computers & fluids - fcfm - universidad de chile applied to the cfd simulation of turbulent...
TRANSCRIPT

Computers & Fluids 90 (2014) 72–87
Contents lists available at ScienceDirect
Computers & Fluids
journal homepage: www.elsevier .com/locate /compfluid
OpenFOAM applied to the CFD simulation of turbulent buoyantatmospheric flows and pollutant dispersion inside large open pit minesunder intense insolation
0045-7930/$ - see front matter � 2013 Elsevier Ltd. All rights reserved.http://dx.doi.org/10.1016/j.compfluid.2013.11.012
⇑ Corresponding author.E-mail address: [email protected] (F. Flores).
Federico Flores ⇑, René Garreaud, Ricardo C. MuñozDepartamento de Geofísica, Universidad de Chile, Santiago, Chile
a r t i c l e i n f o
Article history:Received 19 March 2013Received in revised form 9 September 2013Accepted 7 November 2013Available online 20 November 2013
Keywords:CFDOpenFOAMOpen pitsLESChuquicamata
a b s t r a c t
The particular conditions of air circulation inside large open pit mines under intense insolation, domi-nated by mechanical and buoyant effects, are crucial when studying the dispersion of pollutants insideand outside the pit. Considering this, we study this problem using CFD tools able to include the complexgeometry characterizing it and the different processes affecting circulation: flow interaction with obsta-cles, buoyancy, stratification and turbulence. We performed simulations using a previously developedOpenFOAM solver, focusing in the particular case of Chuquicamata, a large open pit mine (�1 km deep)located in northern Chile. Both idealized and real topographies were used. Given the importance of tur-bulence in this type of large-scale flows we have used LES to incorporate it in the calculation, using a DESapproach to solve the flow near walls.
The results from the idealized cases support the idea that buoyant currents foster the exit of particlesfrom the pit and increase the turbulence inside its atmosphere, modifying the purely mechanical recir-culatory flow inside the cavity. Differences in the air circulation and dispersion of particles between ide-alized and non-idealized cases are reported. In particular, there are changes in the intensity and locationof the recirculation inside the pit due to variations in the aspect ratio (length/depth) of the cavity alongthe axis perpendicular to the main flow. Also, the topography surrounding the mine affects the main flowthat sweeps the cavity, channeling it along the main axis of the pit and forcing it to enter the cavitythrough the lower level of the top edge. As a consequence, the patterns of pollutant transport observedin the idealized cases, dominated by near-wall upward currents, are different than those observed in thecases with complex topography, where the dispersion is dominated by internal buoyant upward currents.Anyhow, whether by internal or near wall upward currents, in all buoyant cases considered a large per-centage of the particles injected inside the pit leaves the cavity.
Further experiments studying the effect of 3D aspect ratio over the mechanically forced internal floware needed to fully understand the effect of the internal geometry of the pit over the flow.
� 2013 Elsevier Ltd. All rights reserved.
1. Introduction
Extraction and transport of minerals from open pit mines canproduce significant emissions of fugitive dust, severely affectingthe operations both inside and outside the pit. Throughout theyears different techniques have been developed in order to mini-mize health and environmental issues, with the objective of max-imizing the operations. This has increased the interest inunderstanding the different patterns of pollutant transport insidethe atmosphere of open pit mines.
We summarize in Table 1 the main numerical studies of con-taminant transport inside open pit mines. In the 1990s Baklanov
was one of the first to propose the need to approach the problemfrom a multiphysics perspective, highlighting the combination ofscales involved, and the importance of topography [1,2]. His workstudied the use of ventilators to facilitate the dispersion of contam-inants [3] and the effect of surface explosions on the atmosphere ofthe pit [4]. It verified the existence of inclined currents, defined bythe topography inside the pit, controlling the dispersion of contam-inants inside and around it, and detected the presence of zones offlow recirculation inside its atmosphere. Shi et al. [5] used a highresolution 3D nonhydrostatic model to simulate the air circulationinside a 2 km wide and 100 m deep pit, and were able to reproducethe intense recirculation inside the cavity, consistent with windtunnel experiments, which was responsible for maintaining highlevels of pollution inside the pit. Their results showed that bothmechanical and thermal forcings are important mechanisms

Table 1Main numerical simulations of air circulation inside open pit mines.
Reference Model Pit size (xyz) km Turbulence model
Baklanov [1,2], Rigina and Baklanov [4] and Baklanov and Rigina [3] Own 3 � 1 � 0.5 Smagorinsky, k—eShi et al. [5] Own 2 � 2 � 0.1 k—eSilvester et al. [6] Fluent 1 � 0.65 � 0.12 R k—e
F. Flores et al. / Computers & Fluids 90 (2014) 72–87 73
controlling the evolution of the atmosphere inside the pit, withfairly strong turbulence (maximum TKE values �2 m2=s2) pro-duced by the interaction of both processes. Silvester et al. [6] usedthe CFD code Fluent to study the mechanically forced circulationsdeveloped inside the Old Moor open pit (1 km wide and 650 mdeep). Without accounting for buoyancy, they showed the exis-tense of strong mechanical shear near the top of the pit (TKE�2:5 m2=s2 in that zone), produced by the interaction of the windthat sweeps over the cavity and the internal atmosphere. Thesenumerical experiments highlighted the importance that the geom-etry of the pit has over the flow (slope angle, aspect ratio, etc.), theexistence of intense air flow recirculation inside the pit, and therole played by surface heat flux (that determines the intensity ofbuoyant currents), all factors controlling the exit of pollutants fromopen pits. The flow recirculation detected inside the pit by theseauthors is a well known phenomenon affecting flows over cavities[7–9], being the aspect ratio of the cavity (length/depth) the keyparameter defining the number, size and location of the main rollsinside the cavity.
The environmental problem described before is increased in thecase of very large open pit mines subject to strong insolation (an-nual mean surface radiation >200 W=m2), due to the interactionbetween intense buoyant currents and the particular complex 3Dgeometry of these pits. Despite its large scale, the complex featuresthat characterize this circulation, with developed turbulence,buoyant currents and mechanical effects due to topography, aredifficult to address with standard meteorological models. There ex-ists consensus that the problem demands appropriate inclusion ofmulti-physics and multi-scale processes into a ComputationalFluid Dynamics (CFD) approach [10,11]. In particular, intense tur-bulence and recirculation induced mechanically inside the pit mustbe correctly simulated [5], as well as buoyancy.
In this work we focus our attention on understanding the inter-action between the two main processes that control the air flow in-side the internal atmosphere of large open pit mines under intenseinsolation: mechanical effects due to the surface geometry andconvective effects due to buoyancy. Our primary target is to definethe main modes of contaminant transport inside and outside Chu-quicamata, a very large open pit copper mine located in northernChile (22�1702000S 68�540W). Due to its large scale (width �4 km,depth �1 km, see Section 4) and intense insolation (the mine is lo-cated in the Atacama Desert), previous studies cannot be directlyapplied here.
First, we performed simulations aimed at studying the circula-tion using a simplified geometry, that conserves the main size ofthe real pit but with circular symmetry. In second place we usedthe complex real topography of Chuquicamata and its surround-ings. The simplified geometry allows a clearer study of theprocesses interacting in the formation of the air circulation insidethe pit, while the more realistic topography includes the effect ofthe real geometry. Given the great versatility that it provides, weselected the CFD tool OpenFOAM as development platform, usinga solver previously developed [12]. We used Detached EddySimulation (DES), to properly simulate turbulence around complexgeometries, and included density as an explicit variable in thesystem of equations in order to improve the treatment of buoy-ancy. DES combines Large Eddy Simulation (LES) far from walls,
to properly solve large atmospheric eddies, and Reynolds AverageNavier Stokes (RANS) techniques near walls, to solve complexgeometries [13,14]. Even if the circulation inside closed valleyshas been simulated in previous works [6,15,16], there is apparentlyno record that OpenFOAM has been used to study the circulationand pollutant dispersion within very large scale open pit minessubject to intense insolation. In particular, there is no evidence thatthe new compressible solvers that consider density as a calculationvariable (instead of using the Boussinesq approximation) havebeen used for these applications.
Section 2 of this paper briefly describes the physical problemconsidered and the numerical treatment. The numerical approachused to configure the simulations was described in detail and val-idated in a previous work [12]. In Section 3 we present differentnumerical simulations using an idealized geometry similar to Chu-quicamata, considering different boundary conditions in order toinvestigate the effect of mechanical and buoyant processes overpollutant dispersion separately. In Section 4 we describe the re-sults of the CFD simulation of air flow inside and around Chuquica-mata using its real topography, in order to identify the role playedby it over the dispersion of contaminants. Section 5 includes themain conclusions taken from the work, and proposes futureapplications.
2. Physical problem and numerical treatment
2.1. Air circulation inside a closed valley
The air flow affecting the dispersion of pollutants inside andaround closed valleys, like the ones that interest us, is composedby two main processes that control its evolution:
� Slope flows controlled by buoyancy, which will generally be theflow dominating the circulation inside the pit. There exist sev-eral references relative to this type of flows [17–19].� Mechanical effects produced by the interaction of the external
flow with the geometry of the cavity. The approximately conicalfeatures of open pit mines modify the circulation imposed bybuoyant slope flows, introducing mechanical effects producedby the slope angle and circular symmetry of the pit. In thisregard, the analysis is similar to that developed for valleys[20,21], although the open condition of the latter allows for exitflows not possible in closed pits. Given that the existence oflarge scale closed valleys is rare in nature the research aboutair circulation inside their atmosphere has remained restrictedto meteoritical craters, or to the specific case of large open pitmines [6,22].
2.2. Numerical approach
2.2.1. ModelWe have already described in [12] the numerical approach used
in our simulations, as well as its validation against documenteddata. The solver includes the following equations: continuity,momentum conservation (Navier–Stokes), enthalpy conservation,ideal gas state and passive scalar transport, using the libraries

Fig. 2. Example showing the variation of mean velocity and standard deviation ofvelocity at three single points, used to study mesh independence. The points arelocated at the center inside the pit, at 250 m (blue), 500 m (red) and 750 m (green)above the bottom. (For interpretation of the references to color in this figure legend,the reader is referred to the web version of this article.)
74 F. Flores et al. / Computers & Fluids 90 (2014) 72–87
and tools provided by OpenFOAM to solve them (thermophysical,turbulence and finite volume libraries). We have chosen a numer-ical approach that includes density as an explicit variable in thesystem of equations, instead of using the Boussinesq approxima-tion. The density-based non-Boussinesq formulation used to solvebuoyant flows in OpenFOAM includes density as an explicit variablein the calculation and uses PISO type algorithms (Pressure-Implicitwith Splitting of Operators) to couple pressure and velocity in thecompressible case. A detailed view of PISO type compressible algo-rithms can be found in [23–26]. We use a DES (Detached Eddy Sim-ulation) approach to solve the flow near walls, in order to be able toinclude complex topography (Spalart–Allmaras DES formulation).LES (Large Eddy Simulation) is used to solve the turbulent eddiesfar from walls. Results obtained in [12] showed that the modeland the particular boundary and initial conditions implementedin OpenFOAM for this work can deal with the complex multiphys-ical problem that implies modeling atmospheric buoyant flowsclose to a complex ground. DES allows us to use the advantages of-fered by LES when modeling turbulent atmospheric flows, withouthaving to pay the high computing cost that would be implied byusing this technique in complex geometries.
2.2.2. Geometry and meshingAs in the previous work [12] we used the snappyHexMesh tool-
box to generate the mesh, in conjunction with the CAE softwareSalome to create the necessary STL files. GlobalMapper, a mappingsoftware package, was used to create STL files from real topogra-phy (SRTM data). Matlab was used to modify the files generatedby GlobalMapper to allow their use by snappyHexMesh.
2.2.3. Computing supportThe configuration of the simulations and the analysis of their re-
sults was done on a personal workstation using Paraview, whiletheir execution was done in parallel in the Levque cluster of theNational Laboratory for High Performance Computing (NLHPC) ofthe Center for Mathematical Modeling of the University of Chile.The Levque cluster is an IBM iDataplex machine with 536 cores,equipped with Intel Nehalem processors, an Infiniband QDR switchand several development tools [27].
3. Idealized cases
3.1. Domain
In this first part we used a simplified topography, that retainsthe same general dimensions of Chuquicamata (see Section 4), rep-resenting the pit as an inverted truncated cone with a superiordiameter of 4 km, an inferior diameter of 1 km and 1 km deep(Fig. 1b). We selected this simplified symmetric geometry since itallows a clearer study of the processes interacting in the formation
Fig. 1. Mesh used. (a) Total domain
of the air circulation inside the pit. The simulation domain con-sisted of a rectangular region 15 km long, 10 km wide and 3 kmhigh (Fig. 1a). Although the domain is small, considering the sizeof the cone, it was chosen after several mesh tests produced solu-tions independent of domain size and mesh (Fig. 2). Due to thehigh computational cost of this kind of simulations a balance mustbe reached between domain size and mesh resolution. The snappy-HexMesh tool was used to generate the mesh based on a STL filecreated using Salome, providing a mesh with nearly 5 million cells.The mesh was refined near walls, by the use of snappyHexMeshcontrols, to produce cells with wall normal dimensions of betweenyþ1 ¼ 100 and yþ1 ¼ 1000 adjacent to the surface (yþ1 is the distancein wall units between the centroid of the first cell and the wallassuming the y coordinate is normal to the wall). However, it isimpossible to satisfy this criterion everywhere when processes offlow separation and attachment occur. The refinement procedureproduced vertical grid spacing on the order of meters near theground, tens of meters below 1500 m above the top edge of thepit, and hundreds of meters above (the top of the convectiveboundary layer is located �1000 m above the top edge of the pit).
3.2. Experimental setup
We employed cyclic lateral boundary conditions in both hori-zontal directions. The upper boundary conditions (2 km above
and (b) detail, inverted cone.

F. Flores et al. / Computers & Fluids 90 (2014) 72–87 75
the top edge of the pit) are free-slip and maintain a constantpotential temperature gradient. The initial potential temperatureprofile has a constant value of 300 K up to 937 m above the topedge of the pit (all the internal volume of the cone has constant po-tential temperature), followed by an 8 K increase in the next167 m, and a constant 0.003 K/m gradient up to the top of the do-main (as used by Moeng and Sullivan [28] and Churchfield et al.[29]).
Because of our interest in studying the interaction betweenbuoyancy and mechanical effects, we defined three numericalexperiments in which these processes have different relativeimportance. A summary of the cases and the designation codes isshown in Table 2. The first case, W, is dominated by winds aloft(10 m/s at 300 m over the top edge of the pit, vertical profile fol-lowing a power law as described in [12]), and does not considerany thermal effect (no enthalpy equation included, neutral atmo-spheric boundary layer). Case B is dominated by buoyancy, witha surface heat flux of 240 W=m2, and only a 1 m/s wind speed300 m above the top edge of the pit. The third case, WB, combinesboth previous cases, keeping a 10 m/s wind aloft and a 240 W=m2
surface heat flux.In order to facilitate the initial development of turbulence, the
initial velocity field was perturbed as suggested by de Villiers[30], introducing periodic perturbations along the x and y-axesthrough sine and cosine functions. The time step used in each sim-ulation was 0.025 s, necessary to keep a low Courant number nearthe surface where the mesh is refined, for a full simulation time of2 h (until reaching a statistically stationary flow). To determinewhether the steady state was achieved we performed time statis-tics while the simulation was executing in order to test the evolu-tion of the temporal means of velocity (time evolution of themoving-average of the velocity at different points inside the do-main). Also, different final times have been tested to ensure thatconvergent time-averaged results were attained. As a referencefor monitoring statistical convergence in LES simulations see forexample [31]. In each idealized case around one month of CPU timewas necessary in Levque cluster, running in parallel in 32 cores (In-tel(R) Xeon(R) CPU X5550 (Nehalem) 2.67 GHz). For further detailsof the numerical approach used see [12].
3.3. Results
In order to analyze the circulation imposed by each case and itseffect on the dispersion of contaminants inside and around the pit,we use two simple techniques to visualize this circulation. First, weuse time-averaging over the last hour of simulation to describe themean patterns of circulation. Then, injecting passive tracers to thevelocity field, we study the features that characterize the currentsleaving the pit, in such a way that we can explore the dispersion ofcontaminants emitted from the surface.
3.3.1. Mean valuesThe last hour mean vector velocity field is presented for each
case in Fig. 3. Panels 3a, c and e show a vertical plane that runsthrough the center of the pit, while panels 3b, d and f show a hor-izontal plane 250 m above the bottom of the pit (height scale indi-cated in the vertical plane). The existence of distinctive circulation
Table 2Idealized cases. Wind speed is specified 300 m above the top edge of the pit.
Predominance Name Wind above 300 m Surface heat flux
Wind W 10 m/s 0Surface heat flux B 1 m/s �240 W=m2
Wind and surface heat flux WB 10 m/s �240 W=m2
patterns in each case can be observed. In both cases with positivesurface heat flux (B, panels 3c and d and WB, panels 3e and f) theair circulation inside the pit is characterized by strong convectivecurrents (vertical velocity >2 m/s) that ascend close to the walls.In case W (panels 3a and b), in which the wind dominates, thereare no clearly defined ascending currents close to the walls. Twoflow features can be identified in this case: a circulation thatfollows the geometric pattern of the pit, with convergent currentsnear the downwind slope, induced by circular symmetry (the flownear the top edge of the pit follows the circular walls of the cavity,feature not seen in the vertical plane but visible in a horizontalplane near the top edge (not shown) and in Fig. 3 counter-directionflow inside the pit (as reported in previous works [1,5]), whichinduces descending flow in the downstream wall and ascendingflow in the upstream wall. Flow separation occurs at the top ofthe upstream wall, induced by local changes in pressure [32].The vorticity present near ground (no-slip boundary) evolves intoa large eddy when the boundary condition changes [33]. This eddyis not clear in Fig. 3a, mainly due to vector scale and symmetry.Descending currents closing the eddy are very weak (�0.5 m/s)compared to the main wind aloft (�10 m/s). Also, the main eddyis more evident outside the symmetry plane shown in Fig. 3a, sinceit developes mainly near the walls outside that plane. The circulargeometry of the pit reduces the aspect ratio of the cavity along they-axis (perpendicular to the main flow) outside the vertical sym-metry plane, favoring the formation of a more intense eddy nearthe lateral walls [8] (a well defined eddy is visible in a verticalplane 300 m outside the symmetry plane, Fig. 4). Fig. 3c and d (caseB) show the recirculation produced by the interaction betweenupslope flows and the weak incident ambient wind, and thepresence of vertical convective currents inside the pit near ground(below 300 m). In this case wall updrafts seem to be the more rel-evant flow, with compensatory subsidence inside. The effect ofupslope currents is less important in case WB (Fig. 3e and f), af-fected also by 10 m/s wind, in which the mean circulation seemsto be a combination of both previous cases. In this case the maininternal eddy shows a clear structure, and seems reinforced bybuoyant currents.
Fig. 5 shows the standard deviation of velocity magnitude in allcases. In case W (Fig. 5a) intense turbulence occurs near the top ofthe pit due to the interaction between the flow aloft and the inter-nal atmosphere. In case B (Fig. 5b) the turbulence is linked to ther-mal updrafts, while in case WB (Fig. 5c) turbulence increases itsmagnitude and extends inside all the pit. As shown in Fig. 3, buoy-ancy increases the recirculation induced by the incident wind,increasing the circulation and turbulence inside the pit.
3.3.2. Tracking of particlesGiven our interest in studying the dispersion of pollutants from
the interior of the pit we used tracking of particles to analyze aircirculation. Using the Paraview software we injected instant puffsof 18,000 particles in an imaginary 500 m diameter disc 10 mabove the bottom of the pit (radial resolution: 50 particles, circum-ferential resolution: 360 particles), every 50 s, during the last hourof simulation. The particles are treated as ideal tracers, with nosedimentation velocity. A video showing the evolution of theseparticles exposes the differences between each case (video link),and Fig. 6 shows the final locations of the injected particles (atthe end of the second hour), the color indicating the original loca-tion of each particle (red �y, blue +y).
In cases B and WB a large number of particles leaves the pit,while in case W only a small fraction of the injected particlesleaves the cavity, after a long time since their injection, due tothe recirculation effect, as suggested by previous studies [5,6].The role of wind becomes clear comparing scenarios B and WB,especially the top views 6d and f. In case WB (10 m/s wind), with

Fig. 3. Mean vector velocity field during the last hour of simulation, for each case. (a), (c) and (e), Vertical plane in the middle of the basin (y = 0). (b), (d) and (f), Horizontalplane 250 m above the bottom of the pit. Color indicates mean vertical velocity (color bar, m/s). Vector scale is the same for all cases. (For interpretation of the references tocolor in this figure legend, the reader is referred to the web version of this article.)
Fig. 4. Mean vector velocity field during the last hour of simulation for case W.Vertical plane 300 m outside the symmetry plane. Vector scale is not the same ofFig. 3. We have increased it and eliminated the vectors above the pit in order toimprove the visualization of the main roll. Color indicates mean vertical velocity(color bar, m/s). (For interpretation of the references to color in this figure legend,the reader is referred to the web version of this article.)
76 F. Flores et al. / Computers & Fluids 90 (2014) 72–87
stronger wind than in case B (1 m/s wind) the particles, once theyreach the top edge of the pit, are dragged downstream. In case B on
the contrary, particles leaving the basin close to the walls accumu-late over the top edge, especially upstream, where convective cur-rents interact with the weak incident wind (recirculation at theupstream top edge seen in Fig. 3).
Fig. 7 shows the temporal evolution of the injected particles.Only the final location of three puff of particles is shown: blue dotsmark the final locations of particles released 30 min before endtime, green dots those released 20 min before end time and reddots those released 10 min before end time. In case W (Fig. 7aand b) the intense recirculation inside the pit drags the particlestoward the upwind slope, producing their uplift, but not enoughto reach the edge. Even oldest particles stay inside the pit, butare affected by the turbulent flow present at the top of the cavity,where the incident wind aloft interacts with the internal atmo-sphere (Fig. 6a), extracting some of the particles. In case B(Fig. 7c and d) the temporal evolution of particles is influencedby convective currents, present both in the center of the basinand near the walls, where they are stronger (vertical velocity�2.5 m/s near the walls, �1 m/s in the center). Older particles(blue), that have had the time necessary to reach the walls, havebeen expelled out of the pit. Particles with shorter lifetime (greenand red) are dominated by internal thermal lifts and remain nearthe center of the basin. In this case upward currents following
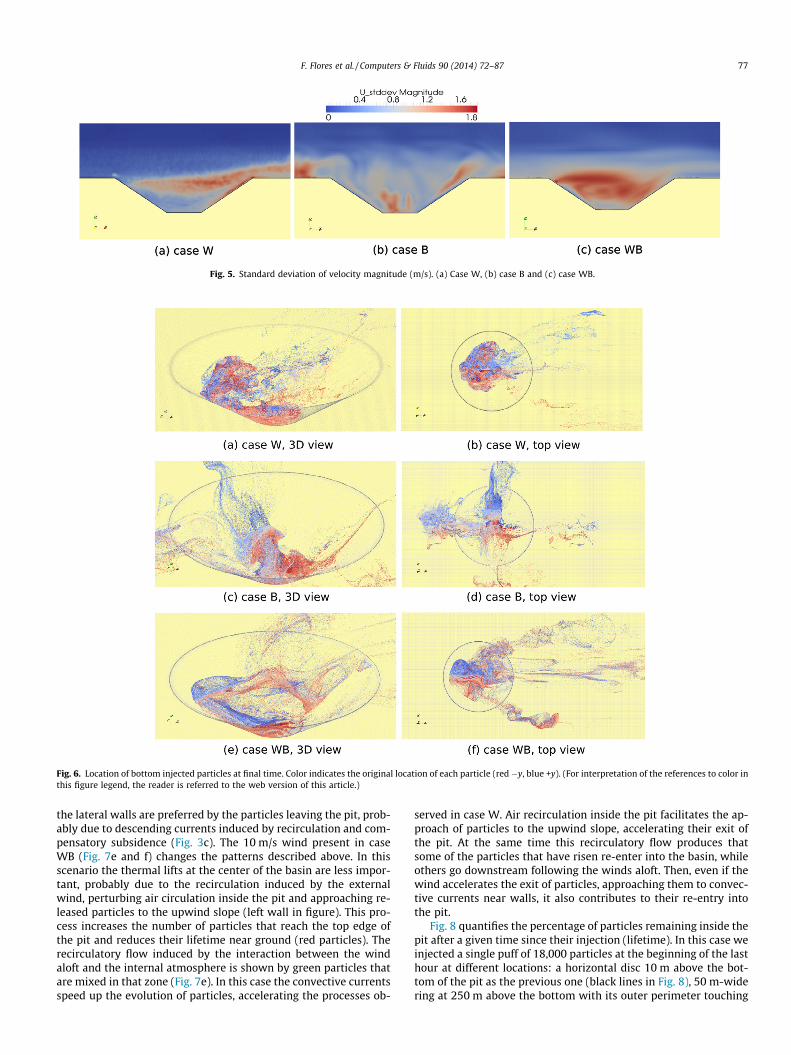
Fig. 5. Standard deviation of velocity magnitude (m/s). (a) Case W, (b) case B and (c) case WB.
Fig. 6. Location of bottom injected particles at final time. Color indicates the original location of each particle (red �y, blue +y). (For interpretation of the references to color inthis figure legend, the reader is referred to the web version of this article.)
F. Flores et al. / Computers & Fluids 90 (2014) 72–87 77
the lateral walls are preferred by the particles leaving the pit, prob-ably due to descending currents induced by recirculation and com-pensatory subsidence (Fig. 3c). The 10 m/s wind present in caseWB (Fig. 7e and f) changes the patterns described above. In thisscenario the thermal lifts at the center of the basin are less impor-tant, probably due to the recirculation induced by the externalwind, perturbing air circulation inside the pit and approaching re-leased particles to the upwind slope (left wall in figure). This pro-cess increases the number of particles that reach the top edge ofthe pit and reduces their lifetime near ground (red particles). Therecirculatory flow induced by the interaction between the windaloft and the internal atmosphere is shown by green particles thatare mixed in that zone (Fig. 7e). In this case the convective currentsspeed up the evolution of particles, accelerating the processes ob-
served in case W. Air recirculation inside the pit facilitates the ap-proach of particles to the upwind slope, accelerating their exit ofthe pit. At the same time this recirculatory flow produces thatsome of the particles that have risen re-enter into the basin, whileothers go downstream following the winds aloft. Then, even if thewind accelerates the exit of particles, approaching them to convec-tive currents near walls, it also contributes to their re-entry intothe pit.
Fig. 8 quantifies the percentage of particles remaining inside thepit after a given time since their injection (lifetime). In this case weinjected a single puff of 18,000 particles at the beginning of the lasthour at different locations: a horizontal disc 10 m above the bot-tom of the pit as the previous one (black lines in Fig. 8), 50 m-widering at 250 m above the bottom with its outer perimeter touching

Fig. 7. Final locations of particles released 30 (blue), 20 (green) and 10 (red) minutes before end time. (a) and (b) Case W. (c) and (d) Case B. (e) and (f) Case WB. These are notsection views, all particles in 3D space are included. (For interpretation of the references to color in this figure legend, the reader is referred to the web version of this article.)
78 F. Flores et al. / Computers & Fluids 90 (2014) 72–87
the surface of the slope of the pit (blue lines), a similar ring at500 m (green lines) and another one at 750 m (red lines). In caseW the percentage of particles inside the pit decreases slowly. Someparticles, due to the intense recirculation inside the cavity, are ableto reach the top edge of the pit and exit the cavity driven by the
wind aloft. In this case, particles injected in a disc near the ground(black line) follow a counterintuitive behavior: their discharge isfaster than those of particles injected in a ring at 250 m. This couldbe related to recirculation: particles injected at 250 m near thedownstream wall are forced to descend before their exit following

Fig. 8. Percentage of a puff of particles injected at different levels that remains inside the pit v/s time. (a) Case W. (b) case B. (c) Case WB. Black line, 500 m diameter disc at10 m from the bottom; blue line, 50 m-wide ring at 250 m; green line, ring at 500 m; red line, ring at 750 m. (For interpretation of the references to color in this figure legend,the reader is referred to the web version of this article.)
F. Flores et al. / Computers & Fluids 90 (2014) 72–87 79
the upstream flow along the upstream wall, while particlesinjected in a disc near the ground are swept by internal counter-direction flow (Fig. 3b). In case B (Fig. 8b), affected by strongconvective currents (vertical velocity �2 m/s) and weak wind(1 m/s), the percentage of particles injected in a ring that remainsinside the pit drops quickly, depending on the altitude of injection.This fast discharge is related to the upward currents close to thewalls of the pit. In this same case the discharge of particles injectedin a disc close to the bottom of the pit is slower, and takes also alarge amount of time to begin. As we already saw, this can be re-lated to the time required by the particles released at the centerof the pit to approach the upward currents near the walls. The qua-si-steady state reached could be attributed to particles that are notable to exit the pit due to subsidence inside its atmosphere. In caseWB (Fig. 8c) the effect of recirculation induced by the strongerwind aloft (10 m/s in case WB against 1 m/s in case B) is responsi-ble for an abrupt change in the rate of discharge, initially similar tothat of case B. There is also a reduction in the time needed to ini-tiate the exit of particles injected at the disc near the bottom of thepit. The differences between both cases can be attributed to therecirculation enhanced by the stronger wind in case WB (10 m/sin case WB against 1 m/s in case B), which favors the entry of par-ticles inside convective currents, accelerating their initial output,but also inducing their re-entry to the pit. In fact, as shown inFig. 8b and c, particles injected at the upper ring discharge fasterin case B than in case WB, while those injected at the bottom ringdischarge faster in case WB than in case B.
3.4. Conceptual model
A simplified conceptual scheme is presented in Fig. 9 for eachidealized case. In case W (Fig. 9a) the main flow aloft induces recir-culation inside the pit. This is a well known pattern of the flow overopen cavities [7–9]. The magnitude and location of the main roll in-side the cavity is a function of the geometry, particularly, the aspectratio of the cavity (length/depth). The aspect ratio changes thenumber, location and magnitude of the eddies inside the cavity(see for example Fig. 2 in [8] and 6 in [9]). In this case the geometryof the pit mainly coincides with a 4:1 aspect ratio, although its con-ical feature enhances upward and downward currents near thewalls, while its circular geometry produces changes in the aspectratio along the y-axis. Both factors slightly modify the patterns seenin [8], where the main eddy inside the pit is located closer to thedownstream wall than in this case. Also, as previously described,in our case the structure of the main roll is more clearly defined out-
side the vertical symmetry plane, since the walls outside the sym-metry plane, where the aspect ratio is smaller, highly contribute tothe recirculation. Strong turbulence exists at the top of the pit (stan-dard deviation of velocity magnitude �1.6 m/s), enhancing the exitof particles that reach that zone carried by ascending currentslinked to the main roll. In case B (Fig. 9b) strong convective currentsnear the walls (vertical velocity >2 m/s) dominate the flow. Theinteraction between the low incident wind aloft and the convectiveupdraft leaving the pit upstream generates a roll near the top edgeof the pit (similar to that seen over cavities). This roll blocks theinfluence of the weak main flow over the rest of the atmosphere in-side the pit. The strong currents leaving the pit (vertical velocity>2 m/s) induce, by continuity, descending flow at the center ofthe cavity. However, due to the intense heat flux at the base, con-vective updrafts at the center of the pit remain, overcoming thedescending flow near the base. In case WB (Fig. 9c) both schemesdescribed above combine. The 10 m/s incident wind is able to over-come the convective current at the upwind wall and generate a rollinside the pit similar to that seen in case W. This roll changes itslocation and intensity, becoming more intense and approachingthe upwind wall. This displacement leaves a wide area of descend-ing flow near the center of the pit, that compensates the intenseconvective upward currents. The intensity of the main roll sweepsall the convective updrafts near the base at the center of the pit.In this case the effect of buoyancy is similar to changing the aspectratio of the pit (roll similar to 1:1 aspect ratio cavities [8]). In case Wthe exit of particles is mainly produced by the intense turbulence atthe top levels inside the pit: upslope currents produced mechani-cally near the upstream wall carry the particles near the top edge,where some of them leave the pit due to the intense turbulencein that zone. In case B the exit of particles is controlled by convec-tive currents near walls, while in case WB the upslope convectivecurrent near the upstream wall dominates: recirculation insidethe pit sweeps the particles approaching them to the upstreamwall, where an intense upslope current carry them to the top edge.There, some of them leave the pit directly and others enter the zoneof intense turbulence as in case W.
4. Real topography
Chuquicamata is an open pit copper mine located in northernChile (western slope of the Andes, 22�1702000S 68�540W, �3000 maltitude, Fig. 10a), whose vast dimensions make it one of the largestpits in the world, with more than 4 km long, 3.5 km wide and al-most 1 km deep (Fig. 10b). Due to its location in the Chilean desert,

Fig. 9. Simplified conceptual scheme of the flow. (a) Case W. (b) Case B. (c) Case WB. Geometrical scales were modified to improve representation. Vectors are not at scale. Inred, convective currents. (For interpretation of the references to color in this figure legend, the reader is referred to the web version of this article.)
Fig. 10. (a) Location of Chuquicamata, (b) Chuquicamata open pit, most relevant dimensions (�Codelco, Chilean National Copper Corporation, under Creative Commons).
80 F. Flores et al. / Computers & Fluids 90 (2014) 72–87
Chuquicamata is exposed to high rates of solar radiation all the year(200—350 W=m2 annual mean surface radiation [34]), fostering thegeneration of convective currents inside its atmosphere. Due tooperations undertaken inside the pit (movement of machinery,blasting), and the type of soil, fine powder streams are almost al-ways present, generating an environmental problem both inside
and outside the pit. The transport of these particles follows a diur-nal cycle, influenced by convective currents that promote their dis-persion during day [34]. Due to its geographic location, the windover Chuquicamata is affected by the regional circulation over thePacific and the Andes cordillera. The upper-level large-scale circula-tion is characterized by moderate easterly wind at low latitudes

F. Flores et al. / Computers & Fluids 90 (2014) 72–87 81
(�15� of latitude) and westerly winds at subtropical/extratropicallatitudes [35]. Due to its altitude (�3000 m a.s.l.) and latitude(22�1702000S) the mean wind conditions above Chuquicamata are af-fected by this westerly circulation [36,37]. In fact, the data from aweather station in Calama, the nearest city to the pit (located about13 km southwest of the mine), shows a predominance of westerlywind during daytime/summer, while easterly wind predominatesduring nightime/winter. Both patterns are driven by heating/cool-ing of the Andean slope and the large-scale westerlies. For detailedinformation see for example the data from Chilean Weather Service(DMC), available at http://www.meteochile.gob.cl/.
4.1. Domain
The topography around Chuquicamata is complex, especially tothe west of the pit. Considering that the large scale predominantwind direction during day is westerly, to correctly simulate theflow affecting the pit the complex topography at its west must
Fig. 11. (a) Topography from GlobalMapper. Color bar represents height above sea level. Hfrom north. Size of the domain included. (b) OpenFOAM mesh, includes inlet and outlet tover 2500 m are visible). (For interpretation of the references to color in this figure lege
be incorporated in the domain. As the configuration of our simula-tions uses cyclic boundary conditions (to correctly simulate theflow of heat and avoid compressibility problems), the domainand mesh generation of this case is particularly complex. To solvethis problem we selected the domain in such a way that both inletand outlet boundary topographies are similar, and as simple aspossible (Fig. 11a), using SRTM data and GlobalMapper to createan elevation data file. Then, we modified the file created by thesoftware to include inlet and outlet transition zones at the same le-vel with flat topography (we included different levels until reach-ing the same level at both boundaries), in order to allow thecreation of well defined inlet and outlet cyclic boundaries. Finally,we used again GlobalMapper to create the necessary STL file. As ex-pected, this technique highly increases the computational cost ofthe simulation, increasing the number of cells of the domain, butit allows the inclusion of the complex topography upwind of thepit, in order to run a more realistic simulation. The snappyHexMeshtool was used to generate the final mesh based on the STL file, pro-
ills block the inlet flow at the west of the mine. The main axis of the pit is tilted�15�
ransition zones. Detail of the pit includes topographic contour lines (only contoursnd, the reader is referred to the web version of this article.)

82 F. Flores et al. / Computers & Fluids 90 (2014) 72–87
viding a mesh with nearly 7 million cells (Fig. 11b), refined nearwalls to produce cells with wall normal dimensions of betweenyþ1 = 200 and yþ1 = 5000 adjacent to the surface. However, it isimpossible to satisfy this criterion everywhere when processes offlow separation and attachment occur. The refinement procedureproduced vertical grid spacing on the order of meters near theground, tens of meters below 1500 m above the top edge of thepit, and hundreds of meters above (the top of the convectiveboundary layer is located �1000 m above the top edge of thepit). Fig. 11 also shows a detail of the pit included in the mesh.Topographic contour lines are included as reference to highlightthe complex topography and the detail required by the mesh, re-fined close to the terrain. Several mesh tests were performed untilobtaining solutions independent of domain size and mesh.
The main differences between the more realistic topographyused here and the idealized geometry used in the previous sectionare the following:
� Asymmetry. The real topography shows a clear main axis, espe-cially at the bottom layers inside the pit (Fig. 11), tilted �15�
from north. As a consequence, the base area is much larger thanin the idealized case (�2.5 km against �1 km), eliminating thecircular symmetry near ground.
Fig. 12. Last hour mean velocity vector field in a plane aligned with the main axis of thebar associated to vertical velocity Uz, m/s. Topographic contour lines included. To improvwind magnitude. (For interpretation of the references to color in this figure legend, the
� Top edge irregularity. The top edge of the real pit is mostly irreg-ular, with different heights depending on location (top edgebetween 700 and 1000 m above the bottom of the pit).� Irregular walls. Real hillsides are perturbed by several irregular-
ities, changing their slope angle along the interior of the pit.� Surroundings. Hills surround the real pit, particularly at its west
(highest peaks reach �600 m above the top edge of the mine).
4.2. Initial and boundary conditions
We employed cyclic inlet and outlet boundary conditions in thewest–east direction. To simplify the mesh generation and limit thesize of the domain we did not include cyclic lateral boundaries inthe south–north direction, as we imposed a west–east forcing flow(lateral boundaries are defined as inviscid wall: normal componentand gradients of tangential components of velocity equal zero). Theupper boundary conditions are free-slip and maintain a constantpotential temperature gradient. The initial potential temperatureprofile has a constant value of 300 K up to 937 m above the topedge of the pit (including its internal volume), followed by an 8 Kincrease in the next 167 m, and a constant 0.003 K/m gradient upto the top of the domain (as used in the idealized cases and in[28,29]). We simulated two cases, with 3 and 10 m/s wind speed
pit (see Fig. 11). (a) Case TB, wind aloft 3 m/s. (b) Case TWB, wind aloft 10 m/s. Colore visualization a different vector scale was used in each case, due to the difference inreader is referred to the web version of this article.)

Fig. 13. Last hour mean velocity vector field in a horizontal plane at 3000 m. (a) Case TB, wind aloft 3 m/s. (b) Case TWB, wind aloft 10 m/s. Color bars associated to horizontalvelocity component Uy , m/s. Topographic contour lines included. To improve visualization a different vector scale was used in each case, due to the difference in windmagnitude. (For interpretation of the references to color in this figure legend, the reader is referred to the web version of this article.)
Table 3Mean vertical velocity (W , m/s) and flux (F, dam3/s) at 250 m above the bottom of thepit, for each buoyant case simulated (B and WB, idealized geometry; TB and TWB, realtopography). The horizontal plane inside the cavity was divided in two zones: aninternal region, far from the walls of the pit, and a near-wall region, less than 150 mfrom the hillsides.
Region Case
B WB TB TWB
W F W F W F W F
Near-wall
+0.67 +580 +0.85 +740 �0.55 �550 �0.40 �420
Internal �0.38 �585 �0.51 �780 +1.06 +600 +0.83 +470
F. Flores et al. / Computers & Fluids 90 (2014) 72–87 83
over the top edge of the pit (cases TB and TWB respectively), usinga surface heat flux of 240 W=m2 in both cases (boundary condi-tions are similar to those of the idealized cases, see Section 3.2).The time step was 0.01 s, necessary to keep a low Courant numbernear complex topography, where the mesh is refined, for a full sim-ulation time of 4 h (reaching a statistically stationary flow). Todetermine whether the steady state was achieved we performedtime statistics while the simulation was executing in order to testthe evolution of the temporal means of velocity (time evolution ofthe moving-average of the velocity at different points inside the
domain). Also, different final times have been tested to ensure thatconvergent time-averaged results were attained. As a reference formonitoring statistical convergence in LES simulations see forexample [31]. In each non-idealized case around two and a halfmonths of CPU time was necessary in Levque cluster, running inparallel in 32 cores (Intel(R) Xeon(R) CPU X5550 (Nehalem)2.67 GHz).
4.3. Results
Fig. 12 shows the last hour mean velocity vector field in a ver-tical plane aligned with the main axis of the pit (tilted 15� fromnorth, see Fig. 11), for the two cases simulated. The vector fieldshows intense convective upward currents inside the pit, thatmodify the air circulation over and around the mine. Also, the flownear the mine shows a south–north orientation (y-axis, Fig. 11),different from the imposed west–east mean flow (x-axis). The caseTB shows stronger uplifts (maximum vertical velocity �3 m/s incase TB, and �2.4 m/s in case TWB), while case TWB shows a flowmore aligned with the imposed main direction.
Fig. 13, showing the last hour mean velocity vector field in ahorizontal plane near the top edge of the pit, is useful to explainthe south–north orientation of the main flow near the mine. Nearthe pit, positive values of Uy (flow from the south) dominate the

Fig. 14. Streamlines of the mean flow seeded from five points at 20 m above ground at the deepest zone inside the pit. Case TB, similar behavior at case TWB.
Fig. 15. Percentage of a puff of particles injected at a ring at different levels that remains inside the pit v/s time. (a) TB, (b) TWB. Blue line, particles injected at a ring 250 mabove the bottom; green, ring at 500 m; red, ring at 750 m. (For interpretation of the references to color in this figure legend, the reader is referred to the web version of thisarticle.)
84 F. Flores et al. / Computers & Fluids 90 (2014) 72–87

Fig. 16. Simplified conceptual scheme of flow circulation. Vectors are not at scale.
F. Flores et al. / Computers & Fluids 90 (2014) 72–87 85
circulation, acting as a forcing for the flow entering the cavity, inboth cases. This is so because the topography surrounding the pitforms a valley at its south, channeling the mean flow and forcingit to enter the pit through the lower level of the top edge. The flowconfiguration seen in Fig. 13 is similar to that seen in Fig. 3, nearthe top edge of the inverted cone used in the idealized simulations,with mean flow entering from the southwest. Strong convectiveupdrafts are seen at the center of the pit in the case with realtopography (maximum vertical velocity >2 m/s). These convectiveupdrafts at the center of the cavity, far from walls, are also presentin the idealized simulation (Fig. 3c), but with less intensity (maxi-mum vertical velocity <1 m/s), probably due to the symmetric con-figuration of the ground and reduced extension of the main axis ofthe bottom surface. Both factors increase recirculation at the centerof the pit and perturb the development of convective currents atthat zone seen in the idealized cases. The high concentration andmagnitude of convective updrafts seen at the center of the pit inFig. 13 originate downward currents that descend over the contourof the mine.
In order to quantify the relative importance of internal andnear-wall convective currents in each buoyant case, we computedthe mean vertical velocity at 250 m above the bottom of the pit,dividing the horizontal plane inside the cavity in two zones: aninternal region, far from the walls of the pit, and a near-wall re-gion, less than 150 m from the hillsides. The results are shown inTable 3. As suggested by the vector fields in Figs. 3 and 12, cleardifferences between buoyant idealized cases (B and WB) and realcases (TB and TWB) exist. In idealized cases the mean value of ver-tical velocity is positive near the walls of the pit, due to high speedconvective currents, and negative in the internal region, due tocompensating subsidence. In cases with real topography, however,this configuration reverses, with positive mean vertical velocity farfrom the hillsides and negative close to them (W internal <0 incases B and WB and >0 in cases TB and TWB). These results confirmthe effect of the recirculatory flow, induced by the interaction ofthe wind that sweeps over the cavity and the internal atmosphere,on the vertical circulation inside the pit, fostering descending cur-rents far from walls. In idealized cases stronger wind aloft (10 m/sin case WB, against 1 m/s in case B) increases both the negative va-lue of internal mean velocity and the positive value of near-wallvertical mean velocity. In cases with real topography strongerwind aloft (10 m/s in case TWB, against 3 m/s in case TB) decreasesboth the positive value of internal mean vertical velocity and thenegative value of near-surface mean vertical velocity. Also, theair flux (F) is larger in case WB, where recirculation is more impor-tant. This confirms the previous idea of recirculation induced bythe wind that sweeps the pit favoring descending currents insideits atmosphere, and evinces a link between wind aloft, geometry,
recirculation and internal convective currents. In idealized casesthe variation of the aspect ratio along the y-axis, caused by the cir-cular geometry of the pit, induces recirculation inside the cavity,that inhibits the formation of upward currents inside the pit. Innon-idealized cases the particular geometry of the pit, long andnarrow, is aligned with the main direction of the flow, that is alsochanneled by the surrounding topography entering the pit throughthe lower levels of the top edge. Both factors increase the aspectratio, reducing the recirculation, especially that linked to lateralwalls in idealized cases. This increases the magnitude of internalupdrafts, allowing the main flow to sweep the lateral hillsides ofthe pit.
Fig. 14 shows streamlines of the last hour mean flow seededfrom five points at 20 m above ground at the deepest zone insidethe pit. Convective currents leaving the basin are well depicted,and confirm the main role played by vertical upward currents in-side the pit in the exit of particles from the mine in the cases thatinclude topography. Also, the streamlines show the south–northflow dominating at low altitude over the pit, and the west–eastmean flow controlling the circulation at higher altitudes (similarbehavior in both cases simulated, only case TB shown).
In these complex-topography cases strong upward convectivecurrents (vertical velocity >2 m/s) at the center of the cavity, in-duced by the particular topography of the pit, accelerate the exitof particles from the interior of the cavity. As in idealized cases,we injected particles inside the pit and studied their evolution(Fig. 15). The graphs show the percentage of particles remaininginside the pit v/s time. To simulate the generation of fugitive dustnear the surface of the pit we injected a single puff of particles (att = 3 h), at different locations: a 50 m-wide ring at 250 m above thebottom, that follows the surface of the slope of the pit (blue lines),a similar surface at 500 m (green lines) and another one at 750 m(red lines). In both cases a quick drop in the percentage of particlesremaining inside the pit is seen. Even if the particles are injectednear the walls they are quickly affected by internal convective up-drafts. Since in this case the exit of particles is not controlled byupward currents near the walls, the level of the injection doesnot affect directly the percentage remaining inside the pit, as oc-curred in idealized cases. A quick change in the rate of dischargeis seen after 10 min, with particles reentering the pit, especiallythose injected near the bottom of the cavity (blue lines inFig. 15). This process is probably linked to downward currentsassociated to convective updrafts. The presence of strong interiorconvective updrafts (vertical velocity >2 m/s) explains the low per-centage of particles remaining inside the pit, that in case TWB iseven lower than those seen in idealized cases. Like in previous ide-alized cases, stronger wind in case TWB (10 m/s) increases the exitof particles.

86 F. Flores et al. / Computers & Fluids 90 (2014) 72–87
4.4. Conceptual model
A simplified scheme of the flow is summarized in Fig. 16. Thepresence of an inlet valley modify the mean imposed wind, chan-neling the flow reaching the pit. As a consequence the flow sweepsthe pit along its principal axis, and enters the cavity through thelower level of the top edge. This, together with the particulartopography near the lower level of the pit, narrow in one axisand long in other, modifies the 3D aspect ratio of the cavity, reduc-ing recirculation inside the pit, allowing the development of in-tense internal convective updrafts. Due to continuity, downwardcurrents descend over the walls, at both sides of internal updrafts,where they interact with incident wind, that sweeps the lateralhillsides of the pit. The existence of intense internal convectivecurrents and reduced recirculation inside the pit fosters the exitof particles from the mine and reduces their residence time insideits atmosphere.
5. Conclusions
We have applied a CFD solver to study the turbulent buoyantatmospheric flow inside large open pit mines under intense insola-tion, and its effect over pollutant dispersion. Using a DES approachwe have incorporated buoyancy, stratification, developed turbu-lence and complex topography in our analysis. Three idealizedcases were studied, and two full scale simulations using the com-plex topography of Chuquicamata were performed.
The simplified conceptual model of the air circulation seen ineach case shows clear differences. In idealized case W, withoutbuoyant currents, the main flow aloft induces recirculation insidethe pit, while strong turbulence exists at the top of the pit (stan-dard deviation of velocity magnitude �1.6 m/s), enhancing the exitof particles that reach that zone carried by ascending currentslinked to the main roll. In idealized case B, dominated by buoyancy,strong convective currents (vertical velocity >2 m/s) near the wallsdominate the flow, enhancing the exit of particles, while adescending flow is induced at the center of the cavity by continu-ity. Both previous schemes combine in idealized case WB, whereintense convective currents near walls enhance the main roll insidethe pit. In both cases with complex topography, TB and TWB, theinlet valley modifies the mean imposed wind, channeling the flow,that now sweeps the cavity along its principal axis, and enters thepit through the lower level of the top edge. This, together with theparticular topography near the lower level of the pit, narrow in oneaxis and long in other, modifies the 3D aspect ratio of the cavity,reducing recirculation inside the pit, allowing the development ofintense internal convective updrafts.
The results of this work point to the key role played by buoyantcurrents fostering the dispersion of contaminants inside and out-side large open pit mines under intense insolation: despite thelarge size of the pit considered, in all cases buoyant currents con-tribute to the exit of a large percentage of the particles injected in-side the pit. In particular, buoyancy modifies the flow patterns thatthe purely mechanically-induced recirculation generates inside thepit, reducing the particle residence time seen in the purelymechanical case (non-buoyant case). The different cases studied,with and without a complex topography, also shed light in the roleof geometry in the flow patterns, especially in flow recirculation.Given that the aspect ratio of the cavity controls the intensityand location of the main roll inside the pit, idealized cases, witha circular geometry that produces a reduction of the aspect ratioalong the axis perpendicular to the main flow, show intense recir-culation inside the pit, even in cases with strong buoyancy (surfaceheat flux �240 W=m2). Non-idealized cases, on the other hand,have an inlet valley that aligns the main flow with the main axis
of the cavity, forcing it to enter the cavity through the lower levelof the top edge, and have a non circular geometry that is alignedwith the main flow. Both factors highly increase the aspect ratio,reducing the recirculatory flow induced mechanically inside thepit, that is now unable to overcome the intense buoyant currentsat the center of the cavity. Anyhow, whether by internal or nearwall upward currents, in all buoyant cases considered a large per-centage of the particles injected inside the pit leaves the cavityafter 30 min. Idealized cases also showed that recirculation con-tributes to the re-entry of particles at the top edge, reducing theexit of particles.
Further experiments studying the effect of 3D aspect ratio overthe mechanically forced internal flow are needed to understand theprecise effect of the internal geometry of the pit over the flow. Asreported in this work, this is particularly important considering thevariations of the cavity aspect ratio along the axis perpendicular tothe main flow seen in large scale open pit mines.
The present work may give more insight into the complex pat-terns of circulation that affect Chuquicamata, allowing the study ofmeasures to minimize the effect of fugitive dust over the opera-tions. Also, a similar framework as the one presented here can beused to study similar large scale atmospheric flows that includecomplex topography, developed turbulence, stratification andbuoyancy, such as dispersion of contaminants in urban environ-ments, or wind energy studies.
Acknowledgements
This work was carried out during the doctoral research of thefirst author, with the support of Conicyt under Grant ‘‘Beca paraEstudios de Doctorado Nacional’’. ‘‘René Garreaud was partiallysupported by FONDAP-CONICYT 15110009.’’ Powered @ NLHPC:This research was partially supported by the supercomputinginfrastructure of the NLHPC (ECM-02), Center for MathematicalModeling CMM, Universidad de Chile.
Appendix A. Supplementary material
Supplementary data associated with this article can be found, inthe online version, at http://dx.doi.org/10.1016/j.compfluid.2013.11.012.
References
[1] Baklanov A. Numerical modelling of atmosphere processes in mountaincirques and open pits. Air Pollut III: Air Pollut Theory Simul 1995:1.
[2] Baklanov A. Application of CFD methods for modelling in air pollutionproblems: possibilities and gaps. J Environ Monit Assess 2000;65:181–90.
[3] Baklanov A, Rigina OY. Research of local zones atmosphere normalizationefficiency by artificial currents. Trans Ecol Environ 1995:3.
[4] Rigina O, Baklanov A. Numerical modelling of dispersion of dust-gas plume inthe atmosphere after mass explosions. Trans Ecol Environ 1995:6.
[5] Shi Y, Feng X, Wei F. Three-dimensional nonhydrostatic numerical simulationfor the PBL of an open-pit mine. Boundary-Layer Meteorol 2000;94:197–224.
[6] Silvester S, Lowndes I, Hargreaves D. A computational study of particulateemissions from an open pit quarry under neutral atmospheric conditions.Atmos Environ 2009;43:6415–24.
[7] Bres G, Colonius T. Three-dimensional instabilities in compressible flow overopen cavities. J Fluid Mech 2008;599:309–39.
[8] Kang W, Sung HJ. Large-scale structures of turbulent flows over an open cavity.J Fluids Struct 2009;25:1318–33.
[9] Mesalhy O, Aziz SSA, El-Sayed MM. Flow and heat transfer over shallowcavities. Int J Therm Sci 2009;49:514–21.
[10] Wyngaard JC. Toward numerical modeling in the ‘‘Terra Incognita’’. J Atmos Sci2004;61:1816–26.
[11] Chen F, Kusaka H, Bornstein R, Ching J, Grimmond C, Grossman-Clarke S, et al.The integrated WRF/urban modeling system: development, evaluation, andapplications to urban environmental problems. Int J Climatol 2011;31:273–88.
[12] Flores F, Garreaud R, Muñoz R. CFD simulations of turbulent buoyantatmospheric flows over complex geometry: solver development inOpenFOAM. Comput Fluids 2013;82:1–13.

F. Flores et al. / Computers & Fluids 90 (2014) 72–87 87
[13] Spalart PR, Jou W, Strelets M, Allmaras SR. Comments on the feasibility of LESfor wings, and on a hybrid RANS/LES approach. In: Proceedings of 1st AFOSRinternational conference on DNS/LES; 1997. p. 137–47.
[14] Spalart PR. Detached-eddy simulation. Ann Rev Fluid Mech 2009;41:181–202.[15] Kiefer MT, Zhong S. A numerical modeling study of the nocturnal boundary
layer inside Arizona’s Meteor Crater. In: 19th Symposium on boundary layersand turbulence, 12 April 2010. American Meteorological Society; 2010.
[16] Fritts DC, Goldstein D, Lund T. High-resolution numerical studies of stableboundary layer flows in a closed basin: evolution of steady and oscillatoryflows in an axisymmetric arizona meteor crater. J Geophys Res 2010;115.D18109–.
[17] Sharples J, McRae R, Weber R. Wind characteristics over complex terrain withimplications for bushfire risk management. Environ Model Softw2010;25:1099–120.
[18] Skyllingstad ED. Large-eddy simulation of katabatic flows. Boundary-LayerMeteorol 2002;106:217–43.
[19] Axelsen SL. Large-eddy simulation and analytical modelling of katabaticwinds. Ph.D. thesis, Institute for Marine and Atmospheric research, Faculty ofScience, Department of Physics and Astronomy, Utrecht University, TheNetherlands; 2010.
[20] Whiteman CD. Observations of thermally developed wind systems inmountainous terrain. Atmos Process Complex Terrain Meteorol Monogr1990:1–4.
[21] Colette A, Chow FK, Street RL. A numerical study of inversion-layer breakupand the effects of topographic shading in idealized valleys. J Appl Meteorol2003;42:1255–72.
[22] Whiteman CD, Muschinski A, Zhong S, Fritts D, Hoch SW, Hahnenberger M,et al. METCRAX 2006 meteorological experiments in Arizona’s Meteorcrater. BAMS, American Meteorological Society; 2008.
[23] Issa R. Solution of the implicitly discretised fluid flow equations by operator-splitting. J Comput Phys 1985;62:40–65.
[24] Issa R, Gosman A, Watkins A. The computation of compressible andincompressible recirculating flows by a non-iterative implicit scheme. JComput Phys 1986;62:66–82.
[25] Oliveira P, Issa R. An improved PISO algorithm for the computationof buoyancy-driven flows. Numer Heat Transfer 2001;Part B,40:473–793.
[26] Demirdzic I, Lilek Z, Peric M. A collocated finite volume method for predictingflows at all speeds. Int J Numer Methods Fluids 1993;16:1029–50.
[27] Maureira JC, Baeza C, Pérez T. Levque cluster user manual. Universidad deChile; 2011. Major scientific and technological equipment for user facilitycenters.
[28] Moeng CH, Sullivan P. A comparison of shear -and buoyancy- driven planetaryboundary layer flows. J Atmos Sci 1994;51(7):999–1022.
[29] Churchfield M, Moriarty P, Vijayakumar G, Brasseur J. Wind energy-relatedatmospheric boundary layer large-eddy simulation using openfoam. In: 19thSymposium on Boundary layers and turbulence, Keystone, Colorado, August2–6, 2010; 2010.
[30] de Villiers E. The potential of large eddy simulation for the modeling ofwall bounded flows. Ph.D. thesis; Thermofluids Section, Department ofMechanical Engineering, Imperial College of Science, Technology andMedicine; 2006.
[31] Gousseau P, Blocken B, van Heijst G. Quality assessment of large-eddysimulation of wind flow around a high-rise building: validation and solutionverification. Comput Fluids 2013;79:120–33.
[32] Batchelor GK. An introduction to fluid dynamics. Cambridge University Press;1967.
[33] Schlichting H. Boundary-layer theory. McGraw Hill; 1979.[34] Barkan J, Alpert P. The linkage between solar insolation and dust in the major
world deserts. Open Atmos Sci J 2010;4:101–13.[35] Garreaud R. The Andes climate and weather. Adv Geosci 2009;7:1–9.[36] Rutllant J, Fuenzalida H, Aceituno P. Climate dynamics along the arid northern
coast of Chile: the 1997–1998 Dinámica del Clima de la Región de Antofagasta(DICLIMA) experiment. J Geophys Res 2003;108. 4538–.
[37] Garreaud RD, Rutllant JA, Muñoz RC, Rahn DA, Ramos M, Figueroa D. VOCALS-CUpEx: the Chilean upwelling experiment. Atmos Chem Phys2011;11:2015–29.