computer networks and internets -...
TRANSCRIPT

1
Chapter 4-6
Signals, Media, And
Data Transmission

Figure 7.1 Transmission medium and
physical layer

7.1 Guided Media
Twisted-Pair Cable
Coaxial Cable
Fiber-Optic Cable

Figure 7.3 Twisted-pair cable

Figure 7.4 UTP and STP
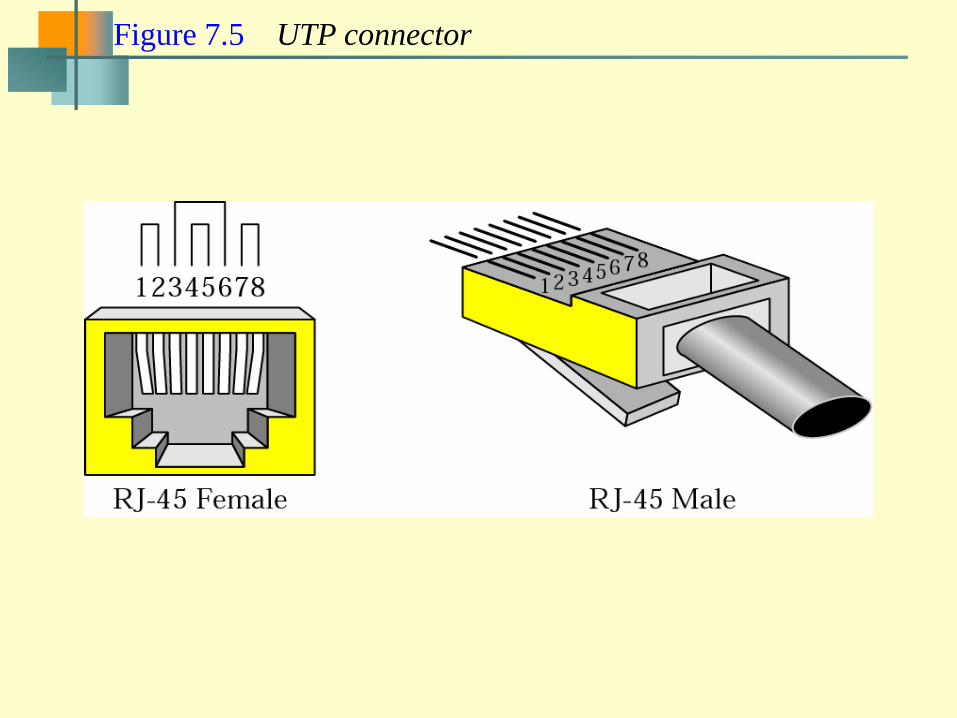
Figure 7.5 UTP connector

Figure 7.7 Coaxial cable

Figure 7.8 BNC connectors

Figure 7.10 Bending of light ray
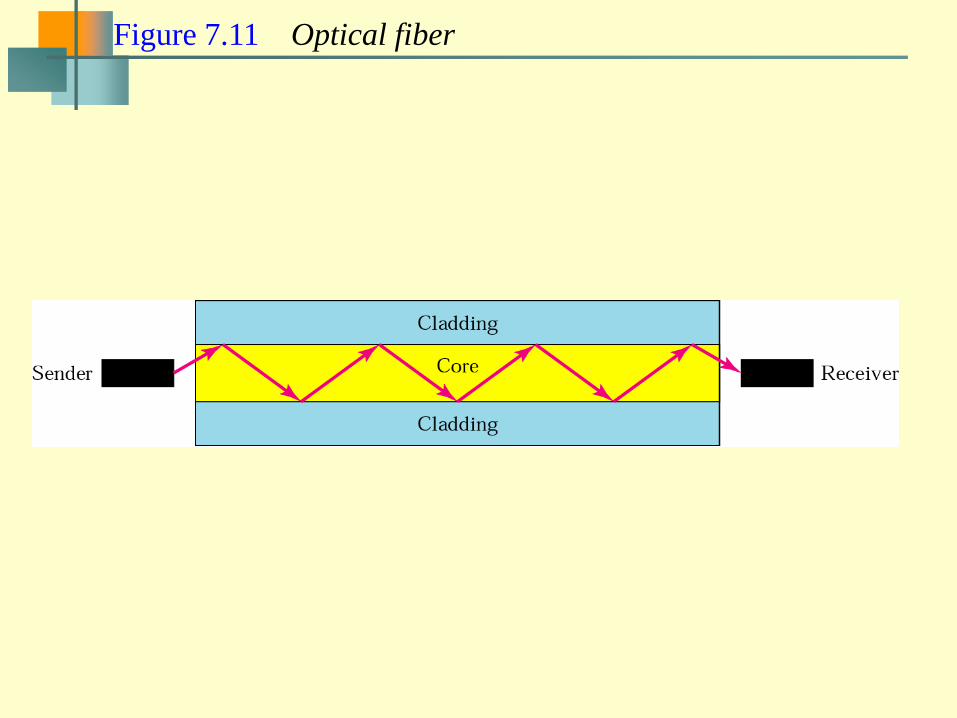
Figure 7.11 Optical fiber
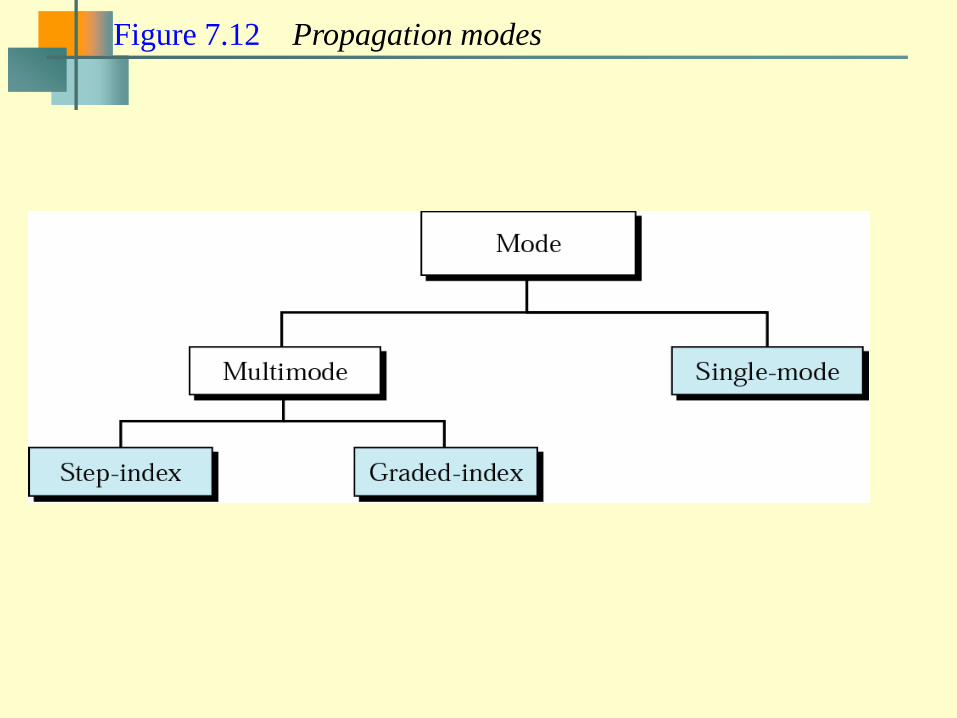
Figure 7.12 Propagation modes

Figure 7.13 Modes

Figure 7.14 Fiber construction
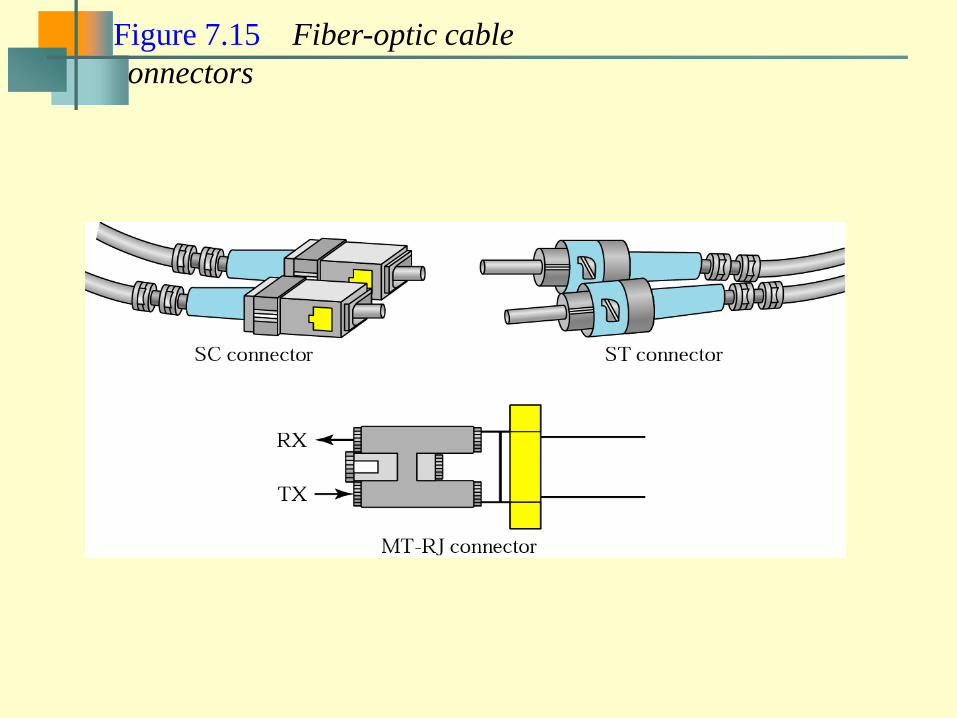
Figure 7.15 Fiber-optic cable
connectors

Figure 7.16 Optical fiber
performance

7.2 Unguided Media: Wireless
Radio Waves
Microwaves
Infrared

Figure 7.17 Electromagnetic spectrum for wireless
communication
Radio waves are used for multicast
communications, such as radio and
television, and paging systems.
Note:
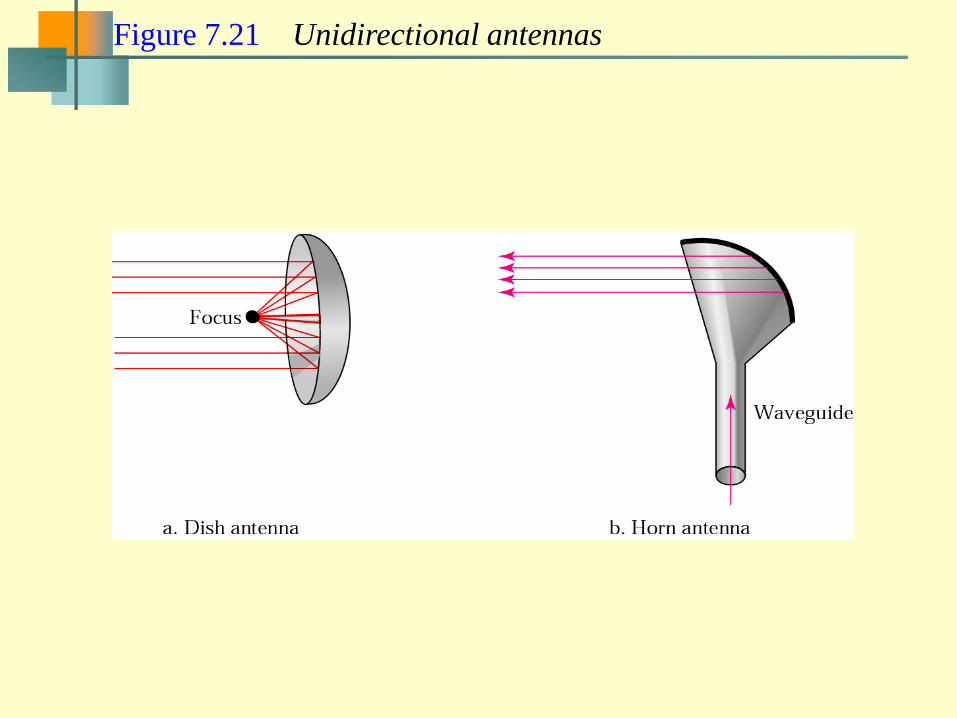
Figure 7.21 Unidirectional antennas
Microwaves are used for unicast
communication such as cellular
telephones, satellite networks, and
wireless LANs.
Note:

Infrared signals can be used for short-
range communication in a closed area
using line-of-sight propagation.
Note:
To be transmitted, data must be
transformed to electromagnetic signals.
Note:

Signals can be analog or digital.
Analog signals can have an infinite
number of values in a range; digital
signals can have only a limited number
of values.
Note:

Figure 3.1 Comparison of analog and digital
signals

In data communication, we commonly
use periodic analog signals and
aperiodic digital signals.
Note:

3.2 Analog Signals
Sine Wave
Phase
Examples of Sine Waves
Time and Frequency Domains
Composite Signals
Bandwidth
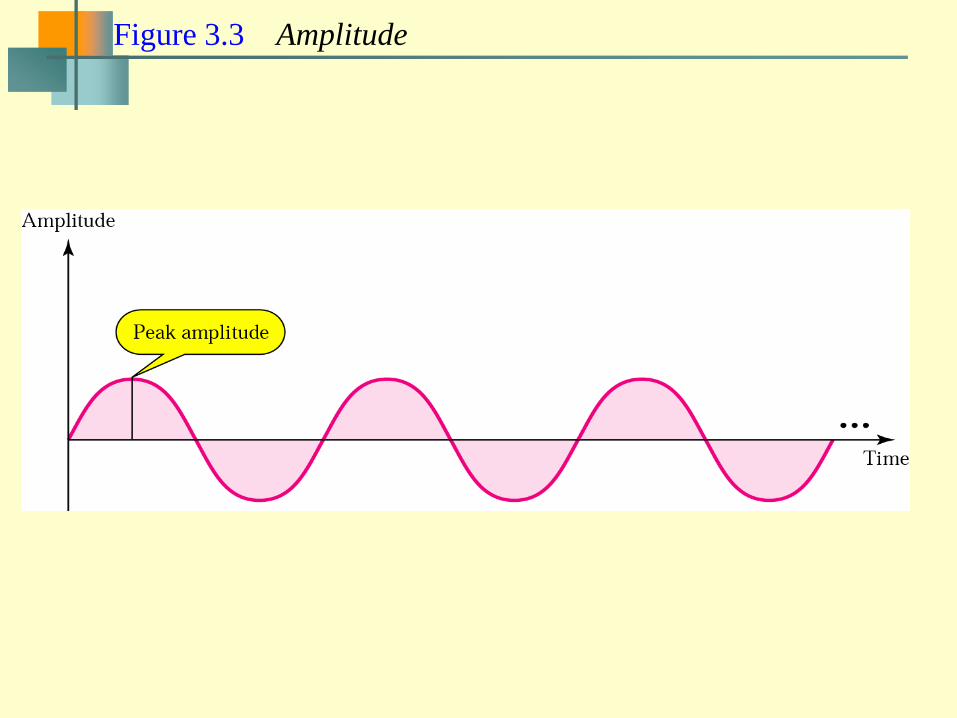
Figure 3.3 Amplitude
Frequency and period are inverses of
each other.
Note:

Figure 3.4 Period and frequency

If a signal does not change at all, its
frequency is zero. If a signal changes
instantaneously, its frequency is infinite.
Note:

Phase describes the position of the
waveform relative to time zero.
Note:

Figure 3.5 Relationships between different
phases

Figure 3.6 Sine wave examples
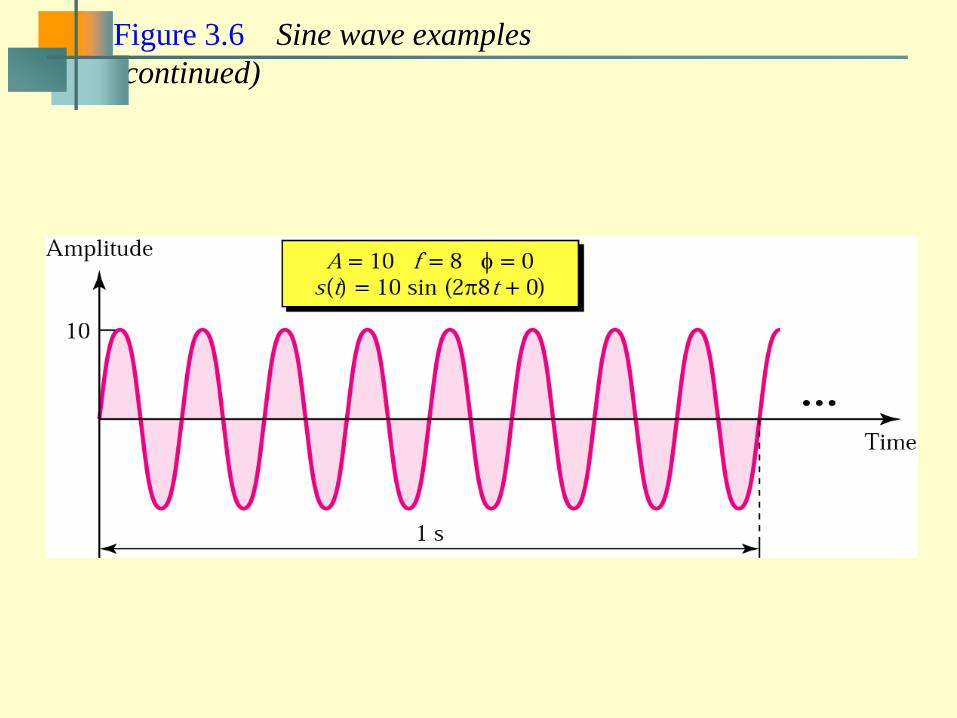
Figure 3.6 Sine wave examples
(continued)
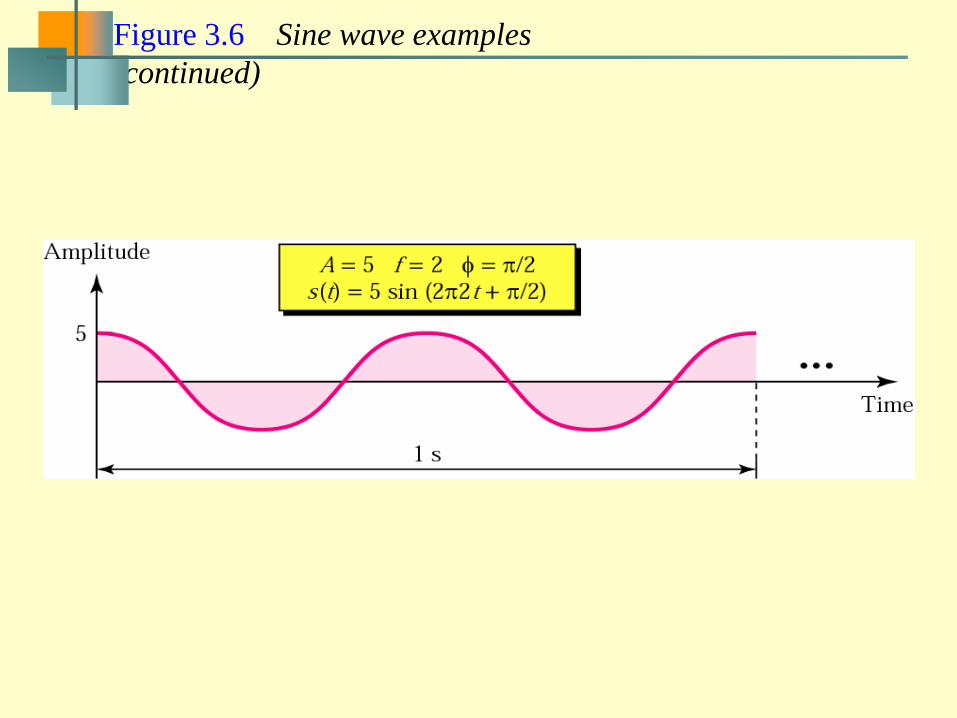
Figure 3.6 Sine wave examples
(continued)

An analog signal is best represented in
the frequency domain.
Note:
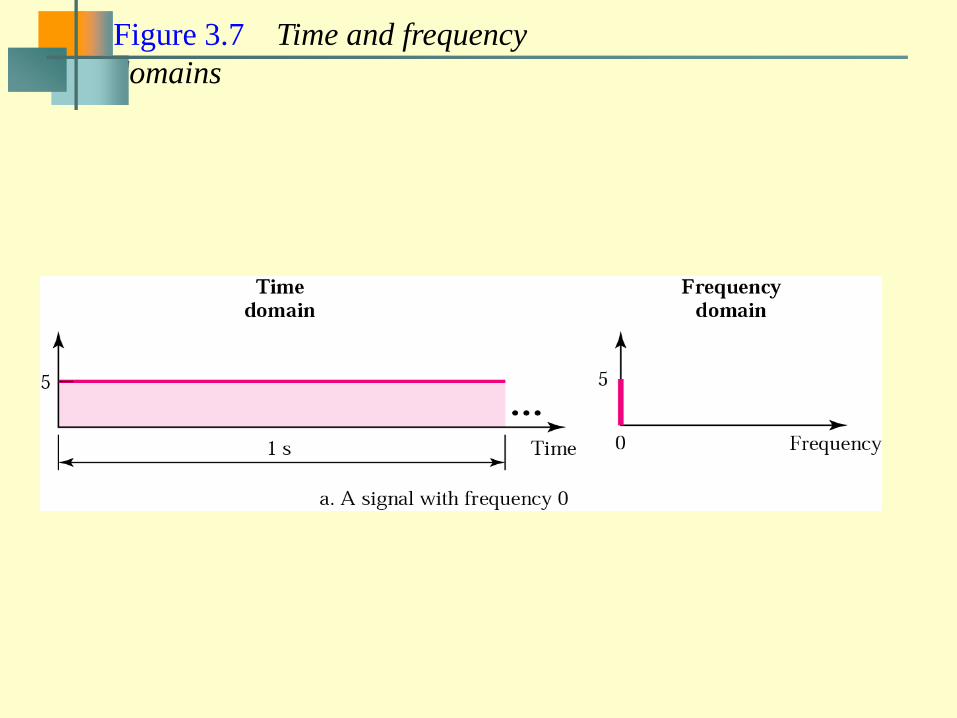
Figure 3.7 Time and frequency
domains

Figure 3.7 Time and frequency domains
(continued)

Figure 3.7 Time and frequency domains
(continued)
A single-frequency sine wave is not
useful in data communications; we need
to change one or more of its
characteristics to make it useful.
Note:

When we change one or more
characteristics of a single-frequency
signal, it becomes a composite signal
made of many frequencies.
Note:

According to Fourier analysis, any
composite signal can be represented as
a combination of simple sine waves
with different frequencies, phases, and
amplitudes.
Note:

Figure 3.8 Square wave

Figure 3.9 Three harmonics

Figure 3.10 Adding first three
harmonics

Figure 3.11 Frequency spectrum
comparison
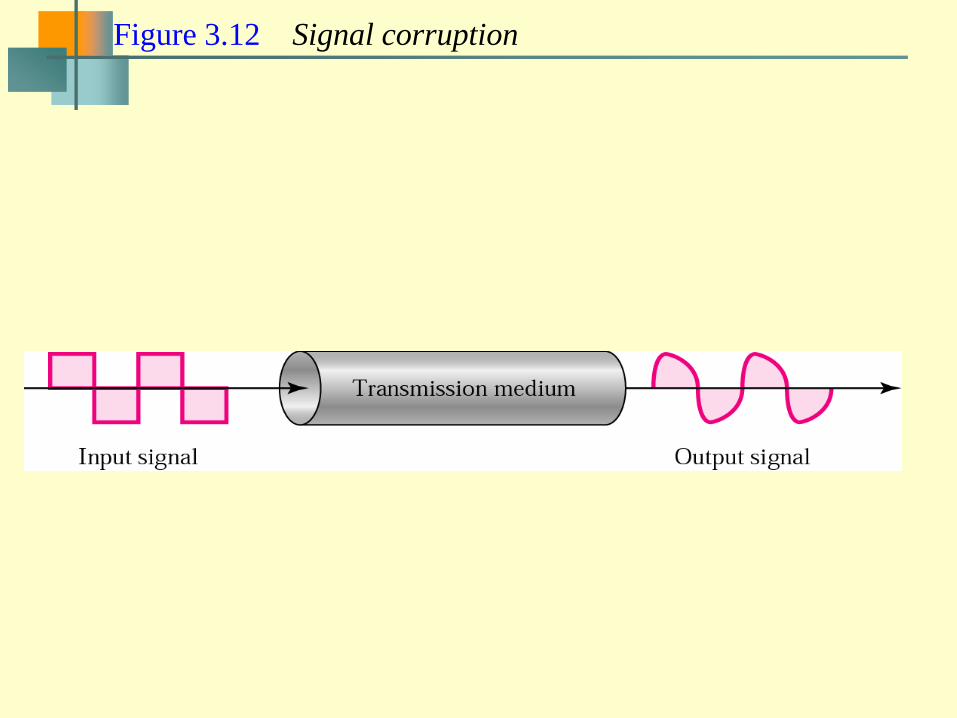
Figure 3.12 Signal corruption
The bandwidth is a property of a
medium: It is the difference between the
highest and the lowest frequencies that
the medium can
satisfactorily pass.
Note:
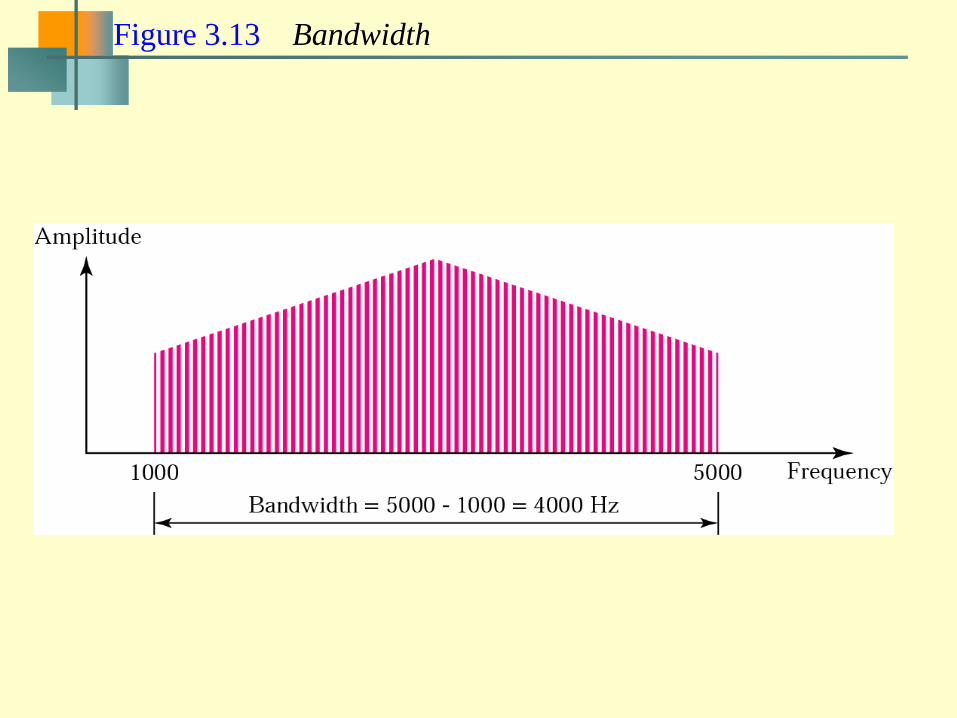
Figure 3.13 Bandwidth
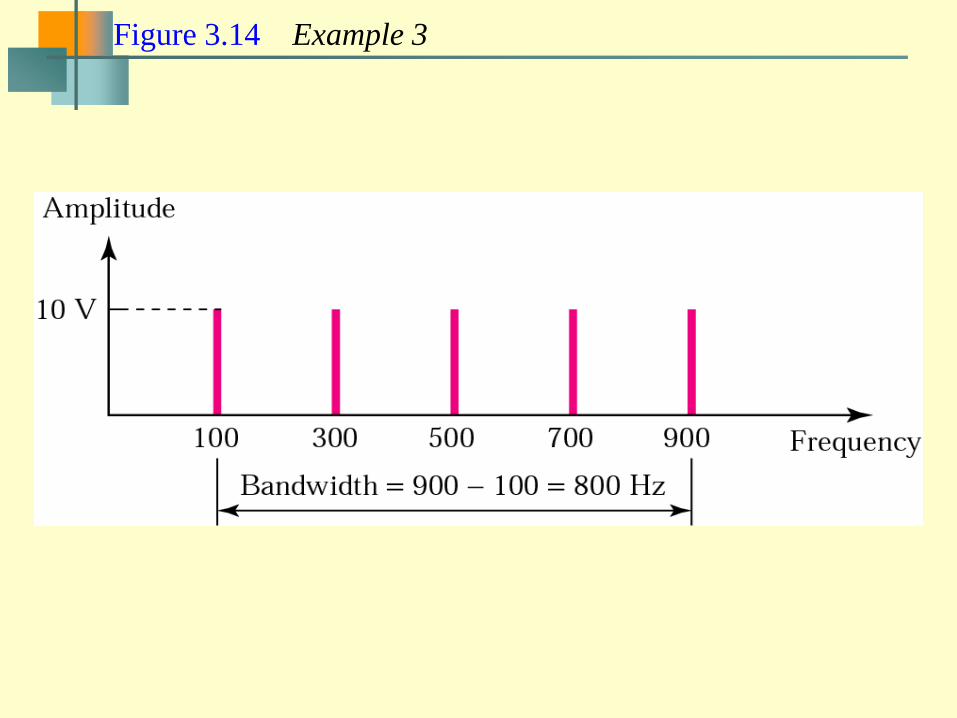
Figure 3.14 Example 3

Figure 3.15 Example 4
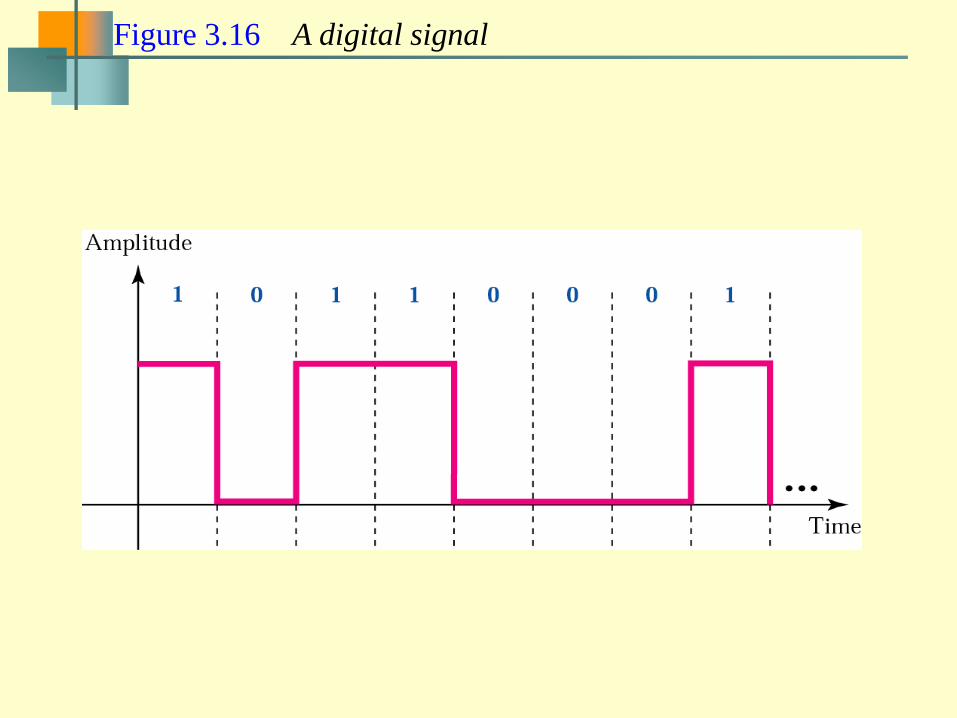
Figure 3.16 A digital signal
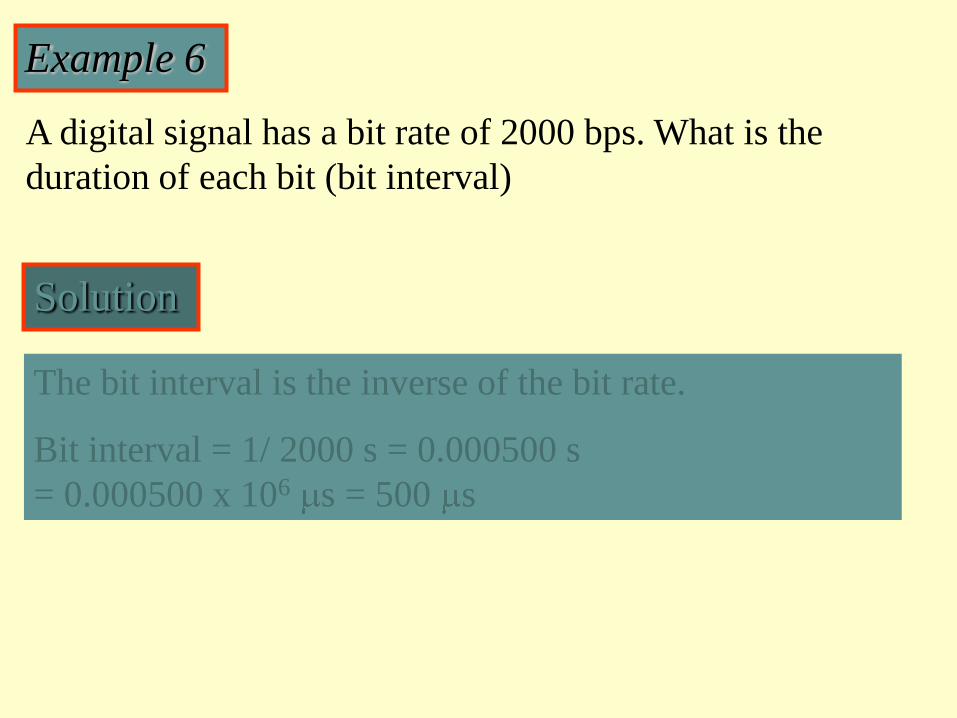
Example 6
A digital signal has a bit rate of 2000 bps. What is the
duration of each bit (bit interval)
Solution
The bit interval is the inverse of the bit rate.
Bit interval = 1/ 2000 s = 0.000500 s
= 0.000500 x 10⁶ s = 500 s
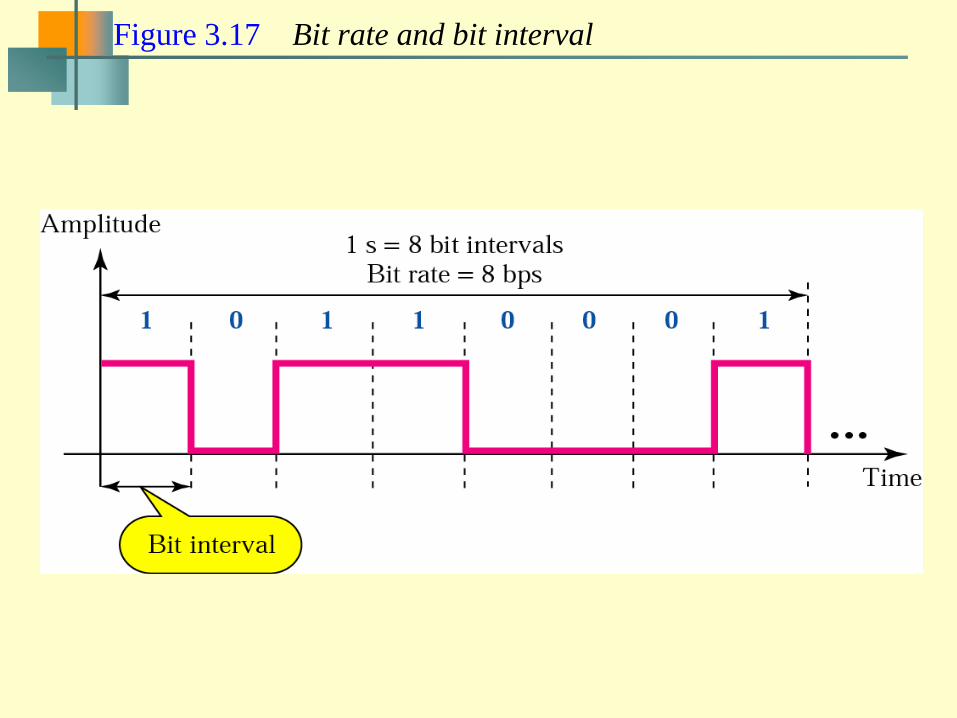
Figure 3.17 Bit rate and bit interval

Figure 3.18 Digital versus analog
The bit rate and the bandwidth are
proportional to each other.
Note:
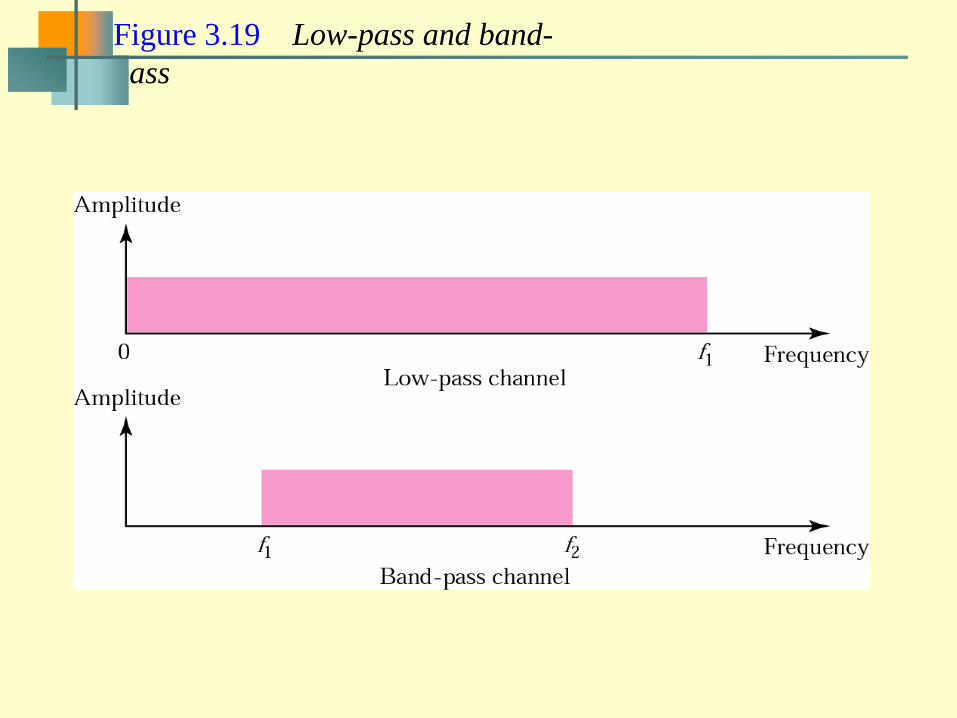
Figure 3.19 Low-pass and band-
pass
The analog bandwidth of a medium is
expressed in hertz; the digital
bandwidth, in bits per second.
Note:

3.5 Data Rate Limit
Noiseless Channel: Nyquist Bit Rate
Noisy Channel: Shannon Capacity
Using Both Limits
Example 7
Consider a noiseless channel with a bandwidth of 3000
Hz transmitting a signal with two signal levels. The
maximum bit rate can be calculated as
Bit Rate = 2 3000 log2 2 = 6000 bps
Example 8
Consider the same noiseless channel, transmitting a signal
with four signal levels (for each level, we send two bits).
The maximum bit rate can be calculated as:
Bit Rate = 2 x 3000 x log2 4 = 12,000 bps
Example 9
Consider an extremely noisy channel in which the value
of the signal-to-noise ratio is almost zero. In other words,
the noise is so strong that the signal is faint. For this
channel the capacity is calculated as
C = B log2 (1 + SNR) = B log2 (1 + 0)
= B log2 (1) = B 0 = 0

Example 10
We can calculate the theoretical highest bit rate of a
regular telephone line. A telephone line normally has a
bandwidth of 3000 Hz (300 Hz to 3300 Hz). The signal-
to-noise ratio is usually 3162. For this channel the
capacity is calculated as
C = B log2 (1 + SNR) = 3000 log2 (1 + 3162)
= 3000 log2 (3163)
C = 3000 11.62 = 34,860 bps

Example 11
We have a channel with a 1 MHz bandwidth. The SNR
for this channel is 63; what is the appropriate bit rate and
signal level?
Solution
C = B log2 (1 + SNR) = 106 log2 (1 + 63) = 106 log2 (64) = 6 Mbps
Then we use the Nyquist formula to find the
number of signal levels.
4 Mbps = 2 1 MHz log2 L L = 4
First, we use the Shannon formula to find our upper
limit.

Figure 3.20 Impairment types

Figure 3.21 Attenuation

Example 12
Imagine a signal travels through a transmission medium
and its power is reduced to half. This means that P2 = 1/2
P1. In this case, the attenuation (loss of power) can be
calculated as
Solution
10 log10 (P2/P1) = 10 log10 (0.5P1/P1) = 10 log10 (0.5)
= 10(–0.3) = –3 dB
Example 13
Imagine a signal travels through an amplifier and its
power is increased ten times. This means that P2 = 10 ¥
P1. In this case, the amplification (gain of power) can be
calculated as
10 log10 (P2/P1) = 10 log10 (10P1/P1)
= 10 log10 (10) = 10 (1) = 10 dB

Example 14
One reason that engineers use the decibel to measure the
changes in the strength of a signal is that decibel numbers
can be added (or subtracted) when we are talking about
several points instead of just two (cascading). In Figure
3.22 a signal travels a long distance from point 1 to point
4. The signal is attenuated by the time it reaches point 2.
Between points 2 and 3, the signal is amplified. Again,
between points 3 and 4, the signal is attenuated. We can
find the resultant decibel for the signal just by adding the
decibel measurements between each set of points.
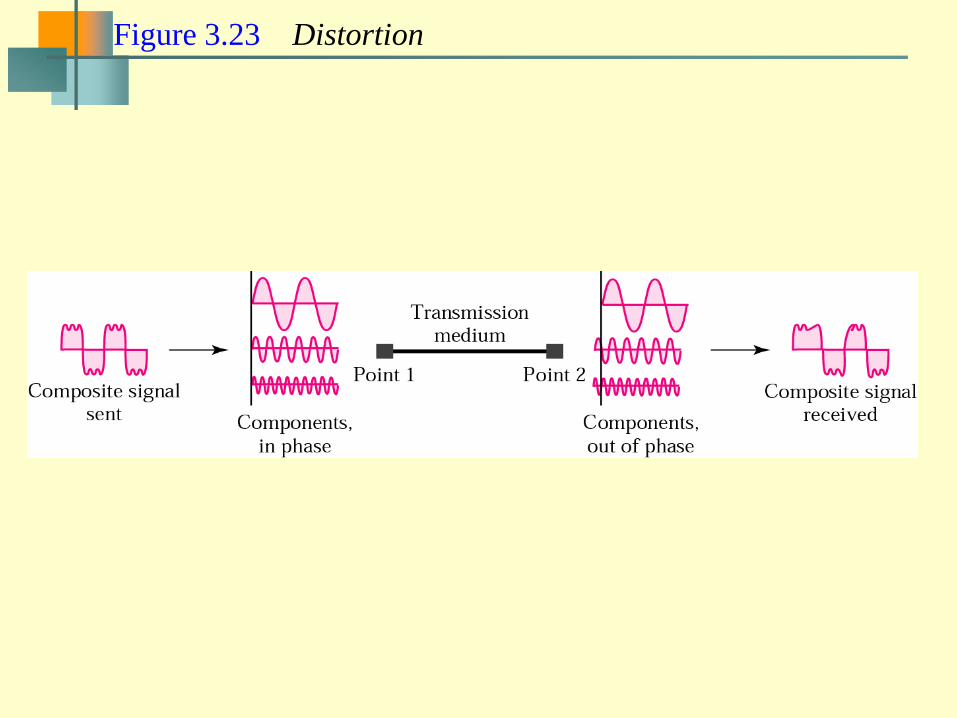
Figure 3.23 Distortion

Figure 3.24 Noise
3.7 More About Signals
Throughput
Propagation Speed
Propagation Time
Wavelength

Figure 5.1 Digital-to-analog
modulation
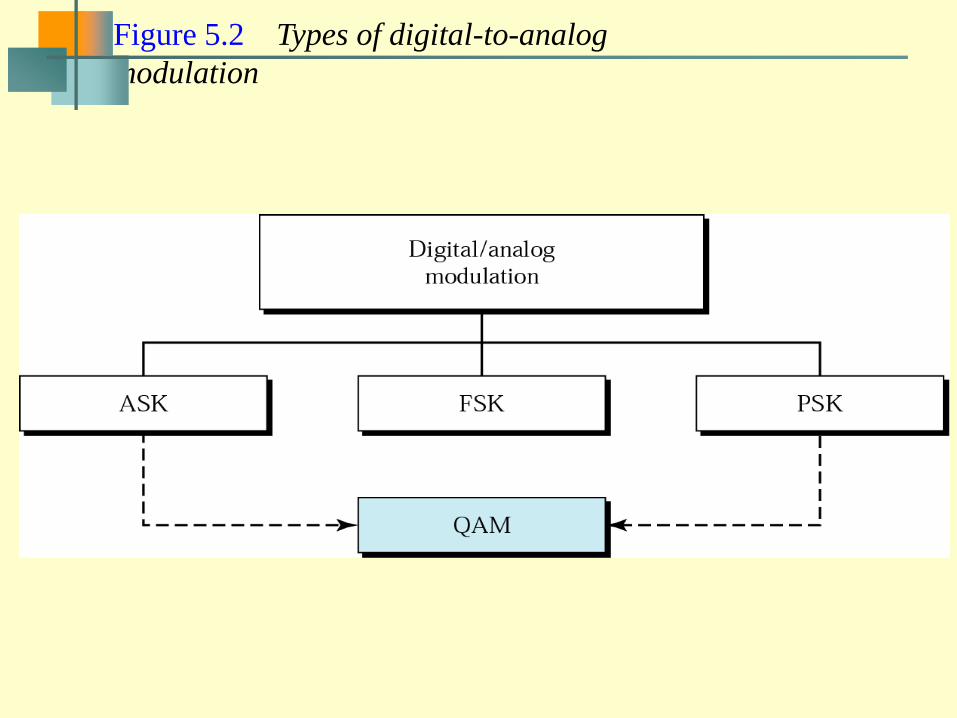
Figure 5.2 Types of digital-to-analog
modulation

Bit rate is the number of bits per
second. Baud rate is the number of
signal units per second. Baud rate is
less than or equal to the bit rate.
Note:
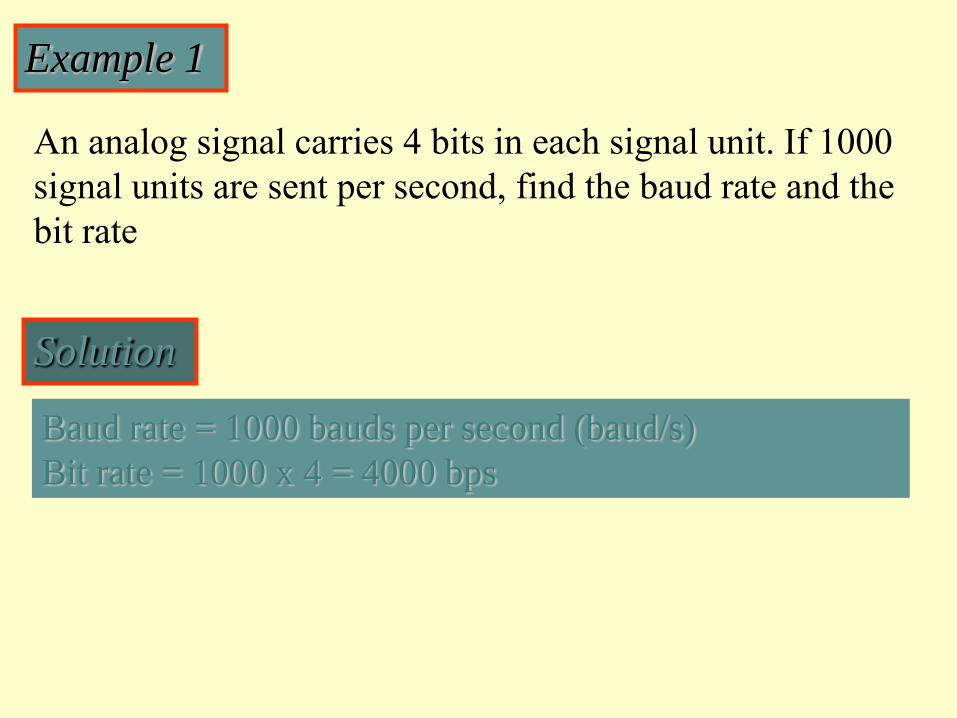
Example 1
An analog signal carries 4 bits in each signal unit. If 1000
signal units are sent per second, find the baud rate and the
bit rate
Solution
Baud rate = 1000 bauds per second (baud/s)
Bit rate = 1000 x 4 = 4000 bps
Example 2
The bit rate of a signal is 3000. If each signal unit carries
6 bits, what is the baud rate?
Solution
Baud rate = 3000 / 6 = 500 baud/s

Figure 5.3 ASK
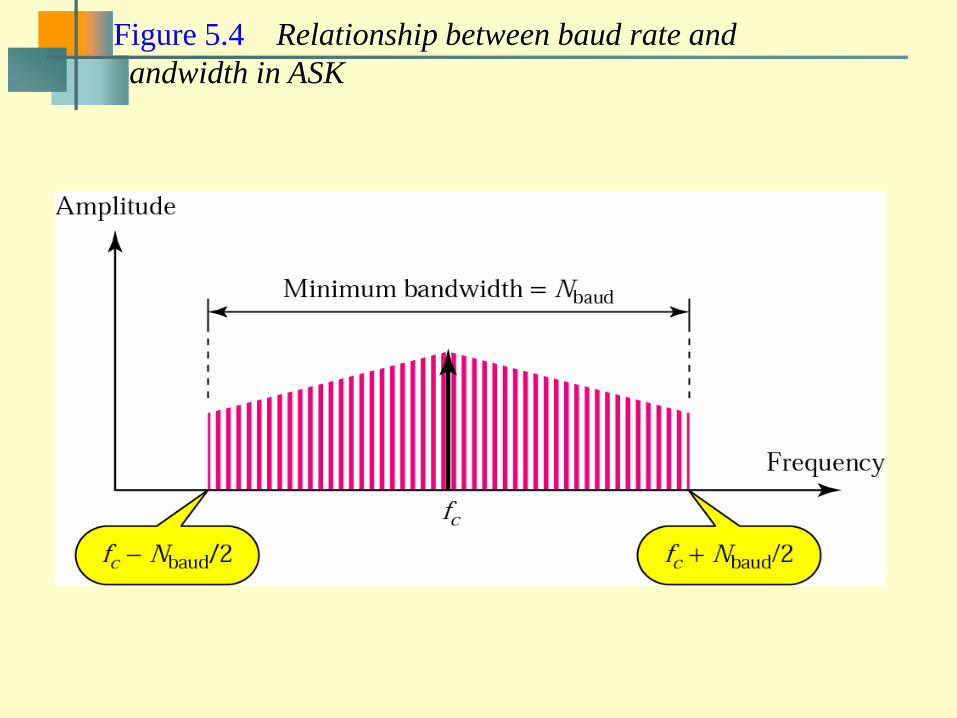
Figure 5.4 Relationship between baud rate and
bandwidth in ASK
Example 3
Find the minimum bandwidth for an ASK signal
transmitting at 2000 bps. The transmission mode is half-
duplex.
Solution
In ASK the baud rate and bit rate are the same. The baud
rate is therefore 2000. An ASK signal requires a
minimum bandwidth equal to its baud rate. Therefore,
the minimum bandwidth is 2000 Hz.
Example 4
Given a bandwidth of 5000 Hz for an ASK signal, what
are the baud rate and bit rate?
Solution
In ASK the baud rate is the same as the bandwidth,
which means the baud rate is 5000. But because the baud
rate and the bit rate are also the same for ASK, the bit
rate is 5000 bps.

Example 5
Given a bandwidth of 10,000 Hz (1000 to 11,000 Hz),
draw the full-duplex ASK diagram of the system. Find the
carriers and the bandwidths in each direction. Assume
there is no gap between the bands in the two directions.
Solution
For full-duplex ASK, the bandwidth for each direction is
BW = 10000 / 2 = 5000 Hz
The carrier frequencies can be chosen at the middle of
each band (see Fig. 5.5).
fc (forward) = 1000 + 5000/2 = 3500 Hz
fc (backward) = 11000 – 5000/2 = 8500 Hz
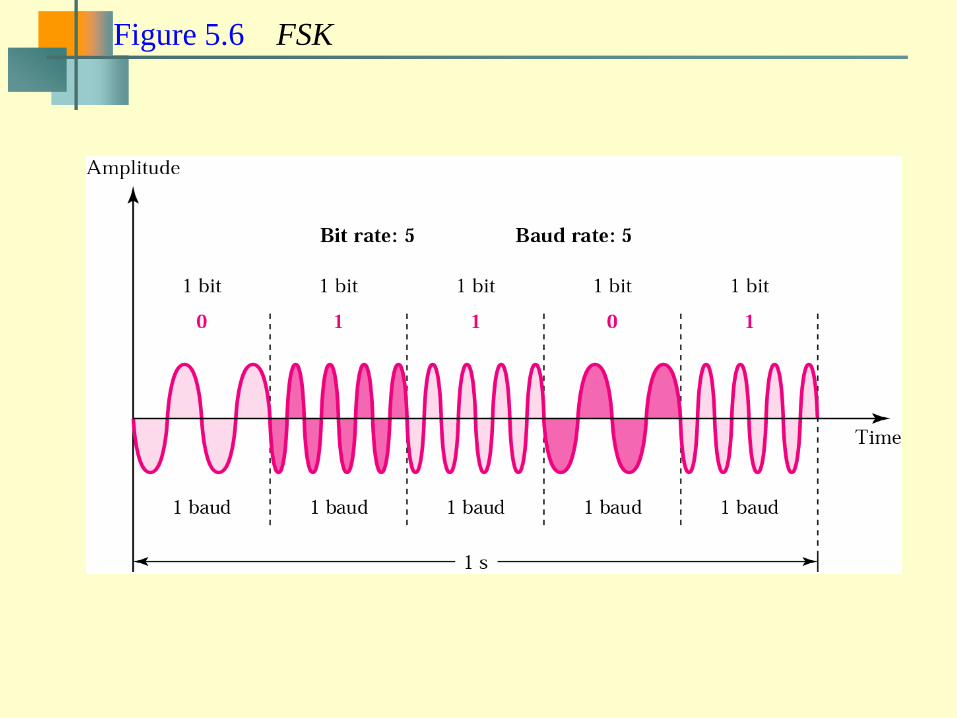
Figure 5.6 FSK

Example 6
Find the minimum bandwidth for an FSK signal
transmitting at 2000 bps. Transmission is in half-duplex
mode, and the carriers are separated by 3000 Hz.
Solution
For FSK
BW = baud rate + fc1 fc0
BW = bit rate + fc1 fc0 = 2000 + 3000 = 5000 Hz
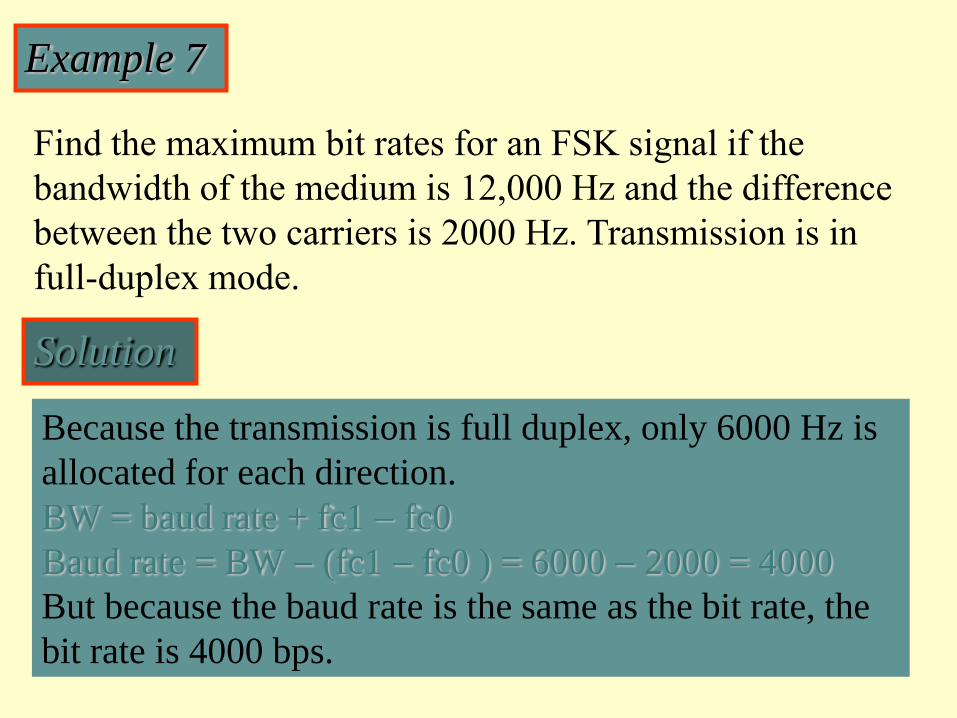
Example 7
Find the maximum bit rates for an FSK signal if the
bandwidth of the medium is 12,000 Hz and the difference
between the two carriers is 2000 Hz. Transmission is in
full-duplex mode.
Solution
Because the transmission is full duplex, only 6000 Hz is
allocated for each direction.
BW = baud rate + fc1 fc0
Baud rate = BW (fc1 fc0 ) = 6000 2000 = 4000
But because the baud rate is the same as the bit rate, the
bit rate is 4000 bps.
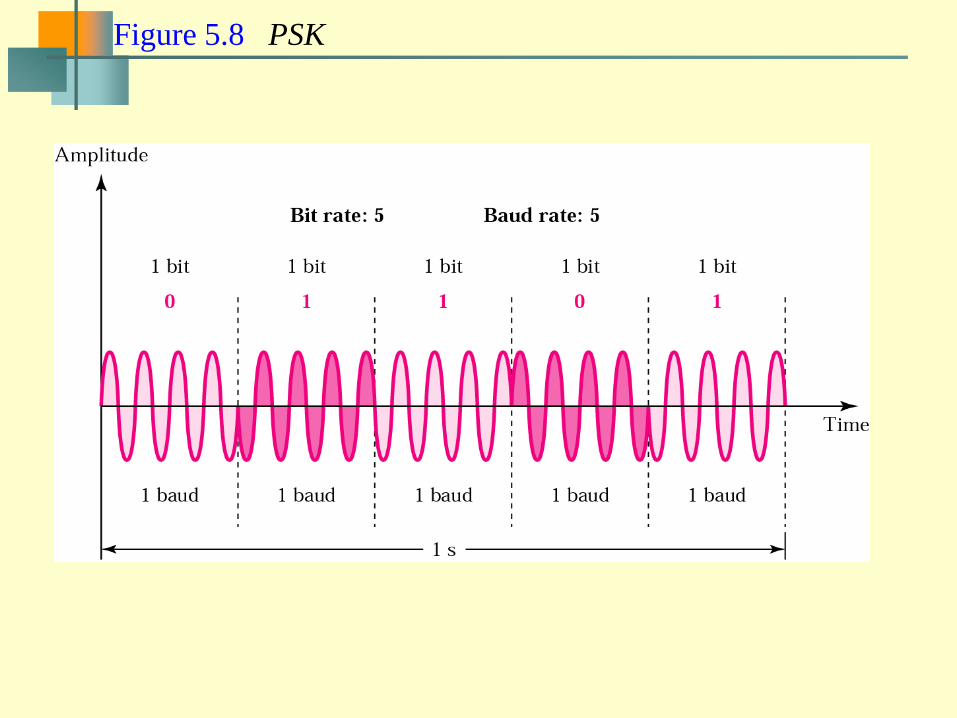
Figure 5.8 PSK
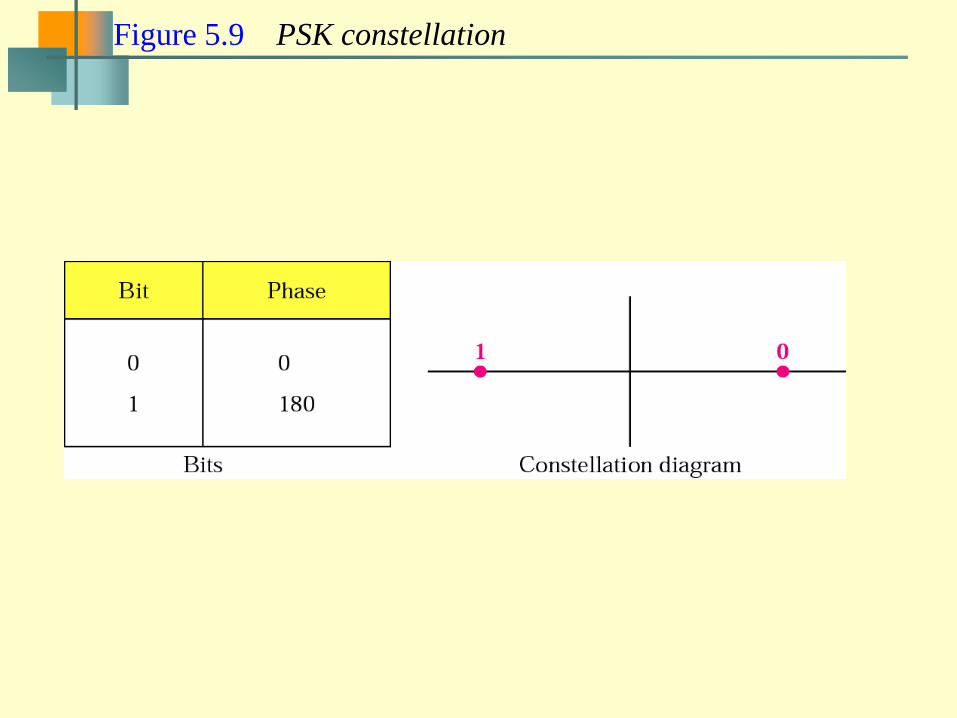
Figure 5.9 PSK constellation
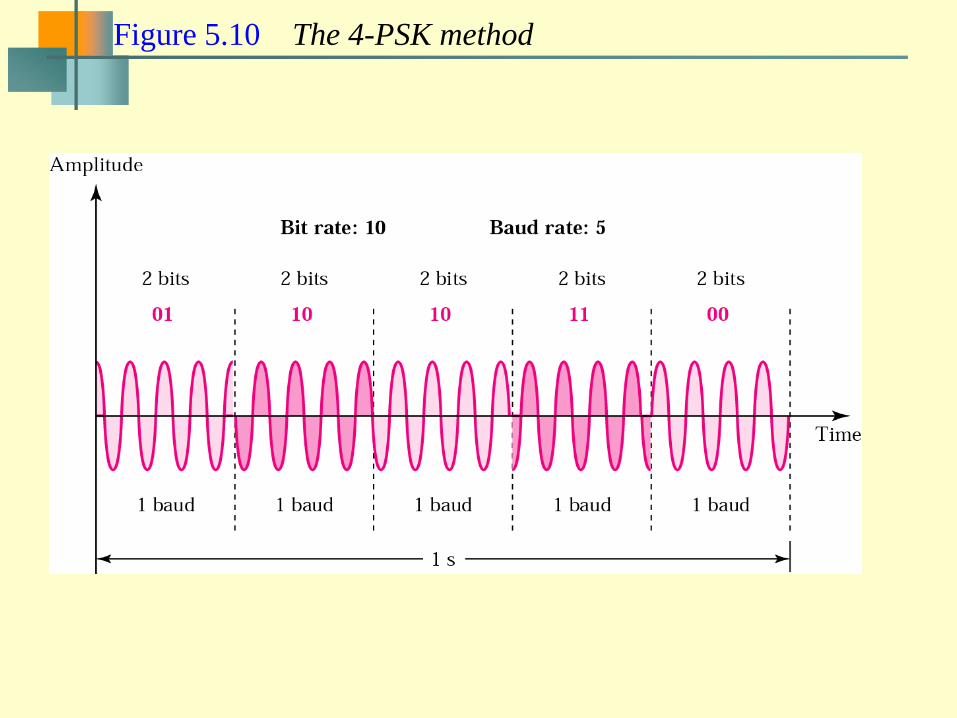
Figure 5.10 The 4-PSK method

Figure 5.11 The 4-PSK
characteristics
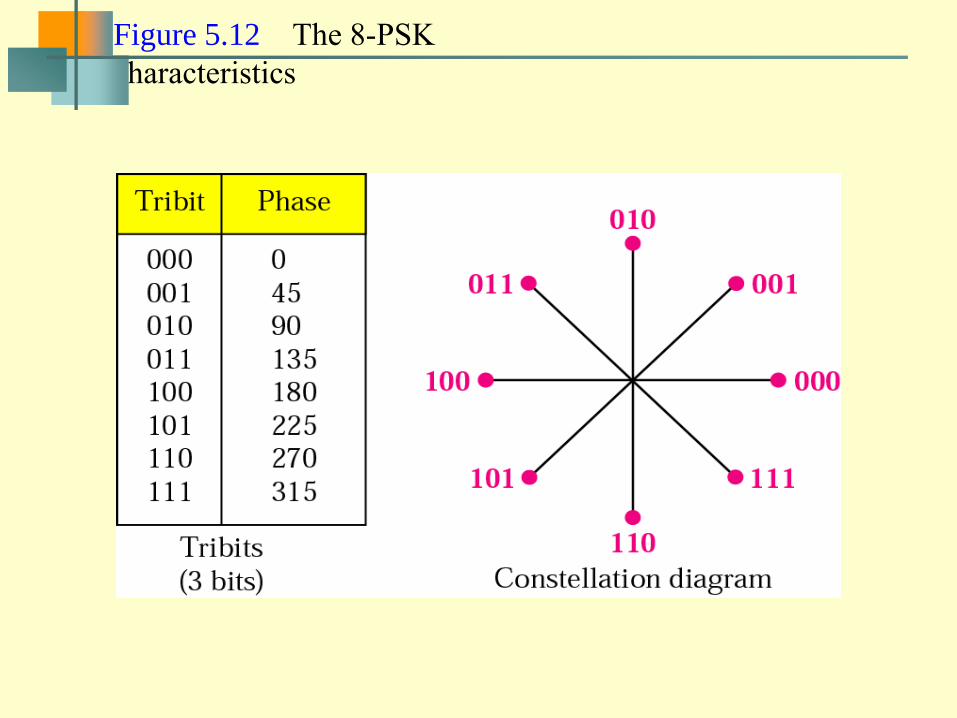
Figure 5.12 The 8-PSK
characteristics
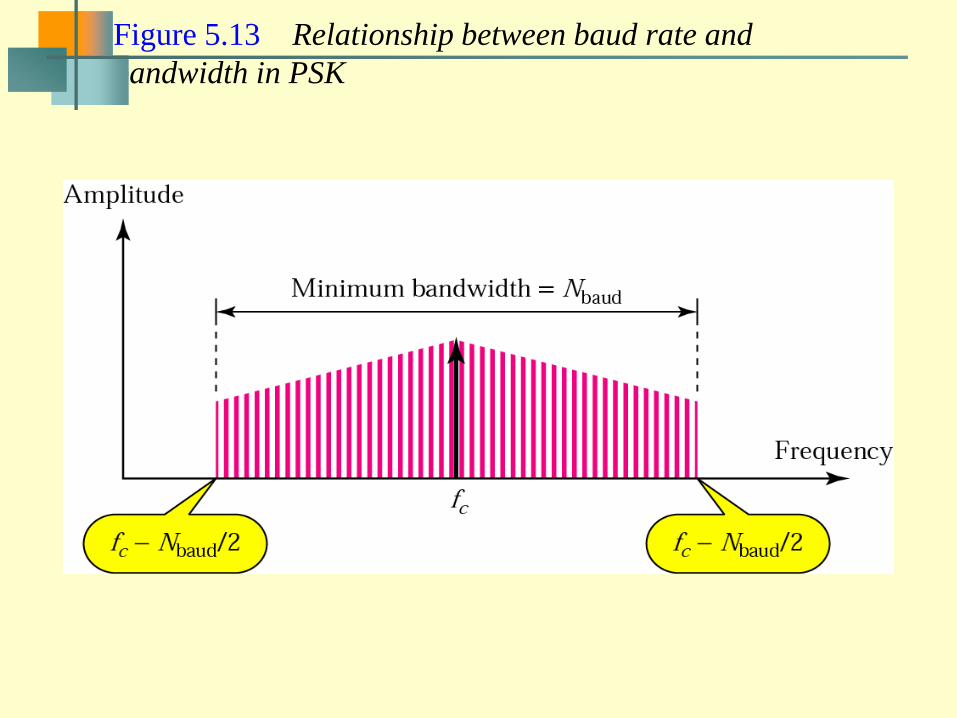
Figure 5.13 Relationship between baud rate and
bandwidth in PSK
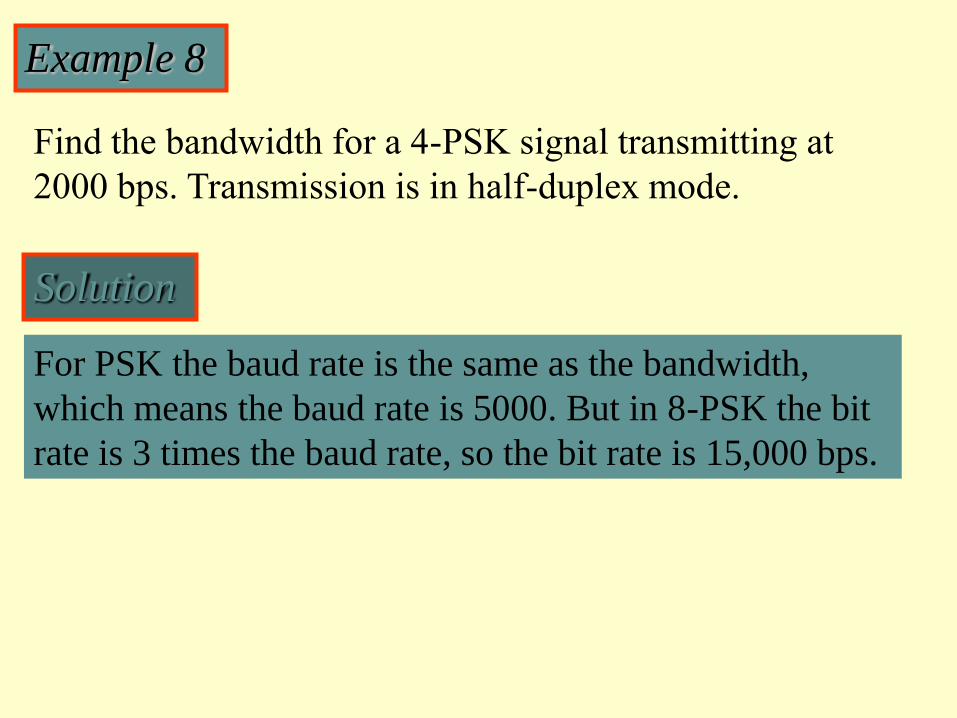
Example 8
Find the bandwidth for a 4-PSK signal transmitting at
2000 bps. Transmission is in half-duplex mode.
Solution
For PSK the baud rate is the same as the bandwidth,
which means the baud rate is 5000. But in 8-PSK the bit
rate is 3 times the baud rate, so the bit rate is 15,000 bps.
Example 9
Given a bandwidth of 5000 Hz for an 8-PSK signal, what
are the baud rate and bit rate?
Solution
For PSK the baud rate is the same as the bandwidth,
which means the baud rate is 5000. But in 8-PSK the bit
rate is 3 times the baud rate, so the bit rate is 15,000 bps.

Quadrature amplitude modulation is a
combination of ASK and PSK so that a
maximum contrast between each signal
unit (bit, dibit, tribit, and so on) is
achieved.
Note:
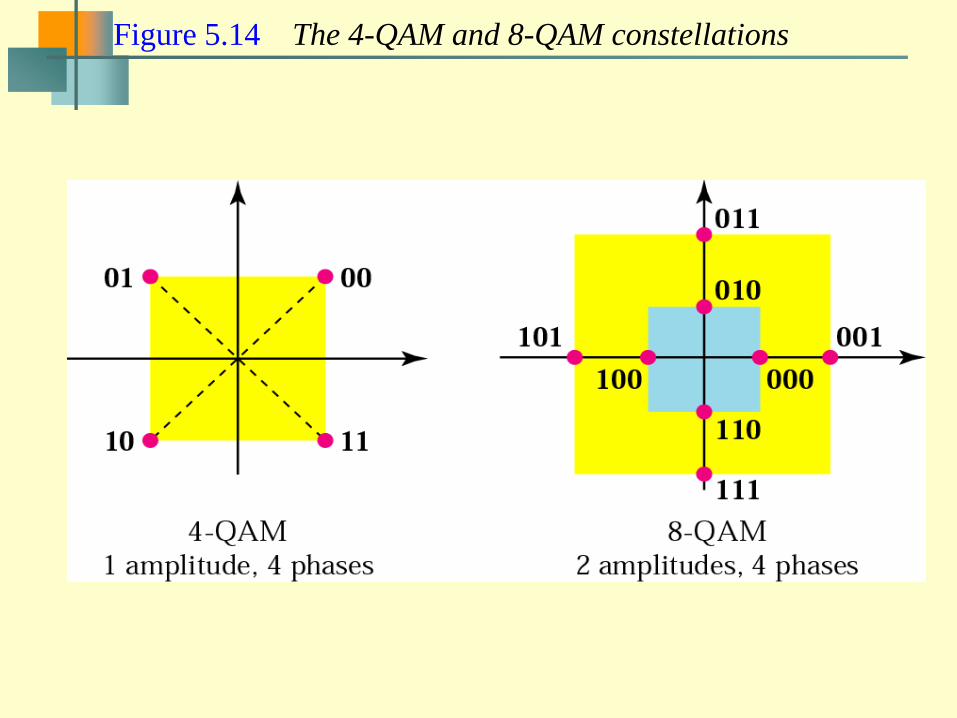
Figure 5.14 The 4-QAM and 8-QAM constellations
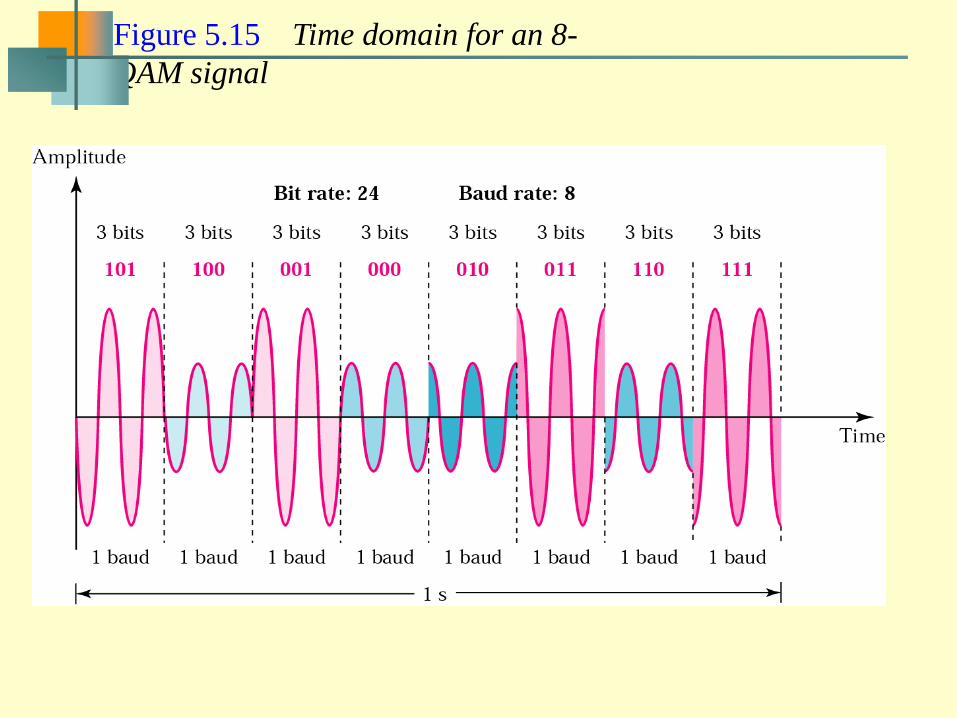
Figure 5.15 Time domain for an 8-
QAM signal
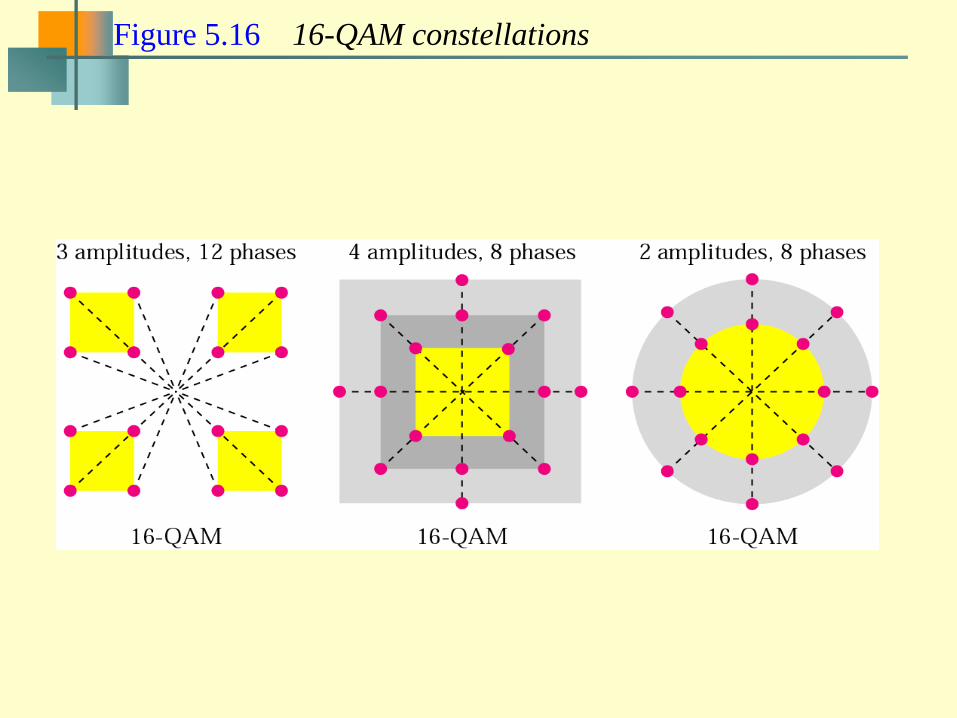
Figure 5.16 16-QAM constellations

Example 11
Compute the bit rate for a 1000-baud 16-QAM signal.
Solution
A 16-QAM signal has 4 bits per signal unit since
log216 = 4.
Thus,
(1000)(4) = 4000 bps

Example 12
Compute the baud rate for a 72,000-bps 64-QAM signal.
Solution
A 64-QAM signal has 6 bits per signal unit since
log2 64 = 6.
Thus,
72000 / 6 = 12,000 baud

5.2 Telephone Modems
Modem Standards

A telephone line has a bandwidth of
almost 2400 Hz for data transmission.
Note:

Figure 5.18 Telephone line
bandwidth

Modem stands for
modulator/demodulator.
Note:
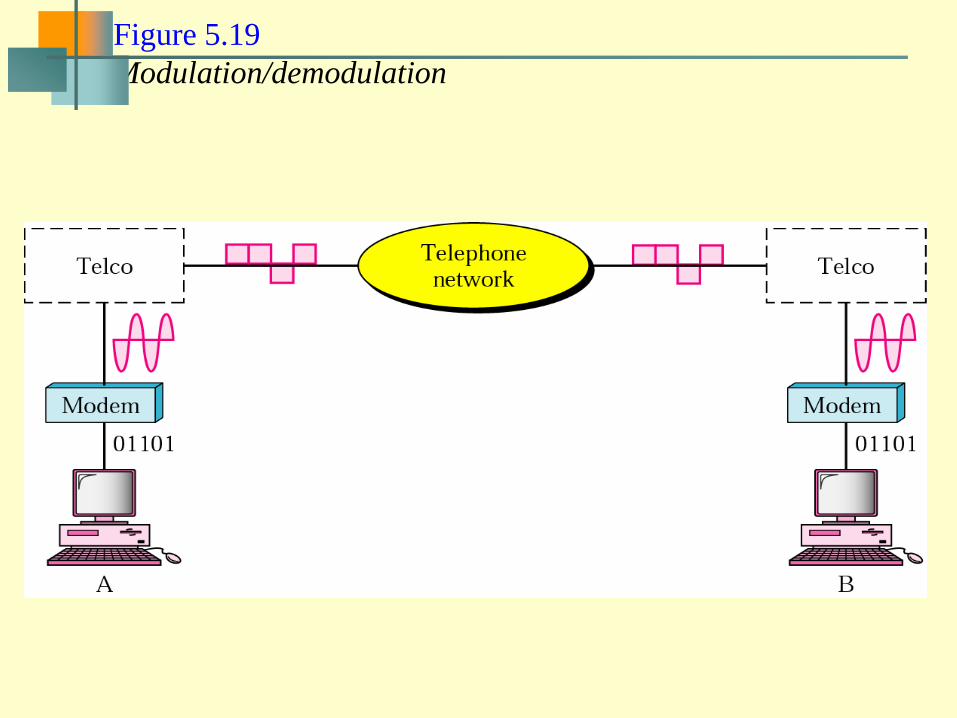
Figure 5.19
Modulation/demodulation
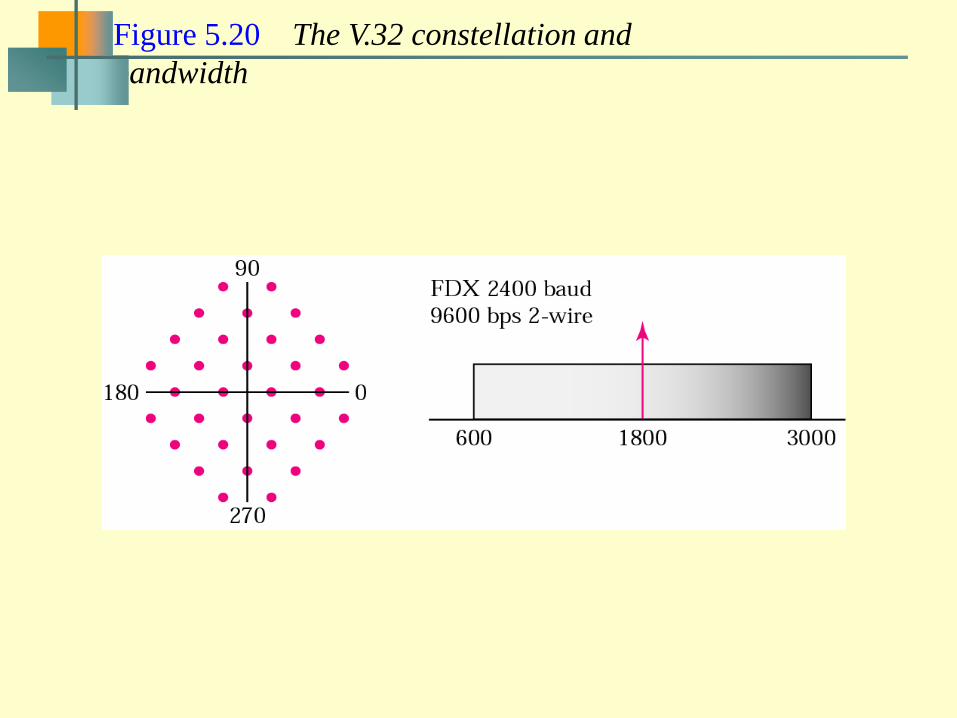
Figure 5.20 The V.32 constellation and
bandwidth
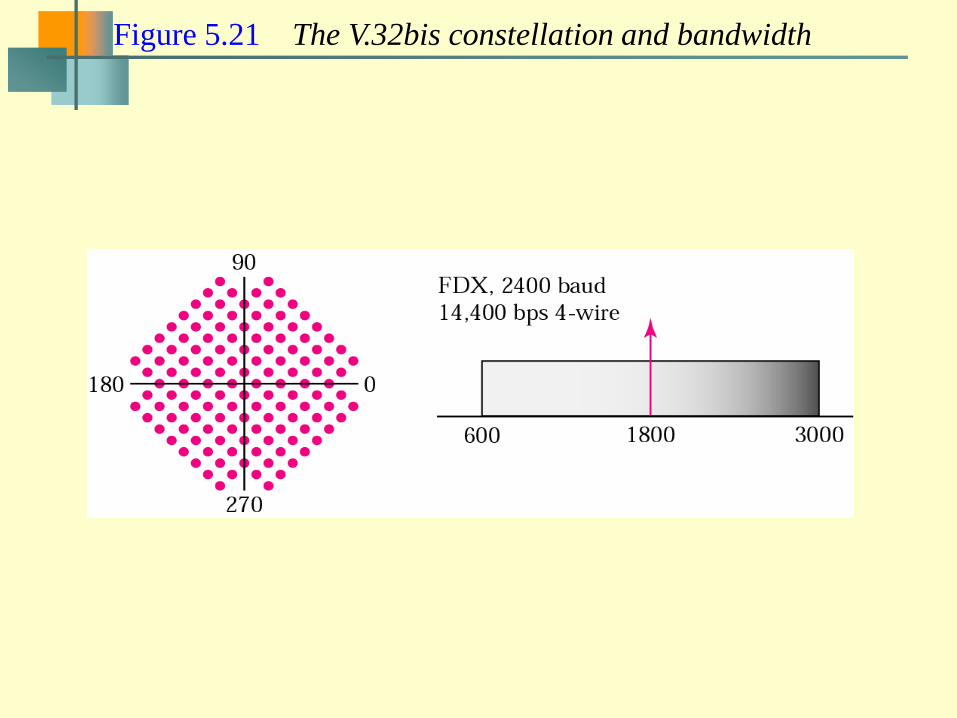
Figure 5.21 The V.32bis constellation and bandwidth
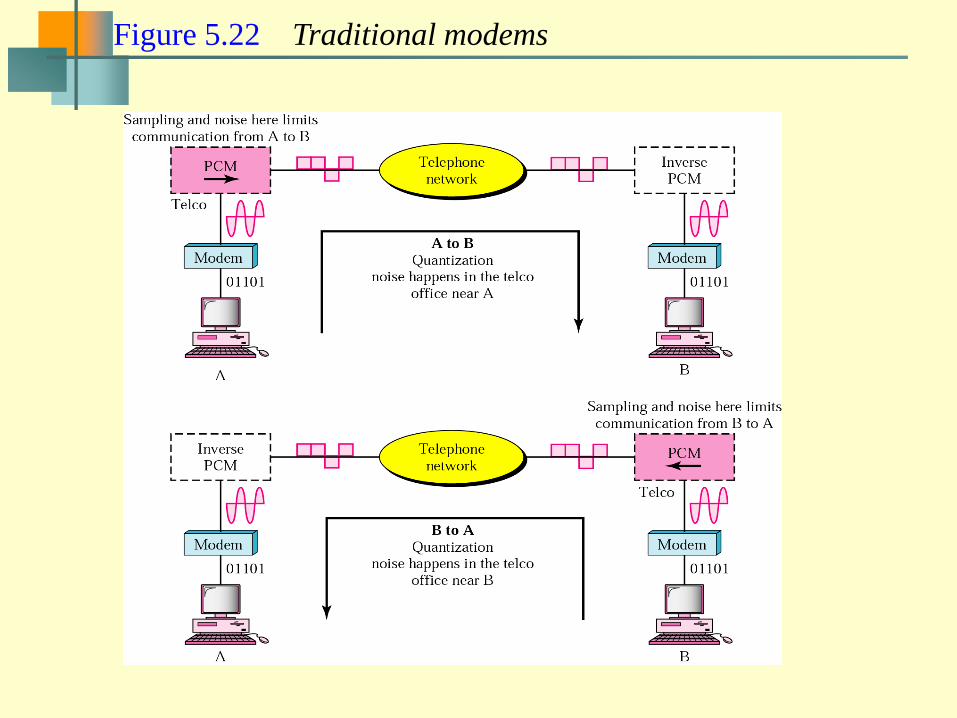
Figure 5.22 Traditional modems

Figure 5.23 56K modems