computer-based instruction on multimedia networking fundamentals: equational versus graphical...
TRANSCRIPT

438 IEEE TRANSACTIONS ON EDUCATION, VOL. 48, NO. 3, AUGUST 2005
Computer-Based Instruction on MultimediaNetworking Fundamentals: Equational
Versus Graphical RepresentationJana Reisslein, Patrick Seeling, Student Member, IEEE, and Martin Reisslein, Senior Member, IEEE
Abstract—Multimedia networking has been emerging in recentyears as a strong driving force behind the expansion of the Internet.However, this topic is not commonly covered in the already con-tent-intensive introductory networking courses. To facilitate stu-dent self-study of this novel topic the authors have developed acomputer-based instructional module on the fundamentals of mul-timedia networking. In this paper, they describe the design and de-velopment of the module, which is aligned with Gagne’s theory ofinstruction. They have developed two versions of the module—onewith equation-based representation of the learning content and onewith graph-based representation of the learning content. They haveevaluated the two versions of the module with a total of 75 un-dergraduate, senior-level electrical engineering students, of whichhalf were randomly assigned to the equational representation, andthe other half to the graphical representation. They found that thegraphical representation results in statistically significantly higherstudent performance on practice and post-test problems, shorterlearning time, and more positive attitudes toward the computer-based instructional module.
Index Terms—Computer-based instruction, equational repre-sentation, graphical representation, multimedia networking.
I. INTRODUCTION
MULTIMEDIA networking is one of the main drivingforces behind the expansion of the Internet. Video
and audio streaming over the Internet are enjoying greaterpopularity and are accounting for an increasing portion of thetotal Internet traffic. With the rising importance of multimedianetworking, educating electrical and computer engineering stu-dents at both the undergraduate and the graduate level about thefundamentals of multimedia networking becomes increasinglyimportant. The introductory networking courses commonlyoffered by Electrical and Computer Engineering Departmentsat the senior and first-year graduate levels are typically devotedto introducing the students to the fundamental principles of theprotocols and mechanisms in the five-layer networking protocolstack. The wealth of material to cover on the five-layer protocolstack leaves typically little or no time to teach novel topics,such as multimedia networking in the introductory networkingclasses. An attractive alternative to cover topics, such as mul-timedia networking, that do not fit into the class schedule is
Manuscript received August 4, 2004; revised February 1, 2005.J. Reisslein is with the Division of Psychology in Education, Arizona State
University, Tempe AZ 85287-0611 USA (e-mail: [email protected]).P. Seeling and M. Reisslein are with the Department of Electrical Engi-
neering, Arizona State University, Goldwater Center, MC 5706, Tempe AZ85287-5706 USA (e-mail: [email protected]; [email protected]).
Digital Object Identifier 10.1109/TE.2005.849744
computer-based instruction. A self-contained, computer-basedinstructional module provides the students with flexibility interms of the time, place, and pace of their learning process.The module can present the novel material in an interactivemanner and provide the students with immediate feedback andinstructional prompts. Such a computer-based instructionalmodule can be assigned to the students as part of a homeworkor a class project. Also, the module could be presented in asenior design project class to complement the instruction onproject design and management and to aid the students in theprojects related to multimedia networking.
The pedagogical research on instruction, including computer-based instruction, has investigated the effectiveness of differentcontent representations, mainly textual or graphical represen-tations or combinations thereof, of the learning content, as de-tailed in Section II. The combination of multiple representationsfor learning is often referred to as multimedia learning [1]. Inthe context of engineering education, the learning content mayoften be represented in the form of mathematical equations or inthe form of graphs. As detailed in Section II, the effectiveness ofequational or graphical representation of engineering learningcontent has received relatively little attention.
In this paper, two main contributions are made:
• two versions are developed—one with equational repre-sentation, and one with graphical representation—of acomputer-based instructional module that teaches the fun-damentals of multimedia networking;
• the equational and graphical representation of the engi-neering learning content is investigated in terms of theperformance on practice problems, learning time, post-test achievement, and learner attitudes for undergraduate,senior-level, electrical engineering students.
The instructional module introduces the students to the structureof a video-streaming system and teaches two specific objectiveson how to determine the maximum video traffic backlog in thestreaming server and the maximum video traffic delay from thevideo traffic characterization and the streaming rate. FollowingGagne’s theory of instruction [2], this module design includesa presentation of the learning objectives, the learning content,and practice activities with feedback and review of the learningcontent. All these components are instructionally aligned withthe objectives and employ representation by mathematical equa-tions in the equational version of the module and representationby graphs in the graphical version of the module.
0018-9359/$20.00 © 2005 IEEE
REISSLEIN et al.: COMPUTER-BASED INSTRUCTION ON MULTIMEDIA NETWORKING FUNDAMENTALS 439
This investigation of the equational and graphical represen-tation was conducted with a total of 75 undergraduate senior-level, electrical engineering students who completed the moduleas part of the EEE 489 Engineering Senior Design II class atArizona State University. Half of the students were randomly as-signed to the equational version of the module, and the other halfto the graphical version. The performance of the students on thepractice problems that are part of the computer-based instruc-tional module, the time spent in the computer-based learningenvironment, the performance on a post-test, and the student at-titudes toward the effectiveness of the module were collectedand analyzed. With the graphical representation the learningtime was statistically significantly shorter. The performance onpractice and post-test problems were statistically significantlyhigher, and the attitudes were more positive as compared to theequational representation.
This paper is structured as follows. In Section II, the au-thors briefly review related work. In Section III, they describethe design of the computer-based instructional module. InSection IV, they describe the methodology for evaluatingthe two versions—with equational representation and withgraphical representation—of the module. In Section V, theypresent and discuss the results from the evaluation of the twoforms of representation. In Section VI, they summarize theirconclusions.
II. RELATED WORK
In this section overviews of the existing literature are given inthe two broad areas most closely related to the study; namely, 1)the area of the design and development of multimedia learningmodules for electrical and computer engineering and 2) the areaof content representation for instruction and the related theory ofcognition. The ubiquitous availability of multimedia computingon classroom and home computers has resulted in considerableinterest in including multimedia instruction and learning intothe electrical and computer engineering curricula [3]–[5]. Thesimple usage of computers, however, does not necessarily resultin better education [6]. Rather the computer-based multimediainstruction needs to be carefully designed to employ effectivelythe various media channels, e.g., text, graphics, animations, etc.,offered by the multimedia computing technology. Learner-cen-tered design (LCD) which scaffolds the instructional contentand engages the learner in active problem-solving, has been es-tablished as a basis for good design practice for such instruc-tional modules [7]–[13] and is employed in this module design.Instructional modules for a wide variety of electrical and com-puter engineering topics have been developed [14]–[30], and in-struction in the area of communication networks has recently re-ceived increasing interest [31], [32]. This module developmentis complementary to these works in that the authors develop amodule for multimedia networking fundamentals for which noknown computer-based module employing multimedia learningtechniques exists.
The contemporary theory of cognition and learning that isrelevant in the context of the present study of the equationaland graphical representations is based on two key assumptions,namely, the dual channel assumption and the limited working
memory assumption. The dual channel assumption [33], in brief,states that humans have two processing channels, one verbalchannel and one pictorial channel. The verbal channel is as-sumed to process symbolic (abstract) representation of the con-tent, such as spoken or written text, mathematical equations,and logical expressions. These are commonly referred to as de-scriptive representations, or descriptors of the content. Pictures,graphs, sculptures, and real physical models, on the other hand,are depictive representations, also referred to as depictions ofthe content, and are assumed to be processed in the pictorialchannel. The limited working memory assumption [34], [35],in brief, states that each of the two channels can only processa limited amount of information at any one time, i.e., there is alimited working memory for each channel, as quantified in [36],[37]. Building on these foundations from the theory of cogni-tion, a plethora of studies have evaluated the cognitive mecha-nisms and the effectiveness of learning from representations inthe form of words, pictures, and combinations thereof [38]–[47].A relatively wide range of knowledge domains has been cov-ered in these studies, including the functioning of the humanlungs, the process of generating lightning, and the mechanicalfunctioning of brakes and pumps. The electrical engineering do-main has received some attention in these studies; in particular,the insulation resistance test of electrical installations and thewiring (arrangement) of resistors in series and parallel have beenconsidered [45].
On the other hand, representations involving mathematicalequations have received relatively little interest. The studies[48], [49], which considered the content domains of Pascal’sfluid pressure principle and simple interest calculation, haveexamined representations in the form of words, equations, orcombinations thereof and compared the effectiveness of theserepresentations with each other, but not with representationsinvolving pictures/graphs. Note that if the assumptions of theoutlined theory of cognition hold true, then these representa-tions involving equations are processed in the verbal channeland do not utilize the resources of the pictorial channel. Thisstudy complements these existing studies in that the authorsevaluate and compare the representation involving a combi-nation of words and graphs with the representation involvingwords and equations.
The studies [50], [51] have examined how to represent theequations of elementary electrical circuit analysis in diagramsand compared the developed diagram-based representationwith equation-based representation. There are a number offundamental differences between this study and the studies in[50], [51]. First, the studies [50], [51] examined general instruc-tional techniques for regular classroom instruction; whereas,the authors specifically focus on computer-based instruction.Second, the knowledge domain considered in the studies [50],[51] is elementary electrical circuit analysis (e.g., Ohm’s law,resistance of parallel and series circuits, etc.), whereas theauthors consider an advanced knowledge domain, namelymultimedia networking fundamentals. Finally, the studies [50],[51] are primarily focused on developing ways of encoding(representing) the equations relating current, voltage, resis-tance, and power in static electrical circuits (i.e., the quantitiesare not functions of time) by graphical means. In contrast, the

440 IEEE TRANSACTIONS ON EDUCATION, VOL. 48, NO. 3, AUGUST 2005
quantities considered in this multimedia networking moduleare functions of time, which can be naturally plotted over theabscissa as time axis and do not require specialized encodingtechniques.
III. DESIGN OF COMPUTER-BASED INSTRUCTIONAL MODULE
In this section, the design of the computer-based instructionalmodule is described. The authors first specify the learning objec-tives and then present the instructional flow and the individualcomponents in the instructional flow of the module.
A. Learning Objectives
The goal was to develop a computer-based instructionalmodule that introduces electrical and computer engineeringstudents without any specific prior knowledge in communi-cation networks to the fundamental principles of multimedianetworking. The goal was also to design the module so that ittakes less than 40 minutes to complete, and could be integratedinto a regular 50-min class session. To achieve these goals, theauthors decided to develop a module that first introduces thestudents to the structure of a typical video streaming system andthen teaches the two main objectives to determine 1) the max-imum backlog of video traffic in the streaming server and 2) themaximum delay of video traffic in the streaming server. Morespecifically, the introduction to the video-streaming systempresents to the students a model of a video-streaming systemconsisting of a camera, a streaming server, and the Internetconnection to the video client, where the camera generatesvideo frames of variable size (in bits) at a fixed frame rate. Inthe considered model the camera is directly connected to thestreaming server, which immediately receives the generatedvideo frames and streams them over the Internet connection,which is modeled by a fixed bandwidth pipe, to the videoclient. In the context of this streaming-system model, two mainlearning objectives are formulated.
• Objective 1: Given the video frame sizes generated bya video camera and the streaming rate, the learner de-termines the maximum backlog of video traffic in thestreaming server.
• Objective 2: Given the maximum backlog of video trafficand the streaming rate, the learner determines the max-imum delay of video traffic in the streaming server.
The motivation for the considered streaming-system model andthe selected learning objectives is that they provide the novicelearner with an introduction to the key mechanisms in mul-timedia networking in accordance with the relevant literature[52]–[57]. Also, from the key mechanisms taught in the module,the students can continue to explore the rich literature in multi-media networking with a solid understanding of the underlyingkey mechanisms.
In the computer-based module, Objective 1 is broken downinto the following substeps. In each substep, the authors de-tail how the learners interact with the computer-based learningmodule in the equational (E) version and in the graphical (G)version. Because of the limitations of the available human–com-puter interface technology, another given—namely, a functional
template in the equation-based version, and coordinate systemsand graph segments in the graph-based version—is incorporatedinto the objectives.
1) In order to determine the maximum backlog of videotraffic in the streaming server, the learner first expressesthe amount of video traffic generated by the video cameraas a function of time. In the equation-based version(E), this expression is constructed by filling in the func-tional parameters in the given functional template. In thegraph-based version (G), the learner selects the appro-priate graph segments.
2) In the second step, the learner expresses the backlogof video traffic as a function of time in the streamingserver by subtracting the amount of served traffic fromthe amount of generated traffic for any given time. Inthe equation-based version (E), this expression is con-structed by filling in the functional parameters in thegiven functional template. In the graph-based version(G), the learner fills in the vertical distance between thecompleted graph showing the amount of generated videotraffic and the graph segment showing the amount ofserved video traffic.
3) In the third step, the learner determines the maximumbacklog as the maximum over time of the function rep-resenting the amount of backlogged traffic as a functionof time. In the equation-based version (E), the learnercalculates the maximum backlog of video traffic in thestreaming server from the completed functional template.In the graph-based version (G), the learner reads off themaximum vertical distance between the completed graphshowing the amount of generated video traffic and thegraph segment showing the amount of served video traffic.
B. Instructional Flow
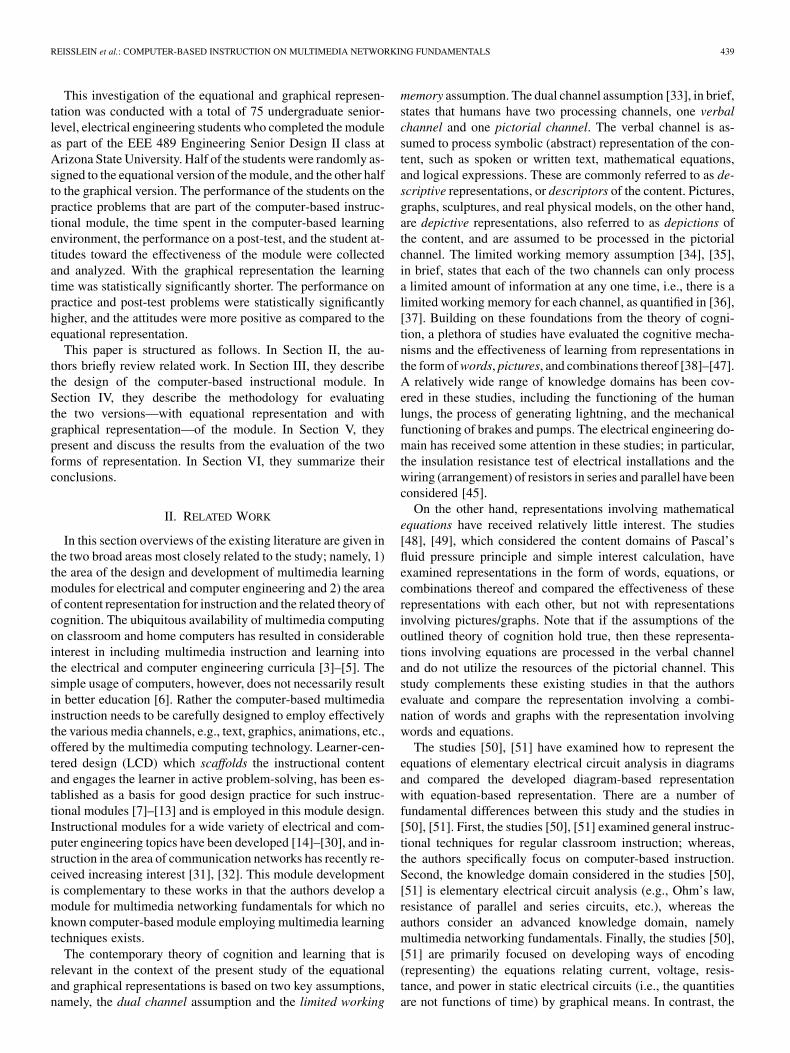
Each version of the computer-based instructional modulecontains screens with subject matter information, examples,and practice activities, including feedback, that are directlyaligned with the main instructional outcomes. The moduleconsists of seven sections: Introduction (five screens), VideoTraffic Backlog (11 screens in equational version, 12 screensin graphical version1), Backlog Practice (six screens), BacklogReview (two screens), Video Traffic Delay (three screens),Delay Practice (two screens), and Review and Conclusion (twoscreens), as illustrated in Fig. 1. This overall instructional flowwas adopted in accordance with Gagne’s theory of instruction[2], [58]. In the following, the authors describe the individualcomponents in the overall instructional flow in more detail.
1) Introduction Screens: On the introductory screens, thelearners are briefed on the importance of the domain area andlearning goals, and on how to navigate through the computermodule and how to interact with the practice activities. The mainmenu screen lists the objectives and the overall purpose of theprogram.
1The larger number of screens in the graphical version is a result of the graphstaking up more space on the screen compared to the equations. The instructionalcontent is the same in both versions.
REISSLEIN et al.: COMPUTER-BASED INSTRUCTION ON MULTIMEDIA NETWORKING FUNDAMENTALS 441
Fig. 1. Illustration of instructional flow.
2) Objectives and Instructional Content: At the beginningof each unit, the learners are given the objectives and the ex-pected learning goals. The objectives are also accessible fromthe navigational menu and are written in nontechnical languageto promote positive attitudes in the learners. The subsequentscreens contain the instructional content.
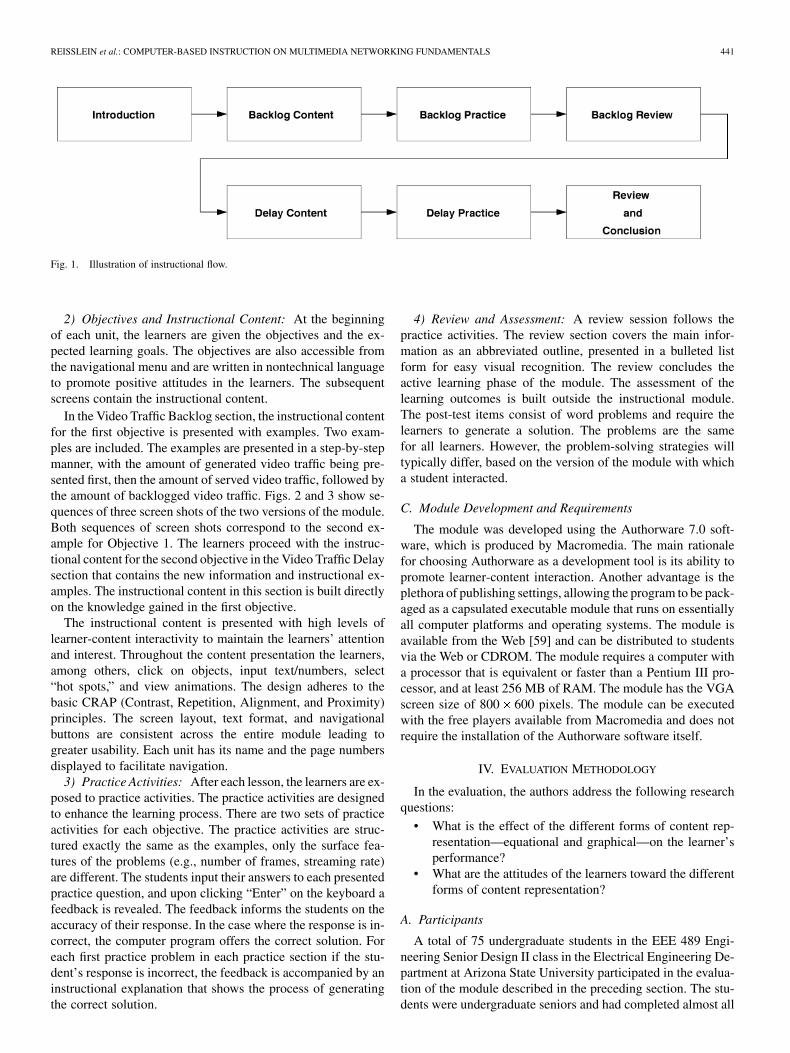
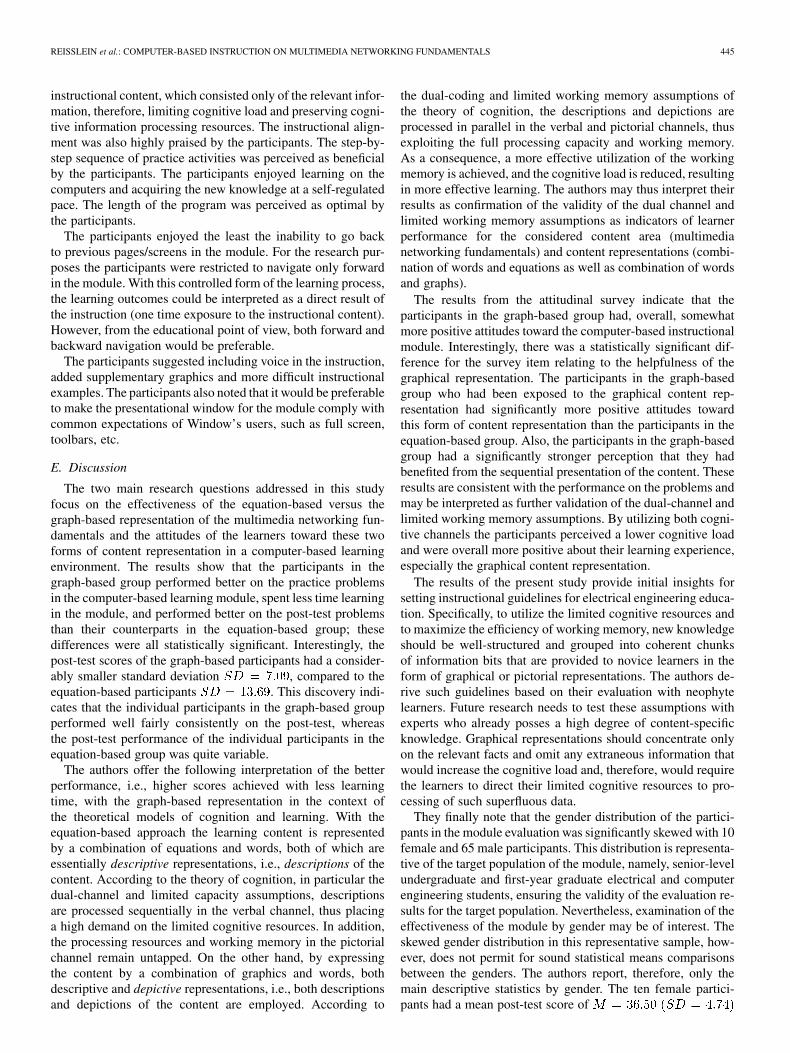
In the Video Traffic Backlog section, the instructional contentfor the first objective is presented with examples. Two exam-ples are included. The examples are presented in a step-by-stepmanner, with the amount of generated video traffic being pre-sented first, then the amount of served video traffic, followed bythe amount of backlogged video traffic. Figs. 2 and 3 show se-quences of three screen shots of the two versions of the module.Both sequences of screen shots correspond to the second ex-ample for Objective 1. The learners proceed with the instruc-tional content for the second objective in the Video Traffic Delaysection that contains the new information and instructional ex-amples. The instructional content in this section is built directlyon the knowledge gained in the first objective.
The instructional content is presented with high levels oflearner-content interactivity to maintain the learners’ attentionand interest. Throughout the content presentation the learners,among others, click on objects, input text/numbers, select“hot spots,” and view animations. The design adheres to thebasic CRAP (Contrast, Repetition, Alignment, and Proximity)principles. The screen layout, text format, and navigationalbuttons are consistent across the entire module leading togreater usability. Each unit has its name and the page numbersdisplayed to facilitate navigation.
3) Practice Activities: After each lesson, the learners are ex-posed to practice activities. The practice activities are designedto enhance the learning process. There are two sets of practiceactivities for each objective. The practice activities are struc-tured exactly the same as the examples, only the surface fea-tures of the problems (e.g., number of frames, streaming rate)are different. The students input their answers to each presentedpractice question, and upon clicking “Enter” on the keyboard afeedback is revealed. The feedback informs the students on theaccuracy of their response. In the case where the response is in-correct, the computer program offers the correct solution. Foreach first practice problem in each practice section if the stu-dent’s response is incorrect, the feedback is accompanied by aninstructional explanation that shows the process of generatingthe correct solution.
4) Review and Assessment: A review session follows thepractice activities. The review section covers the main infor-mation as an abbreviated outline, presented in a bulleted listform for easy visual recognition. The review concludes theactive learning phase of the module. The assessment of thelearning outcomes is built outside the instructional module.The post-test items consist of word problems and require thelearners to generate a solution. The problems are the samefor all learners. However, the problem-solving strategies willtypically differ, based on the version of the module with whicha student interacted.
C. Module Development and Requirements
The module was developed using the Authorware 7.0 soft-ware, which is produced by Macromedia. The main rationalefor choosing Authorware as a development tool is its ability topromote learner-content interaction. Another advantage is theplethora of publishing settings, allowing the program to be pack-aged as a capsulated executable module that runs on essentiallyall computer platforms and operating systems. The module isavailable from the Web [59] and can be distributed to studentsvia the Web or CDROM. The module requires a computer witha processor that is equivalent or faster than a Pentium III pro-cessor, and at least 256 MB of RAM. The module has the VGAscreen size of 800 600 pixels. The module can be executedwith the free players available from Macromedia and does notrequire the installation of the Authorware software itself.
IV. EVALUATION METHODOLOGY
In the evaluation, the authors address the following researchquestions:
• What is the effect of the different forms of content rep-resentation—equational and graphical—on the learner’sperformance?
• What are the attitudes of the learners toward the differentforms of content representation?
A. Participants
A total of 75 undergraduate students in the EEE 489 Engi-neering Senior Design II class in the Electrical Engineering De-partment at Arizona State University participated in the evalua-tion of the module described in the preceding section. The stu-dents were undergraduate seniors and had completed almost all

442 IEEE TRANSACTIONS ON EDUCATION, VOL. 48, NO. 3, AUGUST 2005
Fig. 2. Equation-based version of second example for Objective 1.
required B.S. degree courses. The average age of the studentswas 25.24 years, and the age ranged from 19 to 45 years. Therewere 65 male and 10 female participants. The average GPA ofthe participants was 3.06 (standard deviation of GPA was 0.45).All students had the required entry-level behavior and knowl-edge that enabled them to learn from the computer-based pro-gram. None of the participants had any specific prior knowl-
Fig. 3. Graph-based version of second example for Objective 1.
edge about multimedia networking fundamentals. The partici-pants were randomly assigned into the two experimental groups.There was no statistically significant difference in the averageGPA between the two groups. There were 37 participants inthe equation-based version of the computer-based instructionalmodule and 38 participants in the graphical-based version. Eachstudent was identified by a unique experimental ID number inthe evaluation study.

REISSLEIN et al.: COMPUTER-BASED INSTRUCTION ON MULTIMEDIA NETWORKING FUNDAMENTALS 443
TABLE IPRACTICE PERFORMANCE, LEARNING TIME, AND POST-TEST ACHIEVEMENT
B. Data Sources and Collection
Research data for the evaluation of the two versions of theinstructional module were collected using 1) a paper-based de-mographic questionnaire, 2) the computer-based instructionalmodule, 3) a paper-based post-test, and 4) a paper-based attitu-dinal survey.
1) Demographic Questionnaire: The questionnaire col-lected demographic data and information on prerequisiteknowledge and entry-level behavior with eight simple ques-tions. Specifically, students were asked to report their gender,ethnicity, age, GPA, and number of math courses while incollege. The questionnaire also asked the participants whetherthey had learned about multimedia networking fundamentalsearlier.
2) Computer-Based Learning Environment: The modulewas programmed to track the performance of each individualstudent on practice activities (a total of 24 practice tasks), andthe total instructional time spent in the computer-based learningenvironment. The learners were permitted to navigate throughthe module in only one direction—namely forward (linearnavigational pattern). With this linear navigational pattern thelearning outcomes can be interpreted as a direct outcome ofthe instruction, i.e., the one-time exposure to the instructionalcontent.
3) Post-Test: The post-test assessed student learning thatwas a direct result of interacting with the computer-basedinstructional module. The post-test contained three complexproblems that required the students to perform the tasks thatthey had learned in the module, specifically determining themaximum backlog and delay of video traffic that is beinggenerated by a video camera and, consequently, streamed bya video server and transported over the Internet. Participantscould gain a maximum of 12 points (each) on problems number1 and 2, and a maximum of 14 points on problem number3, leading to a maximum score of 38 points to be achievedon the post-test. The post-test was an integrative test activitywhere the participants demonstrated their level of attainmentof the two main instructional objectives. The format of the testitems/problems was aligned with the conditions specified in theoverall learning goals. The post-test was administered directlyafter completion of the computer-based module.
The purpose of the post-test being paper-based rather thancomputer-based (which would be more instructionally alignedwith the computer-based instruction) is the complexity of tasksthat students have to perform. In the computer-based instruc-tional module, the learning was scaffolded by the inclusion ofseveral givens (e.g., functional templates and graph coordinatesystems). This scaffolding was beneficial in the initial phases of
knowledge acquisition; however, to assess student learning ac-curately the instructors needed to see the students demonstratetheir abilities to perform the complex tasks—as stated in the ob-jectives—without instructional help and scaffolds.
4) Attitudinal Survey: The survey contained 15 five-pointLikert-scale (rating from strongly agree, which was scoredas 5, to strongly disagree, which was scored as 1) ratingitems. The items asked about the overall effectiveness of thecomputer-based instructional module. The students rated theiragreement with the positive statements on the survey. Thesurvey was to gather information that could be used to assessthe students’ attitudes toward the computer-based instructionalmodule, its instructional components, the navigation, andcontent presentation. The survey also asked three open-endedquestions concerning the most positive/negative aspects ofthe computer-based instructional module and suggestions forimprovement of the module.
C. Procedure
The experimental study was carried out in two sessions thatwere one week apart. During the first session the participantsfilled out the demographic questionnaire. This initial sessionlasted approximately 10 min. The purpose of this initial sessionwas to determine whether the students met the eligibility crite-rion of having no prior knowledge about multimedia networkingfundamentals. One week later the experiment took place. Thestudents worked individually on PCs in a school computer lab.After completing the computer-based module, the students weregiven the paper-based post-test, and then answered the attitu-dinal survey. This second session lasted approximately 40 min.
V. RESULTS AND DISCUSSION
In this section, the results for the evaluation of the two ver-sions of the computer-based instructional module are reportedand discussed. The main results for the performance on the prac-tice problems, the learning time, and the post-test achievementare summarized in Table I. Throughout the report, the meanand standard deviation of the performance measures aregiven. For the statistically significant differences between thegraph-based group and the equation-based group, the authors re-port the F-ratio with its degrees of freedom, the mean squareerror , the statistical significance level , and Cohen’sof the effect size.
A. Practice Performance
The overall average number of correct answers to practiceactivities was out of the maximumscore of 24, which represents a successful practice-solving

444 IEEE TRANSACTIONS ON EDUCATION, VOL. 48, NO. 3, AUGUST 2005
TABLE IIMEAN SCORES ON ATTITUDINAL SURVEY
rate of 75.71% for all participants combined. The partici-pants in the equational version on average successfully solved
practice items, corresponding toa rate of 71.17%. The participants in the graphical versionon average successfully solvedpractice items, which corresponds to an average success rateon practice activities of 80.17%. The difference between theaccuracy of practice problem solving of the participants in theequational and graphical versions was statistically significant,
, , . Cohen’s statisticfor these data yields an effect size of 0.25, which correspondsto a medium effect.
B. Learning Time
On the average the students spentin the computer-based learning environment. In
the equation-based version the students spent on the averageinteracting with the com-
puter-based program. In the graph-based version, the studentson the average spent on thecomputers. This time difference was statistically significant,
, , . Cohen’s statisticfor these data yields an effect size of 0.19, which approachesa medium effect.
C. Post-Test Achievement
Overall, the participants learned much from the computer-based learning environment. The average total post-test scorefor all participants combined wasout of a maximum of 38 points, translating into a percentagescore of 83.44% mastery level. The participants in the equa-tional version on the average scored
on the post-test, an equivalent of 74.54% mastery level.In comparison, the participants in the graph-based version onthe average scored on thepost-test, which translates into a mastery level of 92.11%. Thedifference on post-test achievement between the two experi-mental groups was statistically significant, ,
, . Cohen’s statistic for these datayields an effect size of 0.31, which corresponds to a medium tolarge effect.
For all participants combined, the average score for correctlysolving post-test problems was on problem number1, on problem number 2, and onproblem 3. These results indicate that on average the partici-pants progressively improved their problem-solving abilities asthey worked through the post-test problems.
D. Participant Attitudes
The participants’ responses to the attitudinal survey aresummarized in Table II. The Cronbach alpha across all surveyitems is indicating a high reliability of the survey.Generally, the participants considered the computer-basedinstructional module as good and effective. The total overallaverage attitudinal score was , showing that theparticipants agreed with the positive statements on the attitu-dinal survey. The highest rating was in the equationgroup, which was for the statement “Navigating and using thiscomputer-based instructional module was easy.” This statementreceived the second highest rating in the graph-basedgroup. The highest rated statement in the graph-based groupwith was “Graphical-based approach to teaching theconcepts was/would be helpful.” The lowest rated statementin both groups was “I learned a lot from this computer-basedinstructional module,” which received an average score of
in the equational group, and in thegraphical group. (Recall that a score of 3 corresponds to“neither agree nor disagree” and 4 corresponds to “agree”;thus these lowest scores still indicate positive attitudes.) Theparticipants in the graph-based group agreed significantly morestrongly with the statements “I benefited from the sequentialpresentation of the content,” , ,
, and “Graphical-based approach to teaching the con-cepts was/would be helpful,” , ,
.In the following, the received open-ended comments are sum-
marized. The participants liked the efficient presentation of the
REISSLEIN et al.: COMPUTER-BASED INSTRUCTION ON MULTIMEDIA NETWORKING FUNDAMENTALS 445
instructional content, which consisted only of the relevant infor-mation, therefore, limiting cognitive load and preserving cogni-tive information processing resources. The instructional align-ment was also highly praised by the participants. The step-by-step sequence of practice activities was perceived as beneficialby the participants. The participants enjoyed learning on thecomputers and acquiring the new knowledge at a self-regulatedpace. The length of the program was perceived as optimal bythe participants.
The participants enjoyed the least the inability to go backto previous pages/screens in the module. For the research pur-poses the participants were restricted to navigate only forwardin the module. With this controlled form of the learning process,the learning outcomes could be interpreted as a direct result ofthe instruction (one time exposure to the instructional content).However, from the educational point of view, both forward andbackward navigation would be preferable.
The participants suggested including voice in the instruction,added supplementary graphics and more difficult instructionalexamples. The participants also noted that it would be preferableto make the presentational window for the module comply withcommon expectations of Window’s users, such as full screen,toolbars, etc.
E. Discussion
The two main research questions addressed in this studyfocus on the effectiveness of the equation-based versus thegraph-based representation of the multimedia networking fun-damentals and the attitudes of the learners toward these twoforms of content representation in a computer-based learningenvironment. The results show that the participants in thegraph-based group performed better on the practice problemsin the computer-based learning module, spent less time learningin the module, and performed better on the post-test problemsthan their counterparts in the equation-based group; thesedifferences were all statistically significant. Interestingly, thepost-test scores of the graph-based participants had a consider-ably smaller standard deviation , compared to theequation-based participants . This discovery indi-cates that the individual participants in the graph-based groupperformed well fairly consistently on the post-test, whereasthe post-test performance of the individual participants in theequation-based group was quite variable.
The authors offer the following interpretation of the betterperformance, i.e., higher scores achieved with less learningtime, with the graph-based representation in the context ofthe theoretical models of cognition and learning. With theequation-based approach the learning content is representedby a combination of equations and words, both of which areessentially descriptive representations, i.e., descriptions of thecontent. According to the theory of cognition, in particular thedual-channel and limited capacity assumptions, descriptionsare processed sequentially in the verbal channel, thus placinga high demand on the limited cognitive resources. In addition,the processing resources and working memory in the pictorialchannel remain untapped. On the other hand, by expressingthe content by a combination of graphics and words, bothdescriptive and depictive representations, i.e., both descriptionsand depictions of the content are employed. According to
the dual-coding and limited working memory assumptions ofthe theory of cognition, the descriptions and depictions areprocessed in parallel in the verbal and pictorial channels, thusexploiting the full processing capacity and working memory.As a consequence, a more effective utilization of the workingmemory is achieved, and the cognitive load is reduced, resultingin more effective learning. The authors may thus interpret theirresults as confirmation of the validity of the dual channel andlimited working memory assumptions as indicators of learnerperformance for the considered content area (multimedianetworking fundamentals) and content representations (combi-nation of words and equations as well as combination of wordsand graphs).
The results from the attitudinal survey indicate that theparticipants in the graph-based group had, overall, somewhatmore positive attitudes toward the computer-based instructionalmodule. Interestingly, there was a statistically significant dif-ference for the survey item relating to the helpfulness of thegraphical representation. The participants in the graph-basedgroup who had been exposed to the graphical content rep-resentation had significantly more positive attitudes towardthis form of content representation than the participants in theequation-based group. Also, the participants in the graph-basedgroup had a significantly stronger perception that they hadbenefited from the sequential presentation of the content. Theseresults are consistent with the performance on the problems andmay be interpreted as further validation of the dual-channel andlimited working memory assumptions. By utilizing both cogni-tive channels the participants perceived a lower cognitive loadand were overall more positive about their learning experience,especially the graphical content representation.
The results of the present study provide initial insights forsetting instructional guidelines for electrical engineering educa-tion. Specifically, to utilize the limited cognitive resources andto maximize the efficiency of working memory, new knowledgeshould be well-structured and grouped into coherent chunksof information bits that are provided to novice learners in theform of graphical or pictorial representations. The authors de-rive such guidelines based on their evaluation with neophytelearners. Future research needs to test these assumptions withexperts who already posses a high degree of content-specificknowledge. Graphical representations should concentrate onlyon the relevant facts and omit any extraneous information thatwould increase the cognitive load and, therefore, would requirethe learners to direct their limited cognitive resources to pro-cessing of such superfluous data.
They finally note that the gender distribution of the partici-pants in the module evaluation was significantly skewed with 10female and 65 male participants. This distribution is representa-tive of the target population of the module, namely, senior-levelundergraduate and first-year graduate electrical and computerengineering students, ensuring the validity of the evaluation re-sults for the target population. Nevertheless, examination of theeffectiveness of the module by gender may be of interest. Theskewed gender distribution in this representative sample, how-ever, does not permit for sound statistical means comparisonsbetween the genders. The authors report, therefore, only themain descriptive statistics by gender. The ten female partici-pants had a mean post-test score of

446 IEEE TRANSACTIONS ON EDUCATION, VOL. 48, NO. 3, AUGUST 2005
and a total mean attitudinal score of ,whereas the corresponding mean scores for the 65 male par-ticipants were and
. While these mean scores may appear to indi-cate that females achieved higher test scores and had more pos-itive attitudes, such conclusions can not be supported by statis-tical tests and would need to be thoroughly examined in a futurestudy specifically designed to compare genders.
VI. CONCLUSION
The authors have described the design and developmentof two versions—an equation-based and a graph-based ver-sion—of a computer-based instructional module on fundamen-tals of multimedia networking. The instructional flow in themodule follows Gagne’s theory of instruction. The moduleintroduces students to the structure of a typical video-streamingsystem and teaches them how to determine the maximumbacklog and the maximum delay of video traffic.
They have evaluated the effectiveness of the two versions ofthe module with 75 electrical engineering seniors. They foundthat with the graph-based version of the module the learningtime of the students was significantly shorter, and the studentsachieved statistically significantly higher scores on practice andpost-test problems compared to the equation-based version. Fur-thermore, the attitudes were more positive among the studentsin the graph-based version of the module.
Their evaluation results for the equation-based and graph-based versions of the module complement the existing eval-uations of multimedia learning which have largely focused1) on comparing content representations in words, graphics,and combinations of words and graphics with each otherand 2) on comparing representations in words, equation, andcombinations of words and equations with each other. Incontrast, the authors have compared the representation withan equation-word combination with the representation with agraph-word combination, both of which are highly relevantand convenient representations for electrical and computerengineering content. Their evaluation findings provide initialevidence that the dual-channel and limited working memoryassumptions of the theory of cognition apply to the knowledgedomain considered in this study and its representation by anequation-word combination and a graph-word combination.
There are many exciting avenues for future work on themodule design and development and research on the effective-ness of representations of electrical engineering content. Oneavenue for future module development is to include searchcapabilities, which would allow the learners to enter keywordsand navigate to the pages that include that keyword. Furtherdevelopment could also address the suggestions expressed bythe students in the open-ended comments on the attitudinalsurvey, as summarized at the end of Section V-D. An importantavenue for future research on the representation of electricalengineering content is to examine the effectiveness of repre-sentations that combine words, equations, and graphs so as toprovide foundations for guidelines on effective content repre-sentation for the electrical and computer engineering educationfield.
ACKNOWLEDGMENT
The authors would like to thank Prof. J. Aberle of ArizonaState University for allowing them to present their module tothe EEE489 Senior Design II class in the spring 2004 semester.They are grateful to the late Prof. R. Kulhavy of the Divisionof Psychology in Education at Arizona State University forhelpful pointers and discussions. The authors are also gratefulto Prof. A. Igoe of the Division of Psychology in Educationat Arizona State University for feedback on their instructionalmodule development.
REFERENCES
[1] R. E. Mayer, Multimedia Learning. New York: Cambridge Univ.Press, 2001.
[2] R. M. Gagne, “Learning processes and instruction,” Training Res. J., vol.1, no. 1, pp. 17–28, 1995.
[3] C. A. Carver and M. A. Biehler, “Incorporating multimedia and hyper-text documents in an undergraduate curriculum,” in Proc. ASEE/IEEEFrontiers in Education Conf. (FIE), vol. 2, San Jose, CA, Nov. 1994, pp.87–92.
[4] C. A. Carver, R. A. Howard, and W. D. Lane, “Enhancing studentlearning through hypermedia courseware and incorporation of studentlearning styles,” IEEE Trans. Educ., vol. 42, no. 1, pp. 33–38, Feb.1992.
[5] R. S. Friedman and F. P. Deek, “Innovation and education in the digitalage: Reconciling the roles of pedagogy, technology, and the business oflearning,” IEEE Trans. Eng. Manage., vol. 50, no. 4, pp. 403–412, Nov.2003.
[6] W. N. Holmes, “The myth of the educational computer,” IEEE Com-puter, vol. 32, no. 9, pp. 36–42, Sep. 1999.
[7] M. Guzdial, M. McCracken, and A. Elliott, “LCD: A learner centered ap-proach to developing educational software,” in Proc. ASEE/IEEE Fron-tiers in Education Conf. (FIE), vol. 2, Pittsburgh, PA, Nov. 1997, p. 702.
[8] D. A. Norman and J. C. Spohrer, “Learner-centered education,”Commun. ACM, vol. 39, no. 4, pp. 24–27, Apr. 1996.
[9] C. Quintana, E. Fretz, J. Krajcik, and E. Soloway, “Evaluation criteriafor scaffolding in learner-centered tools,” in Proc. Conf. Human Fac-tors in Computing Systems, The Hague, The Netherlands, Apr. 2000,pp. 189–190.
[10] C. Quintana, J. Krajcik, and E. Soloway, “Issues and methods for eval-uating learner-centered scaffolding,” in Proc. IEEE Int. Conf. AdvancedLearning Technologies, Madison, WI, Aug. 2001, pp. 353–356.
[11] C. Quintana, E. Soloway, and C. Norris, “Learner-centered design: De-veloping software that scaffolds learning,” in Proc. IEEE Int. Conf. Ad-vanced Learning Technologies, Madison, WI, Aug. 2001, pp. 499–500.
[12] E. Soloway, M. Guzdial, and K. E. Hay, “Learner-centered design: Thechallenge for HCl in the 21st century,” Interactions, vol. 1, no. 2, pp.36–48, Apr. 1994.
[13] E. Soloway, S. L. Jackson, J. Klein, C. Quintana, J. Reed, J. Spitulnik, S.J. Stratford, C. Studer, J. Eng, and N. Scala, “Learning theory in practice:Case studies of learner-centered design,” in Proc. Conf. Human Factorsin Computing Systems, Vancouver, Canada, Apr. 1996, pp. 189–196.
[14] B. A. A. Antao, A. J. Brodersen, J. R. Bourne, and J. R. Cantwell,“Building intelligent tutorial systems for teaching simulation in engi-neering education,” IEEE Trans. Educ., vol. 35, no. 1, pp. 50–56, Feb.1992.
[15] A. Asif, “Multimedia and cooperative learning in signal processing tech-niques in communications,” IEEE Signal Process. Lett., vol. 11, no. 2,pp. 278–281, Feb. 2004.
[16] S. Barua, “An interactive multimedia system on ’computer architecture,organization, and design’,” IEEE Trans. Educ., vol. 44, no. 1, pp. 41–46,Feb. 2001.
[17] A. Berglund, “What is good teaching of computer networks?,” in Proc.ASEE/IEEE Frontiers in Education (FIE), Boulder, CO, Nov. 2003, pp.S2D-13–S2D-19.
[18] G. Bengu and W. Swart, “A computer-aided, total quality approach tomanufacturing education in engineering,” IEEE Trans. Educ., vol. 39,no. 3, pp. 415–422, Aug. 2003.
[19] F. Buret, D. Muller, and L. Nicholas, “Computer-aided education formagnetostatics,” IEEE Trans. Educ., vol. 42, no. 1, pp. 45–49, Feb. 1999.

REISSLEIN et al.: COMPUTER-BASED INSTRUCTION ON MULTIMEDIA NETWORKING FUNDAMENTALS 447
[20] D. Carlson, M. Guzdial, C. Kehoe, V. Shah, and J. Stasko, “WWW in-teractive learning environments for computer science education,” ACMSIGCSE Bull., vol. 28, no. 1, pp. 290–294, Mar. 1996.
[21] V. Dadarlat, T. Coffey, and C. Ivan, “A personalized approach forteaching web-based curriculum in communications & computernetworks,” in Proc. IEEE Canadian Conf. Electrical Computer Engi-neering (CCECE), Winnipeg, Canada, May 2002, pp. 732–737.
[22] R. S. Friedman and F. P. Deek, “The integration of problem-basedlearning and problem-solving tools to support distributed educationenvironments,” in Proc. ASEE/IEEE Frontiers in Education Conf.(FIE), vol. 2, Boston, MA, Nov. 2002, pp. F3E-17–F3E-22.
[23] G. Hassapis, “An interactive electronic book approach for teaching com-puter implementation of industrial control systems,” IEEE Trans. Educ.,vol. 46, no. 1, pp. 177–184, Feb. 2003.
[24] G. Martinovic, L. Budin, and Z. Hocenski, “Undergraduate teachingof real-time scheduling algorithms by developed software tool,” IEEETrans. Educ., vol. 46, no. 1, pp. 185–196, Feb. 2003.
[25] A. de Assis Mota, L. T. M. Mota, and A. Morelato, “Teaching powerengineering basics using advanced web technologies and problem-basedlearning environment,” IEEE Trans. Educ., vol. 19, no. 1, pp. 96–103,Feb. 2004.
[26] J. C. Principe, N. R. Euliano, and W. C. Lefebvre, “Innovating adaptiveand neural systems instruction with interactive electronic books,” Proc.IEEE, vol. 88, no. 1, pp. 81–95, Jan. 2000.
[27] A. A. Renshaw, H. R. Reibel, C. A. Zukowski, K. Penn, R. O. McClin-tock, and M. B. Friedman, “An assessment of on-line engineering designproblem presentation strategies,” IEEE Trans. Educ., vol. 43, no. 2, pp.83–91, May 2000.
[28] A. L. Sears and S. E. Watkins, “A multimedia manual on the world wideweb for telecommunications equipment,” IEEE Trans. Educ., vol. 39,no. 3, pp. 342–348, Aug. 1996.
[29] J. B. Schodorf, M. A. Yoder, J. H. McClellan, and R. W. Schafer, “Usingmultimedia to teach the theory of digital multimedia signals,” IEEETrans. Educ., vol. 39, no. 3, pp. 336–341, Aug. 1996.
[30] C. Vrasidas, “Issues of pedagogy and design in e-learning systems,”in Proc. 2004 ACM Symp. Applied Computing, Nicosia, Cyprus, Mar.2004, pp. 911–915.
[31] J. Kurose, J. Liebeherr, S. Ostermann, and T. Ott-Boisseau, “Final Re-port on 2002 ACM SIGCOMM Workshop on Computer Networking:Curriculum Designs and Educational Challenges,”, Pittsburgh, PA,2002.
[32] J. Liebeherr and M. ElZarki, Mastering Networks: An Internet LabManual. Reading, MA: Addison-Wesley, 2003.
[33] A. Paivio, Mental Representations: A Dual Coding Approach. NewYork: Oxford Univ. Press, 1986.
[34] J. R. Anderson, The Architecture of Cognition. Cambridge, MA: Har-vard Press, 1983.
[35] A. D. Baddeley, Working Memory. New York: Oxford UniversityPress, 1986.
[36] G. Miller, “The magic number seven, plus or minus two: Some limits toour capacity for processing information,” Psycholog. Rev., vol. 63, pp.81–97, 1956.
[37] H. Simon, “How big is a chunk?,” Science, vol. 12, pp. 257–285, 1974.[38] C. R. Beck, “Visual cueing strategies: pictorial, textual and combina-
tional effects,” Educ. Commun. Technol., vol. 32, no. 4, pp. 207–216,Winter 1984.
[39] R. Carlson, P. Chandler, and J. Sweller, “Learning and understandingscience instruction material,” J. Educ. Technol., vol. 95, no. 3, pp.629–640, 2003.
[40] R. Chandler and J. Sweller, “Cognitive load theory and the format ofinstruction,” Cogn. Instruct., vol. 8, no. 4, pp. 293–332, 1991.
[41] R. E. Mayer and R. Moreno, “Aids to computer-based multimedialearning,” Learn. Instruct., vol. 12, no. 1, pp. 107–119, 2002.
[42] R. E. Mayer, “Cognitive theory and the design of multimedia instruction:An example of the two-way street between cognition and instruction,”New Direct. Teach. Learn., vol. 89, pp. 55–71, 2002.
[43] W. Schnotz and M. Bannert, “Construction and interference in learningfrom multiple representations,” Learn. Instruct., vol. 13, pp. 141–156,2003.
[44] J. Sweller, “Cognitive technology: Some procedures for facilitatinglearning and problem solving in mathematics and science,” J. Educ.Psychol., vol. 81, pp. 457–466, 1989.
[45] , Instructional Design in Technical Areas. Camberwell, Australia:Australian Council for Educations Research (ACER) Ltd, 1999.
[46] H. K. Tabbers, R. L. Martens, and J. J. G. van Merriënboer, “Multimediainstructions and cognitive load theory: Effects of modality and cueing,”Brit. J. Educ. Psychol., vol. 74, pp. 71–81, 2004.
[47] I. Vekiri, “What is the value of graphical displays in learning?,” Educ.Psychol. Rev., vol. 14, no. 3, pp. 261–312, Sep. 2002.
[48] D. Dee-Lucas and J. H. Larkin, “Equations in scientific proofs: effectson comprehension,” Amer. Educ. Res. J., vol. 28, pp. 661–682, 1991.
[49] M. Leung, R. Low, and J. Sweller, “Learning from equations or words,”Instruct. Sci., vol. 25, pp. 37–70, 1997.
[50] P. Cheng, “AVOW diagrams: A novel representational system forunderstanding electricity,” in Diagrammatic Representation and Rea-soning, M. Anderson, B. Meyer, and P. Olivier, Eds. Berlin, Germany:Springer, 2001, pp. 512–534.
[51] P. C.-H. Cheng, “Electrifying diagrams for learning: Principles for com-plex representational systems,” Cogn. Sci., vol. 26, no. 6, pp. 685–736,Nov.–Dec. 2002.
[52] M. Krunz, “Bandwidth allocation strategies for transporting variable-bit-rate video traffic,” IEEE Commun. Mag., vol. 37, no. 1, pp. 40–46,Jan. 1999.
[53] M. Reisslein and K. W. Ross, “High-performance prefetching protocolsfor VBR prerecorded video,” IEEE Network, vol. 12, no. 6, pp. 46–55,Nov/Dec. 1998.
[54] J. Salehi, Z. Zhang, J. Kurose, and D. Towsley, “Supporting stored video:Reducing rate variability and end-to-end resource requirements throughoptimal smoothing,” IEEE/ACM Trans. Networking, vol. 6, no. 4, pp.397–410, Aug. 1998.
[55] P. Seeling, M. Reisslein, and B. Kulapala, “Network performanceevaluation using frame size and quality traces of single-layer andtwo-layer video: A tutorial,” IEEE Commun. Surv. Tutor., vol. 6, no. 3,Third Quarter 2004.
[56] D. Wrege, E. Knightly, H. Zhang, and J. Liebeherr, “Deterministic delaybounds for VBR video in packet-switching networks: Fundamentallimits and tradeoffs,” IEEE/ACM Trans. Networking, vol. 4, no. 3, pp.352–362, Jun. 1996.
[57] D. Wu, Y. Hou, W. Zhu, Y.-Q. Zhang, and J. Peha, “Streaming videoover the Internet: Approaches and directions,” IEEE Trans. Circuits Syst.Video Technol., vol. 11, no. 3, pp. 282–300, Mar. 2001.
[58] R. M. Gagne, The Conditions of Learning. New York: Holt, Rinehartand Winston, 1985.
[59] J. Reisslein, P. Seeling, and M. Reisslein. (2004) Computer-Based In-structional Modules on Multimedia Networking Fundamentals. [Online]http://www.fulton.asu.edu/~mre/mm.html
Jana Reisslein received the Master’s degree in psychology from Palacky Uni-versity, Olomouc, Czech Republic, in 2000 and is currently pursuing the Ph.D.degree in the Educational Technology Program, Division of Psychology in Ed-ucation, Arizona State University, Tempe.
Her research interests are in the area of engineering education and multimedialearning.
Patrick Seeling (S’03) received the Dipl.-Ing. degree in industrial engineeringand management (specializing in electrical engineering) from the TechnicalUniversity of Berlin (TUB), Germany, in 2002. Since 2003, he has beenpursuing the Ph.D. degree in the Department of Electrical Engineering atArizona State University, Tempe.
His research interests are in the area of video communications in wired andwireless networks and distance education.
Mr. Seeling is a Student Member of the ACM.
Martin Reisslein (A’96–S’97–M’98–SM’03) received the Dipl.-Ing. (FH) de-gree from the Fachhochschule Dieburg, Germany, in 1994 and the M.S.E. de-gree from the University of Pennsylvania, Philadelphia, in 1996, both in elec-trical engineering. He received the Ph.D. degree in systems engineering fromthe University of Pennsylvania, University Park, in 1998.
Currently, he is an Assistant Professor in the Department of ElectricalEngineering at Arizona State University, Tempe. During the academic year1994–1995, he visited the University of Pennsylvania as a Fulbright Scholar.From July 1998 through October 2000, he was a Scientist with the GermanNational Research Center for Information Technology (GMD FOKUS), Berlinand Lecturer at the Technical University Berlin. He is Editor-in-Chief of theIEEE Communications Surveys and Tutorials. He maintains an extensivelibrary of video traces for network performance evaluation, including framesize traces of MPEG-4 and H.263 encoded video, at http://trace.eas.asu.edu
Dr. Reisslein is a Member of the ASEE.