computational study on the solubility of lithium salts...
TRANSCRIPT

Computational Study on the Solubility of Lithium Salts Formed on Lithium Ion BatteryNegative Electrode in Organic Solvents
Ken Tasaki*,† and Stephen J. Harris‡
Mitsubishi Chemical USA, 410 Palos Verdes BouleVard, Redondo Beach, California 90277, and GeneralMotors Corporation Research & DeVelopment Center, Mail Code 480-102-000, 30500 Mound Road,Warren, Michigan 48090
ReceiVed: January 2, 2010; ReVised Manuscript ReceiVed: March 22, 2010
The solubility of lithium salts, found in solid-electrolyte interface (SEI) films on the anode surface in lithiumion battery cells, has been examined in organic solvents through atomistic computer simulations. The saltsincluded lithium oxide (Li2O), lithium carbonate (Li2CO3), lithium oxalate ([LiCO2]2), lithium fluoride (LiF),lithium hydroxide (LiOH), lithium methoxide (LiOCH3), lithium methyl carbonate (LiOCO2CH3), lithiumethyl carbonate (LiOCO2C2H5), and dilithium ethylene glycol dicarbonate (([CH2OCO2Li]2: LiEDC). Theorganic solvents were dimethyl carbonate (DMC) and ethylene carbonate (EC). The atomic charges in theforce field have been fitted to the electrostatic potential obtained from density functional theory calculationsfor each salt. The heat of dissolution in DMC for the salts calculated from computer simulations ranged fromexothermic heats for the organic salts in general to endothermic heats for the inorganic salts in the order ofLiEDC < LiOCO2CH3 < LiOH < LiOCO2C2H5 < LiOCH3 < LiF < [LiCO2]2 < Li2CO3 < Li2O where thevalue of the heat went from more negative in the left to more positive in the right. In EC, the order was moreor less the same, but the salts were found to dissolve more than DMC in general. The analysis from simulationswas performed to rationalize the solubility of each salt in DMC and also the solubility difference between inDMC and EC. The latter was found to be due not only to the difference in polarity between the two solvents,but we also suspect that it may be due to the molecular shapes of the solvents. We also found that theconformation of LiEDC changed in going from DMC to EC, which contributed to the difference in thesolubility.
The solid-electrolyte-interface (SEI) film formed on thenegative electrode in lithium ion battery cells has been foundto be a key component affecting important cell performanceparameters, such as cycle life, calendar life, irreversible capacityloss, safety, and others.1-35 The dissolution of the SEI filmduring cycling or storage has been discussed by a number ofgroups and has been claimed to be a major cause for capacityfading.4,34,35 Film dissolution can result in exposure of theelectrode surface to the electrolyte, prompting irreversiblereactions with the electrolyte, thus reducing the cell capacity.However, most of the previous reports have been based onindirect observations of the film dissolution, such as thedisappearance of differential scanning calorimetry peaks5 andchanges in the X-ray photospectroscopy spectra13,21,26,34,35 or theatomic force microscopy images13 before and after cycling orstorage. We have recently determined the solubility of individuallithium salts typically found in the SEI film in dimethylcarbonate (DMC) through ion conductivity measurements.36 Wefound that organic salts were more likely to dissolve thaninorganic salts. On the basis of the results, we proposed amechanism by which a capacity fading may be facilitated bythe SEI film dissolution, but we provided little interpretationof the solubility data in our previous paper.36
Computer simulation may be a useful tool to interpret theexperimental solubility data and gain insight into the solubilitybehavior of the lithium salts in organic solvents. Further,
rationalization of the lithium salt solubility measurements mayprovide useful information for designing a stable SEI film. Wereport here a detailed examination of the solubility of the lithiumsalts using the results from computer simulations. The lithiumsalts studied here include lithium oxide (Li2O), lithium carbonate(Li2CO3), lithium oxalate ([LiCO2]2), lithium fluoride (LiF),lithium hydroxide (LiOH), lithium methoxide (LiOCH3), lithiummethyl carbonate (LiOCO2CH3), lithium ethyl carbonate(LiOCO2C2H5), and dilithium ethylene glycol dicarbonate([CH2OCO2Li]2, LiEDC), all of which have been found as SEIfilm components.1,5,9,14-35 The solvents in which the solubilityof the lithium salts was examined were DMC and ethylenecarbonate (EC). This work is a series of reports in understandingSEI film solubility, which may lead to practical rejuvenationof lithium ion cells. Because the application of lithium ionbatteries for transportation is expected to grow, recycling orrefurbishing used cells will become an important issue.
The lithium salts studied here may fall into a category ofionic solids in materials science. Computer modeling of ionicsolids has been found to be challenging due to the strongpolarization effects, among other factors.37 Still, computationalmodeling approaches have been successfully applied to severallithium ions, such as Li2O38-46 and Li2CO3.47 The primary reasonfor such a predominantly large number of reports for Li2O isdue to its interest as an ionic conductor.38 However, most ofthe studies used ad hoc force fields for particular salts.Furthermore, very few potential functions or force field param-eters have been proposed for the other lithium salts examinedin this study, partially due to the lack of experimental data. We
* Corresponding author. E-mail: [email protected].† Mitsubishi Chemical USA.‡ General Motors Corporation.
J. Phys. Chem. C 2010, 114, 8076–80838076
10.1021/jp100013h 2010 American Chemical SocietyPublished on Web 04/06/2010

have recently reported solubility data for a variety of lithiumsalts.36 This provides an opportunity to test and optimize ourforce field parameters against the experimental data. In thisstudy, we attempt to treat a wide range of salts, includinginorganic and organic salts, with either monolithium ion ordilithium ions within the framework of a single potentialfunction. Very few (theoretical) solubility studies have beenreported for such a diverse range of salts in organic solvents.
To model ionic solids with reasonable accuracy, it is oftendesirable to include polarizable potential functions in the forcefield. However, parametrization of such functions can be time-consuming and requires special expertise. On the other hand,commercial software packages are broadly available and ac-cessible. Materials Studio is a widely used commercial packageavailable from Accelrys, Inc. We will examine the effectivenessof a commercial package dealing with the solubility of ionicsolids in this report.
Computation
Figure 1 shows the chemical structures of all the moleculesinvolved in the calculations. Figure 2 illustrates the thermody-namic cycle used in the calculations of the heat of dissolution
for each salt in DMC and EC. The heat of sublimation (∆Hsub),the heat of solution (∆Hsol), and the heat of dissolution (∆Hdiss)were obtained from the following equations:
where ∆Esub is the energy required to bring the salt moleculefrom the condensed phase to the gas phase, and ∆Esol is theenergy required to transfer the same salt molecule from the gasphase to the organic solvent.48,49 Both ∆Esub and ∆Esol wereobtained from the MD simulations. R and T are the gas constantand the absolute temperature, respectively. The temperature was298 K. The volume change between the salt solution and theliquid (DMC or EC) in the calculation of the heat of solutionwas assumed to be negligible.48
The software package, Materials Studio, used for this studyis commercially available from Accelrys, Inc.50 The force field,using a pairwise potential function, was COMPASS51 includingautomatic parameters52 except for the atomic charges. Theatomic charges have been derived from density functional theory(DFT) calculations using the Perdew-Burke-Ernzerhof (PBE)exchange-correlation functional53,54 through electrostatic poten-tial fitting. The basis set was the double-numerical polarizationbasis set including one atomic orbital (AO) for each occupiedatomic orbital, the second set of valence AOs, d-functions fornon-hydrogen atoms, and p-functions on hydrogen atoms.55 Theatomic charges thus derived for each salt and solvent are shown
Figure 1. The chemical structures of all molecules studied: (a) lithium fluoride, (b) lithium oxide, (c) lithium hydroxide, (d) lithium methoxide,(e) lithium carbonate, (f) lithium methyl carbonate, (g) lithium ethyl carbonate, (h) dilithium ethylene glycol dicarbonate, (i) lithium oxalate, (j)dimethyl carbonate, and (k) ethylene carbonate. The structures displayed were taken from the optimized structures by energy minimization by DFTcalculations. The atomic charges, not shown for the hydrogen atoms, used in computer simulations are also shown by or on the atoms.
Figure 2. The thermodynamic cycle used for the calculations of theheat of sublimation (∆Hsub), the heat of solution (∆Hsol), and the heatof dissolution (∆Hdiss).
∆Hsub ) ∆Esub + RT (1)
∆Hsol ) ∆Esol - RT (2)
∆Hdiss ) ∆Hsub + ∆Hsol (3)
Solubility of Li Salts J. Phys. Chem. C, Vol. 114, No. 17, 2010 8077
in Figure 1. The van der Waals parameters in COMPASSincluding automatic parameters are proprietary to Accelrys, Inc.and could not be changed for this study; thus, the originalparameters were used. For each salt, 1 ns simulations were runat 298 K under the NPT ensemble, under which the number ofatoms, the pressure, and the temperature were constant duringthe simulation, for a cell having a side length of ∼20 Å. Theexception was LiEDC which required longer simulations, 2 ns,especially in the solid phase, due to its larger molecular size.The average value from several runs was taken as the potentialenergy used for the heat calculations. The long-range interac-tions, both van der Waals and electrostatic interactions, weretreated by the Ewald summation.56 Crystal structures were usedin the solid simulations of LiOH,57 LiF,58 [LiCO2]2,59 Li2CO3,60
and Li2O,61 and amorphous structures were generated for theothers using the Amorphous Cell software package,62 since nocrystallographic data were available.
Results and Discussion
Table 1 lists the heat of dissolution for each salt obtainedfrom the MD simulations, along with the heat of sublimationand the heat of solution in DMC and EC. The heat of dissolutionin DMC for the salts ranges from exothermic heats for theorganic salts in general to endothermic heats for the inorganicsalts in the order of LiEDC < LiOCO2CH3 < LiOH <LiOCO2C2H5 < LiOCH3 < LiF < [LiCO2]2 < Li2CO3 < Li2O,where the value of the heat went from more negative at the leftto more positive at the right. It seems the organic salts are ingeneral more likely to dissolve than the inorganic salts in bothDMC and EC. For the results in DMC, this is consistent withour previous experimental observations.36 The salts tend todissolve somewhat more in EC than in DMC in general, withan exception for LiEDC, which is addressed later. Our previouswork predicted the heat of dissolution for LiEDC to beendothermic.63 However, the atomic charges in the force fieldused in the previous work were directly taken from COMPASSand automatic parameters.
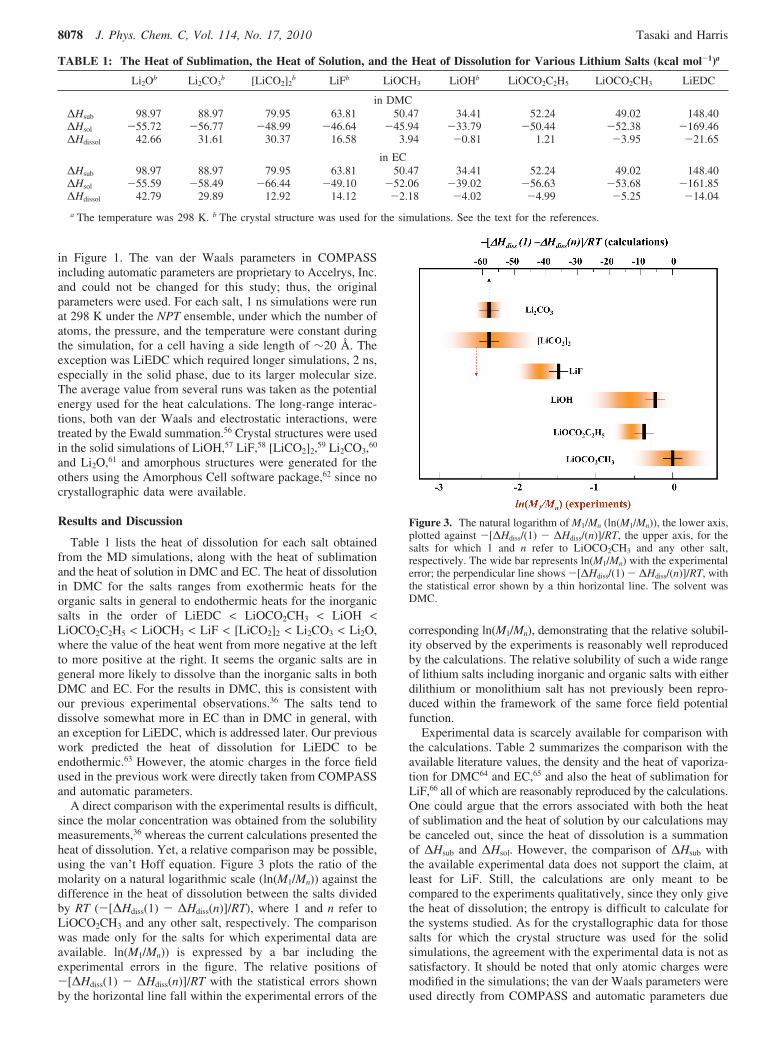
A direct comparison with the experimental results is difficult,since the molar concentration was obtained from the solubilitymeasurements,36 whereas the current calculations presented theheat of dissolution. Yet, a relative comparison may be possible,using the van’t Hoff equation. Figure 3 plots the ratio of themolarity on a natural logarithmic scale (ln(M1/Mn)) against thedifference in the heat of dissolution between the salts dividedby RT (-[∆Hdiss(1) - ∆Hdiss(n)]/RT), where 1 and n refer toLiOCO2CH3 and any other salt, respectively. The comparisonwas made only for the salts for which experimental data areavailable. ln(M1/Mn)) is expressed by a bar including theexperimental errors in the figure. The relative positions of-[∆Hdiss(1) - ∆Hdiss(n)]/RT with the statistical errors shownby the horizontal line fall within the experimental errors of the
corresponding ln(M1/Mn), demonstrating that the relative solubil-ity observed by the experiments is reasonably well reproducedby the calculations. The relative solubility of such a wide rangeof lithium salts including inorganic and organic salts with eitherdilithium or monolithium salt has not previously been repro-duced within the framework of the same force field potentialfunction.
Experimental data is scarcely available for comparison withthe calculations. Table 2 summarizes the comparison with theavailable literature values, the density and the heat of vaporiza-tion for DMC64 and EC,65 and also the heat of sublimation forLiF,66 all of which are reasonably reproduced by the calculations.One could argue that the errors associated with both the heatof sublimation and the heat of solution by our calculations maybe canceled out, since the heat of dissolution is a summationof ∆Hsub and ∆Hsol. However, the comparison of ∆Hsub withthe available experimental data does not support the claim, atleast for LiF. Still, the calculations are only meant to becompared to the experiments qualitatively, since they only givethe heat of dissolution; the entropy is difficult to calculate forthe systems studied. As for the crystallographic data for thosesalts for which the crystal structure was used for the solidsimulations, the agreement with the experimental data is not assatisfactory. It should be noted that only atomic charges weremodified in the simulations; the van der Waals parameters wereused directly from COMPASS and automatic parameters due
TABLE 1: The Heat of Sublimation, the Heat of Solution, and the Heat of Dissolution for Various Lithium Salts (kcal mol-1)a
Li2Ob Li2CO3b [LiCO2]2
b LiFb LiOCH3 LiOHb LiOCO2C2H5 LiOCO2CH3 LiEDC
in DMC∆Hsub 98.97 88.97 79.95 63.81 50.47 34.41 52.24 49.02 148.40∆Hsol -55.72 -56.77 -48.99 -46.64 -45.94 -33.79 -50.44 -52.38 -169.46∆Hdissol 42.66 31.61 30.37 16.58 3.94 -0.81 1.21 -3.95 -21.65
in EC∆Hsub 98.97 88.97 79.95 63.81 50.47 34.41 52.24 49.02 148.40∆Hsol -55.59 -58.49 -66.44 -49.10 -52.06 -39.02 -56.63 -53.68 -161.85∆Hdissol 42.79 29.89 12.92 14.12 -2.18 -4.02 -4.99 -5.25 -14.04
a The temperature was 298 K. b The crystal structure was used for the simulations. See the text for the references.
Figure 3. The natural logarithm of M1/Mn (ln(M1/Mn)), the lower axis,plotted against -[∆Hdiss/(1) - ∆Hdiss/(n)]/RT, the upper axis, for thesalts for which 1 and n refer to LiOCO2CH3 and any other salt,respectively. The wide bar represents ln(M1/Mn) with the experimentalerror; the perpendicular line shows -[∆Hdiss/(1) - ∆Hdiss/(n)]/RT, withthe statistical error shown by a thin horizontal line. The solvent wasDMC.
8078 J. Phys. Chem. C, Vol. 114, No. 17, 2010 Tasaki and Harris

to the constraint described in the Computation section. With ajudicious modification of the van der Waals parameters, weexpect that the agreement with the experimental crystallographicdata could be improved, but on the basis of Figure 3, we believethe calculated relative solubility is valid.
A variety of solvents are currently used in lithium ion batteryelectrolytes, including cyclic carbonates and linear carbonates,among others. It is thus of particular interest to examine thesolubility of salt components found in SEI films in othersolvents. EC is one of the most popular solvents used in thelithium ion battery electrolytes. Our computer simulations haveshown that the heat of dissolution is generally somewhat moreexothermic (or less endothermic) for the salts in EC than inDMC. One reason may be that EC is a more polar solvent thanDMC. The dielectric constant of EC is 89.6, whereas that forDMC is 3.12 at room temperature.67 It is of interest to note thatafter cycling, cell capacity recovery has been observed oncethe anode electrode was rinsed in water, which has a dielectricconstant of 80.2 at room temperature.12,68
In addition, we suspect that the molecular shape of the solventmay affect the solubility of the salt. For example, EC is a rathercompact molecule, having a cyclic structure, whereas DMC isa chain molecule having two terminal methyl groups with theCdO bond perpendicular to the chain axis (see Figure 1). Sincesolvation of the lithium cation occurs primarily with the CdOdipole of the carbonate solvent pointing at the cation, as shownbelow, the differences in the molecular structures between thesolvents may result in a different accessibility of the solvent tothe cation for solvation. The lithium cation can also be solvatedby the ether oxygen of the carbonate solvent. Due to the cyclicstructure’s having its ethylene groups pointing away from thelithium cation, EC may have better accessibility to the cationthan DMC, whose methyl groups can point toward the cation.
On the other hand, a DMC molecule’s contact with itsneighboring solvent molecules through the flexible terminalgroups may become more repulsive, and it gets increasinglycrowded around the lithium ion as the DMC molecule tries toapproach the cation. By extending this argument, it may followthat salts may be less soluble, as compared with in DMC, indiethyl carbonate (DEC) which has a longer terminal group thanDMC. Still, the above discussions remain only speculation.
Table 3 summarizes the differences in the Li+ solvationstructure between that in DMC and in EC. The table lists thenumber of the carbonyl oxygens and ether oxygens of thesolvent molecules within the first solvation shell of the Li+ ionin each solvent. They were obtained through integration of thepair distribution function (PDF),
where F is the atom number density, r is the interatomic distancebetween the Li+ ion and either the carbonyl oxygen or the etheroxygen atom, and N is the number of oxygen atoms within thedistance r. The integration of the PDF was performed up to 3Å, by which point the first peak disappeared in the mostdistribution functions. Figure 4 displays typical PDFs for pairsboth in DMC and in EC. Figure 4a shows the PDF for theLi+-carbonyl oxygen pair in DMC, where a sharp peak appearsaround 2 Å, corresponding to the nearest carbonyl oxygen atomscoordinating the Li+ ion. The only other peak is broad andappears beyond 6 Å, which corresponds to the carbonyl oxygenatoms in the second solvation shell. The dominant first peak inthe PDF demonstrates strong interactions between the Li+ ionand the carbonyl oxygen atoms of DMC surrounding the ion.
TABLE 2: Comparisons of Calculations and Experimental Dataa
DMC EC
density 1.06 ( 0.02 1.30 ( 0.02g cm-3 (1.07b) (1.32b)heat of vaporization 9.47 ( 0.48 12.04 ( 0.42kcal mol-1 (9.26c) (13.45d)
LiF Li2O Li2CO3 [LiCO2]2 LiOH
heat of sublimation 63.81kcal mol-1 (64.59e)lattice constant 3.88 Å 4.48 Å a/b/c ) 8.01/4.64/5.85 Å a/b/c ) 5.27/2.98/5.62 Å a/b/c ) 6.56/7.46/2.62 Å
(4.02f) (4.61g) � ) 114.79° R/�/γ ) 98.43/97.92/78.77° � ) 102°(a/b/c ) 8.36/4.97/6.19 Å (a/b/c ) 5.66/3.36/5.97 Å (a/b/c ) 7.37/8.26/3.19 Å� ) 114.79°h) R/�/γ ) 98.43/97.92/78.77°i) � ) 110.18°j)
a The experimental data is in the parentheses. b Taken from ref 67. c Taken from ref 64. d Taken from ref 65. e Taken from ref 66. f Cubic,taken from ref 58. g Cubic, taken from ref 61. h Monoclinic, taken from ref 60. i Triclinic, taken from ref 59. j Monoclinic, taken from ref 57.
TABLE 3: The Number of the Carbonyl and the Ether Oxygens of the Solvent in the First Shell of the Li+ Solvationa
DMC
oxygen Li2O Li2CO3 [LiCO2]2 LiF LiOCH3 LiOH LiOCO2C2H5 LiOCO2CH3 LiEDCcarbonyl oxygen 1.82 2.08 2.06 2.80 2.56 2.11 2.40 2.50 2.31ether oxygen 0.30 0.05 0.16 0.04 0.36 0.61 0.11 0.03 0.20total 2.12 2.13 2.22 2.84 2.92 2.72 2.51 2.53 2.51
ECoxygen Li2O Li2CO3 [LiCO2]2 LiF LiOCH3 LiOH LiOCO2C2H5 LiOCO2CH3 LiEDCcarbonyl oxygen 1.82 2.07 2.53 2.84 2.64 2.12 2.76 2.81 1.90ether oxygen 0.50 0.04 0.21 0.32 0.44 0.75 0.32 0.14 0.0total 2.32 2.11 2.74 3.16 3.08 2.87 3.08 2.95 1.9
a Obtained from integration of the pair distribution function for Li+ and the carbonyl oxygen or the ether oxygen up to 3 Å from Li+. Thevalues for the dilithium salts were averaged over the two lithium cations.
g(r) ) 1
4πFr2
dN(r)dr
(4)
Solubility of Li Salts J. Phys. Chem. C, Vol. 114, No. 17, 2010 8079

The Li+-ether oxygen PDF in DMC, in Figure 4b, on theother hand, has two clear peaks around 2 and 4 Å, whichcorrespond to the ether oxygen of DMC nearest to Li+ and theother ether oxygen in the same or the adjacent DMC molecule,respectively. The first peak at around 2 Å clearly indicates thatsome ether oxygens directly solvate the Li+ ion. The reasonfor the second peak, higher than the first, is that the contributionto the second peak also includes those from the ether oxygensbelonging to the adjacent DMC molecules, which solvate theLi+ ion through the carbonyl oxygens.
In sharp contrast, the Li+-ether oxygen PDF in EC in Figure4d shows only a single peak around 4 Å, which is due to theether oxygen of EC molecules that solvate the lithium ionsthrough their carbonyl oxygens. A compact, closed conformationof LiEDC in EC, shown in Figure 5b, gives limited accessibilityto the solvent. This conformation allows only the carbonyloxygen to access the lithium ion, since this orientation minimizes
the van der Waals overlap between the LiEDC molecule andthe solvent molecules. The limited accessibility of the solventsalso removes the ether oxygens of EC up to 10 Å from thelithium ion, which is the reason no peak appears in Figure 4d.
The results in Table 3 indicate that the carbonyl oxygendirectly solvates Li+ more than the ether oxygen. From thesimulation trajectories, it was occasionally observed that botha carbonyl and ether oxygen of the same solvent moleculesimultaneously solvate Li+, but such occurrences were rare. Forthe most part, the carbonyl oxygens and the ether oxygens within3 Å from the lithium ion belonged to different solvent molecules.Thus, the total number of the carbonyl and ether oxygens inthe fourth row of Table 3 can be considered as the total solvationnumber in the first shell of the lithium salt. It is shown that thesolvation number is around 3, except for Li2CO3, Li2O, and[LiCO2]2, for which the number is around 2, at least in DMC.The solvation number of 3.7 for Li+ has been recently reported
Figure 4. Pair distribution functions (g(r)) for (a) the Li+-carbonyl oxygen (DMC) pair, (b) the Li+-ether oxygen (DMC) pair, (c) the Li+-carbonyloxygen (EC), and (d) the Li+-ether oxygen of EC.
Figure 5. Snapshots taken from MD simulations: (a) LiEDC in DMC and (b) LiEDC in EC.
8080 J. Phys. Chem. C, Vol. 114, No. 17, 2010 Tasaki and Harris

by Yamada et al.69 With one solvation site still occupied by theanion counterpart, the solvation number of around 3 seemsconsistent with the crystallographic data. As to Li2CO3, Li2O,and [LiCO2]2, these salts have two lithium ions for solvation,which may bring the solvent molecules too close to one anotherto have a solvation number of 3. The high negative charges onthe oxygen may be at work as well, pushing the solventmolecules away from the lithium ion. The solvation numberfor [LiCO2]2 increases to almost 3 in EC, which suggests ahigher accessibility of EC molecules than that of DMC. Theresults in Table 3 demonstrate that in general, the solvationnumber in EC is higher than in DMC, except for LiEDC, whichwill be discussed below. The higher solvation numbers of thesalts in EC than in DMC correlate reasonably well with thesomewhat more exothermic heats of dissociation for the saltsin EC relative to those in DMC.
LiEDC is obviously an exception to the general trend thatthe other salts exhibit for solubility in DMC relative to that inEC. The conformation of LiEDC in both solvents was examinedfrom the MD trajectories. Figure 5 illustrates the solvation ofLiEDC in each solvent taken from the MD trajectories. Asmentioned above, in EC, LiEDC maintains a compact, closedconformation, which is the most stable found in the gas phase,as well. This conformation may be favorable entropically inEC, given the compact, closed structure of the EC molecules.The two lithium ions are shared by both terminal carbonategroups, keeping the lithium ions with the anion from accessingfor solvation. In DMC, on the other hand, LiEDC transformsitself to an open conformation, separating the two lithium ionsfrom one another, further away from the opposite side of theterminal carbonate group. The conformation of LiEDC in DMCis believed to be also entropically driven, since DMC is a chainmolecule, as well. Now each lithium ion is more exposed tothe solvent, allowing the solvent access, becoming more proneto dissolution. In fact, Table 3 indicates that the solvationnumber for the lithium ion of LiEDC is higher in DMC than inEC. It should be noted, however, that the simulations in ECwere performed at 298 K to compare without the temperatureeffect on the results in DMC obtained from simulations at 298K. Hence, the results in EC are presented only for theoreticalcomparisons to those in DMC, since the melting point of EC is313 K. We observed, however, that LiEDC remained in a closedconformation at 313 K, as well.
As to the relative solubility among the salts, its rationalizationseems rather straightforward in terms of the electrostaticinteractions and the crystal molecular packing. The electrostaticinteractions in the current modeling framework are controlledthrough Coulombic interactions by the atomic charges assignedto each atom, shown in Figure 1. Table 1 suggests a generalcorrelation between the heat of sublimation of the salts and theiratomic charges, especially the oxygen charges. For example, arelevant comparison can be made between the oxygen chargefor LiOCO2CH3 (-0.76e, -0.75e, or -0.25e) and that for Li2O(-1.74e) and their corresponding heat of sublimation: 49.02and 98.97 kcal mol-1, respectively. In fact, the heat ofsublimation for dilithium salts such as Li2O is generally higherthan that for the monolithium salts because two lithium ions inLi2O induce higher polarization in the molecule, resulting inthe higher atomic charges. In fact, Li2O has one of the highestvalues for the heat of sublimation among the salts studied here.
On the other hand, the oxygen of LiOCH3, a monolithiumsalt, also has a rather large charge, -1.13e, yet its heat ofsublimation is only the second smallest among the salts studied:50.47 kcal mol-1. We suspect this is due primarily to the
molecular packing of LiOCH3 in the crystal lattice, which maynot be as closely packed as Li2O or LiF, because of the methylgroup of LiOCH3. The methyl group may prevent a closemolecular packing. Both Li2O and LiF are linear molecules, onthe other hand, more likely to pack themselves densely in thelattice. For the same reason, lithium oxalate, having a planestructure (see Figure 1i) allowing tight molecular packing, hasa high heat of sublimation, 79.95 kcal mol-1, despite its not solarge charge, -0.69e, for the oxygen. As for LiEDC, its atomiccharges are not as large as those of Li2O, yet it has the largestheat of sublimation, 148.40 kcal mol-1, which contradicts thediscussion above. We suspect that this is simply a result of thelarge molecular size, the largest among the salts, having manyinteracting points, giving rise to stronger interactions betweenthe molecules in the solid. The size of the molecule has beenused as one of the molecular descriptors to predict heats ofsublimation for a large number of molecules.70 As to the processof dissolving a salt molecule into a solvent, the separation ofthe lithium from the anion counterpart of the salt is the primarydriving force for dissolution. Here, again, the electrostaticinteractions play a dominant role. There seems to be a correlationbetween the atomic charges and the heat of solution for thesalts.
Crystal structures were not used for some of the salts in thesimulations, since crystallographic data are available only forLiOH, LiF, [LiCO2]2, Li2CO3, and Li2O.
Amorphous structures were used for other salts. The effectof using a crystal structure on the heat of dissolution wasexamined for those salts whose crystal structures are known.For amorphous simulations, to avoid a system’s being trappedin a shallow potential well, the cell was first heated to 600 K,then gradually cooled to 298 K, followed by a 1 ns simulationat the same temperature. For LiOH, LiF, [LiCO2]2, Li2CO3, andLi2O, the heat of dissolution obtained from such amorphoussimulations was 1.24, 7.45, 8.49, 23.94, and 80.02 kcal mol-1,respectively. The differences from those obtained from thecrystal simulations ranged from 0.14 kcal mol-1 for LiOH to37.38 kcal mol-1 for Li2O. Yet, the order for dissolution eitherin DMC or EC was not altered. We note that some studies havefound amorphous regions in SEI films.13 Experimental solubilitydata for EC is not available for a comparison with our calculatedresults. Still, we note that the current force field reproduced thethermodynamic data for both EC and DMC fairly well, as isshown in Table 2.
A pairwise potential function has been used as the force fieldin the current simulations, whereas a polarizable function is oftenused to model ionic solids.39,42,71 The force field used here isbased on a pairwise potential function without many-body-effectterms. Yet, at least, the heat of sublimation for LiF wasreasonably reproduced by our calculations. Still, the treatmentof the isoelectronic F- may be less problematic in the forcefield calculations than Li2O having the high delocalization ofthe second electron of the outermost shell O2-, inducing anonspherical electron density around the oxygen. For example,the Cauchy violation for Li2O is known to be difficult toreproduce using pairwise potential functions,39 yet some knownproperties of the salts such as Li2O have been well-reproducedby pairwise potentials.44 Gale has suggested that for many ionicmaterials, it is often sufficient to include only the two-body termin the potential function.37 However, for quantitative discussionson salts such as Li2O, the inclusion of the polarizable potentialfunction is obviously favored.
Solubility of Li Salts J. Phys. Chem. C, Vol. 114, No. 17, 2010 8081

Conclusion
The relative solubility among a wide range of lithium salts,all of which are well-known SEI components, has for the firsttime been reasonably well reproduced in DMC by computersimulations using a force field with DFT-derived atomic charges.The heats of dissolution for the organic salts were found to beeither exothermic or slightly endothermic, whereas all theinorganic salts showed endothermic heats of dissolution. Theheat of dissolution became more exothermic in the followingorder in DMC: LiEDC > LiOCO2CH3 > LiOH > LiOCO2C2H5
>LiOCH3 > LiF > [LiCO2]2 > Li2CO3 > Li2O.The heats of dissolution for the same salts were also
calculated in EC. It was found that the salts tended to dissolvemore in EC than in DMC, except for LiEDC. Our analysissuggests that not only does the polarity of the solvent influencethe solubility of the salt, but also the size and shape of thesolvent molecule may play an important role. Only LiEDC wasless soluble in EC than in DMC, due to its conformation, whichmay obstruct the Li+ dissociation. The solubility of each salthas been discussed in terms of the electrostatic interactions andthe molecular packing. We find that in general, the larger thesize of the salt molecule is, the more soluble it becomes; namely,a large size of the salt molecule may promote delocalization ofthe electrons over the molecule, leading to weaker electrostaticinteractions with atoms in the neighboring molecules in the solidand giving rise to a lower heat of sublimation. Salts having alinear or planar molecular shape promoting an enhancedmolecular packing in a crystal lattice tend to dissolve less thansalts having bulky groups or flexible chains. Furthermore, acompact molecular shape of the solvent, such as EC, may helpsolvate the lithium ion, resulting in more heat of solution.
We have demonstrated the effective use of a commercialsoftware package for modeling the relative solubility of a widerange of lithium salts in organic solvents with a combinationof atomic charge adjustments from DFT calculations. Still, itshould be noted that the discussion presented here should betaken only as qualitative, since the van der Waals parameterswere not optimized and, in addition, a pairwise potential functionfor the salts was used for the force field. More rigorousparametrization including a polarizable function should not onlyprovide a better agreement with the crystallographic data forsome of the salts studied here, but also allow quantitativediscussions on the salt solubility.
Acknowledgment. The authors thank Drs. Alexander Gold-berg, Jian-Jie Lian, Matthew Hat, and George Fitzgerald ofAccelrys, Inc. for their very helpful comments and advice.
References and Notes
(1) Peled, E.; Goloditsky, D.; Penciner, D. J. In Handbook of BatteryMaterials; Besenhard, J. O., Ed.; Wiley-VCH.: Weinheim, 1999; p 419.
(2) Andersson, A.; Edstrom, K.; Thomas, J. O. J. Power Sources 1999,81, 8.
(3) Jean, M.; Chausse, A.; Messina, R. Abstract 146; 192nd Electro-chem. Soc. Meeting Paris, 1997.
(4) Vetter, J.; Novak, P.; Wagner, M. R.; Veit, C.; Moller, K. C.;Besenhard, J. O.; Winter, M.; Wohlfahrt-Mehrens, M.; Vogler, C.; Hm-mouche, A. J. Power Sources 2005, 147, 269.
(5) Du Pasquier, A.; Disma, F.; Bowmer, T.; Gozdz, A. S.; Amatucci,G.; Tarascon, J.-M. J. Electrochem. Soc. 1998, 145, 472.
(6) Safari, M.; Morcrette, M.; Teyssot, A.; Delacourt, C. J. Electrochem.Soc. 2009, 156, A145.
(7) Darling, R.; Newman, J. J. Electrochem. Soc., 1998, 145, 990.(8) Ramasamy, R. P.; Lee, J. W.; Popov, B. N. J. Power Sources 2007,
166, 266.(9) Ramadass, P.; Haran, B. S.; Gomadam, P. M.; White, R.; Popov,
B. N. J. Electrochem. Soc. 2004, 151, A196.
(10) Genies, S.; Brun-Buisson, D.; Wu, Y.-F.; Mattera, F.; Merten, J.Abstract 1280; 214th Electrochemical Society Meeting, Honolulu, 2008.
(11) Abraham, D. P.; Knuth, J. L.; Dees, D. W.; Bloom, I.; Christo-phersen, J. P. J. Power Sources 2007, 170, 465.
(12) Broussely, M.; Biensan, P.; Bonhomme, F.; Blanchard, P.; Herreyre,S.; Nechev, K.; Staniewicz, R. J. J. Power Sources 2001, 97-98, 13.
(13) Leroy, S.; Blanchard, F.; Dedryvere, R.; Martinez, H.; Carre, B.;Lemordant, D.; Gonbeau, D. Surf. Interface Anal. 2005, 37, 773.
(14) Aurbach, D.; Ein-Eli, Y.; Markovsky, B.; Zaban, A.; Luski, S.;Carmeli, Y.; Yamin, H. J. Electrochem. Soc. 1995, 142, 2882.
(15) Aurbach, D.; Levi, M. D.; Levi, E.; Schechter, A. J. Phys. Chem.B 1997, 101, 2195.
(16) Leroy, S.; Blanchard, F.; Dedryvere, R.; Martinez, H.; Carre, B.;Lemordant, D.; Gonbeau, D. Elecrochim. Acta 2008, 53, 3539.
(17) Augustsson, A.; Herstedt, M.; Guo, J.-H.; Edstrom, K.; Zhuang,G. V.; Ross, P. N., Jr.; Rubensson, J.-E.; Nordgren, J. Phys. Chem. Chem.Phys. 2004, 6, 4185.
(18) Cheng, H.; Zhu, C.; Lu, M.; Yang, Y. J. Power Sources 2007, 173,531.
(19) Zhang, S. S.; Xu, K.; Jow, T. R. Electrochim. Acta 2006, 51, 1636.(20) Zhuang, G. V.; Ross, P. N. Electrochem. Solid State Lett. 2003, 6,
A136.(21) Zhao, L.; Watanabe, I.; Doi, T.; Okada, S.; Yamaki, J. J. Power
Sources 2006, 161, 1275.(22) Fong, R.; Von Sacken, U.; Dahn, J. R. J. Electrochem. Soc. 1990,
137, 2009.(23) Aurbach, D.; Markovsky, B.; Weissman, I.; Levi, E.; Ein-Eli, Y.
Electrochim. Acta 1999, 45, 67.(24) Dedryvere, R.; Leroy, S.; Martinez, H.; Blanchard, F.; Lemordant,
D.; Gonbeau, D. J. Phys. Chem. B 2006, 110, 12986.(25) Aurbach, D.; Zinigrad, E.; Cohen, Y.; Teller, H. Solid State Ionics
2002, 148, 405.(26) Zhuang, G. V.; Yang, H.; Blizanac, B.; Ross, P. N. Electrochem.
Solid State Lett. 2005, 8, A441.(27) Naejus, R.; Lemordant, D.; Coudert, R.; Willimann, P. J. Fluorine
Chem. 1998, 90, 81.(28) Aurbach, D.; Zaban, A.; Gofer, Y.; Ein-Eli, Y.; Weissman, I.;
Chusid, O.; Abramson, O. J. Power Sources 1995, 54, 76.(29) Ein-Eli, Y.; Markovsky, B.; Aurbach, D.; Carmeli, Y.; Yamin, H.;
Luski, S. Electrochim. Acta 1994, 39, 2559.(30) Richard, M. N.; Dahn, J. R. J. Electrochem. Soc. 1999, 146, 2068.(31) Chusid, O.; Ein-Eli, Y.; Aurbach, D.; Babai, M.; Carmeli, Y. J.
Power Sources 1993, 43-44, 47.(32) Ota, H.; Sakata, Y.; Inoue, A.; Yamaguchi, S. J. Electrochem. Soc.
2004, 151, A1659.(33) Ota, H.; Sakata, Y.; Wang, X.; Sasahara, J.; Yasikawa, E. J.
Electrochem. Soc. 2004, 151, A437.(34) Andersson, A. M.; Edsrom, K. J. Electrochem. Soc. 2001, 148,
A1100.(35) Xu, K.; Zhang, S.; Jow, T. R. Electrochem. Solid State Lett. 2003,
6, A117.(36) Tasaki, K.; Goldberg, A.; Lian, J.-J.; Walker, M.; Timmons, A.;
Harris, S. J. J. Electrochem. Soc. 2009, 156, A1019.(37) Gale, J. In Handbook of Materials Modeling; Yip, S., Ed.; Springer:
The Netherlands, 2005; p 479.(38) Wilson, M.; Jahn, S.; Madden, P. A. J. Phys.: Condens. Matter
2004, 16, S2795.(39) Chadwick, A. V.; Flack, K.; Strange, J. H.; Harding, J. H. Proc.
6th Int. Conf. on Solid State Ionics, Garmisch-Partenkirchen, Fed. Rep.Germany, Sept. 6-11, 1987.
(40) Rodeja, J. G.; Meyer, M.; Hayoun, M. Modell. Simul. Mater. Sci.Eng. 2001, 9, 81.
(41) Jacobs, P. W. M.; Vernon, M. L. J. Chem. Soc., Faraday Trans.1990, 86 (8), 1233.
(42) Gavartin, J. L.; Catlow, C. R. A.; Shluger, A. L.; Varaksin, A. N.;Kolmogorov, Y. N. Modell. Simul. Mater. Sci. Eng. 1992, 1, 29.
(43) Bush, T. S.; Gale, J. D.; Catlow, C. R. A.; Battle, P. D. J. Mater.Chem. 1994, 4 (6), 831.
(44) Fracchia, R. M.; Barrera, G. D.; Allan, N. L.; Barron, T. H. K.;Mackrodt, W. C. J. Phys. Chem. Solids 1998, 59, 435.
(45) Gavartin, J. L.; Shluger, A. L.; Catlow, C. R. A. J. Phys.: Condens.Matter 1993, 5, 7397.
(46) Zhou, L. X.; Hardy, J. R.; Cao, H. Z. Solid State Commun. 1996,99, 637.
(47) Habasaki, J. Mol. Phys. 1990, 69, 115.(48) Jorgensen, W. L.; Madura, J. D. J. Am. Chem. Soc. 1983, 105,
1408.(49) Lousada, C. M.; Pinto, S. S.; Lopes, J. N.C.; da Piedade, M. F. M.;
Diogo, H. P.; da Piedade, M. E. M. J. Phys. Chem. A 2008, 112, 2977.(50) Materials Studio, V4.3, Accelrys, Inc.: 10188 Telesis Ct., Suite 100,
San Diego, CA 92121.(51) Sun, H. J. Phys. Chem. B 1998, 102, 7338.(52) Eichinger, B. E.; Rigby, D.; Stein, J. Polymer 2002, 43, 599.
8082 J. Phys. Chem. C, Vol. 114, No. 17, 2010 Tasaki and Harris

(53) Perdew, J. P.; Burke, K.; Ernzerhof, M. Phys. ReV. Lett. 1996, 77,3865.
(54) Perdew, J. P.; Burke, K.; Ernzerhof, M. Phys. ReV. Lett. 1997, 78,1396.
(55) Sadhukhan, S.; Munoz, D.; Adamo, C.; Scuseria, G. E. Chem. Phys.Lett. 1999, 306, 83.
(56) Ewald, P. Ann. Phys. 1918, 54, 519.(57) Alcock, N. W. Acta Crystallogr. 1971, B27, 168.(58) Thewlis, J. Acta Crystallogr. 1955, 8, 36.(59) Pedersen, B. F. Acta Chem. Scand. 1969, 23, 1871.(60) Idemoto, Y.; Richardson, J. W.; Koura, N.; Loong, C.-K. J. Phys.
Chem. 1998, 59, 363.(61) Shunk, F. A. Consitution of Binary Alloys, 2nd Suppl.; McGraw-
Hill: New York, 1969.(62) Amorphous Cell; Accelrys, Inc.: 10188 Telesis Ct., Suite 100, San
Diego, CA 92121.(63) Tasaki, K. J. Phys. Chem. B 2005, 109, 2920.
(64) Steele, W. V.; Chirico, R. D.; Knipmeyer, S. E.; Nguyen, A.J. Chem. Eng. Data 1997, 42, 1008.
(65) Hong, C. S.; Wakslak, R.; Finston, H.; Fried, V. J. Chem. Eng.Data 1982, 27, 146.
(66) Chase, M. W., Jr.; Davis, C. A.; Downy, J. R., Jr.; Frurip, D. J.;McDonald, R. A.; Syverud, A. N. JANAF Thermochemical Tables, 3rd ed.;National Bureau of Standards: Washington, DC, 1985.
(67) Linden, D. Handbook of Batteries, 2nd ed.; MaGraw-Hill: NewYork, 1995; p 36.14.
(68) Archer, D. G.; Wang, P. J. Phys. Chem. Ref. Data 1990, 19, 371.(69) Yamada, Y.; Koyama, Y.; Abe, T.; Ogumi, Z. J. Phys. Chem. C
2009, 113, 8948.(70) Gharagheizi, F. Thermochim. Acta 2008, 469, 8.(71) Wilson, M.; Exner, M.; Huang, Y. M.; Finnis, M. W. Phys. ReV. B
1996, 54, 683.
JP100013H
Solubility of Li Salts J. Phys. Chem. C, Vol. 114, No. 17, 2010 8083