computational model of avian nervous system nuclei governing … · 2018-06-18 · tion neurons (ra...
TRANSCRIPT

Computational model of avian nervous system nuclei governing learnedsong
Eve Armstrong∗1
1Computational Neuroscience Initiative, University of Pennsylvania, Philadelphia, PA 19104
(Dated: June 18, 2018)
Abstract
The means by which neuronal activity yields robust behavior is a ubiquitous question in neuroscience. In thesongbird, the timing of a highly stereotyped song motif is attributed to the cortical nucleus HVC, and to feedbackto HVC from downstream nuclei in the song motor pathway. Control of the acoustic structure appears to be sharedby various structures, whose functional connectivity is largely unknown. Currently there exists no model forfunctional synaptic architecture that links HVC to song output in a manner consistent with experiments. Herewe build on a previous model of HVC in which a distinct functional architecture may act as a pattern generatorto drive downstream regions. Using a specific functional connectivity of the song motor pathway, we show howthis HVC mechanism can generate simple representations of the driving forces for song. The model reproducesobserved correlations between neuronal and respiratory activity and acoustic features of song. It makes testablepredictions regarding the electrophysiology of distinct populations in the robust nucleus of the arcopallium (RA),the connectivity within HVC and RA and between them, and the activity patterns of vocal-respiratory neurons inthe brainstem.
I. INTRODUCTION
The song motor pathway is an excellent testbed for prob-ing the relationship between neuronal activity and ahighly stereotyped and quantifiable animal behavior.Specifically, a remarkably sparse series of bursts in corti-cal nucleus HVC is observed to be tightly locked to songtiming (Hahnloser et al. 2002; Lynch et al. 2016). Con-trol of the timing has been assigned to HVC (Simpson& Vicario 1990, Ashmore et al. 2005), and to recurrentfeedback from the brainstem (McLean et al. 2013, Reinke& Wild 1998, Striedter & Vu 1998). Previous modelingof HVC has invoked a chain-like mechanism to drivedownstream areas. These chain models are instructivebut lack biophysical justification. Meanwhile, models ofconnectivity downstream, including feedback to HVC,omit important observations of both electrophysiologyand of song-related neuronal and respiratory activity. Inparticular, the connectivity between HVC and the robustnucleus of the arcopallium (RA) - a connectivity that iscritical for song production - is extremely poorly char-acterized, even though these two regions have receivedconsiderable attention by the experimental community.
Here we build upon a biophysically-motivated
pattern-generating mechanism in HVC, which has beenset forth in a previous paper (Armstrong & Abarbanel2016). We expand on this model to generate representa-tions of acoustic output of the zebra finch, via a specificfunctional connectivity for downstream regions that isin keeping with observations to date.
Previous models of HVC have focused on produc-ing the observed sparse bursting of neurons projectingto RA (HVCRA PNs) (Hahnloser et al. 2002; Lynch etal. 2016). Those models invoke a feedforward chain ofexcitation (Li & Greenside 2006; Long et al. 2010; Gibbet al. 2009a, Cannon et al. 2015). Gibb et al. (2009a)introduced a chain modulated by inhibition, to incor-porate evidence that inhibition is integral to the seriespropagation. Their proposed mechanism, however, wasengineered without biophysical motivations. Moreover,the chain model is troublesome in that, by its very defi-nition, it does not represent an interconnected web - thepicture that emerges from evidence for highly reciprocalstructured excitation and structured inhibition withinHVC (Kosche et al. 2015).
Armstrong & Abarbanel (2016) proposed an alterna-tive to the HVC chain model, in terms of a competitionamong inhibitory neurons (e.g. Verduzco-Flores et al.
1
arX
iv:1
801.
0622
6v1
[q-
bio.
NC
] 1
8 Ja
n 20
18

2012; Yildiz & Kiebel 2011). This formalism is based onthe biophysical process of mutual inhibition. It read-ily offers a structured role for inhibition, and permitsa formulation that is simpler yet more versatile: a sin-gle architecture capable of generating multiple modesof activity. In this paper, we take that model to drivesignaling through a functional architecture of the songmotor pathway.
In this paper we focus exclusively on the song motorpathway, and will not discuss its known connections tothe auditory system (Vates et al. 1996, Lewandowski etal. 2013) or the anterior forebrain pathway, a circuit thatis required for song learning (e.g. Brainard & Doupe2002). The current understanding of the song motorpathway goes as follows. An initiating signal reachesHVC, and perhaps also the respiratory-related brain-stem. HVCRA PNs then enact a sparse pattern of burst-ing. RA, a nucleus long implicated in song generation(Nottebohm et al. 1976, Vu et al. 1994, Yu & Margoliash1996, Kubota and Saito 1991, Spiro et al. 1999, Mar-goliash 1997, Simpson and Vicario 1990), converts thebursts from HVC into more elaborate instructions (Yu& Margoliash 1996, Margoliash 1997) to be delivered toregions in the brainstem that control respiration and thesyrinx, the avian vocal instrument. The song consists ofsyllables and inter-syllable gaps, which coincide withactive expiration and mini-breaths, respectively.
Previous modeling aimed to link HVC to song out-put has been performed (Abarbanel et al. 2004). Theprediction of this model, however, is inconsistent withsubsequent observed correlations between RA activityand acoustic structure (Leonardo & Fee 2005). In Abar-banel et al. (2004), the syringeal- and respiratory-relatedbrainstem regions were activated sequentially. Thisassignment predicted that the number of RA projec-tion neurons (RA PNs) firing should depend on notefrequency, and on whether a particular temporal in-stance occurred during sound versus gap. In contrast,Leonardo & Fee (2005) found the number of active RAPNs to be roughly invariant throughout song. In thispaper we show how simultaneous signaling by RA tothese regions can reproduce that observation.
Previous modeling of a functional feedback loop forsong generation has been proposed (Gibb et al. 2009b).Those authors, however, used the chain model of Gibbet al. (2009a) to describe HVC, and they did not ex-tend the model to acoustic output. Their schematic forfeedback connectivity, on the other hand, is consistentwith observed timings of syllables versus gaps (Glaze
& Troyer 2006), and with subsequent air sac pressuretimings during song (Andalman et al. 2011). We buildupon this aspect of their framework. Further, we expandthe RA model to include both excitatory and inhibitorypopulations, and observations that HVCRA PNs exciteonly the latter (e.g. Spiro et al. 1999).
The work presented in this paper was incited by thequestion: Can we create a functional connectivity of thesong motor pathway that is consistent with observations,such that the HVC model of Armstrong & Abarbanel(2016) drives a simple representation of song? We offeran answer, by invoking three features: 1) a detailed func-tional connectivity between HVC and RA, given knownelectrophysiology; 2) a specific temporal relationshipamong signals sent from RA to song-related brainstemregions; 3) song timing that is shared by HVC and recur-rent brainstem feedback at the onset of each gap. Themodel makes testable predictions regarding the electro-physiology of RA, and of song-related neuronal activitythroughout the motor pathway.
II. MODEL
A. Scope
The model, whose scope is shown in Figure 1, is sum-marized in this Subsection and in Subsection B. For theinterested reader, details of the model are explainedin Subsections C - J. Finally, control of song timing isdescribed in Subsection K.
Figure 1: Black and grey: detailed computational model. Blue:simple one-to-one relations to generate driving forces forsong.
2

The model invokes an “initiating region” that is capa-ble of activating HVC via some neuromodulatory mech-anism. We do not explicitly model this initiating region,but rather offer suggestions for its likely geographiclocation. The model explicitly includes HVC, RA, andfour distinct brainstem regions that have identified rolesin driving song.
These four brainstem regions are: 1) the expiratory-related retroambigualis (RAm), to which is attributedthe control of pressure in the air sacs that compress thelungs; 2) the inspiratory-related parambigualis (PAm)(Wild 1993a, Wild 1993b, Wild 1997, Wild et al. 1997,Wild et al. 1998, Roberts et al. 2008); 3) the rostral and 4)caudal tracheosyringeal region of the hypoglossal nerve(nXIIts), which respectively control labial tension (viathe ventral syringeal muscle vS) and labial adduction(via a dorsal syringeal muscle that varies across birds)(Wild 1997, Wild 1993b, Vicario 1991a, Vicario 1991b,Gardner et al. 2001, Goller & Suthers 1996, Larsen &Goller 2002, Sober et al. 2008). At the onset of a gap,PAm sends feedback to HVC to halt the currently-activeseries of HVCRA bursts.
Now, in a more realistic picture, these four brainstemregions inter-connect and may overlap. For simplicity,however, in the zebra finch model we take them to bedistinct and non-interacting. Further, we omit brainstemnuclei whose role in song production appears significantbut is to-date obscure1, and we omit audition2.
B. Basic functionality
The basic steps for modeling the song motor pathwayare as follows.
1. During quiescence immediately preceding song,HVCRA neurons are silent above threshold whileHVC interneurons are densely spiking, and theopposite situation occurs in RA (e.g. Spiro et al.1999). These scenarios are produced by assigningrelative threshold potentials for spiking, for theexcitatory and inhibitory neurons in each nucleus,respectively.
2. Song is initiated via a neuromodulatory mecha-nism that rapidly increases the strengths of theinterneuron-interneuron synapses in HVC3, such
that a competition is effected among that popula-tion.
3. Then, due to a specific connectivity within HVC,this competition among interneurons effects a se-quence of activations of the HVCRA PNs.
4. HVCRA PNs synapse exclusively onto RA in-terneurons, which are inactive until excited bya projection from HVC (Spiro et al. 1999). In thismodel, each HVCRA PN synapses onto four RAinterneurons.
5. Then, due to a specific connectivity within RA,these four RA interneurons suppress a fraction ofthe (otherwise active) RA PNs. It is in this way thateach HVCRA PN indirectly recruits an ensembleof RA PNs.
6. Each of the four RA PNs in an ensemble activatesa premotor neuron in a distinct song-related brain-stem region.
7. Using simple one-to-one rules for brainstem-to-motor connectivity, we offer an informal illustra-tion of how the computational model may repro-duce the driving forces for song. Here, within each∼ 10-ms timebin during a syllable and at the onsetof a gap, the four brainstem regions command fourdistinct motor regions to effect a specific value of:1) labial tension, 2) air sac pressure, 3) degree ofsyringeal adduction, and 4) a specific instructionto PAm, respectively.
If the instructions to the four brainstem regionsoccur simultaneously, then RA PN activity is un-correlated with the fundamental frequency of thenote and whether a syllable or gap is currentlyplaying, as found by Leonardo & Fee (2005). RAPN activity is also uncorrelated with note ampli-tude.
8. At the onset of an inter-syllable gap, PAm is di-rected to begin inspiration and send electricalfeedback to HVC to silence the currently-activeHVCRA PN series.
Throughout the gap, HVCRA PNs continue to fire,until the feedback signal reaches HVC and termi-
1We omit nucleus DM. In oscine birds, stimulation to DM elicits calls but not song, so it is generally believed that DM is associated withunlearned vocalization (Wild 1997).
2Bottjer & Arnold (1984) found that adult song is stable after deafening.3The initiating signal may target PAm as well, as suggested by Amador et al. 2013; Alonso et al. 2015; Alonso et al. 2016, but that
consideration does not affect this model.
3
nates that series. During the gap, the four brain-stem regions identified above are not necessarilyactivated with the precision required during sylla-bles and gap onsets.
In Subsections C - J, we describe in detail the me-chanics that effect the summary described above. Theuninterested reader may move directly to Subsection K:Control of Song Timing.
C. The equations of motion
C.1 Neurons
The neuronal populations are as follows. HVC con-tains 12 inhibitory interneurons and 12 HVCRA PNs,distinguished by their leak and synaptic reversal poten-tials. RA contains 12 inhibitory interneurons and 12excitatory PNs that connect to the brainstem. Again, theinhibitory-versus-excitatory nature of an RA neuron isset by leak and synaptic reversal potentials. The brain-stem consists of four neurons: one representing each ofthe four regions shown in Figure 1. Given the dearthof studies on electrophysiology, neuromodulation, andreceptor dynamics in the region downstream of RA, weare agnostic regarding whether the brainstem neuronsare motor neurons, or excitatory or inhibitory pre-motorneurons.
The electrophysiology of HVC neurons has beenstudied in detail (Daou et al. 2013). For simplicityand computational efficiency, however, for all neuronswe choose a three-dimensional Hodgkin-Huxley model,as three dimensions is the fewest required to producebursting (Izhikevich 2007). The model consists of onecompartment with a persistent sodium current and in-stantaneous activating gating variable, and a fast and aslow potassium current.
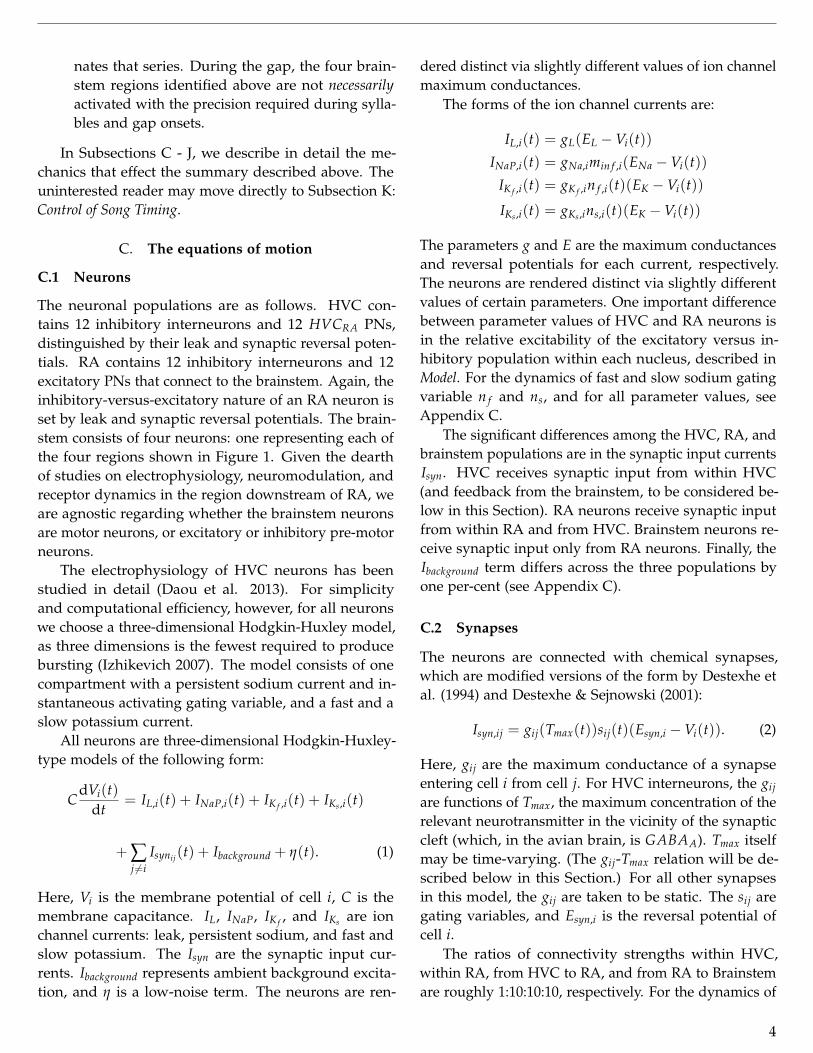
All neurons are three-dimensional Hodgkin-Huxley-type models of the following form:
CdVi(t)
dt= IL,i(t) + INaP,i(t) + IK f ,i(t) + IKs,i(t)
+ ∑j 6=i
Isynij(t) + Ibackground + η(t). (1)
Here, Vi is the membrane potential of cell i, C is themembrane capacitance. IL, INaP, IK f , and IKs are ionchannel currents: leak, persistent sodium, and fast andslow potassium. The Isyn are the synaptic input cur-rents. Ibackground represents ambient background excita-tion, and η is a low-noise term. The neurons are ren-
dered distinct via slightly different values of ion channelmaximum conductances.
The forms of the ion channel currents are:
IL,i(t) = gL(EL −Vi(t))
INaP,i(t) = gNa,imin f ,i(ENa −Vi(t))
IK f ,i(t) = gK f ,in f ,i(t)(EK −Vi(t))
IKs,i(t) = gKs,ins,i(t)(EK −Vi(t))
The parameters g and E are the maximum conductancesand reversal potentials for each current, respectively.The neurons are rendered distinct via slightly differentvalues of certain parameters. One important differencebetween parameter values of HVC and RA neurons isin the relative excitability of the excitatory versus in-hibitory population within each nucleus, described inModel. For the dynamics of fast and slow sodium gatingvariable n f and ns, and for all parameter values, seeAppendix C.
The significant differences among the HVC, RA, andbrainstem populations are in the synaptic input currentsIsyn. HVC receives synaptic input from within HVC(and feedback from the brainstem, to be considered be-low in this Section). RA neurons receive synaptic inputfrom within RA and from HVC. Brainstem neurons re-ceive synaptic input only from RA neurons. Finally, theIbackground term differs across the three populations byone per-cent (see Appendix C).
C.2 Synapses
The neurons are connected with chemical synapses,which are modified versions of the form by Destexhe etal. (1994) and Destexhe & Sejnowski (2001):
Isyn,ij = gij(Tmax(t))sij(t)(Esyn,i −Vi(t)). (2)
Here, gij are the maximum conductance of a synapseentering cell i from cell j. For HVC interneurons, the gijare functions of Tmax, the maximum concentration of therelevant neurotransmitter in the vicinity of the synapticcleft (which, in the avian brain, is GABAA). Tmax itselfmay be time-varying. (The gij-Tmax relation will be de-scribed below in this Section.) For all other synapsesin this model, the gij are taken to be static. The sij aregating variables, and Esyn,i is the reversal potential ofcell i.
The ratios of connectivity strengths within HVC,within RA, from HVC to RA, and from RA to Brainstemare roughly 1:10:10:10, respectively. For the dynamics of
4
gating variables sij, and for all other parameter values,see Appendix C.
These equations were integrated forward to yieldvoltage traces, via Python’s odeINT: a fourth-order adap-tive Runge-Kutta scheme. The time step used was 0.1ms.
D. HVC functional architecture
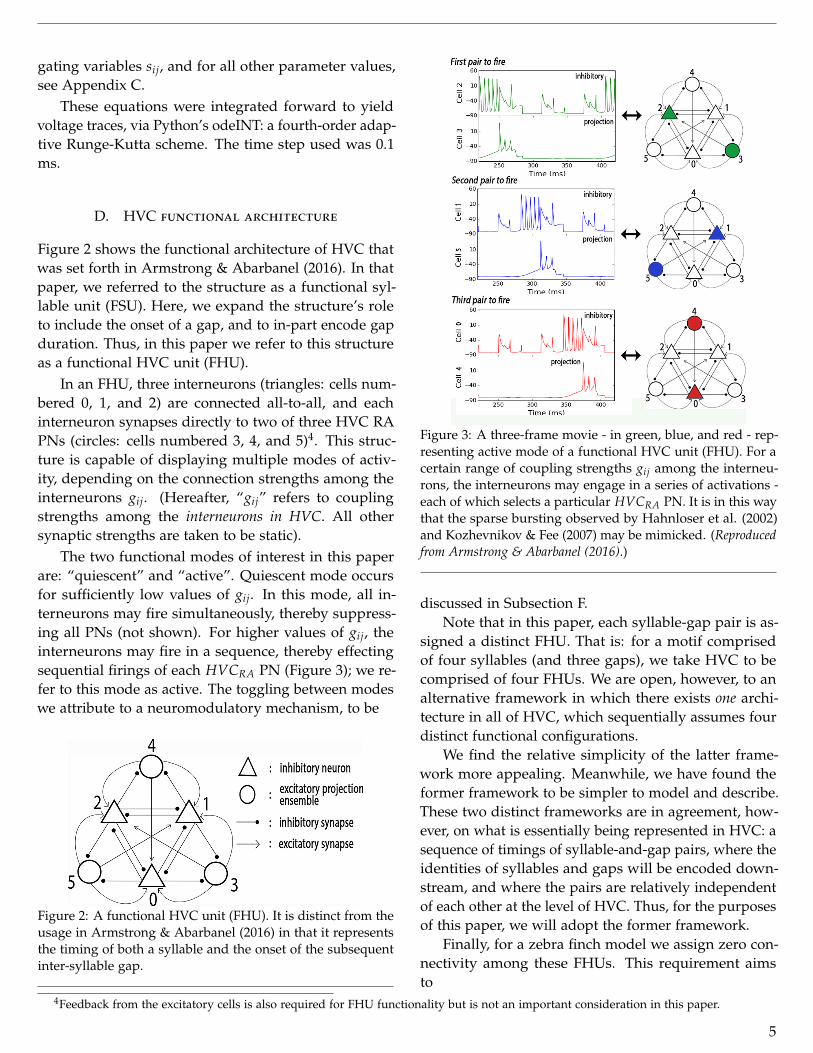
Figure 2 shows the functional architecture of HVC thatwas set forth in Armstrong & Abarbanel (2016). In thatpaper, we referred to the structure as a functional syl-lable unit (FSU). Here, we expand the structure’s roleto include the onset of a gap, and to in-part encode gapduration. Thus, in this paper we refer to this structureas a functional HVC unit (FHU).
In an FHU, three interneurons (triangles: cells num-bered 0, 1, and 2) are connected all-to-all, and eachinterneuron synapses directly to two of three HVC RAPNs (circles: cells numbered 3, 4, and 5)4. This struc-ture is capable of displaying multiple modes of activ-ity, depending on the connection strengths among theinterneurons gij. (Hereafter, “gij” refers to couplingstrengths among the interneurons in HVC. All othersynaptic strengths are taken to be static).
The two functional modes of interest in this paperare: “quiescent” and “active”. Quiescent mode occursfor sufficiently low values of gij. In this mode, all in-terneurons may fire simultaneously, thereby suppress-ing all PNs (not shown). For higher values of gij, theinterneurons may fire in a sequence, thereby effectingsequential firings of each HVCRA PN (Figure 3); we re-fer to this mode as active. The toggling between modeswe attribute to a neuromodulatory mechanism, to be
Figure 2: A functional HVC unit (FHU). It is distinct from theusage in Armstrong & Abarbanel (2016) in that it representsthe timing of both a syllable and the onset of the subsequentinter-syllable gap.
Figure 3: A three-frame movie - in green, blue, and red - rep-resenting active mode of a functional HVC unit (FHU). For acertain range of coupling strengths gij among the interneu-rons, the interneurons may engage in a series of activations -each of which selects a particular HVCRA PN. It is in this waythat the sparse bursting observed by Hahnloser et al. (2002)and Kozhevnikov & Fee (2007) may be mimicked. (Reproducedfrom Armstrong & Abarbanel (2016).)
discussed in Subsection F.Note that in this paper, each syllable-gap pair is as-
signed a distinct FHU. That is: for a motif comprisedof four syllables (and three gaps), we take HVC to becomprised of four FHUs. We are open, however, to analternative framework in which there exists one archi-tecture in all of HVC, which sequentially assumes fourdistinct functional configurations.
We find the relative simplicity of the latter frame-work more appealing. Meanwhile, we have found theformer framework to be simpler to model and describe.These two distinct frameworks are in agreement, how-ever, on what is essentially being represented in HVC: asequence of timings of syllable-and-gap pairs, where theidentities of syllables and gaps will be encoded down-stream, and where the pairs are relatively independentof each other at the level of HVC. Thus, for the purposesof this paper, we will adopt the former framework.
Finally, for a zebra finch model we assign zero con-nectivity among these FHUs. This requirement aimsto
4Feedback from the excitatory cells is also required for FHU functionality but is not an important consideration in this paper.
5
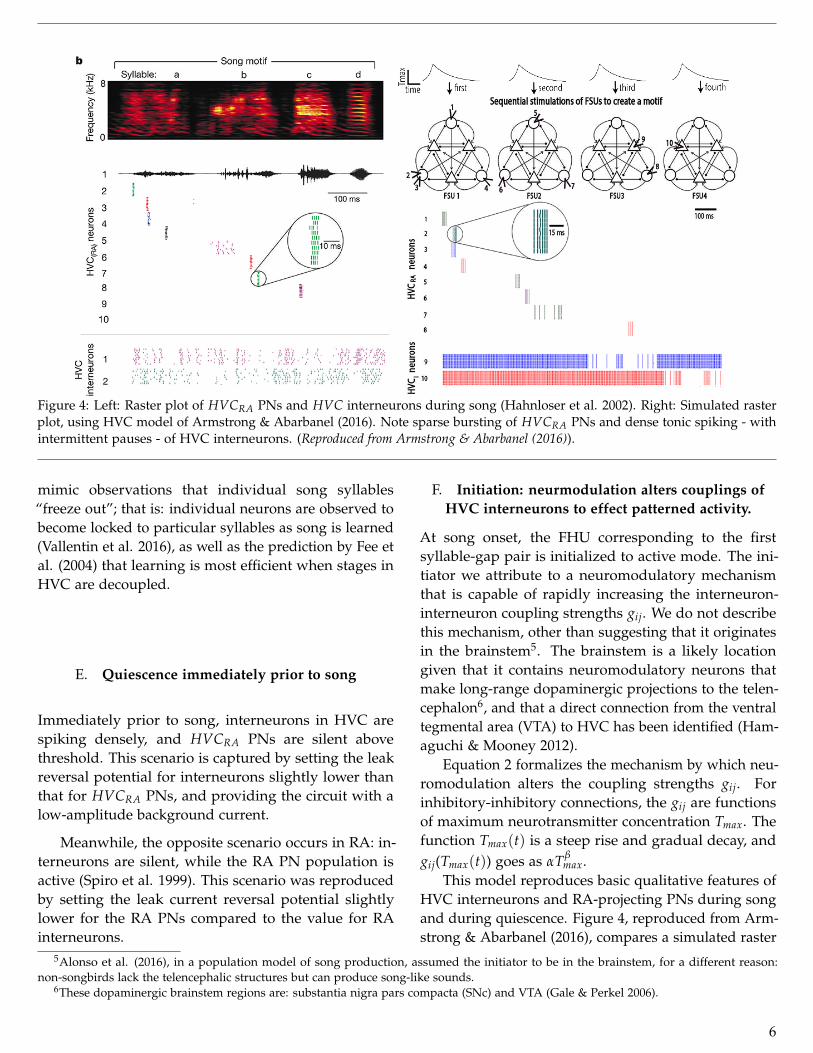
Figure 4: Left: Raster plot of HVCRA PNs and HVC interneurons during song (Hahnloser et al. 2002). Right: Simulated rasterplot, using HVC model of Armstrong & Abarbanel (2016). Note sparse bursting of HVCRA PNs and dense tonic spiking - withintermittent pauses - of HVC interneurons. (Reproduced from Armstrong & Abarbanel (2016)).
mimic observations that individual song syllables“freeze out”; that is: individual neurons are observed tobecome locked to particular syllables as song is learned(Vallentin et al. 2016), as well as the prediction by Fee etal. (2004) that learning is most efficient when stages inHVC are decoupled.
E. Quiescence immediately prior to song
Immediately prior to song, interneurons in HVC arespiking densely, and HVCRA PNs are silent abovethreshold. This scenario is captured by setting the leakreversal potential for interneurons slightly lower thanthat for HVCRA PNs, and providing the circuit with alow-amplitude background current.
Meanwhile, the opposite scenario occurs in RA: in-terneurons are silent, while the RA PN population isactive (Spiro et al. 1999). This scenario was reproducedby setting the leak current reversal potential slightlylower for the RA PNs compared to the value for RAinterneurons.
F. Initiation: neurmodulation alters couplings ofHVC interneurons to effect patterned activity.
At song onset, the FHU corresponding to the firstsyllable-gap pair is initialized to active mode. The ini-tiator we attribute to a neuromodulatory mechanismthat is capable of rapidly increasing the interneuron-interneuron coupling strengths gij. We do not describethis mechanism, other than suggesting that it originatesin the brainstem5. The brainstem is a likely locationgiven that it contains neuromodulatory neurons thatmake long-range dopaminergic projections to the telen-cephalon6, and that a direct connection from the ventraltegmental area (VTA) to HVC has been identified (Ham-aguchi & Mooney 2012).
Equation 2 formalizes the mechanism by which neu-romodulation alters the coupling strengths gij. Forinhibitory-inhibitory connections, the gij are functionsof maximum neurotransmitter concentration Tmax. Thefunction Tmax(t) is a steep rise and gradual decay, andgij(Tmax(t)) goes as αTβ
max.This model reproduces basic qualitative features of
HVC interneurons and RA-projecting PNs during songand during quiescence. Figure 4, reproduced from Arm-strong & Abarbanel (2016), compares a simulated raster
5Alonso et al. (2016), in a population model of song production, assumed the initiator to be in the brainstem, for a different reason:non-songbirds lack the telencephalic structures but can produce song-like sounds.
6These dopaminergic brainstem regions are: substantia nigra pars compacta (SNc) and VTA (Gale & Perkel 2006).
6
plot to that of Hahnloser et al. (2002), where HVCRAPNs burst sparsely while interneurons spike tonicallywith intermittent pauses, over ten song renditions (thisfinding by Hahnloser et al. (2002) has been significantlyenhanced by Lynch et al. (2016)). The FHU structurealso roughly captures the observed high rates of recip-rocal connectivity between HVC interneuron and PNpopulations, and that inhibition masks the activity of anexcitatory population (Kosche et al. 2015).
G. A similar structure is created in RA, whosecoupling strengths are static and where the
inhibitory-to-excitatory connections are critical forfunctionality.
We base our construction of RA upon three experimentalfindings: 1) During quiescence, RA PNs are active andRA interneurons are silent above threshold (Spiro et al.1999). 2) HVCRA PNs synapse to RA interneurons andnot to RA excitatory PNs (Kubota & Saito 1991, Mooney& Konishi 1991, Spiro et al. 1999). 3) RA interneurons,which are inhibitory, make vast projections to RA PNs(Spiro et al. 1999), which are excitatory.
First we reproduce quiescence in RA by setting theleak reversal potential EL for the interneurons to belower that than for the excitatory neurons: -85 versus-80 mV. Then, when both populations receive the samelow background excitation, the PNs burst and the in-terneurons are inactive above threshold.
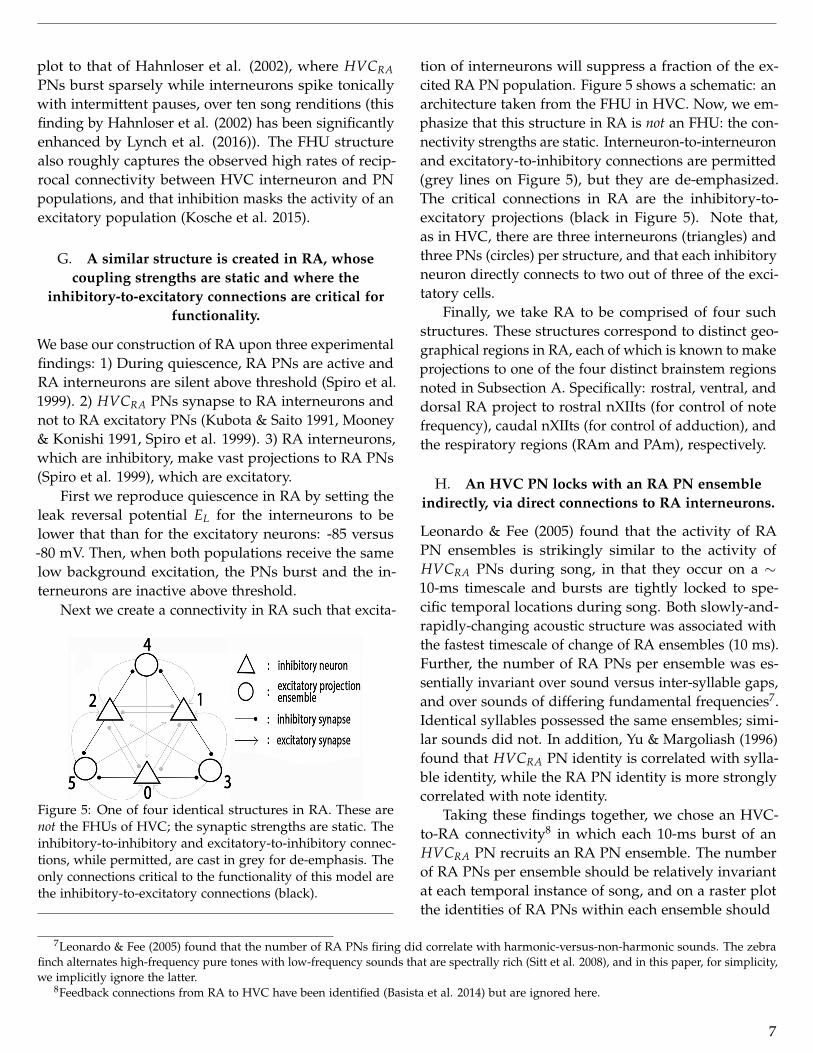
Next we create a connectivity in RA such that excita-
Figure 5: One of four identical structures in RA. These arenot the FHUs of HVC; the synaptic strengths are static. Theinhibitory-to-inhibitory and excitatory-to-inhibitory connec-tions, while permitted, are cast in grey for de-emphasis. Theonly connections critical to the functionality of this model arethe inhibitory-to-excitatory connections (black).
tion of interneurons will suppress a fraction of the ex-cited RA PN population. Figure 5 shows a schematic: anarchitecture taken from the FHU in HVC. Now, we em-phasize that this structure in RA is not an FHU: the con-nectivity strengths are static. Interneuron-to-interneuronand excitatory-to-inhibitory connections are permitted(grey lines on Figure 5), but they are de-emphasized.The critical connections in RA are the inhibitory-to-excitatory projections (black in Figure 5). Note that,as in HVC, there are three interneurons (triangles) andthree PNs (circles) per structure, and that each inhibitoryneuron directly connects to two out of three of the exci-tatory cells.
Finally, we take RA to be comprised of four suchstructures. These structures correspond to distinct geo-graphical regions in RA, each of which is known to makeprojections to one of the four distinct brainstem regionsnoted in Subsection A. Specifically: rostral, ventral, anddorsal RA project to rostral nXIIts (for control of notefrequency), caudal nXIIts (for control of adduction), andthe respiratory regions (RAm and PAm), respectively.
H. An HVC PN locks with an RA PN ensembleindirectly, via direct connections to RA interneurons.
Leonardo & Fee (2005) found that the activity of RAPN ensembles is strikingly similar to the activity ofHVCRA PNs during song, in that they occur on a ∼10-ms timescale and bursts are tightly locked to spe-cific temporal locations during song. Both slowly-and-rapidly-changing acoustic structure was associated withthe fastest timescale of change of RA ensembles (10 ms).Further, the number of RA PNs per ensemble was es-sentially invariant over sound versus inter-syllable gaps,and over sounds of differing fundamental frequencies7.Identical syllables possessed the same ensembles; simi-lar sounds did not. In addition, Yu & Margoliash (1996)found that HVCRA PN identity is correlated with sylla-ble identity, while the RA PN identity is more stronglycorrelated with note identity.
Taking these findings together, we chose an HVC-to-RA connectivity8 in which each 10-ms burst of anHVCRA PN recruits an RA PN ensemble. The numberof RA PNs per ensemble should be relatively invariantat each temporal instance of song, and on a raster plotthe identities of RA PNs within each ensemble should
7Leonardo & Fee (2005) found that the number of RA PNs firing did correlate with harmonic-versus-non-harmonic sounds. The zebrafinch alternates high-frequency pure tones with low-frequency sounds that are spectrally rich (Sitt et al. 2008), and in this paper, for simplicity,we implicitly ignore the latter.
8Feedback connections from RA to HVC have been identified (Basista et al. 2014) but are ignored here.
7

Figure 6: HVC-to-RA connectivity for a full motif, represented by a four-frame movie. Here, four FSUs in HVC are sequentiallyactivated: one representing syllable a, b, c, and d, and the ensuing gap for each. Each FSU targets the same four structures inRA. Each ∼ 10-ms burst of an HVCRA PN codes for a ∼ 10-ms “time bin” within a syllable or at gap onset. This connectivity,together with the RA-to-brainstem connections of Figure 7, created the raster plot of HVC, RA, and brainstem activity duringsong shown in Results. 8

Figure 7: RA-to-brainstem connectivity for a full motif. Each RA PN connects directly (black arrows) to a specific brainstemneuron, which is not pictured. RA PNs in the first, second, third, and fourth structures of RA project to specific neurons inrostral nXIIts, caudal nXIIts, RAm, and PAm, respectively. This connectivity, together with the HVC-to-RA connections ofFigure 6, created the raster plot of HVC, RA, and brainstem activity shown in Results
.
not appear to be correlated with the identities of RAPNs within other ensembles.
The specifics are as follows. Each HVCRA PNprojects directly to one randomly-selected interneuronin each of the four RA structures. Then the connectiv-ity of Figure 5 is such that when any one interneuronbecomes excited, it suppresses the activity of two of thethree9 PNs in that structure - and permits the third toburst (as is the case within an FHU of HVC). It is in thisway that each HVCRA PN indirectly recruits - via theRA interneuron population - an ensemble of RA PNs.For an illustration of this mechanism, see Appendix A.
Figure 6 contains the full schematic for HVC-to-RAconnectivity. It consists of four sequential panels, one foreach FHU. For example, the top panel of Figure 6 illus-trates the connectivity involving the FHU representingthe first syllable-gap pair (“a”), and the four structuresin RA. Here, a blue arrow entering an interneuron inany of the four structures of RA indicates that the blueHVCRA PN that bursts during the first “time bin” ofsong directly excites those particular interneurons dur-ing that first time bin.
I. RA simultaneously signals four distinctbrainstem regions, during each time bin of a syllable
and at gap onset.
Each of the four RA PNs in a currently-active ensemblethen directly connects to a neuron in one of four distinctbrainstem regions shown in Figure 1. Figure 7 showsthe projections leaving RA for these regions (brainstemregions are not shown). Specifically, the first, second,third, and fourth RA structures represent rostral, ventral,
dorsal, and dorsal RA, respectively. Signals are sent: 1)from rostral RA to ventral/rostral nXIIts; 2) ventral RAto ventral/caudal nXIIts; 3) dorsal RA to RAm; 4) dorsalRA to PAm. We choose these regions for their direct con-nections to labial tension, syringeal adduction, air sacpressure, and inspiration, respectively. Importantly, inthis model these four signals are sent essentially simul-taneously and continuously (on a ∼ 10-ms timescale)throughout each syllable and gap onset.
As relatively little is known about neurmodulationand receptor dynamics in the brainstem (e.g. Schmidt& Wild 2014), we assume a one-to-one relation betweeneach of these four RA structures and each of the fourbrainstem areas. That is: Each RA PN effects the ex-citation of a motor neuron (which in vertebrates areexcitatory), either by directly exciting it or indirectly viainteractions with pre-motor brainstem neurons.
Note that by assigning specific brainstem regions tospecific geographical locations in RA, we have implicitlyassumed no long-range connectivity within RA. Thereare known vast connections across RA, particularly be-tween ventral and dorsal regions (e.g. Spiro et al. 1999).Note also the assumption of no cross-connectivity at thebrainstem level. There exists an extensive literature ondense respiratory-syringeal connections at the brainstemlevel (e.g. Schmidt & Wild 2014). These omissions willbe addressed in Discussion.
J. Switching among FHUs occurs via feedback toHVC from downstream.
Amongst PAm, RAm, and nXIIts, the only robustly iden-tified10 feedback pathway to HVC is via Uva (Mooney
9The observed fraction is ten per cent (Leonardo & Fee 2005).10It is unlikely that the syrinx sends feedback to the motor pathway. Ashmore et al. (2005) found that stimulation to nXIIts distorted sound
but did not affect song timing or structure. Further, learned song can be destroyed via lesions to HVC and RA but is unaffected by syringealdenervation (Simpson & Vicario 1990; Vicario 1991b; Wild 1997). RAm appears to not project to Uva (McLean et al. 2013).
9

2009) from PAm (McLean et al. 2013, Reinke & Wild1998, Striedter & Vu 1998). In addition, activity in Uvashortly precedes the onset of each syllable (Aronov &Fee 2008). In this paper, then, we take feedback to HVCto occur via PAm11. Specifically: at the onset of an inter-syllable gap, PAm receives an order to send feedback toHVC.
There are two issues here, however, to consider.First: how does a succession of FHUs become acti-vated? Second: how does a succession of FHUs becomedeactivated? Now, in Armstrong & Abarbanel (2016)we took the inactivation of an FHU to occur once thetemporarily-enhanced neurotransmitter concentrationhad decayed below some critical value. This was not astrong argument, given the 10-ms temporal precision im-plicitly required of neurotransmitter decay (the requiredrise time was not a concern, as these can be nearly in-stantaneous; see references in Armstrong & Abarbanel;2016). In this paper we suggest instead that an FHU isdeactivated once electrical feedback reaches HVC fromthe brainstem.
That is: to coordinate the “off” of the current FHUwith the “on” of the subsequent FHU requires that theelectrical signal from PAm (via Uva) and the neuro-modulatory signal from, for example, VTA, reach HVCessentially simultaneously. For this reason, we tenta-tively suggest that the series of signals to the initiatorare triggered by PAm as well; see Discussion.
Note that in this paper the neuromodulatory “on”signal to HVC is modeled in the Tmax-gij relation ofEquation 1. To model the electrical “off” signal, wemerely truncate the integration.
K. Control of timing
We base our assignment of song timing on two bodiesof observations. First, the number of RA PNs firing atany instance during song is independent of whether theinstance occurs during a syllable or a gap (Leonardo& Fee 2005). If HVC RA PNs are locked to these en-sembles, then they should possess the same essentialrelationship over syllables versus gaps. Second, Ash-more et al. (2005) found via electrical stimulations toHVC that the time to motif truncation was independentof whether the stimulation was given during a note or
a gap. Third, and perhaps most intriguing, is the find-ing of those authors that when a syllable truncated butsong continued, the gap lengthened so that the totalmotif duration was preserved. These lines of evidenceindicate that the sequence of HVC RA PNs represents acontinuous timing throughout the full motif, regardlessof whether a particular time bin is encoded downstreamas a syllable or gap.
On the other hand, a second set of observations indi-cates that the timing mechanism is not entirely dictatedby HVC. Andalman et al. (2011) found that coolingHVC stretches air sac pressure time series differentially.During syllables and during roughly the second half ofinspiration, these time series stretch in response to HVCcooling. The first half of inspiration, however, remainsessentially unchanged. Further, Glaze & Troyer (2006)have identified significantly higher variability in gapsversus syllables.
We attribute this second collection of findings to thetimescales of signals returning to HVC, both from PAmand from the source of neuromodulation - where thesignal from PAm is triggered by HVC at the onset ofeach inter-syllable gap.
Specifically, the timing framework is as follows. Thesequence of HVCRA PN bursts encodes syllable dura-tion, including the onset of the subsequent gap. The gaponset is coded via a signal to PAm to begin inspiration.The HVCRA PN activity remains self-sustaining untila signal from PAm arrives and terminates it. A seriesof syllables is invoked via recurrent activation from theinitiating region, which may also be triggered by PAm;see Discussion.
Note that in this small model, each 10-ms timebin ofsong is encoded by one HVCRA PN. On a larger scale,this by no means need be the case.
III. RESULTS
Figure 812 shows a simulated raster plot over five songrenditions, based on the connectivity shown in Figures 6and 7. The raster plot shows eight HVCRA PNs, nine RAPNs, and two brainstem neurons. The spectrogram attop results from simple one-to-one assignments betweenbrainstem and motor areas yielding the driving forces
11HVC may receive feedback on a timescale faster than a syllable. The coordination of the HVC hemispheres, for example, occurs on atimescale of 25-50 ms throughout song (Ashmore et al. 2004), and the mechanism effecting that coordination is unknown. Continual feedbackfaster than a syllable is not required for the model in this paper.
12To create the raster plot, we ran the time series using the gij-Tmax relation described in Appendix A. That is: we invoke a neuromodulatorymechanism to commence each syllable. To represent the electrical feedback ceasing each inter-syllable gap, we simply truncated the timeseries.
10

Figure 8: Simulated raster plot of HVCRA PNs and RA PNs over five song renditions, via the connectivity of Figures 6 and 7.Each HVCRA PN is locked to a particular RA PN ensemble. Numberings correspond to the numberings of electrodes in Figure9. HVCRA firings may be compared to the experimental raster plot of Hahnloser et al. (2002): Figure 4, left panel; RA PNfirings may be compared to the experimental raster plot of Figure 10. Note that the firings of specific brainstem neurons aretightly locked to particular temporal instances during song. The spectrogram at top was created via simple assignments tomotor areas (Appendix B), which generated the driving forces for song (Figure 11, left panel).
11

Figure 9: Model schematic with electrodes placed by an experimentor who has inadvertently targeted particular neurons.Numbers on electrodes correspond to vertical neuron numberings on the raster plot of Figure 8.
for song, to be described below in this Section.
Figure 9 shows a schematic indicating the identitiesof neurons numbered 1 - 19 on the raster plot. In Fig-ure 9, electrodes - with corresponding numbers 1 - 19 -have been placed inadvertently by an experimenter intoparticular neurons in HVC, RA, and the brainstem.
The reader may compare the raster plot of the HVCneurons to the sparse bursting found by Hahnloser etal. (2002) (Figure 4, left panel), and that of the RA in-terneurons to Figure 10, reproduced from Leonardo &Fee (2005). Note that the bursts of the two brainstemneurons (18 and 19 in Figure 8) indicate that at least asubpopulation of brainstem neurons should be found tobe tightly locked to certain temporal instances duringsong - or, perhaps more tellingly, to certain discontinu-ities in the time series of driving forces. See SubsectionB for the explicit link between the bursting of the brain-stem neurons 18 and 19 and specific instances duringthe time series of the driving forces.
We note some other features captured by the sim-ulated raster plot, all noted by Leonardo & Fee (2005).First, each HVCRA PN is tightly locked with an ensem-ble of RA PNs upon repeated song renditions. Second,the activity of each RA PN is similar to that of the HVCPNs in that they burst at reliable temporal locations.
Each RA PN, however, bursts multiple times duringeach rendition, and in some cases multiple times withinone syllable. Third, there is little variation in the numberof RA PNs bursting over temporal locations, includinggaps versus syllables.
A. Example driving forces for song
Below the brainstem we assigned simple one-to-one re-lations between each brainstem and particular motororders. The resulting time series of driving forces aredepicted at left in Figure 11. See Appendix B for thecomplete list of instructions used to generate these driv-ing forces.
In the left panel of Figure 11, the third, fourth, andfifth rows are time series of b, f0, and k - the parametersgoverning labial displacement x(t) (first row):
x = y;
y = −kx− cx2 + by− f0 (3)
(Laje et al. 2002). In the second line of Equation 3:the first term on the right side represents restitution,where k is a spring constant with roughly a one-to-onecorrelation with labial tension T. The second term is a
12

Figure 10: Experimental raster plot of RA PNs during song, for comparison with the simulated raster plot of Figure 8.(Reproduced from Leonardo & Fee (2005).)
nonlinear dissipation term associated with the labiameeting each other or the containing walls; we takec = 0.1. The term by is a function of the driving air sacpressure P; P relates one-to-one to b. Finally, the drivingforce f0 is set by adduction or abduction of the syrinx13.
The first row of the left panel in Figure 11 shows the
time series of labial displacement x(t). The second rowshows x(t)P(t), which is roughly representative of anacoustic pressure wave (see Appendix B). The Fouriertransform of x(t)P(t) yielded the spectrogram shown inthe simulated raster plot of Figure 8.
For comparison, at right in Figure 11 are the time se-
13The muscle governing adduction may vary across birds (Vicario 1990, Larsen & Goller 2002, Goller & Suthers 1996), and in this paper wedo not attribute the force f0 to a specific muscle.
13
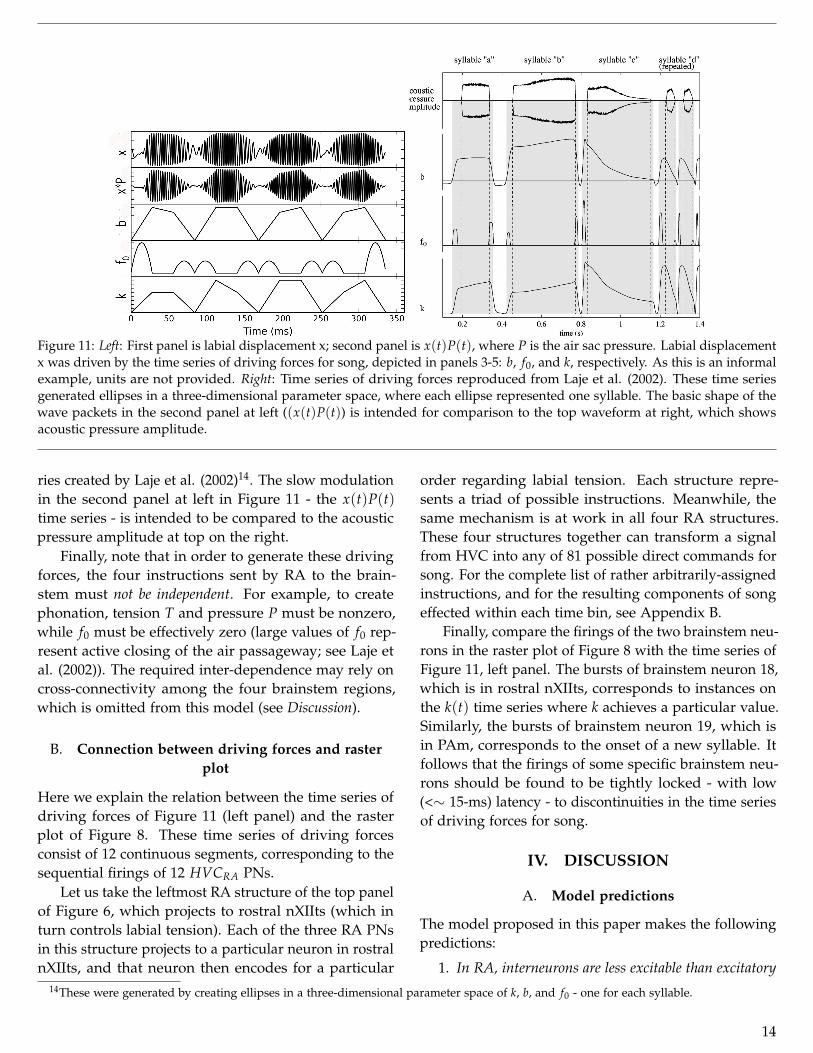
Figure 11: Left: First panel is labial displacement x; second panel is x(t)P(t), where P is the air sac pressure. Labial displacementx was driven by the time series of driving forces for song, depicted in panels 3-5: b, f0, and k, respectively. As this is an informalexample, units are not provided. Right: Time series of driving forces reproduced from Laje et al. (2002). These time seriesgenerated ellipses in a three-dimensional parameter space, where each ellipse represented one syllable. The basic shape of thewave packets in the second panel at left ((x(t)P(t)) is intended for comparison to the top waveform at right, which showsacoustic pressure amplitude.
ries created by Laje et al. (2002)14. The slow modulationin the second panel at left in Figure 11 - the x(t)P(t)time series - is intended to be compared to the acousticpressure amplitude at top on the right.
Finally, note that in order to generate these drivingforces, the four instructions sent by RA to the brain-stem must not be independent. For example, to createphonation, tension T and pressure P must be nonzero,while f0 must be effectively zero (large values of f0 rep-resent active closing of the air passageway; see Laje etal. (2002)). The required inter-dependence may rely oncross-connectivity among the four brainstem regions,which is omitted from this model (see Discussion).
B. Connection between driving forces and rasterplot
Here we explain the relation between the time series ofdriving forces of Figure 11 (left panel) and the rasterplot of Figure 8. These time series of driving forcesconsist of 12 continuous segments, corresponding to thesequential firings of 12 HVCRA PNs.
Let us take the leftmost RA structure of the top panelof Figure 6, which projects to rostral nXIIts (which inturn controls labial tension). Each of the three RA PNsin this structure projects to a particular neuron in rostralnXIIts, and that neuron then encodes for a particular
order regarding labial tension. Each structure repre-sents a triad of possible instructions. Meanwhile, thesame mechanism is at work in all four RA structures.These four structures together can transform a signalfrom HVC into any of 81 possible direct commands forsong. For the complete list of rather arbitrarily-assignedinstructions, and for the resulting components of songeffected within each time bin, see Appendix B.
Finally, compare the firings of the two brainstem neu-rons in the raster plot of Figure 8 with the time series ofFigure 11, left panel. The bursts of brainstem neuron 18,which is in rostral nXIIts, corresponds to instances onthe k(t) time series where k achieves a particular value.Similarly, the bursts of brainstem neuron 19, which isin PAm, corresponds to the onset of a new syllable. Itfollows that the firings of some specific brainstem neu-rons should be found to be tightly locked - with low(<∼ 15-ms) latency - to discontinuities in the time seriesof driving forces for song.
IV. DISCUSSION
A. Model predictions
The model proposed in this paper makes the followingpredictions:
1. In RA, interneurons are less excitable than excitatory14These were generated by creating ellipses in a three-dimensional parameter space of k, b, and f0 - one for each syllable.
14
PNs, via lower resting potential.
2. Each RA ensemble is tightly locked to a particularHVCRA PN.
3. All HVCRA PNs that burst during a syllable and atgap onset extend to both rostral and ventral RA. Thereexists some evidence that certain HVCRA PNs tar-get certain geographical areas in RA (Basista etal. 2014). In particular, some HVC neurons tar-get both dorsal and ventral RA (Kittelberger &Mooney 1997).
4. Following gap onset, HVCRA PN activity continuesthroughout gaps. While at least one HVCRA PN isbursting at each ∼ 10-ms interval, the HVCRA PNsbursting throughout the gap need not target vast re-gions of RA.
5. The relative strengths of synaptic connectionswithin HVC, within RA, HVC-to-RA, and RA-to-brainstem are roughly: 1:10:10:10, respectively. Or:the strengths of couplings affected by neuromodulationin HVC are significantly lower than the strengths ofcouplings downstream.
6. Specific neurons in nXIIts and RAm/PAm should betightly locked to specific instances during song. Thoseinstances should be found to correspond to distinct dis-continuities in the time series of a particular drivingforce for song (air sac pressure P, labial tension T,or adduction force f0), or to activity in PAm or Uvaindicating active signaling to HVC.
7. PAm projects to a region capable of effecting neurmodu-latory control of HVC; for example: VTA.
Regarding point 4 above: our model remains agnos-tic regarding the degree to which the four motor-relatedregions continue to be stimulated by RA throughout agap. Various lines of evidence, however, appear to indi-cate that these four regions are receiving relatively con-tinuous information throughout gaps as well as syllables.As noted, Leonardo & Fee (2005) found all timescales ofthe song to be correlated with just one (the fastest) burst-ing/spiking timescale of RA ensemble activity, and thatthe number of RA PNs bursting per temporal locationwas essentially invariant. In addition, there exists evi-dence that motor areas during song receive essentiallycontinuous instructions. Both inspiration and expira-tion are active processes in songbirds, even during quietbreathing (Fedde et al. 1964). In the syrinx, even when
one (lateral) side is not producing sound, the ipsilateraldorsal syringeal muscles are active to keep the syrinxclosed, and ventral muscles are active on both sides(Wild 1997; Riede & Goller 2010).
On the other hand, Amador et al. (2013) foundthat the number of HVCRA PNs bursting during songincreases at certain instances, including the onsets ofsyllables. In this paper we remain agnostic regardingthe activity of brainstem regions during gaps.
B. Implications for electrical stimulation studies
This model provides a framework within which someof the electrical stimulation studies of Ashmore et al.(2005) can be understood. In that work, during in-stances following HVC stimulation when the currentsyllable truncated and song continued, the subsequentgap lengthened such that the total duration of songremained unchanged.
Within the framework presented in this paper, hereis what occurred. The stimulation disrupted the ventralor rostral RA signal to nXIIts; that is: it disrupted a sig-nal encoding a particular order for either labial tension,adduction, or both. It did not, however, noticeably affectthe signaling to respiratory regions.
Now, in Ashmore et al. (2005), electrical stimula-tion only occassionally resulted in syllable truncationfollowed by motif continuation. In another fraction oftrials, HVC stimulations distorted but did not truncatesyllables; in yet another, the motif was severed entirely.Within the framework of this model, each of those casesrepresents the electrical disruption of a particular subsetof the four parallel pathways from RA to brainstem -and for a particular severity of disruption. In the caseof syllable distortion, for example, pathways leadingto the syrinx were affected, but less severely, than thatrequired for syllable truncation.
We note that the time-bin framework for HVC seemsto imply that without disruption by feedback from PAm,the currently-active configuration in HVC should, uponcompleting a series of HVCRA PN firings, commenceagain from the beginning, replaying the first syllable -until the neurotransmitter concentration governing theinhibitory-to-inhibitory strengths gij drops below somecritical value. Now, Ashmore et al. (2005) found that ina fraction of trials in which PAm stimulation truncatedthe motif, the motif began again from the first syllable.This finding is consistent with the framework presentedin this paper. We do not emphasize this consistencystrongly, however, given that the multiple explanations
15

for motif restart are possible.
C. Scaling the model
It will be interesting to scale the model in terms ofneuron number, to examine the timing framework infiner detail. In the small-scale model for HVC describedin Figure 2, there are three HVCRA neurons firing persyllable-and-gap pair. Here, the first two HVCRA PNssequentially encode two notes of the syllable, and thethird encodes gap onset. That is: all three HVCRA neu-rons are used.
In a configuration with, for example, 30 HVCRA PNsthat fire sequentially, the motif may progress as follows.The first 20 HVCRA PNs encode Syllable 1 - a numberthat may be sufficient to permit probing the relationbetween HVCRA PN and “note” identity. The 20th PNsends a command to terminate phonation and initiatefeedback. Until feedback reaches HVC from PAm, thePNs continue to fire, now encoding in part for the inter-syllable gap that follows Syllable 1. Perhaps HVCRAPNs 21-25th are afforded the chance to fire, before feed-back reaches HVC (and HVCRA PNs 26-30 never fire).There exists evidence that some HVCRA PNs do notburst during adult song (private communication, 2016).
Further, a larger-scale model will permit the exami-nation of an alternative to the framework presented inthis paper wherein each syllable-gap pair is representedby a distinct architecture. Specifically, we are interestedin examining an HVC model that contains one architec-ture that sequentially assumes distinct modes of activity- where each mode encodes the timing for a particularsyllable-gap pair.
D. A concern with the “on”/“off” coordination ofsyllables
We identify a glaring problem with the mechanism forgenerating a full motif with this model. Following aninter-syllable gap, how does the electrical “off” signalto the currently-active configuration in HVC (Figure 3)coincide with a new chemical “on” signal to the ensuingconfiguration (that is: the subsequent syllable)? Recallthat in this model we attribute the former to an elec-trical signal from PAm via Uva, and the latter to somecoordination with a region of the brain capable of mod-ulating neurotransmitter concentrations, such as VTA
- which is known to project to HVC. For our model towork, those two signals must be essentially simultane-ous - or must be separated by no more than ∼ 16 ms -the typical standard deviation of gap duration (Glaze& Troyer 2006). A direct projection from PAm to VTA,for example, would be convenient. One has not beenidentified, but we note that in mammals PAm indirectlyaccesses brainstem regions - specifically: raphe nuclei- that are known to have neurmodulatory effects upondistant CNS regions15.
E. Building cross-connectivity in RA and brainstem
In Figure 11 (with details in Appendix B), we showedhow particular combinations of orders to the brainstemcan result in time series of the driving forces for song: airsac pressure P, labial tension T and adducting force f0.To effect song, these orders cannot be mutually indepen-dent. Meanwhile, we took the four structures in RA thatsignal the brainstem to be unconnected, and those fourbrainstem regions to be unconnected. It is likely thatthose ignored connections play a role in coordinatingthe driving forces.
There exists extensive evidence for dense connec-tions at the brainstem level (e.g. Reinke & Wild 1998,Wild 2004). Indeed, Vicario (1991a) described the identi-fied anatomical connectivities below RA as a “cascade”.This literature has been reviewed by Schmidt & Wild(2014), who emphasized the need to record from andmanipulate distinct brainstem regions during song.
The brainstem region is difficult to target, and forthat reason extremely little is known about neuromod-ulatory processes and receptor dynamics downstreamof RA16 Largely-open questions include: 1) What arethe relative contributions to song structure from RA andfrom the brainstem? 2) What is the role of connectivityacross RA regions? 3) What is the role of connectivitybetween respiratory areas and nXIIts? 4) What are therelative contributions to song output from the nervoussystem versus motor structures? (Regarding this lastquestion, Mindlin (2017b) offers a review.)
Computational modeling of within-brainstem con-nectivity (e.g. Trevisan et al. 2006) may both comple-ment and guide future experimental design to illuminatethese questions. A next step in our work will be to buildupon the model presented in this paper various designs
15On a related note: we are currently examining an alternative framework in which there exists one architecture in all of HVC, rather than asuccession, which repeatedly becomes initiated into different functional configurations.
16See Sturdy et al. (2003) regarding receptor dynamics between RA and brainstem regions, and Kubke et al. (2005) for connections betweenthe respiratory-related brainstem regions and nXIIts.
16

for cross-brainstem and cross-RA connectivity, and toassign various degrees of control to specific regions.Of keen interest is ascertaining the minimum requiredmodel components for creating a synthetic song thatHVC of an awake bird will recognize as bird’s ownsong.
Finally, we have ignored the cross-hemisphere coor-dination that occurs during normal song production (Vuet al. 1998, Ashmore et al. 2008, reviewed by Schmidt& Wild 2014). Birds can sing with just one HVC hemi-sphere (Ashmore et al. 2004), however, and juvenileswith one RA hemisphere destroyed at birth can developnormal song (Ashmore et al. 2008). Lateralization at themotor level has been examined by Suthers et al. (1997),who commented that the degree of coordination is likelyto be highly variable across species. Moreover, a unilat-eral model is justified by the literature, although bilateralmodels offer the opportunity to probe more deeply thecomplex coordinated efforts of the CNS, in addition toidentifying processes that represent redundancy.
F. The pressure-tension relation andsynchronization
Finally, we comment on studies of pressure-tension tra-jectories and of synchronization in the song motor path-way, neither of which our model addresses.
Amador et al. (2013) found that both HVCRA PNand HVC interneuron activity was synchronized withmotor instances called gestures. A gesture (Gardneret al. 2001) is a relatively continuous trajectory in theparameter space defined by air sac pressure P(t) andlabial tension T(t), and within the gesture frameworksong generation is described dynamically in terms ofthe relation between these quantities. Further, Amadoret al. (2013) found that onsets and offsets of gesturescorrelated - with near-zero latency - with both HVCRAPN and interneuron activity. Those authors took thisfinding as an apparent violation of causality if one isto assume the “clock model” - in which timing in themotor pathway is set by a simple underlying clock.
Regardless of the significance of these gesture ex-trema: the synchronization observed by Amador et al.(2013) is not necessarily a problem for causality. It hasbeen shown that a dynamical system, once initiated,
may rapidly converge to an attractor state. Such a phe-nomenon has been modeled as ”anticipated synchro-nization” (Matias et al. 2011; Matias et al. 2015).
Within the context of the songbird, anticipated syn-chronization works as follows (Yu & Margoliash 1996).During the introductory notes that precede the motif,the sequence of events throughout the motor pathwayindeed reflects the time delays set by causally-relatedregions. By the time of onset of the actual motif, how-ever, these regions have become synchronized. That is:a connectivity such as that described in this paper isrequired to initiate song, but it may be dispensed withfor some duration thereafter, once the attractor state isreached.
In future modeling, we will examine: 1) implica-tions regarding relationships among P and T and otherpossibly-significant dynamical quantities; 2) the synapticconnections that may be required to incite synchroniza-tion in the song motor pathway.
V. LOOKING FORWARD
In closing, we pose questions that may be probed via acombination of computation modeling and the designof new experiments. 1) At what geographical location(s)in the song motor pathway does “note” acquire defi-nition? 2) Can a note be further divided? 3) How docross-brainstem and inter-hemisphere connectivity af-fect acoustic output? 4) Which CNS regions must becausally connected (via electrical synapses) in order toincite the synchronization of distinct nuclei during song?5) How biophysically detailed must a neuronal networkmodel be in order to produce synthetic songs that ananimal of the species will recognize? We look forwardto expanding the simple model set forth in this paper,to determine whether it proves useful for probing thesefascinating problems.
VI. ACKNOWLEDGEMENTS
Thank you to Marc Schmidt for invaluable guidance inshaping this paper. Thanks also to Franz Goller, An-thony Leonardo, Daniel Margoliash, Gabriel Mindlin,Ofer Tchernichovski, and Martin Wild for informativeconversations.
References
[1] Abarbanel, H. D., Gibb, L., Mindlin, G. B., and Talathi, S. Mapping neural architectures onto acousticfeatures of birdsong. Journal of neurophysiology 92, 1 (2004), 96–110.
17

[2] Albert, C. Y., and Margoliash, D. Temporal hierarchical control of singing in birds. Science 273, 5283 (1996),1871.
[3] Alonso, R. G., Amador, A., and Mindlin, G. B. An integrated model for motor control of song in serinuscanaria. Journal of Physiology-Paris (2016).
[4] Alonso, R. G., Trevisan, M. A., Amador, A., Goller, F., and Mindlin, G. B. A circular model for song motorcontrol in serinus canaria. Frontiers in computational neuroscience 9 (2015).
[5] Amador, A., and Mindlin, G. B. Beyond harmonic sounds in a simple model for birdsong production. Chaos:An Interdisciplinary Journal of Nonlinear Science 18, 4 (2008), 043123.
[6] Amador, A., Perl, Y. S., Mindlin, G., and Margoliash, D. Elemental gesture dynamics are encoded by songpremotor cortical neurons. Nature 495, 7439 (2013), 59.
[7] Andalman, A. S., Foerster, J. N., and Fee, M. S. Control of vocal and respiratory patterns in birdsong:dissection of forebrain and brainstem mechanisms using temperature. PLoS One 6, 9 (2011), e25461.
[8] Armstrong, E., and Abarbanel, H. D. Model of the songbird nucleus hvc as a network of central patterngenerators. Journal of neurophysiology 116, 5 (2016), 2405–2419.
[9] Aronov, D., Andalman, A. S., and Fee, M. S. A specialized forebrain circuit for vocal babbling in the juvenilesongbird. Science 320, 5876 (2008), 630–634.
[10] Ashmore, R. C., Bourjaily, M., and Schmidt, M. F. Hemispheric coordination is necessary for song productionin adult birds: implications for a dual role for forebrain nuclei in vocal motor control. Journal of neurophysiology99, 1 (2008), 373–385.
[11] Ashmore, R. C., Wild, J. M., and Schmidt, M. F. Brainstem and forebrain contributions to the generation oflearned motor behaviors for song. Journal of Neuroscience 25, 37 (2005), 8543–8554.
[12] Basista, M. J., Elliott, K. C., Wu, W., Hyson, R. L., Bertram, R., and Johnson, F. Independent premotorencoding of the sequence and structure of birdsong in avian cortex. Journal of Neuroscience 34, 50 (2014),16821–16834.
[13] Beckers, G. J., Suthers, R. A., and Ten Cate, C. Pure-tone birdsong by resonance filtering of harmonicovertones. Proceedings of the National Academy of Sciences 100, 12 (2003), 7372–7376.
[14] Bottjer, S., Miesner, E. A., and Arnold, A. P. Forebrain lesions disrupt development but not maintenance ofsong in passerine birds. Science 224 (1984), 901–904.
[15] Brainard, M. S., and Doupe, A. J. What songbirds teach us about learning. Nature 417, 6886 (2002), 351–358.
[16] Cannon, J., Kopell, N., Gardner, T., and Markowitz, J. Neural sequence generation using spatiotemporalpatterns of inhibition. PLoS Comput Biol 11, 11 (2015), e1004581.
[17] Daou, A., Ross, M. T., Johnson, F., Hyson, R. L., and Bertram, R. Electrophysiological characterization andcomputational models of hvc neurons in the zebra finch. Journal of neurophysiology 110, 5 (2013), 1227–1245.
[18] Destexhe, A., Mainen, Z. F., and Sejnowski, T. J. Synthesis of models for excitable membranes, synaptictransmission and neuromodulation using a common kinetic formalism. Journal of computational neuroscience 1, 3(1994), 195–230.
[19] Destexhe, A., and Sejnowski, T. J. Thalamocortical assemblies: How ion channels, single neurons andlarge-scale networks organize sleep oscillations.
18

[20] Elemans, C. P., Mead, A. F., Rome, L. C., and Goller, F. Superfast vocal muscles control song production insongbirds. PloS one 3, 7 (2008), e2581.
[21] Fedde, M., Burger, R. E., and Kitchell, R. Electromyographic studies of the effects of bodily position andanesthesia on the activity of the respiratory muscles of the domestic cock. Poultry Science 43, 4 (1964), 839–846.
[22] Fee, M. S., Kozhevnikov, A. A., and Hahnloser, R. H. Neural mechanisms of vocal sequence generation inthe songbird. Annals of the New York Academy of Sciences 1016, 1 (2004), 153–170.
[23] Fee, M. S., Shraiman, B., Pesaran, B., and Mitra, P. P. The role of nonlinear dynamics of the syrinx in thevocalizations of a songbird. Nature 395, 6697 (1998), 67.
[24] Gale, S. D., and Perkel, D. J. Physiological properties of zebra finch ventral tegmental area and substantianigra pars compacta neurons. Journal of neurophysiology 96, 5 (2006), 2295–2306.
[25] Gardner, T., Cecchi, G., Magnasco, M., Laje, R., and Mindlin, G. B. Simple motor gestures for birdsongs.Physical review letters 87, 20 (2001), 208101.
[26] Gibb, L., Gentner, T. Q., and Abarbanel, H. D. Inhibition and recurrent excitation in a computational modelof sparse bursting in song nucleus hvc. Journal of neurophysiology 102, 3 (2009a), 1748–1762.
[27] Gibb, L., Gentner, T. Q., and Abarbanel, H. D. Brain stem feedback in a computational model of birdsongsequencing. Journal of neurophysiology 102, 3 (2009b), 1763–1778.
[28] Glaze, C. M., and Troyer, T. W. Temporal structure in zebra finch song: implications for motor coding. Journalof Neuroscience 26, 3 (2006), 991–1005.
[29] Goller, F., and Suthers, R. A. Role of syringeal muscles in gating airflow and sound production in singingbrown thrashers. Journal of Neurophysiology 75, 2 (1996), 867–876.
[30] Hahnloser, R. H., Kozhevnikov, A. A., and Fee, M. S. An ultra-sparse code underlies the generation of neuralsequences in a songbird. Nature 419, 6902 (2002), 65.
[31] Hamaguchi, K., and Mooney, R. Recurrent interactions between the input and output of a songbird cortico-basal ganglia pathway are implicated in vocal sequence variability. Journal of Neuroscience 32, 34 (2012),11671–11687.
[32] Izhikevich, E. M. Dynamical systems in neuroscience. MIT press, 2007.
[33] Jensen, K. K., Cooper, B. G., Larsen, O. N., and Goller, F. Songbirds use pulse tone register in two voices togenerate low-frequency sound. Proceedings of the Royal Society of London B: Biological Sciences 274, 1626 (2007),2703–2710.
[34] Kittelberger, M., and Mooney, R. Individual hvc axons innervate ra subdomains that control temporal andspectral elements of learned song. In Soc Neurosci Abstr (1997), vol. 23.
[35] Kosche, G., Vallentin, D., and Long, M. A. Interplay of inhibition and excitation shapes a premotor neuralsequence. Journal of Neuroscience 35, 3 (2015), 1217–1227.
[36] Kozhevnikov, A. A., and Fee, M. S. Singing-related activity of identified hvc neurons in the zebra finch. Journalof neurophysiology 97, 6 (2007), 4271–4283.
[37] Kubota, M., and Saito, N. Nmda receptors participate differentially in two different synaptic inputs in neuronsof the zebra finch robust nucleus of the archistriatum in vitro. Neuroscience letters 125, 2 (1991), 107–109.
[38] Laje, R., Gardner, T. J., and Mindlin, G. B. Neuromuscular control of vocalizations in birdsong: a model.Physical Review E 65, 5 (2002), 051921.
19

[39] Larsen, O. N., and Goller, F. Direct observation of syringeal muscle function in songbirds and a parrot.Journal of Experimental Biology 205, 1 (2002), 25–35.
[40] Leonardo, A., and Fee, M. S. Ensemble coding of vocal control in birdsong. Journal of Neuroscience 25, 3 (2005),652–661.
[41] Lewandowski, B., Vyssotski, A., Hahnloser, R. H., and Schmidt, M. At the interface of the auditory andvocal motor systems: Nif and its role in vocal processing, production and learning. Journal of Physiology-Paris107, 3 (2013), 178–192.
[42] Li, M., and Greenside, H. Stable propagation of a burst through a one-dimensional homogeneous excitatorychain model of songbird nucleus hvc. Physical Review E 74, 1 (2006), 011918.
[43] Long, M. A., Jin, D. Z., and Fee, M. S. Support for a synaptic chain model of neuronal sequence generation.Nature 468, 7322 (2010), 394–399.
[44] Lynch, G. F., Okubo, T. S., Hanuschkin, A., Hahnloser, R. H., and Fee, M. S. Rhythmic continuous-timecoding in the songbird analog of vocal motor cortex. Neuron 90, 4 (2016), 877–892.
[45] Margoliash, D. Functional organization of forebrain pathways for song production and perception. Develop-mental Neurobiology 33, 5 (1997), 671–693.
[46] Matias, F. S., Carelli, P. V., Mirasso, C. R., and Copelli, M. Anticipated synchronization in a biologicallyplausible model of neuronal motifs. Physical Review E 84, 2 (2011), 021922.
[47] Matias, F. S., Carelli, P. V., Mirasso, C. R., and Copelli, M. Self-organized near-zero-lag synchronizationinduced by spike-timing dependent plasticity in cortical populations. PloS one 10, 10 (2015), e0140504.
[48] McLean, J., Bricault, S., and Schmidt, M. F. Characterization of respiratory neurons in the rostral ventrolateralmedulla, an area critical for vocal production in songbirds. Journal of neurophysiology 109, 4 (2013), 948–957.
[49] Mindlin, G. B. Nonlinear dynamics in the study of birdsong. Chaos: An Interdisciplinary Journal of NonlinearScience 27, 9 (2017a), 092101.
[50] Mindlin, G. B. Avian vocal production beyond low dimensional models. Journal of Statistical Mechanics: Theoryand Experiment 2017, 2 (2017b), 024005.
[51] Mooney, R. Neurobiology of song learning. Current opinion in neurobiology 19, 6 (2009), 654–660.
[52] Mooney, R., and Konishi, M. Two distinct inputs to an avian song nucleus activate different glutamate receptorsubtypes on individual neurons. Proceedings of the National Academy of Sciences 88, 10 (1991), 4075–4079.
[53] Nottebohm, F., Stokes, T. M., and Leonard, C. M. Central control of song in the canary, serinus canarius.Journal of Comparative Neurology 165, 4 (1976), 457–486.
[54] Perl, Y. S., Arneodo, E. M., Amador, A., Goller, F., and Mindlin, G. B. Reconstruction of physiologicalinstructions from zebra finch song. Physical Review E 84, 5 (2011), 051909.
[55] Picardo, M. A., Merel, J., Katlowitz, K. A., Vallentin, D., Okobi, D. E., Benezra, S. E., Clary, R. C.,Pnevmatikakis, E. A., Paninski, L., and Long, M. A. Population-level representation of a temporal sequenceunderlying song production in the zebra finch. Neuron 90, 4 (2016), 866–876.
[56] Reinke, H., and Wild, J. Identification and connections of inspiratory premotor neurons in songbirds andbudgerigar. Journal of Comparative Neurology 391, 2 (1998), 147–163.
[57] Riede, T., and Goller, F. Peripheral mechanisms for vocal production in birds–differences and similarities tohuman speech and singing. Brain and language 115, 1 (2010), 69–80.
20

[58] Roberts, T. F., Klein, M. E., Kubke, M. F., Wild, J. M., and Mooney, R. Telencephalic neurons monosynapticallylink brainstem and forebrain premotor networks necessary for song. Journal of Neuroscience 28, 13 (2008), 3479–3489.
[59] Schmidt, M. F., Ashmore, R. C., and Vu, E. T. Bilateral control and interhemispheric coordination in the aviansong motor system. Annals of the New York Academy of Sciences 1016, 1 (2004), 171–186.
[60] Schmidt, M. F., and Wild, J. M. The respiratory-vocal system of songbirds: anatomy, physiology, and neuralcontrol. Progress in brain research 212 (2014), 297.
[61] Simpson, H. B., and Vicario, D. S. Brain pathways for learned and unlearned vocalizations differ in zebrafinches. Journal of Neuroscience 10, 5 (1990), 1541–1556.
[62] Sitt, J., Amador, A., Goller, F., and Mindlin, G. Dynamical origin of spectrally rich vocalizations in birdsong.Physical Review E 78, 1 (2008), 011905.
[63] Spiro, J. E., Dalva, M. B., and Mooney, R. Long-range inhibition within the zebra finch song nucleus ra cancoordinate the firing of multiple projection neurons. Journal of neurophysiology 81, 6 (1999), 3007–3020.
[64] Striedter, G., and Vu, E. Bilateral feedback projections to the forebrain in the premotor network for singing inzebra finches. Developmental Neurobiology 34, 1 (1998), 27–40.
[65] Suthers, R. A. Peripheral control and lateralization of birdsong. Developmental Neurobiology 33, 5 (1997),632–652.
[66] Trevisan, M. A., Mindlin, G. B., and Goller, F. Nonlinear model predicts diverse respiratory patterns ofbirdsong. Physical review letters 96, 5 (2006), 058103.
[67] Vallentin, D., Kosche, G., Lipkind, D., and Long, M. A. Inhibition protects acquired song segments duringvocal learning in zebra finches. Science 351, 6270 (2016), 267–271.
[68] Vates, G. E., Broome, B. M., Mello, C. V., and Nottebohm, F. Auditory pathways of caudal telencephalonand their relation to the song system of adult male zebra finches (taenopygia guttata). Journal of ComparativeNeurology 366, 4 (1996), 613–642.
[69] Verduzco-Flores, S. O., Bodner, M., and Ermentrout, B. A model for complex sequence learning andreproduction in neural populations. Journal of computational neuroscience 32, 3 (2012), 403–423.
[70] Vicario, D. S. Organization of the zebra finch song control system: functional organization of outputs fromnucleus robustus archistriatalis. Journal of Comparative Neurology 309, 4 (1991a), 486–494.
[71] Vicario, D. S. Contributions of syringeal muscles to respiration and vocalization in the zebra finch. Develop-mental Neurobiology 22, 1 (1991b), 63–73.
[72] Vu, E. T., Mazurek, M. E., and Kuo, Y.-C. Identification of a forebrain motor programming network for thelearned song of zebra finches. Journal of Neuroscience 14, 11 (1994), 6924–6934.
[73] Wild, J. Pulmonary and tracheosyringeal afferent inputs to the avian song system. In Seventh Congress of theInternational Society for Neuroethology, Nyborg, Denmark (2004), p. 070.
[74] Wild, J., Goller, F., and Suthers, R. Inspiratory muscle activity during bird song. Journal of neurobiology 36, 3(1998), 441.
[75] Wild, J., Li, D., and Eagleton, C. Projections of the dorsomedial nucleus of the intercollicular complex (dm)in relation to respiratory-vocal nuclei in the brainstem of pigeon (columba livia) and zebra finch (taeniopygiaguttata). Journal of Comparative Neurology 377, 3 (1997), 392–413.
21

[76] Wild, J. M. Descending projections of the songbird nucleus robustus archistriatalis. Journal of ComparativeNeurology 338, 2 (1993a), 225–241.
[77] Wild, J. M. The avian nucleus retroambigualis: a nucleus for breathing, singing and calling. Brain research 606,2 (1993b), 319–324.
[78] Wild, J. M. Neural pathways for the control of birdsong production. Developmental Neurobiology 33, 5 (1997),653–670.
[79] Yildiz, I. B., and Kiebel, S. J. A hierarchical neuronal model for generation and online recognition of birdsongs.PLoS Computational Biology 7, 12 (2011), e1002303.
VII. Appendix A: Mechanism for HVC-RA andRA-to-brainstem interactions
Here we present details regarding the mechanism bywhich an HVCRA PN recruits an ensemble of RA PNs,and how those RA PNs in turn recruit brainstem neu-rons. This procedure was used to generate the rasterplot of Figure 8.
A. RA electrophysiology and connectivityreproduce observed RA activity during quiescence.
As described in Model, RA contains four identical struc-tures, represented in Figure 12. We first mimic quies-cence in RA immediately prior to and following a song.Here the excitatory and inhibitory populations receive alow background excitation but no direct excitation fromHVC, and the interneurons are rendered less excitablethan the RA PNs, via the reversal potential of leak cur-rent (EL,i and EL,e are -85 and -80 mV, respectively).
Figure 13 shows the resulting voltage traces for oneof the four structures in RA. Numberings correspondto the numberings on the schematic of Figure 12: threeinhibitory neurons (Cells 0, 1, and 2) at left, and threeexcitatory PNs (3, 4, and 5) at right. The former aresilent above threshold, while the latter spike or burstcontinually.
B. HVC RA PNs recruit RA PN ensembles byexciting RA interneurons.
Now we demonstrate how an excitatory signal from anHVCRA neuron directly excites an RA interneuron, andhow that interneuron in turn suppresses a fraction ofthe RA PNs17.
Let us take as an example the top panel of the HVC-to-RA connectivity diagram of Figure 6, which corre-
sponds to Syllable a and the subsequent gap. Within thatpanel, let us take the interaction between the HVCRAFHU and the leftmost RA structure. Note that HVCRAneurons 3 and 4 directly excite RA interneuron 0. Figure14 shows the voltage traces of the six RA neurons shownpreviously in quiescence, now when connectivity fromHVC is turned on. RA interneuron 0 is now bursting.
The top panel of Figure 15 elucidates this mecha-nism. Here, the colorings on the voltage traces (left)correspond to the colorings of the schematics at right.The burst of either HVC 3 (blue) or HVC 4 (cyan) incitesa burst from RA 0 (magenta).
The middle panel of Figure 15 shows the effect of aburst from RA interneuron 0 upon the RA PNs withinthat structure. Given the inhibitory projections of RAinterneuron 0 to RA PNs 3 and 5 - but not to RA PN4: while RA interneuron 0 bursts, the bursting of RAPN 3 and RA PN 5 is suppressed - and the bursting ofRA PN 4 is permitted. Further, recall that each HVCRAPN has such a relationship with an interneuron in foursuch structures identical to that depicted in Figure 12.It is in this way that each HVC PN - via interneuronconnectivity - selects an ensemble of RA PNs.
Figure 12: One of four identical six-neuron structures in RA.Numbering corresponds to numbers on voltage traces in Fig-ure 13.
17Here we hold the inhibitory-to-inhibitory couplings gij in HVC at constant elevated values, in order to demonstrate the robustness of theresulting relationship between HVC and RA activity. That is: here we are not invoking the gij-Tmax relation that was used to construct theraster plot.
22

Figure 13: Activity of RA interneurons and excitatory projection neurons during quiescence, when the HVCRA PN populationis inactive. The RA interneurons possess a lower leak reversal potential than do the RA PNs: -85 vs -80 mV, respectively.Consequently, when all six neurons receive the same background excitation, the interneurons are silent and the RA PNs areactive. Numbering corresponds to numbers on schematic of Figure 12.
Figure 14: Activity of RA interneurons and excitatory projection neurons when HVCRA PNs 3 and 4 directly excite RAinterneuron 0. RA interneuron 0 now bursts.
C. The four distinct RA structures send four ∼simultaneous signals to four distinct brainstem
regions.
In the final stage of the computational model, a brain-stem neuron is excited. The bottom panel of Figure 15is a summary. Here, HVCRA neurons 3 and 4 (blue andcyan) excite RA interneuron 0 (magenta), which sup-presses RA PNs 3 and 5 (green and black), but permitsRA PN 4 (yellow) to burst. RA PN 4 then excites aneuron in the brainstem (black).
VIII. Appendix B: Creating the examplebrainstem-to-motor connectivity and driving
forces for song
A. Brainstem assignments for creating the drivingforces for song
As noted in Results, we assigned each of the three RAPNs in each of the four RA structures a particular orderfor its associated brainstem neuron. These assignmentsare as follows.
For the three RA PNs in the RA structure that sendsinstructions to rostral nXIIts (leftmost in Figure 6), re-spectively: 1) “Effect Tension Value 1”; 2) “Effect TensionValue 2”; 3) “Set labia at resting locations (Tension =
0)”.For the three RA PNs in the RA structure projecting
to caudal nXIIts (second from left in Figure 6): 1) “Effect
23

Figure 15: Three events. Top: HVCRA PNs 3 and 4 directly excite RA interneuron 0. Middle: RA interneuron 0 then suppressesRA PNs 3 and 5, but not RA PN 4. Bottom: Summary. HVCRA PNs 3 and 4 excite RA interneuron 0, which permits only RAPN 4 (and not 3 or 5) to fire. Finally, RA PN 4 directly excites a neuron in the brainstem.
24
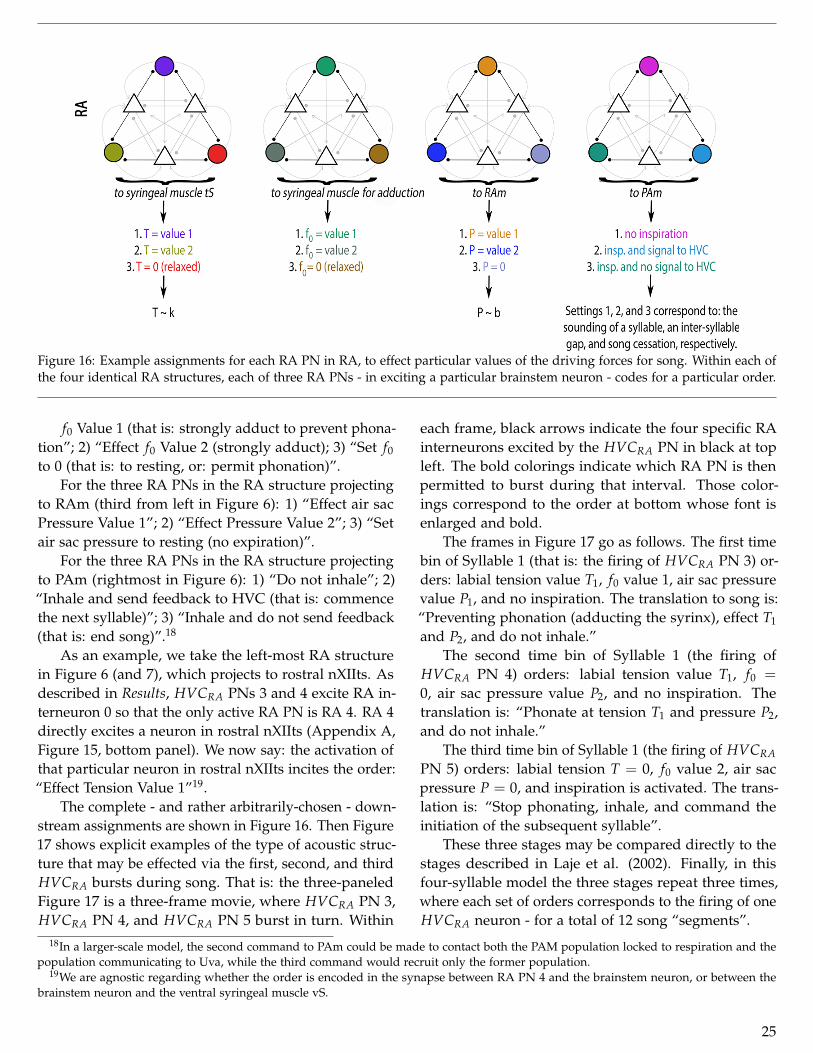
Figure 16: Example assignments for each RA PN in RA, to effect particular values of the driving forces for song. Within each ofthe four identical RA structures, each of three RA PNs - in exciting a particular brainstem neuron - codes for a particular order.
f0 Value 1 (that is: strongly adduct to prevent phona-tion”; 2) “Effect f0 Value 2 (strongly adduct); 3) “Set f0
to 0 (that is: to resting, or: permit phonation)”.For the three RA PNs in the RA structure projecting
to RAm (third from left in Figure 6): 1) “Effect air sacPressure Value 1”; 2) “Effect Pressure Value 2”; 3) “Setair sac pressure to resting (no expiration)”.
For the three RA PNs in the RA structure projectingto PAm (rightmost in Figure 6): 1) “Do not inhale”; 2)“Inhale and send feedback to HVC (that is: commencethe next syllable)”; 3) “Inhale and do not send feedback(that is: end song)”.18
As an example, we take the left-most RA structurein Figure 6 (and 7), which projects to rostral nXIIts. Asdescribed in Results, HVCRA PNs 3 and 4 excite RA in-terneuron 0 so that the only active RA PN is RA 4. RA 4directly excites a neuron in rostral nXIIts (Appendix A,Figure 15, bottom panel). We now say: the activation ofthat particular neuron in rostral nXIIts incites the order:“Effect Tension Value 1”19.
The complete - and rather arbitrarily-chosen - down-stream assignments are shown in Figure 16. Then Figure17 shows explicit examples of the type of acoustic struc-ture that may be effected via the first, second, and thirdHVCRA bursts during song. That is: the three-paneledFigure 17 is a three-frame movie, where HVCRA PN 3,HVCRA PN 4, and HVCRA PN 5 burst in turn. Within
each frame, black arrows indicate the four specific RAinterneurons excited by the HVCRA PN in black at topleft. The bold colorings indicate which RA PN is thenpermitted to burst during that interval. Those color-ings correspond to the order at bottom whose font isenlarged and bold.
The frames in Figure 17 go as follows. The first timebin of Syllable 1 (that is: the firing of HVCRA PN 3) or-ders: labial tension value T1, f0 value 1, air sac pressurevalue P1, and no inspiration. The translation to song is:“Preventing phonation (adducting the syrinx), effect T1
and P2, and do not inhale.”The second time bin of Syllable 1 (the firing of
HVCRA PN 4) orders: labial tension value T1, f0 =
0, air sac pressure value P2, and no inspiration. Thetranslation is: “Phonate at tension T1 and pressure P2,and do not inhale.”
The third time bin of Syllable 1 (the firing of HVCRAPN 5) orders: labial tension T = 0, f0 value 2, air sacpressure P = 0, and inspiration is activated. The trans-lation is: “Stop phonating, inhale, and command theinitiation of the subsequent syllable”.
These three stages may be compared directly to thestages described in Laje et al. (2002). Finally, in thisfour-syllable model the three stages repeat three times,where each set of orders corresponds to the firing of oneHVCRA neuron - for a total of 12 song “segments”.
18In a larger-scale model, the second command to PAm could be made to contact both the PAM population locked to respiration and thepopulation communicating to Uva, while the third command would recruit only the former population.
19We are agnostic regarding whether the order is encoded in the synapse between RA PN 4 and the brainstem neuron, or between thebrainstem neuron and the ventral syringeal muscle vS.
25

Figure 17: A three-frame movie illustrating examples of the first three time-bins of a motif - controlled by a burst from HVCRAPN 3, HVCRA PN 4, and HVCRA PN 5, respectively. In each frame, black arrows indicate the four particular RA interneuronsexcited by the HVCRA PN in black at top left. Then the bold colorings indicate which RA PN is permitted to burst during thatinterval. Those colorings correspond to the order at bottom whose font is enlarged and bold.
26

B. Translating the driving forces into an examplespectrogram
Extensive modeling has been done of the syrinx and vo-cal tract, and of the role that the syrinx plays in creatingthe spectral content of sound (Gardner et al. 2001, Sittet al. 2008, Amador & Mindlin 2008, Riede & Goller2010, Fee et al. 1998, Elemans et al. 2008, Mindlin 2017a,Mindlin 2017b, Beckers et al. 2003, Jensen et al. 2007).To create the spectrogram depicted at top in Figure 8,we employed an existing model for the displacement ofthe labia from resting location (Equation 3.
Perl et al. (2011) then added to this basic model atract and Helmholtz oscillator to represent the tracheaand oropharyngeal cavity, respectively. This model wasused by Amador et al. (2013) to create synthetic soundsthat were recognized as BOS playback by HVC of awakebirds. Now, our model driving forces were not derivedformally, and for that reason we considered it excessiveto filter the air sac pressure through a biophysically-realistic vocal tract in order to produce a spectrogram.To produce the spectrogram of Figure 8, then, we tookthe Fourier transform of x(t)P(t), which roughly corre-sponds to the output acoustic pressure wave (Perl et al.2011).
IX. Appendix C: Complete equations ofmotion and parameter values
A. Ion channel gating variables
The gating variables Ui(t) = [n f ,i(t), ns,i(t)], which gov-ern the fast and slow potassium current, respectively,
satisfy:
dUi(t)dt
= (U∞(Vi(t))−Ui(t))/tU0;
U∞(Vi) = 0.5[1 + tanh((Vi − θU,i)/σU,i)]
.
The gating variable for INaP, min f ,i, is treated as instan-taneous: 0.5[1 + tanh((Vi − θm,i)/σm,i).
B. Synapse gating variables
The synapse gating variables sij, for the synapse enteringcell i from cell j, evolve as:
dsij(t)dt
= α(Tmax(t), Vj(t))[1− sij(t)]− βsij(t),
where α is taken to be a function of the maximum neu-rotransmitter concentration Tmax(t):
α(Tmax(t), Vj(t)) =Tmax/T0
1 + exp(−(Vj(t)−VP)/KP).
For the examples in which Tmax was held static (in or-der to demonstrate the robustness of the firings betweenHVC, RA, and brainstem), Tmax for all connections washeld at a value of 2 mMol. To create the raster plotof Figure 8, the gij-Tmax relation of Armstrong & Abar-banel (2016) was invoked. Within that framework, theinhibitory-to-inhibitory strengths during active modeare of order 1.0 µSiemen; see Armstrong & Abarbane;(2016) for details and for the specific form of Tmax(t).
C. Cellular parameters
HVCThe four FSUs are identical and receive a backgroundinjected current of 7.88 nA (nano-Amperes). Table 1 liststhe cellular parameters.
27

Quantity Cell 0 Cell 1 Cell 2 Cell 3 Cell 4 Cell 5 [unit]
gL 8. 8. 8. 8. 8. 8. [µS]gNa 20. 20. 20. 20. 20. 20. [µS]gK,s 9. 9. 9. 9. 9. 9. [µS]gK, f 4.95. 4.93 4.94 4.92 4.935 4.942 [µS]EL -80.07 -80.06 -80.07 -80.07 -80.05 -80.06 [mV]ENa 60. 60. 60. 60. 60.5 60.5 [mV]EK -90. -90. -90. -90. -90.5 -90.5 [mV]θm -20. -20. -20. -20. -20. -20. [mV]σm 30. 30. 30. 30. 30. 30. [mV]θn, f -25. -25. -25. -25. -25. -25. [mV]σn, f 10. 10. 10. 10. 10. 10. [mV]tn, f 0.152 0.152 0.152 0.152 0.152 0.152 [ms]θn,s -20. -20. -20. -20. -20. -20. [mV]σn,s 5. 5. 5. 5. 5. 5. [mV]tn,s -20. -20. -20. -20. -20. -20. [ms]C 1. 1. 1. 1. 1. 1. [µF]
Table 1: Parameter values for six cells in an FHU of HVC. All four FHUs in the model presented in this paper are identical interms of these values. Units: mV, millivolts; ms, milliseconds; µF, micro-Farads; µS, micro-Siemens.
RAThe four six-neuron structures in RA are identical, andeach receives a background current of 7.81 nA (99 percent the value of background current injected to HVC).The cellular parameters for the RA structures are iden-tical to those listed above for an FHU in HVC, exceptthat the leak reversal potentials EL for the interneurons(Cells 0, 1, and 2) are: -85.0 mV, rather than -80.0 mV forthe excitatory PNs.
BrainstemThe cellular parameters for each of the four brainstemneurons are identical to those of RA PN 5 (and hencealso HVCRA PN 5).
Cell 0 1 2 3 4 5
0 0. -83. -83.3 0. 0. 0.1 -82.7 0. -82.5 0. 0. 0.2 -83.2 -82.9 0. 0. 0. 0.3 -83.0 -83.0 -83.0 0. 0. 0.4 -83.0 -83.0 -83.0 0. 0. 0.5 -83.0 -83.0 -83.0 0. 0. 0.
Table 2: Synaptic reversal potentials Eij, for the synapse en-tering cell i from cell j. Units: mV.
D. Synapse parameters
The parameters Eij, αij, and βij, for each six-cell structurein both HVC and RA, are listed in Tables 2, 3, and 4,respectively.
Cell 0 1 2 3 4 5
0 1. 1. 1.1 2.2 2.2 2.21 1.05 1. 1.9 2.2 2.2 2.22 1.2 1.8 1. 2.2 2.2 2.23 1.0 1.0 1.0 2. 2. 2.4 1.0 1.0 1.0 2. 2. 2.5 1.0 1.0 1.0 2. 2. 2.
Table 3: Parameters αij, for the synapse entering cell i fromcell j. Units: mMol−1ms−1.
Cell 0 1 2 3 4 5
0 0. 0.18 0.181 0.38 0.38 0.381 0.182 0. 0.179 0.38 0.38 0.382 0.178 0.183 0. 0.38 0.38 0.383 0.18 0.18 0.18 0.38 0.38 0.384 0.18 0.18 0.18 0.38 0.38 0.385 0.18 0.18 0.18 0.38 0.38 0.38
Table 4: Parameters βij, for the synapse entering cell i fromcell j. Units: ms−1.
For the connections between RA and brainstem neu-rons, the values of Eij, αij, and βij were taken for anexcitatory-to-excitatory connection. We arbitrarily chosethe values for a synapse entering cell 3 from cell 5.
For an HVC FHU during active mode
For the gij-Tmax relation governing the inhibitory-to-inhibitory connections (among Cells 0, 1, and 2), theparameters Vp and Kp are:
28

Cell 0 1 2 [unit]
Vp 2. 2.01 2.03 [mV]Kp 5.0 5.01 4.8 [mV]
For all other connections: Vp = 2. mV; Kp = 5. mV;Tmax = 2.0 mM.
Strengths of static synaptic connections
In HVC: the excitatory-to-inhibitory, and inhibitory-to-excitatory synapse strengths are: 1.0 and 2.5 µS, respec-tively. In RA: within each of the four RA structures(of Figure 5), the inhibitory-to-excitatory connections- which are critical for the model operation - are 10.0µS. For cross-connectivity from HVC-to-RA and fromRA-to-brainstem: the synapse strengths are 10 µS.
29