computational model for chloride concentration at surface ... · computational model for chloride...
TRANSCRIPT

Computational Model for Chloride Concentration at Surface of Concrete Under Actual Environmental Condition
Supakit Swatekititham
A dissertation submitted to Kochi University of Technology
In partial fulfillment of the requirements for the degree of Doctor of Engineering
Infrastructure Systems Engineering Course Kochi University of Technology
Kochi, Japan
March 2004

Computational Model for Chloride Concentration at Surface of Concrete Under Actual Environmental Condition
Supakit Swatekititham
B.Eng. (Sirindhorn International Institute of Technology, Thailand) 1999 M. Eng. (Kochi University of Technology, Japan) 2001
A dissertation submitted In partial fulfillment of the requirements for the degree of
Doctor of Engineering in the
Graduate School of Engineering on the
Kochi University of Technology
Examination Committee: Professor Hajime Okamura Processor Shinsuke Nakata
Professor Nobumitsu Fujisawa Professor Hiroshi Shima Assoc. Professor Masahiro Ouchi
March 2004

Acknowledgement
I extend my sincere gratitude and appreciation to many people who made this thesis
possible. Special thanks are to my supervisors Professor Hajime Okamura for his
valuable advice, discussion, and inspection all the way through this research work. My
intens ive appreciation would be presented to him for encouragement from the beginning of
my Master thesis until now.
In solving a number of particulars for experimental works would be an incentive to
Professor Hiroshi Shima and Associate Professor Masahiro Ouchi have greatly helped me.
Grateful acknowledgement is offered to Professor Shisuke Nakata and Professor
Nobumitsu Fujisawa as members of examination committee
I would also like to acknowledge Assistant Professor Tetsuya Ishida, Professor Koichi
Maekawa, and Professor Xuehui An for their the crucial role of the modification on
computational program, DuCOM.
Thanks for Miss Sachie Kokubo, Mr. Songkram Piyamahant, Yosuke Arai, Tomohiro
Kajisako, and Shinsuke Morita for their assistance in the experimental works presented in
this study.
Gratitude to Yoneyama Scholarship and Rotary Club members for financial support of
living expense for two years supporting fund

Abstract The integrated computational model in this study is to calculate the chloride concentration
in concrete under actual environmental conditions in the atmosphere. The integrated model
consists of 3 minor models for understanding the mechanisms of environmental parameters
influencing the chlorides attack to concrete struc tures.
(1) The first model is considered as the study on airborne chlorides formation and
transportation. The simplification model on the airborne chlorides formation and flying
upward to the atmosphere is proposed. In sequence, the model of airborne chlorides
transportation to the surface of concrete is further simulated. The wind speed is one of
main parameters in airborne chlorides formation and transportation. The calculated
result in this model is the accumulative airborne chlorides in a time interval. In this
model is verified by the measurement of airborne chlorides by Public Work Research
Institute, 1984-1986.
(2) The second model is the calculation of accumulative chloride concentration on surface
of concrete. The related parameters in this model are amount of airborne chlorides,
surface roughness of concrete, types of structural members and rain. Rain effect is
thought as the largest effect on the removal of chloride concentration on the surface of
concrete. In the verification of this model, the experimental observation of chloride
concentration on surface of existing structures in Kochi prefecture with time history is
compared.
(3) The third model is the computation for chloride concentration in concrete. The
distribution of chloride concentration on surface of concrete obtained from the second
model is used as the input of this model. The computation of chloride concentration in
concrete is calculated by DuCOM program. The integrated model of these 3 steps of
calculation is proved by comparing the monitoring data of chloride concentration of
existing structures from Public Work Research Institute 2000.
Table of Contents
page
Acknowledgement i
Abstract ii
Table of contents iii
List of Tables v
List of Figures vi
CHAPTER 1 1
Introduction 1
1.1 General 2
1.2 State of Problems 5
1.3 Objectives of Study 6
CHAPTER 2 8
Literatures 8
2.1 Airborne chloride transportation in the atmosphere 9
2.2 Computational program on chloride transport in concrete 15
2.3 Design Specification and investigation of existing structures 19
CHAPTER 3 23
Computational model for chloride distribution under simple environmental conditions 23
3.1 Introduction 24
3.2 Steady-State Simulation 25
3.3 Cyclic Wetting-Drying Simulation 27
3.4 Actual Cyclic Wetting and Drying Simulation 31
3.5 Summary 35
CHAPTER 4 36
Mechanisms of airborne chloride formation and transport 36
4.1 General 37
4.2 Model on airborne chloride formation 39
4.3 Model on airborne chlorides transportation 42
4.4 Verification on airborne chlorides formation and transportation 59
4.5 Model modification 65
CHAPTER 5 67
Model of accumulated chloride concentration on the surface of concrete 67
5.1 Introduction 68
5.2 Experimental outlines 71
5.2.1 The examination of chloride distribution in surface layer 71
5.2.2 The examination of Co by considering as the average of chloride in surface depth 74
5.3 Experimental Results 75
5.4 Prediction model of annual accumulated chloride concentration. 83
5.5 The predicting standard accumulated chloride concentration around Japan 92
CHAPTER 6 94
Verification of the computational model on chloride distribution 94
6.1 DuCOM modification 95
6.2 Results verification on chloride distribution in concrete 97
CHAPTER 7 107
New proposed design method 107
7.1 Recent design 108
7.2 New proposed design method 110
CHAPTER 8 116
Conclusion 116
References
List of parameters
Appendix A: Predicting results of accumulated chloride concentration in various zones
Appendix B: The investigated data by Public Works Research Institute for model
verification
Index

List of Tables
page
Table 2.1.1: Classification of severity of chloride attack 9
Table2.3.1: Investigation of structures in each location 20
Table 4.3.2: The example of calculation method in order to obtain the total chloride
content in mg/dm2 /month 53
Table 4.3.1: Value of airborne particle size and chloride content related with wind and
distance from seashore calculated from reference value in Fig.4.2.9 52
Table 5.4.1: Chloride accumulation in various concrete conditions at seashore (kg/m3) 85
Table 6.2.1: Conditions in Simulation of each investigated data in Appendix B 98
Table 7.1.1: The chloride concentration at surface of concrete in a certain distance 109
Table 7.2.1: Surface chloride concentration of concrete in Okinawa (Zone1) at seashore
114

List of Figures
page
Fig.1.1: A simple Schematic of infrastructure management [2]. 2
Fig.1.2: Schematic of integrated simulation of chloride transport in concrete structures 5
Fig.2.1.1: The investigated soundness of structures around Japan 11
Fig.2.1.2: Level of severity in the particular region around Japan 12
Fig.2.1.3: The investigation of airborne chlorides 13
Fig.2.1.4: The inves tigation of airborne chlorides by PWRI [1] 14
Fig.2.2.1: Integration of microphysics-DuCOM and macro-structural analysis-COM3 17
Fig.2.2.2: Relationship between total chloride content and fixed chloride factor [11] 17
Fig.2.2.3: Example of chloride concentration in concrete submerged in 3% NaCl 18
Fig.2.2.4: Example of chloride concentration in concrete in looping of 3-days wetting
+10-days drying 18
Fig.2.3.1: Concrete coring for chloride concentration test and strength test 20
Fig. 2.3.2: Estimation of initial chloride concentration from the examination [12] 21
Fig. 2.3.3: Surface chloride concentration and distance relationship 21
Fig.3.2.1: Chloride distribution (kg/m3) and relative humidity (%) profiles at 30%
ambient RH, 26
Fig.3.2.2: Chloride distribution (kg/m3) and relative humidity (%) profiles at 70%
ambient RH, 26
Fig.3.2.3: Chloride distribution (kg/m3) and relative humidity (%) profiles at 99.9%
ambient RH, 26
Fig. 3.3.1: Chloride distribution (% Wcement) in the cyclic wetting-drying condition of
3-10 case [Drying RH = 30% and Wetting RH = 99.9%] 28
Fig.3.3.2: Chloride distribution (% Wcement) in the cyclic wetting-drying condition of
1-10 case [Drying RH = 30% and Wetting RH = 99.9%] 28
Fig.3.3.3: Chloride distribution (% Wcement) in the cyclic wetting-drying condition of
1-1 case [Drying RH = 30% and Wetting RH = 99.9%] 29
Fig.3.3.4: Chloride distribution (% Wcement) in the cyclic wetting-drying condition of

1-10 case [Drying RH = 60% and Wetting RH = 99.9%] 29
Fig.3.4.1: Ambient Rain and RH in Kochi prefecture, February 2002 32
Fig.3.4.2: Ambient Rain and RH in Kochi prefecture, July 2002 33
Fig.3.4.3: Chloride distribution in case 1 calculated by DuCOM 33
Fig.3.4.4: Chloride distribution in case 1 calculated by DuCOM 34
Fig.3.4.5: Chloride distribution in case 1 calculated by DuCOM 34
Fig. 4.2.1: The simple figure of airborne chloride transport 39
Fig. 4.2.2: Relation of height of aerosol and wind speed in Eq. (4.2.2) 45
Fig. 4.3.1: Equilibrium of vertical force by gravitational settlement. 45
Fig.4.3.2: Kinematic viscosity of air at 1atm as a function of temperature (°c) obtained
from (www.ce.utexas.edu) 46
Fig.4.3.3: Transport mechanism due to vertical and horizontal motion. 46
Fig.4.3.4: Relationship between dropping velocity and specific particle sizes 47
Fig.4.3.5: Profile of 1-size particle affects on a distance in a constant wind speed U 48
Fig.4.3.6: The airborne particle size (mm) influence at a specific distance (m) in various
wind speed (m/s) 50
Fig.4.3.7: The reference value of chloride content with particle size (mm) under the
condition of 2 m/s wind speed and standard deviation at 18 (mm) 49
Fig.4.3.8: The verification by hourly simulation in selected samples 54
Fig.4.3.9: The schematic calculation for airborne chloride distribution 56
Fig.4.3.10: The separation of 4 severe zones on chloride attack around Japan. 55
Fig.4.3.11: The effective wind speed in monthly value in 4 zones 57
Fig.4.3.12: The verification of effective wind speed and average wind speed 57
Fig.4.3.13: The effective wind speeds (m/s) and numbers of effective wind (hrs/day) 58
Fig.4.4.1: Verification of Zone 1 in Okinawa area. (Data from PWRI, 1985 [1]) 62
Fig.4.4.2: Verification of Zone 2 in Japan Sea coastline. (Data from PWRI, 1985 [1]) 63
Fig.4.4.2: Verification of Zone 3 in Pacific Ocean coastline.
(Data from PWRI, 1985 [1]) 64
Fig.4.4.4: Verification of Zone 4 in Chuubu and Chuukoku Area.

(Data from PWRI, 1985 [1]) 67
Fig.4.4.5 Verification on 1-year accumulative airborne chlorides for overall data by PWRI
60 Fig.4.5.1: Sea-based landscape and seawall influence aerosol formation 65
Fig.4.5.2: The investigated of the airborne chloride transport in the obstacle effect 66
Fig.5.1.1: Schematic model of accumulative chloride concentration 68
Fig.5.1.2 Examples of investigated chloride distributions at seashore by PWRI 70
Fig.5.2.1: Three surface roughness conditions of investigated structures 72
Fig.5.2.2: The investigated structure in Maehama at 30m from seashore 72
Fig.5.2.3: Monobe Bridge pier structure on ground at distance of 300 meters from sea 73
Fig. 5.2.4: Box girder, Pier, and foundat ion in Yasu Town at distance of 100 meters
from seashore 73
Fig.5.3.1: Experimental results in the normal surface (kg/m3) with time dependent at
Maehama, Kochi Prefecture (30m from seashore). 75
Fig.5.3.2: Experimental results in the rough surface (kg/m3) with time dependent at
Maehama, Kochi Prefecture (30m from seashore). 76
Fig.5.3.3: Amount of rain (mm) during May to Sep in Kochi prefecture. 77
Fig.5.3.4: Experimental results on the rough surface parallel to South wind (kg/m3) with
time dependent at Maehama, Kochi Prefecture (30m from seashore). 77
Fig.5.3.5: Experimental results on the smooth surface (kg/m3) with time dependent at
Monobe Bridge, Kochi Prefecture (300m from seashore). 78
Fig.5.3.6: Experimental results on the smooth surface of outside foundation (kg/m3) with
time dependent at Yasu Town, Kochi Prefecture (100m from seashore). 79
Fig.5.3.7: Experimental results on the smooth surface of pier (kg/m3) with time
dependent at Yasu Town, Kochi Prefecture (100m from seashore) 79
Fig.5.3.8: Experimental results on the smooth surface of girder (kg/m3) with time
dependent at Yasu Town, Kochi Prefecture (100m from seashore) 79
Fig.5.3.9: The time history of average accumulated chloride concentration, at
Maehama, Kochi Prefecture 80
Fig.5.3.10: The time history of average accumulated chloride concentration, at

Monobe Bridge, Kochi Prefecture 81
Fig.5.3.11: The time history of average accumulated chloride concentration, at
Yasu, Kochi Prefecture 82
Fig.5.4.1: The efficient wind direction at seashore in Kochi Prefecture. 84
Fig.5.4.2: The ratio of wind direction in year 2002-2003 84
Fig.5.4.3 (a): The prediction of 1-year chloride concentration in normal condition of
Kochi prefecture. 89
Fig.5.4.3 (b): The prediction of 1-year chloride concentration in rough condition of
Kochi prefecture 89
Fig.5.4.3 (c): The prediction of 1-year chloride concentration in rough surface with 90°
perpendicular to seashore of Kochi prefecture 90
Fig.5.4.3 (d): The prediction of 1-year chloride concentration in smooth surface with
100% rain of Kochi prefecture 90
Fig.5.4.4: The verification of predicted accumulated chloride concentration with
experimental results 91
Fig.6.1.1: Condensation mechanism of chloride ions in the surface layer of concrete 97
Fig. 6.2.1: Verification of B2009 100
Fig. 6.2.2: Verification of D2016 100
Fig. 6.2.3: Verification of D3008 101
Fig. 6.2.4: Verification of G1026 101
Fig. 6.2.5: Verification of G3003 102
Fig. 6.2.6: Verification of H2018 102
Fig. 6.2.7: Verification of H4017 103
Fig. 6.2.8: Verification of K1005 103
Fig. 6.2.9: Verification of K2005 104
Fig. 6.2.10: Verification of K3003 104
Fig. 6.2.11: Verification of A1017 105
Fig. 6.2.12 : Verification of B1013 105
Fig.6.2.13: Comparison of chloride concentration in concrete in actual structures from 12

selected samples in Table6.2.1 106
Fig.7.1.1: The apparent diffusion coefficient (cm2/yr) 110
Fig.7.2.1: The diffusion coefficient in function of w/c [calculated by DuCOM] 112
Fig. 7.2.2: Relationship between actual and equivalent time of exposure 113

New Durability Design Specification on Chloride Ions Penetration for RC Structures Swatekititham S. 2004
1
CHAPTER 1
Introduction

New Durability Design Specification on Chloride Ions Penetration for RC Structures Swatekititham S. 2004
2
1.1 General
The asset management and sustainable construction is the aims of the future
construction projects. For achieving management system, the service life-span
prediction model is necessary due to the degradation of structures by the ambient
environmental attack. One of the most noteworthy environmental problems on the
concrete structure is chloride attack resulting corrosion of steel bars. A simple schematic
work on the service life prediction and maintenance [2,27] is shown as in Fig1.1. The
model of life-span simulation due to the chloride attack only expresses in this study. It is
shown that the infrastructure management on the structures near seashore needs a model
that can predict the mechanism of chloride attack to concrete.
New Strucutres Estimation ofservice life
ExistingStrucutres
Estimation ofremainingservice life
Monitoring ofchloride
concentration
BackwardAnalysis of
performance
Monitoring ofchloride
concentration
Estimation ofperformance
Maintenance andrehabitation
Maintenance andrehabitation
ATTACK
CHLORIDE
Adjust
Property
ATTACK
CHLORIDE
Fig.1.1: A simple Schematic of infrastructure management [2].
Life-span prediction of some infrastructures is necessary for durability, reliability and
safety performances. The sustainable development of infrastructures is required to

New Durability Design Specification on Chloride Ions Penetration for RC Structures Swatekititham S. 2004
3
maintain their performances over the long life. Maekawa, et al developed a life-span
simulation model named DuCOM and COM3 for predicting overall structural behaviors
[3-5]. The 3-D multi-scale coupled system is built on the thermo-hydro physics coded
by DuCOM for early-aged concrete and nonlinear mechanics FEM coded by COM3 for
seismic performance assessment of reinforced concrete. In the mechanic actions such as
ground acceleration, gravity, temperature and shrinkage effects simulates in the COM3
section. The concrete durability by environmental attacks can be simulated by DuCOM
in any input data of environmental conditions. Therefore the analysis of chloride
transport by DuCOM required the boundary condition of the ambient chloride contents.
At this moment, there is none of the method to create such a boundary condition for a
structure exposed in the atmosphere. In considering the chloride attack in concrete,
time-step simulation model is necessary for calculating the amount of chloride
penetration into concrete with time dependency. DuCOM is one of the appropriate
computational program for analyzing chloride transport behavior. Whenever, the
appropriate boundary condition is known, DuCOM is able to simulate the chloride
transport in concrete. Thus the study of chloride transport in the atmosphere to the
boundary surface layer under actual environment is required as shown in Fig.1.2. In an
actual environmental condition, a particular location has a typical weather and a variety
of the wetting-drying cycles. The wetting-drying cycle is one of the factors that
influence the rate of chlorides penetration in concrete [6]. It is necessary to make the
parametric study on the main environmental parameters, such as the wetting-drying
cycles, relative humidity and amount of airborne chlorides. From preliminary study of
the wetting-drying cycles and the ambient relative humidity cannot clarify the severity
of the locations around Japan4). In sequence, other parameters are simulated on how

New Durability Design Specification on Chloride Ions Penetration for RC Structures Swatekititham S. 2004
4
much each parameter has an effect on the chloride transport in concrete. The most
effective parameter is declared as amount of airborne chloride available in a specific
distance from seashore. It is also necessary to know the airborne chlorides at the
location of the structure for use as complementary for chloride transport through
concrete. The airborne chlorides in the atmosphere are able to classify the severity in
each location around Japan. The airborne chlorides in various distances from the
seashore were collected around Japan by ‘Public Works Research Institute’ [1].
However, the proper simulation based on this database is still in the progress by many
researchers. In general discussion, the relationships among the available airborne
chlorides, wind speed & directions, surface conditions of concrete, and amount of
absorbed chlorides at surface of concrete are necessary for quantitative identification.
Thus, a systematic computational model in analyzing environmental effect on the
chlorides penetration in concrete is the most required in recent times.
The systematic computational model of the chloride attack in concrete structure is
divided into three sub-models. The first sub-model of the chloride attack has to be
considered starting from the seashore just after forming of breaking water. The
characteristic of coastline, landscape, seashore slope, and artificial landscape are
important to regard as the supplement of airborne chlorides at seashore. Then the
transportation of airborne chlorides from breaking seawater through the atmosphere to
the surface of concrete is extended. The second sub-model is the analysis on how many
airborne chlorides accumulate on surface layer of concrete. After all, the computation on
chloride transport in concrete is to obtain the chloride concentration along the covering
depth of concrete. As a result, the systematic computation on real behavior with actual

New Durability Design Specification on Chloride Ions Penetration for RC Structures Swatekititham S. 2004
5
environments is succeeded.
Fig.1.2 Schematic of integrated simulation of chloride transport in concrete structures
1.2 State of Problems
As mentions above, the integrated multi-scale computational program named DuCOM
had developed for support the simulation of chloride transport in any environmental
conditions. DuCOM can simulate the chloride distribution in concrete in the severe
environmental condition as submerged and tidal zones. The chloride attack on the
structure in the atmosphere is able to simulate if the boundary condition and
environmental effect were known. Thus, the analysis of chloride concentration by
DuCOM requires an appropriate input data under actual environment. At present, there
is no a proper method to simulate the actual environment and create a boundary
condition for analysis by DuCOM. Moreover, the creation of the boundary condition at
Airborne chlorides formation & Transportation
Input OutputVerification by data from PWRI
1.
Accumulative chloride concentration on surface of concrete
Input OutputVerification by Experimental data (Kochi)
2.
Chloride concentration in concrete by DuCOM
Input OutputVerification by data from PWRI
3.
1. Input = U, distance, offshore topography Output = Cair (mdh)
2. Input = Cair, concrete roughness, rain, wind, member types Output = Time dependent Co
3. Input = Time dependent Co, w/c Output = Cl concentration in concrete
New Durability Design Specification on Chloride Ions Penetration for RC Structures Swatekititham S. 2004
6
surface layer of concrete is complicated due to distribution of weather.
The environmental factors of wind speed, wind direction, temperature, RH, airborne
chloride and rain are mainly factors on accumulative chloride concentration at surface
of concrete. Wind speed is thought as the driven force for transporting airborne particles
to the surface of a structure. This medium is due to the directions, which has possibility
to reach their destination. Temperature and RH are the nature pointing out the
wetting-drying ratio and have effect on the penetration in concrete. Airborne chloride
formation is a key factor to know how much airborne is formed at seashore and ready to
transport whenever wind blows. Airborne chloride particles are supplied by the
formation after wave breaking at seashore and wind speed. Rain is the main factor to
reduce the amount of chlorides on the surface of concrete. At the same time, the
increment of the degree of saturation allows the diffusion mechanism to occur rapidly.
The equations for calculating the quantitative effects of the parameters are still not
existed. The problems have to be solved systematically and it is time to do it
immediately.
1.3 Objectives of Study
The objectives of this study are shown in Fig1.1 in a macro scale. The necessity of this
study provides the systematic life-span simulation under actual environments. In order
to succeed this aim, the computational model for the chloride formation, transportation
and accumulation on concrete surface are necessary in order to obtain the chloride
distribution in concrete under atmospheric environment. Next, the computational model
can be used for the development of recent design method. This is also fulfilling the

New Durability Design Specification on Chloride Ions Penetration for RC Structures Swatekititham S. 2004
7
design of the chloride distribution in concrete in any locations, specific types. Later on,
the advantage of model is able to use as the prediction of the service life simulation in
the field of asset management.
Without this model, JSCE specification is a prediction model, which can be used to
predict the service life. However the model in JSCE specification is a conservative
method, this is only parameter of distance from seashore as the main parameter. From
the monitoring of the existing structures in any locations around Japan, the chloride
attack depends on the particular environmental conditions. As the result, the prediction
of service life has low precision and high error leading to inefficient management
system. For solving this problem, the new prediction proposed in this study can be
applied instead of the present method. The improvement of the model helps the
management and monitoring system being better decisive factor.
Afterward, the new service life prediction model is pertinent for the development on this
field. The individual analysis of the structures or the integration of the entire structural
situation is a supporting tools in the asset management system both sections of micro
and macro economies.

New Durability Design Specification on Chloride Ions Penetration for RC Structures Swatekititham S. 2004
8
CHAPTER 2
Literatures

New Durability Design Specification on Chloride Ions Penetration for RC Structures Swatekititham S. 2004
9
2.1 Airborne chloride transportation in the atmosphere
In 1983, Japan Roads Associa tion [7] started monitoring the structural conditions about
chloride attack and cracking provision. The selection of investigated structures is mostly
aging up to 50 years. The limitation of the investigated structures is within the distance
500m from seashore, Bridge with span larger than 15 m, Constructed structure before
year 1972. The RC and PC structures are examined totally 920 structures around Japan.
The Fig.2.1.1 shows the investigation of soundness condition of the structure around
Japan. This figures include various ages of structures, thus the details of each
investigated structures are necessary. Nevertheless, the consideration of time history for
overall investigated structures is able to elucidate the severity of each zone. The
summarization of the severity was proposed as shown in Fig. 2.1.2.
Table 2.1.1: Classification of severity of chloride attack
The investigation of the airborne measurement [1,7] in various locations has been
organized followed JIS Z2381 [28]. The apparatus is the steel plate of 10x10cm
dimensions. Windblown transports airborne chlorides to attach with the steel plate. The
collection is done for 1-month interval for enough noticeable quantity. The roof is also
Zone Locations Distance from seashore SEVERITYUp to 100m from seashore IOther distances IIUp to 100m from seashore I100-200 m II200-300 m IIISplash zone IUp to 100m from seashore II100-200 m III
C Others
BJapan SeaCoastline
A Okinawa

New Durability Design Specification on Chloride Ions Penetration for RC Structures Swatekititham S. 2004
10
set for protecting the rain effect to the removal of airborne chloride. The total airborne
chlorides were measured and calculated the amount in mg/dm2/month. The average
chloride content is calculated by
AtWCL
C air ××
=
where, Cair is daily average of airborne chloride (mg/dm2/day)
CL is collected airborne chloride (mg/ml)
W is amount of water used for washing out from steel plate (ml)
t is exposure time (days)
A is specific surface area (= 1dm2)
The airborne chloride observed value with the distance from seashore is the exponential
function with the attitude of airborne chloride content at seashore as shown in Eq.2.1.2.
100055.1
, .l
airoair eCC−
= (2.1.2)
where, Cair is daily average airborne chlorides (mg/dm2/day)
Co,air is daily average of airborne chloride at seashore (mg/dm2/day)
l is distance from seashore (m)
(2.1.1)

New Durability Design Specification on Chloride Ions Penetration for RC Structures Swatekititham S. 2004
11
New Durability Design Specification on Chloride Ions Penetration for RC Structures Swatekititham S. 2004
12
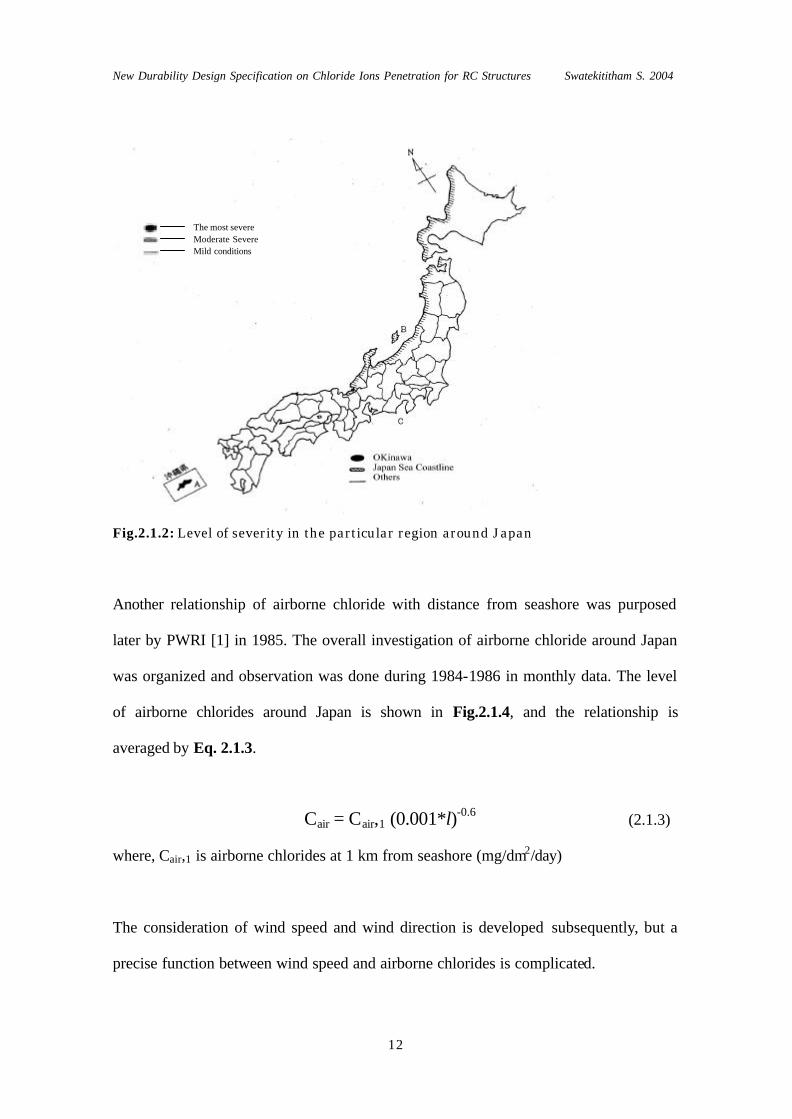
Fig.2.1.2: Level of severity in the particular region around Japan
Another relationship of airborne chloride with distance from seashore was purposed
later by PWRI [1] in 1985. The overall investigation of airborne chloride around Japan
was organized and observation was done during 1984-1986 in monthly data. The level
of airborne chlorides around Japan is shown in Fig.2.1.4, and the relationship is
averaged by Eq. 2.1.3.
Cair = Cair,1 (0.001*l)-0.6 (2.1.3)
where, Cair,1 is airborne chlorides at 1 km from seashore (mg/dm2/day)
The consideration of wind speed and wind direction is developed subsequently, but a
precise function between wind speed and airborne chlorides is complicated.
The most severe Moderate Severe Mild conditions

New Durability Design Specification on Chloride Ions Penetration for RC Structures Swatekititham S. 2004
13
-

New Durability Design Specification on Chloride Ions Penetration for RC Structures Swatekititham S. 2004
14
Fig.2.1.4: The investigation of airborne chlorides by PWRI [1]
Many relationships were purposed in a high scatter. From literatures [1,8,9,10], the
amount of airborne chlorides in a distance is thought as the function of the third power
of wind speed, and wind direction as shown below,
Cair = f (U3, r) (2.1.4)
where, Cair is daily average airborne chloride (mg/dm2 /day)
U is wind speed (m/s)
r is wind ratio in landward direction
The regression analysis of a numbers of experimental results was proposed as a choice
for analyzing wind speed relationship [19]. The formulas do not show a particular
< 0.1 mdd
0.1- 1.0 mdd
1.0-10.0 mdd
>10.0 mdd
< 0.1 mdd
0.1- 1.0 mdd
1.0-10.0 mdd
>10.0 mdd

New Durability Design Specification on Chloride Ions Penetration for RC Structures Swatekititham S. 2004
15
function, but they were recommended by classifying the data into
- Low-scale of airborne chlorides
Cair =0.0515.r. U2.27 R=0.488 (2.1.5)
- Large-scale of airborne chlorides
Cair =0.0150.r. U3.29 R=0.671 (2.1.6)
where, R is regression value
Wind speed, wind direction and distance from seashore were examined by many
literatures. Conversely, the amount of airborne chlorides cannot explain how it affects to
the chloride transportation. The medium to link between the available chloride ions and
the penetration into concrete should be analyzed.
2.2 Computational program on chloride transport in concrete
The three-dimensional multi-scale couple system of thermo-hygro interaction is
constructed and coded by DuCOM. DuCOM is a simulation tool for early aged concrete
in basic hardened concrete properties with time scale. The Integrating of DuCOM with
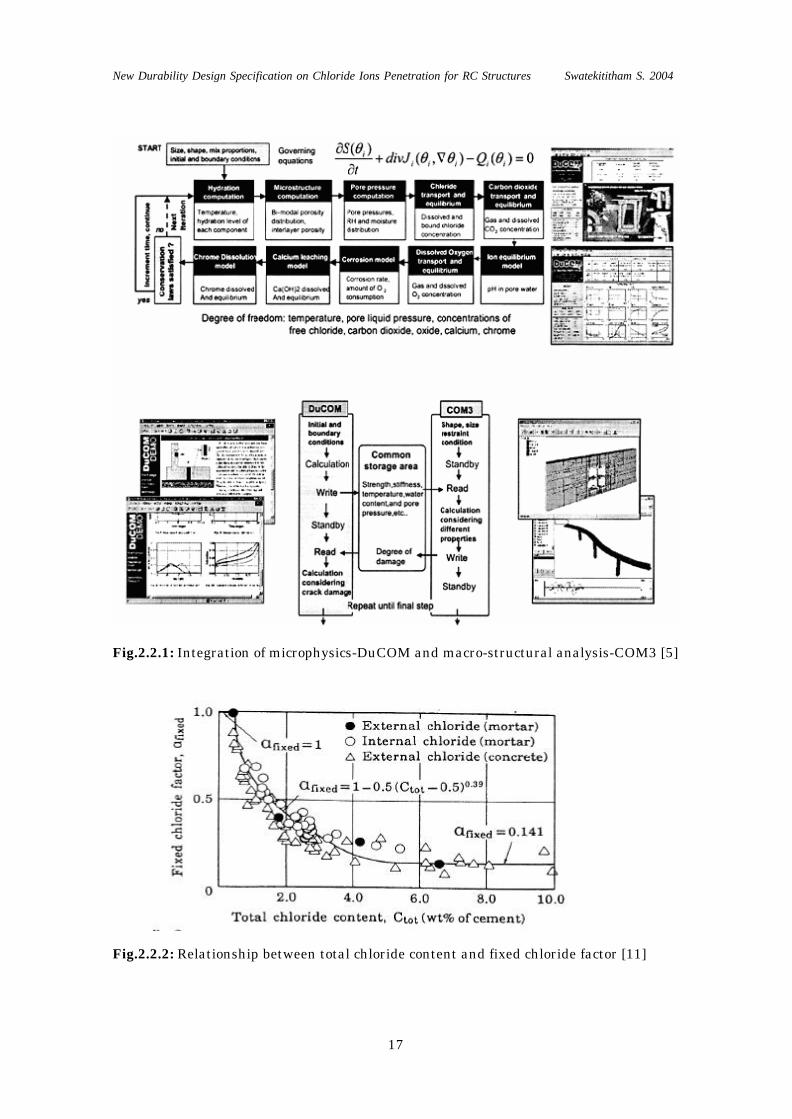
the non- linear mechanics FEM coded by COM3 described in Fig.2.2.1 [5] for seismic
performance of reinforced concrete conducts the durability simulation considering with
both damage by loads and weather actions. The scheme of this simulation model of
chloride transport in concrete named DuCOM involves the incorporation with mainly,
2.2.1 Cement hydration and thermal conduction [3]
2.2.2 Pore structure formation and moisture equilibrium and transport [3]

New Durability Design Specification on Chloride Ions Penetration for RC Structures Swatekititham S. 2004
16
2.2.3 Free/bound chloride equilibrium and transport [4]
2.2.4 Carbonation and dissolved carbon dioxide migration [4]
2.2.5 Corrosion of steel and dissolved oxygen transport [4]
Mention in the Section 2.2.3, the governing equations for chloride transport in
cementitious materials by advective-diffusive phenomenon with time dependent are
shown as
∂(φ.S.Ccl)/∂t + divJcl – Qcl = 0 (2.2.1)
Jcl = (-φ.S.Dcl.∇Ccl/Ω) + φS.u.Ccl (2.2.2)
where, φ is porosity, S is degree of saturation,
Ccl is free chloride concentration in pore solution (mol/l),
Jcl is flux of chloride ion (mol/m2.s),
Qcl is reduction of free chloride,
Dcl is chloride ion diffusivity in pore solution phase (m2/s),
Ω is tortuosity of pore as equal to (π/2)2
Chloride transport in cementitious materials under actual conditions is an
advection-diffusion phenomenon. Mass balance of free chlorides can be expressed
Eq.2.2.1 and Eq.2.2.2.
New Durability Design Specification on Chloride Ions Penetration for RC Structures Swatekititham S. 2004
17
Fig.2.2.1: Integration of microphysics-DuCOM and macro-structural analysis-COM3 [5]
Fig.2.2.2: Relationship between total chloride content and fixed chloride factor [11]

New Durability Design Specification on Chloride Ions Penetration for RC Structures Swatekititham S. 2004
18
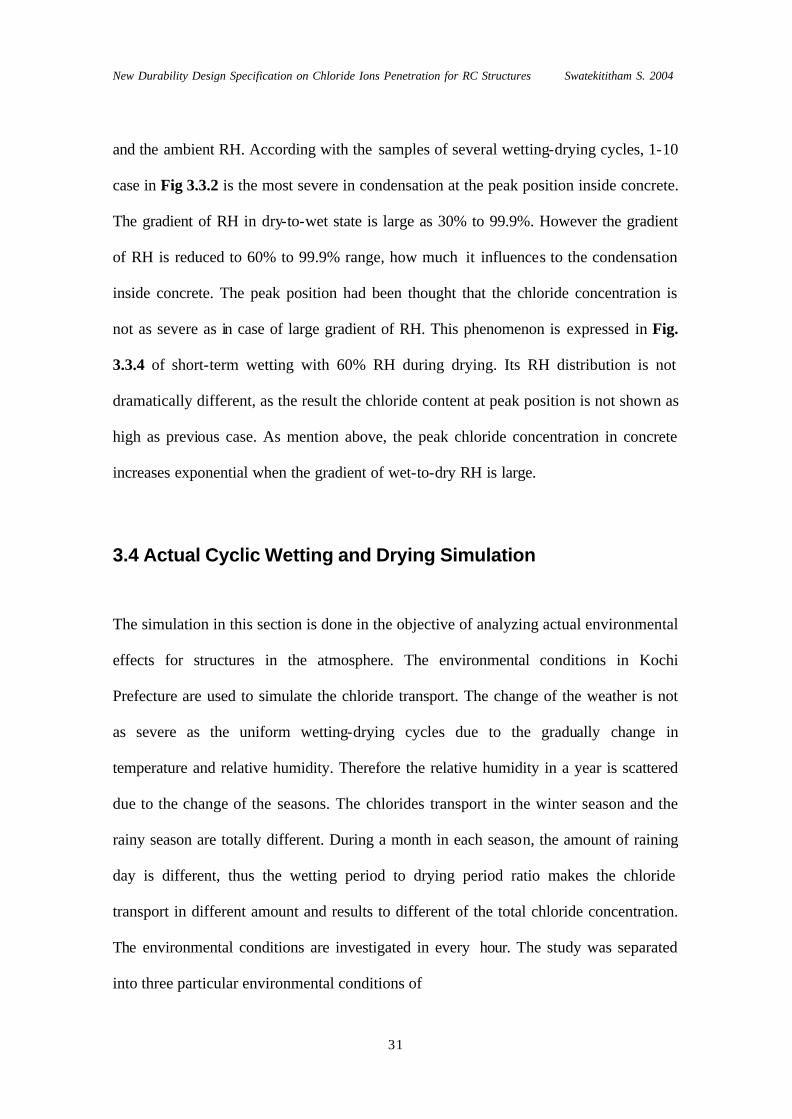
Chlorides in cementitious materials have free and bound components. The bound
chlorides are settled by reaction with aluminates and formed in quantitative value as in
Fig.2.2.2. The bound chlorides were classified into 2 phases of adsorbed and chemically
combined components. From the formulations, the total and free chlorides can be
obtained whenever mix proportion, powder properties, curing, RH, temperature and
ambient chloride concentration (mol/l) were set.
Fig.2.2.3: Example of chloride concentration in concrete submerged in 3% NaCl
Fig.2.2.4: Example of chloride concentration in concrete in looping of 3-days wetting +
1 0 -days drying
0
2
4
6
8
0 10 20 30 40 50Time (years)
Chl
orid
e co
ncen
trat
ion
(% W
cem
ent)
A=2.7 mm
B=32.7 mm
C=103.1 mm
w/c = 0.55
A B C
A
B
C
0
1
2
3
4
5
0 50 100 150 200 250Depth (mm)
Chl
orid
e co
ncen
trat
ion
(% W
cem
ent)
1 yr5yrs10 yrs20 yrs40 yrs
w/c = 0.55
0
2
4
6
8
0 50 100 150 200 250
Depth (mm)
Chl
orid
e co
ncen
trat
ion
(% W
cem
ent)
1 yr
5 yrs
10 yrs20 yrs
40 yrs
3 days wetting and 10 days drying

New Durability Design Specification on Chloride Ions Penetration for RC Structures Swatekititham S. 2004
19
The diffusion and condensation expressed the mechanism of chloride transport in
submerged conditions. Considering the constant boundary condition, the ambient
chloride concentration is 3% of NaCl. In Fig.2.2.3, the analyzed results show time
dependent chloride concentration in various depths. The chloride concentrations at
surface from 1 year to 40 years are constant. This is explained by the constant boundary
condition. The analysis is extent to the simulation of non-steady state of ambient
condition on fluctuated RH. The advection affects by wetting-drying cycles, and the
ratio of the cycles has a difference of inside concentration. The surface layer of chloride
content at 2-3 cm from surface fluctuates due to wetting and drying periods. Wetting
period leads the diffusion and advection become highly effective. Drying period causes
the declination of chloride content and RH at surface layer, afterward the wetting can
have a big influence of advection. At 2-3 cm from surface, chloride concentration is
condensed higher than the value of boundary condition as shown in Fig.2.2.4.
2.3 Design Specification and investigation of existing structures
The investigation of deterioration and structural status was done around Japan by PWRI
[12]. More than 2000 members were observed in various conditions of rust, corrosion,
crack and spalling.152 members were examined the chloride concentration in concrete
by coring the samples from non-reinforced section as shown in Table.2.3.1. Locations
and structural types were classified in the table as well. 10 zones around Japan were
divided for individual characteristic of weather conditions. 6 types of concrete structures
were also categorized by crest structure, abutment, retaining wall, culvert, rivers
structure and tunnel.

New Durability Design Specification on Chloride Ions Penetration for RC Structures Swatekititham S. 2004
20
Table2.3.1: Investigation of structures in each location
Structural types Hokkaido Tohoku Kanto Hokuriku Chubu Kinki Chukoku Shikoku Kyushu Okinawa Total
Crest structure 40 28 63 24 31 53 37 32 55 8 371Abutment 40 38 65 24 38 52 40 31 54 8 390
Retaining wall 40 25 56 24 36 44 40 31 43 9 348Culvert 40 35 64 24 34 53 39 27 48 6 370
Rivers structure 40 41 60 27 32 47 37 28 52 0 364Tunnel 37 35 25 16 22 27 30 27 32 5 256Total 237 202 333 139 193 276 223 176 284 36 2099
Fig.2.3.1: Concrete coring for chloride concentration test and strength test
The Fig.2.3.1 shows the coring sample in the length longer than 200mm. 5 pieces of
2cm size were cut and tested for chloride concentration by averaging at middle of
section. Thus, the average chloride contents express 5 positions of 1,3,5,7 and 9cm.
Later section, 10cm depth was cut for strength test to evaluate the hardened properties
of concrete. The observed values were compared with the results from Fick’2nd Law
equation recommended by JSCE Specification, 2002 [13].
where, C(x,t) is chloride ions concentration at time t (kg/m3)
Co is chloride ions concentration at surface of concrete (kg/m3)
x is covering depth (cm)
D is apparent diffusion coefficient (cm2/yr)
2 2 2 2 210 cm
STRENGTH TEST CL TEST
SURFACE SIDE
)0,(.2
1),( xCtD
xerfCotxC +
−= (2.2.3)

New Durability Design Specification on Chloride Ions Penetration for RC Structures Swatekititham S. 2004
21
t is exposure time (yrs)
C(x,o) is initial chloride ions concentration (kg/m3)
Fig. 2.3.2: Estimation of initial chloride concentration from the examination [12]
Fig.2.3.3: Surface chloride concentration and distance relationship.

New Durability Design Specification on Chloride Ions Penetration for RC Structures Swatekititham S. 2004
22
The 152 structures were classified into 4 groups,
Group A: Eq.2.2.1 fits to 5 investigated points to the calculation
Group B: Chlorides in the depth 0-2 cm is little smaller than the calculated value and
other points are in trend
Group C: Chlorides in the depth 0-2 cm is dramatically smaller than calculated value
and other points are in trend
Group D: Chlorides in the depth 0-2 cm and 2-4 cm are dramatically smaller than
calculated value and other points are in trend
In Fig.2.3.2, the calculation of initial chloride concentrations in this investigation was
plotted with the year of construction. In general of the structures constructed before
1985, the initial chloride concentration was observed at larger than 0.6 kg/m3. The
appendix A. shows the selected investigated data on the chloride concentration and the
depth of carbonation. The data was selected due to the enough information in analysis
only. The surface chlorides at 0-2 cm of the samples in group A, B and C were plotted
with the relationship with distance from seashore. At the same time, the comparison
with the recommended value in JSCE specification was done in log-scale. It expressed
high dispersion more than two times difference. However this is necessary to find out
the cause of deviated data from the real structures in a particular location.

New Durability Design Specification on Chloride Ions Penetration for RC Structures Swatekititham S. 2004
23
CHAPTER 3
Computational model for chloride distribution under simple environmental conditions

New Durability Design Specification on Chloride Ions Penetration for RC Structures Swatekititham S. 2004
24
3.1 Introduction
The purpose of this chapter is to investigate the mechanism of chlorides transport,
especially focusing on the effect of wetting-drying conditions on the penetration.
Basically, the movement of chloride ion into concrete is due to two main mechanisms;
the diffusive movement caused by concentration differences of chlorides, and advective
transport due to bulk suction of pore water. The moisture content or RH inside concrete
subjected to an ambient environment, such as complex wetting-drying condition, does
not have constant distribution throughout the depth. The surface region at 0-3 cm could
have a fluctuation in terms of RH inside pore structure when it is subjected to wetting
and drying conditions. Moreover, a value of an ambient RH also controls the rate of the
chlorides penetration. Of course, properties of concrete, such as strength, porosity and
its distribution, are used to determine how chloride ions behave in concrete. In this
paper, the mechanisms of chloride movement under steady-state condition and several
types of wetting-drying cycles are discussed. As usual of real environment, each season
has a typical environmental condition and all of them have different wetting-drying
cycles. At each location in Japan from East to West or from Hokkaido to Okinawa, the
difference of environmental condition brings some difficulties to evaluate severity of
chloride ions. The important point is to show some facts of the real mechanism of
chloride movement as a basic knowledge to evaluate the effect on the chlorides
transport in actual environments.
A numerical tool simulating concrete properties, such as the microstructure
development has been proposed by Maekawa, et al [3]. Then the target of this

New Durability Design Specification on Chloride Ions Penetration for RC Structures Swatekititham S. 2004
25
technology has been widened by installing the chloride transport model [4]. The
combination of these 2 models can simulate the development of microstructure and RH
with time and the amount of total chloride ions concentration in each period. The
software calculating the chloride ions concentration in concrete based on the above
model is named as DuCOM program. Following these models, the simulated results on
the chlorides transport in several wetting-drying cycles are obtained. The adaptation of
this model can be used to realize the quantitative effect of concerned parameters in
macro level. Thus, DuCOM is a tool to obtain the result for analysis in this paper.
3.2 Steady-State Simulation
In order to understand how CL moves inside and outside along concrete depth, many
cases of environment were set partially starting from steady state of environment and
various wetting and drying period. Some parameters such as ambient RH and wetting
and drying interval were studied by Swatekititham et al [14]. The concrete property is
concrete with w/c of 0.55 under standard curing condition of submerged 28-days
condition. The steady-state chloride concentration in the ambient relative humidity
under constant of ambient chloride concentration at 3% NaCl is simulated. The results
of 3 different RH of 30%, 70% and 99.9% show in Fig.2.3.1-2.3.3.
In low level of ambient RH, the RH distribution inside concrete at surface layer
decreases to reach equilibrium of hydraulic pressure in pore solution to environment.
However, in deeper position inside concrete, RH decreases gradually until all position is
equilibrium. Within long-term analysis until 40 years, RH is same as ambient

New Durability Design Specification on Chloride Ions Penetration for RC Structures Swatekititham S. 2004
26
environment throughout the depth inside concrete.
0
1
2
3
4
5
0 5 10 15 20 25Depth (cm)
Chl
orid
e co
ncen
trat
ion,
(% W
cem
ent) [1,5,10,20,40 years]
Steady-State ,RH = 30 for w/c 0.55
0
20
40
60
80
100
0 5 10 15 20 25Depth (cm)
RH
(%)
1 yr 5yrs 10 yrs
20 yrs 40 yrs
Fig.3.2.1: Chloride distribution (kg/m3) and relative humidity (%) profiles at 30%
ambient RH
0
1
2
3
4
5
0 5 10 15 20 25Depth (cm)
Chl
orid
e co
ncen
trat
ion,
(% W
cem
ent)
[1,5,10,20,40years]
Steady-State ,RH = 70 % for w/c0.55
0
20
40
60
80
100
0 5 10 15 20 25Depth (cm)
RH
(%)
1 yr 5 yrs 10 yrs
20 yrs 40 yrs
Fig.3.2.2: Chloride distribution (kg/m3) and relative humidity (%) profiles at 70%
ambient RH,
0
1
2
3
4
5
0 5 10 15 20 25Depth (cm)
Chl
orid
e co
ncen
tratio
n,(%
Wce
men
t)
Steady-State ,RH = 99.9% for w/c0.55
0
20
40
60
80
100
0 5 10 15 20 25Depth (cm)
RH
(%)[1,5,10,20,40 years]
Fig.3.2.3: Chloride distribution (kg/m3) and relative humidity (%) profiles at 99.9%
ambient RH,

New Durability Design Specification on Chloride Ions Penetration for RC Structures Swatekititham S. 2004
27
3.3 Cyclic Wetting-Drying Simulation
The input data for replicating the mechanism is the concrete with water to cement ratio
of 0.55 in 28-days standard curing in water with temperature of 20°c. The chloride ions
concentration of environment is set equal to 0.51mol/l correspond ing to 3% of salt
concentration. The first input data in Fig.3.3.1 is the consideration of long-term wetting:
3-days wetting and 10-days drying condition. The second set in Fig.3.3.2 is short-term
wetting: 1-day wetting and 10-days drying. In these 2 sets, the same conditions for
wetting and drying states are given by; 30% RH is given for drying, whereas 99.9% RH
is set for wetting. The third set in Fig.3.3.3 is short-term iteration of 1-day wetting and
1-day drying. Moreover, the fourth set in Fig.3.3.4 is the short-term wetting condition
same as in the third set, nevertheless 60% RH is substituted for drying phase in order to
compare RH effects.
The results are shown in 4 sets of figures in different wetting and drying conditions. The
first figure is in steady state condition and the second to fourth figures are 3-days
wetting and 10-days drying, 1-day wetting and 10-days drying (RH 30%) and 1-day
wetting and 10-days drying (RH 60%), in sequence. All figures show the distributions
of chloride ions concentration after having wetting-drying cycles with RH distribution.
Fig. 3.3.1 shows 2 results under different ambient RH: 30% and 99.9%. In fact, high
RH condition accelerates diffusive movement of chloride ions. Thus, the concentration
at surface would be considered as a function of ambient RH. The maximum
concentration in concrete is about 2% by weight of cement in case of 30% RH and 4%
in case of 99.9% RH.

New Durability Design Specification on Chloride Ions Penetration for RC Structures Swatekititham S. 2004
28
0
2
4
6
8
10
0 5 10 15 20 25
Depth (cm)
Chl
orid
e co
ncen
tratio
n(%
Wce
men
t)
[1,5,10,20,40 years]
02
4
68
10
0 5 10 15 20 25
Depth (cm)
Chl
orid
e co
ncen
tratio
n(%
Wce
men
t)
[1,5,10,20,40 years]
0
20
40
60
80
100
0 5 10 15 20 25
Depth (cm)
RH
%
1 yr 5yrs 10 yrs
20 yrs 40 yrs
0
20
40
60
80
100
0 5 10 15 20 25
Depth (cm)
RH
%
3wet +10dry ,RH = 99.9% (Wet) for w/c 0.55
3wet +10dry ,RH = 30% (Dry) for w/c 0.55
Fig. 3.3.1: Chloride distribution (% Wcement) in the cyclic wetting-drying condition
of 3-10 case [Drying RH = 30% and Wetting RH = 99.9%]
0
2
4
6
8
10
0 5 10 15 20 25
Depth (cm)
Chl
orid
e co
ncen
tratio
n(%
Wce
men
t)
[1,5,10,20,40 years]
0
2
46
810
0 5 10 15 20 25Depth (cm)
Chl
orid
e co
ncen
tratio
n(%
Wce
men
t)
[1,5,10,20,40 years]
0
2040
60
80100
0 5 10 15 20 25Depth (cm)
RH
%
1 yr 5yrs 10 yrs
20 yrs 40 yrs
0
20
40
60
80
100
0 5 10 15 20 25
Depth (cm)
RH
%
1wet +10dry , RH = 99.9% (Wet) for w/c 0.55
1wet +10dry , RH = 30% (Dry) for w/c 0.55
Fig.3.3.2: Chloride distribution (% Wcement) in the cyclic wetting-drying condition
of 1-10 case [Drying RH = 30% and Wetting RH = 99.9%]

New Durability Design Specification on Chloride Ions Penetration for RC Structures Swatekititham S. 2004
29
0
2
4
6
8
10
0 5 10 15 20 25
Depth (cm)
Chl
orde
con
cent
ratio
n(%
Wce
men
t)
[1,5,10,20,40 years]
024
68
10
0 5 10 15 20 25
Depth (cm)
Chl
orid
e co
ncen
tratio
n(%
Wce
men
t)
[1,5,10,20,40 years]
0
20
4060
80100
0 5 10 15 20 25
Depth (cm)
RH
%
1 yr 5yrs 10 yrs
20 yrs 40 yrs
020406080
100
0 5 10 15 20 25
Depth (cm)
RH
%
1wet +1dry ,RH = 99.9% (Wet) for w/c 0.55
1wet +1dry ,RH = 30% (Dry) for w/c 0.55
Fig.3.3.3: Chloride distribution (% Wcement) in the cyclic wetting-drying condition
of 1-1 case [Drying RH = 30% and Wetting RH = 99.9%]
0
24
68
10
0 5 10 15 20 25
Depth (cm)
Chl
orid
e co
ncen
trat
ion
(% W
cem
ent)
[1,5,10,20,40 years]
02
4
68
10
0 5 10 15 20 25Depth (cm)
Chl
orid
e co
ncen
trat
ion
(% W
cem
ent)
[1,5,10,20,40 years]
02040
6080
100
0 5 10 15 20 25Depth (cm)
RH
%
1 yr 5yrs 10 yrs
20 yrs 40 yrs
020
406080
100
0 5 10 15 20 25Depth (cm)
RH
%
1wet +10dry , RH = 99.9% (Wet) for w/c 0.55
1wet +10dry , RH = 60% (Dry) for w/c 0.55
Fig.3.3.4: Chloride distribution (% Wcement) in the cyclic wetting-drying
condition of 1-10 case [Drying RH = 60% and Wetting RH = 99.9%]
By this result, the steady state of RH condition, the chlorides concentration has a peak at

New Durability Design Specification on Chloride Ions Penetration for RC Structures Swatekititham S. 2004
30
the surface of concrete. Next, Fig. 3.3.2 is set as long-term wetting of 3-days wetting
and 10-days drying. The wetting period is set as 99.9% RH and the drying period is set
as 30% RH. As a results, the RH gradient from wet-to-dry relates with condensation and
advection force in pore solution in an exponential function.
Looking at the RH distribution, the RH increases up to 99.9% during the wetting and
decreases to 30% during the drying. In a cycle of wetting and drying, RH is nearly
constant throughout the depth after 5cm because of very low rate of moisture transfer
forward and backward. The combination of high gradient of RH near surface and a
constant RH after 5cm results in the non-recovered of RH at the depth of 3.5-5 cm. That
leads us to understand that wetting cannot increase RH all over the depth to be the level
of 99.9% at last of wetting time. However, the case of long-term wetting can prevent
dropping of RH at later 5cm depth and keep constant with time. Compared with the case
in Fig. 3.3.3 of short-term wetting, that is 1-day wetting and 10-days drying condition,
the wetting period is too short in order to prevent the decreasing of RH inside as in the
long-term wetting. The large gradient in terms of RH distribution, especially at 3-5 cm,
causes large water suction, which accelerates chloride migration into concrete. The
analytical results show that the peak of chloride concentration exists at the position of
lowest RH. During the wetting period, RH from surface and inside will be transferred to
the depth of 3.5 cm and bringing chloride ions to accumulate in this position. In
opposite, the peak of chloride ions is decreased by diffusing and moisture movement
outward from concrete during drying. Comparing influences in wetting with those in
drying, the effect during the wetting has higher impact than that during drying. The
parameters influencing on the chloride content at peak position are the wetting period
New Durability Design Specification on Chloride Ions Penetration for RC Structures Swatekititham S. 2004
31
and the ambient RH. According with the samples of several wetting-drying cycles, 1-10
case in Fig 3.3.2 is the most severe in condensation at the peak position inside concrete.
The gradient of RH in dry-to-wet state is large as 30% to 99.9%. However the gradient
of RH is reduced to 60% to 99.9% range, how much it influences to the condensation
inside concrete. The peak position had been thought that the chloride concentration is
not as severe as in case of large gradient of RH. This phenomenon is expressed in Fig.
3.3.4 of short-term wetting with 60% RH during drying. Its RH distribution is not
dramatically different, as the result the chloride content at peak position is not shown as
high as previous case. As mention above, the peak chloride concentration in concrete
increases exponential when the gradient of wet-to-dry RH is large.
3.4 Actual Cyclic Wetting and Drying Simulation
The simulation in this section is done in the objective of analyzing actual environmental
effects for structures in the atmosphere. The environmental conditions in Kochi
Prefecture are used to simulate the chloride transport. The change of the weather is not
as severe as the uniform wetting-drying cycles due to the gradually change in
temperature and relative humidity. Therefore the relative humidity in a year is scattered
due to the change of the seasons. The chlorides transport in the winter season and the
rainy season are totally different. During a month in each season, the amount of raining
day is different, thus the wetting period to drying period ratio makes the chloride
transport in different amount and results to different of the total chloride concentration.
The environmental conditions are investigated in every hour. The study was separated
into three particular environmental conditions of

New Durability Design Specification on Chloride Ions Penetration for RC Structures Swatekititham S. 2004
32
Case 1) 10-years iteration of monthly weather in the winter of (Feb 2003); the 25-93%
of ambient relative humidity and 5-10% of raining period are expressed as the
environmental conditions.
Case 2) 10-years iteration of monthly weather in the rainy season of (Jul, 2003); the
45-93% of ambient relative humidity and 15-20% of raining period are expressed as the
environmental conditions
Case 3) 10-years iteration of the weather in one-year period (Sep 2002 to Aug 2003);
the 25-93% of ambient relative humidity and 10% average of raining period are
expressed as the environmental conditions.
The scattering of the ambient relative humidity in the atmosphere does not effect on the
chloride transport as severe as the uniform wetting-drying cycles described as in
Section 3.3. The scattering of the environmental conditions of Kochi in Feb and Jul are
shown in Fig.3.4.1 and Fig.3.4.2.
Fig.3.4.1: Ambient Rain and RH in Kochi prefecture, February 2002
0
2
4
6
8
10
Time in Feb, 2002
RA
IN (m
m)
0
20
40
60
80
100
RH
(%)
RH Rain

New Durability Design Specification on Chloride Ions Penetration for RC Structures Swatekititham S. 2004
33
Fig.3.4.2: Ambient Rain and RH in Kochi prefecture, July 2002
The actual environment is modified during raining by assuming ambient RH is 99.9%
due to surface saturation. It is noted that RH of 99.9% represents wet condition instead
of 100% due to the capable of equilibrium achievement. The characteristic of weather
condition in Feb has low raining and high scattering of RH. Contrasting with, the
weather in Jul has high raining and low scattering of RH.
Fig.3.4.3: Chloride distribution in case 1 calculated by DuCOM
0
5
10
15
20
Time in Jul, 2002
RA
IN (m
m)
0
20
40
60
80
100
RH
(%)
0
2
4
6
8
10
12
0 50 100 150 200 250Depth (mm)
Tot
al c
hlor
ide
conc
entr
atio
n ,
(kg/
m3 )
1-year5-years10-years

New Durability Design Specification on Chloride Ions Penetration for RC Structures Swatekititham S. 2004
34
Fig.3.4.4: Chloride distribution in case 1 calculated by DuCOM
Fig.3.4.5: Chloride distribution in case 1 calculated by DuCOM
The ambient chloride concentration is fixed constant at 0.51mol/l. The concrete of water
to cement ratio of 0.55 with 28-days water curing is applied. The simulation result s of
the three cases are shown in Fig.3.4.3 to Fig.3.4.5, respectively. The results differ
among them in very few amounts of the total chloride distribution even the ambient
0
2
4
6
8
10
12
0 50 100 150 200 250Depth (mm)
Tot
al c
hlor
ide
conc
entr
atio
n ,
(kg/
m3 )
1-year5-years10-years
0
2
4
6
8
10
12
0 50 100 150 200 250Depth (mm)
Tot
al c
hlor
ide
conc
entr
atio
n ,
(kg/
m3 )
1-year5-years10-years

New Durability Design Specification on Chloride Ions Penetration for RC Structures Swatekititham S. 2004
35
relative humidity changes much. The scattering of the ambient relative humidity in the
atmosphere does not effect on the chloride transport as severe as the uniform
wetting-drying cycles. The actual environments change gradually and lead the
consequence of low advection in concrete similar to the uniform wetting-drying cycles.
3.5 Summary
The study of macro analysis of environmental effect of ambient relative humidity and
cyclic wetting-drying condition tells us what the main parameter on chloride transport is.
The results from this study are in steady and non steady states. The wetting-drying
cycles are used to compare with the actual investigated data existing at this moment.
Therefore, the actual environment cannot explain the different of severity in various
locations around Japan. Next, the simulation of chloride transport for the structures in
the atmosphere has mainly parameters on the available airborne chlorides and how they
transport to concrete. Flow chart in Fig.1.2 shows the dimension of this research work
and environmental condition has the effect on the surface chloride accumulation more
than its on chloride transportation in concrete. Thus scope of this research work is set as
the study of the airborne formation, transportation and accumulation at the surface of
concrete structures. Others environmental factors, such as wind and seashore scenery
become the parametric study.

New Durability Design Specification on Chloride Ions Penetration for RC Structures Swatekititham S. 2004
36
CHAPTER 4
Mechanisms of airborne chloride formation and transport

New Durability Design Specification on Chloride Ions Penetration for RC Structures Swatekititham S. 2004
37
4.1 General
Recently, some coastal areas are being utilized as residential areas. However, various
salt damages of the structures in coastal areas are well known experimentally. The basic
mechanism of salt damage has been clarified depending on the concentration of chloride
ions available in the atmosphere, humidity and temperature.
In thinking of countermeasures for salt damage, it is important to know how sea salt is
formed, transported in the atmosphere and adsorbed on the structural surface. The
prediction of airborne chlorides volume and sizes distribution at the coastal areas is
dependent on the condition of the weather and location.
The airborne chloride is formed by the sea wave breaking produces spray droplets,
which is estimated as the second power of the wind speed. In high wind speed, spray
droplets rapidly increases the effective surface area of the ocean and therefore, should
enhance the exchange of any constituent or property normally transferred across the
air-sea interface. In addition, wind causes the driven force to form a certain wave height.
Thus energy form wave in the relationship with wave height was proposed [35-36].
Sea spray plays a role in the marine boundary layer as well. Spray dehydrates into
sea-salt aerosol (a major component of marine aerosol) and, thus contributes to climate
forcing either directly by sunlight [15]. Relative to bulk seawater, the bubbles from
which most spray droplets and sea-salt aerosols originate are also concentrated in
marine surfactants and, consequently, enhance the air-sea fluxes of particular organic
matter. Moreover, breaking seawater by hitting a breaking wall and wave-blocked

New Durability Design Specification on Chloride Ions Penetration for RC Structures Swatekititham S. 2004
38
concrete is thought as a main criterion of the formation. The magnitude of the spray
effect as a function of wind speed, however, is a subject of heated debate. Likewise,
Makin 1998 concluded from his modeling that ‘for wind speeds below 18 m/s, there is
no drastic impact of spray on heat and moisture flux. However, it is considered as a
minor factor that is ignored in the analysis in this paper. The formation and
transportation of airborne chlorides is summarized as
- Wave breaking and airborne chlorides formation
- Particle size and weight distribution
- Gravitational falling out
- Adsorption & absorption on surface of building structures
The formation of aerosol particles at seashore in the atmosphere has distribution in the
large size of available airborne particles in the air [18]. The airborne particle sizes are
from 2 µm to more than 100 µm in the range of coarse particle distribution. Most of the
particles in the coarse mode are formed by the frictional processes of comminuting,
such as sea spray from breaking waves and the slow growth of particles from the
accumulation mode. Typically, the airborne particles of a few tens to hundreds per cm3
are in the coarse mode in an urban area. The transport process depends on the
mechanisms of meteorological conditions of wind velocity, wind direction, turbulence
by wind atmospheric stability. The transportation of each particle differs in distance due
to the gravitation falling out. The speed of falling out and time consuming before
touching the ground surface is able to use for simulation as the time which windblown
can carry the particles to further distance. The anonymous of airborne chlorides
formation by wave breaking at seashore leads the problem as unknown boundary

New Durability Design Specification on Chloride Ions Penetration for RC Structures Swatekititham S. 2004
39
conditions. There are some of the methodologies for measuring airborne particles [33,
34], but it is not a simple device and also expensive. The apparatus can measure the
volumetric value, but it seems really impossible to obtain particle size distribution. Even
the apparatus is able to measure; the guarantee of accuracy is not approved. Thus the
simplification on the model of airborne chloride transport is modeled under the related
parameters which discuss later.
4.2 Model on airborne chlorides formation
The mechanism of airborne particles formation is due to sea wave, sea slope, and
offshore topography. The amount of airborne particle s flying to the atmosphere is
considered as in the function of wind speed and wave height. However, the factor
causing wave in a certain height depends on the wind speed and movement of sea base.
The model explains the mechanism of airborne particle formation in an assumption of
wave breaking by concrete obstacle along shoreline. After breaking, the overall particles
fly to a certain height. In fact, the particle size distribution along the height is necessary
for the transportation in the atmosphere. In this study, the entire particles are flown
upward to the same height. This equivalent height is called as the initial flying height.
Fig. 4.2.1: The simple figure of airborne chloride transport

New Durability Design Specification on Chloride Ions Penetration for RC Structures Swatekititham S. 2004
40
In Fig.4.2.1, the wind speed at sea surface acts as driven force to the wave to concrete
water breakings. Simultaneously, the upper wind acts as the driven force to the airborne
chlorides transport along the distance from seashore. Thus, the energy from the wind
transfers to the airborne particles and allow the particles to move with the speed of U,
horizontally. Again, the wind speed data using in this analysis is used the average wind
speed in hourly constantly with distance from seashore and height from mean sea level,
as well.
Applying the energy theorem, the height of particles movement at point A to point B in
Fig 4.2.1 is related with wind speed in the second power. In addition, sea wave in a
certain height gives extra energy for driving airborne particles moving in higher
distance. The energy from wave [35] is proportional to the wave height and wind speed
as shown
where, ρsea is the density of seawater (kg/m3)
hwave is height of wave (m/s) (= proportional to wind speed, U)
g is gravitational acceleration (m/s2)
h is the initial flying height (m)
U is the wind speed (m/s)
The calculation of the initial height is simplified depending on the function of wind
speed only. The initial flying height (h) at B point is calculated by
281
wavesea ghE ρ= (4.2.1)

New Durability Design Specification on Chloride Ions Penetration for RC Structures Swatekititham S. 2004
41
where, β is the modification factor due to wave energy (= 4/3)
α is the modification factor due to wind speed (= 1/2g)
Despite the fact that, wave energy in the equation is containing in the wave before
breaking by concrete blocks. Hence, some of energy is absorbed by the concrete wave
breaking, and the residual energy still stored within the airborne particles. The energy of
the airborne particles driving upward is the combination between kinetic energy and
residual energy inside the airborne droplets. At this moment, the amount of absorbed
energy after wave breaking giving to the airborne particles is unknown. Therefore, the
airborne particles movement in upward direction is due to the combination of both wind
and wave energy. In fact, the wave energy due to wave height is also related with wind
speed, the speed of upward movement should be in the function of wind, as well. In fact
of the combination between kinetic energy and the residual energy from wave, the
initial flying height is higher than that in the case of neglecting wave energy. According
to this unknown of residual energy from breaking wave, the simplification on the
equivalent of flying height should be done for more precise calculation. Value of h
calculated by Eq.4.2.2 is the empirical formula estimating the actual flying height of the
airborne particles. The multiplication factors are proposed in this study as β and α. The
value of α is considered as the coefficient expressing the relationship between the initial
flying height and the wind speed. In this paper, the value of α is recommended as equal
to 1/2g. Furthermore, the value of β is expressed as the multiplication factor due to the
(4.2.2) 2.. Uh αβ=

New Durability Design Specification on Chloride Ions Penetration for RC Structures Swatekititham S. 2004
42
additional of residual energy from wave. The consideration of sea slope and shape of the
obstacles along shoreline is neglected. Thus, the average residual energy of wave after
breaking is thought as 4/3 of the initial flying height due to the driving energy of wind
speed. Thus, the computation of airborne particles formation flying to a certain height is
averaged for the verification of data allover Japan. The relationship between the initial
flying height and the wind speed is computed as shown in Fig.4.2.2.
Fig. 4.2.2: Relation of height of aerosol and wind speed in Eq.4.2.2
4.3 Model on airborne chlorides transportation
Next the transportation from an initial flying height through the distance is considered
by the law of motion of a particle in the air. At the same time the gravitational force
makes the particle fall down to the ground. This phenomenon is called as gravitational
settlement. The rate at which a particle falls through air under the action of gravity
depends not only upon the size and density of the particle but also its shape. The
majority of analyses in this subject assume that each particle is the spherical shape.
0
10
20
30
40
50
60
70
0 5 10 15 20 25 30 35wind speed (m/s)
Hei
ght
of a
eros
ol a
irbor
nech
loride
par
ticl
es (
m)
New Durability Design Specification on Chloride Ions Penetration for RC Structures Swatekititham S. 2004
43
In general, the mechanism of transportation is due to gravitational settlement. However,
the complicate simulation of the particles movement needs the computational program.
Moreover, the actual scenery at seashore such as, residents, tree, and etc., has a
difficulty of the particles transport. The computational model should be proposed in an
average free-space movement without obstacle along the moving path. The mechanisms
are the advection due to winds and the gravitational settlement as criteria for simulating
the transportation.
When a body is suspended in airflow, 3 components of forces are acting on the airborne
particle. One is the self-weight of the body within prevailing gravitational field. The
weight of sphere of diameter d is
W = 1/6.ρs.π.d3.g (4.3.1)
Second is the resisting force due to the volumetric up trust force. During gravity, the
sphere displaces it own volume of fluid and will experience the up trust force equal to
the weight of fluid displaced, i.e.
Nuptrust = 1/6.ρair.π.d3.g (4.3.2)
where, .ρs is density of particles (kg/m3) = 1086 kg/m3
.ρa is density of air (kg/m3) = 1.29 kg/m3 at 1 atm [29]
d is particle diameter (m)

New Durability Design Specification on Chloride Ions Penetration for RC Structures Swatekititham S. 2004
44
Thirdly is the drag force on resisting on the projected area of spherical shape of airborne
particle. The particle is moving relative to airflow then it will experience a further
resistance due to drag. A general expression of drag force is
Ndrag = 1/2 Cd Ab.ρair v2 (4.3.3)
where, Cd is coefficient of drag
Ab is projected area (πd2/4), m2
v is constant dropping speed (m/s)
Many investigators have investigated relationships between drag coefficient, Cd, and
Reynolds’ Number, Re, for fully submerged bodies. For the particular case of laminar
flow around a particle, Sir George G. Stokes (1819-1903) proposed that
Cd = 24 / Re (4.3.4)
And
Re = ρair .v.d / µair (4.3.5)
where, µa is dynamic viscosity of air (Ns/m2)
Substitution of Eq. (4.3.4-4.3.5) to Eq. (4.3.3) gets
Ndrag = 3πv.µair.d (4.3.6)
The equilibrium of the vertical motion due to the balancing of force acting at the

New Durability Design Specification on Chloride Ions Penetration for RC Structures Swatekititham S. 2004
45
airborne particle is shown in Fig. 4.3.1. Therefore the up trust or uplift force resisting
the particle is much smaller than the gravitational force according to the density of air
medium is only 1.29 kg/m3 in 1 STP. The particle accelerates downwards, its velocity, v,
and increases until the drag equals the downward force. As described above, the
equilibrium of gravitational motion is written as
dvgd iraairs µπρρπ 3)(61 3 =−
Fig. 4.3.1: Equilibrium of vertical force by gravitational settlement.
The equation is referred as Stokes’ Law, where up trust force is negligible (ρs>>ρair). The
value of µair is calculated by kinematic viscosity divided by density of air. The
kinematic viscosity of air at 1atm shows the function of temperature as in Fig. 4.3.2.
Referred to Fig. 4.3.3, the vertical motion by gravitational force at the maximum height
falls down with gravity acceleration (m/s2). The decreasing of acceleration occurs from
the drag resistance. At a certain height, h, the vertical acceleration is zero and vertical
(4.3.7)
Water particle
gdair3
61 πρ
gds3
61
πρ
airvd µπ3
Weight
Up trust
Drag
Water particle
gdair3
61 πρ
gds3
61
πρ
airvd µπ3
Weight
Up trust
Drag

New Durability Design Specification on Chloride Ions Penetration for RC Structures Swatekititham S. 2004
46
movement is in constant wind speed.
Fig. 4.3.2: Kinematic viscosity (m2/s) of air at 1atm as a function of temperature (°c)
obtained from (www.ce.utexas.edu)
During vertical motion, horizontal wind speed brings the particle transport for a distance.
Wind speed and particle size affect to how long it can be blown. Thus, total time of
transportation t is computable as the equilibrium of motion in both vertical and
horizontal direction.
Fig. 4.3.3: Transport mechanism due to vertical and horizontal motion.
v = const.dth
Xdth
X
U
v = const.dth
Xdth
X
U

New Durability Design Specification on Chloride Ions Penetration for RC Structures Swatekititham S. 2004
47
t = h/v = X/U (4.3.8)
where, X is the horizontal distance (m)
t is the transportation time to the ground (sec)
v, is vertical speed (m/s)
The Eq.4.3.7 integrates with Eq.4.3.8 and the result shows the relationship between
vertical speed and the specific particle size as illustrated in Fig.4.3.4.
0
3
6
9
12
15
0 100 200 300 400 500 600
Particle size (x 10-6)
Ver
ticle
vel
ocity
(m
/s)
Fig. 4.3.4: Relationship between dropping velocity and specific particle sizes
At a constant wind speed, a water particle size is dropped at a distance depending on
size. In this behavior, it becomes the important of this model on the hypothesis that a
structural location, only 1-size of airborne chlorides can fly to it. This assumption is
under the condition of constant wind speed. Conversely, the actual environment has
fluctuation of wind speed in a period of time, thus in this study, the consideration of
wind speed is necessary in the hourly interval. This is a laborious work on simulating
chloride concentration at surface of concrete accumulated a numbers of years, but the
simulation in every hours is done for high accuracy. As a result, wind fluctuation during
an hour is averaged as a constant value. This constant wind speed is used to analyze the
particle size that can fly to a considered structure. As shown in Fig.4.3.5, one effective

New Durability Design Specification on Chloride Ions Penetration for RC Structures Swatekititham S. 2004
48
size can fly to a specific distance as followed the Newton’s Law.
Fig. 4.3.5: Profile of 1-size particle affects on a distance in a constant wind speed U
The results of wind speed and particle size relationship with the distance from seashore
are shown in Fig. 4.3.6. Next the volume of each particle size is unknown; consequently
the investigation of particle size distribution and volume is necessary. Although, there is
no means to observe the volume and size distribution at seashore area, the indirect
method is proposed in this model. The method is done in backward from the
investigated data by PWRI [1] combining with above discussion. Thus, the particle size
distribution and volume of salt is assumed for reaching the investigated results. In
addition, the wind speed influences the volume and size distribution as well. This
phenomenon happens because winds result strong wave and large volume of aerosol.
The reference of volumetric water particle at seashore is set as 2.0mm3/dm2 /hr with
wind relationship at 2m/s. Inside the water particle, it contains 3% of salt concentration
as same as the concentration form sea. The value of 0.06mg/dm2/hr is the calculation of
weight of chlorides content in the water particle. The particle distribution the reference
wind speed is calculated by the assumption of normal distribution with the standard
deviation,σ, of 18 µm. The conversion from volume of airborne water particles flying to
a structure is done to obtain the weight of chlorides content (mg). In the Fig. 4.3.7, the
t
U
t
U
X

New Durability Design Specification on Chloride Ions Penetration for RC Structures Swatekititham S. 2004
49
x-axis is the particle size, which relates to the distance from seashore. At the peak value
of chloride content by weight, it is equivalent to the distance at seashore (= about 10m
length from concrete wave breaking to average coastline). The smaller particle sizes can
transport in further distance from seashore. The particle size at 33µm is the particle size
dropping at seashore, and the particle sizes in right-half of the normal distribution do
not take into account. Since, the large size particles drops at very short distance within
10m from the concrete wave breaking.
Fig. 4.3.7: The reference value of chloride content with particle size (µm) under the
condition of 2 m/s wind speed and standard deviation at 18 (µm)
The normal distributions of weight of airborne chloride in other wind speeds are
calculated by the relationship of third power on reference wind speed. The weight of
water particle at seashore in higher wind speed cause the larger volume of aerosol and
bigger size distribution. The standard deviation of the size distribution is also
considered as the max size ratio. The max size ratio means the proportion between
maximum size at a wind speed (particle size at seashore) and reference wind sped
(2m/s). The formula of modification for weight of chloride content is shown below
3)/2(, ]
2[U
WW smpeakipeak ×= (4.3.9)

New Durability Design Specification on Chloride Ions Penetration for RC Structures Swatekititham S. 2004
50
Fig. 4.3.6: The airborne particle size (µm) influence at a specific distance (m) in various
wind speeds (m/s)
The formulation of modification for the standard deviation is shown as
Effective airborne particle size with wind relation
0
100
200
300
400
500
600
700
0 100 200 300 400 500 600 700 800
distance (m)
Part
icle
siz
e, m
(x 1
0 -6
)
U = 2 m/sU = 3 m/sU = 4 m/sU = 5 m/sU = 6 m/sU = 7 m/sU = 8 m/sU = 9 m/sU = 10 m/sU = 11 m/sU = 12 m/sU = 13 m/sU = 14 m/sU = 15 m/sU = 20 m/s
max,2
max,)/2( d
dismi ×= σσ (4.3.10)

New Durability Design Specification on Chloride Ions Penetration for RC Structures Swatekititham S. 2004
51
where, di,max is maximum airborne particle size at seashore at a particular U
d2,max is maximum airborne particle size at seashore at U = 2m/s
Wpeak is the peak weight of airborne chloride at U (mg/dm2/hr)
Wpeak(2m/s) is the peak weight of airborne chloride at U=2 m/s (mg/dm2 /hr)
σi is standard deviation at U ((µm)
σ(2m/s) is standard deviation at U = 2 m/s (µm)
The interrelation among wind speed, distance and chlorides content are known as shown
in Table 4.3.1. Then, wind directions are important parameters, the consideration of
wind directions should be linked with the formula described above. In each location, the
effective wind speed is defined as the shortest distance from sea to the considered
distance. For example, the investigation of a structure in Kochi prefecture is due to
South wind. Other wind directions in ± 67.5° from south generally influence to flying of
airborne chloride to the structure. It is noted that the wind direction may not be always
fixed at ± 67.5°, due to the panorama of coastline. However the effect of wind direct is
considered by equivalent to the distance from seashore. For example, a structure locates
at X (m) from seashore with the efficient wind direction from South. Once wind
direction changed to S-W direction, the distance that airborne chlorides fly to the
structure is longer. The distance in an efficient wind speed (X’) is calculated by
X’ = X /cosϕ (4.3.11)
where, ϕ is angle of an efficient wind to effective wind direction [Ex. S-W is 45°]

New Durability Design Specification on Chloride Ions Penetration for RC Structures Swatekititham S. 2004
52
Table 4.3.1: Value of airborne particle size and chloride content related with wind and
distance from seashore calculated from reference value in Fig. 4.3.7 with
Eq.(4.3.9-4.3.10)
10 30 50 100 200 300 400 500 600 700 8001 12 7 6 4 3 2 0 0 0 0 0
2 33 19 15 10.5 7.4 5.9 5 4 3 0 0
3 55 35 27 19 14 11 9.5 9 8 7 6
4 90 55 42 30 21 17 15 13 12 11 10
5 123 80 60 40 30 24 21 19 17 16 156 170 100 78 55 39 31 27 24 22 20 19
7 220 120 97 68 50 39 34 31 29 26 24
8 250 160 120 85 60 49 41 36 34 31 29
9 300 180 150 98 70 58 50 45 41 37 34
10 350 250 170 120 82 65 58 53 47 44 4011 390 240 190 130 95 75 65 60 55 51 47
12 440 270 220 160 110 89 76 70 65 60 56
13 470 313 242 174 125 101 88 80 70 67 62
14 510 340 274 195 135 114 97 87 79 73 69
15 545 378 300 214 154 125 109 96 88 82 7620 640 497 410 299 213 174 151 136 124 114 107
25 830 690 595 452 326 267 232 207 190 176 165
30 934 820 728 579 426 350 305 270 248 230 220
U= SD
1 6.5 0.01 0.00 0.00 0.00 0.00 0.00 0.00 0.00 0.00 0.00 0.002 18.0 0.06 0.03 0.02 0.02 0.01 0.01 0.01 0.01 0.01 0.00 0.00
3 30.0 0.20 0.10 0.07 0.05 0.03 0.03 0.03 0.03 0.02 0.02 0.02
4 49.1 0.48 0.22 0.16 0.11 0.08 0.07 0.06 0.06 0.05 0.05 0.05
5 67.1 0.94 0.50 0.33 0.20 0.16 0.13 0.12 0.11 0.11 0.10 0.10
6 92.7 1.62 0.70 0.52 0.35 0.26 0.22 0.20 0.19 0.18 0.17 0.177 120.0 2.40 0.84 0.73 0.49 0.38 0.32 0.29 0.28 0.27 0.25 0.25
8 136.4 3.84 1.97 1.31 0.87 0.63 0.54 0.48 0.45 0.43 0.42 0.40
9 163.6 5.47 2.34 1.96 1.19 0.87 0.76 0.69 0.65 0.62 0.59 0.57
10 190.9 7.50 5.27 2.59 1.71 1.20 1.02 0.95 0.90 0.84 0.82 0.78
11 212.7 9.98 5.50 3.47 2.21 1.65 1.38 1.26 1.21 1.15 1.11 1.0712 240.0 12.96 6.20 4.66 3.15 2.19 1.86 1.68 1.60 1.53 1.47 1.42
13 256.4 16.48 8.90 6.16 4.09 2.94 2.47 2.24 2.11 1.96 1.91 1.84
14 278.2 20.58 11.14 8.15 5.30 3.66 3.18 2.83 2.64 2.50 2.39 2.32
15 297.3 25.31 14.54 10.37 6.72 4.77 3.99 3.61 3.31 3.14 3.02 2.90
Weight of chloride content (mg/dm2/hr)
Airborne Particle Size (m x10-6)U / Dist (m)

New Durability Design Specification on Chloride Ions Penetration for RC Structures Swatekititham S. 2004
53
Table 4.3.2: The example of calculation method in order to obtain the total chloride
content in mg/dm2/month
In Table 4.3.2, the calculation of airborne chloride accumulation in a month has to
consider in every hour. The wind speed in each hour is set as a constant with a direction.
In the example, S-W direction is the effective wind direction for this location. The wind
in each direction is calculated using Eq.4.3.11.
The wind without efficient direction is set zero value in the column of (Eff. Wind). The
procedure in order to obtain the hourly chloride content is calculated using Eq.
4.3.9-4.3.10. Finally, the total chloride content in a month and average value in a day
are obtained for verifying with the investigated data [1]. It is noted that the investigated
data is the salt content which has to covert to the value of chloride content before the
verification. In the verification, the samples, where are located at seashore, have to be
generally assumed at 30m as the location of settlement the apparatus. The result of
verification shows in Fig. 4.3.8.
Time Wind Eff B*C Eff Eff Eff Peak Max size SD' Z area Hourly Wind hr m/s wind m/s dist dia. Volume weight at seashore value norm dist Weight CL direction 1st 0 0 0 0 0 0.00 0.00 0.0000 0.0000 - 2nd 1 0 0 0.0075 12 4.18 0.00 0.0000 0.0000 N-E 3rd 2 0 0 0.06 33 11.50 0.00 0.0000 0.0000 N-W 4th 1 0 0 0.0075 12 4.18 0.00 0.0000 0.0000 N-E 5th 1 1 1 209 3 1E-17 0.0075 12 4.18 -2.15 0.0157 0.0002 N-W-W 6th 0 0 0 0 0 0.00 0.00 0.0000 0.0000 - 7th 1 0 0 0.0075 12 4.18 0.00 0.0000 0.0000 N 8th 1 1 1 86 4.5 5E-17 0.0075 12 4.18 -1.79 0.0364 0.0005 S-S-W 9th 1 1 1 80 5 7E-17 0.0075 12 4.18 -1.67 0.0471 0.0007 S-W 10th 2 1 2 86 12 9E-16 0.06 33 11.50 -1.83 0.0339 0.0041 S-S-W 11th 2 1 2 86 12 9E-16 0.06 33 11.50 -1.83 0.0339 0.0041 S-S-W 12th 2 1 2 86 12 9E-16 0.06 33 11.50 -1.83 0.0339 0.0041 S-S-W 13th 1 1 1 80 5 7E-17 0.0075 12 4.18 -1.67 0.0471 0.0007 S-W 14th 2 1 2 86 12 9E-16 0.06 33 11.50 -1.83 0.0339 0.0041 S-S-W
744th 8 0.0185 (mg/dm 2 /month)
Summation of data from 1st hour to last hour in a

New Durability Design Specification on Chloride Ions Penetration for RC Structures Swatekititham S. 2004
54
Data Notes X(m) Data Cal.Shikoku-May 80 7.5 6.0Hokaaido-Dec 20 213.2 210.0Shikoku-Aug 200 0.7 2.0Shikoku-Apr 400 0.4 1.2Shikoku-Nov 50 0.4 1.2
Kochi-Oct 30 2.1 4.0Kochi-Oct 100 0.6 1.8Kochi-Oct 300 0.3 1.0
Okinawa-Sep 50 352.8 288.3Chuukoku-Dec 50 150 144.0
0
100
200
300
400
0 200 400Data of monthly Cair (mg/dm2)
Cal
cula
ted
mon
thly
,C
air (
mg/
dm2 )
Fig. 4.3.8: The verification by hourly simulation in selected samples
The overall systematic calculation is expressed in Fig. 4.3.9 and shows the procedures
of calculation. The 10 individual data were used to verify the model. It is very complex
to simulate each case by hourly data in a month or year. The standard environmental
condition should be created for easier simulation. This method is proposed in order to
reduce the simulation process. Firstly, the standard environments are separated into 4
zones as below
Zone 1: Okinawa area
Zone 2: Japan-Sea coastline (Hokkaido to Niigata Prefecture)
Zone 3: Pacific Ocean Coastline
Zone 4: Chuubu to Nagasaki
The 4 zones are separated as shown in Fig. 4.3.10 depending on the characteristic of
environmental conditions and level of severity. The separation of severity has been
recommended into 3 zones of Okinawa, Japan Sea coastline and others [19-22].

New Durability Design Specification on Chloride Ions Penetration for RC Structures Swatekititham S. 2004
55
Fig. 4.3.10: The separation of 4 severe zones on chloride attack around Japan.
The 4 red marks in Fig. 4.3.10 represent the selected environmental conditions in each
zone. The area is selected in a moderate severe region of each zone and the weather
condition is selected in year 1985 according to the date of investigated data. The data of
the environmental condition are obtained by the observation of government section (See
www.data.kishou.go.jp). The providing of average data in different time and locations
are wind speed, wind direction, rain, sunshine hours, humidity, temperature, and etc.
The standard weather condition is created due to the information observed in a zone.
Firstly, the monthly effective wind speed is calculated by referring to Table 4.3.2. The
monthly average value is done by
< 0.1 mdd
0.1- 1.0 mdd
1.0-10.0 mdd
>10.0 mdd
< 0.1 mdd
0.1- 1.0 mdd
1.0-10.0 mdd
>10.0 mdd
1
2
34
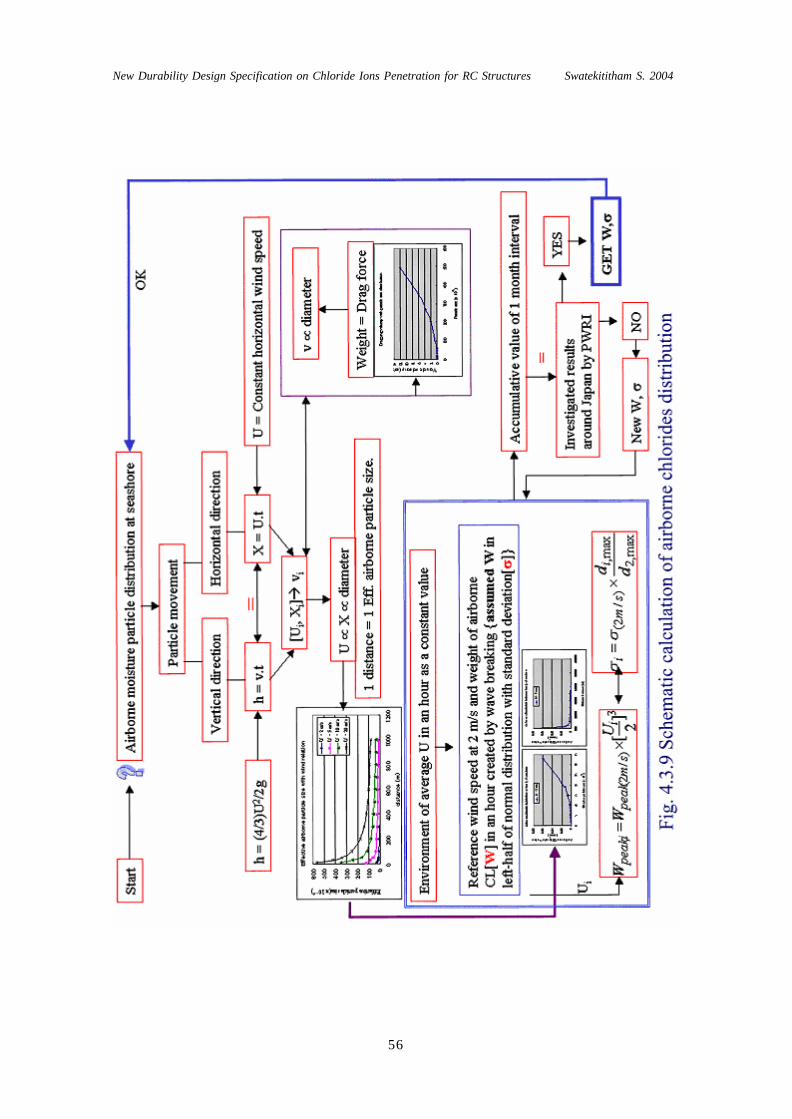
New Durability Design Specification on Chloride Ions Penetration for RC Structures Swatekititham S. 2004
56

New Durability Design Specification on Chloride Ions Penetration for RC Structures Swatekititham S. 2004
57
Ueff = ΣUe / Σre (4.3.12)
where, Ueff is monthly effective wind speed with equivalent airborne chloride (m/s)
ΣUe is monthly summation of wind only in the efficient wind directions (m/s)
Σre is monthly summation of efficient wind directions (hrs)
Fig. 4.3.11: The effective wind speed in monthly value in 4 zones
The effective wind speed, Ueff in Fig. 4.3.11 is calculated and found that it is higher than the average wind speed. The Ueff is proved as an equivalent of chloride content and verified in Fig. 4.3.12.
0
2
4
6
8
10
12
0 2 4 6 8U Average
Eff
ectiv
e U
(for
Equ
iv. C
air)
y = 0.02x3 + 1.1xR2 = 0.94
Fig. 4.3.12: The verification of effective wind speed and average wind speed
0
2
4
6
8
10
12
0 2 4 6 8 10 12 14Month
Mon
tly E
ff. w
ind
spee
d(m
/s)
ZONE1 ZONE2 ZONE3 ZONE4

New Durability Design Specification on Chloride Ions Penetration for RC Structures Swatekititham S. 2004
58
Next, the numbers of efficient wind hours is averaged daily and used for analyzing the
efficient wind speed as described above. The summarization of results for all 4 zones is
shown in Fig. 4.3.13. The figures in each zone are consisted of the average wind speed
in each month and the effective wind direction averaged per days.
Fig. 4.3.13: The effective wind speeds (m/s) and hours of effective wind (hrs/day)
ZONE2
6.95.6 6.1
3 3.32.6 2.3 2.4 2.4
5.757.2
6.3
0
2
4
6
8
10
1 2 3 4 5 6 7 8 9 10 11 12
02468
101214
1 2 3 4 5 6 7 8 9 10 11 12Month
Effective wind speed m/s
ZONE3
4.05 3.84.65
5.86.55
3.6 3.8 4 4 45 4.8
0
2
4
6
8
10
1 2 3 4 5 6 7 8 9 10 11 12
02468
101214
1 2 3 4 5 6 7 8 9 10 11 12Month
ZONE4
3.44.7
3.92.5
3.4 3.12
2.8 33.8 4.2 4
0
2
4
6
8
10
1 2 3 4 5 6 7 8 9 10 11 12
02468
101214
1 2 3 4 5 6 7 8 9 10 11 12Month
ZONE1
53.7
4.5 4.6 4.14.8
4 4
10.1
4.55 4.153.6
0
2
4
6
8
10
1 2 3 4 5 6 7 8 9 10 11 12
Effective wind direction per day
0
5
10
15
1 2 3 4 5 6 7 8 9 10 11 12Month
Effective wind speed m/s

New Durability Design Specification on Chloride Ions Penetration for RC Structures Swatekititham S. 2004
59
4.4 Verification on airborne chlorides formation and transportation
The uniform environmental conditions in Fig. 4.3.13 are used to calculate the chloride
contents in each month and verify with the investigated data of accumulative airborne
chlorides. Raining period is no effect to the transportation of airborne particle to
structures. The data was classified into various distances and only the data at distance of
0m, 100m and 500m are shown. In zone 1 to 4 (Fig4.4.1-4.4.4), some months are used
the average value for comparison excluding the severe months in a year. In zone1, the
most severe is in September due to storm effect; however this analysis is lower in this
month. It can be said that the calculation is underestimated under the environment
during storm period as shown in Fig.4.4.1. The storm affect to the wave energy which
provide large effect to the amount of airborne particle formation in the atmosphere after
wave breaking. In zone 2, the winter season show high chloride content according to the
high wind speed during this time. In this case, the calculated results are also
underestimated and illustrated in Fig.4.4.2. However the formula of wind speed
relationship in third power is changed to the forth power, the overestimated of data is
certainly too high. The optimum wind speed value is between third to forth power, but
the third power is thought as the most accurate relationship in this study.
The calculation of the results in four zones is calculated without the effect of height. In
general the height effect can be modified as the equivalent to the distance according to
the calculating procedure described above. The airborne chloride in height 5m- 10m has
not so large variation of chloride content. The available at the same distance in a
separated zone is plotted together in order to show the macro-scale comparison of the

New Durability Design Specification on Chloride Ions Penetration for RC Structures Swatekititham S. 2004
60
computational model. The investigated results by PWRI have no supporting data on the
exact position and real scenery at seashore area. Again, the settlement of the apparatus
may not set exactly in the effective wind direction. In summary, three unknown
parameters, which cause the scattering of data in verification, are height effect, seashore
scenery, and settlement of the equipment. Moreover the effect due to residual wave
energy acting on the airborne formation is also considered as further study of this study.
In order to understand the scattering level of overall data comparing with the calculation
results, the data all around Japan are plotted by separating in macro-scale into 4 zones as
shown in Fig.4.3.10. The comparison of 1-year accumulative airborne chlorides for all
available data by PWRI 1988 is illustrated in Fig4.4.5. The further study on airborne
chlorides formation is vital for reducing the scattering of data.
0.1
1
10
100
1000
10000
0.1 1 10 100 1000 10000
1-year Accumulative C air Data (mg/dm2)
1-ye
ar A
ccum
ulat
ive
C air
Cal
cula
tion
(m
g/dm
2 )
Zone1Zone2Zone3Zone4
Fig.4.4.5 Verification on 1-year accumulative airborne chlorides for overall data by
PWRI

New Durability Design Specification on Chloride Ions Penetration for RC Structures Swatekititham S. 2004
61
ZONE 1
Cair in Zone 1 (0-50m)
050
100150200
0 5 10 15month
Cai
r (m
dd)
0m
50m
Cair in Zone 1 (100m)
0
5
10
15
0 5 10 15month
Cai
r (m
dd)
Cair in Zone 1 (500m)
05
101520
0 5 10 15month
Cai
r (m
dd)
Fig.4.4.1: Verification of Zone 1 in Okinawa area. (Data from PWRI, 1985 [1])
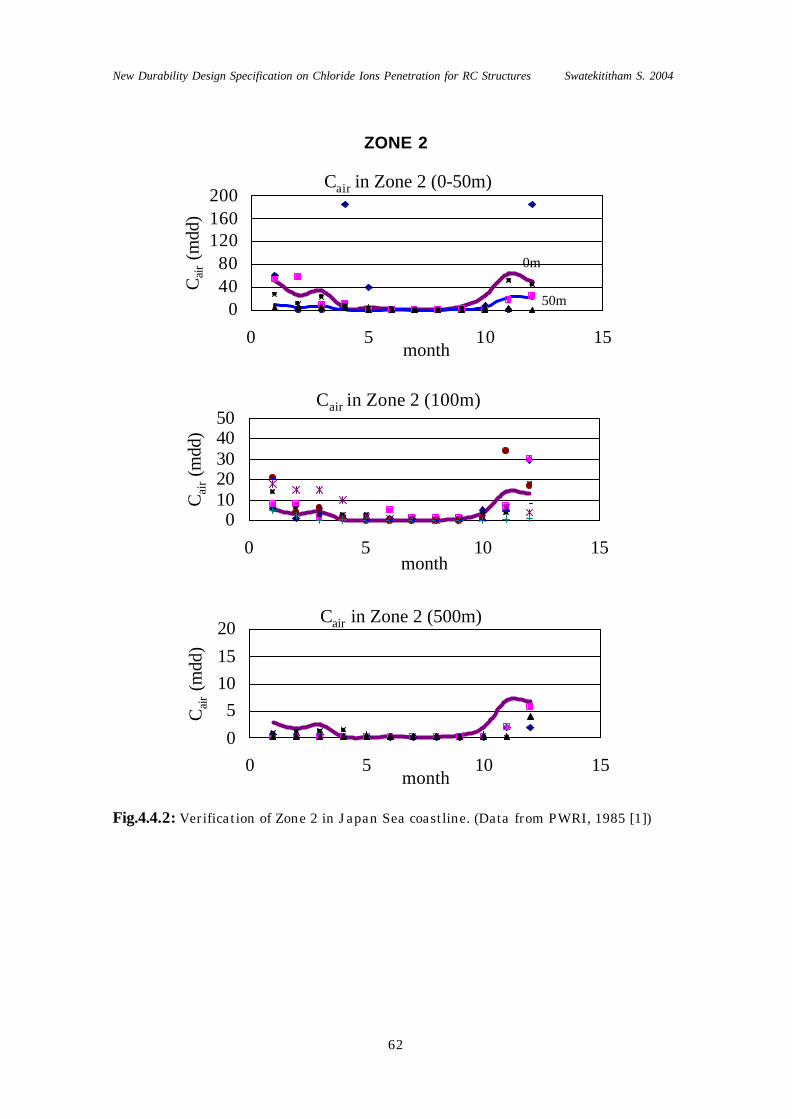
New Durability Design Specification on Chloride Ions Penetration for RC Structures Swatekititham S. 2004
62
ZONE 2
Cair in Zone 2 (0-50m)
04080
120160200
0 5 10 15month
Cai
r (m
dd)
0m
50m
Cair in Zone 2 (100m)
01020304050
0 5 10 15month
Cai
r (m
dd)
Cair in Zone 2 (500m)
0
51015
20
0 5 10 15month
Cai
r (m
dd)
Fig.4.4.2: Verification of Zone 2 in Japan Sea coastline. (Data from PWRI, 1985 [1])

New Durability Design Specification on Chloride Ions Penetration for RC Structures Swatekititham S. 2004
63
ZONE 3
Cair in Zone 3 (0-50m)
0
5
10
0 5 10 15month
Cai
r (m
dd)
0m50m
Cair in Zone 3 (100-150m)
0
1
2
3
0 5 10 15month
Cai
r (m
dd)
Cair in Zone 3 (500m)
0
1
2
3
0 5 10 15month
Cai
r (m
dd)
Fig.4.4.3: Verification of Zone 3 in Pacific Ocean coastline. (Data from PWRI, 1985 [1])

New Durability Design Specification on Chloride Ions Penetration for RC Structures Swatekititham S. 2004
64
ZONE 4
Cair in Zone 4 (0-50m)
0
3
6
0 5 10 15month
Cai
r (m
dd)
0m
50m
Cair in Zone 4 (100m)
00.5
11.5
2
0 5 10 15month
Cai
r (m
dd)
Cair in Zone 4 (500m)
00.5
11.5
2
0 5 10 15month
Cai
r (m
dd)
Fig.4.4.4: Verification of Zone 4 in Chuubu and Chuukoku Area. (Data from PWRI,
1985 [1])

New Durability Design Specification on Chloride Ions Penetration for RC Structures Swatekititham S. 2004
65
4.5 Model Modification
The model presented above is the average model with free space transport in the
atmosphere. The modification is necessary due to the scenery of the structure allocation.
Firstly the costal landscape and artificial seawall are considered as in Fig.4.5.1. The
recommendation on consideration of this difference is done by modifying the parameter
of β in Eq.4.2.2. The natural or artificial offshore topography such as sea slope and
concrete wave breaking wall in various angels and heights influence to the initial flying
height.
Fig.4.5.1: Sea-based landscape and seawall influence aerosol formation
Besides, the amounts of airborne chlorides formation in case of with and without
obstacles for wave breaking along seashore are different. The modification on the
amount of airborne chlorides in Table 4.3.1 is necessary. The modification factor on the
amount of airborne chlorides is proposed as R(d) in Eq.4.5.1.
C’air,hr = Cair,hr. R(d) (4.5.1)
where, C’air,hr is modified airborne chlorides after obstruction (mg/dm2 /hr)
Cair,hr is free transport airborne chlorides in Table 4.3.1 (mg/dm2/hr)

New Durability Design Specification on Chloride Ions Penetration for RC Structures Swatekititham S. 2004
66
R(d) is modification factor due to obstacle
R(d) is the modification factor due to 2 main items of the obstacles for wave breaking in
the sea and the obstacles inland along the distance from seashore. R(d) is the parameter
to modified the free space transportation proposed in the Section 4.2-4.3. One of the
investigated results is studied for obtaining value of R(d) as illustrated in Fig.4.5.2. The
R(d) value is approximated by analyzing the reduction on the amount of airborne
chlorides in a distance due to the residents, buildings and natural topographies. If the
obstruction is constructed at 100 meter from seashore, the value of R(d) is
R(d) = 1.0 from 0 meter to the location of an obstacle
R(d) = 0.4 after passing an obstacle
R(d) is not always fixed as a constant value, thus many factors affecting to the
transportation due to variety of obstacles. For the achievement of R(d), many
investigated data should be considered and analyzed as the further study of this study.
Fig.4.5.2: The investigated of the airborne chloride transport in the obstacle effect [19]

New Durability Design Specification on Chloride Ions Penetration for RC Structures Swatekititham S. 2004
67
CHAPTER 5
Model of accumulated chloride concentration on the surface of concrete

New Durability Design Specification on Chloride Ions Penetration for RC Structures Swatekititham S. 2004
68
5.1 Introduction
The model in this chapter is shown the accumulated chloride concentration with the
parametric study and verification as shown in Fig.5.1.1
Fig.5.1.1: Schematic model of accumulative chloride concentration
The simulation in Chapter 4 shows that the airborne transport mechanism to a certain
distance is known as in the function of wind speed in third power. In general, the
amount of chloride concentration in concrete for the structures near seashore should be
high. This causes by the amount of airborne chlorides transport to the structures. The
airborne chlorides transported with the wind blow are adsorbed on the surface of
concrete structures. The airborne chlorides are transported with the water particles to the
surface of structures, so the absorption to the pore structure in the boundary layer
happens. The literatures were proposed the boundary layer as 1cm depth from surface of
concrete in unit of kg/m3. This definition of the boundary layer was recommended
because of unknown amount of airborne chlorides. The chloride concentration inside
concrete averaged 1 cm depth from surface is represented as the boundary layer. Once,
Airborne chlorides formation & Transportation
Input OutputVerification by data from PWRI
1.
Accumulative chloride concentration on surface of concrete
Input OutputVerification by Experimental data (Kochi)
2.
Chloride concentration in concrete by DuCOM
Input OutputVerification by data from PWRI
3.

New Durability Design Specification on Chloride Ions Penetration for RC Structures Swatekititham S. 2004
69
the amount airborne chlorides transported to the surface of structures are known, the
new definition of boundary layer is more suitable. The boundary layer is thought as the
layer which is the adsorption layer of airborne chlorides. The boundary layer in this
study is defined as the adsorption layer in the depth of 0 to 1mm from surface of
concrete. The rough and smooth surfaces have the boundary layer about 1mm and
0.08mm, respectively. The unit of chloride concentration in the boundary layer is also in
kg per volume of concrete in m3. In the boundary layer, the chloride concentration in
this layer is due to the amount of airborne chlorides transported to it with neglecting of
diffusive phenomenon into concrete. The reason that the amount of chloride
concentration at surface of concrete is necessary is to use for calculating the chloride
concentration in concrete. The DuCOM program can simulate the chloride penetration
into concrete if the chloride concentration, temperature and relative humidity at the
boundary layer are known. In this paper, the chloride concentration in the boundary
layer is the same as the meaning of chloride concentration at surface of concrete.
Firstly, the chloride concentration in the boundary layer might be easily calculated by
knowing the amount of the amount airborne chlorides adsorbed on surface. The
conversion of the amount of airborne chlorides in unit of mg per unit area per time to
the chloride concentration in the unit of kg per unit volume of concrete is vital. By this
methodology, the structures located near seashore should have high chloride
concentration on the surface of concrete. However, PWRI examined the chloride
concentration in concrete and found that the retaining walls along seashore area in two
different locations have large different chloride contents in concrete. Two examples of
investigated result are done in Yamagata and Ichikawa prefectures which both are

New Durability Design Specification on Chloride Ions Penetration for RC Structures Swatekititham S. 2004
70
constructed near seashore as shown in Fig.5.1.2. Two structures at the same distance are
totally different on the chloride concentration in concrete.
0246
0 50 100Depth (mm)
Chl
orid
eco
ncen
trat
ion
, (kg
/m3 )
0123
0 50 100Depth (mm)
Chl
orid
eco
ncen
trat
ion
(kg/
m3 )
Yamagata
Ichikawa
Fig.5.1.2 Examples of investigated chloride distributions at seashore by PWRI
It is very necessary to study on what the main parameter causes the different of chloride
concentration in concrete in the same location and type of structure. The environmental
parameter and the structure itself are both considered in order to explain this
phenomenon. Many parametric studies such as, temperature, relative humidity, amount
of airborne chlorides, the deteriorated level of crack and concrete property are not able
to explain clearly which are the most effective parameter. Finally, raining is thought as
the parameter which is able to explain this phenomenon evidently. None of the literature
had ever investigated the raining effect to the removal of chloride concentration in the
boundary layer. Several structural members out of the roof are subjecting to rainfall
during raining, and having various surface roughness. The experiment on site is
necessary for investigate the chloride concentration in boundary layer with time history.
After that, the parametric observation of rain and wind effects related with the
accumulation of chloride concentration in the boundary layer is accomplished. Next is
the creation of the model on accumulative chloride concentration in the boundary layer

New Durability Design Specification on Chloride Ions Penetration for RC Structures Swatekititham S. 2004
71
with time dependence. As the results, the model is applicable to predict amount of
accumulative chloride concentration in the boundary layer in any locations of Japan, if
the environmental conditions are known.
5.2 Experimental outlines
5.2.1 The examination of chloride distribution in surface layer
At the real surface of the structures, the surface concrete has to take out to test for the
chloride concentration. Firstly, the investigated area on the selected surface of structure
is set the size of 10 x 10 cm dimensions using sand paper for 1g abrasion. Using of sand
paper is better to stick with a cubic bar for uniformly abrasion. At the same observed
10x10 cm section, the samples are taken for 4 layers more with 1g each. Some of
samples were done in the 3-times bigger area and taken 3g each, such as 15x20 cm, or
10x30 cm. The bigger area was taken in order to provide three times average. However,
the results are compared and there is no much different in any area. In conclusion, the
area of 300cm3 is a better choice for guarantee accuracy. The dustpan with the wind
blocking is used to collect the sample falling down after abrasion. The initial and final
weight of sand paper in each layer should be weighed for deduction the influent weight
of the particles from sand paper out of taken samples. Many existing structures in Kochi
area have investigated with the several of distance from sea, types of structure, and
outdoor or indoor members. The different of surface conditions are also investigated in
3 conditions of smooth, normal and rough as shown in Fig.5.2.1.The taken sample is
used for testing the acid soluble chloride concentration in samples by the titration

New Durability Design Specification on Chloride Ions Penetration for RC Structures Swatekititham S. 2004
72
method. In this method, the result is the acid soluble chloride content and thought as the
total chloride concentration in unit of % weight of sample. The chloride concentration in
kg/m3 of concrete is calculated by assumed that unit weight of concrete is
approximately 2300 kg/m3 for all samples.
Fig.5.2.1: Three surface roughness conditions of investigated structures
The examination was done in three locations with difference distance, and surface
roughness observed in a location, as well. Fig.5.2.2-5.2.4 are three observed structures,
which are concrete block, bridge pier, and box girder, pier and foundation, respectively.
In the Fig.5.2.2, the structure is concrete stairs, which is able to investigate normal and
rough surface conditions. On the right side of concrete stairs, they turn in
Fig.5.2.2: The investigated structure in Maehama at 30m from seashore
smooth normal rough
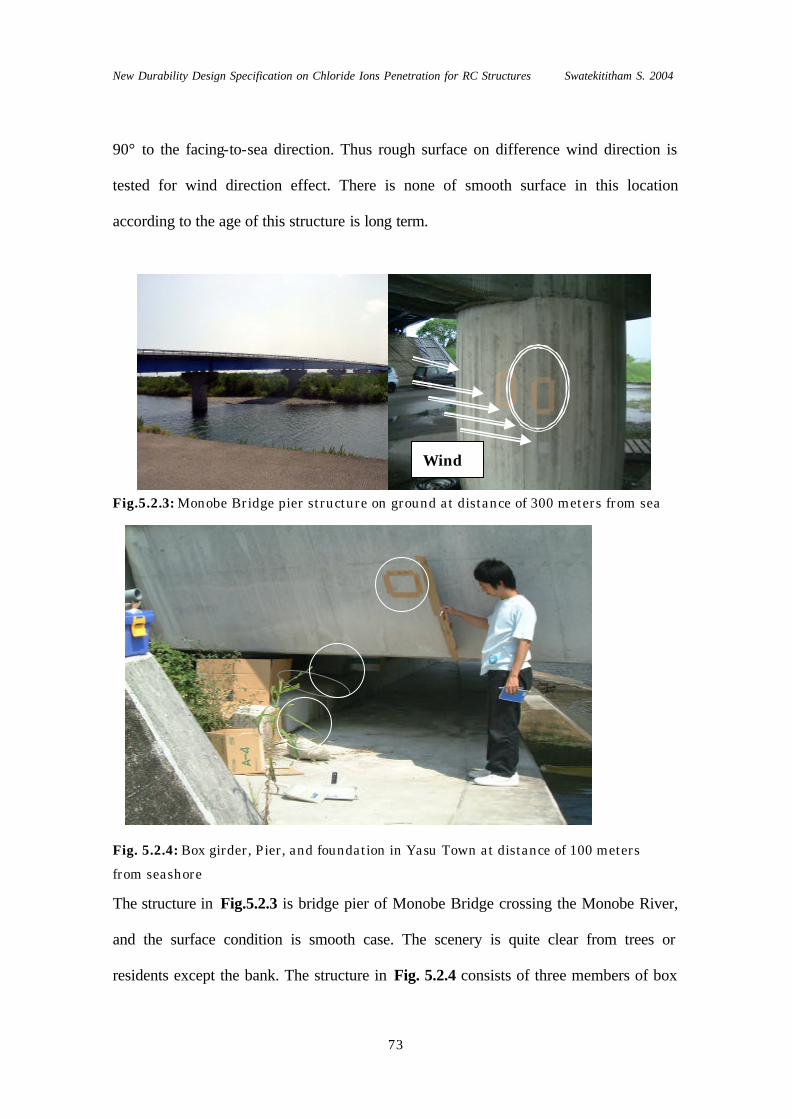
New Durability Design Specification on Chloride Ions Penetration for RC Structures Swatekititham S. 2004
73
90° to the facing-to-sea direction. Thus rough surface on difference wind direction is
tested for wind direction effect. There is none of smooth surface in this location
according to the age of this structure is long term.
Fig.5.2.3: Monobe Bridge pier structure on ground at distance of 300 meters from sea
Fig. 5.2.4: Box girder, Pier, and foundation in Yasu Town at distance of 100 meters
from seashore
The structure in Fig.5.2.3 is bridge pier of Monobe Bridge crossing the Monobe River,
and the surface condition is smooth case. The scenery is quite clear from trees or
residents except the bank. The structure in Fig. 5.2.4 consists of three members of box
Wind

New Durability Design Specification on Chloride Ions Penetration for RC Structures Swatekititham S. 2004
74
girder, foundation and pier in Yasu town. All members are considered as smooth surface.
This structure is quite new structure located at distance of 100 meters from seashore.
The rain affects to box girder and foundation excluding pier. All structures are
investigated with time history. It reminds that the examined surface would not abrade
again.
5.2.2 The examination of Co by considering as the average of chloride in surface depth
The checking of surface roughness is very important of taking sample of the surface
depth. The collected sample depends on the level of roughness until the smooth surface
is achieved. The smooth surface is set as amount of concrete paste on surface. This can
be explained as the taken layer until the aggregate is found. The surface paste is
considered as high w/c and porosity, which is considered at the depth at most 0.08 mm.
The normal and rough surfaces are occurred by erosion of smooth surface by raining.
The degradation of smooth surface takes a several years to make concrete surface
become rougher. The selected area is set a bigger area of 500 cm2 and doing abrasion on
selected surface till surface becomes smooth. Next, the weight of sample taken from
surface should be weighed and deducted weight of sand paper, and then the amount of
total weight could be estimated by the experiment in Section 5.2.1. The taken sample in
this section is used to sieve for finding the distribution of sand particle to powder ratio.
The max size from sieve analysis is defined as the roughness depth of the considered
structures. Another means is using the automatic roughness sensor, which can detect the
roughness during abrasion on surface. The roughness sensor used in this experiment to
measure the roughness of concrete.

New Durability Design Specification on Chloride Ions Penetration for RC Structures Swatekititham S. 2004
75
5.3 Experimental Results
The investigation of chloride concentration in the boundary layer is done using abrasion
test using sand paper. The samples are examined on the surface of concrete within the
specific area in 5 layers from surface. Each investigated layer is limited by the amount
of taken sample weight (g). In Section 5.2.2, the relationship of weight of sample from
abrasion test and surface roughness from the roughness sensor can be obtained, and it is
used to represent the chloride concentration with the depth. At first, the examination
results in each member of concrete stairs at 30 meters from average coastline from MSL
are discussed. The results of normal and rough surface are illustrated in Fig.5.3.1 and
Fig.5.3.2, respectively. The investigation time is examined 6 times during Jun 20th to
Sep 26th, which is in raining season. Both rough and normal surfaces are tested at the
same dates for comparing roughness condition in the same environmental condition.
Fig.5.3.1: Experimental results in the normal surface (kg/m3) with time dependent at
Maehama, Kochi Prefecture (30m from seashore)
0
3
6
9
12
15
0.0 0.2 0.4 0.6 0.8Depth from surface (mm)
Chl
orid
e co
ncen
trat
ion
(kg/
m3 )
20-Jun 9-Jul 15-Jul6-Sep 23-Sep 26-Sep

New Durability Design Specification on Chloride Ions Penetration for RC Structures Swatekititham S. 2004
76
Fig.5.3.2: Experimental results in the rough surface (kg/m3) with time dependent at
Maehama, Kochi Prefecture (30m from seashore).
These results on June 20th in both roughness show that the chloride concentration in
normal roughness has higher value than it on rough surface. It does not mean that
chloride adsorption in normal surface is more severe than rough surface. Surface
roughness affect to the adsorption by the factor of specific surface area. High specific
surface area affects both adsorbed and dissolved capability on surface of concrete. In
order to analyze these two results, the raining amount before and during experiment is
necessary as shown in Fig. 5.3.3. The amount raining in Kochi is large from May to
August, thus chloride concentration at the surface is removed in a large amount
proportional to the specific surface roughness of concrete. The amount of chloride
concentration on the rough surface is removed in a large amount. As the results, the
chloride concentration on June 20th is less. After June 20th, the chloride concentration is
dramatically decreased due to raining until zero. In sunshine day, the accumulated
chloride at surface started again, thus the chloride concentration the testing date should
0
2
4
6
8
0.0 0.2 0.4 0.6 0.8 1.0 1.2Depth from surface (mm)
Chl
orid
e co
ncen
trat
ion
(kg/
m3 ) 20-Jun 9-Jul 15-Jul
6-Sep 23-Sep 26-Sep

New Durability Design Specification on Chloride Ions Penetration for RC Structures Swatekititham S. 2004
77
be considered according to actual environment.
0
40
80
120
160
3-Feb 24-Mar 13-May 2-Jul 21-Aug
Rai
n, (m
m)
Fig.5.3.3: Amount of rain (mm) during Feb to Sep in Kochi prefecture.
At the Maehama, the surface, where is parallel to the south wind direction, is also
examined. So the efficient wind direction is narrower and the accumulated chloride is
less, though the raining effect is same. The result in this case shown in Fig.5.3.4 is less
than that in the rough surface of results described above.
Fig.5.3.4: Experimental results on the rough surface parallel to South wind (kg/m3) with
time dependent at Maehama, Kochi Prefecture (30m from seashore).
0
2
4
6
0.0 0.2 0.4 0.6 0.8 1.0 1.2Depth from surface (mm)
Chl
orid
e co
ncen
trat
ion
(kg/
m3 ) 9-Jul 15-Jul 6-Sep
23-Sep 26-Sep
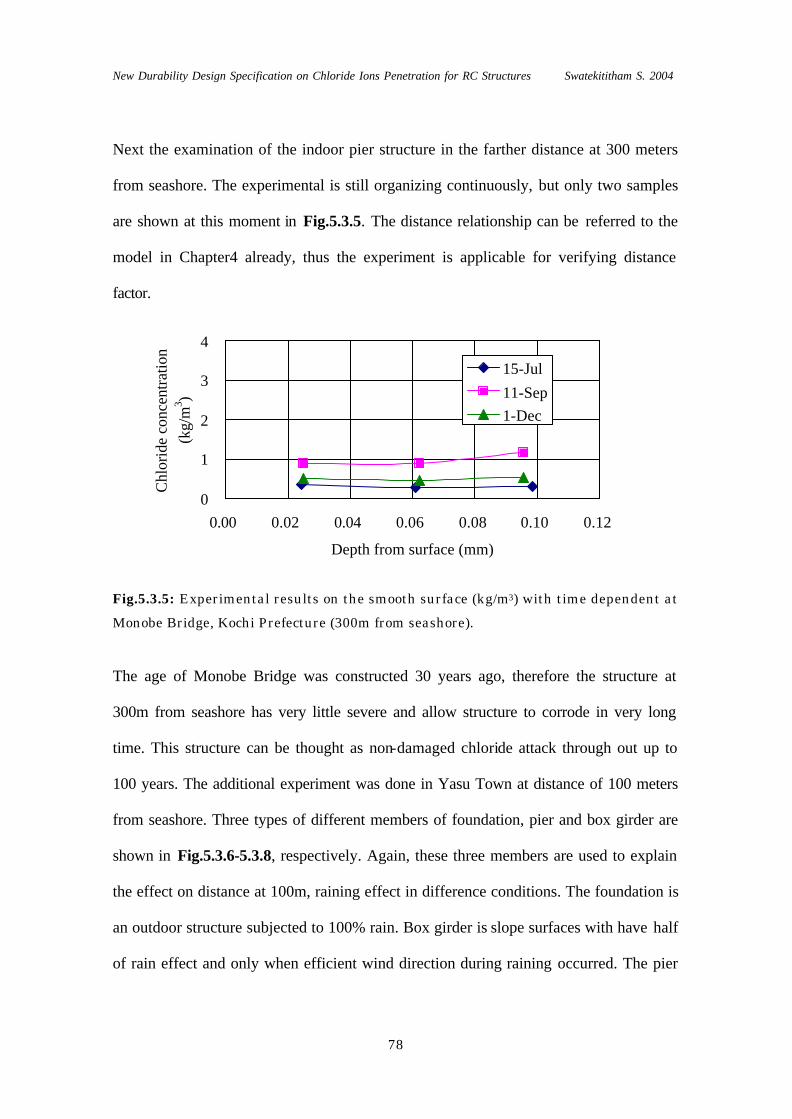
New Durability Design Specification on Chloride Ions Penetration for RC Structures Swatekititham S. 2004
78
Next the examination of the indoor pier structure in the farther distance at 300 meters
from seashore. The experimental is still organizing continuously, but only two samples
are shown at this moment in Fig.5.3.5. The distance relationship can be referred to the
model in Chapter4 already, thus the experiment is applicable for verifying distance
factor.
Fig.5.3.5: Experimental results on the smooth surface (kg/m3) with time dependent at
Monobe Bridge, Kochi Prefecture (300m from seashore).
The age of Monobe Bridge was constructed 30 years ago, therefore the structure at
300m from seashore has very little severe and allow structure to corrode in very long
time. This structure can be thought as non-damaged chloride attack through out up to
100 years. The additional experiment was done in Yasu Town at distance of 100 meters
from seashore. Three types of different members of foundation, pier and box girder are
shown in Fig.5.3.6-5.3.8, respectively. Again, these three members are used to explain
the effect on distance at 100m, raining effect in difference conditions. The foundation is
an outdoor structure subjected to 100% rain. Box girder is slope surfaces with have half
of rain effect and only when efficient wind direction during raining occurred. The pier
0
1
2
3
4
0.00 0.02 0.04 0.06 0.08 0.10 0.12
Depth from surface (mm)
Chl
orid
e co
ncen
tratio
n(k
g/m
3 )
15-Jul11-Sep1-Dec

New Durability Design Specification on Chloride Ions Penetration for RC Structures Swatekititham S. 2004
79
has none of rain effect at all. The surface conditions are all smooth surface with
different strength due to structural types.
Fig.5.3.6: Experimental results on the smooth surface of outside foundation (kg/m3)
with time dependent at Yasu Town, Kochi Prefecture (100m from seashore)
Fig.5.3.7: Experimental results on the smooth surface of pier (kg/m3) with time
dependent at Yasu Town, Kochi Prefecture (100m from seashore)
Fig.5.3.8: Experimental results on the smooth surface of girder (kg/m3) with time
dependent at Yasu Town, Kochi Prefecture (100m from seashore)

New Durability Design Specification on Chloride Ions Penetration for RC Structures Swatekititham S. 2004
80
Fig.5.3.9: The time history of average accumulated chloride concentration, at Maehama,
Kochi Prefecture
The chloride concentration along the depth from surface layer of concrete is almost
same at the boundary layer of 0 to 0.8mm for rough and normal surfaces and 0 to
0.10mm for smooth surface. Fig.5.3.9 shows the chloride concentration at surface of
concrete averaged from the experimental results in Fig.5.3.1, 5.3.2 and 5.3.4, and the
standard deviation is also calculated. The table attached inside Fig.5.3.9, show the
standard deviation of each experimental data. The maximum standard deviation of the
average value is up to 0.8kg/m3. The amount of chloride concentration after Jun 20th is
decreasing with affected by raining duration. During the sunshine period, the increment
of chloride concentration at surface of concrete can be seen during 6th-23rd of Sep.
During this period, the raining period is rare comparing with the sunshine period. From
the results in Fig.5.3.9, the distribution of chloride concentration at surface of concrete

New Durability Design Specification on Chloride Ions Penetration for RC Structures Swatekititham S. 2004
81
is recognized that the raining effect is significantly removed.
Fig.5.3.10: The time history of average accumulated chloride concentration, at
Monobe Bridge, Kochi Prefecture
The average results of the experiment of the Monobe Bridge are shown in Fig.5.3.10
with the same display as in Fig.5.3.9. The bridge pier of Monobe Bridge is located
inside the roof; however the size of roof is not so wide. Sometimes with some strong
wind in south directions, rainfall might affect to the removal of chloride concentration at
surface of concrete. It is still in doubt on how strong wind has influence to the surface
of bridge pier. Again, rainfall might effect to structure by making surface becoming wet
condition. Rain might outcome the wet surface condition without removal of chloride
concentration. This phenomenon results the rate of diffusion inside concrete, and the
amount of chloride concentration at surface of concrete is reduced due to the diffusion
into concrete. For the bridge in Yasu town, it was constructed recently, so the surface

New Durability Design Specification on Chloride Ions Penetration for RC Structures Swatekititham S. 2004
82
condition is durable.
Fig.5.3.11: The time history of average accumulated chloride concentration, at
Yasu, Kochi Prefecture
For the pier and box girder of this bridge, the results in Fig.5.3.11 have no effect of rain
acting on the surfaces, so the accumulation is gradually increasing without removal by
rainfall. Only two points’ investigation in this structure were done, and found that the
rate of increasing the amount of accumulative chloride concentration at surface of
concrete is very low. So, the examination period for indoor structures is not necessary to
investigate in a short period.
New Durability Design Specification on Chloride Ions Penetration for RC Structures Swatekititham S. 2004
83
5.4 Prediction model of annual accumulated chloride concentration.
The assumptions of this prediction model are the consideration of wind in hourly, and
rain in daily. Moreover, the fact on the various surface roughness and structural types
are added in this prediction model as well. The model provides the reference value of
the increment of chloride concentration by wind, and declination due to rain in various
surface conditions. The computation model considered the quantitative effect of
environmental conditions and structural surface conditions. The accumulative chloride
concentration in the boundary layer should be the functions of airborne chlorides, which
is described in chapter 4, surface conditions of concrete and weather conditions such as
rain and sunshine. The reference value is based on the experimental results in Kochi
prefecture, thus the actual environment of Kochi prefecture is used in the verification.
The average wind speed of Kochi prefecture only for the efficient wind speed is 3 m/s.
First of all, 1-year weather in Kochi prefecture is introduced. The average value cannot
be used in analysis according to the fact that wind speed relationship with chloride
accumulation is in third power. For simple explanation, the chloride accumulation in an
hour of wind speed at 8m/s is much higher than its 4 hours of wind speed at 2 m/s. The
best prediction is to make use of hourly wind speed for undoubted calculation. The
efficient wind directions in Kochi prefecture are illustrated in Fig.5.4.1 and the ratio of
each wind direction is illustrated in Fig.5.4.2. The efficient wind direction is totally at
46.3% and South wind represents the effective wind direction in Kochi.

New Durability Design Specification on Chloride Ions Penetration for RC Structures Swatekititham S. 2004
84
Fig.5.4.1: The efficient wind directions at seashore in Kochi prefecture.
Fig.5.4.2: The ratio of wind direction in year 2002-2003
The model for calculating the accumulative chloride concentration in the boundary layer
is simply proposed as the coefficient of accumulation per unit of wind speed. The
amount of airborne chloride at wind speed 3 m/s is converted to the unit of kg/m3 of
volume concrete. The coefficients of accumulative chloride content are recommended as
16.5 14.0
0.3 3.07.4 4.1
54.7
0.0
10.0
20.0
30.0
40.0
50.0
60.0
S S-E
S-W
S-S-W
S-S-E
S-E-E
OT
HE
RS
Effective Wind Directions
% b
y to
tal h
ours
in y
ear
2002
-200
3
SW
SSW S SSE SE
ϕ

New Durability Design Specification on Chloride Ions Penetration for RC Structures Swatekititham S. 2004
85
a constant value in a specific surface condition and raining effect at seashore. The
recommended values are illustrated in Table 5.4.1. In this study, the shoreline is
approximately set as 30m from the concrete obstacle constructed in the sea
Table5.4.1: Chloride accumulation in various conditions at seashore (about 30m from
concrete wave breaking) with the constant wind speed at 3m/s (kg/m3)
For other wind speeds, the equation for calculating the coefficient of accumulative
chloride concentration in the boundary layer is followed in Eq.5.4.1. The ratio of wind
speed in the third power is regarded as the model described in chapter 4. The third
power of the relationship between wind speed and surface chloride accumulation is
referred to the Eq. 4.3.9. The discussion in chapter 4 expresses the amount of airborne
chlorides in a distance related with the third power of wind speed, thus the coefficient of
accumulative chloride concentration in the boundary layer should be in the same
function.
∆Co,i = ∆Co,(3m/s). [U/U(3m/s)]3 (5.4.1)
where ∆Co,i is coefficient of increasing surface chloride concentration at wind speed U
Co Accumulation (kg/m3) Smooth Normal Rough
No rain / Little rain 0.0003-0.002 - -
50% Rain Effect 0.004 - -
100% Effect 0.008 0.01375 0.0175
Co Removal (kg/m 3) Smooth Normal Rough
Little rain -0.069 - -
50% Rain Effect -0.138 - -
100% Effect -0.276 -0.45 -0.65
New Durability Design Specification on Chloride Ions Penetration for RC Structures Swatekititham S. 2004
86
∆Co,(3m/s) is coefficient of increasing surface chloride concentration at wind
speed 3m/s
Next, the amount of chloride accumulation to the surface of structure along the distance
from seashore is predicted. The calculation of the coefficients of accumulative chloride
concentration for a structure in a particular distance is directly related with the amount
of airborne chlorides transportation. The coefficients proposed in Table 5.4.1 are
converted based on the amount of airborne chlorides of 0.10 mg/dm2/hr under the
conditions of wind speed at 3m/s and the distance of 30m. The conversion of
coefficients in the function of transported distance at a constant wind speed is shown
below,
∆Co,x = ∆Co,(30m). [Cair,x/Cair,30m] (5.4.2)
where, ∆Co,x is coefficient of accumulative surface chloride concentration at a distance
∆Co,(30m) is coefficient of accumulative surface chloride concentration at 30m
from concrete wave breaking
Cair,x is amount of airborne chlorides at a distance
Cair,30m is the reference of the amount of airborne chloride at 30m from
concrete wave breaking
The relationship between transportation distance and the coefficient of accumulative
chloride concentration in the boundary layer in Eq.5.4.2 is proposed for the effective
wind direction. The different wind directions have been discussed in chapter 4, again the
conversion of wind direction to the equivalent of transportation distance should be

New Durability Design Specification on Chloride Ions Penetration for RC Structures Swatekititham S. 2004
87
considered. After conversion of efficient wind directions to the transportation distance,
the coefficient of accumulative chloride concentration in the boundary layer is obtained.
Then, the model of the removal of chloride concentration in the boundary layer by
raining effect is considered. First of all, the raining effect on the removal of chloride
concentration in the boundary layer should be understood. However raining effect is
very complex and not well understood, yet. The model in this study is proposed on the
some basic assumption such as,
1) The amount of raining (mm/hr) is independent with the removal of chloride
concentration in the boundary layer. For example, the removal of raining at 2 mm/hr
or 10 mm/hr is same.
2) The removal by raining has an effect in daily scale, because only raining duration in
hours is not taken absolute effect into account. During pore solution in the boundary
layer of concrete is absolutely fulfilled with water, the diffusion outward from inside
concrete is significant. Also, a several hours between two periods of raining affect to
the dissolving of chloride concentration out of the boundary layer. In the raining
days, the amount of precipitation is quite small and continuous for whole day. Thus,
the raining effect on the removal of the chloride concentration in the boundary layer
is thought as a daily average value.
3) The removal of chloride concentration in the boundary layer depends on the
roughness of surface. The removal of chloride concentration on rough surface is the
largest due to the highest of specific surface area.
4) The structures are separating into 2 conditions of indoors and outdoors, which rain
affect to the outdoor structures only. The raining will not affect the removal of
New Durability Design Specification on Chloride Ions Penetration for RC Structures Swatekititham S. 2004
88
chloride concentration on indoor structure, except the rain drainage path passing to
the surface.
From above consideration, the coefficients of removal chloride concentration in the
boundary layer are recommended according to the surface conditions and structural
circumstances as shown in Table 5.4.1.
For more understanding of target of this model, the 1-year accumulative chloride
concentration is shown under the analyzing of actual environmental conditions. Due to
the experimental organized in Kochi prefecture with various distances and structural
members, the prediction of 1-year accumulative chloride concentration in the boundary
layer is done for verifying the precision of this computational model. The prediction of
1-year accumulative chloride concentration for the smooth, normal and rough surfaces,
and wind direction are shown in Fig.5.4.3 (a) to Fig.5.4.3 (d). The calculation of
accumulative chloride concentration in the boundary layer starts in the summer season
in 2002. According to the experimental results, the amount of chloride concentration in
the boundary layer is nearly zero after long duration of raining. The middle of August is
the starting period for calculating the accumulative chloride concentration in the
boundary layer, which is starting at 0 kg/m3 of chloride concentration.

New Durability Design Specification on Chloride Ions Penetration for RC Structures Swatekititham S. 2004
89
Fig.5.4.3 (a): The prediction of 1-year chloride concentration in normal condition of
Kochi prefecture.
Fig.5.4.3 (b): The prediction of 1-year chloride concentration in rough condition of Kochi
prefecture
0
5
10
15
20
25
24-May 1-Sep 10-Dec 20-Mar 28-Jun 6-Oct
time
Sufa
ce c
hlor
ide
conc
entra
tion
(kg/
m3 )
Rough
0
4
8
12
16
20
24-May 1-Sep 10-Dec 20-Mar 28-Jun 6-Oct
time
Sufa
ce c
hlor
ide
conc
entra
tion
(kg/
m3 )
Normal

New Durability Design Specification on Chloride Ions Penetration for RC Structures Swatekititham S. 2004
90
Fig.5.4.3 (c): The prediction of 1-year chloride concentration in rough surface with 90°
perpendicular to seashore of Kochi prefecture
Fig.5.4.3 (d): The prediction of 1-year chloride concentration in smooth surface with
100% rain of Kochi prefecture
The predicted results are verified by the experimental data in Fig.5.4.4. The precision of
0
4
8
12
16
20
24-May 1-Sep 10-Dec 20-Mar 28-Jun 6-Oct
time
Sufa
ce c
hlor
ide
conc
entra
tion
(kg/
m3 )
Smooth
0
4
8
12
16
20
24-May 1-Sep 10-Dec 20-Mar 28-Jun 6-Oct
time
Sufa
ce c
hlor
ide
conc
entra
tion
(kg/
m3 )
Rough-side

New Durability Design Specification on Chloride Ions Penetration for RC Structures Swatekititham S. 2004
91
high-accumulated chloride concentration is not good and error is large about 1 kg/m3.
Although, the reason might be caused by the precision of model and the accuracy of
experimental results, it may affect to a large deviation. In order to check the precision of
the model the experimental work should do for whole year. However, the accuracy of
this model can be verified again in final. This model is used as boundary condition for
DuCOM simulation on chloride concentration in concrete. Finally, the verification is
done again with the actual data from PWRI [12].
Later in Chapter 6, the monitoring of existing structures done by PWRI is discussed. In
this section, the actual environmental effect of the monitored members is analyzed
same as the procedure described in this chapter. The various shape of 1-year
accumulated chloride concentration is known. Importantly, this model is able to explain
why the chloride concentration in a seashore structure is very low.
Fig.5.4.4: The verification of predicted accumulated chloride concentration with
experimental results
0
2
4
6
8
0 2 4 6 8Data value (kg/m3)
Cal
cula
ted
Val
ue (kg
/m3 )
New Durability Design Specification on Chloride Ions Penetration for RC Structures Swatekititham S. 2004
92
5.5 The predicting standard accumulated chloride concentration around Japan
The prediction of the accumulated chloride concentration around Japan is very tough
works, thus zoning of the similar severity is grouped into 4 zones as shown in Fig.
4.3.10. The standard environments representing the overall environment in a specific
zone are selected as
Zone 1: Itokazu, Okinawa 2002
Zone 2: Otaru, Hokkaido 2002
Zone 3: Irozaki, Shizuoka 2002
Zone 4: Susa, Yamaguchi 2002
The environmental conditions in these 4 zones are analyzed as in Chapter 4 and shown
in Fig. 4.3.13. The accumulated chloride concentration starts with the different month,
because the model want to calculate the accumulated in 1 year iteration with starting
and ending point in zero value. It is easier to use 1-year iteration of chloride
accumulation for simulating the chloride transport in concrete by DuCOM. It helps the
simplicity of the input data as 1-year iteration until the simulated life is achieved. The
maximum value of chloride concentration and area under the graph between chloride
concentration and time is highest in Okinawa area. The second severe location is in
zone 2. For zone 3 and zone 4 has similar severity but the division was done according
to the different of efficient wind direction. The predicted results were calculated under
various conditions as mentions in Table5.4.1. The entire calculated results are
illustrated in Appendix A. The seashore outer structures have higher severe condition in
all 4 zones than those inner structures. The last figure of each zone is the accumulative
at 1-year interval, and this chloride accumulation is multiplied by number of years for

New Durability Design Specification on Chloride Ions Penetration for RC Structures Swatekititham S. 2004
93
simulating at a considered age. The outer structures in la ter distance from coastline has
a little chloride attack due to the raining effect is relatively larger than amount of
adsorption. It might be said that the chloride attack on outer structure is controlled by
rain and kept very low surface chloride concentration. In the opposite way, inner
structures without wind effect still have large effect on accumulation.

New Durability Design Specification on Chloride Ions Penetration for RC Structures Swatekititham S. 2004
94
CHAPTER 6
Verification of the computational model on chloride distribution

New Durability Design Specification on Chloride Ions Penetration for RC Structures Swatekititham S. 2004
95
6.1 DuCOM modification
According to the computational program in simulating the chloride transport in
concrete; the governing equations are described in the Chapter2. The flux movement in
the surface layer of concrete is due to both diffusion and the condensation of chloride
ions by ion adsorption [11,23]. Maruya, et al, proposes the surface chloride
condensation as the quasi-adsorption as in function of chloride concentration at 1cm
surface layer. However DuCOM is microstructure based simulation model, the
boundary surface layer is small as the pore structure at surface. The condensation
influences to the flux movement of free chlorides in surface pore structure. The flux due
to quasi-adsorption in the computational program was modified as the function of free
chloride at surface layer,
qads = 6.5x10⁻³ exp(-1.15Ccl) (6.1.1)
where: qads is flux of quasi-adsorption (mol/cm2/day)
Ccl is free chloride content at boundary layer, (mol/l)
Referred to Fig.6.1.1, zone1 represents the ambient environment at outer surface of
concrete, zone 2 is the surface layer due to depth of roughness, and zone 3 corresponds
to the concrete structure. From previous study of submerged and wetting-drying cycles,
the ambient environment is known as chloride concentration equaled to sea
concentration about 3% NaCl. Nevertheless, the ambient environment of a structure in
the atmosphere is unidentified. Thus the surface layer of zone2 is equivalent as the
ambient environment of that concrete structure. So the input chloride concentration of

New Durability Design Specification on Chloride Ions Penetration for RC Structures Swatekititham S. 2004
96
ambient environment changes to use the free chloride concentration at surface layer in
zone2, Ccl, instead. Consequently, the experiment of total chloride concentration at
surface layer, Co, [see Chapter5] is in unit of (kg/m3). The conversion of the unit of mol
per liter of pore volume is necessary. Moreover, the condensation term is included in the
boundary condition already, thus it is abandoned. The adaptation of each
time-dependence of total chloride concentration in concrete (Co), to the free chloride in
pore solution (Ccl) is computed by
Ccl = Co (1-αfixed) . 1000 / [Mcl.Vpore. S] (6.1.2)
and,
1.0 Ctot ≤ 0.1
αfixed = 1- 0.35(Ctot-0.1)0.25 0.1 ≤ Ctot ≥ 3.0 (6.1.3)
0.543 3.0 ≤ Ctot
where, Ccl is free chloride concentration at boundary layer (mol/l)
Co is total chloride concentration at surface (kg/m3)
Ctot is total chloride concentration (% by weight of cement)
is [Co .100 / Wc]
Wc is weight of cementitious material (kg/m3)
Mcl is molecular weight of chloride (35.5 g/mol)
Vpore is pore volume (l/m3) of a concrete (computed by DuCOM)
S is degree of saturation, [saturated condition is 1.0]
αfixed is the ration of fixed chloride [Proposed by Maruya, et al,1992]

New Durability Design Specification on Chloride Ions Penetration for RC Structures Swatekititham S. 2004
97
Fig.6.1.1: Condensation mechanism of chloride ions in the surface layer of concrete [23]
The pore solution and degree of saturation are obtained using the same computational
program by applying the actual environmental condition. The pore structure and volume
through the depth of concrete is assumed as a consistent distribution. The result of the
available water in the pore system is used for calculating Ccl (mol/l) at the surface layer.
The flux of quasi-adsorption at the surface is ignored because none of the effect from
the ambient environment. The flux of chloride ions at surface, Fc’ was modified by
Fc’ = -Dcl (Cfree-Ccl)/∆x (6.1.4)
where Dcl is chloride ion diffusivity in pore solution phase (m2/s),
Cfree is free chloride concentration in the pore solution on the inner surface of
boundary layer [Between zone2 and zone3]
6.2 Sample calculation for verifying chloride distribution in concrete
The verification in this section used the investigated data as shown in Appendix B. The
data was observed in various structures and locations totally 152 data, but only few of
CL-
CL-
1
Quasi adsorption 1à2
Diffusion, Advection 1à2à3
CL-
CL-CL-CL-
CL-CL-
CL-CL-CL-
CL-
CL-
CL-CL-
CL- CL-
2
3
Surface layer Inner
Input by ambient CL concentrationà Input by surface CL concentration
CL-CL-
CL-CL-
1
Quasi adsorption 1à2
Diffusion, Advection 1à2à3
CL-CL-
CL-CL-CL-CL-CL-CL-
CL-CL-CL-CL-
CL-CL-CL-CL-CL-CL-
CL-CL-
CL-CL-
CL-CL-CL-CL-
CL-CL- CL-CL-
2
3
Surface layer Inner
Input by ambient CL concentrationà Input by surface CL concentration
Cfree
Co

New Durability Design Specification on Chloride Ions Penetration for RC Structures Swatekititham S. 2004
98
them have enough information in analysis. The exact location and distance, concrete
property and types of structure by photographs are necessary information to judge the
suitable condition for analysis referred to Table 5.4.1. According with the required
information, the data is considered the appropriate circumstance for each as shown in
Table 6.2.1. The investigated data of strength has to evaluate the water to cement ratio
as input condition in DuCOM. The evaluate of the structure constructed since long time
ago, the formula is proposed by Kokubu, 1950 [24]
f`c(28) = -377+377c/w 6.2.1)
where, c/w is cement to water ratio
Table 6.2.1: Conditions in Simulation of each investigated data in Appendix B
No. Condition Co accumulation Rain effect Note
(kg/m3) (kg/m3)
A1017Smooth-normal100% rain
0.0109 -0.3630 Low efficient wind direction,Rain drainage path
B1013 Smooth- no rain 0.0020 0.0000 Water drainage sometimes
B2009 Rough-100% rain 0.0175 -0.6500D2016 Rough-100% rain 0.0175 -0.6500
D3008 Smooth-no rain 0.0020 0.0000No CL attack, CL initial = 0.03kg/m3
G1026 Smooth-100% rain 0.0080 -0.2760 CL initial = 2.835 kg/m3
G3003 Smooth-no rain 0.0020 0.0000 Narrow efficient wind direction
H2018 Normal-100% rain 0.0138 -0.4500surface facing opposite to sea,CL initial = 1.8 kg/m3
H4017 Normal-100% rain 0.0138 -0.4500 CL initial = 1 kg/m3
K1005 Smooth-no rain 0.0020 0.0000K2005 Normal-100% rain 0.0138 -0.4500 CL initial = 1.25 kg/m3
K3003 Smooth-no rain 0.0020 0.0000 Low efficient wind direction

New Durability Design Specification on Chloride Ions Penetration for RC Structures Swatekititham S. 2004
99
The judgment on how to situate each data is the most important; however some
unknown factors are assumed. For example, the surface in box culvert is affected in
narrow wind direction. Wind direction in opposite to the surface in box culvert is
thought as none of effect. Some indoor structures have to consider the drainage path,
which can cause the rain effect whenever raining occurs. The surface roughness
conditions in Fig.5.2.1 are standard performance, and the extrapolation of roughness
condition can be calculated as in data No.A1017. From the investigated results, the
initial chloride concentration of each structure is unidentified. The calculated results of
zero initial chloride contents in min and max curves are shown (Ex. B2009). Moreover,
the result in the case that initial chloride concentration might exist shows the summation
curve of the result with the estimated initial chloride concentration (Ex. G3003). The
accumulated chloride for outdoor structure is using 1-year cyclic for whole life iteration
(Ex. H4017). For indoor structures, the accumulated chlorides for entire life of that
structure are necessary (Ex. K1005). Each investigated data is predicted the input data
by Eq.6.1.2, and the calculation of total chloride concentration in concrete by DuCOM
is compared with the investigated results as shown in Fig.6.2.1-6.2.12. It is noted that
the accumulative value in each case is the total chloride concentration in kg/m3. The
conversion to the free chloride at surface layer is necessary for input in DuCOM. In fact,
annual environments for whole life duration is not consistent, thus the cyclic of the
accumulated chloride concentration is not alike. It is very hard work to create the exact
input data, so the scattering of the environment in the average and the most severe
weathers are needed to define as the multiplication factors. The distributions of weather
condition and chloride concentration are a vital further study. In this verification, the
iteration of 1-year accumulative chloride is applied as an average weather condition.
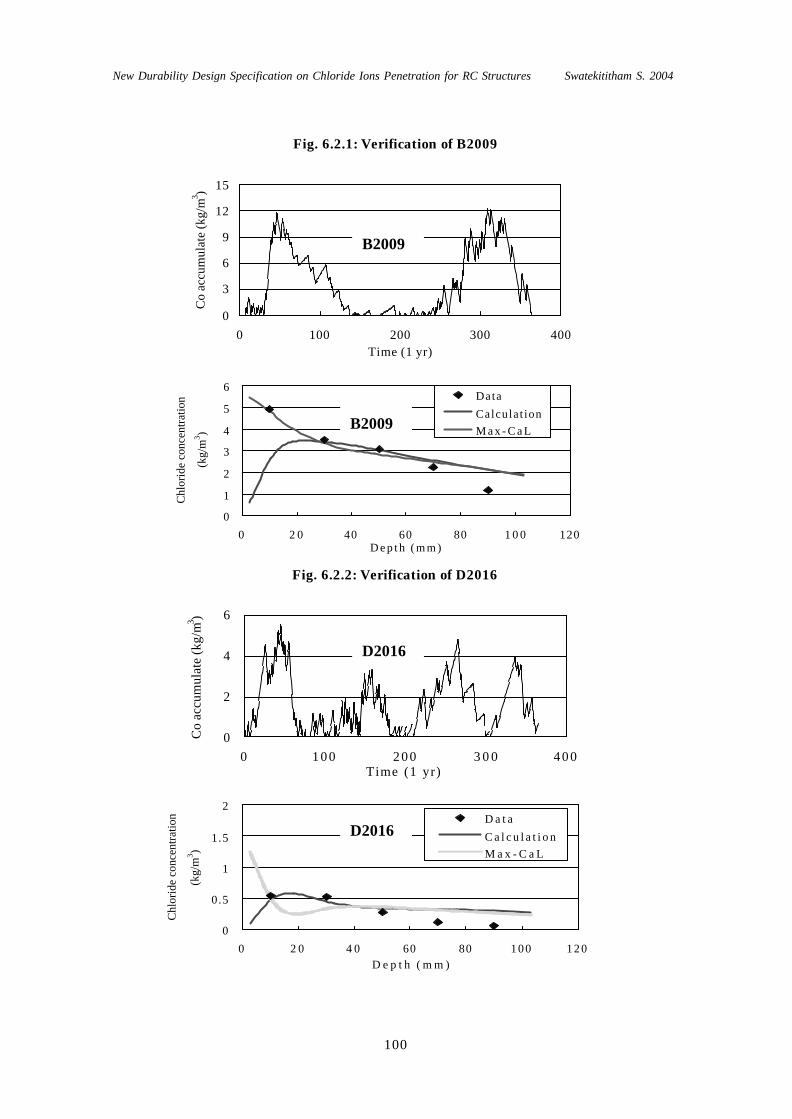
New Durability Design Specification on Chloride Ions Penetration for RC Structures Swatekititham S. 2004
100
Fig. 6.2.1: Verification of B2009
Fig. 6.2.2: Verification of D2016
0
3
6
9
12
15
0 100 200 300 400Time (1 yr)
Co
accu
mul
ate
(kg/
m3 )
0
1
2
3
4
5
6
0 2 0 40 60 80 1 0 0 120D e p t h ( m m )
Chl
orid
e co
ncen
tratio
n
(kg/
m3 )
Da ta
Calculat ionM a x - C a L
0
2
4
6
0 1 0 0 2 0 0 3 0 0 4 0 0Time (1 yr)
Co
accu
mul
ate
(kg/
m3 )
0
0.5
1
1.5
2
0 2 0 4 0 60 80 1 0 0 1 2 0D e p t h ( m m )
Chl
orid
e co
ncen
tratio
n
(kg/
m3 )
D a t a
C a l c u l a t i o nM a x - C a L
B2009
B2009
D2016
D2016

New Durability Design Specification on Chloride Ions Penetration for RC Structures Swatekititham S. 2004
101
Fig. 6.2.3: Verification of D3008
No Chloride accumulation at this location
Fig. 6.2.4: Verification of G1026
0
3
6
9
12
0 100 200 300 400Time (1 yr)
Co
accu
mul
ate
(kg/
m3 )
0
0.1
0.2
0.3
0.4
0 2 0 4 0 6 0 8 0 1 0 0 1 2 0
D e p t h ( m m )
Chl
orid
e co
ncen
trat
ion
(kg/
m3 )
DataCalcula t ion
Calcula t ion by in i t ia l CL a t 0 .03 kg/m 3
D3008
G1026
G1026
0
2
4
6
8
1 0
0 2 0 4 0 6 0 8 0 1 0 0 1 2 0Dep t h (mm )
Chl
orid
e co
ncen
trat
ion
(kg/
m3 )
Data
Calcu la t ion
M a x - C a L
Ca l+CL in i t i a l
CL in i t i a l = 2 .835 kg/m 3
G1026
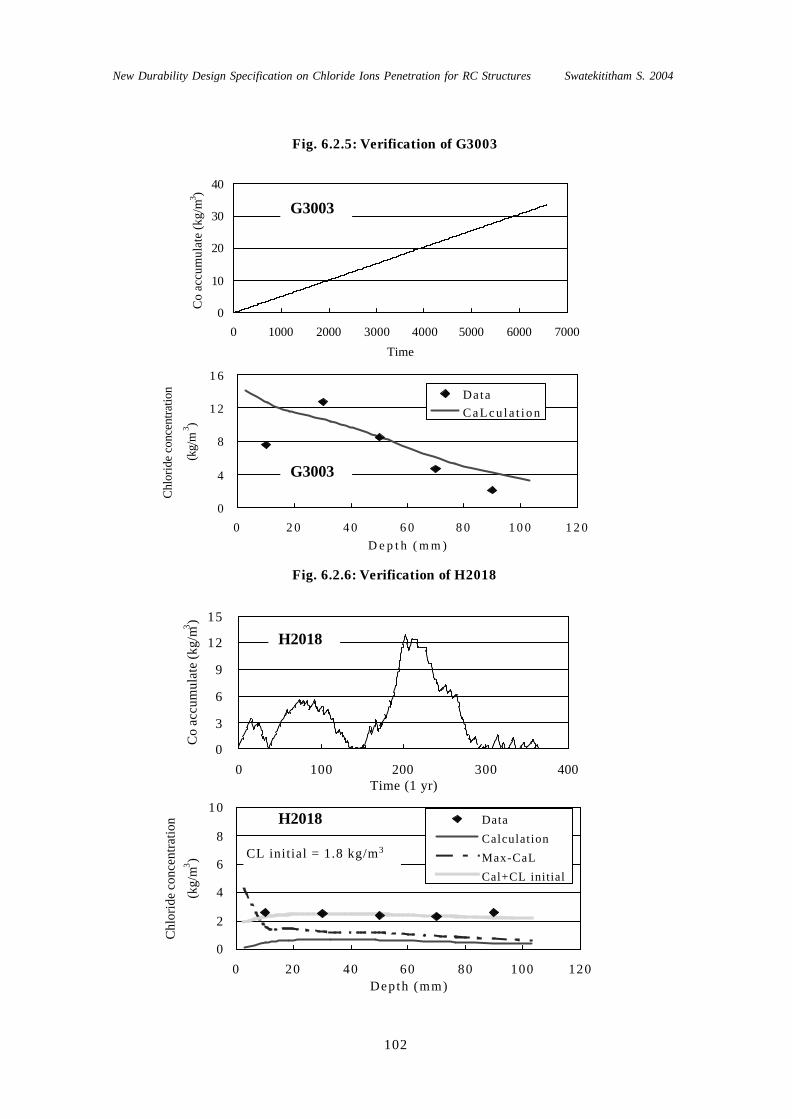
New Durability Design Specification on Chloride Ions Penetration for RC Structures Swatekititham S. 2004
102
Fig. 6.2.5: Verification of G3003
Fig. 6.2.6: Verification of H2018
0
10
20
30
40
0 1000 2000 3000 4000 5000 6000 7000
Time
Co
accu
mul
ate
(kg/
m3 )
0
4
8
1 2
1 6
0 2 0 4 0 6 0 8 0 1 0 0 1 2 0D e p t h ( m m )
Chl
orid
e co
ncen
tratio
n
(kg/
m3 )
Da taC a L c u l a t i o n
0
3
6
9
12
15
0 100 200 300 400Time (1 yr)
Co
accu
mul
ate
(kg/
m3 )
G3003
G3003
H2018
0
2
4
6
8
10
0 20 40 60 80 100 120Depth (mm)
Chl
orid
e co
ncen
trat
ion
(kg/
m3 )
Data
Calculation
Max-CaL
Cal+CL initial
CL initial = 1.8 kg/m3
H2018

New Durability Design Specification on Chloride Ions Penetration for RC Structures Swatekititham S. 2004
103
Fig. 6.2.7: Verification of H4017
Fig. 6.2.8: Verification of K1005
0
2
4
6
0 2 0 4 0 6 0 8 0 100 120D e p t h ( m m )
Chl
orid
e co
ncen
tratio
n
(kg/
m3 )
DataCalcula t ionM a x - C LCal + CLini t ia l
CL in i t ia l = 1 .0 kg/m 3
0
10
20
30
40
50
0 2000 4000 6000 8000
Time
Co
accu
mul
ate
(kg/
m3 )
H4017
K1005
0
2
4
6
8
1 0
1 2
0 2 0 4 0 6 0 80 1 0 0 1 2 0D e p t h ( m m )
Chl
orid
e co
ncen
tratio
n
(kg/
m3 )
D a t a
C a l c u l a t i o n
K1005
0
2
4
6
8
0 1 0 0 200 300 400Time (1 yr)
Co
accu
mul
ate
(kg/
m3 )
H4017

New Durability Design Specification on Chloride Ions Penetration for RC Structures Swatekititham S. 2004
104
Fig. 6.2.9: Verification of K2005
Fig. 6.2.10: Verification of K3003
0
4
8
12
16
0 1000 2000 3000 4000 5000 6000 7000
Time
Co
accu
mul
ate
(kg/
m3 )
0
2
4
6
8
10
0 2 0 40 60 80 100 120Depth (mm)
Chl
orid
e co
ncen
trat
ion
(kg/
m3 )
DataCalculat ion
K2005
K3003
0
5
10
15
20
0 100 200 300 400
Time (1 yr)
Co
accu
mul
ate
(kg/
m3 )
0
3
6
9
12
0 20 40 60 80 100 120Depth (mm)
Chl
orid
e co
ncen
trat
ion
(kg/
m3 )
DataCalculationMax-CaLCal + CL initial
CL initial = 1.25 kg/m3
K2005
K2005
K3003
K3003

New Durability Design Specification on Chloride Ions Penetration for RC Structures Swatekititham S. 2004
105
Fig. 6.2.11: Verification of A1017
Fig. 6.2.12: Verification of B1013
0
5
10
15
20
0 2000 4000 6000 8000 10000 12000time (days)
Co
accu
mul
ate
(kg/
m3 )
0
1
2
3
4
0 2 0 4 0 6 0 8 0 1 0 0 1 2 0D e p t h ( m m )
Chl
orid
e co
ncen
tratio
n
(kg/
m3 )
D a t aC a l c u l a t i o nM a x - C a L
0
2
4
6
8
0 100 200 300 400 500 600Time (1 yr)
Co
accu
mul
ate
(kg/
m3 )
A1017
A1017
B1013
0
2
4
6
8
0 20 40 60 80 100 120Depth (mm)
Chl
orid
e co
ncen
tratio
n
(kg/
m3 )
DataCalculation
B1013

New Durability Design Specification on Chloride Ions Penetration for RC Structures Swatekititham S. 2004
106
The selected data in Table 6.2.1 has been plotted the calculated chloride concentration
in concrete at the depth of 1, 3, 5, 7, 9 cm. with the examined data. The comparison is
plotted without the relationship of covering depth and shown in Fig.6.2.13. The least
square of regression from this comparison is calculated at 0.723. The scattering of data
occurs in the range of high chloride concentration where is taken from the depth near to
surface. The depth of 0-3cm from surface of concrete subjecting to various
environmental conditions such as wetting-drying cycles, carbonation and shrinkage
crack is influenced from the fluctuation of chloride concentration with time history.
Fig.6.2.13: Comparison of chloride concentration in concrete in actual structures from
12 selected samples in Table6.2.1

New Durability Design Specification on Chloride Ions Penetration for RC Structures Swatekititham S. 2004
107
CHAPTER 7
New proposed design method

New Durability Design Specification on Chloride Ions Penetration for RC Structures Swatekititham S. 2004
108
7.1 Recent design
At present, the design of chloride concentration follows the evaluation method proposed
by Japan Society of Engineers until year 2002 [25-26]. The chloride ion penetration can
be calculated by Fick’2nd law as below,
∂∂=
∂∂
2
2
xCDc
tC
(7 1.1)
where; C: is chloride ion concentration
Dc: is bulk diffusion coefficient
x: is penetration depth
t : is exposure time
The chloride ion concentration at reinforced steel position in concrete is computed by
the modification of Eq.7.1.1 to
)0,(.2
1),( xCtD
xerfCotxC +
−= (7.1.2)
where, C(x,0) is the initial chloride ion concentration (kg/m3)
D is apparent diffusion coefficient, cm2/yr (For Ordinary Portland Cement,
calculated by
log D = -3.9(w/c)2 + 7.2(w/c) - 2.5 (7.1.3)
Co is chloride concentration at the surface (kg/m3) [See in Table 7.1.1]
C(x,t) is chloride ion concentration at steel position (kg/m3)
x is covering depth (cm)

New Durability Design Specification on Chloride Ions Penetration for RC Structures Swatekititham S. 2004
109
Table 7.1.1: The chloride concentration at surface of concrete in a certain distance
First of all, the explanation of the specification of JSCE 2002 is needed to realize the
current thoughts. The evaluation of chloride concentration at the position of reinforcing
bars is based on the Fick’2nd law equation. There are 3 main dependent variables in the
Fick’2nd law equation; chloride at the surface (Co), apparent diffusion coefficient (D),
service life (t). The Co is set as the function distance from sea by the longer distance
from sea, the less Co is. The apparent diffusion coefficient (D) is computed by the
equation with related to w/c. The equation is the average apparent diffusion coefficients
from the observed data among submerge zone, tidal zone, splash zone and atmospheric
zone as shown in Fig.7.1.1. This technique leads to high fluctuation of diffusion
coefficient and meaningless in truthful behavior. In a distance, the constant surface
chloride concentration was proposed, but the zoning separation due to severity level [1,
7] cannot explain by this specification. The safety factors in calculation of chloride
transport were introduced for conservation in design. Firstly, the limitation of chloride
concentration when corrosion started is used 1.2 kg/m3. Actually, the chloride
concentration for starting corrosion is between 1.2 – 2.4 kg/m3. Secondly, the design
apparent diffusion coefficient given by Eq.7.1.3 needs a modification factor of 1.3 for
upper member due to bleeding effect. Thirdly, the safety factor for scattering of surface
chloride concentration in concrete is compensated by the factor of 1.3 times. The
modification based on this proposed model in this paper is the criteria for high accuracy
Splash Seashore 0.1 0.25 0.5 1
13 9 4.5 3 2 1.5
Distance from seashore (km)
Co
(kg/m 3)
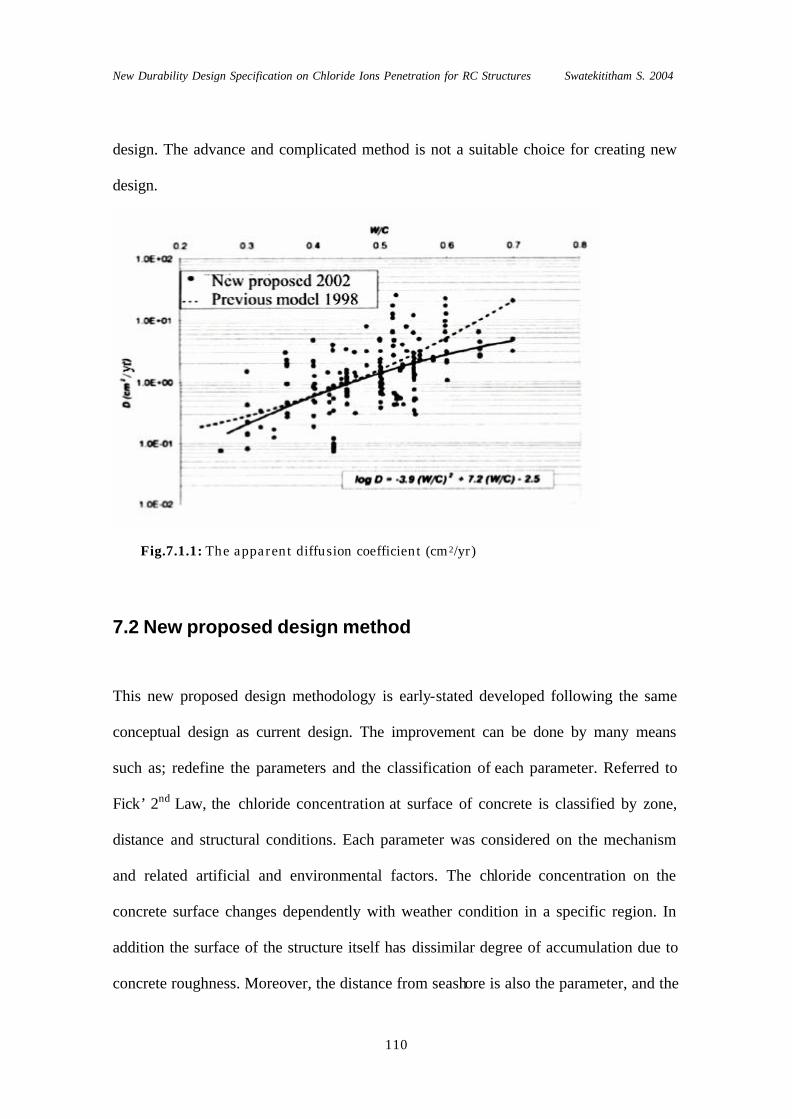
New Durability Design Specification on Chloride Ions Penetration for RC Structures Swatekititham S. 2004
110
design. The advance and complicated method is not a suitable choice for creating new
design.
Fig.7.1.1: The apparent diffusion coefficient (cm2/yr)
7.2 New proposed design method
This new proposed design methodology is early-stated developed following the same
conceptual design as current design. The improvement can be done by many means
such as; redefine the parameters and the classification of each parameter. Referred to
Fick’ 2nd Law, the chloride concentration at surface of concrete is classified by zone,
distance and structural conditions. Each parameter was considered on the mechanism
and related artificial and environmental factors. The chloride concentration on the
concrete surface changes dependently with weather condition in a specific region. In
addition the surface of the structure itself has dissimilar degree of accumulation due to
concrete roughness. Moreover, the distance from seashore is also the parameter, and the

New Durability Design Specification on Chloride Ions Penetration for RC Structures Swatekititham S. 2004
111
relationship is followed the model in Chapter 4. On the other hand, the chloride at
surface of concrete is independent with the water to cement ratio.
The water to cement ratio is the factor that affects the diffusion behavior represented by
diffusion coefficient. In previous calculation, the apparent diffusion coefficient is
defined as material property and functioned with water to cement ratio only. However,
collecting investigated diffusion coefficients from entire locations such as, tidal, splash
and atmospheric zone used for the regression method. In fact, the diffusion coefficient
should be considered with the difference of material usage only. The diffusion
coefficient is set a standard condition under 91-days submerged condition in 3% of
NaCl solution. The material is cast and cured under 28-days under water before
exposure. The entire process keeps the temperature constant at 20°c. The calculating
standard diffusion coefficient is achieved by using the computational program named
DuCOM MC. After that, the application of the equation of Fick’ 2nd Law is done for
trial diffusion coefficient matching with the result. The standard diffusion coefficient of
concrete using ordinary Portland cement, OPC can be shown as Fig.7.2.1. In usage of
other cementitious materials, the experimental of the condition above is necessary for
getting chloride concentration. Arrhenius’s Law of diffusion represents the temperature
influence on the rate of diffusion as shown below,
where, DT is diffusion coefficient at a certain temperature (cm2/yr)
D20 is diffusion coefficient at reference temperature of 20°c (cm2 /yr)
)])273(
1293
1(2285exp[.20 T
DDT +−⋅= (7.2.1)

New Durability Design Specification on Chloride Ions Penetration for RC Structures Swatekititham S. 2004
112
T is an average temperature (K)
Fig.7.2.1: The diffusion coefficient in function of w/c [calculated by DuCOM]
Last, dependent parameter is service life span, the code was suggested this value as the
design life of a structure, t. The new proposed time is the equivalent time, teq due to the
condition of exposure [change t à teq]. By Fick’ 2nd Law, the standard diffusion
coefficient of submerged condition is applied, thus the equivalent time means the time
proportion to the time in submerged case. For example, the exposure time of concrete
under various conditions, equivalent t is
Submerged à teq = t
Atmosphere à teq = t . f(r)
where f(r) is reduction factor due to the ratio of diffusion duration. The diffusion
duration is the equivalent of actual wetting-drying condition in each particular ambient
environment. Thus f(r) is due to the level of RH inside concrete influenced by weather
condition.
The Fig. 7.2.2 shows the relationship between actual time and equivalent time. The
actual environmental conditions depend on the diversity of climate around Japan. In the
y = 12.67x2.505
0
2
4
6
8
0 0.2 0.4 0.6 0.8w/c
Diff
usio
n co
effic
ient
(cm
2 /yr)
(7.2.2)

New Durability Design Specification on Chloride Ions Penetration for RC Structures Swatekititham S. 2004
113
design, the concrete structures exposed into the environmental conditions are
universally classified into outdoors and indoors. The difference of these two conditions
is the raining affecting to removal of chloride concentration at surface of concrete and
high wetting to drying ratio. The coefficient of f(r) for outdoor structures is lager than
that for indoor structures according to the subjecting time of wetting state.
0
5
10
15
20
25
0 10 20 30 40 50Actual year (yrs)
Equ
ival
ent T
ime;
(yrs
)
outdoor f(r) = 0.37
indoor f(r) = 0.30
Fig. 7.2.2: Relationship between actual and equivalent time of exposure
Next the recommended value of chloride at surface of concrete is functioned with
zoning, ambient environments, and distance. The equivalent surface chloride
concentration (Co,eq) is shown in Table 7.2.1. The equivalent surface chloride
concentration is constant for any designed service life of a structure. The equivalent
surface chloride concentrations of outside structures are very low in distance further
than 100m in overall zones. In further distance from seashore, the chloride attack shows
large effect only on indoor structures. The indoor structures have the increment of
surface chloride concentration during exposure without the effect of rain taken into
account.

New Durability Design Specification on Chloride Ions Penetration for RC Structures Swatekititham S. 2004
114
Table 7.2.1: Surface chloride concentration of concrete in 4 zones
Zone 1 Zone 2 Zone 3 Zone 4Rough 100% rain 12.0 10.0 6.0 4.0Normal 100% rain 11.0 8.0 4.5 3.0Smooth 100% rain 7.0 4.0 3.0 2.0Smoooth 50% rain 3.0 2.0 1.5 1.0
Zone 1 Zone 2 Zone 3 Zone 4Rough 100% rain 4.0 3.5 2.0 1.2Normal 100% rain 3.5 3.0 1.5 1.0Smooth 100% rain 2.0 1.5 1.0 0.8Smoooth 50% rain 1.0 0.7 0.5 0.4
Zone 1 Zone 2 Zone 3 Zone 4Seashore 20.0 18.0 14.0 10.0100m 15.0 14.0 9.0 5.0500m 7.0 6.0 3.0 1.5
Indoor Co,eq (kg/m3)
Co,eq (kg/m3) at seashoreOutdoor
OutdoorCo,eq (kg/m3) at 100m from seashore
The recommendation of equivalent chloride concentration on surface of concrete in this
study shows in various zones (See Fig. 4.3.10), concrete surface conditions and exposed
environments. The equivalent chloride concentrations in severe zones of zone 1&2 are
larger than these in mild zones. Also, the values for indoor structures are very large
comparing with the recommendation in JSCE specification. Although, the equivalent
chloride concentration at surface of concrete is large, the equivalent time controls the
rate of chlorides penetration. The calculations of time to corrosion in this method are
less than the results by JSCE for all conditions in Table7.2.1.
Once the condition chloride concentration is known, the degree of scattering due to this

New Durability Design Specification on Chloride Ions Penetration for RC Structures Swatekititham S. 2004
115
analysis is decreasing. So, the recommended limitation of chloride concentration at steel
posit ion is able to use the average value of 1.2 to 2.4 kg/m3 or 1.8 kg/m3. At last, the
design of a new concrete structure with required service life can be calculated by this
means. Finally, the additional application of this model is able to predict the service life
of existing structures whenever the investigation of a structure is examined. If the
condition of covering depth, strength, surface condition and environmental attack were
known, the current status and prediction of corrosion starting time are able to calculate.
This is useful for the simulating existing structure and planning of future maintenance.

New Durability Design Specification on Chloride Ions Penetration for RC Structures Swatekititham S. 2004
116
CHAPTER 8
Conclusion
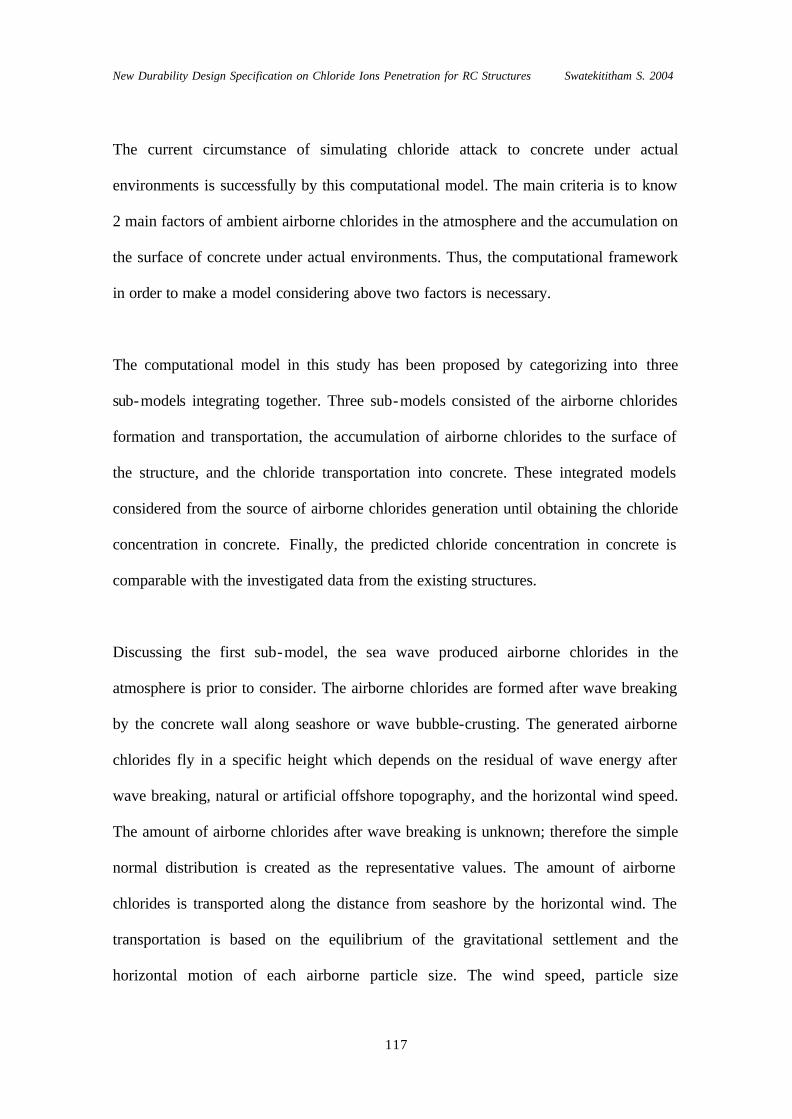
New Durability Design Specification on Chloride Ions Penetration for RC Structures Swatekititham S. 2004
117
The current circumstance of simulating chloride attack to concrete under actual
environments is successfully by this computational model. The main criteria is to know
2 main factors of ambient airborne chlorides in the atmosphere and the accumulation on
the surface of concrete under actual environments. Thus, the computational framework
in order to make a model considering above two factors is necessary.
The computational model in this study has been proposed by categorizing into three
sub-models integrating together. Three sub-models consisted of the airborne chlorides
formation and transportation, the accumulation of airborne chlorides to the surface of
the structure, and the chloride transportation into concrete. These integrated models
considered from the source of airborne chlorides generation until obtaining the chloride
concentration in concrete. Finally, the predicted chloride concentration in concrete is
comparable with the investigated data from the existing structures.
Discussing the first sub-model, the sea wave produced airborne chlorides in the
atmosphere is prior to consider. The airborne chlorides are formed after wave breaking
by the concrete wall along seashore or wave bubble-crusting. The generated airborne
chlorides fly in a specific height which depends on the residual of wave energy after
wave breaking, natural or artificial offshore topography, and the horizontal wind speed.
The amount of airborne chlorides after wave breaking is unknown; therefore the simple
normal distribution is created as the representative values. The amount of airborne
chlorides is transported along the distance from seashore by the horizontal wind. The
transportation is based on the equilibrium of the gravitational settlement and the
horizontal motion of each airborne particle size. The wind speed, particle size

New Durability Design Specification on Chloride Ions Penetration for RC Structures Swatekititham S. 2004
118
distribution and distance from seashore are known relating to the amount of airborne
chlorides. After all, the verification of the model is done by comparing with the
investigated data of monthly accumulative airborne chlorides from Public Work
Research Institute.
Next, the airborne chlorides transport to the surface of structures. The model is the
computation of accumulative chloride concentration at the surface of concrete. The
surface of concrete is the boundary layer in the depth of 0-1mm from surface. The depth
of the boundary layer is different due to the roughness of surface. The accumulative
chloride concentration in the boundary layer is considered with the actual environments
of wind, rain, surface roughness and amount of airborne chlorides. The removal of
chloride concentration in the boundary layer is affected by rainfall for the outdoor
structures. During rainy season, the dissolution of chloride concentration out of the
surface of concrete is significant. Thus the amount of accumulative airborne chloride for
outdoor structures is less than that in the indoor structures for long term accumulation.
The structure located near seashore, although the raining duration is large, can have
very low amount of chloride concentration in concrete. The advantage of this model is
the ability to calculate the time dependent accumulative chloride concentration in the
boundary layer, if the actual environmental conditions of wind speed, wind directions
and raining period are known. The investigation of the chloride concentration at the
boundary layer in Kochi prefecture is done for approval the calculation in this
sub-model.
Come to the third sub-model, the DuCOM is the program used to calculate the chloride
New Durability Design Specification on Chloride Ions Penetration for RC Structures Swatekititham S. 2004
119
concentration in concrete if the accumulative chloride concentration, humidity, and
temperature at the boundary layer are known. The combination of above two models is
applicable to create the input data of accumulative chloride concentration at the
boundary layer with time dependence for DuCOM simulation. In this section, the
verification of the investigated chloride concentration in the existing structures is
compared with the results from DuCOM simulation. The input data is created
individually with the environmental conditions at the existing structural location from
the investigated data by PWRI. The verification of the integrated model with the
investigated data of actual structure is succeeded.
Finally, the successive integrated computational model in this study is able to simulate
the chloride concentration in concrete under the actual environmental conditions. In
various environmental conditions around Japan, the simulation can explain the level of
severity of chloride attack to the concrete structures following the concept of this study.
The knowledge of this research is modified the current design code in order to reduce
the local of safety factor due to the accuracy improvement. At last, the modification of
the current design code is proposed and the parameters are recommended from the
calculation using this model. However, the approval of the high accuracy on the details
of the formula in this study is necessary for further study.

New Durability Design Specification on Chloride Ions Penetration for RC Structures Swatekititham S. 2004
120
References
[1]. Nationwide survey on airborne chloride, Public Works Research Institute, PWRI Technical Memorandum No. 2687, Dec 1988 (in Japanese) [2] W. Ronald Hudson, Ralph Haas, Waheed Uddin, ‘Infrastructure Management’ McGraw-Hill, 1997, [3] Maekawa K., Chaube R. and Kishi T., ‘Modeling of Concrete Performance’ E&FN SPON, 1999 [4] Ishida T., An Integrated Computational System of Mass/Energy Generation, Transport and Mechanics of Materials and Structures, The dissertation submitted to University of Tokyo, March 1999 (in Japanese) [5] Maekawa K., Ishida T., and Kishi T., ’Multi-scale Modeling of Concrete Performance’, Journal of Advanced Concrete Technology, Vol.1, No.2, 91-126, Jul 2003 [6] Kishitani E, Series of durability of concrete structure, Salt-Damage (Ι), pp 10-13, April 1986 (in Japanese) [7] Department of planning on chlorides in concrete structure,’ Summarizing Lecture on Bridge Structure Training’ Japan Roads Association, 1983 [8] Chiaki et al, ’The analysis of Airborne Particle in the Atmosphere in the Amount of Chloride at Coastal Environment Related with Environmental Factors’, Metropolitan Electrical Research Center, No.73020, 1973 [9] Chiaki et al, ’The analysis of maximum airborne chloride particle in the atmosphere’, Metropolitan Electrical Research Center, No.73056, 1974 [10] ‘The measurement of chloride during winter of Japan Sea costal area, Electrical Engineering Research Center, No.177001, 1977 [11] Maruya T., Matsuoka Y., and Tangtermsirikul S.,’ Simulation of Chloride Movement in Hardened Concrete’, Concrete Library of JSCE, No.20, Dec 1992 [12] Investigating Results on the Degree of Soundness in Existing Concrete

New Durability Design Specification on Chloride Ions Penetration for RC Structures Swatekititham S. 2004
121
Structures, Public Works Research Institute, PWRI Technical Memorandum No. 3854, Dec 1999(in Japanese) [13] Standard Specification for Durability of Concrete, Japan Society of Civil Engineers, 2002 (in Japanese) [14] Swatekititham S., Shima H., Ishida T., and Okamura H., The Mechanism of Chloride Ions Penetration in Various Wetting and Drying Conditions, Proc. of JSCE V-006, pp 11-12, 2003 [15] Wade M., and Donald L, ‘Air-sea Interactions and Transport Processes in the Atmospheric and Oceanic Boundary Laters’, US SOLAS Working Group, June 2002 [16] Ley, A.J., ‘A Random Walk Model of two Dimensional Diffusion in the Neutral Surface Layer, Atmospheric Environment, No.16, pp. 2799-2808, 1982 [17] Asakura S., Moriyama M., and Matsumoto M.,’A study on the Distribution of Salt Concentration in the Atmosphere at Coastal Areas’, Energy and Buildings, 15-16, pp. 1069-1077, 1990 [18] APEG Source Apportionment of Airborne particulate Matter in the United Kingdom’, Report of the Airborne Particles Expert Group London: Department of the Environment, Transport and the regions, 1999 [19] Nationwide survey on airborne chloride, Public Works Research Institute, PWRI Technical Memorandum No. 3175, Mar 1993 (in Japanese) [20] Public Works Research Institute, Investigation for Minimum Maintenance of Prestressed Concrete Bridge, December 2000, (in Japanese) [21] Tanaka Y., Kawano H., Watanabe, and Nakajo T., ’Study on Required Cover Depth of Concrete Highway Bridges in Coastal Environment ’, 17th U.S.-Japan Bridge Engineering Workshop, 2001 [22] Department of planning on chlorides in concrete structure,’ Investigation of chlorides in highway Bridges’ Japan Roads Association, Feb 1984 [23] Maruya T., Matsuoka Y., and Tangtermsirikul S., ’Modeling of chloride Ion

New Durability Design Specification on Chloride Ions Penetration for RC Structures Swatekititham S. 2004
122
Movement in the surface Layer of hardened Concrete, Concrete Library of JSCE, NO32, Dec. 1998, pp. 69-84 [24] Kokubu M., ’Research on New and old concrete joint’, JSCE Journal, No.8, 1950, pp 1-24 [25] Standard Specification for Durability of Concrete, Japan Society of Civil Engineers, 1998 (in Japanese) [26] Investigating Results on the Degree of Soundness in Existing Concrete Structures, Public Works Research Institute, PWRI Technical Memorandum No. 3854, March 2000, (in Japanese) [27] French C., ’Durability of Concrete Structures’ Courtesy of the Fib, Osaka 2002 [28] Recommended Practice for weather Test, JIS Specification, Z 2381, 1997, pp 94-105 [29] Fishbane, M.P., Gasiorowicz S., and Thornton S.T., ’Physics for Scientists and Engineers’, Prentice Hall 2nd Edition, 1996 [30] Satou et al, ’Relationship between Wind Speed and the Amount of Chloride Transport and Sediment ’, Proc. of JCI, Vol.25, No.1, 2003, pp 851-856 [31] Aoyama et al, ‘Surface Chloride Ions and Diffusion Coefficient of Concrete Structures near Seashore’, Proc. of JCI, Vol.25, NO.1, 2003, pp 683-688 [32] Oyadomari et al,’ Investigation of Concrete Structures on Ishikaki Island in Okinawa’, Proc. of JCI, Vol.25, No.2, 2003, pp 1933-1938 [33] Hinds, W. C., ’Aerosol Technology; Properties, Behavior, and Measurement of Airborne Particles. Wiley-Interscience, New York, 1982 [34] Willeke K.,’ Aerosol Measurement, Van Nostrand Reinhold, New York, 1993 [35] Coastal Vulnerability Assessment of Cape Cod National Seashore to Sea-Level

New Durability Design Specification on Chloride Ions Penetration for RC Structures Swatekititham S. 2004
123
Rise 2002, USGS Open-File Report 02-233 [36] Southgate, H. N. 1993, ‘The use of wave transformation models to evaluate inshore wave energy resource’, Proc. European Wave energy symposium (Edinburgh, Scotland), pp. 41-46 [37] Sato, K., 2001. Sato, K., ‘Prediction technique on airborne chloride distribution and example of application’, Concrete Engineering Series, No.46, 2001, pp 57-62

New Durability Design Specification on Chloride Ions Penetration for RC Structures Swatekititham S. 2004
124
List of parameters
Cair: daily average airborne chlorides (mg/dm2/day) CL: collected airborne chloride (mg/ml) W: amount of water used for washing out from steel plate (ml) t: exposure time (days) A: specific surface area (= 1dm2) Co,air: daily average of airborne chlorides at seashore (mg/dm2/day) l: distance from seashore (m) Cair,1: airborne chlorides at 1 km from seashore (mg/dm2/day) λ: a multiplication factor U: wind speed (m/s) r: wind ratio in landward direction R: regression value φ: porosity S: degree of saturation Ccl: free chloride concentration in pore solution (mol/l) Jcl: flux of chloride ion (mol/m2.s) Qcl: reduction of free chloride Dcl: chloride ion diffusivity in pore solution phase (m2/s), Ω: tortuosity of pore as equal to (π/2)2
C(x,t): chloride ions concentration at time t (kg/m3) Co: chloride ions concentration at surface of concrete (kg/m3) x: covering depth (cm) D: apparent diffusion coefficient (cm2/yr)
teq: equivalent exposure time (yrs)
C(x,o): initial chloride ions concentration (kg/m3)
ρsea : the density of seawater (kg/m3) E: wave energy density hwave: significant mean wave height (m) g: gravitational acceleration (m/s2) h: height from datum base (m) β: the modification factor due to wave energy α: the modification factor due to wind speed ρs: density of particles (kg/m3)
New Durability Design Specification on Chloride Ions Penetration for RC Structures Swatekititham S. 2004
125
ρair: density of air (kg/m3) at 1 atm W: weight of an airborne particle (N) Nuptrust up trust force of an airborne particle (N) Ndrag: drag force of an airborne particle (N) Cd: coefficient of drag Ab: projected area (πd2/4), m2 v: constant dropping speed (m/s) d: airborne particle diameter (m) µair: dynamic viscosity of air (Ns/m2) Re: Reynolds’ Number X: distance of effective wind (m) Wpeak: peak weight of airborne chloride at U (mg/dm2/hr) Wpeak(2m/s): peak weight of airborne chloride at U=2 m/s (mg/dm2/hr) σi: standard deviation at U ((µm)
σ(2m/s): standard deviation at U = 2 m/s (µm)
di,max: maximum airborne particle size at seashore at a particular U d2,max: maximum airborne particle size at seashore at U = 2m/s X’: horizontal distance in an efficient wind speed (m) ϕ: angle of an efficient wind to effective wind direction Ueff: monthly effective wind speed with equivalent airborne chloride (m/s)
ΣUe: monthly summation of wind only in the efficient wind direction (m/s) Σre: monthly summation of efficient wind direction (hrs) C’air,hr: modified airborne chloride after obstruction (mg/dm2/hr) Cair,hr: free transport airborne chloride in Table 4.3.1 (mg/dm2 /hr) R(d): apparent reduction factor due to obstacle ∆Co,i: coefficient of increasing surface chloride concentration at wind speed U
∆Co,(3m/s): coefficient of increasing surface chloride concentration at wind speed 3m/s qads: flux of quasi-adsorption (mol/cm2/day) Ctot: total chloride concentration at surface (kg/m3) C’tot: total chloride concentration (% by weight of cement) Wc: weight of cementitious material (kg/m3) Mcl: molecular weight of chloride (35.5 g/mol) Vpore: pore volume (l/m3) of a concrete (computed by DuCOM) αfixed: the ration of fixed chloride Cfree: free chloride concentration on the inner surface of boundary layer c/w: cement to water ratio

New Durability Design Specification on Chloride Ions Penetration for RC Structures Swatekititham S. 2004
126
C: chloride ion concentration Dc: bulk diffusion coefficient DT: diffusion coefficient at a certain temperature (cm2/yr) D20: diffusion coefficient at reference temperature of 20°c (cm2/yr) T: an average temperature (K) f(r): reduction factor due to the ratio of diffusion duration Co,eq: equivalent surface chloride concentration (kg/m3)
∆Co,x : coefficient of accumulative surface chloride concentration at a distance
∆Co,(30m): coefficient of accumulative surface chloride concentration at 30m from
concrete wave breaking
Cair,x : amount of airborne chlorides at a distance
Cair,30m: the reference of the amount of airborne chloride at 30m from concrete wave
breaking
New Durability Design Specification on Chloride Ions Penetration for RC Structures Swatekititham S. 2004
Appendix A
Predicting results of accumulated chloride concentration in various zones

New Durability Design Specification on Chloride Ions Penetration for RC Structures Swatekititham S. 2004
Zone 1: At coastline in Okinawa
0.0
10.0
20.0
30.0
40.0
50.0
0 100 200 300 400Time (1 yr)
Co
accu
mul
ate
(kg/
m3 )
ROUGH
0.0
10.0
20.0
30.0
40.0
0 100 200 300 400Time (1 yr)
Co
accu
mul
ate
(kg/
m3 )
NORMAL
0.0
10.0
20.0
30.0
40.0
0 100 200 300 400
Time (1 yr)
Co
accu
mul
ate
(kg/
m3 )
SMOOTH-100% RAIN

New Durability Design Specification on Chloride Ions Penetration for RC Structures Swatekititham S. 2004
0.0
5.0
10.0
15.0
20.0
0 100 200 300 400Time (1 yr)
Co
accu
mul
ate
(kg/
m3 )
SMOOTH-50% RAIN
0.0
3.0
6.0
9.0
12.0
0 100 200 300 400
Time (1 yr)
Co
accu
mul
ate
(kg/
m3 )
SMOOTH-0% RAIN

New Durability Design Specification on Chloride Ions Penetration for RC Structures Swatekititham S. 2004
Zone 2: At coastline in Japan Sea Coastline
0
10
20
30
40
0 100 200 300 400Time (1 yr)
Co
accu
mul
ate
(kg/
m3 )
ROUGH
0
10
20
30
40
0 100 200 300 400Time (1 yr)
Co
accu
mul
ate
(kg/
m3 )
NORMAL
0
10
20
30
40
0 100 200 300 400
Time (1 yr)
Co
accu
mul
ate
(kg/
m3 )
SMOOTH-100% RAIN

New Durability Design Specification on Chloride Ions Penetration for RC Structures Swatekititham S. 2004
0
5
10
15
20
0 100 200 300 400
Time (1 yr)
Co
accu
mul
ate
(kg/
m3 )
SMOOTH-50% RAIN
0
1
2
3
4
0 100 200 300 400
Time (1 yr)
Co
accu
mul
ate
(kg/
m3 )
SMOOTH-0% RAIN

New Durability Design Specification on Chloride Ions Penetration for RC Structures Swatekititham S. 2004
Zone 3: At coastline in Pacific Ocean Coastline
0.0
10.0
20.0
30.0
40.0
0 100 200 300 400Time (1 yr)
Co
accu
mul
ate
(kg/
m3 )
ROUGH
0.0
10.0
20.0
30.0
40.0
0 100 200 300 400Time (1 yr)
Co
accu
mul
ate
(kg/
m3 )
NORMAL
0.0
5.0
10.0
15.0
20.0
0 100 200 300 400Time (1 yr)
Co
accu
mul
ate
(kg/
m3 )
SMOOTH-100% RAIN

New Durability Design Specification on Chloride Ions Penetration for RC Structures Swatekititham S. 2004
0.0
3.0
6.0
9.0
12.0
0 100 200 300 400Time (1 yr)
Co
accu
mul
ate
(kg/
m3 )
SMOOTH-50% RAIN
0.0
1.0
2.0
3.0
4.0
0 50 100 150 200 250 300 350 400
Time (1 yr)
Co
accu
mul
ate
(kg/
m3 )
SMOOTH-0% RAIN

New Durability Design Specification on Chloride Ions Penetration for RC Structures Swatekititham S. 2004
Zone 4: At coastline in Chuubu to Nagasaki
0.0
10.0
20.0
30.0
40.0
0 100 200 300 400Time (1 yr)
Co
accu
mul
ate
(kg/
m3 )
ROUGH
0.0
10.0
20.0
30.0
40.0
0 100 200 300 400Time (1 yr)
Co
accu
mul
ate
(kg/
m3 )
NORMAL
0.0
5.0
10.0
15.0
20.0
0 100 200 300 400
Time (1 yr)
Co
accu
mul
ate
(kg/
m3 )
SMOOTH-100% RAIN

New Durability Design Specification on Chloride Ions Penetration for RC Structures Swatekititham S. 2004
0.0
3.0
6.0
9.0
12.0
0 100 200 300 400
Time (1 yr)
Co
accu
mul
ate
(kg/
m3 )
SMOOTH-50% RAIN
0.0
0.5
1.0
1.5
2.0
0 50 100 150 200 250 300 350 400
Time (1 yr)
Co
accu
mul
ate
(kg/
m3 )
SMOOTH-0% RAIN

New Durability Design Specification on Chloride Ions Penetration for RC Structures Swatekititham S. 2004
Zone 1: At 100m from coastline in Okinawa
0.0
5.0
10.0
15.0
20.0
0 100 200 300 400Time (1 yr)
Co
accu
mul
ate
(kg/
m3 )
ROUGH
0.0
5.0
10.0
15.0
20.0
0 50 100 150 200 250 300 350 400Time (1 yr)
Co
accu
mul
ate
(kg/
m3 )
NORMAL
0.0
4.0
8.0
12.0
16.0
0 100 200 300 400Time (1 yr)
Co
accu
mul
ate
(kg/
m3 )
SMOOTH-100% RAIN

New Durability Design Specification on Chloride Ions Penetration for RC Structures Swatekititham S. 2004
0.0
2.0
4.0
6.0
8.0
0 50 100 150 200 250 300 350 400Time (1 yr)
Co
accu
mul
ate
(kg/
m3 )
SMOOTH-50% RAIN
0.0
0.5
1.0
1.5
2.0
0 100 200 300 400
Time (1 yr)
Co
accu
mul
ate
(kg/
m3 )
SMOOTH-0% RAIN

New Durability Design Specification on Chloride Ions Penetration for RC Structures Swatekititham S. 2004
Zone 2: At 100m from coastline in Japan Sea Coastline
0.0
4.0
8.0
12.0
16.0
0 100 200 300 400Time (1 yr)
Co
accu
mul
ate
(kg/
m3 )
ROUGH
0.0
4.0
8.0
12.0
16.0
0 100 200 300 400Time (1 yr)
Co
accu
mul
ate
(kg/
m3 )
NORMAL
0.0
2.0
4.0
6.0
8.0
0 100 200 300 400Time (1 yr)
Co
accu
mul
ate
(kg/
m3 )
SMOOTH-100% RAIN
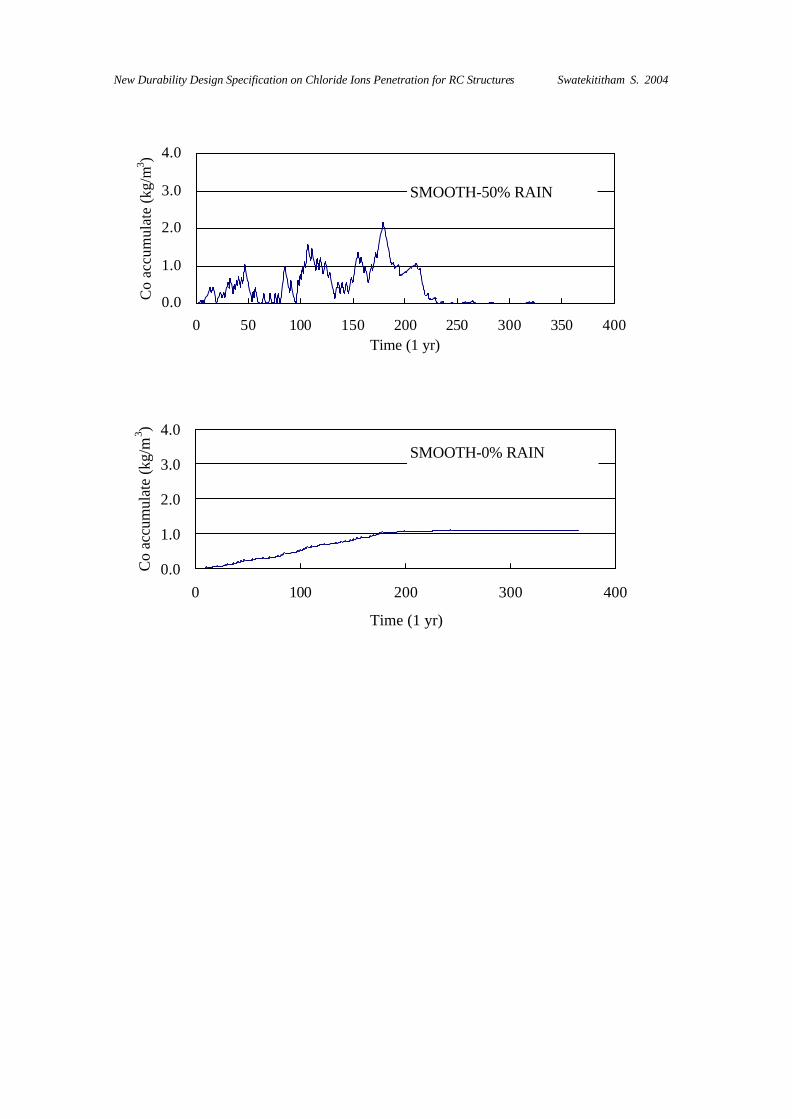
New Durability Design Specification on Chloride Ions Penetration for RC Structures Swatekititham S. 2004
0.0
1.0
2.0
3.0
4.0
0 50 100 150 200 250 300 350 400Time (1 yr)
Co
accu
mul
ate
(kg/
m3 )
SMOOTH-50% RAIN
0.0
1.0
2.0
3.0
4.0
0 100 200 300 400
Time (1 yr)
Co
accu
mul
ate
(kg/
m3 )
SMOOTH-0% RAIN

New Durability Design Specification on Chloride Ions Penetration for RC Structures Swatekititham S. 2004
Zone 3: At 100m from coastline in Pacific Ocean Coastline
0.0
3.0
6.0
9.0
12.0
0 100 200 300 400Time (1 yr)
Co
accu
mul
ate
(kg/
m3 )
ROUGH
0.0
3.0
6.0
9.0
12.0
0 100 200 300 400Time (1 yr)
Co
accu
mul
ate
(kg/
m3 )
NORMAL
0.0
2.0
4.0
6.0
8.0
0 100 200 300 400Time (1 yr)
Co
accu
mul
ate
(kg/
m3 )
SMOOTH-100% RAIN

New Durability Design Specification on Chloride Ions Penetration for RC Structures Swatekititham S. 2004
0.0
2.0
4.0
6.0
8.0
0 100 200 300 400Time (1 yr)
Co
accu
mul
ate
(kg/
m3 )
SMOOTH-50% RAIN
0.0
0.5
1.0
1.5
2.0
0 100 200 300 400
Time (1 yr)
Co
accu
mul
ate
(kg/
m3 )
SMOOTH-0% RAIN

New Durability Design Specification on Chloride Ions Penetration for RC Structures Swatekititham S. 2004
Zone 4: At 100m from coastline in Chuubu to Nagasaki
0.0
3.0
6.0
9.0
12.0
0 100 200 300 400
Time (1 yr)
Co
accu
mul
ate
(kg/
m3 )
ROUGH
0.0
3.0
6.0
9.0
12.0
0 100 200 300 400Time (1 yr)
Co
accu
mul
ate
(kg/
m3 )
NORMAL
0.0
2.0
4.0
6.0
8.0
0 100 200 300 400Time (1 yr)
Co
accu
mul
ate
(kg/
m3 )
SMOOTH-100% RAIN

New Durability Design Specification on Chloride Ions Penetration for RC Structures Swatekititham S. 2004
0.0
2.0
4.0
6.0
8.0
0 50 100 150 200 250 300 350 400Time (1 yr)
Co
accu
mul
ate
(kg/
m3 )
SMOOTH-50% RAIN
0
0.5
1
1.5
2
0 100 200 300 400
Time (1 yr)
Co
accu
mul
ate
(kg/
m3 )
SMOOTH-0% RAIN

New Durability Design Specification on Chloride Ions Penetration for RC Structures Swatekititham S. 2004
Zone 1: At 300m from coastline in Okinawa
0.0
3.0
6.0
9.0
12.0
0 100 200 300 400Time (1 yr)
Co
accu
mul
ate
(kg/
m3 )
ROUGH
0.0
2.0
4.0
6.0
8.0
0 100 200 300 400Time (1 yr)
Co
accu
mul
ate
(kg/
m3 )
NORMAL
0.0
1.0
2.0
3.0
4.0
0 100 200 300 400Time (1 yr)
Co
accu
mul
ate
(kg/
m3 )
SMOOTH-100% RAIN

New Durability Design Specification on Chloride Ions Penetration for RC Structures Swatekititham S. 2004
0.0
1.0
2.0
3.0
4.0
0 100 200 300 400Time (1 yr)
Co
accu
mul
ate
(kg/
m3 )
SMOOTH-50% RAIN
0.0
0.4
0.8
1.2
1.6
0 100 200 300 400
Time (1 yr)
Co
accu
mul
ate
(kg/
m3 )
SMOOTH-0% RAIN

New Durability Design Specification on Chloride Ions Penetration for RC Structures Swatekititham S. 2004
Zone 2: At 300m from coastline in Japan Sea Coastline
0.0
1.0
2.0
3.0
4.0
0 100 200 300 400Time (1 yr)
Co
accu
mul
ate
(kg/
m3 )
ROUGH
0.0
0.5
1.0
1.5
2.0
0 100 200 300 400Time (1 yr)
Co
accu
mul
ate
(kg/
m3 )
NORMAL
0
0.4
0.8
1.2
1.6
0 100 200 300 400Time (1 yr)
Co
accu
mul
ate
(kg/
m3 )
SMOOTH-100% RAIN

New Durability Design Specification on Chloride Ions Penetration for RC Structures Swatekititham S. 2004
0
0.2
0.4
0.6
0.8
0 100 200 300 400Time (1 yr)
Co
accu
mul
ate
(kg/
m3 )
SMOOTH-50% RAIN
0
0.3
0.6
0.9
1.2
0 100 200 300 400
Time (1 yr)
Co
accu
mul
ate
(kg/
m3 )
SMOOTH-0% RAIN

New Durability Design Specification on Chloride Ions Penetration for RC Structures Swatekititham S. 2004
Zone 3: At 300m from coastline in Pacific Ocean Coastline
0.0
1.0
2.0
3.0
4.0
0 100 200 300 400
Time (1 yr)
Co
accu
mul
ate
(kg/
m3 )
ROUGH
0.0
0.5
1.0
1.5
2.0
0 100 200 300 400Time (1 yr)
Co
accu
mul
ate
(kg/
m3 )
NORMAL
0.0
0.5
1.0
1.5
2.0
0 100 200 300 400Time (1 yr)
Co
accu
mul
ate
(kg/
m3 )
SMOOTH-100% RAIN

New Durability Design Specification on Chloride Ions Penetration for RC Structures Swatekititham S. 2004
0.0
0.5
1.0
1.5
2.0
0 100 200 300 400Time (1 yr)
Co
accu
mul
ate
(kg/
m3 )
SMOOTH-50% RAIN
0.0
0.3
0.6
0.9
1.2
0 100 200 300 400
Time (1 yr)
Co
accu
mul
ate
(kg/
m3 )
SMOOTH-0% RAIN
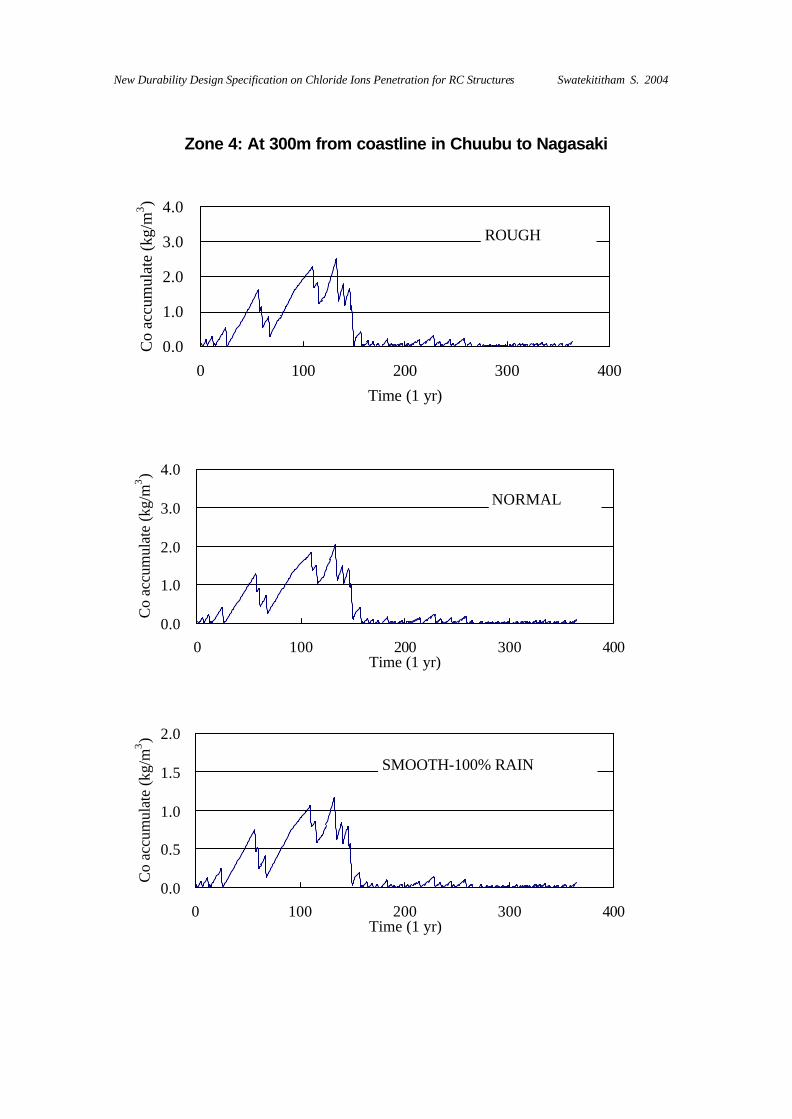
New Durability Design Specification on Chloride Ions Penetration for RC Structures Swatekititham S. 2004
Zone 4: At 300m from coastline in Chuubu to Nagasaki
0.0
1.0
2.0
3.0
4.0
0 100 200 300 400
Time (1 yr)
Co
accu
mul
ate
(kg/
m3 )
ROUGH
0.0
1.0
2.0
3.0
4.0
0 100 200 300 400Time (1 yr)
Co
accu
mul
ate
(kg/
m3 )
NORMAL
0.0
0.5
1.0
1.5
2.0
0 100 200 300 400Time (1 yr)
Co
accu
mul
ate
(kg/
m3 )
SMOOTH-100% RAIN

New Durability Design Specification on Chloride Ions Penetration for RC Structures Swatekititham S. 2004
0.0
0.5
1.0
1.5
2.0
0 100 200 300 400Time (1 yr)
Co
accu
mul
ate
(kg/
m3 )
SMOOTH-50% RAIN
0.0
0.3
0.6
0.9
1.2
0 100 200 300 400
Time (1 yr)
Co
accu
mul
ate
(kg/
m3 )
SMOOTH-0% RAIN

New Durability Design Specification on Chloride Ions Penetration for RC Structures Swatekititham S. 2004
Zone1-Zone4: 500m distance from seashore for indoor structures only [Others are very low surface chloride concentration at this distance]
Zone1
Zone2
0.0
0.3
0.6
0.9
1.2
0 100 200 300 400
Time (1 yr)
Co
accu
mul
ate
(kg/
m3 )
SMOOTH-0% RAIN
0
0.3
0.6
0.9
1.2
0 100 200 300 400
Time (1 yr)
Co
accu
mul
ate
(kg/
m3 )
SMOOTH-0% RAIN

New Durability Design Specification on Chloride Ions Penetration for RC Structures Swatekititham S. 2004
Zone3
Zone4
0
0.1
0.2
0.3
0.4
0 100 200 300 400
Time (1 yr)
Co
accu
mul
ate
(kg/
m3 )
SMOOTH-0% RAIN
0.0
0.1
0.2
0.3
0.4
0 100 200 300 400
Time (1 yr)
Co
accu
mul
ate
(kg/
m3 )
SMOOTH-0% RAIN

New Durability Design Specification on Chloride Ions Penetration for RC Structures Swatekititham S. 2004
Appendix B
The investigated data by Public Works Research Institute for model verification

New Durability Design Specification on Chloride Ions Penetration for RC Structures Swatekititham S. 2004
STRUCTURE NO. A1017Structural input data ValueTime after construction, T (yrs) 31 Depth (cm) Value (kg/m3)Structural area (select one) Hokkaido 1 1.13Distance from seashore (m) 200 3 0.93Height from the mean sea level (m) 8 5 0.84Structure Type (select one) Abutment 7 0.35Apparent Strength, f'c (MPa) 19 9 0.14
Material input data ValueCement type (select one) OPCEstimated w/c = 0.66Weight of cement per m 3 (kg) 256
Experimental CL- data

New Durability Design Specification on Chloride Ions Penetration for RC Structures Swatekititham S. 2004
STRUCTURE NO. B1013Structural input data ValueTime after construction, T (yrs) 30 Depth (cm) Value (kg/m3)Structural area (select one) Iwate 1 1.89Distance from seashore (m) 100 3 4.09Height from the mean sea level (m) 7 5 2.50Structure Type (select one) foundation 7 1.33Apparent Strength, f'c (MPa) 30 9 0.23
Material input data ValueCement type (select one) OPCEstimated w/c = 0.56Weight of cement per m 3 (kg) 300
Experimental CL- data

New Durability Design Specification on Chloride Ions Penetration for RC Structures Swatekititham S. 2004
STRUCTURE NO. B2009Structural input data ValueTime after construction, T (yrs) 29 Depth (cm) Value (kg/m3)Structural area (select one) yamagata 1 4.91Distance from seashore (m) 10 3 3.50Height from the mean sea level (m) 5 5 3.07Structure Type (select one) Retaining wall 7 2.24Apparent Strength, f'c (MPa) 12.2 9 1.18
Material input data ValueCement type (select one) OPCEstimated w/c = 0.76Weight of cement per m 3 (kg) 234
Experimental CL- data

New Durability Design Specification on Chloride Ions Penetration for RC Structures Swatekititham S. 2004
STRUCTURE NO. D2016Structural input data ValueTime after construction, T (yrs) 35 Depth (cm) Value (kg/m3)Structural area (select one) Ichikawa 1 0.60Distance from seashore (m) 30 3 0.58Height from the mean sea level (m) 4 5 0.31Structure Type (select one) Retaining wall 7 0.14Apparent Strength, f'c (MPa) 23.2 9 0.07
Material input data ValueCement type (select one) OPCEstimated w/c = 0.62Weight of cement per m 3 (kg) 266
Experimental CL- data

New Durability Design Specification on Chloride Ions Penetration for RC Structures Swatekititham S. 2004
STRUCTURE NO. D3008Structural input data ValueTime after construction, T (yrs) 36 Depth (cm) Value (kg/m3)Structural area (select one) Toyama 1 0.10Distance from seashore (m) 300 3 0.03Height from the mean sea level (m) 12.5 5 0.03Structure Type (select one) Box culvert 7 0.05Apparent Strength, f'c (MPa) 37.4 9 0.03
Material input data ValueCement type (select one) OPCEstimated w/c = 0.50Weight of cement per m 3 (kg) 312
Experimental CL- data
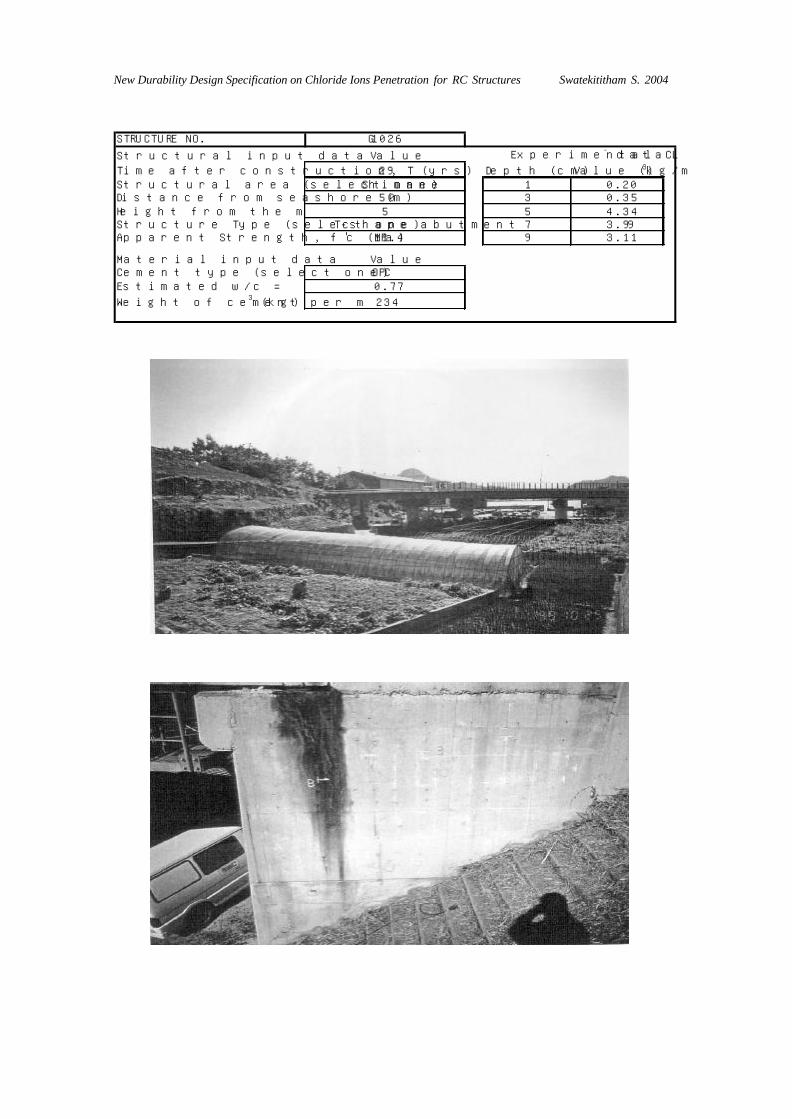
New Durability Design Specification on Chloride Ions Penetration for RC Structures Swatekititham S. 2004
STRUCTURE NO. G1026Structural input data ValueTime after construction, T (yrs) 29 Depth (cm) Value (kg/m3)Structural area (select one) Shimane 1 0.20Distance from seashore (m) 50 3 0.35Height from the mean sea level (m) 5 5 4.34Structure Type (select one) T-shape abutment 7 3.99Apparent Strength, f'c (MPa) 11.4 9 3.11
Material input data ValueCement type (select one) OPCEstimated w/c = 0.77Weight of cement per m 3 (kg) 234
Experimental CL- data

New Durability Design Specification on Chloride Ions Penetration for RC Structures Swatekititham S. 2004
STRUCTURE NO. G3003Structural input data ValueTime after construction, T (yrs) 18 Depth (cm) Value (kg/m3)Structural area (select one) Tottori 1 8.26Distance from seashore (m) 50 3 13.94Height from the mean sea level (m) 4 5 9.30Structure Type (select one) Box culvert 7 5.11Apparent Strength, f'c (MPa) 19 9 2.33
Material input data ValueCement type (select one) OPCEstimated w/c = 0.66Weight of cement per m 3 (kg) 260
Experimental CL- data
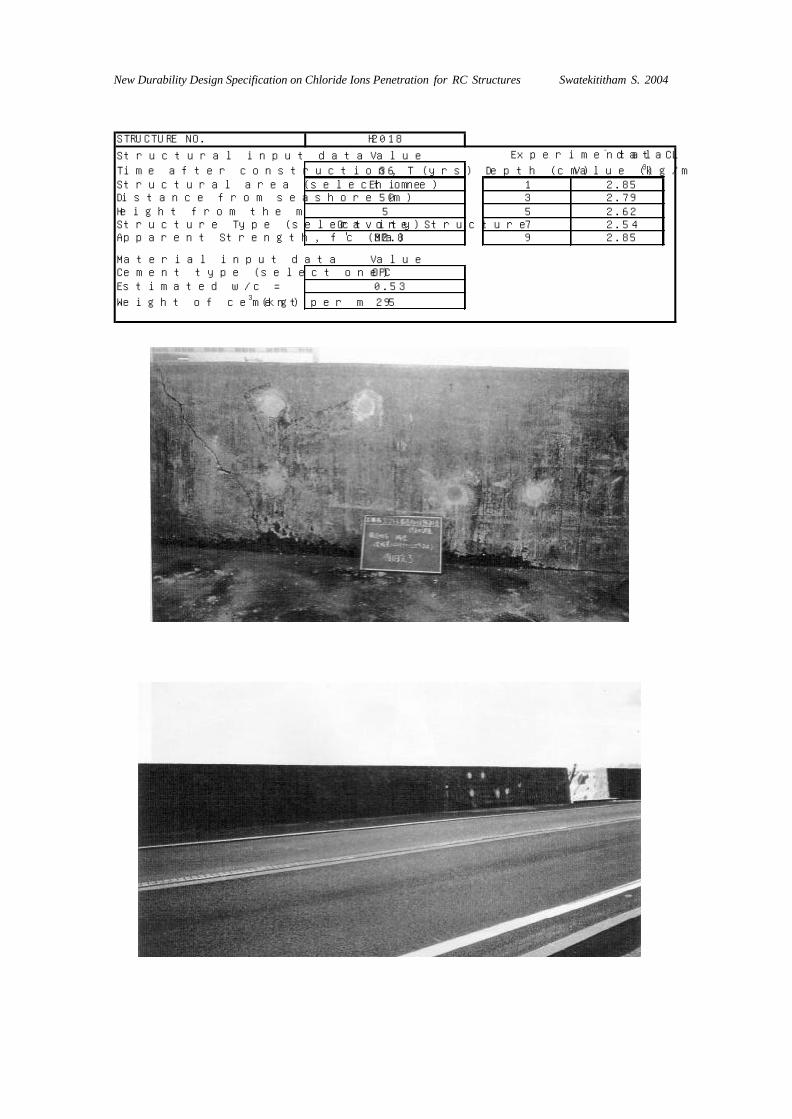
New Durability Design Specification on Chloride Ions Penetration for RC Structures Swatekititham S. 2004
STRUCTURE NO. H2018Structural input data ValueTime after construction, T (yrs) 36 Depth (cm) Value (kg/m3)Structural area (select one) Ehime 1 2.85Distance from seashore (m) 50 3 2.79Height from the mean sea level (m) 5 5 2.62Structure Type (select one) Gravity Structure 7 2.54Apparent Strength, f'c (MPa) 32.8 9 2.85
Material input data ValueCement type (select one) OPCEstimated w/c = 0.53Weight of cement per m 3 (kg) 295
Experimental CL- data

New Durability Design Specification on Chloride Ions Penetration for RC Structures Swatekititham S. 2004
STRUCTURE NO. H4017Structural input data ValueTime after construction, T (yrs) 23 Depth (cm) Value (kg/m3)Structural area (select one) Ehime 1 2.20Distance from seashore (m) 251 3 2.68Height from the mean sea level (m) 0 5 2.06Structure Type (select one) Gutter 7 1.71Apparent Strength, f'c (MPa) 31 9 1.66
Material input data ValueCement type (select one) OPCEstimated w/c = 0.55Weight of cement per m 3 (kg) 295
Experimental CL- data

New Durability Design Specification on Chloride Ions Penetration for RC Structures Swatekititham S. 2004
STRUCTURE NO. K1005Structural input data ValueTime after construction, T (yrs) 18 Depth (cm) Value (kg/m3)Structural area (select one) Okinawa 1 5.42Distance from seashore (m) 100 3 11.79Height from the mean sea level (m) 0 5 7.92Structure Type (select one) Under bridge members 7 4.37Apparent Strength, f'c (MPa) 26 9 3.08
Material input data ValueCement type (select one) OPCEstimated w/c = 0.59Weight of cement per m 3 (kg) 275
Experimental CL- data

New Durability Design Specification on Chloride Ions Penetration for RC Structures Swatekititham S. 2004
STRUCTURE NO. K2005Structural input data ValueTime after construction, T (yrs) 17 Depth (cm) Value (kg/m3)Structural area (select one) Okinawa 1 3.74Distance from seashore (m) 70 3 5.50Height from the mean sea level (m) 5 5 3.74Structure Type (select one) Gravity structure 7 2.55Apparent Strength, f'c (MPa) 23.1 9 1.37
Material input data ValueCement type (select one) OPCEstimated w/c = 0.62Weight of cement per m 3 (kg) 269
Experimental CL- data

New Durability Design Specification on Chloride Ions Penetration for RC Structures Swatekititham S. 2004
STRUCTURE NO. K3003Structural input data ValueTime after construction, T (yrs) 20 Depth (cm) Value (kg/m3)Structural area (select one) Okinawa 1 4.26Distance from seashore (m) 10 3 7.26Height from the mean sea level (m) 0.8 5 2.32Structure Type (select one) Box culvert 7 1.17Apparent Strength, f'c (MPa) 28.6 9 0.85
Material input data ValueCement type (select one) OPCEstimated w/c = 0.57Weight of cement per m3 (kg) 284
Experimental CL- data