computational analysis of pulsed- laser … · computational analysis of pulsed-laser...
TRANSCRIPT
COMPUTATIONAL ANALYSIS OF PULSED-
LASER PLASMON-ENHANCED PHOTOTHERMAL ENERGY CONVERSION
AND NANOBUBBLE GENERATION IN THE NANOSCALE
by
Ioannis Karampelas July 28, 2016
A dissertation submitted to the Faculty of the Graduate School of the University at Buffalo, State University of New York in partial
fulfillment for the degree of Doctor of Philosophy
Department of Chemical and Biological Engineering

ii
Acknowledgements
First and foremost, I would like to begin by expressing my honest gratitude and
appreciation to my academic advisor: Prof. Edward P. Furlani. His guidance, leadership
and patience were paramount to the completion of the current work. Under his
supervision, an initial idea was able to grow and mature, taking the form that it has today.
Prof. Furlani offered me the great opportunity to work in his group not only on the project
that became my dissertation but also on plethora of other exciting projects that added to
my experience and qualified me for future endeavors. His assistance, suggestions and
constructive critique proved invaluable throughout the pursuit of my doctoral degree and
contributed to the successful completion of this work. Indeed, it has been an honor to be
his student and serve under the wing of such a multi-talented scientist and engineer who
was also my friend and mentor.
I would also like to extend my sincere thanks to my committee members Profs. Mark T.
Swihart and Gang Wu for their assistance and valuable suggestions in improving this
work. Along with the entire faculty of the Department of Chemical Engineering at
University at Buffalo, they guided me in lifetime decisions towards the completion of my
degree.
I can’t express anything else other than profound appreciation to present and past group
members and lifetime friends: Xiaozheng Xue, Kai Liu, Jenifer Gómez Pastora, Viktor

iii
Sukhotskiy, Fatema Alali, Vikram Reddy Ardham, Young Hwa Kim, Shailesh Konda,
Koushik Ponnuru, Chenxu Liu, Moon Kattula, Jianchao Wang, Aditi Verma and Gourav
Garg for their active participation, lively discussions, encouragement and valuable
feedback in the course of my research.
Last but certainly not least, my deepest gratitude to my beloved parents, Haralabos and
Maria, my loving sisters Natalia and Demi for their everlasting love and motivation.
Without their help, none of my achievements would have been possible.

iv
Table of Contents
Acknowledgements ................................................................................................................................. ii
Table of Contents .................................................................................................................................... iv
List of Tables ............................................................................................................................................ vi
List of Figures and Graphs ................................................................................................................... vi
Abstract ..................................................................................................................................................... ix
Chapter 1: Introduction .......................................................................................................................... 1
1.1 The Basics of Plasmonic Heating ........................................................................................ 2
1.1.1 Nanoparticle Illumination ............................................................................................... 2
1.1.2 Photothermal Energy Conversion ............................................................................... 6
1.2 Biological Applications of Plasmonic Nanotransducers ............................................. 10
1.2.1 Photothermal Therapy .................................................................................................. 10
1.2.2 Nanobubble Treatment ................................................................................................. 16
Chapter 2: Theory and Methods ......................................................................................................... 22
2.1 Photonic Analysis .................................................................................................................. 24
2.1.1 Spherical Nanoparticles ............................................................................................... 24
2.1.2 Numerical Field Analysis ............................................................................................. 25
2.2 Fluidic Analysis ...................................................................................................................... 28
2.2.1 Temperature and Flow Fields ..................................................................................... 28
2.2.2 Phase Change and Bubble Dynamics ...................................................................... 30
Chapter 3: Combined Computational Modeling............................................................................. 34
3.1 Nanospheres ........................................................................................................................... 35
3.1.1 Synthesis .......................................................................................................................... 35
3.1.2 Photonic Simulations .................................................................................................... 37
3.1.3 Thermofluidic Simulations .......................................................................................... 40
3.2 Nanorods .................................................................................................................................. 44
3.2.1 Synthesis .......................................................................................................................... 44
3.2.2 Photonic Simulations .................................................................................................... 47
3.2.3 Thermofluidic Simulations .......................................................................................... 49

v
3.3 Nanorings and nanotori ........................................................................................................ 52
3.3.1 Synthesis .......................................................................................................................... 52
3.3.2 Photonic Simulations .................................................................................................... 54
3.3.3 Thermofluidic Simulations .......................................................................................... 56
3.4 Nanocages and Nanoframes ............................................................................................... 60
3.4.1 Synthesis .......................................................................................................................... 60
3.4.2 Photonic Simulations .................................................................................................... 63
3.4.3 Thermofluidic Simulations .......................................................................................... 67
3.5 Summary of Combined Modeling Effort........................................................................... 73
Chapter 4: Colloidal Photothermal Modeling ................................................................................. 75
4.1 Photonic Models for Nanoparticles at Varying Orientations ...................................... 76
4.1.1 Absorption Spectra of Gold Nanorods and Nanotori at Discrete Rotations .. 76
4.1.2 Absorption Comparison of Gold Nanorods, Nanotori and Nanorings............. 79
4.1.3 Absorption Cross-Section of Nanoframes under Different Orientations ........ 82
4.2 Colloidal Heating of Identical Nanoparticles .................................................................. 84
4.2.1 Gold Nanorods ................................................................................................................ 84
4.2.2 Gold Nanotori .................................................................................................................. 85
4.3 Cooperative Nanobubble Nucleation ................................................................................ 87
4.3.1 System of Two Nanotori ............................................................................................... 87
4.4 Summary of Colloidal Modeling Effort ............................................................................. 90
Chapter 5: Future Work Recommendations and Conclusions .................................................. 91
5.1 Future Work Recommendations ........................................................................................ 92
5.1.1 Two-Temperature Model for Femto- and Pico-Second Pulsing ......................... 92
5.1.2 Temperature Dependent Material Properties .......................................................... 93
5.1.3 Illumination during Nanobubble Formation ............................................................ 95
5.2 Conclusions ............................................................................................................................. 97
References ............................................................................................................................................. 100

vi
List of Tables
Table 3.1. Summary of modeled nanoparticle geometries with heating and nanobubble
parameters.
List of Figures and Graphs
Figure 1.1. Light wave passing through a plasmonic material. The induced electric field
creates a charge separation in the atoms and thus an oscillating electron cloud (source:
www.nanocomposix.com).
Figure 1.2. Photothermal energy conversion a) Numerical calculation of heat power as a
function of incident wavelength for the case of a single nanorod (50 x 12 nm), b) Heat
power density within the nanoparticle for various wavelengths (Baffou and Quidant 2013).
Figure 1.3. Illustration of the process of photothermal therapy. a) Preparation of
nanoparticles b) Intravenous injection c) Laser illumination d) Successful treatment
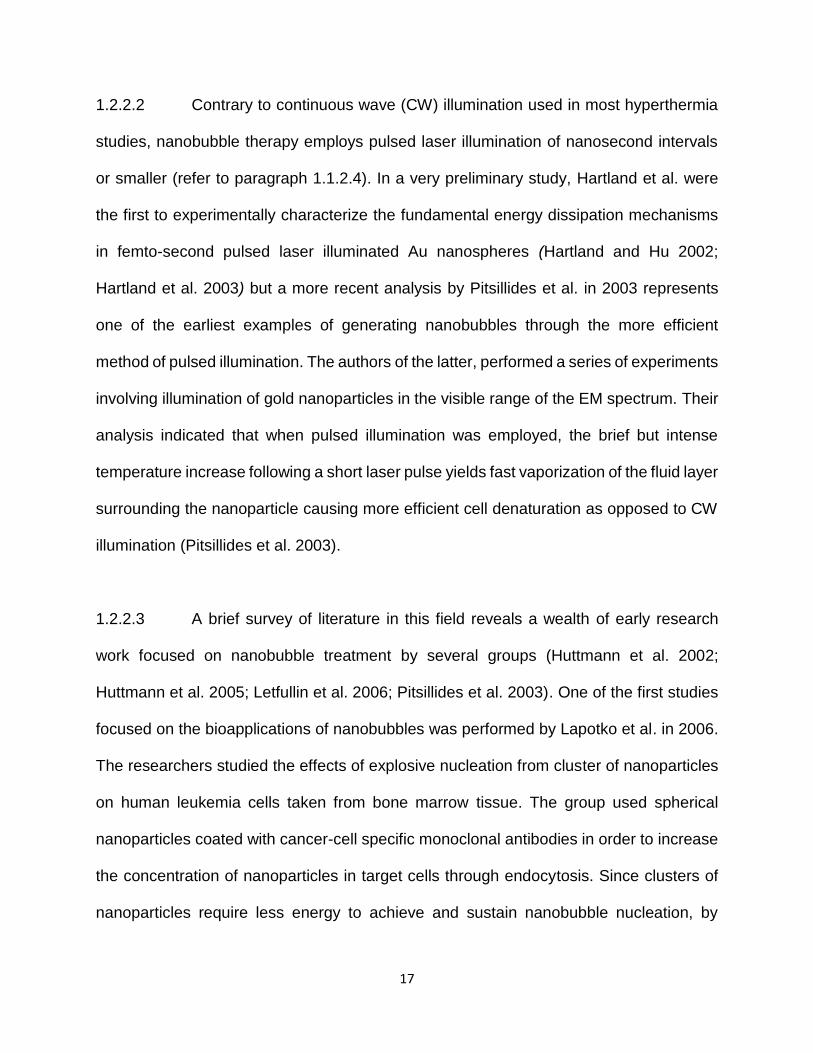
Figure 1.4. In-situ photothermolysis of living EMT-6 tumor cells by thermal explosions
triggered by laser-illuminated gold nanorods. Laser Irradiance (a-d) 113 mJ/cm2, (e-h)
93mJ/cm2 (C.L. Chen et al. 2010a).
Figure 3.1. Scanning electron microscopy (SEM) image illustrating gold nanospheres
with an average diameter of 60 nm (source: www.nanocomposix.com).
Figure 3.2. Photonic analysis of a gold nanosphere (a) Computational domain and field
analysis, (b) Absorbed power vs. wavelength.
Figure 3.3. Photothermal heat cycle of a nanosphere (R = 30 nm) (cross-sectional
view): plot of nanosphere temperature vs. time, pulse duration indicated by red arrow
and dashed line and inset plots showing various phases of the thermal cycle; (a) initial
heating, (b) primary nanobubble formation, (c) primary nanobubble collapse, (d)
secondary nanobubble formation, (e) secondary nanobubble collapse with cooling.
Figure 3.4. Scanning electron microscopy (SEM) image illustrating gold nanorods with
an average length and diameter of 60 and 17 nm, respectively (source:
www.nanocomposix.com).
Figure 3.5. Photonic analysis of a gold nanorod (a) Computational domain and field
analysis, (b) Absorbed power vs. wavelength.
Figure 3.6. Photothermal heat cycle of a nanorod (L = 60 nm, R = 8.5 nm) (cross-sectional
view): plot of nanorod temperature vs. time, pulse duration indicated by red arrow and

vii
dashed line and inset plots showing various phases of the thermal cycle; (a) initial heating,
(b) nanobubble formation, (c) nanobubble (maximum size), (d) nanobubble collapse, (e)
cooling.
Figure 3.7. Nanostructure geometries: (a) nanoring, (b) nanotorus.
Figure 3.8. SEM image (tilted by 80o) of gold nanotori fabricated with colloidal lithography
(Aizpurua et al. 2003)
Figure 3.9. Photonic analysis of a gold nanotorus (R= 30 nm and r = 10nm) with parallel
alignment to the incident polarization: (a) Computational domain and plot of Ex through a
cross section of the domain, (b) Absorbed power vs. wavelength at parallel orientation.
Figure 3.10. Absorption spectra for a nanoring (R = 40 nm, r = 20 nm, h = 20 nm) and a
nanotorus (R = 30 nm, r = 10 nm), both aligned parallel to the incident field.
Figure 3.11. Photothermal heat cycle of a gold nanotorus (R= 30 nm and r = 10nm)
(cross-sectional view): plot of nanorod temperature vs. time, pulse duration indicated by
red arrow and dashed line and inset plots showing various phases of the thermal cycle;
(a) initial heating, (b) nanobubble formation, (c) nanobubble (maximum size), (d)
nanobubble collapse, (e) cooling.
Figure 3.12. Nanoframe structure and characteristic dimensions (Edge length L and edge
thickness W).
Figure 3.13. Transmission electron microscopy (TEM) image of gold nanoframes with an
average edge length L = 50 nm and thickness W = 10 nm (Au et al. 2008)
Figure 3.14. Photonic analysis of a gold nanoframe (L=28nm and R=4) with parallel
alignment to the incident polarization: (a) computational domain, (b) in plane spatial plot
of electric field intensity enhancement (|E|2/|E0|2) (plane shown in inset).
Figure 3.15. Nanoframe absorption spectra as a function of geometric parameters: (a)
absorption spectra vs. L (W = 7 nm) (b) absorption spectra vs. R= L/W (L = 28 nm).
Figure 3.16. Photothermal heat cycle of a nanoframe (L = 50 nm, W = 5 nm) (cutaway
perspective of heated nanocage): plot of nanoframe temperature vs. time, pulse duration
indicated by red arrow and dashed line and inset plots showing various phases of the
thermal cycle; (a) nanobubble formation, (b) nanobubble (maximum size), (c) nanobubble
collapse, (d) cooling.
Figure 3.17. Photothermal heat cycle of a nanoframe (L = 50 nm, W = 10 nm) (cutaway
perspective of heated nanocage): plot of nanoframe temperature vs. time, pulse duration
indicated by red arrow and dashed line and inset plots showing various phases of the

viii
thermal cycle; (a) nanobubble formation, (b) nanobubble (maximum size), (c) nanobubble
collapse, (d) cooling.
Figure 3.18. Photothermal heat cycle of a nanoframe (L = 70 nm, W = 5 nm) (cutaway
perspective of heated nanocage): plot of nanoframe temperature vs. time, pulse duration
indicated by red arrow and dashed line and inset plots showing various phases of the
thermal cycle; (a) nanobubble formation, (b) nanobubble (maximum size), (c) nanobubble
collapse, (d) cooling.
Figure 3.19. 3D perspective of CFD simulations showing nanobubble at maximum
expansion for different nanoframe geometries.
Figure 4.1. Pulsed laser heating of colloidal gold nanorods and nanotori. The nanoparticle
orientation is defined by angles θ and φ. The inset plot illustrates a laser pulse profile,
irradiance I vs. t.
Figure 4.2. Normalized absorption spectra with nanoparticles at different orientations: (a)
nanorod (L = 60 nm, R = 8.5 nm) and (b) nanotorus (R = 40 nm, r = 10 nm).
Figure 4.3. Normalized peak absorption at respective fixed LSPR wavelengths as a
function of particle orientation (θ, φ): (a) nanorod at λ = 770 nm (L = 60 nm, R = 8.5 nm),
(b) nanotorus at λ = 986 nm (R = 40 nm, r = 10 nm).
Figure 4.4. Normalized peak absorption at respective fixed LSPR wavelengths as a
function of particle orientation (θ, φ): (a) nanoring at λ = 793 nm (R = 40 nm, r = 20 nm),
(b) nanotorus at λ = 825 nm (R = 30 nm, r = 10 nm).
Figure 4.5. Pulsed laser heating of colloidal Au nanoparticles. (a) Nanoparticle orientation
is defined by angles θ and φ. Inset plot illustrates a laser pulse profile, irradiance Ilaser vs.
t. (b) Optical absorption cross section σabs vs. orientation.
Figure 4.6. Cooperative heating effects (a) Percentage of single nanorod energy required
to achieve multi-rod nucleation vs. nanorod separation, (b) Percentage of single
nanotorus energy required to achieve 2 tori nucleation vs. nanotorus separation.
Figure 4.7. Photothermal heat cycle of a 2 identical nanotori system (R= 30 nm and r =
10 nm) (cross-sectional view): plot of nanorod temperature vs. time, pulse duration
indicated by red arrow and dashed line and inset plots showing various phases of the
thermal cycle; (a) initial heating, (b) nanobubble formation, (c) nanobubble (maximum
size), (d) nanobubble collapse, (e) cooling.
Figure 5.1. Temperature dependent thermal conductivity for water.
Figure 5.2. Normalized absorption spectra for varying nanobubble size (40 to 80 nm).

ix
Abstract
The ability to generate and control thermal energy with nanoscale resolution is finding
increasing use in a variety of applications spanning the fields of nanoparticle synthesis,
nanofabrication, bio-imaging and medical therapy. One of the most promising approaches
to achieving this involves the use of plasmonics, wherein a laser is used to heat metallic
nanostructures at their localized surface plasmon resonance (LSPR) wavelength. At
plasmon resonance there is a collective and coherent oscillation of electrons within the
nanostructures that gives rise to peak absorption of the incident photons and highly
localized (sub-wavelength) heating and field enhancement. Laser-based plasmon-
enhanced photothermal energy conversion in the nanoscale has drawn increased interest
in recent years for applications such as photothermal therapy and nanoscale imaging
since it can provide efficient heating with unprecedented (subwavelength) spatial
resolution. In the current work, we study pulsed-laser plasmon-assisted nanoscale bubble
nucleation around various nanoparticle geometries using combined computational
electromagnetic and CFD-based fluidic analysis. This combined modeling approach will
aid in the development of a rational guide to experimentalists in this field since it enables
fundamental understanding and, hence, rational design of plasmon-based photothermal
processes; eventually leading to the development of novel photothermal applications. Our
primary goal is to develop computational electromagnetic and CFD-based models for
some of the most commonly used nanoparticle geometries. Such modeled geometries
include nanospheres, nanorods, nanoframes, nanotori and nanorings. Two types of
computational models will be developed: a) Computational Electromagnetics models for

x
the photonic analysis, used to calculate photothermal energy conversion within the
nanoparticles, i.e. the time-averaged power absorbed by a particle as a function of the
wavelength, intensity and polarization of the incident light and b) Computational Fluid
Dynamic (CFD)-based models that predict thermal, pressure and flow effects including
the temperature rise in the particle, heat transfer from the particle to the fluid, phase
change within the fluid leading to homogeneous bubble nucleation, the dynamic behavior
of the bubble as it expands and collapses, and the temperature, pressure and flow
throughout the fluid during the entire process. In order to achieve that goal, we use state-
of-the-art software packages including but not limited to: FLOW 3D versions 10.1 and
11.1 from Flow Science Corp. (www.flow3d.com) and COMSOL Multiphysics Software
versions 4.4 and 5.2 with full CFD-FSI, nanofluidics and RF analysis capability,
respectively. The initial modeling effort is mainly focused on modeling nanoparticles
exhibiting some kind of axial symmetry, such as nanospheres and nanorods, with
constant fluid and particle properties. It will be used to determine heretofore unknown
properties such as the plasmon resonance wavelength, the amount of power required to
generate and sustain nanobubbles without melting the nanoparticles and the size and
duration of occurring nanobubbles for each nanoparticle geometry. In the next phase of
the study, we proceed with the development of enhanced computational models to
account for colloidal effects. Although initial models are able to predict the details of the
generation of a nanobubble around a single nanoparticle illuminated in parallel orientation
relative to the polarization of the incident field, most in-vivo applications involve a colloidal
solution of particles: a collection of particles at random orientations. Therefore, a series
of models to account for colloidal effects for certain nanoparticle geometries will be

xi
developed. Such models include a) cooperative colloidal nanoparticle heating models that
predict the average temperature rise of a colloidal solution of identical nanoparticles under
fixed illumination as a function of nanoparticle concentration, b) cooperative nanobubble
nucleation models that are able to calculate the effects of cooperative nucleation including
the generation of nanobubbles around multiple identical nanoparticles and merging of
nanobubbles and c) photonic models for colloidal nanoparticles at varying orientations
that can determine the fall off in the peak absorption under fixed illumination as the
nanoparticles take on different orientations. This study directly addresses the knowledge
gap concerning the colloidal behavior of plasmonic nanoparticles. Finally, we will be
suggesting new potential paths of research such as a non-continuum, high accuracy
approach. Although, the models developed in this study represent the most accurate
nanobubble modeling attempt thus far, the assumptions of continuum theory and of
constant nanoparticle properties might lead to potential discrepancies between modeling
and experimental results. Hence, in the interest of increased accuracy, we will suggest
the use of the Two-temperature Model (TTM) to describe non-equilibrium femto-second
electron relaxation in the nanoparticles. Such models may enable the proposed theory to
be extended to femto- and pico-second pulsing. A further refinement of the models
developed initially can be potentially realized with the inclusion of temperature dependent
properties for the fluid and the nanoparticle. The combination of non-equilibrium effects
and temperature pertinent properties will provide most sophistication to an already
complex modeling effort. In addition to the enhanced models, initial computational models
could also be extended to include the fall off on the peak absorption when a nanobubble
is being formed around a nanoparticle while it is still being illuminated. Overall, the

xii
modeling approach described herein will a) directly address the knowledge gap of
photothermal therapy nanobubble specifics for each geometry such as required
wavelength for plasmon resonance, required energy and pulse duration to achieve
nucleation without melting or even evaporating the nanoparticles, b) explain the
temperature related behavior of colloidal plasmonic nanoparticles for photothermal drug
delivery and c) provide experimentalists in the field with a most accurate rational guide
for the development of novel photothermal applications.
1
Chapter 1: Introduction
1.0 Over the last several years there has been a proliferation of research into the
synthesis, characterization and photonic applications of metallic (e.g. Au, Ag)
nanoparticles (Frens 1973; Goodman et al. 1980; P. K. Jain et al. 2008; Kreibig and
Vollmer 1995; Lewinski et al. 2008; Schultz et al. 2000). This is due, in large part, to the
unique optical properties of such particles, especially manifestations of localized surface
plasmon resonance (LSPR). At plasmon resonance, there is a collective and coherent
oscillation of free electrons in subwavelength particles that results in an intense
absorption and scattering of incident light, as well as highly localized field enhancement.
Metallic nanoparticles exhibit this resonance at shape and size-dependent wavelengths
that span the ultraviolet (UV) to near-infrared (NIR) spectrum. A desired resonant
wavelength can in principle be obtained by controlling the geometry and dimensions of
the particles during synthesis. The ability to tune LSPR in this fashion has proven useful
for a broad range of applications such as biosensing (Carrara 2010), optical coherence
tomography (Oldenburg et al. 2006), photoacoustic imaging (Agarwal et al. 2007), two-
photon luminescence imaging (H. Wang et al. 2005), photothermal therapy (X. Huang et
al. 2006), photovoltaic and nanoparticle synthesis (Hashimoto et al. 2012). In many
applications, a femto- or nano-second pulsed laser is used to excite a desired LSPR
response of a nanoparticle (Ekici et al. 2008). The ability to probe and exploit plasmon-
enhanced light-mater interactions occurring in ultra-fast time frames and nanoscale
spatial resolution has spawned fundamental and translational research with broad impact
in fields that include analytical and material chemistry, condensed matter physics,
nanophotonics and biomedicine.

2
1.1 The Basics of Plasmonic Heating
1.1.1 Nanoparticle Illumination
1.1.1.1 As a first step in our investigation of the use of plasmonic nanoparticles as
nano-sources of heat and subsequent nanobubble nucleation, we discuss the basic
mechanisms that lead to the generation of heat in metal nanoparticles from the absorption
of incident light.
1.1.1.2 Most metal nanoparticles support electronic resonances known as localized
surface plasmons (LSPs) that can be excited when such nano-objects are illuminated at
a certain wavelength. For the purposes of the current research, plasmons can be
understood in a classical sense as an oscillation of a free electron density with respect to
the fixed positive ions in a metal, notably noble metals (e.g. Au or Ag) at optical
frequencies as seen in Fig. 1.1. Under certain circumstances, plasmons can be excited
by an incident electromagnetic (EM) field, i.e. when there is a proper momentum match
between the incoming
photons and the plasmons.
Once plasmons are excited,
they give rise to greatly
enhanced and highly localized
fields and absorption of
energy, which are useful for
many applications requiring
Figure 1.1. Light wave passing through a plasmonic
material. The induced electric field creates a charge
separation in the atoms and thus an oscillating
electron cloud (source: www.nanocomposix.com).

3
nanoscale heat generation or manipulation, e.g. photothermal therapy. The response of
a plasmonic material to an applied field can be predicted using classical electrodynamics
if the material can be modeled using an effective bulk dispersive dielectric function. In
practice, for noble metal particles, a bulk dielectric function can be used to describe
plasmonic behavior for dimensions down to approximately in 10 nm, and a size
dependent dielectric function can be employed for objects with dimensions down to
roughly 1-2 nm (Coronado and Schatz 2003; Imura et al. 2005; Kottmann et al. 2001).
1.1.1.3 The wavelength at which local surface plasmon resonance occurs depends
mostly on the morphology and the type of the metal that nanoparticles are fabricated with.
This ability to tune the frequency at which LSP resonances arise, for gold and silver
nanoparticles, from the visible to the near infrared (NIR) is a very important quality for
bioapplications (Frangioni 2003). Since recent advances in the field of bottom-up
fabrication techniques have allowed colloid metal nanoparticles in a variety of different
shapes and sizes to be created at low cost, nanoparticles specifically tailored for a
plethora of different plasmonic applications are currently available.
1.1.1.4 In order to provide a basic understanding of the physics involved in
nanoparticle illumination, we assume that a metal nanoparticle immersed in fluid is being
irradiated by polarized monochromatic light at an angular frequency ω. The nanoparticle
has a complex relative permittivity ε(ω) while the surrounding fluid has a real relative
permittivity εs. For the simplest case, a metal sphere with radius R illuminated at a
wavelength much larger than the particle itself can be considered as an electromagnetic

4
dipole. The wavelength at which LSP resonance occurs can them be derived from its
polarizability α(ω) which reads:
34
2
s
s
R
(1.1)
Based on this expression, it can be concluded that for the simple case of a sphere, LSP
resonance arises when the polarizability gets maximized. This occurs at a frequency ω
at which the value of the permittivity of the nanoparticle is ε(ω) ≈ -2εs. For example, for a
gold sphere with a radius of approximately 30 nm, submerged in water, the plasmon
resonance wavelength is found to be λ ≈ 530 nm. It is useful to note that for larger
nanoparticles the previously described dipolar approximation is not valid and more
complex models that account for retardation effects are required (e.g. Mie theory)
(Bohren and Huffman 2008; Myroshnychenko et al. 2008). Nano-objects of complex
geometry, require a full numerical analysis.
1.1.1.5 Nonetheless, for all nanoparticle morphologies the efficiency of the
absorption process and thus the effectiveness of the photothermal transduction can be
quantified through the absorption and scattering cross-sections (Bohren and Huffman
2008; Myroshnychenko et al. 2008). Independent of nanoparticle geometry, the
absorption (σabs) and scattering (σscat) cross sections read as follows:
4
2Im
6abs
kk
(1.2)
4
2
6scat
k
(1.3)

5
where k is the angular wavenumber (2π/λ). The photothermal efficiency (μ) can then be
determined through the ratio of cross-sections:
abs
scat
(1.4)
The value of μ strongly depends on the morphology of the nanoparticle (H. Chen et al.
2010b; B. Khlebtsov et al. 2006). For the simple case of spherical nanoparticles immersed
in water, particles with radii less than 88 nm are found to be more absorption dominant
(μ≈1) while particles with larger radii were determined to be more scattering dominant
(μ<1). However, this statement is only accurate when comparing the respective maxima
of both the absorption and scattering cross-section spectra (Baffou and Quidant 2013).
1.1.1.6 Overall, although gold nanoparticles are generally better absorbers than
scatterers of incident light, their actual behavior depends on the illumination frequency.
Such frequency has to be precisely determined in order to better understand which the
dominant energy conversion pathway actually is. It is worth mentioning that estimating
the absorption efficiency of a given plasmonic nanostructure based on experimentally
derived extinction spectra, a process commonly employed in literature (Arbouet et al.
2004), does not represent a reliable method of determining the dominant energy
conversion pathway. In the current work, we opted for the development of computational
models and more specifically full-wave electromagnetic analysis in order to most
accurately calculate the absorption cross-section and, hence, the consequent conversion
of electromagnetic radiation to heat inside the nanoparticle.

6
1.1.2 Photothermal Energy Conversion
1.1.2.1 The plasmonic response of metallic nanoparticles to illumination and the
resulting thermal effects in a fluid are of particular interest, especially for bioapplications.
These effects depend on many factors including the duration of the laser pulse, the
wavelength, polarization and intensity of the incident light, the size and shape of the
nanoparticles (Hao and Schatz 2004; Hao et al. 2004; Sonnichsen et al. 2002) and the
physical properties of the fluid. In order to better understand these effects and the factors
affecting them, in this section we describe the basic physics of the process of
photothermal energy conversion.
1.1.2.2 The power absorbed by a metallic nanostructure (Q), and subsequently
delivered to the surrounding fluid, can be simply expressed using the absorption cross-
section σabs (introduced in paragraph 1.1.1.5) and the irradiance I of the incoming light
(power per unit surface). It reads as follows:
absQ I (1.5)
For the case of a simple sphere of radius r, the heat generation can also be determined
through the volume integral of the heat power density q(r) in the nanoparticle which is:
3
VQ q r d r (1.6)
However, because of the fact that heat generation stems from Joule effects, the heat
power density q(r) can also be written as:
1
Re2
q r J r E r (1.7)

7
where J(r) is the complex amplitude of the electronic current density and E(r) is the
electric field inside the nanostructure. As seen from this analysis, the absorption of energy
and the subsequent heat generation is a completely optical problem and directly related
to the electric field within the confines of the nanoparticle (Baffou and Quidant 2013).
1.1.2.3 Nevertheless, the calculation of the temperature distribution both inside and
outside the nanoparticle falls in the field of transport phenomena. For the simplest case
of a spherical nanoparticle, the steady state temperature distribution T(r) under
continuous illumination can be readily calculated from:
Nanoparticler T r q r (1.8)
0 Fluidr T r (1.9)
where κ(r) is the radially dependent thermal conductivity. Although, the heat power
density q(r) can be non-uniform as it can be seen in Fig. 1.2, the temperature of the
nanoparticle is generally found to be highly uniform because of the high thermal
conductivity of most metals as opposed to their surrounding environment (fluids).
1.1.2.4 Thus far, we described the absorption of light energy under continuous
wave illumination. Yet, most applications of metal nanoparticles involve some kind of
pulsed illumination ranging from the femtosecond to the nanosecond range. Photothermal
energy conversion in pulsed illuminated metallic nanostructures in fluid occurs through a
succession of 3 processes (Ekici et al. 2008) involving different time scales. At the onset
of illumination, free electrons in the nanoparticles absorb energy from the incident

8
photons. The electrons undergo electron-electron scattering and relax to an equilibrium
energy distribution within 10-50 fs. Consequently, these energetic electrons transfer their
kinetic energy to the lattice of the nanoparticle through electron-phonon interactions.
Thermal equilibrium between the electrons and the lattice occurs on the order of 10 to 50
ps. Finally, as the particle (lattice) temperature increases, energy is transferred to the
surrounding fluid through phonon–phonon coupling. Initially, there is a discontinuous jump
in temperature at the particle-fluid interface due to the mismatch in material properties,
but this subsides within a fraction of a nanosecond (100-400 ps) (Ekici et al. 2008).
Figure 1.2. Photothermal energy conversion a) Numerical calculation of heat power
as a function of incident wavelength for the case of a single nanorod (50 x 12 nm), b)
Heat power density within the nanoparticle for various wavelengths (Baffou and
Quidant 2013).

9
1.1.2.5 Pulsed illumination presents researchers with a wealth of advantages such
as highly localized temperature increases (Baffou and Rigneault 2011), smaller
temperature and pressure variations (Hu and Hartland 2002; V. K. Pustovalov 2005;
Volkov et al. 2007) and nanobubble generation which is the focus of the present work
(Alali et al. 2013; Furlani et al. 2012; Karampelas et al. 2016; Kotaidis et al. 2006; D.
Lapotko 2009a; E. Lukianova-Hleb et al. 2010; Vogel et al. 2008). In the next section we
will focus more on the different bioapplications of noble metal nanoparticles as highly
isolated sources of heat.

10
1.2 Biological Applications of Plasmonic Nanotransducers
1.2.1 Photothermal Therapy
1.2.1.1 One of the most prominent applications of plasmonic nanoparticles is
photothermal therapy. The basic method of operation of photothermal therapy lies in
artificially enhancing the optical absorption of the cancerous tissue compared to healthy
tissue. During the last several years, various transducers have been studied for
photothermal therapy including organic dyes (e.g. indocyanince green (Zheng et al.
2012)), metal nanoparticles (e.g. Au nanostructures (N. Khlebtsov et al. 2013)) and
carbon-based nanomaterials (e.g. carbon nanotubes (Moon et al. 2009)). Among these,
there has been an emphasis on applications of gold nanoparticles. Gold nanoparticles
are particularly well-suited for bioapplications because they can be synthesized in various
sizes and shapes and can be readily coated with a variety of enabling agents using
thiolate monolayer chemistry. Such agents include poly(ethylene glycol) (PEG), which
enhances biocompatibility and circulation time, cancer specific antibodies (e.g. HER2-
antibody (Skrabalak et al. 2007)) to enable selective cancer cell targeting, smart polymers
such as poly(N-isopropylacrylamide) (pNIPAAm) (Yavuz et al. 2009) for photothermally
controlled drug delivery or combinations thereof. For photothermal applications, gold
Figure 1.3. Illustration of the process of photothermal therapy. a) Preparation of
nanoparticles b) Intravenous injection c) Laser illumination d) Successful treatment
11
nanoparticles can enhance optical absorption of tumor sites through an increase of their
concentration in such tissues either via active targeting, as a result of appropriate
functionalization, or via agglomeration, due to the nature of the tumorous vascular
system. Laser illumination of appropriate wavelength can then locally slowly raise the
temperature (usually less than 10 K) of the tissue. This temperature rise (hyperthermia)
leads to the disruption of homeostasis of cancer cells causing apoptosis or necrosis. The
process in its entirety results in successful patient treatment and is summarized in Fig.
1.3. As it can be seen from the following literature review, this method of treatment
remains highly popular amongst experimentalists thanks to its relative simplicity and its
lack of harmful systemic side-effects usually associated with other methods of cancer
therapy, e.g. chemotherapy. However, it has certain disadvantages, namely the lack of
high treatment localization which causes the accidental death of healthy cells surrounding
the treated tissue (Au et al. 2008; Cherukuri et al. 2010; Gu et al. 2007; X. Huang et al.
2008; Prashant K Jain et al. 2007; Lal et al. 2008; von Maltzahn et al. 2009; Y. Wang et
al. 2013; Yakunin et al. 2015).
1.2.1.2 As mentioned previously, in order to achieve the objective of local
hyperthermia, appropriate illumination should be employed. It has been demonstrated
that maximum penetration of light in human tissues occurs at wavelengths in the near-
infrared (NIR) range of the electromagnetic (EM) spectrum. Thus, the collection of
wavelengths between 700 and 1000 nm, are commonly referred to as “transparency
window”, “therapeutic window” or “optical window”. This high photon propagation is due
to the absorption characteristics of particular tissues or organs. In living tissue, the only

12
major NIR absorbers are water, oxyhemoglobin, deoxyhemoglobin and lipids. On
average, for tissues containing 8% blood and 29% lipids, hemoglobin accounts for most
of the absorption at NIR wavelengths with a total absorption no more than 65% (Frangioni
2003; Lim et al. 2003). Thus, employing therapeutic options in this region of the spectrum
allows for deeper cancerous tissue penetration and nanoparticle targeting while
maintaining minimum absorption of light by nearby healthy cells.
1.2.1.3 After light reaches the targeted tissue, maximum light absorption by
nanoparticles can be achieved by taking advantage of plasmonic effects. While spherical
nanoparticles have maximum absorption peaks in the visible spectrum, a variety of other
nanoparticle morphologies with strong NIR absorption peaks have been developed. A few
of the most popular choices include gold nanoshells (structures composed of a dielectric
core covered by a thin layer of gold) (Day et al. 2011; André M Gobin et al. 2007; L_R
Hirsch et al. 2003; Lal et al. 2008; Loo et al. 2005), gold nanorods (elongated ellipsoid
structures) (Dickerson et al. 2008; X. Huang et al. 2006; von Maltzahn et al. 2009; Y.
Wang et al. 2013) and gold nanocages (hollow nanostructures with porous walls) (Au et
al. 2008; Jingyi Chen et al. 2010c; Mackey et al. 2013; Skrabalak et al. 2007).
1.2.1.4 Some of the most pioneering work in the field of photothermal treatment
was performed by Hirsch and co-workers in 2003. The authors proposed the novel, at the
time, idea of in vitro incubating human breast carcinoma cells with gold nanoshells. After
illuminating the cells with a laser at wavelength of 820 nm and an irradiance of 35 W/cm2,
the authors observed photothermally induced morbidity. No effects were shown on cells
13
not treated with nanoparticles (L_R Hirsch et al. 2003). Some of the first in vivo
experiments were performed by O’Neil et al. in 2004. They demonstrated the feasibility
of the method, developed by Hirsch and co, on mice with murine colon cancer by initially
functionalizing nanoshells of 130 nm in diameter with polyethylene glycol (PEG) for
biocompatibility and then intravenously introducing the solution to the mice to be treated.
Nanoparticle illumination was achieved through the use of a diode laser operating at a
wavelength of 808 nm with an irradiance of 4 W/cm2. All treated mice appeared healthy
and tumor free after 90 days (O'Neal et al. 2004).
1.2.1.5 The use of gold nanorods for photothermal therapy was first introduced by
the El-Sayed group in 2006. The group managed to appropriately modify the aspect ratio
of gold nanorods thus allowing for strong absorption peaks in the NIR. Then, a series of
in vitro experiments were performed to demonstrate the capabilities of their nanoparticle
design. After functionalizing the nanorods with anti-epidermal growth factor receptor (anti-
EGFR) monoclonal antibodies, the authors introduced the nanoparticles into a culture of
nonmalignant epithelial cells (HaCat) and two cultures of malignant oral epithelial cell
lines (HOC 313 clone8 and HSC 3). The properly functionalized nanoparticles were then
shown to bind only to the malignant cells due to the overexpressed EGFR on the
cytoplasmic membrane of the malignant cells and after continuous laser illumination at a
wavelength of 800 nm the malignant cells were destroyed. Their work represents one of
the early examples of theranostics were cancer cell diagnosis and treatment are possible
through the use of gold nanoparticles (X. Huang et al. 2006). The same group also
introduced some of the first in vivo experiments on mice in 2008. Through the introduction

14
of PEG-treated nanorods in the cancerous tissue and subsequent illumination in the NIR,
the authors were able to demonstrate significant tumor size decreases in the treated mice
population (Dickerson et al. 2008).
1.2.1.6 Gold nanocages were introduced to the field of photothermal therapy
through an early study performed by L. Au et al. The authors studied the effectiveness of
photothermal therapy using gold nanocages by examining breast cancer cell death rate.
Initially, through coating nanocages with monoclonal antibodies they were able to attach
nanocages to the cell membrane or even achieve endocytosis. After performing a pulsed
laser illumination parametric study, they established the illumination power intensity and
duration required to achieve irreversible cellular damage. The percentage of cellular
damage was measured using flow cytometry coupled with propidium iodide staining (Au
et al. 2008). One of the first in vivo investigations of the photothermal application of gold
nanocages was performed by J. Chen et al. on mice injected with U87wtEGFR tumor
cells. Due to malfunctioning lymphatic system and wide interendothelial junctions, the
nanocage concentration was found to be higher in the tumor area because of enhanced
permeability and retention. The nanocages were subsequently illuminated by diode laser
for 10 min causing a sudden increase in temperature which resulted in irreversible
damage to tumor cells. The damage was evaluated by changes to tumor metabolism
using F-FDG PET and confirmed through histological examination (Jingyi Chen et al.
2010c). In a recent comparison study by Y Wang et al, nanocages have been shown to
be much better photothermal transducers as opposed to nanoshells and nanorods. Based
on their analysis, nanocages represent the optimal choice for photothermal energy

15
conversion per Au atom in vitro followed by nanohexapods and then nanorods. More
specifically, in their photothermal efficiency investigation, a solution of gold nanocages
was compared to solutions of gold nanohexapods and gold nanorods and despite having
the lowest concentration, the overall photothermal performance of the nanocages was
the highest (Y. Wang et al. 2013).
1.2.1.7 In spite of its demonstrated therapeutic capabilities, photothermal therapy
still remains at its infancy and hasn’t quickly translated from the lab to the clinic perhaps
because of certain disadvantages that it presents. In most of the studies mentioned above
the authors used hyperthermia to induce cancer cell death. However, hyperthermia is a
slow process which might result in potential collateral damage to nearby tissues and if
combined with photothermal drug delivery for increased effectiveness, specific agents
that might have undesired cytoxicity are also introduced. In addition, there is a wealth of
evidence indicating that this method of treatment lacks therapeutic potential in cases of
low nanoparticle targeting specificity due to tumor cell heterogeneity, resistance of
phenotypes (Cho et al. 2008; Jemal et al. 2009; Peer et al. 2007) as well as cases prone
to nanoparticle or energy delivery toxicity (Cherukuri et al. 2010; Choi et al. 2011; Gilstrap
et al. 2011; Andre M Gobin et al. 2005; H.-C. Huang et al. 2011; Huff et al. 2007; Li et al.
2009; Pitsillides et al. 2003; Yuan et al. 2012). As a viable alternative to photothermal
therapy’s shortcomings, we propose the use of plasmonic nanobubbles.

16
1.2.2 Nanobubble Treatment
1.2.2.1 The principles of nanobubble therapy lie in the synergistic effect of
nanoparticle agglomeration and phase-change induced mechanical damage in tumor
sites. In this approach, the nanoparticles are introduced into the vasculature and find their
way to cancerous tissue where they are up-taken by bio-targeted unwanted cells. Once
within the vicinity, the nanoparticles are heated using a pulsed laser with sufficient
intensity to selectively generate a thin film of vapor that leads to the destruction of
malignant cells by rupturing their membrane. This technique, compared to other
nanoparticle medicine solutions, presents an alternative with various advantages: (a)
plasmonic nanobubbles can be generated on-demand with high temporal and spatial
resolution; (b) the size of the occurring nanobubble size and nucleation energy required
depend on the localized concentration of nanoparticles. Higher concentration of
nanoparticles in tumor cells results in a lower energy threshold for nanobubble formation
due to cooperative heating. Hence, by carefully tuning laser fluence minimal damage is
caused to nearby healthy cells (D. O. Lapotko et al. 2006a; E. Y. Lukianova-Hleb et al.
2012a; E. Y. Lukianova-Hleb and Lapotko 2014), (c) plasmonic nanobubbles can be used
to inflict direct mechanical damage to a cell’s membrane thus nullifying the requirement
for specialized drugs. This mechanical process results in immediate lysis of the targeted
cancer cells rather than apoptosis or necrosis; (d) the entire process requires only a few
nanoseconds to perform rather than approximately 10 min for hyperthermia; (e) apart
from mechanical destruction, nanobubbles can also be used for drug delivery for a
synergistic effect (E. Y. Lukianova-Hleb and Lapotko 2014).
17
1.2.2.2 Contrary to continuous wave (CW) illumination used in most hyperthermia
studies, nanobubble therapy employs pulsed laser illumination of nanosecond intervals
or smaller (refer to paragraph 1.1.2.4). In a very preliminary study, Hartland et al. were
the first to experimentally characterize the fundamental energy dissipation mechanisms
in femto-second pulsed laser illuminated Au nanospheres (Hartland and Hu 2002;
Hartland et al. 2003) but a more recent analysis by Pitsillides et al. in 2003 represents
one of the earliest examples of generating nanobubbles through the more efficient
method of pulsed illumination. The authors of the latter, performed a series of experiments
involving illumination of gold nanoparticles in the visible range of the EM spectrum. Their
analysis indicated that when pulsed illumination was employed, the brief but intense
temperature increase following a short laser pulse yields fast vaporization of the fluid layer
surrounding the nanoparticle causing more efficient cell denaturation as opposed to CW
illumination (Pitsillides et al. 2003).
1.2.2.3 A brief survey of literature in this field reveals a wealth of early research
work focused on nanobubble treatment by several groups (Huttmann et al. 2002;
Huttmann et al. 2005; Letfullin et al. 2006; Pitsillides et al. 2003). One of the first studies
focused on the bioapplications of nanobubbles was performed by Lapotko et al. in 2006.
The researchers studied the effects of explosive nucleation from cluster of nanoparticles
on human leukemia cells taken from bone marrow tissue. The group used spherical
nanoparticles coated with cancer-cell specific monoclonal antibodies in order to increase
the concentration of nanoparticles in target cells through endocytosis. Since clusters of
nanoparticles require less energy to achieve and sustain nanobubble nucleation, by

18
illuminating the nanoparticles with a 532 nm laser for 10 ns with an irradiance of 0.6 J/cm2,
the authors managed to achieve a cancer cell death rate of more than 99% with a single
laser pulse. Surrounding healthy cells were largely unaffected and had a survival rate of
up to 84%. This preliminary work established nanobubble-induced lysis as a reliable and
highly specific treatment method that mostly depends on the size of the nanoparticle
cluster and the laser radiation properties rather than specific cell characteristics (D. O.
Lapotko et al. 2006a). Further research from the same group in the field of nanobubbles
for imaging, diagnosis and therapeutic applications at the cellular level verified and
expanded the initial results (D. Lapotko et al. 2006b; D. O. Lapotko et al. 2006a; D.
Lapotko 2009a, 2009b, 2009c).
1.2.2.4 More recently, Chen et al. revealed that the nanobubble dynamics are
dependent on the laser irradiance and directly responsible for the rupture of the cell
membrane. It was experimentally determined that the number of nanorods required for
the perforation of the plasma membrane directly depends on the energy effluence (C. L.
Chen et al. 2010a). An example of their work can be seen in Fig 1.4.
1.2.2.5 In numerous published works, Lukianova et al. demonstrated the use of
gold nanoparticles and nanobubbles as a method for effective intracellular drug delivery
(E. Y. Lukianova-Hleb et al. 2011; E. Y. Lukianova-Hleb et al. 2012b). More specifically,
the authors investigated the cooperative effects of plasmonic nanobubbles and drug
delivery in an in vivo and in vitro study on head and neck squamous cell carcinoma
(HNSCC). A combination of 20 and 60 nm gold nanospheres along with Doxorubicin
19
encapsulated into 85 nm liposomes was used to cause an explosive impact that would
immediately disrupt the liposome and endosome membranes while the pressure released
by the plasmonic nanobubble would trigger a highly localized drug ejection. Ultrasound
analysis was used to determine when the nanobubble-enhanced drug delivery was
triggered. A level of necrosis of more than 90% was achieved (for low penetration depths)
while the method’s high selectivity prevented damage to nearby healthy cells (E. Y.
Lukianova-Hleb et al. 2012a).
1.2.2.6 Compared to experimental work, relatively few computational models on the
behavior of plasmonic nanobubbles have been reported. For instance, Volkov et al.
Figure 1.4. In-situ photothermolysis of living EMT-6 tumor cells by thermal explosions
triggered by laser-illuminated gold nanorods. Laser Irradiance (a-d) 113 mJ/cm2, (e-h)
93 mJ/cm2 (C.L. Chen et al. 2010a)

20
introduced a one-dimensional (1D) hydrodynamic computational model for predicting
femtosecond-pulsed laser heating of spherical nanoparticles. Their work suggests that
biological damage can be restricted to within a short distance (relative to the particle
diameter) from the illuminated particle (Volkov et al. 2007). Yet, 1D analyses have
inherent limitations since they can be applied only in cases of spherical nanoparticles. In
a more recent study by Lombard et al. it was computationally demonstrated via a
hydrodynamic free energy model that the temporal evolution of the size of nanobubbles
is an asymmetrical process consisting of an adiabatic expansion followed by an
isothermal collapse (Lombard et al. 2014). Their model provides good insight on the
thermodynamic nature of nanobubble expansion and collapse phases but lacks
generalization. Thus, it could be possible that even computational models developed so
far, most likely lack the rigor required to describe all the details of the nanobubble
treatment process.
1.2.2.7 From this brief literature survey it can be concluded that plasmonic
nanobubble treatment represents a potentially safer and more effective alternative to
photothermal therapy. Despite the recent experimental progress in this field, relatively few
theoretical studies have emerged, let alone, focused on the details of plasmon-assisted
bubble nucleation and the subsequent bubble and fluid dynamics as described here. In
the majority of the aforementioned studies researchers used spherical nanoparticles
particularly functionalized to achieve aggregation in cells of interest. The ensuing
illumination was then performed, in certain cases, at off-plasmon resonance or non
“therapeutic window” wavelengths leading to the potential generation of non-specific
nanobubbles and limited penetration in cancerous tissue. This process cannot be directly

21
regulated, due to the random location of nanoparticles in colloids or in vivo aggregates
and might have unwanted side effects such as destruction of healthy cells, without lengthy
calibration. For successful treatment, most experimentalists still rely on simplified
nanoparticle morphologies, theoretical approximations and trial-error. Therefore, there is
a significant knowledge gap concerning the specific details of photothermal energy
conversion such as the required wavelength to achieve plasmon resonance and the
required energy and pulse duration for various geometries. Since, to the best of our
knowledge, very few theoretical studies addressing the aforementioned have been
reported, the need arises for a new approach of studying pulsed-laser plasmon-assisted
nanoscale bubble nucleation using combined computational electromagnetic and CFD-
based fluidic analysis for a number of nanostructure morphologies; thus combining the
advantages of employing complex morphologies (e.g. high average absorption in the NIR)
with those of nanobubble treatment (e.g. specificity) resulting in a more effective and
controlled method of cancer therapy. This approach, proposed herein, enables
fundamental understanding and rational design of plasmon-based photothermal
processes and should prove useful for the development of novel photothermal
applications.

22
Chapter 2: Theory and Methods
2.0 The plasmon-based photothermal process studied here is highly complex. It
involves coupled phenomena that span multiple length and time scales, which depend on
the duration and power level of the laser pulse. A rigorous analysis of this process would
require concurrent multiscale modelling that encompasses quantum to continuum level
theory. To the best of our knowledge, no such models have been reported. Previous
theoretical studies in this field are based to some extent on simplifying assumptions. In
this work, we make the assumption that the photothermal process can be modelled using
continuum theory over the range of variables that we consider. The continuum approach
can be justified based on several factors. To begin with, we consider laser pulse durations
of multiple nanoseconds, which is longer than the characteristic time constants of the
transient non-equilibrium photothermal effects such as electron-electron scattering (10-
50 fs), electron-phonon/lattice interactions (10 - 50 ps), and phonon-phonon interactions
at the surface of the particle ( 100 - 400 ps) (Roper et al. 2007). Second, we study the
response of metallic nanoparticles with dimensions ( 60 nm) that are greater than the
phonon mean free path ( 20 nm in gold) (Pattamatta and Madnia 2010). Therefore, the
phonon Knudsen number is 0.3, which implies that continuum thermal analysis can
provide a reasonable estimate of thermal behavior. Similarly, as it will be shown in the
following chapters below, nucleated bubbles have dimensions ( 60 nm) that are greater
than the mean free path ( 10 - 15 nm) of the vapor molecules within them. Thus, the
Knudsen number for the gas dynamics is 0.25. The fluidic domain is on the order of
200-300 nm, which is suitable for continuum fluid dynamics. Finally, in order to account

23
for the complexity and multidimensionality of the problem, we make combined use of
computational fluid dynamics (CFD) to predict coupled thermal fluid phase change effects
and computational electromagnetics to predict photonic effects. In this chapter we will
describe the key theoretical principles and methods used to achieve this objective. The
equations used can be found in subsections 2.1 and 2.2, respectively.

24
2.1 Photonic Analysis
2.1.1 Spherical Nanoparticles
2.1.1.1 Although the basic underlying principles regarding spherical nanoparticles
are briefly described in Chapter 1, it would be instructive to explain some of the theory
regarding their absorption of light when submerged in fluid. For this case, the irradiance
of the incident laser Iinc is given by:
20
2
f
inc inc
c nI E
(2.1)
where c is the speed of light in vacuum, ε0 is the permittivity of free space, nf is the
refractive index of the fluid and Einc is the incident electric field. Throughout this analysis,
we have Einc = 2106 V/m and therefore the nominal irradiance for all of our photonic
simulations is Iinc = 7 mW/m2. We can then compute the absorbed power (Qabs) using an
analytical approach, which is based on Rayleigh scattering theory (van de Hulst 1981):
incIm( )IabsQ k (2.2)
where k = 2π nf / λ and α is the complex-valued polarizability of the sphere:
0 0
23
0
4
21
3
kik
a
(2.3)

25
where α0 = Rp3(r-1)/(r+2) and Rp and εr are the radius and relative permittivity of the
sphere, respectively (Furlani and Baev 2009b). This analytical approach can be used to
estimate the heat generated by a spherical nanoparticle submerged in fluid but is not
applicable for more complex nanoparticle geometries and yields a somewhat lower and
narrower absorption profile because it is based on a dipole approximation, whereas the
numerical model described in the following section is geometry independent and gives
more accurate results since it takes into account absorption and scattering due to higher
order multiple terms.
2.1.2 Numerical Field Analysis
2.1.2.1 For more complex geometries, the photonic response of metallic
nanoparticles in fluid is predicted using numerical three-dimensional (3D) full-wave time-
harmonic field theory which accounts for all the principles discussed above. In this case,
Maxwell’s equations are solved assuming an E-field time dependence of the form:
i tE E x e (2.4)
where ω is the angular frequency of incident light. For cases of nanoparticles immersed
in fluid, we use transverse electromagnetic (TEM) analysis where the equation for the
electric field can be written as:
1 2
0
0
0r rk j
E E (2.5)
26
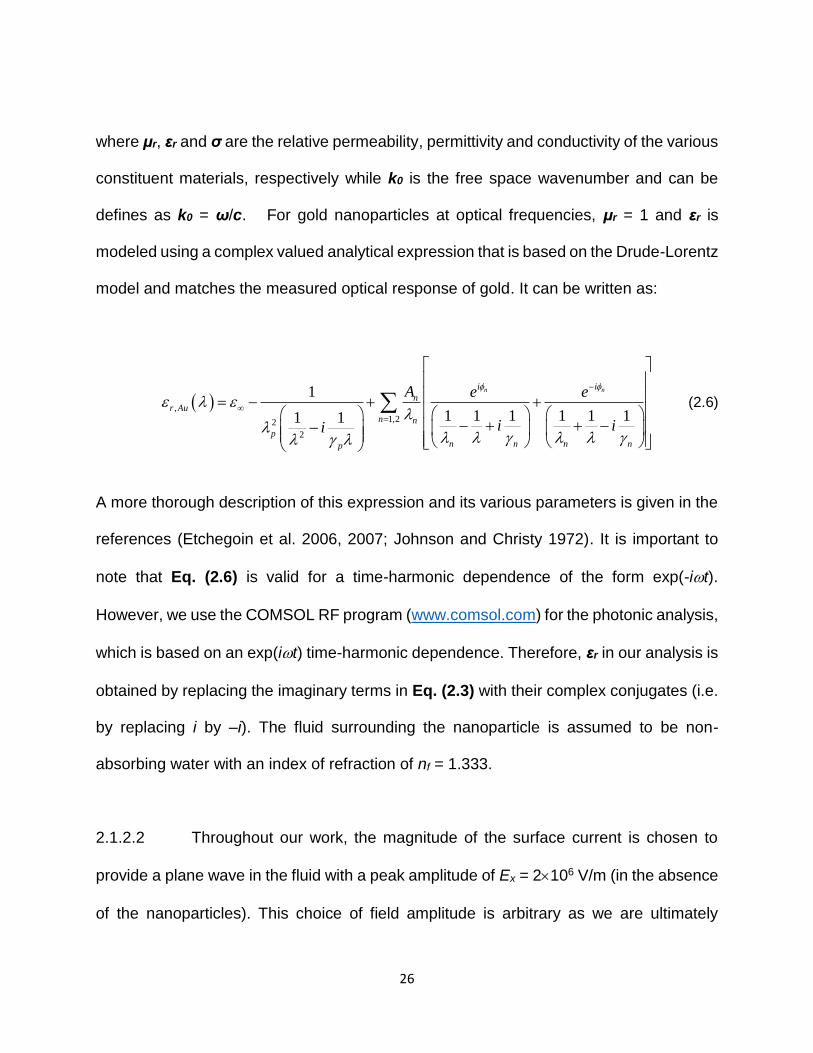
where μr, εr and σ are the relative permeability, permittivity and conductivity of the various
constituent materials, respectively while k0 is the free space wavenumber and can be
defines as k0 = ω/c. For gold nanoparticles at optical frequencies, μr = 1 and εr is
modeled using a complex valued analytical expression that is based on the Drude-Lorentz
model and matches the measured optical response of gold. It can be written as:
,
1,22
2
1
1 1 1 1 1 11 1
n ni i
nr Au
n n
pn n n np
A e e
i ii
(2.6)
A more thorough description of this expression and its various parameters is given in the
references (Etchegoin et al. 2006, 2007; Johnson and Christy 1972). It is important to
note that Eq. (2.6) is valid for a time-harmonic dependence of the form exp(-it).
However, we use the COMSOL RF program (www.comsol.com) for the photonic analysis,
which is based on an exp(it) time-harmonic dependence. Therefore, εr in our analysis is
obtained by replacing the imaginary terms in Eq. (2.3) with their complex conjugates (i.e.
by replacing i by –i). The fluid surrounding the nanoparticle is assumed to be non-
absorbing water with an index of refraction of nf = 1.333.
2.1.2.2 Throughout our work, the magnitude of the surface current is chosen to
provide a plane wave in the fluid with a peak amplitude of Ex = 2106 V/m (in the absence
of the nanoparticles). This choice of field amplitude is arbitrary as we are ultimately
27
interested in the power absorbed by the particle Qabs (W) per unit irradiance Iinc (W/m2).
The absorbed power, which is wavelength dependent, is converted to heat and thus this
analysis predicts photothermal energy conversion within the particle. The power level in
the nanoparticle and corresponding pulse duration that are needed to nucleate and
sustain a bubble without damaging the particle are computed using a CFD analysis as
described in the next section. Once a viable power level is known, the laser irradiance
required to generate this power within the nanoparticle is computed from the photonic
analysis.

28
2.2 Fluidic Analysis
2.2.1 Temperature and Flow Fields
2.2.1.1 The fluidic analysis is performed using computational fluid dynamics (CFD)
and is used to predict thermal, pressure and flow effects including the temperature rise in
the particle, heat transfer from the particle to the fluid, phase change within the fluid
leading to homogeneous bubble nucleation, the dynamic behavior of the bubble as it
expands and collapses, and the temperature, pressure and flow throughout the fluid
during the entire process. The fluidic analysis is used to determine the threshold power
and pulse duration needed to generate and sustain a bubble with a desired dynamic
behavior. Once this is understood, the laser intensity needed to produce the threshold
power within the particle is back-calculated from the photonic analysis. The thermofluidic
analysis is based on the following assumptions: For simplicity and better result
reproducibility, we consider all fluid and solid properties as constant throughout the
photothermal cycle. As a result, we also consider the nanoparticle size variations
(maximum of ~1.5% increase) caused by density changes due to heating as negligible
(V. Pustovalov et al. 2008). The shape of the nanoparticle is assumed to remain unaltered
for all simulations and any mechanical damage to the nanoparticle from the pressure
generated by the nanobubble is considered trivial because of the inherent structural
rigidity of the metal structure and the symmetry of the nucleated nanobubble. Finally, we
assume that no heat transfer occurs from the nanoparticle to the surrounding gas post-
29
nucleation since energy losses to the rarefied gas are significantly lower compared to the
effects of laser heating.
2.2.1.2 The volume of fluid (VOF) method as implemented in the Flow3D software
(www.flow3d.com) is used for this analysis (Hirt and Nichols 1981). The fluid is assumed
to be incompressible and Newtonian with surface tension σ, viscosity μ, density ρ,
specific heat at constant pressure cp and thermal conductivity k. These are assumed to
be constant in our initial analysis. The general equations governing momentum and heat
transfer are as follows:
Navier-Stokes:
2p
t
(2.7)
Continuity: 0v (2.8)
Heat transfer:
2 (fluid)p
Tc T k T
t
(2.9)
2( ) (nanoparticle)np
np np abs np np
Tc Q t k T
t
(2.10)
where v and p are the velocity and pressure in the fluid and ρnp, cnp and knp are the
density, specific heat at constant pressure and thermal conductivity of the nanoparticle,

30
respectively. Qabs is the power generated uniformly within by the nanoparticle due to
absorption of incident laser light while T and Tnp are the corresponding temperatures in
the fluid and the nanoparticle, respectively. For our initial approach, we study the behavior
of gold nanoparticles using the following material properties: ρgold = 19,300 kg/m3, cgold =
129 J/kgK and kgold = 317 W/mK. Similarly, in all our simulations, the gold nanoparticles
are immersed in an aqueous solution, which has the properties of water at 300 K. The
surface tension contact angle for the nanoparticle is assumed to be 30.
2.2.1.3 In addition to the physical equations, initial and boundary conditions are
imposed to obtain a consistent theory. Heat transfer at the particle-fluid interface is
determined using an effective transfer coefficient that takes into account local variations
in thermal conduction and convection at this surface. This coefficient can vary along the
surface, especially when its shape changes, as in the case of a nanorod. The variation in
this coefficient can impact the local formation and growth of a bubble.
2.2.2 Phase Change and Bubble Dynamics
2.2.2.1 Phase change that initiates bubble nucleation occurs when the fluid reaches
its superheat temperature at the surface of the particle, which is taken to be T = 580K for
H2O. Before nucleation, the temperature in the particle and surrounding fluid is calculated
based on Eqs. (2.9) and (2.10). Heat transfer at the particle-fluid interface is predicted
using a local effective transfer coefficient that is dynamically determined. Once a bubble
is nucleated, its interface is tracked using the VOF method. The pressure in the bubble is

31
initially set to the saturation pressure at the superheat temperature (approximately 100
atm), which is computed using the Clausius-Clayperon equation:
1
1
1 1( ) exp
vap
sat
Hp T p
R T T
(2.11)
where p1 and T1 are the pressure and temperature at a point on the saturation curve (e.g.
p1 = 100 kPa, T1 = 273 K), ΔHvap (40.65x10³ J/mol) is the molar enthalpy of vaporization
and R (8.314 J/molK) is the universal gas constant. This pressure exerts an outward
force at the liquid-vapor interface that causes the vapor region to expand into a bubble.
As the bubble evolves, the pressure pvap, temperature Tvap and density ρvap of the vapor
within it are computed using the equation-of-state of an ideal gas:
,1vap vap vap v vapp C T (2.12)
where cvap is the specific heat of the vapor at constant volume and γ = cvap,p/cvap,v is the
ratio of specific heats. The pressure, temperature and density are assumed to be spatially
uniform (i.e. homogeneous) within the bubble. The mass flux ṁ at the fluid-bubble
interface is taken to be proportional to the deviation of the fluid from its saturation
conditions:
2
satvapl
evap cond
l vap
ppMWm c c
R T T
(2.13)

32
where MW is the molecular weight of the vapor, R the vapor gas constant, T is
temperature (K), and the subscripts l and vap refer to liquid and vapor phases,
respectively. The term pl is the saturation pressure corresponding to the liquid
temperature Tl, and cevap and ccond are accommodation coefficients for evaporation and
condensation.
2.2.2.2 After the bubble has nucleated, the nanoparticle is surrounded by vapor and
there is negligible heat transfer at the particle-vapor interface. Thus, if the laser pulse
continues beyond nucleation, the temperature of the nanoparticle will rise rapidly as it
absorbs incident light while being essentially insulated. Under this condition, the
nanoparticle can reach its melting or even vaporization temperature within a nanosecond
or less. For bulk gold, these values are Tm = 1336 K and Tvap = 2933 K, respectively.
However, experiments have shown that Au nanoparticles have a lower melting point that
can differ by as much as 200 K from the bulk value. Specifically, the experimentally
observed surface melting temperature of a 38 nm gold nanoparticle, which is smaller than
the nanoparticles we consider, was found to be ~ 1067 K (Inasawa et al. 2005). Additional
experiments performed on gold nanoparticles show significant surface melting effects can
occur even at lower temperatures, given a sufficiently long period of time (timescales
ranging from hours to days). As an example, nanorods of various lengths can be
converted into spheres at 523 K in 60 min (Petrova et al. 2006). In order to avoid high
temperature damage to the particle, the laser power level and pulse duration must be
carefully chosen, with special attention given to laser heating immediately after bubble
nucleation while the nanoparticle is essentially insulated. We use modelling to carefully

33
select the laser pulse duration so as to constrain the heating to keep the nanoparticle
below a maximum temperature of 1100 K. The modelling approach suggested here
enables rapid parametric screening to achieve this goal for a variety of nanoparticle
geometries such as nanospheres, nanorods, nanotori, nanorings and
nanocages/nanoframes.

34
Chapter 3: Combined Computational Modeling
In this chapter, we will describe the development of computational electromagnetic and
CFD-based models for various nanoparticle geometries. The nanoparticle geometries
that represent the focus of our research are nanospheres, nanorods, nanotori, nanorings
and nanocages/nanoframes. As described in the previous chapter, two types of
computational models will be developed: a) Computational Electromagnetics models for
the photonic analysis will be used to calculate the plasmon resonance wavelength and
the photothermal energy conversion within the nanoparticles, i.e. the time-averaged
power absorbed by a particle as a function of the wavelength, intensity and polarization
of the incident light and b) CFD models that predict thermal, pressure and flow effects
including the temperature rise in the particle, heat transfer from the particle to the fluid,
phase change within the fluid leading to homogeneous bubble nucleation, the dynamic
behavior of the bubble as it expands and collapses, and the temperature, pressure and
flow throughout the fluid during the entire process. In order to achieve that goal, we will
employ state-of-the-art customizable software packages including but not limited to:
FLOW 3D versions 10.1 and 11.1 from Flow Science Corp. (www.flow3d.com) and
COMSOL Multiphysics Software (www.comsol.com) versions 4.4 and 5.2 with full CFD-
FSI, nanofluidics and RF analysis capabilities, respectively. Simulation results will also
be compared with analytical methods where applicable. The modeling effort will follow the
assumptions stated in Chapter 2 and will be used to determine heretofore unknown
properties such as the plasmon resonance wavelength, the amount of power required to
generate and sustain nanobubbles without melting the nanoparticles and the size and
duration of occurring nanobubbles for each nanoparticle geometry.

35
3.1 Nanospheres
3.1.1 Synthesis
3.1.1.1 The modeling effort begins with an analysis of the most common
nanoparticle geometry: the nanosphere. The synthesis of gold spherical nanoparticles is
one of the oldest known fabrication techniques and is traditionally carried out through a
citrate reduction bottom-up process. This technique, which still remains popular today,
was first reported by Turkevich in 1951 and involves the mixing of gold salt and citrate
stirred in a water solution. It can lead to the fabrication of nanoparticles with a diameter
ranging between 16 and 147 nm. The size distribution of the yielded nanospheres is
controlled by the temperature, the ratio of gold to citrate and the order of addition of the
reagents used (Daniel and Astruc 2004; Frens 1973; Turkevich et al. 1951).
3.1.1.2 However, the fabrication technique that has potentially had the most
considerable impact in the field is the Brust-Schiffrin method published in 1994. This
represents a more accurate fabrication procedure which allows the facile synthesis of air-
stable and thermally-stable gold nanoparticles of reduced dispersity and controlled size.
Nanospheres generated through this process have diameters from 1.5 to 5.2 nm, they
can be repeatedly isolated and re-dissolved is a variety of organic solvents without risk of
decomposition and they can be easily handled and appropriately functionalized for any
application, behaving similarly to other stable organic compounds. The method itself is
based on Faraday’s two phase system (Faraday 1857) and makes use of thiol ligands

36
that bind to gold through thiolate monolayer chemistry (Mathias Brust et al. 1994; M Brust
et al. 1995).
3.1.1.3 Another notable
synthesis method for larger
spherical nanoparticles, as those
shown in Fig 3.1, is the seeding
technique. This method starts with a
colloid of small nanospheres at
which a reducing agent is added.
The mixture is then introduced into
a growth solution with more metal
ions and surfactant to induce
anisotropic growth. Usually sodium
borohydride is used as an initial
reducing agent while a weaker agent such as ascorbic acid is used in the growth solution
to reduce the metal salt to an intermediate state so that only catalyzed reduction on the
nanoparticle surface is allowed. A variation of this technique can also be applied for the
synthesis of nanorods (Murphy et al. 2005). More information on the history and the
details of the various fabrication processes of gold nanospheres can be found in an
excellent review from M.C. Daniel and D. Astruc (Daniel and Astruc 2004).
Figure 3.1. Scanning electron microscopy
(SEM) image illustrating gold nanospheres with
an average diameter of 60 nm (source:
www.nanocomposix.com).

37
3.1.1.4 Now that the basics of fabrication are understood let’s turn our attention to
the computational modeling of nanospheres for nanobubble treatment. Similarly to all the
cases studied here, nanospheres will be initially modeled in isolation, as single particle
system. As part of this approach all material properties are considered constant. A
photonic analysis is performed to quantify photothermal energy conversion within the
sphere. The power absorbed by the sphere Qabs(λ) is computed as a function wavelength
at a nominal irradiance with TEM field polarization. The wavelength that produces the
highest absorption is identified as the plasmon resonant wavelength. Once the photonic
analysis is complete, a CFD analysis is performed to determine a power level for heat
generation within the nanosphere and a corresponding pulse duration that are sufficient
to create bubble nucleation without irreversible damage to the particle, i.e. keeping its
peak temperature below its melting or even vaporization temperature. Once the viable
power level and pulse duration are known, the laser irradiance needed to generate this
power is back-calculated from the results of the photonic analysis.
3.1.2 Photonic Simulations
3.1.2.1 For analysis purposes, we have chosen to model a nanosphere with a
diameter of 60 nm using the finite element (FE) method as implemented by COMSOL
Multiphysics (www.comsol.com) and analytical techniques. The numerical solution
method which remains the same for all geometries can be briefly summarized in the
following eight steps: a) Discretization of the solution region (computational domain) into
a finite number of sub-regions (elements) and labeling of the nodes that define each

38
element; b) User choice of an
approximating function for each
element’s field solution; c) Numerical
solution at each element as a function
of the nodal values and the spatial
variables from the element; d)
Definition and evaluation of energy
functional for the field equation over
each element to obtain an expression
for the energy in each element in
terms of its nodal values; e)
Compilation of a global energy
expression as a sum of the energy of
the individual elements; f)
Simplification of the global energy
expression with respect to the
unknown nodal values, which results
to algebraic equations for the nodal
values; g) Solution of the system of
equations to determine the nodal
values and finally; h) Assembly of the
desired solution from a compilation of nodal values. In the case of a nanosphere with a
diameter of 60 nm, the computational domain spans 1000 nm in the direction of
Figure 3.2. Photonic analysis of a gold
nanosphere (a) Computational domain and
field analysis, (b) Absorbed power vs.
wavelength.

39
propagation (z-axis), and 250 nm in both the x and y directions. The nanosphere is
centered at the origin (Fig. 3.2a). Perfectly matched layers (PMLs) are applied to the top
and bottom of the computational domain with a height of 100 nm. This leaves 800 nm of
physical domain along the z-axis. Perfect electric conductor (PEC) boundary conditions
are applied at the boundaries perpendicular to the E field at x = 125 nm, and perfect
magnetic conductor (PMC) boundary conditions are applied at the boundaries
perpendicular to the magnetic (H) field at y = 125 nm. These conditions mimic a 2D
array of identical nanospheres with a center-to-center lattice spacing of 250 nm in both
the x and y directions. These, boundary conditions simplify the analysis and the lattice
distances are chosen to be large enough so that the resulting predictions will reflect the
response of a single particle i.e. negligible coupling with neighboring particles. The sphere
is illuminated with a downward directed uniform TEM plane wave with E parallel to the x-
axis. The incident field is generated by a time-harmonic surface current (not shown)
positioned in the x-y plane 400 nm above the center of the nanosphere, i.e. immediately
below the upper PML as described in the references (Furlani and Baev 2009a, 2009b).
We use a cubic vector finite element formulation with a total of 29,615 tetrahedral
elements in the computational domain. The time-averaged power absorbed by the
nanosphere was computed for a range of wavelengths that spanned 450 nm to 650 nm
in 2 nm increments.
3.1.2.2 The plasmon resonance wavelength was found to be 532 nm based on the
numerical analysis and the corresponding power absorbed by the nanosphere is 76 μW
(with Iinc = 7 mW/μm2) as shown in Fig. 3.2b. The analytical approach, indicated by the

40
blue line in Fig. 3.2b as Rayleigh approximation (described in subsection 2.1.1), is also
plotted and it yields a somewhat lower and narrower absorption profile because it is based
on a dipole approximation, whereas the numerical model takes into account absorption
and scattering due to higher order multiple terms. It is useful to note that although an
isolated nanosphere of 60 nm has a plasmon resonance wavelength located in the visible
spectrum, plasmonic coupling effects in nanosphere aggregates may produce an
optimum absorption in the NIR which is more suitable for bioapplications (Baffou and
Quidant 2013). Overall, we use the results of the photonic analysis to determine the laser
irradiance needed to effect bubble nucleation, which is based on the fluidic analysis
described in the following subsection.
3.1.3 Thermofluidic Simulations
3.1.3.1 A CFD analysis was performed to determine viable power levels and pulse
durations that produce bubble nucleation with sustained bubble dynamics, without
damaging the nanosphere. We chose such values that limit the maximum particle
temperature to less than 1100 K. An axisymmetric CFD model was developed to model
one quadrant of a gold sphere. The computational domain spanned 7 radii of the sphere
(210 nm), with 1 nm cell widths in both the radial (r) and axial (z) direction. Symmetry
boundary conditions were imposed along both the r- and z-axes. The former accounted
for the lower half of the sphere, while the latter accounted for its axial symmetry. The
pressure and temperature throughout the computational domain were initialized to 1 atm
(1 x 10⁵ N/m2) and T0 = 300 K, respectively. A stagnation pressure condition (1 x 10⁵

41
N/m2) was imposed at the outer r and z boundaries along with a Dirichlet condition set to
the ambient temperature, Tamb = 300 K. These initial and boundary conditions were used
for all fluidic analyses.
3.1.3.2 A preliminary CFD thermal analysis (without phase change) was performed
to determine power levels and pulse durations that increase the temperature of the fluid
at the interface with the sphere from its initial value (T0 = 300 K) to the supercritical
temperature of 580 K. We computed the temperature of the nanosphere during heating
for a range of power levels and pulse durations. The latter was chosen to be from 2 to 5
ns so as to exceed the non-equilibrium time constants of the photothermal process as
described in paragraph 2.0. The CFD analysis was guided by analytical formulas for heat
transfer as appropriate. This preliminary analysis was performed because it is far less
computationally intensive than the full phase change and bubble nucleation analysis,
while at the same time providing an intuitive understanding of thermal diffusion from the
sphere to the fluid up to nucleation.
3.1.3.3 Once the preliminary thermal calculations were complete, CFD simulations
of bubble nucleation were performed using power levels selected from the preliminary
analysis, but with slightly longer pulse durations to ensure nucleation and sustained
bubble dynamics. For the nanosphere, we concluded that an adequate power for
nucleation without melting was 152 μW, with a pulse duration of 5 ns. Given these values,
and the results from the photonic analysis (Fig. 3.2a), we determined that a laser
operating at λ = 532 nm with an irradiance of Iinc = 14 mW/m2 is sufficient to generate a
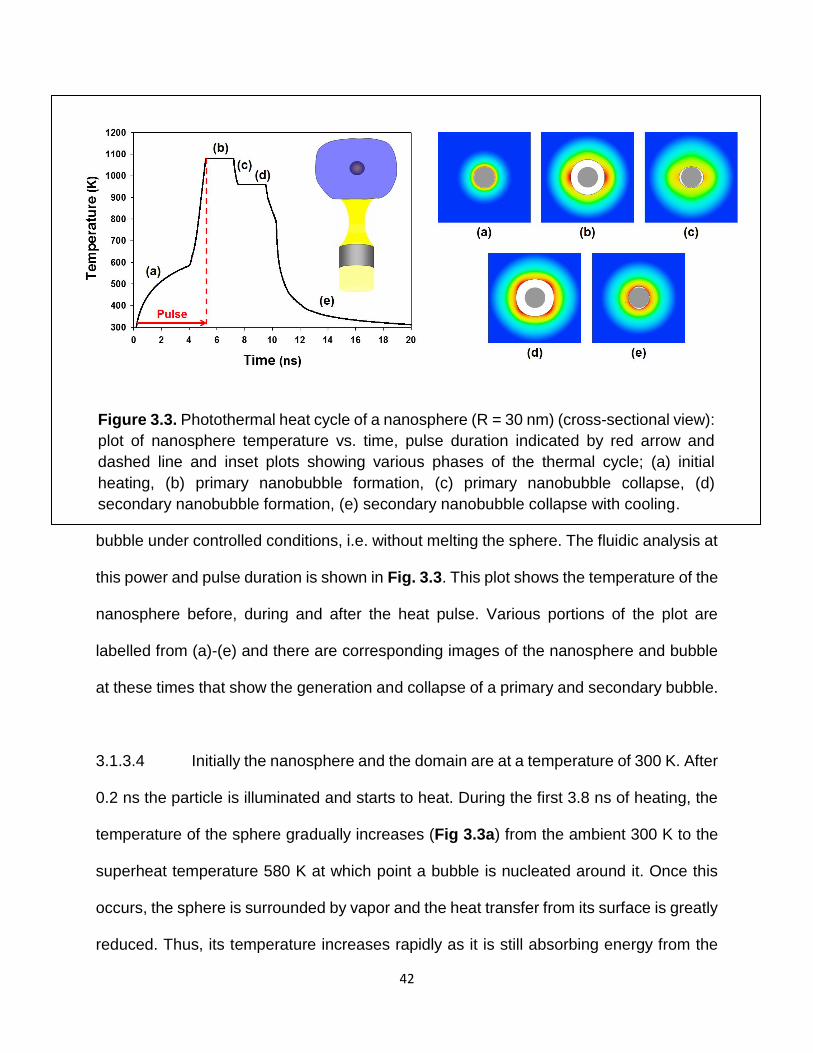
42
bubble under controlled conditions, i.e. without melting the sphere. The fluidic analysis at
this power and pulse duration is shown in Fig. 3.3. This plot shows the temperature of the
nanosphere before, during and after the heat pulse. Various portions of the plot are
labelled from (a)-(e) and there are corresponding images of the nanosphere and bubble
at these times that show the generation and collapse of a primary and secondary bubble.
3.1.3.4 Initially the nanosphere and the domain are at a temperature of 300 K. After
0.2 ns the particle is illuminated and starts to heat. During the first 3.8 ns of heating, the
temperature of the sphere gradually increases (Fig 3.3a) from the ambient 300 K to the
superheat temperature 580 K at which point a bubble is nucleated around it. Once this
occurs, the sphere is surrounded by vapor and the heat transfer from its surface is greatly
reduced. Thus, its temperature increases rapidly as it is still absorbing energy from the
Figure 3.3. Photothermal heat cycle of a nanosphere (R = 30 nm) (cross-sectional view):
plot of nanosphere temperature vs. time, pulse duration indicated by red arrow and
dashed line and inset plots showing various phases of the thermal cycle; (a) initial
heating, (b) primary nanobubble formation, (c) primary nanobubble collapse, (d)
secondary nanobubble formation, (e) secondary nanobubble collapse with cooling.

43
incident light. The particle reaches a peak temperature of approximately 1080 K, which
occurs at the end of the heat pulse (5 ns), while it is surrounded by vapor (Fig 3.3b). Once
the bubble has nucleated, which occurs just after 4 ns, it expands due to its high pressure
relative to the surrounding fluid, which is initially at 1 atm. The bubble reaches its
maximum volume 5.4 ns after the heating starts. At its largest extent, the bubble is
characterized by a slightly elliptical shape and its maximum size is approximately 50 nm
and 60 nm in the r and z directions, respectively. Subsequently, 7 ns after the onset of
heating, the bubble collapses, bringing fluid back in contact with the particle, which cools
it from its peak temperature of 1080 K to approximately 960 K (Fig. 3.3c). As the particle
cools, the fluid temperature increases until it reaches the superheat temperature once
again, at which point a secondary bubble is generated (Fig. 3.3d). The secondary bubble
reaches its maximum size 8.2 ns after the initial onset of heating. At this point, the bubble
is characterized by a spherical shape and its maximum size is approximately 50 nm in
radius. Eventually, the second bubble collapses bringing fluid in contact with the sphere
once again, and the sphere cools it towards the ambient temperature (Fig. 3.3e). It is
important to note that the number of bubble cycles generated and the dynamics during
each cycle can in principle be controlled by tuning the power and duration of the heat
pulse (Furlani et al. 2012).

44
3.2 Nanorods
3.2.1 Synthesis
3.2.1.1 Let’s now examine three bottom up methods of fabricating gold nanorods.
The first method is the template method and was first introduced by Martin and co. in
1992. This technique is based on the electrochemical deposition of gold in the pores of
nanoporous polycarbonate or alumina template membranes. The group showed that the
gold/alumina composites can be optically transparent in the visible and also that by
changing the aspect ratio of the prepared nanocylinders they were able to vary the color
of the membrane (Foss Jr et al. 1992; Martin 1994, 1996). Following the initial work on
nanocomposites, the method was later applied to the synthesis and dispersion of gold
nanorods in water or even other organic solvents by the dissolution of the appropriate
membrane followed by polymer stabilization (Cepak and Martin 1998; Van der Zande et
al. 1997). In brief, this fabrication method can be described as follows: a) A small amount
of Ag or Cu is sprayed onto the alumina template membrane to provide a conductive film
for electrodeposition; b) Gold is then electrodeposited within the nanopores of alumina c)
The alumina membrane and the copper or silver film are selectively dissolved in the
presence of a polymeric stabilizer such as poly(vinylpyrrolidone) (PVP) d) The nanorods
are then dispersed either in water or in organic solvents by means of sonication or
agitation. The diameter of the gold nanoparticles synthesized with this method coincides
with the pore diameter of the alumina membrane while their length can be controlled
through the amount of gold deposited within the pores of the membrane (Pérez-Juste et
al. 2005).

45
3.2.1.2 Another synthesis technique with considerable less complexity was first
demonstrated by the Wang group. Their method, which is based on previous research on
the electrochemical synthesis of transition metal clusters within reverse micelles in
organic solvent systems, enables the production of gold nanorods with high yield.
According to this technique, synthesis of gold nanorods can be made possible within a
simple two-electrode-type electrochemical cell. More specifically, a gold metal plate is
used as an Au source anode whilst the cathode is a platinum plate. Both electrodes are
immersed in an electrolytic solution, containing a cationic surfactant,
hexadecyltrimethylammonium bromide (C16TAB), and a small amount of a much more
hydrophobic cationic
surfactant,
tetradodecylammonium
bromide (TC12AB) acting as
a rod-inducing co-surfactant.
The electrolytic cell
containing the mixed solution
is then placed inside an
ultrasonic bath. Throughout
the process, a controlled-
current electrolysis is used
with a typical current of 3 mA
and a typical electrolysis time
Figure 3.4. Scanning electron microscopy (SEM)
image illustrating gold nanorods with an average length
and diameter of 60 and 17 nm, respectively (source:
www.nanocomposix.com).

46
of 30 min. Thus, the bulk gold metal anode is consumed, forming AuBr4−. These anions
combine with the cationic surfactants and migrate to the cathode where reduction occurs.
Sonication is required to shear the synthesized nanorods away from the cathode surface.
An important factor controlling the aspect ratio of fabricated nanoparticles is the gradual
introduction of a silver plate in the electrolytic solution behind the Pt electrode. The redox
reaction between gold ions generated from the anode and silver metal leads to the
formation of silver ions. It was determined that the concentration of silver ions and their
release rate determined the length of the nanorods. The complete mechanism, as well as
the role of the silver ions, still remains largely unexplained (Chang et al. 1999; Reetz and
Helbig 1994; Yu et al. 1997).
3.2.1.3 More recently, the seeding method, a technique for fabricating nanospheres
(refer to 3.1.1.3), was also applied to the synthesis of gold nanorods. Although, the basic
steps involved in this fabrication method, described in the previous subsection, remain
the same, gold nanorods can be synthesized by carefully controlling the growth
conditions, and in particular by using ascorbic acid as a weak reducing agent, that cannot
reduce the gold salt in the presence of the micelles if the seed is not present. By
controlling the growth conditions in aqueous surfactant media it is possible to synthesize
gold nanorods with tunable aspect ratio. It was found that addition of AgNO3 influences
not only the yield and aspect ratio control of the gold nanorods but also the mechanism
for gold nanorod formation and correspondingly its crystal structure. Nevertheless,
synthesis of gold nanorods is possible even without its addition. A more thorough

47
description of the details of nanorod synthesis and applications can be found in a very
well written review by J. Pérez-Juste et al. (Pérez-Juste et al. 2005).
3.2.1.4 Having provided the basic principles of nanorod fabrication, we shift our
attention to the use of gold nanorods for bubble nucleation. It is important to note that
these nanoparticles have plasmonic properties that are different than their spherical
counterparts. Most notably, they have two distinct plasmon resonant frequencies, one
higher and one lower, corresponding to transverse and longitudinal polarization modes,
respectively. The higher frequency (shorter wavelength) occurs when the field is polarized
transverse to the rod (i.e. perpendicular to the major axis) and is similar to that of a
spherical particle. The lower frequency (longer wavelength) depends on the aspect ratio
of the nanorod and can be tuned through synthesis for specific applications. The ability
to tune the resonance in this fashion has spawned a growing interest in the use of gold
nanorods, especially for bioapplications that require plasmon resonance tuned to NIR
wavelengths to achieve deeper and more effective penetration of light into a target tissue.
Gold nanorods have additional interesting plasmonic features, notably, a narrower
plasmon bandwidth (Sonnichsen et al. 2002) and greater field enhancement than
spherical particles at comparable resonance frequencies and volumes.
3.2.2 Photonic Simulations
3.2.2.1 The gold nanorod was modelled as a cylinder with hemispherical caps. For
this analysis, we chose the length and diameter of the nanorod to be 60 nm and 17 nm,

48
respectively. The computational
domain for the photonic analysis
spans 110 nm in the direction of
propagation (z-axis), and 150 nm in
both the x and y directions as shown
in Fig. 3.5a. The nanorod is centered
at the origin with its length aligned
with the x-axis. As before, there are
PMLs at the top and bottom of the
computational domain, which are 25
nm in height. This leaves 60 nm of
physical domain along the z-axis.
PEC boundary conditions are applied
at boundaries perpendicular to the E
field at x = 75 nm and PMC
boundary conditions are applied at
boundaries perpendicular to the H
field at y = 75 nm. These conditions
mimic a 2D array of identical nanorods with a center-to-center lattice spacing of 150 nm
in both the x and y directions. The nanorod is illuminated with a downward directed
uniform TEM plane wave with E aligned along the length of the nanorod, i.e. parallel to
the x-axis. As in the previous analysis, the incident field is generated by a time-harmonic
surface current positioned in the x-y plane immediately below the upper PML. Cubic
Figure 3.5. Photonic analysis of a gold
nanorod (a) Computational domain and field
analysis, (b) Absorbed power vs. wavelength.

49
vector finite elements were used and there were a total of 41,932 tetrahedral elements in
the computational domain. The time-averaged power absorbed by the nanorod was
computed for wavelengths that spanned 600 nm to 900 nm in 2 nm increments. The
plasmon resonance wavelength was found to be 770 nm and the corresponding power
absorbed is 53.7 μW (with Iinc = 7 mW/μm2) as shown in Fig. 3.5b.
3.2.3 Thermofluidic Simulations
3.2.3.1 A CFD analysis was performed to determine a power level and pulse
duration that would produce bubble nucleation and sustained dynamics without melting
the nanorod. An axisymmetric CFD model was used for the analysis. The computational
domain spanned 150 nm in both the r and z directions. A uniform mesh of 0.5 nm cells in
both directions was used. Symmetry boundary conditions were imposed along both the r
and z axes. The former accounted for the lower half of the nanorod while the latter
accounted for its axial symmetry. The same initial and boundary conditions were used as
in the case of the nanosphere. However, it should be noted that unlike a sphere, a
nanorod is characterized by different heat transfer coefficients along the surface of its
cylindrical portion as compared to its spherical tips. Thus, bubble nucleation and growth
can evolve differently over these surfaces.
3.2.3.2 As in the case of the sphere, a preliminary CFD analysis (without phase
change) was performed to determine a range of power levels and pulse durations that
increase the temperature of the nanorod from ambient to the supercritical temperature.

50
Based on this analysis, we identified viable power levels and pulse durations limited to a
range of 1.5 to 3 ns. We then used this data in a parametric CFD analysis that accounted
for bubble nucleation, only with slightly extended pulse durations so as to ensure a
sustained bubble without damaging the particle. It was found that an adequate power for
nucleation without melting the nanorod was 76.8 μW, with a pulse duration of 1.9 ns.
Given these values and the results of the photonic analysis (Fig. 3.5b), we determined
that a laser operating at λ = 770 nm with an irradiance of Iinc = 10 mW/μm2 is sufficient to
generate and sustain a bubble without melting the nanorod. The photothermal process at
this power and pulse duration is shown in Fig. 3.6. This figure shows the temperature of
the nanorod during and after the heat pulse along with corresponding images that show
the generation and collapse of the nanobubble.
Figure 3.6. Photothermal heat cycle of a nanorod (L = 60 nm, R = 8.5 nm) (cross-
sectional view): plot of nanorod temperature vs. time, pulse duration indicated by red
arrow and dashed line and inset plots showing various phases of the thermal cycle; (a)
initial heating, (b) nanobubble formation, (c) nanobubble (maximum size), (d)
nanobubble collapse, (e) cooling.

51
3.2.3.3 Initially, the nanorod is at ambient temperature of 300 K. After 0.2 ns the
nanorod is illuminated and its temperature starts to increase. During the first 1.7 ns of
heating, the temperature of the nanorod gradually increases to the superheat temperature
(Fig. 3.6a), at which point a bubble is nucleated around its tips. Once this occurs the
particle is partly surrounded by vapor and heat transfer from its surface is greatly reduced.
Its temperature increases rapidly at this point as it is still absorbing energy from the
incident light. The nanorod reaches a maximum instantaneous temperature of 915 K,
which occurs at the end of the heat pulse (1.9 ns in duration) when it is still surrounded,
in part, by liquid (Fig. 3.6b). The remaining liquid completely evaporates by approximately
2.7 ns after the onset of heating, and in doing so, the nanorod cools from its peak
temperature to approximately 765 K.
3.2.3.4 As soon as the bubble has nucleated, it expands due to its high pressure
relative to the surrounding fluid. It reaches its maximum size 3 ns after the onset of heating
(Fig. 3.6c) at which point is has an elliptical shape and it has dimensions of approximately
45 nm and 65 nm in the r and z directions, respectively. Eventually, at 4.4 ns the
nanobubble collapses, bringing fluid back in contact with the tips of the nanorod (Fig.
3.6d) and starts cooling it. The nanorod is then further cooled to ambient temperature
when the rest of the fluid comes in contact with it, 5.2 ns after the onset of heating (Fig.
3.6e) (Furlani et al. 2012).

52
3.3 Nanorings and nanotori
3.3.1 Synthesis
3.3.1.1 The next nanostructures we consider are
nanorings and nanotori (Fig. 3.7). These two
geometries are very similar and have comparable
optical responses, hence they are studied as a group.
Various methods have been demonstrated for
producing such nanoparticles (Yan and Goedel 2005;
Zinchenko et al. 2005). More specifically, gold
nanorings can be produced with a bottom up approach
through a template method. Adding chloroauric acid to
a solution of silver nanodisks can cause colloidal
nanoring formation because the standard reduction
potential of the AuCl4-/Au redox pair is higher than that
of the Ag+/Ag redox pair, thus, silver nanoparticles can be oxidized to silver ions
immediately. The AgCl precipitate can, then, be removed by an aqueous solution of
ammonia. Different molar ratios between gold and silver can lead to different nanoring
morphologies (Jiang et al. 2004; Y. Sun and Xia 2003b; Z. Wang 2000).
3.3.1.2 Nanotori, have been recently fabricated on substrates using top-down
lithographic techniques and then released into a colloidal dispersion. However, to the best
of our knowledge, currently no bottom up fabrication methods exist. Nevertheless, we
Figure 3.7. Nanostructure
geometries: (a) nanoring, (b)
nanotorus.

53
choose to study this nanoparticle
geometry because it is commonly
confused with nanorings due to its
symmetrical round structure, as
seen in Fig. 3.8. It is believed that
rapid advances in nanoparticle
synthesis will most likely lead to
bottom-up methods for producing
these particles in the near future.
In addition, these structures can
be tuned to have a high absorption cross-section in the NIR For instance, for incident light
polarized in the plane of the torus, the optical spectrum is characterized by a long
wavelength resonance, and a short wavelength resonance that corresponds to excitation
of higher order modes. We are most interested in the long wavelength resonance as it
can be tuned by varying the major (R) and minor (r) radii of the torus, during synthesis
(Aizpurua et al. 2003; Dutta et al. 2008; Lee et al. 2010). Though nanorods also possess
this feature, their longer (e.g. NIR) resonant wavelength will only be effective when the
field is polarized along the major axis, which can be difficult to achieve in practice. Due to
their unique symmetrical shape, the absorption of such nanostructures remains relatively
high for a broad range of orientations since resonance can be achieved with the field
polarization at any angle as long as it is in the plane of the torus. Therefore, nanorings
and nanotori are better-suited for colloidal heating applications than nanorods especially
for bioapplications that require NIR illumination for maximum tissue penetration. The
Figure 3.8. SEM image (tilted by 80o) of gold
nanotori fabricated with colloidal lithography
(Aizpurua et al. 2003)

54
results of the random orientation colloidal modeling will be discussed in more detail in
chapter 4.
3.3.2 Photonic Simulations
3.3.2.1 For our initial
modeling effort we consider 3
different aspect ratios for
each geometry, i.e. r/R in the
case of the nanotorus and (R-
r)/R in the case of the
nanoring. However, in order
to more concisely summarize
our modeling effort, in the
following sections, we will
consider a specific nanotorus
with major and minor radii of
R= 30 nm and r = 10 nm,
respectively. A similar
analysis was performed for
each geometry and the
results are summarized in
Table 1.
Figure 3.9. Photonic analysis of a gold nanotorus (R=
30 nm and r = 10nm) with parallel alignment to the
incident polarization: (a) Computational domain and
plot of Ex through a cross section of the domain, (b)
Absorbed power vs. wavelength at parallel orientation.

55
3.3.2.2 The computational
domain for the torus spans 230
nm in the direction of propagation
(z-axis), and 150 nm in both the x
and y directions (Fig. 3.9a). The
torus is centered at the origin and
as above, there are PMLs at the
top and bottom of the
computational domain, which are
30 nm in height. This leaves 170
nm of physical domain along the
z-axis. Once again, PEC boundary conditions are applied at boundaries perpendicular to
the E field at x = 75 nm, and PMC boundary conditions are applied at boundaries
perpendicular to the H field at y = 75 nm. These conditions mimic a 2D array of identical
nanotori with a center-to-center lattice spacing of 150 nm in both the x and y directions.
The torus is illuminated with a downward directed uniform TEM plane wave with E parallel
to the x-axis (Fig. 3.9a). The incident field is generated by a time-harmonic surface
current positioned in the x-y plane 85 nm above the center of the torus, i.e. directly below
the upper PML. We performed a parametric analysis of the power absorbed by the torus
as a function of wavelength for λ= 750-950 nm in 2 nm increments. As in the previous
cases, cubic vector finite elements were used, in this case there were 28,668 tetrahedral
elements in the computational domain. Plasmon resonance was found to occur at 828
Figure 3.10. Absorption spectra for a nanoring (R
= 40 nm, r = 20 nm, h = 20 nm) and a nanotorus
(R = 30 nm, r = 10 nm), both aligned parallel to the
incident field.

56
nm and the corresponding power absorbed is 62.8 μW (with Iinc = 7 mW/m2) as shown
in Fig. 3.9b.
3.3.2.3 Nanorings are closely related to nanotori in terms of their plasmonic
behavior. An example of this can be seen in Fig. 3.10, which shows the absorption
spectra for the two geometries of comparable sizes when they are aligned parallel to the
incident field. It is instructive to note that the resonant wavelength of the nanotorus is
redshifted with respect to the nanoring. This is due primarily to the fact that the torus has
a smaller aspect ratio (r/R = 1/3) than the ring (R-r)/R = 1/2.
3.3.3 Thermofluidic Simulations
3.3.3.1 Similarly, for our fluidic analysis we considered 3 cases for each geometry.
However, we present here the thermofluidic nanobubble heat cycle for the case of
nanotorus with major and minor radii of R= 30 nm and r = 10 nm, respectively. The
analysis steps described here apply to all cases of each geometry and will be summarized
in Table 1. For the aforementioned case of nanotorus, we performed a CFD analysis to
determine the power and pulse duration required to achieve bubble nucleation without
melting the nanoparticle. An axisymmetric model was used with a computational domain
that spanned 200 nm in both the r and z directions. A uniform mesh of 1 nm cells in both
dimensions was used. Symmetry boundary conditions were imposed along both the r-
and z-axes. The former accounted for the lower half of the torus while the latter accounted

57
for its axial symmetry. The initial and boundary conditions are the same as for the previous
cases of nanospheres and nanorods.
3.3.3.2 As in the other cases, a preliminary thermal analysis (without phase
change) was performed to determine power levels and pulse durations that increase the
temperature of the torus from ambient to the supercritical temperature. We calculated the
temperature of the torus during heating for a range of power levels and pulse durations.
The latter was chosen to be from 2 to 5 ns. Once this was complete, the results were
used in a second parametric CFD analysis that included bubble nucleation to determine
viable power levels and pulse durations that are sufficient to nucleate a sustained bubble
without destroying the torus or ring. It was found that an adequate power for nucleation
was 172.8 μW, with a pulse duration of 4.1 ns. Given these values and the results of the
Figure 3.11. Photothermal heat cycle of a gold nanotorus (R= 30 nm and r = 10nm)
(cross-sectional view): plot of nanorod temperature vs. time, pulse duration indicated by
red arrow and dashed line and inset plots showing various phases of the thermal cycle;
(a) initial heating, (b) nanobubble formation, (c) nanobubble (maximum size), (d)
nanobubble collapse, (e) cooling.

58
photonic analysis (Fig. 3.9b) we determined that a laser operating at the plasmon
resonant wavelength of λ = 828 nm with an irradiance of Iinc = 19.27 mW/μm2 is sufficient
to generate and sustain a bubble without melting the torus. The fluidic analysis at this
power and pulse duration is shown in Fig. 3.11. This plot shows the temperature of the
torus throughout the photothermal process along with corresponding images of the
bubble dynamics.
3.3.3.3 Initially the torus is at ambient temperature. After 0.2 ns it is illuminated and
its temperature begins to rise. During the first 3.4 ns of heating, its temperature gradually
increases (Fig. 3.11a) to the superheat temperature, at which point a bubble is nucleated
around it. Once this occurs the torus is surrounded by vapor and its temperature increases
rapidly as it is still absorbing energy. It reaches a peak temperature of approximately
1000K, which occurs at the end of the heat pulse (4.1 ns), at which point it is completely
surrounded by vapor (Fig. 3.11b). As soon as the bubble has nucleated, it expands and
reaches its maximum size at 5.4 ns after the onset of heating. At this time the bubble has
a spherical shape, approximately 80 nm in radius.
3.3.3.4 An interesting feature of this process is the residue of an isolated drop of heated
fluid that forms in the middle of the torus during the bubble expansion as seen in Fig.
3.11c. Eventually, 8.7 ns after the onset of heating, the nanobubble collapses, bringing
fluid back in contact with the torus (Fig. 3.11d). Consequently, it slowly cools to the
ambient temperature as more of the fluid comes in contact with it (Fig. 3.11e). It is
instructive to note that the capillary force that acts to collapse the bubble is relatively weak

59
because of the relatively large radius of curvature that defines the fluid-vapor interface as
it gets closer to the torus. Thus, the nanobubble requires a substantial amount of time to
completely collapse, compared to other geometries. This effect is not present in the case
of nanorings

60
3.4 Nanocages and Nanoframes
3.4.1 Synthesis
3.4.1.1 Hollow cubical
nanostructures have gained more
attention in recent years owing to their
high absorption cross-section that
qualifies them as the optimum choice
for a variety of bioapplications (Jingyi
Chen et al. 2007; Leon R Hirsch et al.
2006; Loo et al. 2004). In this part of
our work we will specifically focus on cubical nanocages and nanoframes. Nanocages
are hollow cubical structures with porous walls while nanoframes are hollow cubical
structures that are defined by a metallic frame. An idealized nanoframe can be thought of
as consisting of twelve rectangular nanowires with length L and width W as shown in Fig.
3.12. Both nanocages and nanoframes can be fabricated through a template method. As
far as nanocages are concerned, some of the earliest work in the field was performed by
Y. Sun and Y. Xia in 2003. They reported a simplified method of fabricating porous metal
nanostructures through the galvanic replacement reaction between silver (Ag)
nanoparticles in an aqueous solution of chloroauric acid (HAuCl4). By carefully choosing
the concentration of chloroauric acid in the solution, the authors managed to fabricate
porous Au/Ag nanocages through a de-alloying process during which silver atoms were
replaced with gold. The resulting nanoparticles were found to have a plasmon resonance
Figure 3.12. Nanoframe structure and
characteristic dimensions (Edge length L and
edge thickness W).

61
wavelength in the NIR region (800 – 1030 nm) (Y. G. Sun and Xia 2003a). Following this
work, J.Chen et al. fabricated and characterized gold nanocages on the scale of 40nm.
This group determined that despite their smaller size compared to other nanoparticle
geometries (e.g. gold nanoshells), nanocages not only maintain strong optical resonance
peaks in the NIR but also, based on optical coherence tomography (OCT) measurements,
present a very large absorption cross-section compared to other nanoparticles or organic
dyes. In addition, it was shown that bioconjugated gold nanocages coated IgG antibodies
could successfully bind to SK-BR 3 breast cancer cells bound with anti-HER2 antibodies.
Hence, gold nanocages also showed potential as thermal therapeutic agents for cancer
treatment (J. Chen et al. 2005). S.E. Skrabalak et al. managed to prepare porous hollow
gold nanostructures in the order of ~15nm with 2 to 5nm voids using silver multiply
twinned particles (MTPs). The LSPR wavelength for such nanoparticles could reach a
maximum of 740nm despite their smaller size. Such nanoparticles could prove
advantageous for biomedical applications through enhanced delivery rates and diffusion.
In a related result, coating 45nm nanocages with calcein AM (fluorescent green in living
cells) and EthD-1 (fluorescent red when penetrating compromised cell walls) this group
could determine the effectiveness of using nanocages for photothermal treatment through
fluorescence microscopy (Skrabalak et al. 2007).
3.4.1.2 In the field of nanoframe fabrication a pioneering study was carried out by
Y. Xia and his group who introduced a simplified method of fabricating nanoframes
through the galvanic replacement reaction between silver (Ag) nanocubes and
chloroauric acid (HAuCl4). This method is very similar to the one employed for fabricating
nanocages but the geometrical characteristics of the ensuing nanostructures can be

62
altered by carefully
selecting the
concentration of
chloroauric acid in the
solution. The resulting
nanoparticles were
found to have
absorption peaks
ranging from 400nm to
900nm (Au et al. 2008;
Wan et al. 2013). The
optical properties of
nanoframes were further investigated by M.A. Mahmoud and M.A. El-Sayed. In a
combination of theoretical and experimental studies, they were able to determine that
nanoframes exhibit strong field enhancement at their surface and throughout their hollow
interior. Moreover the authors demonstrated that gold nanoframes have significantly
higher sensitivity factors (an indication of the strength of a nanoparticle’s plasmonic
surface field), compared to other similar size solid nanoparticles. As such, gold
nanoframes represent promising candidates for nanosensors in the NIR (M. A. Mahmoud
and El-Sayed 2010; M. Mahmoud et al. 2010). Despite the plethora of research on their
optical characteristics, compared to other metallic nanoparticles, to the best of our
knowledge, no theoretical studies have been reported to quantify the photothermal and
Figure 3.13. Transmission electron microscopy (TEM)
image of gold nanoframes with an average edge length L =
50 nm and thickness W = 10 nm (Au et al. 2008)

63
thermofluidic behavior of colloidal Au nanoframes under pulsed-laser illumination (Baffou
and Quidant 2013).
3.4.1.3 As it can be deducted from this brief literature review, nanocages and
nanoframes are very similar in their fabrication and optical characteristics. Since a
nanoframe with thicker frame elements can be considered a nanocage while a nanocage
with highly porous walls can be considered a nanoframe, in order to make our analysis
more concise, from now on the term nanoframe will be used to describe this type of
nanoparticles in the following subsections; where, for the first time, their photothermal
response and nanobubble behavior will be numerically quantified.
3.4.2 Photonic Simulations
3.4.2.1 In this section we explore the optical properties of nanoframes with different
dimensions and orientations. The computational domain for this analysis is shown in Fig.
3.14a. A single Au nanoframe is centered at the origin of the domain. The geometry of
the nanoframe is defined by its length L that defines the size of the cube (i.e. the length
of the rectangular nanowire frame element), and the width W that defines the cross-
sectional area of the nanowire as shown in Fig. 3.12. The aspect ratio, R=L/W is also
used in parts of our analysis. The particle is illuminated with a uniform downward-directed
plane wave with the E field parallel to the x-axis. PMLs are applied at the top and bottom
of the domain to reduce backscatter from these boundaries. PEC conditions are applied
at the boundaries perpendicular to E, and PMC conditions are applied at the boundaries

64
perpendicular to H. These
symmetry boundary conditions
mimic the response of a 2D array
of identical nanoframe structures
with center-to-center x and y
lattice spacing equal to the width
of the computational domain in the
x and y directions, respectively.
The lattice spacing is chosen to be
large enough so that the resulting
predictions will reflect the
response of a single isolated
particle, i.e. with negligible
coupling with neighboring
particles. The fluid surrounding the
nanoparticle is assumed to be
non-absorbing water with an index
of refraction of nf = 1.3. The
incident field is generated by a time-harmonic surface current positioned in the x-y plane
directly below the upper PML. We compute the (wavelength dependent) power absorbed
by the particle Qabs (W), which is converted to heat. Thus, this analysis predicts
photothermal energy conversion within the particle.
Figure 3.14. Photonic analysis of a gold
nanoframe (L=28nm and R=4) with parallel
alignment to the incident polarization: (a)
computational domain, (b) in plane spatial plot of
electric field intensity enhancement (|E|2/|E0|2)
(plane shown in inset).

65
3.4.2.2 In Fig. 3.14b we plot the spatial profile of electric field intensity
enhancement (|E|2/|E0|2) in the x-y plane, shown in the inset. The size of the nanoframe
is L=28 nm with R=4 and the localized surface plasmon resonance (LSPR) occurs at λ
= 830 nm. An interesting discovery of this analysis is that the mode profile demonstrates
a high degree of field localization and enhancement due to the coupled surface plasmons
of the neighboring nanowire frame elements. We believe that this property can be
leveraged for theranostic biomedical applications because the surface of gold
nanoframes can be functionalized to achieve cancer cell specificity. More specifically, by
manipulating thiolate-Au monolayer chemistry, excellent compatibility between gold
surfaces and various molecules and ligands can be achieved (J. Chen et al. 2005; Xia et
al. 1999). Through the functionalization process, fluorescent labels can be attached to the
gold surface to enable spatial tracking and imaging. The LSPR of Au nanoparticles can
then be used to enhance fluorescent signal intensity. Such fluorescence increase is
directly related to the localized field enhancement at LSPR (Khatua et al. 2014). Figure
3.14b shows that strong E field enhancement (500 fold) occurs around the nanowires.
This could dramatically increase the signal from surface-bound fluorescent molecules.
Highly localized regions that exhibit even higher enhancement (3000) can also be
observed. If the frame elements of a nanoframe are sufficiently close to one another,
their LSPR modes are coupled, which can produce a significant field enhancement
throughout the interior of the nanoframe. We have predicted enhancement factors of ~300
for this region. This could prove to be especially useful for biomedical applications
wherein photoactivated theranostic agents are transported to target tissue in the porous

66
interior of a nanoframe. These include therapeutic drugs and fluorescent probes (Mackey
et al. 2013; Xiong et al. 2014) that can enable high-resolution in vivo imaging and tracking.
3.4.2.3 Next we investigate the absorption cross-section spectra σabs (m2)
(absorbed power Qabs (W) divided by the incident irradiance Iinc (W/m2)) and especially
the LSPR peak wavelength of a nanoframe as a function of its geometric parameters, i.e.
L and W. As a first step in the analysis, we compute σabs as a function of L in the range
of 22-37 nm with W fixed at 7 nm. As shown in Fig. 3.15a, as L increases, the LSPR
absorption peak red-shifts from 690 nm to 1060 nm, demonstrating a strong L-dependent
LSPR sensitivity, similar to that observed in nanorods (Alali et al. 2013). Our analysis also
indicates that the optical absorption of a nanoframe at LSPR increases with the amount
of gold it contains (Fig. 3.15a). Similarly, we then study the optical response of the
nanoframe as a function of the aspect ratio R=L/W where R ranges from 3 to 5.5 and L =
28nm is kept constant. The absorption cross section σabs is calculated as a function of
wavelength and plotted in Fig. 3.15b. Note that the LSPR peak wavelength red-shifts
Figure 3.15. Nanoframe absorption spectra as a function of geometric parameters: (a)
absorption spectra vs. L (W = 7 nm) (b) absorption spectra vs. R= L/W (L = 28 nm).

67
from 680 nm to 1090 nm as R increases. We found that the absorption cross-section of
the nanoframe monotonically decreases with W (Karampelas et al. 2016).
3.4.3 Thermofluidic Simulations
3.4.3.1 Contrary to all previous geometries studied, nanoframes do no exhibit any
kind of axial symmetry. Thus a highly complex, full 3D analysis is required to describe
their thermofluidic response to incident illumination. This 3D CFD analysis was performed
to determine the incident optical irradiance and pulse duration needed to superheat the
nanoframe and to nucleate an explosive homogeneous nanobubble without damaging
the nanoparticle, i.e. without melting or vaporizing the metal. Owing to its symmetrical
Figure 3.16. Photothermal heat cycle of a nanoframe (L = 50 nm, W = 5 nm) (cutaway
perspective of heated nanocage): plot of nanoframe temperature vs. time, pulse duration
indicated by red arrow and dashed line and inset plots showing various phases of the
thermal cycle; (a) nanobubble formation, (b) nanobubble (maximum size), (c) nanobubble
collapse, (d) cooling.

68
nature, it was only necessary to model a 3D octant of the nanoframe. The CFD
computational domain spanned a length scale that ranged from 2.8 to 8 times the edge
length L of the nanoframe depending on the size of the bubble that was generated. A
computational mesh of cubical cells was used for the analysis. The cell size was fixed at
1 cubic nanometer for x, y, z ≤ 150nm, gradually increasing in size to a maximum of 2
cubic nanometers for the rest of the domain. The cell size was chosen to optimize the
accuracy of the simulation (better surface tracking during the onset of bubble nucleation)
while maintaining computational efficiency (lower total runtime). Symmetry boundary
conditions were imposed along the x-, y- and z-axes in order to account for the remaining
octants of the nanoframe. A stagnation pressure condition was imposed at the outer
boundaries along with a thermal Dirichlet condition (T=300K) to account for the ambient
temperature of the surrounding fluid. The pressure and temperature throughout the
computational domain were initialized to 1Atm and 300K, respectively. These initial
values and boundary conditions were used for all cases studied in our thermofluidic
analysis. We chose water as the working fluid but the analysis can be applied to any
Newtonian fluid.
3.4.3.2 Various gold nanoframe structures were studied, L = 50 nm – W = 5 nm, L
= 50 nm – W = 10 nm and L = 70 nm – W = 5 nm. It should be noted that the nanoframe
dimensions selected for this analysis were chosen to illustrate representative
photothermal behavior and provide an intuitive guide for optimal heating efficiency. As
mentioned previously, the thermofluidic analysis was divided into two phases. In the first
phase, a thermal analysis was performed to predict the power level required to heat the
fluid around nanoframes of varying sizes (L and W) from an ambient temperature of 300

69
K to the superheat temperature of water i.e. 580 K. The heating process depends on the
pulse intensity and duration, which was constrained to be between 3 to 5 ns. The
nanosecond pulse duration far exceeds the characteristic time constants (femto- to pico-
seconds) for non-equilibrium energy transfer mechanisms that occur in gold nanoparticles
and are therefore consistent with the continuum modeling approach taken here. Once the
preliminary thermal calculations were completed, we performed the second phase of
analysis where we applied the power levels obtained in the phase one analysis with a
slightly increased pulse duration in order to heat the nanoframes beyond the superheat
temperature, which causes vaporization of the surrounding fluid and bubble nucleation.
The pulse duration was tuned so that the nanoparticle achieved a temperature that was
sufficiently high to generate a sustained nanobubble, but low enough (< 1100K) to avoid
melting or vaporizing the nanoparticle. A summary of key simulation parameters, such as
Figure 3.17. Photothermal heat cycle of a nanoframe (L = 50 nm, W = 10 nm) (cutaway
perspective of heated nanocage): plot of nanoframe temperature vs. time, pulse duration
indicated by red arrow and dashed line and inset plots showing various phases of the
thermal cycle; (a) nanobubble formation, (b) nanobubble (maximum size), (c) nanobubble
collapse, (d) cooling.
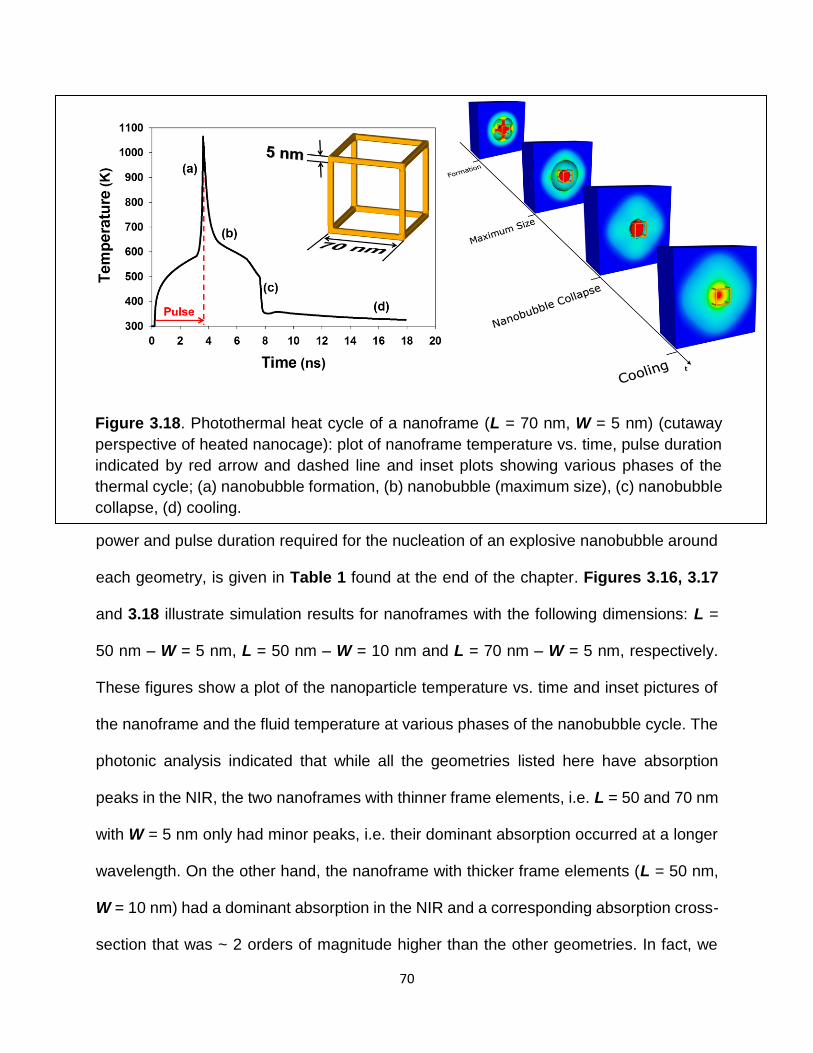
70
power and pulse duration required for the nucleation of an explosive nanobubble around
each geometry, is given in Table 1 found at the end of the chapter. Figures 3.16, 3.17
and 3.18 illustrate simulation results for nanoframes with the following dimensions: L =
50 nm – W = 5 nm, L = 50 nm – W = 10 nm and L = 70 nm – W = 5 nm, respectively.
These figures show a plot of the nanoparticle temperature vs. time and inset pictures of
the nanoframe and the fluid temperature at various phases of the nanobubble cycle. The
photonic analysis indicated that while all the geometries listed here have absorption
peaks in the NIR, the two nanoframes with thinner frame elements, i.e. L = 50 and 70 nm
with W = 5 nm only had minor peaks, i.e. their dominant absorption occurred at a longer
wavelength. On the other hand, the nanoframe with thicker frame elements (L = 50 nm,
W = 10 nm) had a dominant absorption in the NIR and a corresponding absorption cross-
section that was ~ 2 orders of magnitude higher than the other geometries. In fact, we
Figure 3.18. Photothermal heat cycle of a nanoframe (L = 70 nm, W = 5 nm) (cutaway
perspective of heated nanocage): plot of nanoframe temperature vs. time, pulse duration
indicated by red arrow and dashed line and inset plots showing various phases of the
thermal cycle; (a) nanobubble formation, (b) nanobubble (maximum size), (c) nanobubble
collapse, (d) cooling.
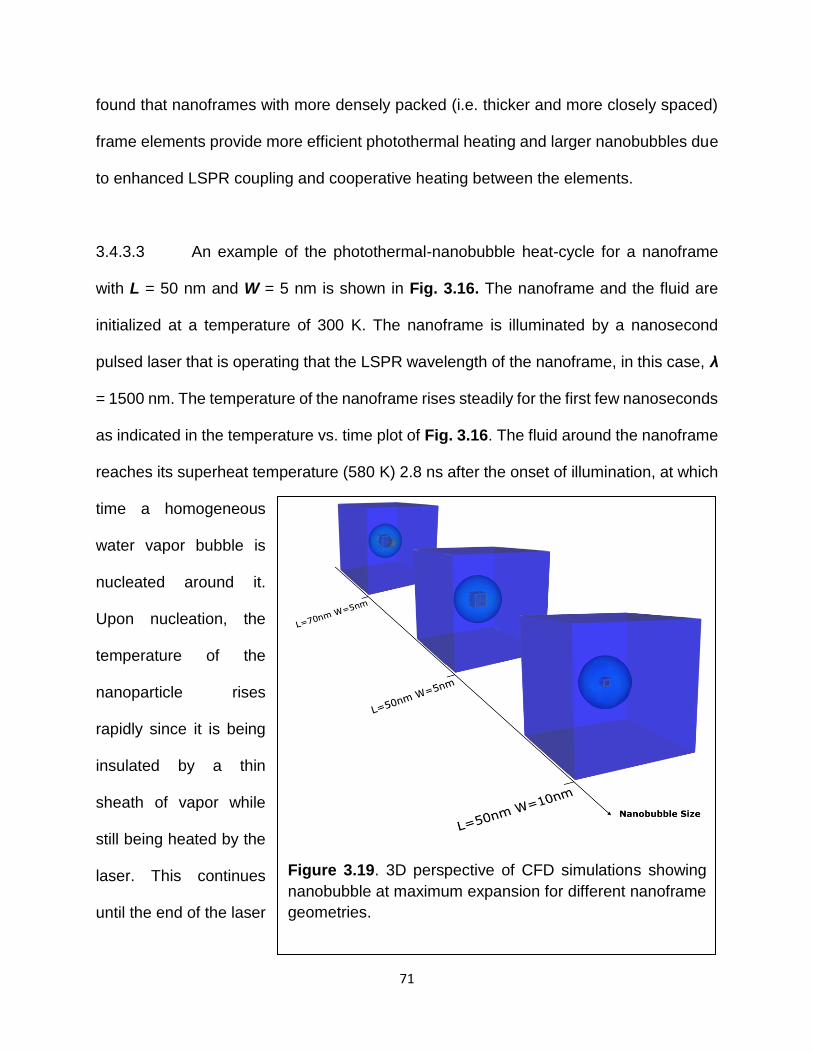
71
found that nanoframes with more densely packed (i.e. thicker and more closely spaced)
frame elements provide more efficient photothermal heating and larger nanobubbles due
to enhanced LSPR coupling and cooperative heating between the elements.
3.4.3.3 An example of the photothermal-nanobubble heat-cycle for a nanoframe
with L = 50 nm and W = 5 nm is shown in Fig. 3.16. The nanoframe and the fluid are
initialized at a temperature of 300 K. The nanoframe is illuminated by a nanosecond
pulsed laser that is operating that the LSPR wavelength of the nanoframe, in this case, λ
= 1500 nm. The temperature of the nanoframe rises steadily for the first few nanoseconds
as indicated in the temperature vs. time plot of Fig. 3.16. The fluid around the nanoframe
reaches its superheat temperature (580 K) 2.8 ns after the onset of illumination, at which
time a homogeneous
water vapor bubble is
nucleated around it.
Upon nucleation, the
temperature of the
nanoparticle rises
rapidly since it is being
insulated by a thin
sheath of vapor while
still being heated by the
laser. This continues
until the end of the laser
Figure 3.19. 3D perspective of CFD simulations showing
nanobubble at maximum expansion for different nanoframe
geometries.

72
pulse, which coincides with the bubble formation and maximum temperature as shown in
plot segment and inset (Fig. 3.16a). The pulse duration is 3.18 ns as indicated by the red
dashed line. After it is nucleated the nanobubble expands because of its higher pressure
compared to the surrounding fluid. The nanobubble reaches a maximum size as shown
in inset Fig. 3.16b. For this geometry, the maximum bubble radius achieved was ~ 120
nm. Eventually, the nanobubble collapses bringing fluid back in contact with the
nanoparticle after 7.8 ns as shown in plot segment and inset Fig. 3.16c, reducing its
temperature to the ambient temperature (Fig. 3.16d). An interesting observation of this
process is the formation of a hot mass of fluid in the middle of the nanoframe, which only
partially evaporates as the nanobubble expands but does not reach superheat
temperature. This phenomenon allows for the cooling of the nanoframe during the
nucleation of an explosive nanobubble around it, thus maintaining its temperature below
melting i.e. 1100 K, for the entirety of the photothermal heat cycle. For comparison
purposes, we provide a transparent 3D perspective of the maximum expansion of the
nanobubbles generated around all the geometries studied in order of maximum size as
shown in Fig 3.19. This figure clearly illustrates that nanoframe geometries with more
concentrated metallic mass are capable of generating nanobubbles of larger radius
(Karampelas et al. 2016).

73
3.5 Summary of Combined Modeling Effort
3.5.0.1 Thus far, we have demonstrated the development and results of combined
computational electromagnetic and CFD-based models for 5 different geometries,
nanospheres, nanorods, nanorings, nanotori and nanocages/nanoframes. In short, using
the combined approach we were able to predict the plasmon resonance wavelength for
each geometry, the pulse duration and power required for sustained nucleation while
avoiding potential damage to the nanoparticle and the dynamic behavior of the bubble as
it expands and collapses. Although, the focus of our initial effort was modeling
nanoparticles exhibiting axial symmetry, such as nanospheres and nanorods, we also
proceeded to determine the aforementioned for 3D geometries such as nanoframes.
Modeling non-symmetric nanoparticles was an extremely more complicated task that
required vast amounts of computational resources. To the best of our knowledge, no
similar numerical studies have been reported in scientific literature. The results of our
modeling effort for specific can be summarized in Table 1.
3.5.0.2 Although our results are focused to a certain number of geometries, the
methods described herein are directly applicable for any nanoparticle morphology.
However, further computational research may be required for variations of already
modeled geometries such as nanoparticles of different dimensions and materials as well
as additional geometries e.g. nanostars or nanoframes of different shape. Therefore, for
our future work, the models described in the previous sections should be further extended
in order to capture all possible cases, thereby creating a more complete and

74
comprehensive ensemble that will form the basis for a rational design guide of future
plasmon-based photothermal processes.
Nanoparticle
Type
Radius,
Dimensions
(nm)
Power
(μW)
Pulse
Duration
(ns)
Laser
Irradiance
(mW/m2)
( nm)
Maximum
Nanoparticle
Temperature
(K)
Maximum
Bubble
Radius
(nm)
Nucleation
Time
(ns)
Maximum
Bubble
Time
(ns)
Nanosphere R=30 152 5
14
(532)
1080 50 3.8 5.6
Nanorod L=60, r=8.5 76.8 1.9
10
(770)
915 65 2.7 3
Nanoring
(h=20nm)
R=50, r=30 252 4
27.07
(935)
862 95 3.5 6.3
R=40, r=20 192 3.8
11.79
(793)
984 85 3.2 5.5
R=30, r=10 127.2 4.1
6.94
(662)
972 50 3.5 4.8
Nanotorus R=40, r=10 259.2 3.1
21.82
(986)
889 70 2.7 4.9
R=30, r=10 172.8 4.1
10.06
(825)
1000 80 3.4 5.4
R=20, r=10 115.2 4.1
7.94
(680)
773 65 3.7 5.6
Nanoframe L=50, W=5 180 3.18
209
(1500)
977 120 2.8 6.8
L=50, W=10 200 3.2
4.96
(1015)
754 185 3.0 5.7
L=70, W=5 288 3.42
633
(1500)
1068 95 3.2 4.5
Table 3.1. Summary of modeled nanoparticle geometries with heating and nanobubble parameters.

75
Chapter 4: Colloidal Photothermal Modeling
4.0 Since most in vivo applications involve a solution of nanoparticles, our modeling
effort will now be extended to include additional computational models that predict the
colloidal photothermal or optical behavior of various nanostructures. We begin with
numerical simulations of the absorption of incident light by nanoparticles rotated in
different orientations. This modeling work will be used to determine not only the types of
nanoparticles that are characterized by LSPR in the NIR but also their overall absorption
cross-section independent of orientation at this wavelength range. A number of thermal
models predicting heating of a colloidal solution of identical nanoparticles under pulsed
illumination as a function of nanoparticle separation distance will also be developed. Such
models will serve as indicators of the energy required for sustained nucleation when
particle aggregates are formed. As it can be seen from SEM and TEM images in previous
sections, nanoparticles in a solution are rarely encountered in isolation but rather as a
parts of a larger population. These types of groups of nanoparticles have also been
experimentally identified by numerous in vitro experiments showing aggregation inside
targeted cells (Albanese and Chan 2011; Chithrani et al. 2006; Hotze et al. 2010). This
phenomenon could be used to increase the localization and effectiveness of nanobubble
treatment. By lowering the irradiance and/pulse duration and relying on cooperative
heating effects, larger nanobubbles are possible with reduced power. This statement can
be confirmed by models of cooperative nanobubble nucleation around identical
nanoparticles described below. Overall, the colloidal modeling effort serves to extend the
application of Chapter 3 models in more realistic in vivo or in vitro environments. In all
Chapter 4 models all material properties are considered constant.

76
4.1 Photonic Models for Nanoparticles at Varying Orientations
4.1.1 Absorption Spectra of Gold Nanorods and Nanotori at Discrete Rotations
4.1.1.1 In this section
we compare photothermal
energy conversion for
colloidal nanorods and
nanotori. In order to
determine their heating
efficiency, it is necessary to
quantify their absorption as a
function of orientation. For all
geometries studied in this
section, the orientation can
be specified using angles φ
and θ that define the rotation of axis of the particle relative to the x- and z-axis,
respectively. Figure 4.1 illustrates colloidal nanorods and nanotori being illuminated with
a pulsed laser and a reference frame showing the angles φ and θ that define the
orientation of the particles. Throughout this analysis the incident field is assumed to be
linearly polarized along the x-axis and propagating downward with k in the z-direction as
shown in our previous photonic analyses e.g. Figs. 3.5 and 3.9. The inset plot in Fig. 4.1
depicts the pulse profile (irradiance llaser vs.t) for the laser. In this figure, n is the unit
vector along the axis of the particle. For the nanorod, n is along its length, whereas for a
Figure 4.1. Pulsed laser heating of colloidal gold
nanorods and nanotori. The nanoparticle orientation is
defined by angles θ and φ. The inset plot illustrates a
laser pulse profile, irradiance I vs. t.

77
nanotorus and similarly for a nanoring, n is along its axis of rotation. The angle φ lies in
the x-y plane and is measured from the x-axis to the projection of n onto that plane,
whereas θ is the angle between n and the z-axis. As noted above, we assume that the
incident field is linearly polarized along the x-axis, shown in Figs. 3.5 and 3.9. As a point
of reference, the nanotorus shown in Fig. 3.9 has an orientation (θ = 0, φ = 0) and is
aligned parallel to polarization, i.e. the E field is parallel to the face of the torus,
perpendicular to its axis. The torus is aligned perpendicular to the polarization when (θ =
90, φ = 0) or (θ = 90, φ = 90). Similarly, a nanorod, as shown in Fig. 4a, is oriented
parallel (longitudinal) to the polarization when ( = 90, = 0).
4.1.1.2 We first study the nanorod. It is well-known that there are two distinct LSPR
frequencies for this geometry that correspond to transverse and longitudinal polarization
modes, respectively. A higher LSPR frequency (shorter wavelength) occurs for transverse
alignment, whereas a lower resonant frequency (longer wavelength) is obtained for
parallel alignment. Moreover, the latter depends on the aspect ratio (diameter/length) of
the nanorod and can be tuned through synthesis for a specific application. The ability to
tune LSPR in this fashion has spawned a growing interest in the use of gold nanorods,
especially for bioapplications that require NIR wavelengths to achieve more effective
penetration of light into a target tissue. As in section 3.2, we model the nanorod as a
cylinder with hemispherical caps. Similarly to our previous analysis, the length and
diameter of the nanorod are 60 nm and 17 nm, respectively, which define an aspect ratio
of 0.28. We compute the absorption spectra for five different orientations that range from
parallel to transverse alignment in 30 increments: (θ = 0, φ = 0º), (θ = 30, φ = 30º), (θ
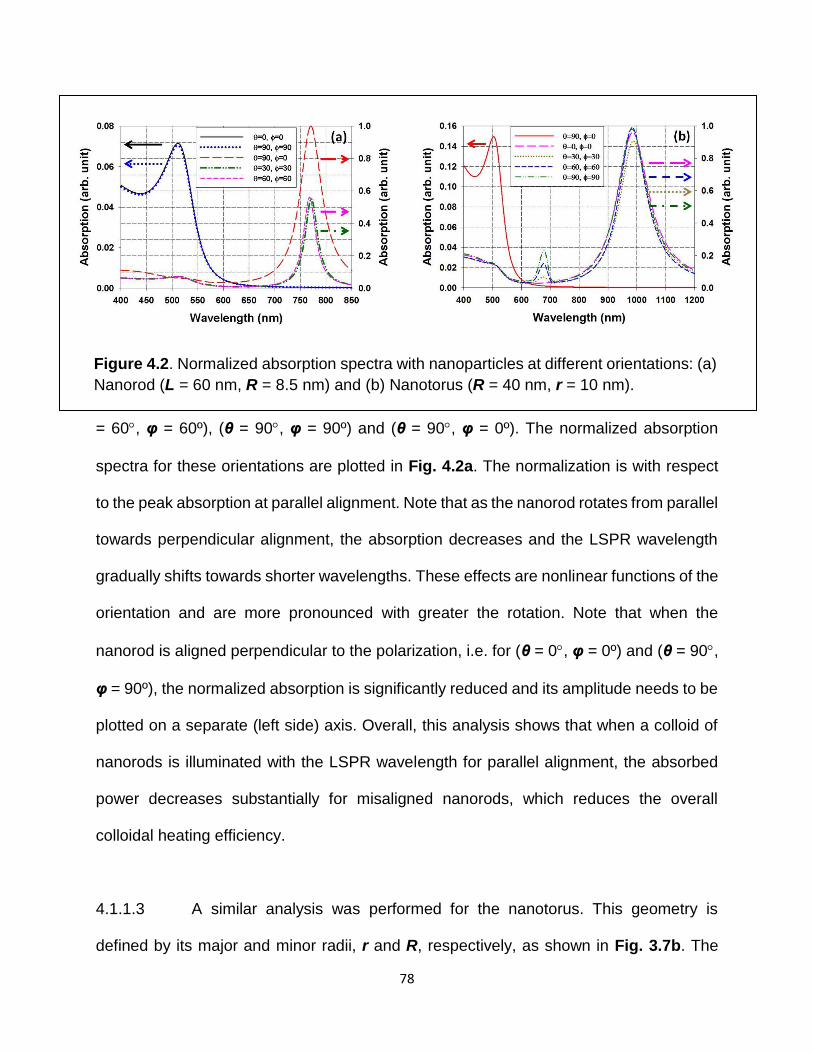
78
= 60, φ = 60º), (θ = 90, φ = 90º) and (θ = 90, φ = 0º). The normalized absorption
spectra for these orientations are plotted in Fig. 4.2a. The normalization is with respect
to the peak absorption at parallel alignment. Note that as the nanorod rotates from parallel
towards perpendicular alignment, the absorption decreases and the LSPR wavelength
gradually shifts towards shorter wavelengths. These effects are nonlinear functions of the
orientation and are more pronounced with greater the rotation. Note that when the
nanorod is aligned perpendicular to the polarization, i.e. for (θ = 0, φ = 0º) and (θ = 90,
φ = 90º), the normalized absorption is significantly reduced and its amplitude needs to be
plotted on a separate (left side) axis. Overall, this analysis shows that when a colloid of
nanorods is illuminated with the LSPR wavelength for parallel alignment, the absorbed
power decreases substantially for misaligned nanorods, which reduces the overall
colloidal heating efficiency.
4.1.1.3 A similar analysis was performed for the nanotorus. This geometry is
defined by its major and minor radii, r and R, respectively, as shown in Fig. 3.7b. The
Figure 4.2. Normalized absorption spectra with nanoparticles at different orientations: (a)
Nanorod (L = 60 nm, R = 8.5 nm) and (b) Nanotorus (R = 40 nm, r = 10 nm).

79
LSPR for the torus has been investigated using closed-form expressions (Dutta et al.
2008) for both parallel alignment (θ = 0, φ = 0) (Fig. 3.9a) and perpendicular alignment
(θ = 90, φ = 0). We compute the absorption spectra for a nanotorus with R = 40 nm and
r = 10 nm, i.e. with an aspect ratio of 0.25. As in the case of the nanorod, the resonant
wavelength can be tuned to the NIR by adjusting the aspect ratio r/R. We determine the
absorption spectra of the nanotorus for five different orientations, as above. These are
plotted in Fig. 4.2b. Note that in contrast to the nanorod, there is more overlap in the
absorption spectra at different orientations and the LSPR wavelength fist red-shifts
slightly and then blue-shifts as the torus rotates away from parallel towards perpendicular
alignment. This suggests that nanotori would provide more efficient colloidal heating than
the nanorods due to their relatively higher absorption at different orientations.
4.1.2 Absorption Comparison of Gold Nanorods, Nanotori and Nanorings
4.1.2.1 We compare the absorption for these geometries over the full range of
orientations, i.e. 0 θ 90 and 0 φ 180. This is a complex function of the geometry
(especially the aspect ratio), the dielectric function of each particle, its orientation (θ, φ),
as well as the dielectric properties of the background medium. Numerical analysis is
needed to study of these effects. We used full-wave analysis as described above to
predict the normalized peak absorption contours at different orientations, as shown in Fig.
4.3.

80
4.1.2.2 In this analysis, the nanorod and nanotori at different orientations are
illuminated with their respective LSPR wavelengths obtained for parallel orientation, in
this case 770 nm and 986 nm, respectively. The idea is to determine the fall off in the
peak absorption under a fixed illumination as the particles take on different orientations.
It is clearly illustrated in Fig. 4.3 that the nanorod has a substantially decreased peak
absorption at most orientations except for those nearly aligned with the polarization (e.g.
θ = 90, φ = 0). This is in sharp contrast to the nanotorus, which exhibits a relatively high
peak absorption throughout a wide range of possible orientations.
4.1.2.3 Nanorings are closely related to nanotori in terms of their plasmonic
behavior. Of the two structures, nanorings are currently easier to fabricate because their
rectangular features can be realized using planar lithographic techniques. Au nanoring
Figure 4.3. Normalized peak absorption at respective fixed LSPR wavelengths as a
function of particle orientation (θ, φ): (a) Nanorod at λ = 770 nm (L = 60 nm, R = 8.5 nm),
(b) Nanotorus at λ = 986 nm (R = 40 nm, r = 10 nm).

81
colloids have been developed by first fabricating the structures on a substrate and then
releasing them into solution. The normalized peak absorption vs. orientation of nanorings
are essentially the same as those of nanotori as shown in Fig. 4.4. In this analysis the
nanoring and nanotorus have comparable dimensions. The nanoring has inner and outer
radii of 20 nm and 40 nm, respectively. All the nanorings analyzed in the paper have a
height of 20 nm. The nanotorus has the same dimensions as above, R = 30 nm, r = 10
nm. The nanoring and nanotorus at different orientations are illuminated with their
respective LSPR wavelengths obtained for a parallel orientation, i.e. 793 nm and 825 nm,
respectively. Specifically, these wavelengths are held constant as the particle orientations
change. The analysis shown in Fig. 4.4 indicates that nanorings and nanotori can be
essentially interchanged for photothermal applications (Alali et al. 2013).
Figure 4.4. Normalized peak absorption at respective fixed LSPR wavelengths as a
function of particle orientation (θ, φ): (a) Nanoring at λ = 793 nm (R = 40 nm, r = 20 nm),
(b) Nanotorus at λ = 825 nm (R = 30 nm, r = 10 nm).

82
4.1.3 Absorption Cross-Section of Nanoframes under Different Orientations
4.1.3.1 While many groups have studied the optical response of nanoframe
structures as a function their geometry, to our best knowledge, this is the first such
analysis with respect to orientation. Similarly to previous the studies explained in previous
subsections, we investigate the LSPR absorption of a nanoframe as a function of its
orientation with respect to the polarization of the incident light. This is important for
applications involving colloids where nanoframes have random orientations within a
carrier fluid as illustrated in Fig. 4.5a. Since nanoframes have a relatively high degree of
geometric symmetry we expect that their LSPR absorption will be somewhat insensitive
to their orientation. Here, we quantify the orientation dependence for the first time.
4.1.3.2 The orientation of the nanoframe can be specified using angles φ and θ that
define the rotation of the particle relative to the x- and z-axis, respectively. Throughout
this paper the incident field is assumed to be linearly polarized along the x-axis and
propagating downward, i.e. with k in the z-direction as shown in Fig. 3.14a. Figure 4.5a
illustrates a colloid of nanoframe structures being illuminated with a pulsed laser. A
reference frame is shown along with angles φ and θ that define the orientation of the
nanoframe. The inset plot in Fig. 4.5a depicts the laser pulse profile (irradiance Ilaser
(W/m2) vs. t). In this figure, n is a unit vector that describes the orientation of the
nanoframe. Specifically, n is normal to the top area, as shown. The angle φ lies in the x-
y plane and is measured from the x-axis to the projection of n onto x-y plane, whereas θ
is the angle between n and the z-axis. We perform parametric calculations of σabs for the

83
nanoframe as a function of its orientation with respect to the incident polarization. In our
analysis, the nanoframe is illuminated by an x-polarized light at the LSPR peak
wavelength. We analyze an Au nanoframe with L = 28 nm and W = 7 nm, which has an
LSPR peak wavelength of 830 nm. The absorption cross section σabs of the nanoframe
is plotted in Fig. 4.5b. Note that there is very little variation in σabs throughout the entire
range of orientations. This is desired for applications such as photothermal cancer
treatment as it implies a higher heating efficiency for a given laser irradiance (Karampelas
et al. 2016). However, in order to quantify the behavior of the nanoparticle in fluid and the
amount of energy required for the generation of nanobubbles, we perform a CFD analysis
described in the following section.
Figure 4.5. Pulsed laser heating of colloidal Au nanoparticles. (a) Nanoparticle
orientation is defined by angles θ and φ. Inset plot illustrates a laser pulse profile,
irradiance Ilaser vs. t. (b) Optical absorption cross section σabs vs. orientation.

84
4.2 Colloidal Heating of Identical Nanoparticles
4.2.1 Gold Nanorods
4.2.1.1 Following our photonic
analysis, we performed a number of
thermal simulations of multi particle
systems. Such nanoparticle
aggregates are very common during
bottom up fabrication or when
appropriately functionalized
nanoparticles are uptaken by
targeted cells in vitro or in vivo
(Albanese and Chan 2011; Chithrani
et al. 2006; Hotze et al. 2010). We
begin with a multi-nanorod system to
examine effects of cooperative
heating. In this case, we studied an
evenly spaced 3-dimensional array
of nanorods that are 60 nm in length
and 17 nm in diameter, i.e. identical
to the single nanorod system
presented in section 3.2. We
systematically varied the surface-to-
(a)
(b)
Figure 4.6. Cooperative heating effects (a)
Percentage of single nanorod energy required
to achieve multi-rod nucleation vs. nanorod
separation, (b) Percentage of single nanotorus
energy required to achieve 2 tori nucleation vs.
nanotorus separation.

85
surface spacing between the nanorods from 1 to 7 radii, in both r and z directions. We
used 3D CFD analysis (without phase change) with a computational domain that spanned
from 12.75 nm to 38.25 nm in both x and y directions and from 34.25 nm to 59.75 nm in
the z direction, depending on the distance between the nanorods. Using the same amount
of power in each nanorod as in the single nanorod case, we calculated the pulse duration
that is required to heat the nanorods to the superheat temperature. The results of this
parametric analysis are presented in Fig. 4.6a. Based on our calculations, it can be
concluded that for a distance of 1 radius between the nanorods, only 39% of the energy
is required to reach the nucleation temperature as compared to the single nanorod
system. Moreover, all cooperative heating effects become negligible after a distance of 7
radii in all directions.
4.2.2 Gold Nanotori
4.2.2.1 A parametric thermal analysis was performed to examine the cooperative
heating effects of the 2-tori system. Using the same amount of power (172.8 μW) as in
the single torus case, we calculated the pulse duration required for the temperature of the
tori to reach the superheat temperature. This analysis was performed for a range of torus-
to-torus spacing spanning 1 to 10 minor radii between the edges of the tori (i.e. 10 to 100
nm). We used an axisymmetric model with a computational domain that spanned 200 nm
and 200-245 nm in the r and z directions, respectively (depending on the distance
between the tori). The results of this analysis are presented in Fig. 4.6b. Note, for
example, that for a distance of 1 radius between the tori, the energy required to achieve

86
the superheat temperature is only 58% of that of the single torus system. In addition, all
cooperative heating effects become negligible after a separation distance of 9 radii.
Having examined the cooperative heating effects between nanoparticles, we will apply
such principles for a multiparticle system undergoing a photothermal nanobubble cycle.

87
4.3 Cooperative Nanobubble Nucleation
4.3.1 System of Two Nanotori
4.3.1.1 In this section we explain the behavior of a two-nanoparticle system under
pulsed illumination. Similarly to the combined modeling work reported in Chapter 3, the
principles of CFD photothermal nanobubble modeling will be applied to a 2 tori system.
We opted for this geometry since it is characterized by a high degree of rotational
symmetry and has high absorption independent of orientation. Hence, the light energy
absorbed by the two particles will be assumed to be identical while we focus our attention
to the effects of cooperative heating in nanobubble nucleation. For this analysis, the
distance between the centers of the tori was set to 60 nm (i.e. 4 minor radii spacing, edge-
to-edge). We used an axisymmetric model in which the computational domain spanned
200 nm and 215 nm in the r and z directions, respectively, with a 1 nm cell size in both
directions. Symmetry boundary conditions were imposed along both the r- and z-axes.
The former accounted for the second torus while the latter accounted for their axial
symmetry. The same initial and boundary values as in the single torus case were applied
(see section 3.3). We first determined a range of viable power levels and pulse durations
and then used this data in a parametric CFD phase change analysis to select a power
level and pulse duration that are sufficient to generate a bubble without damaging the tori.
It was found that respective values of 72.8 μW and 3.45 ns would serve this purpose. The
fluidic analysis at this power and pulse duration is shown in Fig. 4.7. This plot shows the
temperature of the tori and corresponding images that show the generation and collapse
of combined nanobubbles.

88
4.3.1.2 Initially, the tori are at ambient temperature and after 0.2 ns they are
illuminated. During the first 2.9 ns of heating, their temperature gradually increases to the
superheat temperature, at which point, separate bubbles start to nucleate around the tori
(Fig. 4.7a). It should be noted that this heating process requires 10% less energy than
the single torus system, due to cooperative heating effects between the tori, as predicted
by our parametric analysis shown in Fig 4.6b. Once the tori are partly surrounded by
vapor, the heat transfer from their surface is negligible and their temperature increases
rapidly as they continue to absorb energy. The tori reach an instantaneous peak
temperature of approximately 790 K, which occurs at the end of the heat pulse (3.45 ns)
at which point they are partially surrounded by liquid (Fig. 4.7b). This remaining liquid
Figure 4.7. Photothermal heat cycle of a 2 identical nanotori system (R= 30 nm and r =
10 nm) (cross-sectional view): plot of nanorod temperature vs. time, pulse duration
indicated by red arrow and dashed line and inset plots showing various phases of the
thermal cycle; (a) initial heating, (b) nanobubble formation, (c) nanobubble (maximum
size), (d) nanobubble collapse, (e) cooling.

89
completely evaporates at approximately 4.2 ns after the onset of heating, and during
evaporation the tori cool from their peak temperature to 740 K.
4.3.1.3 As soon as the bubbles have nucleated, they expand and as they do so,
isolated drops of hot fluid form within the bubble close to the tori, similar to what was
observed in the single torus system (shown in Fig 3.11). The bubbles eventually merge
and continue to grow as a single bubble, which reaches its maximum size 6.3 ns after the
onset of heating. At its largest extent, the bubble has an elliptical shape of approximately
95 nm and 150 nm in the r and z directions, respectively (Fig. 4.7c). Eventually, 10 ns
after onset of heating, the nanobubble collapses bringing fluid back in contact with the
tori. A minor bubble forms in the space between the tori and shrinks slowly due to a
relatively weak capillary force (Fig. 4.7d). The tori are then further cooled to ambient
temperature and the bubble shown in Fig. 4.7d transforms into 2 smaller bubbles (Fig.
4.7e). It should also be noted that, due to relatively weak capillary forces (corresponding
to a large radius of curvature at the liquid-vapor interface) the nanobubbles shown in Fig.
4.7e require a substantial amount of time to completely collapse. As with all systems
studied, the number of bubbles generated and their dynamics can be controlled by tuning
the power level and duration of the heat pulse. In conclusion, the 2 coaxial tori system
was able to generate a bubble approximately 3.6 times larger than in the single torus case
while requiring less than 85% of the energy consumed by a single torus system.

90
4.4 Summary of Colloidal Modeling Effort
4.4.0.1 In Chapter 4, we developed computational electromagnetic and fluidic
models that pertain to the colloidal behavior of plasmonic nanoparticles. More specifically,
we performed colloidal heating and cooperative bubble nucleation CFD modeling along
with photonic analysis of nanoparticles at varying orientations. In summary, we observed
that colloidal heating for nanobubble nucleation is very important for nanoparticles that
are in relative close proximity while the effects diminish for less concentrated solutions.
When nanobubble formation is the desired goal, it is shown that less energy is required
and larger bubbles are observed for adjacent nanoparticles. In addition, we used
computational modeling to demonstrate that colloidal plasmonic nanorings, nanotori and,
even more so, nanoframes have advantageous absorption properties for photothermal
applications because their level of absorption remains high over a broad range of
orientations relative to the polarization of the incident field. These properties hold potential
for applications such as photothermal cancer therapy as they can enable more efficient
heating of malignant tissue and access to deeper tumors. The computational approach
described herein provides insight into fundamental aspects of the photothermal process
and enables rational design for novel applications. However, we believe that further
modeling is required for cases involving geometries not studied herein e.g. core-shell
nanoparticles. Therefore, in the following chapter we will suggest pathways of future work,
in which the models described thus will be extended in order to capture more of the
complex physical phenomena involved in cases of nanobubble treatment, directly
addressing the knowledge gap concerning the colloidal photothermal behavior of
plasmonic nanoparticles.

91
Chapter 5: Future Work Recommendations and Conclusions
Although, the models described in Chapters 3 and 4 represent the most accurate
nanobubble modeling attempt performed thus far, at the time of writing, the assumptions
of continuum theory, constant nanoparticle properties and constant absorption of light
energy at every stage might lead to potential discrepancies between modeling and
experimental results. Hence, in the interest of increased accuracy, we suggest the
inclusion of additional modeling techniques or expanding current modeling effort through
the addition of more physical models. More specifically, we propose the use of the Two-
temperature Model (TTM) to describe non-equilibrium femto-second electron relaxation
in the nanoparticle when such pulsing methods are employed. These models will enable
the proposed modeling methodology to be extended to femto- and pico-second pulsing.
In addition, a further refinement of the models developed in Chapters 3 and 4 could be
realized with the inclusion of temperature dependent properties for the fluid and the
nanoparticle. By adding temperature dependent properties to all materials involved,
current models could become inherently more accurate. Finally, in order to account for
the changes in refractive index that may occur post-nucleation if pulsing durations are
sufficiently long, we suggest a separate analysis to be performed. This type of approach
could be used to determine the fall off peak absorption when a nanoparticles are
illuminated during the early formation stage of a nanobubble. This analysis could predict
a drop in the absorbed power when nanoparticles are surrounded by vapor. Overall, the
combination of non-equilibrium effects, temperature pertinent properties and nucleation-
step photonic modeling will provide most sophistication to an already complex modeling
effort.

92
5.1 Future Work Recommendations
5.1.1 Two-Temperature Model for Femto- and Pico-Second Pulsing
5.1.1.1 The Two-Temperature Model (TTM) can be used to describe the non-
equilibrium state between electrons and the lattice occurring when metallic sample is
excited by a laser pulse or an electric field is applied. According to the TTM, the metal is
assumed to be composed by two interacting subsystems: electrons and phonons
because the time necessary to achieve equilibrium in the electron gas is much less than
the time required to establish equilibrium between the electrons and the lattice phonons.
The hot degenerate (thermalized) electron gas relaxes to the bath phonons with relatively
slow electron-phonon interactions (Singh 2010).
5.1.1.2 When a metallic sample is illuminated by femto-second laser pulse then a
non-equilibrium electron distribution is generated while the temperature of the phonon
lattice remains unchanged due to the large difference between the heat capacities of
electrons (Cpe) and phonons (Cpp). Consequently, over a period of hundreds of femto-
seconds, the electron cloud returns to equilibrium through coulombic interactions while
the temperature of the electron cloud (Te) is higher than that of the protons (Tp). This
phenomenon is called thermalized electron distribution. This excited thermalized electron
gas then relaxes via electron-phonon interactions giving up the excess energy to the
phonon bath. Therefore, the difference between the intra-electron and intra-phonon
relaxation times justifies the two temperatures Te and Tp.The Two-Temperature model
can be summarized by the following coupled differential equations:

93
p p
e p
Cp TG T T
t
(5.1)
e e
e p
Cp TG T T
t
(5.2)
where G represents the electron-phonon interactions coefficient (Singh 2010).
5.1.1.3 We propose the use of the Two-Temperature Model for the description of
femto- and pico-second laser pulsing being currently used in many experimental
applications. The incorporation of the TTM in our simulations will enable more accurate
modeling of ultra-short laser pulsing expanding our current modeling effort.
5.1.2 Temperature Dependent Material Properties
5.1.2.1 Since all the material properties were maintained at a constant value for the
modeling effort described above we propose a further refinement with the use of
temperature dependent properties for the models developed in Chapters 3 and 4. Since
the temperature of the fluid and the nanoparticle might vary even by 800 K, the inclusion
of temperature dependent properties will potentially provide a more accurate description
of the photothermal process. The properties currently under consideration are: density,
viscosity, specific heat, thermal conductivity and surface tension coefficient for the fluid
and specific heat and thermal conductivity for the nanoparticles.
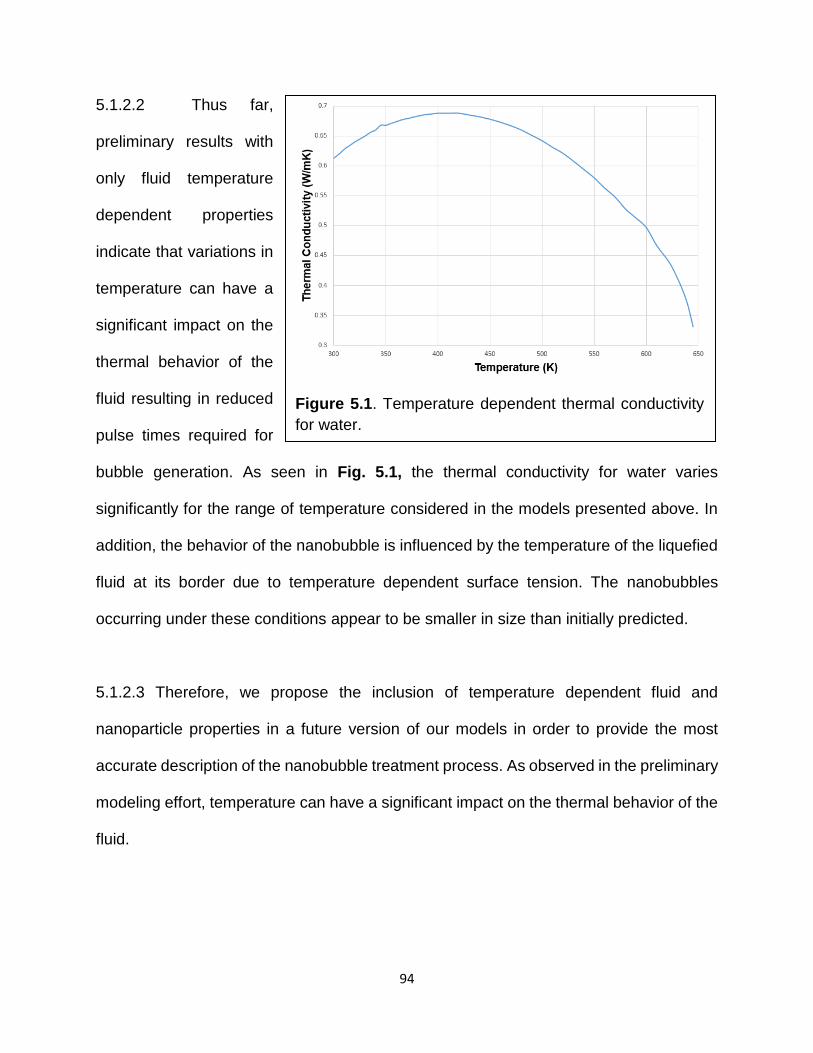
94
5.1.2.2 Thus far,
preliminary results with
only fluid temperature
dependent properties
indicate that variations in
temperature can have a
significant impact on the
thermal behavior of the
fluid resulting in reduced
pulse times required for
bubble generation. As seen in Fig. 5.1, the thermal conductivity for water varies
significantly for the range of temperature considered in the models presented above. In
addition, the behavior of the nanobubble is influenced by the temperature of the liquefied
fluid at its border due to temperature dependent surface tension. The nanobubbles
occurring under these conditions appear to be smaller in size than initially predicted.
5.1.2.3 Therefore, we propose the inclusion of temperature dependent fluid and
nanoparticle properties in a future version of our models in order to provide the most
accurate description of the nanobubble treatment process. As observed in the preliminary
modeling effort, temperature can have a significant impact on the thermal behavior of the
fluid.
Figure 5.1. Temperature dependent thermal conductivity
for water.

95
5.1.3 Illumination during Nanobubble Formation
5.1.3.1 As seen in Chapter 3 models, there exist cases where the nanoparticle is
still being illuminated for a small period of time ranging from 0.1 to 0.2 ns after the onset
of a nanobubble formation. Compared to the total pulse duration, this post nucleation
illumination represents less than 10% of the entire pulse duration. Nevertheless, we
suggest a two-step transient photonic analysis approach. To the best of our knowledge
such methods have never been implemented but could prove useful in determining the
fall off peak absorption when a nanobubble is being formed around a nanoparticle while
it is still being illuminated.
5.1.3.2 A preliminary
analysis was performed for a
spherical nanoparticle with a
radius r = 30 nm similarly to
section 3.1. The absorption of
the nanoparticle was
calculated for nanobubble
radii spanning from 40 nm to
80 nm. In Fig. 5.2, a
significant drop in absorption
is observed with increasing
bubble size. Moreover, as the nanobubble expands, there is a negligible blue-shift in the
Figure 5.2. Normalized absorption spectra for varying
nanobubble size (40 to 80 nm).

96
plasmon resonance wavelength. Further analysis would be recommended in order to
expand the current work to additional nanoparticle geometries.
5.1.3.3 Based on the thermofluidic modeling explained in previous chapters, if
illumination continues post-nucleation, the temperature of the nanoparticle rises rapidly
since it is essentially insulated when surrounded by vapor. This represents a crucial fine
tuning detail that has been identified thanks to our modeling effort. Hence carefully tuned
pulse durations prevent nanoparticle damage and lead to increases of the overall efficacy
of the treatment method by allowing the nucleation of robust nanobubbles with every laser
pulse. However, current models could be further enhanced with a more accurate
description of the crucial, rapid temperature increase, phase if the results of this analysis
were incorporated.
97
5.2 Conclusions
5.2.0.1 The focus of this work was the study nanosecond-pulsed, laser-induced,
plasmon-assisted bubble generation around subwavelength metallic nanoparticles in
aqueous solutions and associated thermal and fluidic effects through advanced
computational modeling. Our results include multiple nanoparticle geometries such as
nanospheres, nanorods, nanotori, nanorings and nanoframes.
5.2.0.2 The modelling effort described herein offers a thorough explanation of the
photothermal process: absorption of photonic energy by the nanoparticle at its plasmon
resonance wavelength, subsequent increase in temperature within the particle,
conductive heat transfer to the fluid, nanobubble formation and resulting behavior of the
bubble and surrounding fluid during and after pulsed illumination.
5.2.0.3 In chapter 3 models, we applied a combined photonic-fluidic approach
which resulted in initial estimates of the plasmon resonance wavelength for each of the
aforementioned geometries, of the pulse duration and power necessary for bubble
formation whilst not exceeding the melting temperature of the nanoparticle and of the
nanobubble performance metrics (e.g. maximum bubble size). While using constant
thermophysical properties for the fluid and the nanoparticle we were able to provide a
wealth of preliminary results for certain geometries. We also proposed a further expansion
of the current modeling effort into more complex geometries in order to conclusively
98
determine an optimal geometry for photothermal energy conversion and provide a more
comprehensive list of design parameters for experimentalists in the field.
5.2.0.4 The ensuing modeling effort in chapter 4 is more focused on the description
of the colloidal behavior of photonic nanoparticles. A preliminary cooperative colloidal
heating and bubble nucleation CFD analysis was performed alongside a thorough
photonic investigation of the power absorbed by the nanoparticles at varying orientations.
The results of this modeling approach demonstrate the importance of colloidal heating as
well as the relative orientation of the nanoparticle for practical applications. Current results
indicate that the suggested use of nanorings, nanotori and nanoframes is advantageous
for colloidal photothermal applications since their level of absorption remains relatively
high for a wider range of orientations. Of these nanostructure morphologies, the use of
nanoframes is most recommended since they can be readily synthesized via bottom up
fabrication techniques and their absorption cross-section remains high independent of
orientation. More specifically, nanoframe geometries with more densely packed frame
elements can provide enhanced photothermal heating due to electromagnetic coupling
and heating between the elements. This phenomenon in combination with the lower
nanobubble nucleation power demands owing to cooperative heating, leads to increased
nanobubble generation selectivity for highly localized cancer cell destruction when
adequate uptake is achieved.

99
5.2.0.5 In terms of potential future work avenues, we proposed the study of the
Two-Temperature Model (TTM) in order to extend our current modelling effort to femto-
and pico-second pulse durations as well as a further refinement of previous models with
the implementation of temperature dependent material properties and additional photonic
analyses specific to the post-nucleation environment. This combined attempt aims at
eliminating any potential discrepancies between modeling and experimental results,
increasing model sophistication and thus providing the most accurate description of the
photothermal process to date.
5.2.0.6. In summary, the modeling approach suggested herein a) directly addresses
the knowledge gap of photothermal therapy nanobubble specifics such as required
wavelength for plasmon resonance, required energy and pulse duration to achieve
nucleation without melting or even evaporating the nanoparticles of various morphologies,
b) explains the photothermal and optical behavior of colloidal plasmonic nanoparticles
and, most importantly, c) provides experimentalists in any field involving bioapplications
of nanotransducers with a most accurate rational guide for the development of novel
applications.

100
References Agarwal, A, et al. (2007), 'Targeted gold nanorod contrast agent for prostate cancer
detection by photoacoustic imaging', J. Appl. Phys., 102, 064701.
Aizpurua, J., et al. (2003), 'Optical properties of gold nanorings', Physical Review
Letters, 90 (5).
Alali, Fatema, et al. (2013), 'Photonic and thermofluidic analysis of colloidal plasmonic
nanorings and nanotori for pulsed-laser photothermal applications', The Journal of Physical Chemistry C, 117 (39), 20178-85.
Albanese, Alexandre and Chan, Warren CW (2011), 'Effect of gold nanoparticle
aggregation on cell uptake and toxicity', ACS nano, 5 (7), 5478-89.
Arbouet, A, et al. (2004), 'Direct measurement of the single-metal-cluster optical
absorption', Physical review letters, 93 (12), 127401.
Au, Leslie, et al. (2008), 'A quantitative study on the photothermal effect of immuno gold
nanocages targeted to breast cancer cells', ACS nano, 2 (8), 1645-52.
Baffou, Guillaume and Rigneault, Hervé (2011), 'Femtosecond-pulsed optical heating of
gold nanoparticles', Physical Review B, 84 (3), 035415.
Baffou, Guillaume and Quidant, Romain (2013), 'Thermo‐plasmonics: using metallic nanostructures as nano‐sources of heat', Laser & Photonics Reviews, 7 (2), 171-87.
Bohren, Craig F and Huffman, Donald R (2008), Absorption and scattering of light by
small particles (John Wiley & Sons).
Brust, M, et al. (1995), 'Synthesis and reactions of functionalised gold nanoparticles',
Journal of the Chemical Society, Chemical Communications, (16), 1655-56.
Brust, Mathias, et al. (1994), 'Synthesis of thiol-derivatised gold nanoparticles in a two-
phase liquid–liquid system', Journal of the Chemical Society, Chemical Communications, (7), 801-02.
101
Carrara, Sandro (2010), Nano-bio-sensing (Springer Science & Business Media).
Cepak, Veronica M and Martin, Charles R (1998), 'Preparation and stability of template-
synthesized metal nanorod sols in organic solvents', The Journal of Physical Chemistry B, 102 (49), 9985-90.
Chang, Ser-Sing, et al. (1999), 'The shape transition of gold nanorods', Langmuir, 15
(3), 701-09.
Chen, C. L., et al. (2010a), 'In situ real-time investigation of cancer cell photothermolysis
mediated by excited gold nanorod surface plasmons', Biomaterials, 31 (14), 4104-12.
Chen, Huanjun, et al. (2010b), 'Understanding the photothermal conversion efficiency of
gold nanocrystals', Small, 6 (20), 2272-80.
Chen, J., et al. (2005), 'Gold nanocages: Bioconjugation and their potential use as
optical imaging contrast agents', Nano Letters, 5 (3), 473-77.
Chen, Jingyi, et al. (2010c), 'Gold Nanocages as Photothermal Transducers for Cancer
Treatment', Small, 6 (7), 811-17.
Chen, Jingyi, et al. (2007), 'Immuno gold nanocages with tailored optical properties for
targeted photothermal destruction of cancer cells', Nano letters, 7 (5), 1318-22.
Cherukuri, Paul, Glazer, Evan S, and Curley, Steven A (2010), 'Targeted hyperthermia
using metal nanoparticles', Advanced drug delivery reviews, 62 (3), 339-45.
Chithrani, B Devika, Ghazani, Arezou A, and Chan, Warren CW (2006), 'Determining
the size and shape dependence of gold nanoparticle uptake into mammalian cells', Nano letters, 6 (4), 662-68.
Cho, Kwangjae, et al. (2008), 'Therapeutic nanoparticles for drug delivery in cancer',
Clinical cancer research, 14 (5), 1310-16.
Choi, Won Il, et al. (2011), 'Tumor regression in vivo by photothermal therapy based on
gold-nanorod-loaded, functional nanocarriers', ACS nano, 5 (3), 1995-2003.

102
Coronado, Eduardo A and Schatz, George C (2003), 'Surface plasmon broadening for
arbitrary shape nanoparticles: A geometrical probability approach', The Journal of chemical physics, 119 (7), 3926-34.
Daniel, Marie-Christine and Astruc, Didier (2004), 'Gold nanoparticles: assembly,
supramolecular chemistry, quantum-size-related properties, and applications toward biology, catalysis, and nanotechnology', Chemical reviews, 104 (1), 293-346.
Day, Emily S, et al. (2011), 'Nanoshell-mediated photothermal therapy improves survival
in a murine glioma model', Journal of neuro-oncology, 104 (1), 55-63.
Dickerson, Erin B, et al. (2008), 'Gold nanorod assisted near-infrared plasmonic
photothermal therapy (PPTT) of squamous cell carcinoma in mice', Cancer letters, 269 (1), 57-66.
Dutta, C. M., et al. (2008), 'Plasmonic properties of a metallic torus', Journal of
Chemical Physics, 129 (8).
Ekici, O., et al. (2008), 'Thermal analysis of gold nanorods heated with femtosecond
laser pulses', Journal of Physics D-Applied Physics, 41 (18).
Etchegoin, P. G., Le Ru, E. C., and Meyer, M. (2006), 'An analytic model for the optical
properties of gold', Journal of Chemical Physics, 125 (16).
--- (2007), 'An analytic model for the optical properties of gold (vol 125, pg 164705,
2006)', Journal of Chemical Physics, 127 (18).
Faraday, Michael (1857), 'The Bakerian lecture: experimental relations of gold (and
other metals) to light', Philosophical Transactions of the Royal Society of London, 147, 145-81.
Foss Jr, Colby A, et al. (1992), 'Optical properties of composite membranes containing
arrays of nanoscopic gold cylinders', The Journal of Physical Chemistry, 96 (19), 7497-99.
Frangioni, John V (2003), 'In vivo near-infrared fluorescence imaging', Current opinion
in chemical biology, 7 (5), 626-34.
103
Frens, G (1973), 'Controlled nucleation for the regulation of particle size in
monodisperse gold solutions', Nature Phys. Sci, 241, 20.
Furlani, E. P. and Baev, A. (2009a), 'Free-space excitation of resonant cavities formed
from cloaking metamaterial', Journal of Modern Optics, 56 (4), 523-29.
--- (2009b), 'Optical nanotrapping using cloaking metamaterial', Physical Review E, 79
(2).
Furlani, E. P., Karampelas, I. H., and Xie, Q. (2012), 'Analysis of pulsed laser plasmon-
assisted photothermal heating and bubble generation at the nanoscale', Lab on a Chip, 12 (19), 3707-19.
Gilstrap, Kyle, et al. (2011), 'Nanotechnology for energy-based cancer therapies', Am J
Cancer Res, 1 (4), 508-20.
Gobin, Andre M, et al. (2005), 'Near infrared laser‐tissue welding using nanoshells as an exogenous absorber', Lasers in Surgery and Medicine, 37 (2), 123-29.
Gobin, André M, et al. (2007), 'Near-infrared resonant nanoshells for combined optical
imaging and photothermal cancer therapy', Nano letters, 7 (7), 1929-34.
Goodman, S. L, Hodges, G. M, and Livingston, D. C (1980), 'A review of the colloidal
gold marker system', Scanning Electron Microsc., 2, 133 - 46.
Gu, Frank X, et al. (2007), 'Targeted nanoparticles for cancer therapy', Nano today, 2
(3), 14-21.
Hao, E and Schatz, G (2004), 'Electromagnetic fields around silver nanoparticles and
dimers', J. Chem. Phys., 120, 357 - 66.
Hao, E, Schatz, G, and Hupp, J (2004), 'Synthesis and optical properties of anisotropic
metal nanoparticles', J. Fluorescence, 14, 331 - 41.
Hartland, G. V and Hu, M (2002), 'Photophysics of metal nanoparticles: heat dissipation
and coherent excitation of phonon modes', Proc. SPIE, 4807, 166 - 76.

104
Hartland, G. V, Hu, M, and Sader, J. E (2003), 'Softening of the symmetric breathing mode in gold particles by laser-induced heating', J. Phys. Chem. B, 107, 7472 - 278.
Hashimoto, S., Werner, D., and Uwada, T. (2012), 'Studies on the interaction of pulsed
lasers with plasmonic gold nanoparticles toward light manipulation, heat management, and nanofabrication', Journal of Photochemistry and Photobiology C-Photochemistry Reviews, 13 (1), 28-54.
Hirsch, L_R, et al. (2003), 'Nanoshell-mediated near-infrared thermal therapy of tumors
under magnetic resonance guidance', Proceedings of the National Academy of Sciences, 100 (23), 13549-54.
Hirsch, Leon R, et al. (2006), 'Metal nanoshells', Annals of biomedical engineering, 34
(1), 15-22.
Hirt, C. W. and Nichols, B. D. (1981), 'VOLUME OF FLUID (VOF) METHOD FOR THE
DYNAMICS OF FREE BOUNDARIES', Journal of Computational Physics, 39 (1), 201-25.
Hotze, Ernest M, Phenrat, Tanapon, and Lowry, Gregory V (2010), 'Nanoparticle
aggregation: challenges to understanding transport and reactivity in the environment', Journal of environmental quality, 39 (6), 1909-24.
Hu, Min and Hartland, Gregory V (2002), 'Heat dissipation for Au particles in aqueous
solution: relaxation time versus size', The Journal of Physical Chemistry B, 106 (28), 7029-33.
Huang, Huang-Chiao, et al. (2011), 'Synergistic administration of photothermal therapy
and chemotherapy to cancer cells using polypeptide-based degradable plasmonic matrices', Nanomedicine, 6 (3), 459-73.
Huang, Xiaohua, et al. (2006), 'Cancer cell imaging and photothermal therapy in the
near-infrared region by using gold nanorods', Journal of the American Chemical Society, 128 (6), 2115-20.
Huang, Xiaohua, et al. (2008), 'Plasmonic photothermal therapy (PPTT) using gold
nanoparticles', Lasers in medical science, 23 (3), 217-28.

105
Huff, Terry B, et al. (2007), 'Hyperthermic effects of gold nanorods on tumor cells'.
Huttmann, G, Yao, C, and Endl, E (2005), 'New concepts in laser medicine: towards a
laser surgery with cellular precision', Med. Laser Appl., 20, 135 - 39.
Huttmann, G, et al. (2002), 'High precision cell surgery with nanoparticles?', Med. Laser
Appl., 17, 9 - 14.
Imura, Kohei, Nagahara, Tetsuhiko, and Okamoto, Hiromi (2005), 'Near-field two-
photon-induced photoluminescence from single gold nanorods and imaging of plasmon modes', The Journal of Physical Chemistry B, 109 (27), 13214-20.
Inasawa, S., Sugiyama, M., and Yamaguchi, Y. (2005), 'Laser-induced shape
transformation of gold nanoparticles below the melting point: The effect of surface melting', Journal of Physical Chemistry B, 109 (8), 3104-11.
Jain, P. K., et al. (2008), 'Noble Metals on the Nanoscale: Optical and Photothermal
Properties and Some Applications in Imaging, Sensing, Biology, and Medicine', Accounts of Chemical Research, 41 (12), 1578-86.
Jain, Prashant K, El-Sayed, Ivan H, and El-Sayed, Mostafa A (2007), 'Au nanoparticles
target cancer', nano today, 2 (1), 18-29.
Jemal, Ahmedin, et al. (2009), 'Cancer statistics, 2009', CA: a cancer journal for
clinicians, 59 (4), 225-49.
Jiang, Li-Ping, et al. (2004), 'Ultrasonic-assisted synthesis of monodisperse single-
crystalline silver nanoplates and gold nanorings', Inorganic Chemistry, 43 (19), 5877-83.
Johnson, P. B. and Christy, R. W. (1972), 'OPTICAL-CONSTANTS OF NOBLE-
METALS', Physical Review B, 6 (12), 4370-79.
Karampelas, Ioannis H, et al. (2016), 'Plasmonic Nanoframes for Photothermal Energy
Conversion', The Journal of Physical Chemistry C, 120 (13), 7256-64.
Khatua, Saumyakanti, et al. (2014), 'Resonant plasmonic enhancement of single-
molecule fluorescence by individual gold nanorods', ACS nano, 8 (5), 4440-49.
106
Khlebtsov, Boris, et al. (2006), 'Optical amplification of photothermal therapy with gold
nanoparticles and nanoclusters', Nanotechnology, 17 (20), 5167.
Khlebtsov, N., et al. (2013), 'Analytical and Theranostic Applications of Gold
Nanoparticles and Multifunctional Nanocomposites', Theranostics, 3 (3), 167-80.
Kotaidis, V, et al. (2006), 'Excitation of nanoscale vapor bubbles at the surface of gold
nanoparticles in water', The Journal of chemical physics, 124 (18), 184702.
Kottmann, Jörg P, et al. (2001), 'Plasmon resonances of silver nanowires with a
nonregular cross section', Physical Review B, 64 (23), 235402.
Kreibig, U and Vollmer, M (1995), Optical Properties of Metal Clusters (Berlin:
Springer).
Lal, Surbhi, Clare, Susan E, and Halas, Naomi J (2008), 'Nanoshell-enabled
photothermal cancer therapy: impending clinical impact', Accounts of chemical research, 41 (12), 1842-51.
Lapotko, D. O., Lukianova, E., and Oraevsky, A. A. (2006a), 'Selective laser nano-
thermolysis of human leukemia cells with microbubbles generated around clusters of gold nanoparticles', Lasers in Surgery and Medicine, 38 (6), 631-42.
Lapotko, Dmitri (2009a), 'Optical excitation and detection of vapor bubbles around
plasmonic nanoparticles', Optics Express, 17 (4), 2538-56.
--- (2009b), 'Plasmonic nanoparticle-generated photothermal bubbles and their
biomedical applications', Nanomedicine, 4 (7), 813-45.
--- (2009c), 'Pulsed photothermal heating of the media during bubble generation around
gold nanoparticles', International Journal of Heat and Mass Transfer, 52 (5-6), 1540-43.
Lapotko, Dmitri, et al. (2006b), 'Method of laser activated nano-thermolysis for
elimination of tumor cells', Cancer Letters, 239 (1), 36-45.
107
Lee, Cheng-Kuang, et al. (2010), 'Characterizing the localized surface plasmon resonance behaviors of Au nanorings and tracking their diffusion in bio-tissue with optical coherence tomography', Biomedical optics express, 1 (4), 1060-74.
Letfullin, R. R, et al. (2006), 'Laser-induced explosion of gold nanoparticles: potential
role for nanophotothermolysis of cancer', Nanomedicine, 1, 473 - 80.
Lewinski, N, Colvin, V, and Drezek, R (2008), 'Cytotoxicity of nanoparticles', Small, 4,
26 - 49.
Li, Zhiming, et al. (2009), 'RGD-conjugated dendrimer-modified gold nanorods for in
vivo tumor targeting and photothermal therapy†', Molecular Pharmaceutics, 7 (1), 94-104.
Lim, Yong Taik, et al. (2003), 'Selection of quantum dot wavelengths for biomedical
assays and imaging', Molecular imaging, 2 (1), 50-64.
Lombard, Julien, Biben, Thierry, and Merabia, Samy (2014), 'Kinetics of nanobubble
generation around overheated nanoparticles', Physical review letters, 112 (10), 105701.
Loo, Christopher, et al. (2005), 'Immunotargeted nanoshells for integrated cancer
imaging and therapy', Nano letters, 5 (4), 709-11.
Loo, Christopher, et al. (2004), 'Nanoshell-enabled photonics-based imaging and
therapy of cancer', Technology in cancer research & treatment, 3 (1), 33-40.
Lukianova-Hleb, E. Y. and Lapotko, D. O. (2014), 'Nano-Theranostics With Plasmonic
Nanobubbles', Ieee Journal of Selected Topics in Quantum Electronics, 20 (3), 12.
Lukianova-Hleb, E. Y., et al. (2012a), 'Plasmonic Nanobubbles Rapidly Detect and
Destroy Drug-Resistant Tumors', Theranostics, 2 (10), 976-87.
Lukianova-Hleb, Ekaterina, et al. (2010), 'Plasmonic nanobubbles as transient vapor
nanobubbles generated around plasmonic nanoparticles', ACS nano, 4 (4), 2109-23.

108
Lukianova-Hleb, Ekaterina Y., et al. (2011), 'Selective and Self-Guided Micro-Ablation of Tissue with Plasmonic Nanobubbles', Journal of Surgical Research, 166 (1), e3-e13.
Lukianova-Hleb, Ekaterina Y., et al. (2012b), 'Plasmonic nanobubble-enhanced
endosomal escape processes for selective and guided intracellular delivery of chemotherapy to drug-resistant cancer cells', Biomaterials, 33 (6), 1821-26.
Mackey, Megan A, et al. (2013), 'Inducing cancer cell death by targeting its nucleus:
solid gold nanospheres versus hollow gold nanocages', Bioconjugate chemistry, 24 (6), 897-906.
Mahmoud, MA, Snyder, B, and El-Sayed, MA (2010), 'Surface plasmon fields and
coupling in the hollow gold nanoparticles and surface-enhanced Raman spectroscopy. theory and experiment†', The Journal of Physical Chemistry C, 114 (16), 7436-43.
Mahmoud, Mahmoud A and El-Sayed, Mostafa A (2010), 'Gold nanoframes: Very high
surface plasmon fields and excellent near-infrared sensors', Journal of the American Chemical Society, 132 (36), 12704-10.
Martin, Charles R (1994), 'Nanomaterials--a membrane-based synthetic approach',
(DTIC Document).
--- (1996), 'Membrane-based synthesis of nanomaterials', Chemistry of Materials, 8 (8),
1739-46.
Moon, H. K., Lee, S. H., and Choi, H. C. (2009), 'In Vivo Near-Infrared Mediated Tumor
Destruction by Photothermal Effect of Carbon Nanotubes', Acs Nano, 3 (11), 3707-13.
Murphy, Catherine J, et al. (2005), 'Anisotropic metal nanoparticles: synthesis,
assembly, and optical applications', The Journal of Physical Chemistry B, 109 (29), 13857-70.
Myroshnychenko, Viktor, et al. (2008), 'Modelling the optical response of gold
nanoparticles', Chemical Society Reviews, 37 (9), 1792-805.

109
O'Neal, D Patrick, et al. (2004), 'Photo-thermal tumor ablation in mice using near infrared-absorbing nanoparticles', Cancer letters, 209 (2), 171-76.
Oldenburg, A. L, et al. (2006), 'Plasmon-resonant gold nanorods as low backscattering
albedo contrast agents for optical coherence tomography', Opt. Express, 14, 6724 - 38.
Pattamatta, A. and Madnia, C. K. (2010), 'Modeling Carrier-Phonon Nonequilibrium Due
to Pulsed Laser Interaction With Nanoscale Silicon Films', Journal of Heat Transfer-Transactions of the Asme, 132 (8).
Peer, Dan, et al. (2007), 'Nanocarriers as an emerging platform for cancer therapy',
Nature nanotechnology, 2 (12), 751-60.
Pérez-Juste, Jorge, et al. (2005), 'Gold nanorods: synthesis, characterization and
applications', Coordination Chemistry Reviews, 249 (17), 1870-901.
Petrova, H., et al. (2006), 'On the temperature stability of gold nanorods: comparison
between thermal and ultrafast laser-induced heating', Physical Chemistry Chemical Physics, 8 (7), 814-21.
Pitsillides, C. M, et al. (2003), 'Selective cell targeting with light-absorbing microparticles
and nanoparticles', Biophys. J., 84, 4023 - 32.
Pustovalov, Viktor K (2005), 'Theoretical study of heating of spherical nanoparticle in
media by short laser pulses', Chemical Physics, 308 (1), 103-08.
Pustovalov, VK, Smetannikov, AS, and Zharov, VP (2008), 'Photothermal and
accompanied phenomena of selective nanophotothermolysis with gold nanoparticles and laser pulses', Laser Physics Letters, 5 (11), 775.
Reetz, Manfred T and Helbig, Wolfgang (1994), 'Size-selective synthesis of
nanostructured transition metal clusters', Journal of the American Chemical Society, 116 (16), 7401-02.
Roper, D. K., Ahn, W., and Hoepfner, M. (2007), 'Microscale heat transfer transduced
by surface plasmon resonant gold nanoparticles', Journal of Physical Chemistry C, 111 (9), 3636-41.

110
Schultz, S, et al. (2000), 'Single-target molecule detection with nonbleaching multicolor
optical immunolabels', Proc. Natl Acad. Sci., 97, 996 - 1001.
Singh, N. (2010), 'TWO-TEMPERATURE MODEL OF NONEQUILIBRIUM ELECTRON
RELAXATION: A REVIEW', International Journal of Modern Physics B, 24 (9), 1141-58.
Skrabalak, Sara E, et al. (2007), 'Gold nanocages for biomedical applications',
Advanced Materials, 19 (20), 3177-84.
Sonnichsen, C, et al. (2002), 'Drastic reduction of plasmon damping in gold nanorods',
Phys. Rev. Lett., 88, 077402.
Sun, Y. G. and Xia, Y. N. (2003a), 'Alloying and dealloying processes involved in the
preparation of metal nanoshells through a galvanic replacement reaction', Nano Letters, 3 (11), 1569-72.
Sun, Yugang and Xia, Younan (2003b), 'Triangular nanoplates of silver: synthesis,
characterization, and use as sacrificial templates for generating triangular nanorings of gold', Advanced Materials, 15 (9), 695-99.
Turkevich, John, Stevenson, Peter Cooper, and Hillier, James (1951), 'A study of the
nucleation and growth processes in the synthesis of colloidal gold', Discussions of the Faraday Society, 11, 55-75.
van de Hulst, H. C. (1981), Scattering of Light by Small Particles (New York: Dover
Publications Inc.).
Van der Zande, Bianca MI, et al. (1997), 'Aqueous gold sols of rod-shaped particles',
The Journal of Physical Chemistry B, 101 (6), 852-54.
Vogel, Alfred, et al. (2008), 'Femtosecond-laser-induced nanocavitation in water:
implications for optical breakdown threshold and cell surgery', Physical review letters, 100 (3), 038102.
Volkov, Alexey N, Sevilla, Carlos, and Zhigilei, Leonid V (2007), 'Numerical modeling of
short pulse laser interaction with Au nanoparticle surrounded by water', Applied Surface Science, 253 (15), 6394-99.
111
von Maltzahn, Geoffrey, et al. (2009), 'Computationally guided photothermal tumor
therapy using long-circulating gold nanorod antennas', Cancer research, 69 (9), 3892-900.
Wan, Dehui, et al. (2013), 'Robust synthesis of gold cubic nanoframes through a
combination of galvanic replacement, gold deposition, and silver dealloying', Small, 9 (18), 3111-17.
Wang, H, et al. (2005), 'In vitro and in vivo two-photon luminescence imaging of single
gold nanorods', Proc. Natl Acad. Sci. USA, 102, 15752 – 56.
Wang, Yucai, et al. (2013), 'Comparison study of gold nanohexapods, nanorods, and
nanocages for photothermal cancer treatment', ACS nano, 7 (3), 2068-77.
Wang, ZL (2000), 'Transmission electron microscopy of shape-controlled nanocrystals
and their assemblies', The Journal of Physical Chemistry B, 104 (6), 1153-75.
Xia, Younan, et al. (1999), 'Unconventional methods for fabricating and patterning
nanostructures', Chemical reviews, 99 (7), 1823-48.
Xiong, Wei, et al. (2014), 'Plasmonic caged gold nanorods for near-infrared light
controlled drug delivery', Nanoscale, 6, 14388-93.
Yakunin, Alexander N, Avetisyan, Yuri A, and Tuchin, Valery V (2015), 'Quantification of
laser local hyperthermia induced by gold plasmonic nanoparticles', Journal of biomedical optics, 20 (5), 051030-30.
Yan, F. and Goedel, W. A. (2005), 'The preparation of mesoscopic rings in colloidal
crystal templates', Angewandte Chemie-International Edition, 44 (14), 2084-88.
Yavuz, M. S., et al. (2009), 'Gold nanocages covered by smart polymers for controlled
release with near-infrared light', Nature Materials, 8 (12), 935-39.
Yu, Yu-Ying, et al. (1997), 'Gold nanorods: electrochemical synthesis and optical
properties', The Journal of Physical Chemistry B, 101 (34), 6661-64.

112
Yuan, Hsiangkuo, Fales, Andrew M, and Vo-Dinh, Tuan (2012), 'TAT peptide-functionalized gold nanostars: enhanced intracellular delivery and efficient NIR photothermal therapy using ultralow irradiance', Journal of the American Chemical Society, 134 (28), 11358-61.
Zheng, X. H., et al. (2012), 'Enhanced Tumor Treatment Using Biofunctional
Indocyanine Green-Containing Nanostructure by Intratumoral or Intravenous Injection', Molecular Pharmaceutics, 9 (3), 514-22.
Zinchenko, A. A., Yoshikawa, K., and Baigl, D. (2005), 'DNA-templated silver
nanorings', Advanced Materials, 17 (23), 2820-+.