compstat weekly analysis
TRANSCRIPT
of Nashville and Davidson County
METROPOLITAN POLICE DEPARTMENT
COMPSTAT WEEKLY ANALYSIS
Begin Date: End Date:
COMPSTAT WEEKLY ANALYSIS: Is provided by the MNPD Crime Analysis Section. This document does not reflect official UCR counts. This document is intended to be a management tool and is for LAW ENFORCEMENT USE ONLY.
"Bite off more than you can chew, then chew it." - Ella Williams
Week:
of Nashville and Davidson County
METROPOLITAN POLICE DEPARTMENT
PRECINCT MAPS
Begin Date End Date
COMPSTAT WEEKLY ANALYSIS: Is provided by the MNPD Crime Analysis Section. This document does not reflect official UCR counts. This document is intended to be a management tool and is for LAW ENFORCEMENT USE ONLY.
METROPOLITAN POLICE DEPARTMENT
of Nashville and Davidson County
AUTO THEFT RECOVERY LINES
of Nashville and Davidson County
METROPOLITAN POLICE DEPARTMENT
UCR PART-ONE OFFENSES REPORTED TO POLICE
(Incident Reports)
Begin Date End Date
COMPSTAT WEEKLY ANALYSIS: Is provided by the MNPD Crime Analysis Section. This document does not reflect official UCR counts. This document is intended to be a management tool and is for LAW ENFORCEMENT USE ONLY.
Begin Date End Date
Prior Week
Last Week
Difference % Change
Prior 4Wks
Last 4Wks
Difference % Change
Prior YTD
YTD Difference % Change
Prior 52Wk
Last 52Wk
Difference % Change
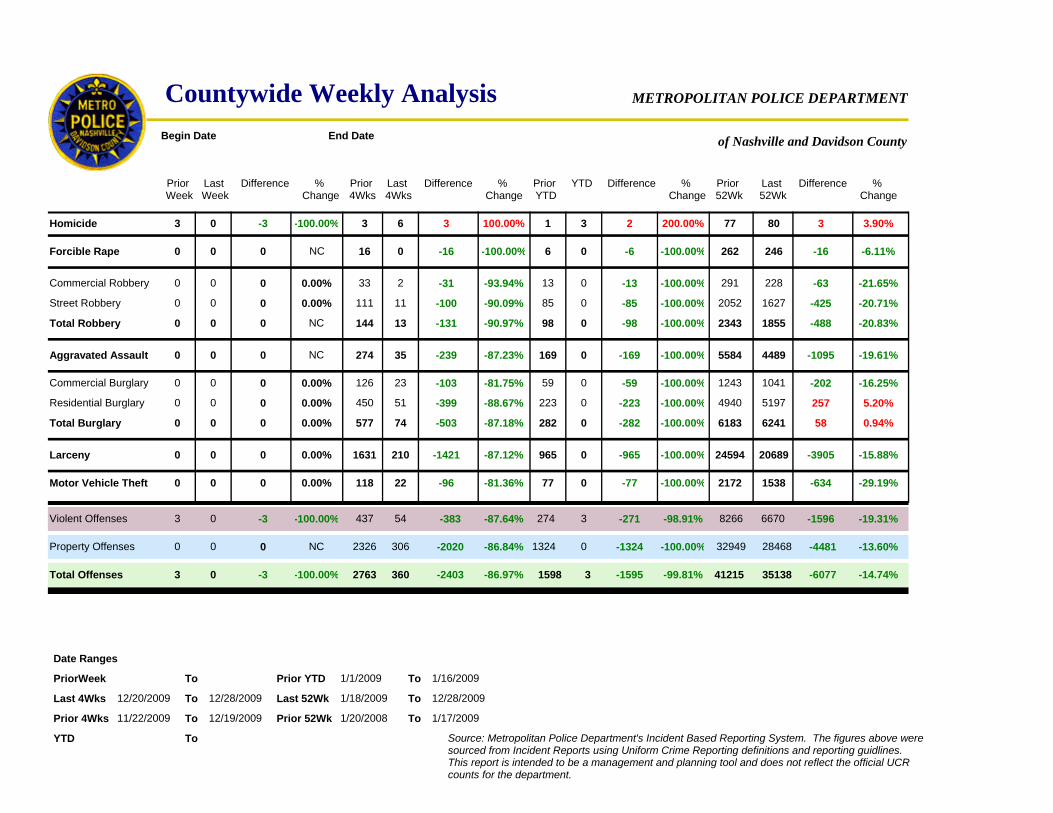
Countywide Weekly Analysis
of Nashville and Davidson County
METROPOLITAN POLICE DEPARTMENT
3
0
0
0
0
0
0
0
0
0
0
0
0
0
0
0
0
0
0
0
0
Homicide
Forcible Rape
Total Robbery
Aggravated Assault
Commercial Burglary
Residential Burglary
Total Burglary
Commercial Robbery
Street Robbery
Larceny
Motor Vehicle Theft
0
-3
0
0
0
0
0
0
0
0
0
0
-100.00%
NC
NC
NC
0.00%
0.00%
0.00%
0.00%
0.00%
0.00%
0.00%
3
16
144
274
126
450
577
33
111
1631
118
6
0
13
35
23
51
74
2
11
22
210
3
-16
-131
-239
-103
-399
-503
-31
-100
-1421
-96
100.00%
-100.00%
-90.97%
-87.23%
-81.75%
-88.67%
-87.18%
-93.94%
-90.09%
-87.12%
-81.36%
1
6
98
169
59
223
282
13
85
965
77
3
0
0
0
0
0
0
0
0
0
0
2
-6
-98
-169
-59
-223
-282
-13
-85
-965
-77
200.00%
-100.00%
-100.00%
-100.00%
-100.00%
-100.00%
-100.00%
-100.00%
-100.00%
-100.00%
-100.00%
77
262
2343
5584
1243
4940
6183
291
2052
24594
2172
80
246
1855
4489
1041
5197
6241
228
1627
1538
20689
3
-16
-488
-1095
-202
257
58
-63
-425
-3905
-634
3.90%
-6.11%
-20.83%
-19.61%
-16.25%
5.20%
0.94%
-21.65%
-20.71%
-15.88%
-29.19%
Total Offenses 3 0 -3 -100.00% 2763 360 -2403 -86.97% 1598 3 -1595 -99.81% 41215 35138 -6077 -14.74%
Property Offenses 0 0 0 NC 2326 306 -2020 -86.84% 1324 0 -1324 -100.00% 32949 28468 -4481 -13.60%
3Violent Offenses 0 -3 -100.00% 437 54 -383 -87.64% 274 3 -271 -98.91% 8266 6670 -1596 -19.31%
PriorWeek To
Date Ranges
Last 4Wks 12/20/2009 To 12/28/2009
Prior 4Wks 11/22/2009 To 12/19/2009
Prior YTD 1/1/2009 To 1/16/2009
Last 52Wk 1/18/2009 To 12/28/2009
Prior 52Wk 1/20/2008 To 1/17/2009
YTD To Source: Metropolitan Police Department's Incident Based Reporting System. The figures above were sourced from Incident Reports using Uniform Crime Reporting definitions and reporting guidlines. This report is intended to be a management and planning tool and does not reflect the official UCR counts for the department.

2 Wk, 8 Wk, 16 Wk, YTD, and 24 Mon Summary
of Nashville and Davidson County
METROPOLITAN POLICE DEPARTMENT
Violent Property Total
Rolling Two Week
Violent Property
Rolling Eight Week
Total
Rolling Sixteen Week
Violent Property Total
YTD
Violent Property Total
Last Week to Prior Week Last 4 Weeks to Prior 4 Weeks Last 8 Weeks to Prior 8 Weeks Current YTD to Prior YTDRolling Twenty-Four Month
Violent Property Total
Last 52 Wks to Prior 52 Wks
1 0 483 5701 870 0 43 580 15
0 0 238 3260 88
0 0 446 5020 56
1 0 540 6261 86
0 0 133 1540 21
1 0 486 5851 99
3 0 2326 27633 4370 0 306 3600 54
0 0 12 170 5
0 0 13 170 4
0 0 79 930 14
0 0 69 760 7
0 0 90 990 9
East
West
North
South
Central
Hermitage
County
NC NC -94.96% -94.79%NC -94.32%
PriorLast
% Change
PriorLast
% Change
PriorLast
% Change
PriorLast
% Change
PriorLast
% Change
PriorLast
% Change
PriorLast
% Change
NC NC -79.82% -80.28%NC -83.93%
-100.00% NC -91.10% -89.82%-100.00% -82.76%
-100.00% NC -87.22% -87.86%-100.00% -91.86%
NC NC -90.23% -88.96%NC -80.95%
-100.00% NC -83.74% -84.10%-100.00% -85.86%
-100.00% NC -86.84% -86.97%-100.00% -87.64%
982 1240258526 627101
498 670172
884 1025141
1309 1489180
321 39978
1041 1203162
5035 60269912632 3119487
250 34393
146 17125
565 677112
609 70091
536 60165
-49.80% -48.81%-45.93%
-39.37% -41.37%-53.90%
-46.44% -49.44%-60.85%
-53.48% -52.99%-49.44%
-54.52% -57.14%-67.95%
-45.73% -43.72%-30.86%
-47.73% -48.24%-50.86%
272 342700 11
116 14125
234 27440
369 44475
77 9013
256 30953
1324 16002760 33
0 00
0 00
0 11
0 11
0 00
-100.00% -100.00%-100.00%
-100.00% -100.00%-100.00%
-100.00% -99.71%-98.57%
-100.00% -99.77%-98.67%
-100.00% -100.00%-100.00%
-100.00% -99.68%-98.11%
-100.00% -99.81%-98.91%
3454 491714633136 44101274-9.21% -10.31%-12.92%
5890 695810685315 6143828-9.76% -11.71%-22.47%
6837 895921225779 74711692
-15.47% -16.61%-20.26%
7972 973917676868 81811313
-13.85% -16.00%-25.69%
2203 27455421781 2200419
-19.16% -19.85%-22.69%
6593 789713045589 67331144
-15.23% -14.74%-12.27%
32949 41215826628468 351386670-13.60% -14.74%-19.31%
Source: Metropolitan Police Department's Incident Based Reporting System. The figures above were sourced from Incident Reports using Uniform Crime Reporting definitions and reporting guidlines. This report is intended to be a management and planning tool and does not reflect the official UCR counts for the department.

Rolling Two Week Analysisof Nashville and Davidson County
METROPOLITAN POLICE DEPARTMENT
Homicide Forcible Rape
Total Robbery
Aggravated Assault
Commercial Burglary
Residential Burglary
Total Burglary
Larceny Motor Vehicle Theft
Violent Offenses
Property Offenses
Total Offenses
Commercial Robbery
Street Robbery
1 0 0 0 0 0 00 0 0 00 0 0 0 0 0 00 0 00
0 0 0 0 0 0 00 0 0 0
0 0 0 0 0 0 00 0 0 0
1 0 0 0 0 0 00 0 0 0
0 0 0 0 0 0 00 0 0 0
1 0 0 0 0 0 00 0 0 0
3 0 0 0 0 0 00 0 0 00 0 0 0 0 0 00 0 00
0 0 0 0 0 0 00 0 00
0 0 0 0 0 0 00 0 00
0 0 0 0 0 0 00 0 00
0 0 0 0 0 0 00 0 00
0 0 0 0 0 0 00 0 00
East
West
North
South
Central
Hermitage
County
NC NC NC NC NC NC NCNC NC NCNC
Prior WeekLast Week% Change
Prior WeekLast Week% Change
Prior WeekLast Week% Change
Prior WeekLast Week% Change
Prior WeekLast Week% Change
Prior WeekLast Week% Change
Prior WeekLast Week% Change
NC NC NC NC NC NC NCNC NC NCNC
-100.00% NC NC NC NC NC NCNC NC NCNC
-100.00% NC NC NC NC NC NCNC NC NCNC
NC NC NC NC NC NC NCNC NC NCNC
-100.00% NC NC NC NC NC NCNC NC NCNC
-100.00% NC NC NC NC NC NCNC NC NCNC
10
0
0
1
0
1
30
0
0
0
0
0
NC
NC
-100.00%
-100.00%
NC
-100.00%
-100.00%
00
0
0
0
0
0
00
0
0
0
0
0
NC
NC
NC
NC
NC
NC
NC
10
0
0
1
0
1
30
0
0
0
0
0
NC
NC
-100.00%
-100.00%
NC
-100.00%
-100.00%
Begin Date End Date
Begin Date End DatePrior Week
Last Week
Source: Metropolitan Police Department's Incident Based Reporting System. The figures above were sourced from Incident Reports using Uniform Crime Reporting definitions and reporting guidlines. This report is intended to be a management and planning tool and does not reflect the official UCR counts for the department.
of Nashville and Davidson County
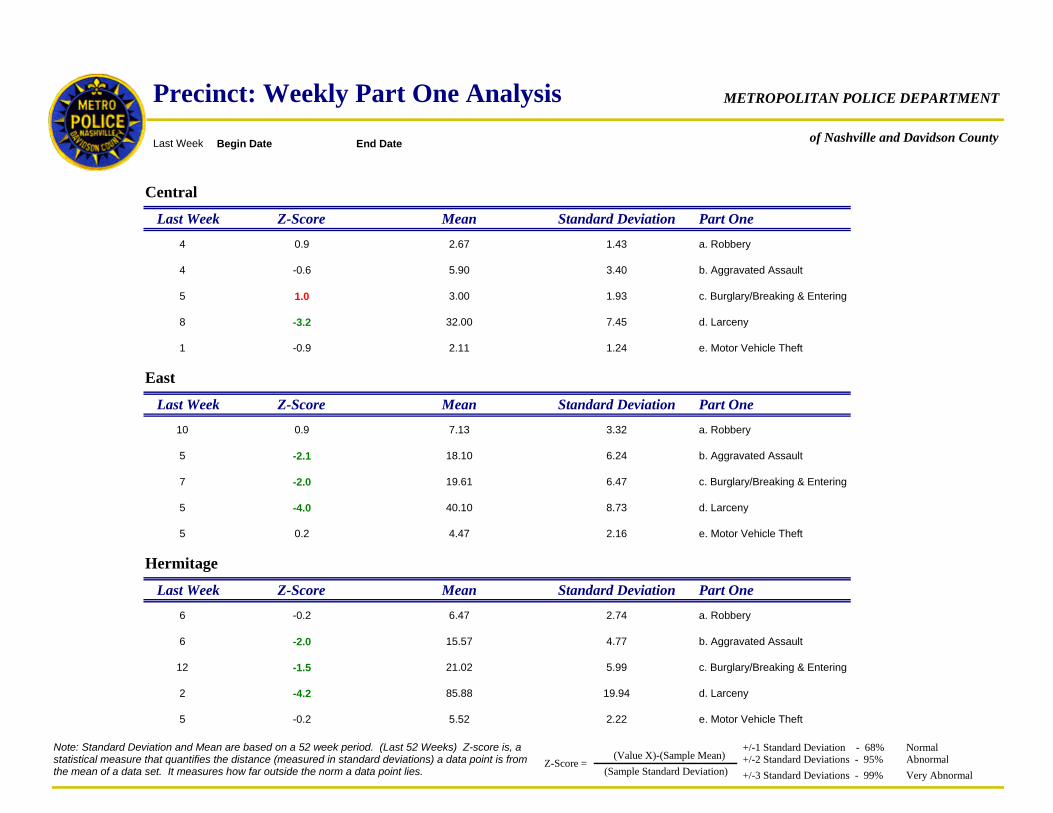
METROPOLITAN POLICE DEPARTMENTPrecinct: Weekly Part One Analysis
Begin Date End DateLast Week
Central
Last Week Z-Score Mean Standard Deviation Part One
4 0.9 2.67 1.43 a. Robbery
4 -0.6 5.90 3.40 b. Aggravated Assault
5 1.0 3.00 1.93 c. Burglary/Breaking & Entering
8 -3.2 32.00 7.45 d. Larceny
1 -0.9 2.11 1.24 e. Motor Vehicle Theft
East
Last Week Z-Score Mean Standard Deviation Part One
10 0.9 7.13 3.32 a. Robbery
5 -2.1 18.10 6.24 b. Aggravated Assault
7 -2.0 19.61 6.47 c. Burglary/Breaking & Entering
5 -4.0 40.10 8.73 d. Larceny
5 0.2 4.47 2.16 e. Motor Vehicle Theft
Hermitage
Last Week Z-Score Mean Standard Deviation Part One
6 -0.2 6.47 2.74 a. Robbery
6 -2.0 15.57 4.77 b. Aggravated Assault
12 -1.5 21.02 5.99 c. Burglary/Breaking & Entering
2 -4.2 85.88 19.94 d. Larceny
5 -0.2 5.52 2.22 e. Motor Vehicle Theft
Note: Standard Deviation and Mean are based on a 52 week period. (Last 52 Weeks) Z-score is, a statistical measure that quantifies the distance (measured in standard deviations) a data point is from the mean of a data set. It measures how far outside the norm a data point lies.
(Value X)-(Sample Mean)+/-1 Standard Deviation - 68%+/-2 Standard Deviations - 95%+/-3 Standard Deviations - 99%(Sample Standard Deviation)
Z-Score = NormalAbnormalVery Abnormal
of Nashville and Davidson County
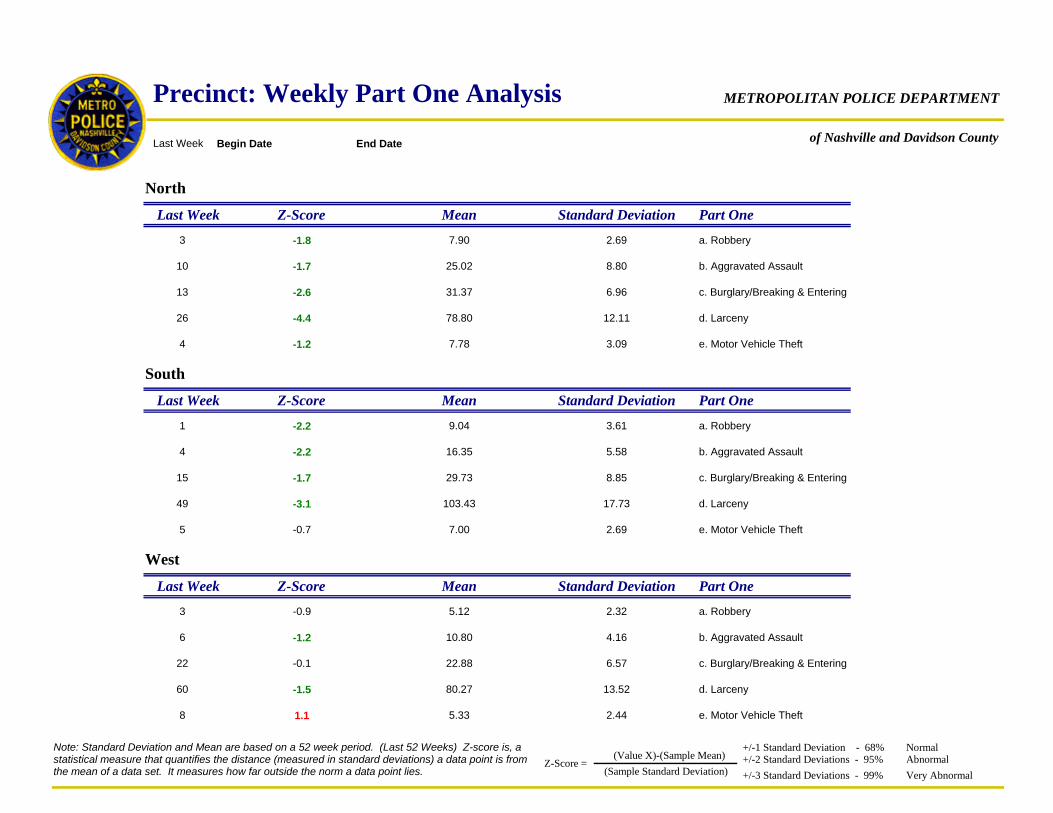
METROPOLITAN POLICE DEPARTMENTPrecinct: Weekly Part One Analysis
Begin Date End DateLast Week
North
Last Week Z-Score Mean Standard Deviation Part One
3 -1.8 7.90 2.69 a. Robbery
10 -1.7 25.02 8.80 b. Aggravated Assault
13 -2.6 31.37 6.96 c. Burglary/Breaking & Entering
26 -4.4 78.80 12.11 d. Larceny
4 -1.2 7.78 3.09 e. Motor Vehicle Theft
South
Last Week Z-Score Mean Standard Deviation Part One
1 -2.2 9.04 3.61 a. Robbery
4 -2.2 16.35 5.58 b. Aggravated Assault
15 -1.7 29.73 8.85 c. Burglary/Breaking & Entering
49 -3.1 103.43 17.73 d. Larceny
5 -0.7 7.00 2.69 e. Motor Vehicle Theft
West
Last Week Z-Score Mean Standard Deviation Part One
3 -0.9 5.12 2.32 a. Robbery
6 -1.2 10.80 4.16 b. Aggravated Assault
22 -0.1 22.88 6.57 c. Burglary/Breaking & Entering
60 -1.5 80.27 13.52 d. Larceny
8 1.1 5.33 2.44 e. Motor Vehicle Theft
Note: Standard Deviation and Mean are based on a 52 week period. (Last 52 Weeks) Z-score is, a statistical measure that quantifies the distance (measured in standard deviations) a data point is from the mean of a data set. It measures how far outside the norm a data point lies.
(Value X)-(Sample Mean)+/-1 Standard Deviation - 68%+/-2 Standard Deviations - 95%+/-3 Standard Deviations - 99%(Sample Standard Deviation)
Z-Score = NormalAbnormalVery Abnormal
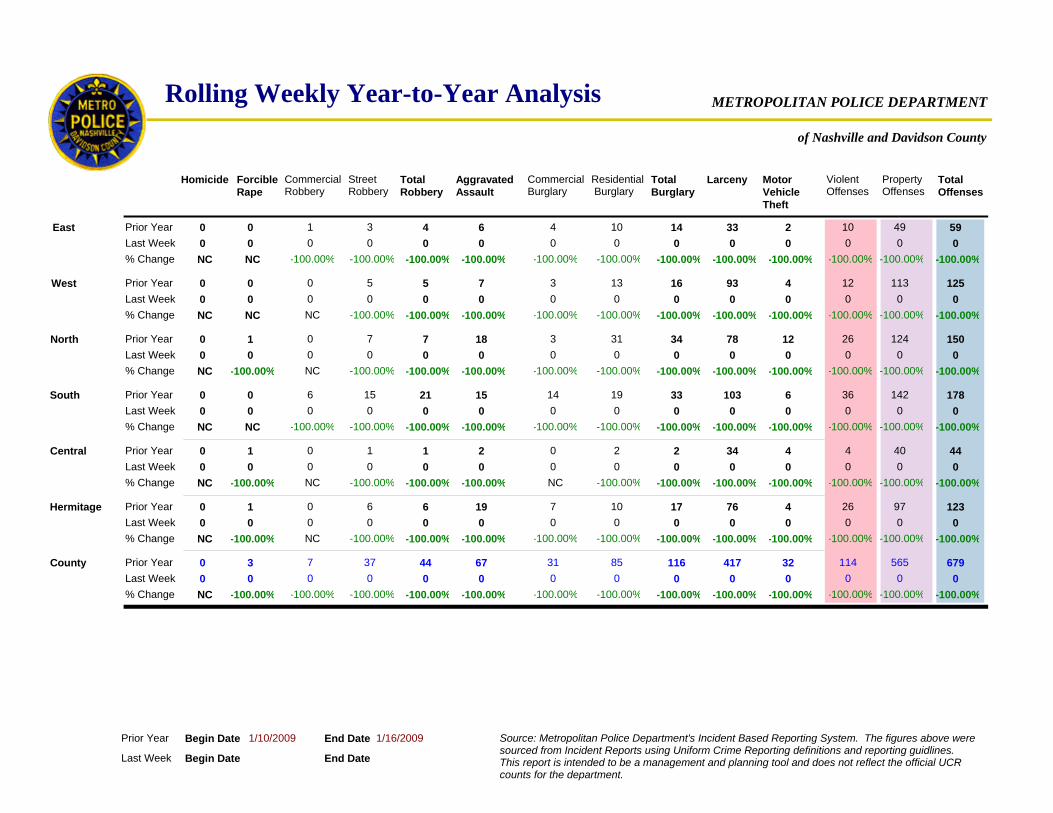
Rolling Weekly Year-to-Year Analysisof Nashville and Davidson County
METROPOLITAN POLICE DEPARTMENT
Homicide Forcible Rape
Total Robbery
Aggravated Assault
Commercial Burglary
Residential Burglary
Total Burglary
Larceny Motor Vehicle Theft
Violent Offenses
Property Offenses
Total Offenses
Commercial Robbery
Street Robbery
0 1 7 18 3 31 340 7 78 120 0 0 0 0 0 00 0 00
0 0 4 6 4 10 141 3 33 2
0 0 5 7 3 13 160 5 93 4
0 0 21 15 14 19 336 15 103 6
0 1 1 2 0 2 20 1 34 4
0 1 6 19 7 10 170 6 76 4
0 3 44 67 31 85 1167 37 417 320 0 0 0 0 0 00 0 00
0 0 0 0 0 0 00 0 00
0 0 0 0 0 0 00 0 00
0 0 0 0 0 0 00 0 00
0 0 0 0 0 0 00 0 00
0 0 0 0 0 0 00 0 00
East
West
North
South
Central
Hermitage
County
NC NC -100.00% -100.00% -100.00% -100.00% -100.00%-100.00% -100.00% -100.00%-100.00%
Prior YearLast Week% Change
Prior YearLast Week% Change
Prior YearLast Week% Change
Prior YearLast Week% Change
Prior YearLast Week% Change
Prior YearLast Week% Change
Prior YearLast Week% Change
NC NC -100.00% -100.00% -100.00% -100.00% -100.00%NC -100.00% -100.00%-100.00%
NC -100.00% -100.00% -100.00% -100.00% -100.00% -100.00%NC -100.00% -100.00%-100.00%
NC NC -100.00% -100.00% -100.00% -100.00% -100.00%-100.00% -100.00% -100.00%-100.00%
NC -100.00% -100.00% -100.00% NC -100.00% -100.00%NC -100.00% -100.00%-100.00%
NC -100.00% -100.00% -100.00% -100.00% -100.00% -100.00%NC -100.00% -100.00%-100.00%
NC -100.00% -100.00% -100.00% -100.00% -100.00% -100.00%-100.00% -100.00% -100.00%-100.00%
260
10
12
36
4
26
1140
0
0
0
0
0
-100.00%
-100.00%
-100.00%
-100.00%
-100.00%
-100.00%
-100.00%
1240
49
113
142
40
97
5650
0
0
0
0
0
-100.00%
-100.00%
-100.00%
-100.00%
-100.00%
-100.00%
-100.00%
1500
59
125
178
44
123
6790
0
0
0
0
0
-100.00%
-100.00%
-100.00%
-100.00%
-100.00%
-100.00%
-100.00%
Begin Date End Date
Begin Date 1/10/2009 End Date 1/16/2009Prior Year
Last Week
Source: Metropolitan Police Department's Incident Based Reporting System. The figures above were sourced from Incident Reports using Uniform Crime Reporting definitions and reporting guidlines. This report is intended to be a management and planning tool and does not reflect the official UCR counts for the department.
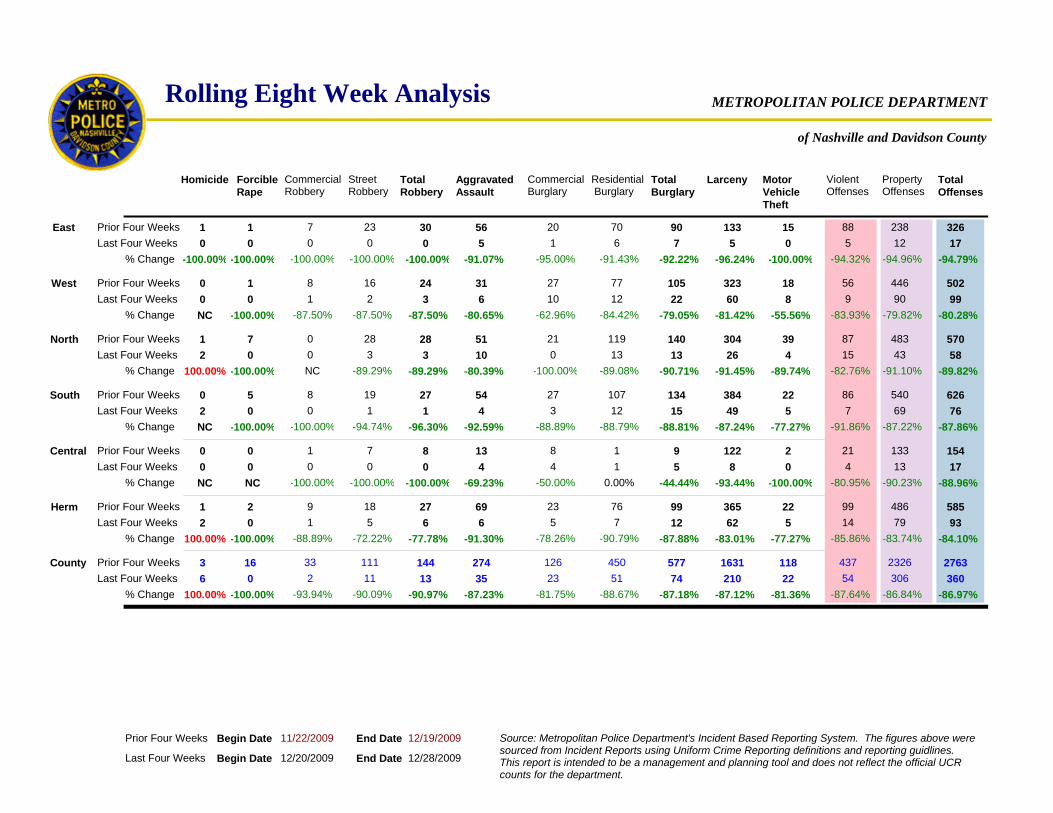
Rolling Eight Week Analysisof Nashville and Davidson County
METROPOLITAN POLICE DEPARTMENT
Homicide Forcible Rape
Total Robbery
Aggravated Assault
Commercial Burglary
Residential Burglary
Total Burglary
Larceny Motor Vehicle Theft
Violent Offenses
Property Offenses
Total Offenses
Commercial Robbery
Street Robbery
1 7 28 51 21 119 1400 28 304 392 0 3 10 0 13 130 3 426
1 1 30 56 20 70 907 23 133 15
0 1 24 31 27 77 1058 16 323 18
0 5 27 54 27 107 1348 19 384 22
0 0 8 13 8 1 91 7 122 2
1 2 27 69 23 76 999 18 365 22
3 16 144 274 126 450 57733 111 1631 1186 0 13 35 23 51 742 11 22210
0 0 0 5 1 6 70 0 05
0 0 0 4 4 1 50 0 08
2 0 6 6 5 7 121 5 562
2 0 1 4 3 12 150 1 549
0 0 3 6 10 12 221 2 860
East
West
North
South
Central
Herm
County
-100.00% -100.00% -100.00% -91.07% -95.00% -91.43% -92.22%-100.00% -100.00% -100.00%-96.24%
NC -100.00% -87.50% -80.65% -62.96% -84.42% -79.05%-87.50% -87.50% -55.56%-81.42%
100.00% -100.00% -89.29% -80.39% -100.00% -89.08% -90.71%NC -89.29% -89.74%-91.45%
NC -100.00% -96.30% -92.59% -88.89% -88.79% -88.81%-100.00% -94.74% -77.27%-87.24%
NC NC -100.00% -69.23% -50.00% 0.00% -44.44%-100.00% -100.00% -100.00%-93.44%
100.00% -100.00% -77.78% -91.30% -78.26% -90.79% -87.88%-88.89% -72.22% -77.27%-83.01%
100.00% -100.00% -90.97% -87.23% -81.75% -88.67% -87.18%-93.94% -90.09% -81.36%-87.12%
8715
88
56
86
21
99
43754
5
4
14
7
9
-94.32%
-83.93%
-82.76%
-91.86%
-80.95%
-85.86%
-87.64%
48343
238
446
540
133
486
2326306
12
13
79
69
90
-94.96%
-79.82%
-91.10%
-87.22%
-90.23%
-83.74%
-86.84%
57058
326
502
626
154
585
2763360
17
17
93
76
99
-94.79%
-80.28%
-89.82%
-87.86%
-88.96%
-84.10%
-86.97%
Prior Four WeeksLast Four Weeks
% Change
Prior Four WeeksLast Four Weeks
% Change
Prior Four WeeksLast Four Weeks
% Change
Prior Four WeeksLast Four Weeks
% Change
Prior Four WeeksLast Four Weeks
% Change
Prior Four WeeksLast Four Weeks
% Change
Prior Four WeeksLast Four Weeks
% Change
Source: Metropolitan Police Department's Incident Based Reporting System. The figures above were sourced from Incident Reports using Uniform Crime Reporting definitions and reporting guidlines. This report is intended to be a management and planning tool and does not reflect the official UCR counts for the department.
Begin Date 12/20/2009 End Date 12/28/2009
Begin Date 11/22/2009 End Date 12/19/2009Prior Four Weeks
Last Four Weeks
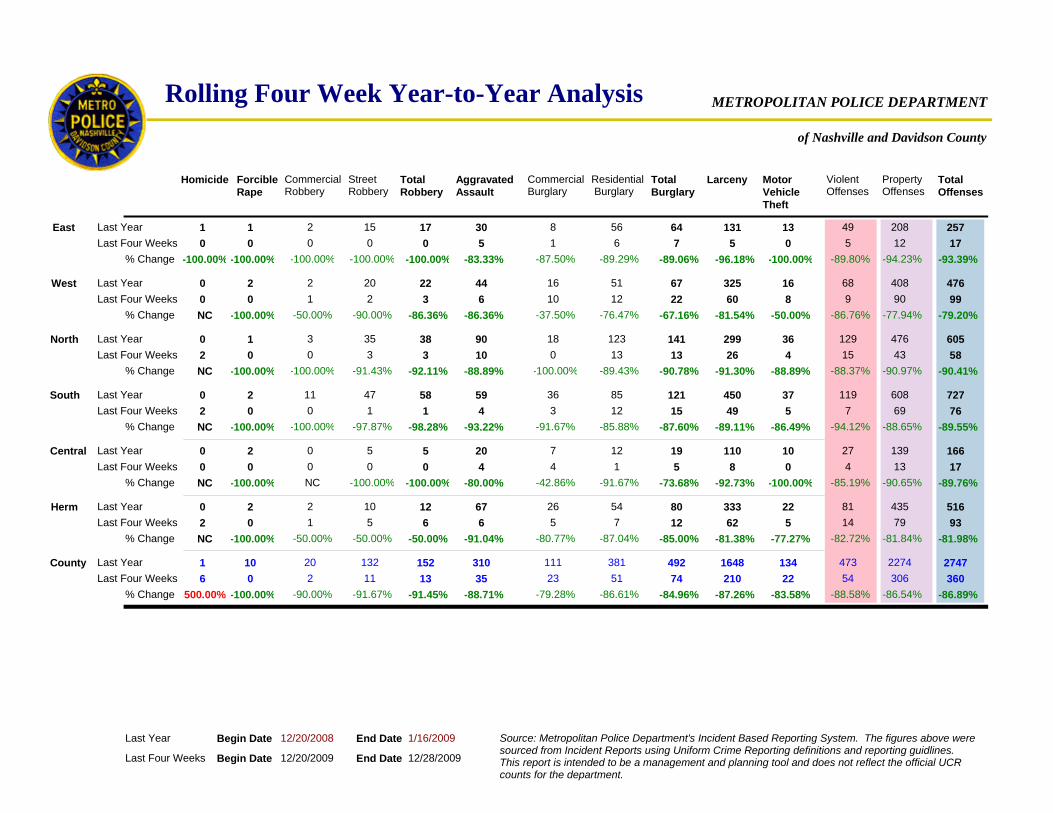
Rolling Four Week Year-to-Year Analysisof Nashville and Davidson County
METROPOLITAN POLICE DEPARTMENT
Homicide Forcible Rape
Total Robbery
Aggravated Assault
Commercial Burglary
Residential Burglary
Total Burglary
Larceny Motor Vehicle Theft
Violent Offenses
Property Offenses
Total Offenses
Commercial Robbery
Street Robbery
0 1 38 90 18 123 1413 35 299 362 0 3 10 0 13 130 3 426
1 1 17 30 8 56 642 15 131 13
0 2 22 44 16 51 672 20 325 16
0 2 58 59 36 85 12111 47 450 37
0 2 5 20 7 12 190 5 110 10
0 2 12 67 26 54 802 10 333 22
1 10 152 310 111 381 49220 132 1648 1346 0 13 35 23 51 742 11 22210
0 0 0 5 1 6 70 0 05
0 0 0 4 4 1 50 0 08
2 0 6 6 5 7 121 5 562
2 0 1 4 3 12 150 1 549
0 0 3 6 10 12 221 2 860
East
West
North
South
Central
Herm
County
-100.00% -100.00% -100.00% -83.33% -87.50% -89.29% -89.06%-100.00% -100.00% -100.00%-96.18%
NC -100.00% -86.36% -86.36% -37.50% -76.47% -67.16%-50.00% -90.00% -50.00%-81.54%
NC -100.00% -92.11% -88.89% -100.00% -89.43% -90.78%-100.00% -91.43% -88.89%-91.30%
NC -100.00% -98.28% -93.22% -91.67% -85.88% -87.60%-100.00% -97.87% -86.49%-89.11%
NC -100.00% -100.00% -80.00% -42.86% -91.67% -73.68%NC -100.00% -100.00%-92.73%
NC -100.00% -50.00% -91.04% -80.77% -87.04% -85.00%-50.00% -50.00% -77.27%-81.38%
500.00% -100.00% -91.45% -88.71% -79.28% -86.61% -84.96%-90.00% -91.67% -83.58%-87.26%
12915
49
68
119
27
81
47354
5
4
14
7
9
-89.80%
-86.76%
-88.37%
-94.12%
-85.19%
-82.72%
-88.58%
47643
208
408
608
139
435
2274306
12
13
79
69
90
-94.23%
-77.94%
-90.97%
-88.65%
-90.65%
-81.84%
-86.54%
60558
257
476
727
166
516
2747360
17
17
93
76
99
-93.39%
-79.20%
-90.41%
-89.55%
-89.76%
-81.98%
-86.89%
Last YearLast Four Weeks
% Change
Last YearLast Four Weeks
% Change
Last YearLast Four Weeks
% Change
Last YearLast Four Weeks
% Change
Last YearLast Four Weeks
% Change
Last YearLast Four Weeks
% Change
Last YearLast Four Weeks
% Change
Source: Metropolitan Police Department's Incident Based Reporting System. The figures above were sourced from Incident Reports using Uniform Crime Reporting definitions and reporting guidlines. This report is intended to be a management and planning tool and does not reflect the official UCR counts for the department.
Begin Date 12/20/2009 End Date 12/28/2009
Begin Date 12/20/2008 End Date 1/16/2009Last Year
Last Four Weeks
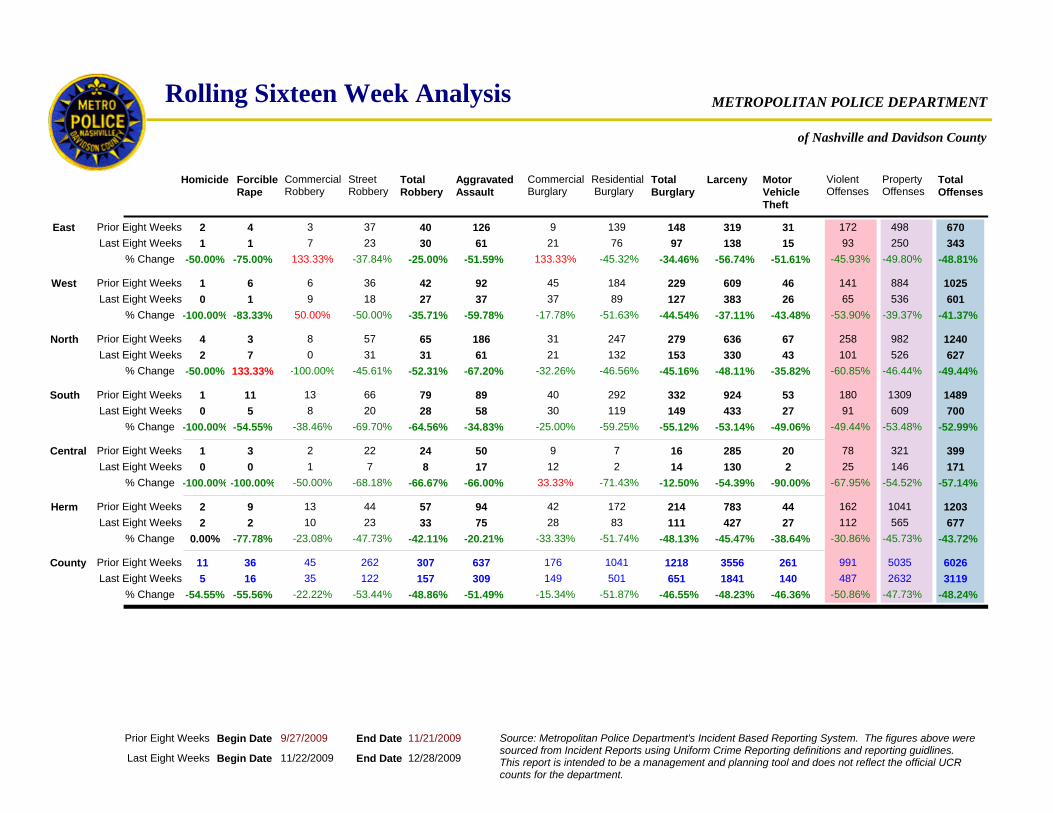
Rolling Sixteen Week Analysisof Nashville and Davidson County
METROPOLITAN POLICE DEPARTMENT
Homicide Forcible Rape
Total Robbery
Aggravated Assault
Commercial Burglary
Residential Burglary
Total Burglary
Larceny Motor Vehicle Theft
Violent Offenses
Property Offenses
Total Offenses
Commercial Robbery
Street Robbery
4 3 65 186 31 247 2798 57 636 672 7 31 61 21 132 1530 31 43330
2 4 40 126 9 139 1483 37 319 31
1 6 42 92 45 184 2296 36 609 46
1 11 79 89 40 292 33213 66 924 53
1 3 24 50 9 7 162 22 285 20
2 9 57 94 42 172 21413 44 783 44
11 36 307 637 176 1041 121845 262 3556 2615 16 157 309 149 501 65135 122 1401841
1 1 30 61 21 76 977 23 15138
0 0 8 17 12 2 141 7 2130
2 2 33 75 28 83 11110 23 27427
0 5 28 58 30 119 1498 20 27433
0 1 27 37 37 89 1279 18 26383
East
West
North
South
Central
Herm
County
-50.00% -75.00% -25.00% -51.59% 133.33% -45.32% -34.46%133.33% -37.84% -51.61%-56.74%
-100.00% -83.33% -35.71% -59.78% -17.78% -51.63% -44.54%50.00% -50.00% -43.48%-37.11%
-50.00% 133.33% -52.31% -67.20% -32.26% -46.56% -45.16%-100.00% -45.61% -35.82%-48.11%
-100.00% -54.55% -64.56% -34.83% -25.00% -59.25% -55.12%-38.46% -69.70% -49.06%-53.14%
-100.00% -100.00% -66.67% -66.00% 33.33% -71.43% -12.50%-50.00% -68.18% -90.00%-54.39%
0.00% -77.78% -42.11% -20.21% -33.33% -51.74% -48.13%-23.08% -47.73% -38.64%-45.47%
-54.55% -55.56% -48.86% -51.49% -15.34% -51.87% -46.55%-22.22% -53.44% -46.36%-48.23%
258101
172
141
180
78
162
991487
93
25
112
91
65
-45.93%
-53.90%
-60.85%
-49.44%
-67.95%
-30.86%
-50.86%
982526
498
884
1309
321
1041
50352632
250
146
565
609
536
-49.80%
-39.37%
-46.44%
-53.48%
-54.52%
-45.73%
-47.73%
1240627
670
1025
1489
399
1203
60263119
343
171
677
700
601
-48.81%
-41.37%
-49.44%
-52.99%
-57.14%
-43.72%
-48.24%
Prior Eight WeeksLast Eight Weeks
% Change
% Change
% Change
% Change
% Change
% Change
% Change
Prior Eight WeeksLast Eight Weeks
Prior Eight WeeksLast Eight Weeks
Prior Eight WeeksLast Eight Weeks
Prior Eight WeeksLast Eight Weeks
Prior Eight WeeksLast Eight Weeks
Prior Eight WeeksLast Eight Weeks
Source: Metropolitan Police Department's Incident Based Reporting System. The figures above were sourced from Incident Reports using Uniform Crime Reporting definitions and reporting guidlines. This report is intended to be a management and planning tool and does not reflect the official UCR counts for the department.
Begin Date 11/22/2009 End Date 12/28/2009
Begin Date 9/27/2009 End Date 11/21/2009Prior Eight Weeks
Last Eight Weeks

Rolling Eight Week Year-to-Year Analysisof Nashville and Davidson County
METROPOLITAN POLICE DEPARTMENT
Homicide Forcible Rape
Total Robbery
Aggravated Assault
Commercial Burglary
Residential Burglary
Total Burglary
Larceny Motor Vehicle Theft
Violent Offenses
Property Offenses
Total Offenses
Commercial Robbery
Street Robbery
4 4 92 162 42 276 3188 84 642 622 7 31 61 21 132 1530 31 43330
3 4 48 83 20 116 1364 44 259 33
1 4 39 99 45 99 1446 33 728 38
2 7 118 123 61 165 22621 97 944 77
0 3 14 39 11 18 290 14 254 20
1 6 35 109 43 133 1766 29 739 63
11 28 346 615 222 807 102945 301 3566 2935 16 157 309 149 501 65135 122 1401841
1 1 30 61 21 76 977 23 15138
0 0 8 17 12 2 141 7 2130
2 2 33 75 28 83 11110 23 27427
0 5 28 58 30 119 1498 20 27433
0 1 27 37 37 89 1279 18 26383
East
West
North
South
Central
Herm
County
-66.67% -75.00% -37.50% -26.51% 5.00% -34.48% -28.68%75.00% -47.73% -54.55%-46.72%
-100.00% -75.00% -30.77% -62.63% -17.78% -10.10% -11.81%50.00% -45.45% -31.58%-47.39%
-50.00% 75.00% -66.30% -62.35% -50.00% -52.17% -51.89%-100.00% -63.10% -30.65%-48.60%
-100.00% -28.57% -76.27% -52.85% -50.82% -27.88% -34.07%-61.90% -79.38% -64.94%-54.13%
NC -100.00% -42.86% -56.41% 9.09% -88.89% -51.72%NC -50.00% -90.00%-48.82%
100.00% -66.67% -5.71% -31.19% -34.88% -37.59% -36.93%66.67% -20.69% -57.14%-42.22%
-54.55% -42.86% -54.62% -49.76% -32.88% -37.92% -36.73%-22.22% -59.47% -52.22%-48.37%
262101
138
143
250
56
151
1000487
93
25
112
91
65
-32.61%
-54.55%
-61.45%
-63.60%
-55.36%
-25.83%
-51.30%
1022526
428
910
1247
303
978
48882632
250
146
565
609
536
-41.59%
-41.10%
-48.53%
-51.16%
-51.82%
-42.23%
-46.15%
1284627
566
1053
1497
359
1129
58883119
343
171
677
700
601
-39.40%
-42.92%
-51.17%
-53.24%
-52.37%
-40.04%
-47.03%
Last YearLast Eight Weeks
% Change
Last Year
% Change
Last Year
% Change
Last Year
% Change
Last Year
% Change
Last Year
% Change
Last Year
% Change
Last Eight Weeks
Last Eight Weeks
Last Eight Weeks
Last Eight Weeks
Last Eight Weeks
Last Eight Weeks
Source: Metropolitan Police Department's Incident Based Reporting System. The figures above were sourced from Incident Reports using Uniform Crime Reporting definitions and reporting guidlines. This report is intended to be a management and planning tool and does not reflect the official UCR counts for the department.
Begin Date 11/22/2009 End Date 12/28/2009
Begin Date 11/22/2008 End Date 1/16/2009Last Year
Last Eight Weeks
of Nashville and Davidson County
METROPOLITAN POLICE DEPARTMENT
Homicide Forcible Rape
Total Robbery
Aggravated Assault
Commercial Burglary
Residential Burglary
Total Burglary
Larceny Motor Vehicle Theft
Violent Offenses
Property Offenses
Total Offenses
Commercial Robbery
Street Robbery
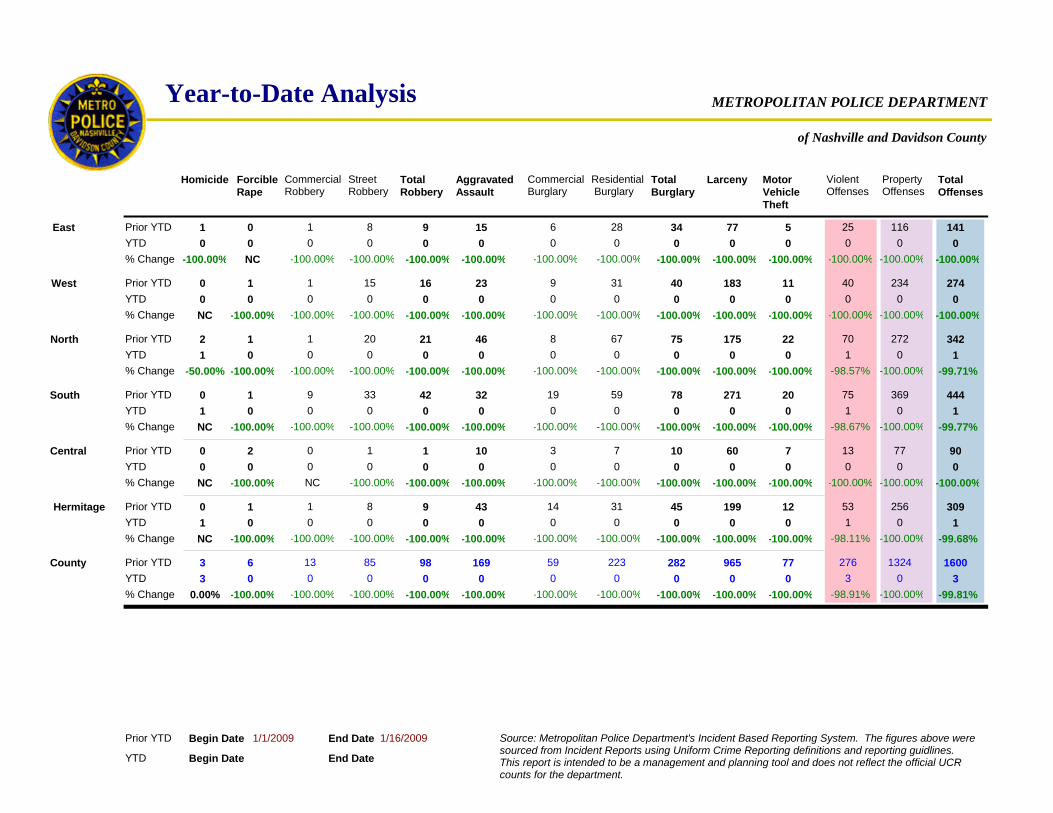
Year-to-Date Analysis
2 1 21 46 8 67 751 20 175 221 0 0 0 0 0 00 0 00
1 0 9 15 6 28 341 8 77 5
0 1 16 23 9 31 401 15 183 11
0 1 42 32 19 59 789 33 271 20
0 2 1 10 3 7 100 1 60 7
0 1 9 43 14 31 451 8 199 12
3 6 98 169 59 223 28213 85 965 773 0 0 0 0 0 00 0 00
0 0 0 0 0 0 00 0 00
0 0 0 0 0 0 00 0 00
1 0 0 0 0 0 00 0 00
1 0 0 0 0 0 00 0 00
0 0 0 0 0 0 00 0 00
East
West
North
South
Hermitage
County
-100.00% NC -100.00% -100.00% -100.00% -100.00% -100.00%-100.00% -100.00% -100.00%-100.00%
NC -100.00% -100.00% -100.00% -100.00% -100.00% -100.00%-100.00% -100.00% -100.00%-100.00%
-50.00% -100.00% -100.00% -100.00% -100.00% -100.00% -100.00%-100.00% -100.00% -100.00%-100.00%
NC -100.00% -100.00% -100.00% -100.00% -100.00% -100.00%-100.00% -100.00% -100.00%-100.00%
NC -100.00% -100.00% -100.00% -100.00% -100.00% -100.00%NC -100.00% -100.00%-100.00%
NC -100.00% -100.00% -100.00% -100.00% -100.00% -100.00%-100.00% -100.00% -100.00%-100.00%
0.00% -100.00% -100.00% -100.00% -100.00% -100.00% -100.00%-100.00% -100.00% -100.00%-100.00%
701
25
40
75
13
53
2763
0
0
1
1
0
-100.00%
-100.00%
-98.57%
-98.67%
-100.00%
-98.11%
-98.91%
2720
116
234
369
77
256
13240
0
0
0
0
0
-100.00%
-100.00%
-100.00%
-100.00%
-100.00%
-100.00%
-100.00%
3421
141
274
444
90
309
16003
0
0
1
1
0
-100.00%
-100.00%
-99.71%
-99.77%
-100.00%
-99.68%
-99.81%
Prior YTDYTD% Change
Prior YTDYTD% Change
Prior YTDYTD% Change
Prior YTDYTD% Change
Prior YTDYTD% Change
Prior YTDYTD% Change
Prior YTDYTD% Change
Central
Source: Metropolitan Police Department's Incident Based Reporting System. The figures above were sourced from Incident Reports using Uniform Crime Reporting definitions and reporting guidlines. This report is intended to be a management and planning tool and does not reflect the official UCR counts for the department.
Begin Date End Date
Begin Date 1/1/2009 End Date 1/16/2009Prior YTD
YTD
of Nashville and Davidson County
METROPOLITAN POLICE DEPARTMENT
Homicide Forcible Rape
Total Robbery
Aggravated Assault
Commercial Burglary
Residential Burglary
Total Burglary
Larceny Motor Vehicle Theft
Violent Offenses
Property Offenses
Total Offenses
Commercial Robbery
Street Robbery
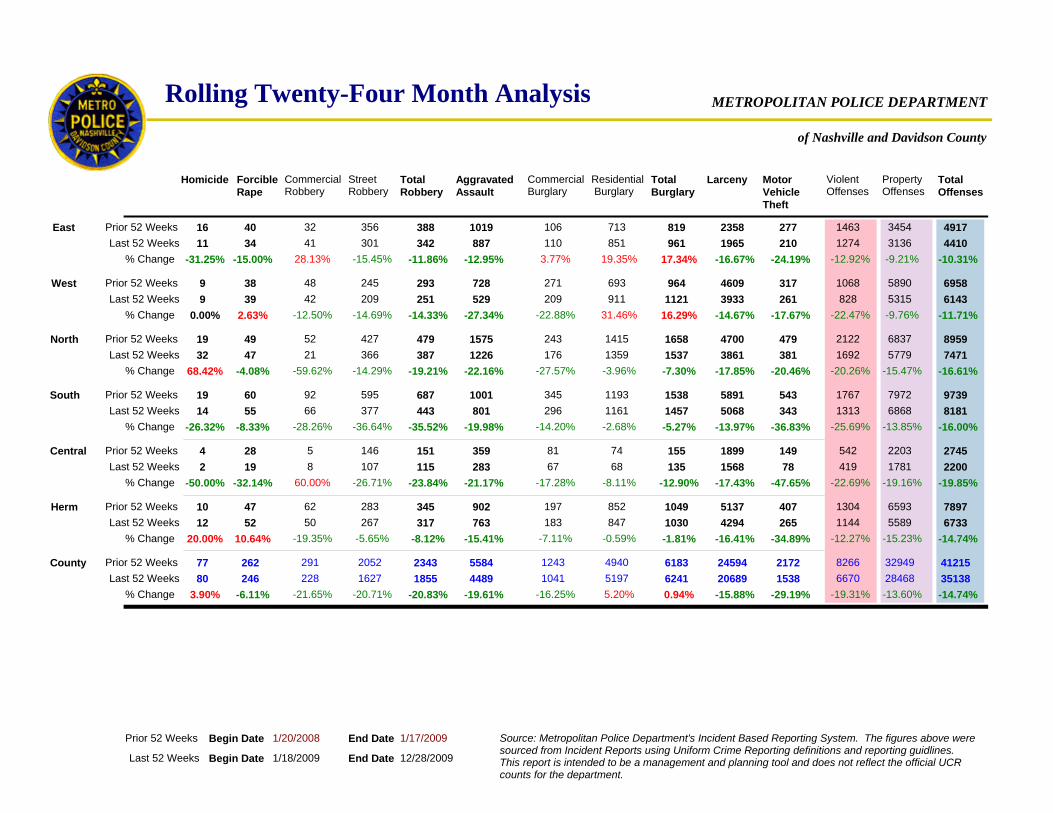
Rolling Twenty-Four Month Analysis
19 49 479 1575 243 1415 165852 427 4700 47932 47 387 1226 176 1359 153721 366 3813861
16 40 388 1019 106 713 81932 356 2358 277
9 38 293 728 271 693 96448 245 4609 317
19 60 687 1001 345 1193 153892 595 5891 543
4 28 151 359 81 74 1555 146 1899 149
10 47 345 902 197 852 104962 283 5137 407
77 262 2343 5584 1243 4940 6183291 2052 24594 217280 246 1855 4489 1041 5197 6241228 1627 153820689
11 34 342 887 110 851 96141 301 2101965
2 19 115 283 67 68 1358 107 781568
12 52 317 763 183 847 103050 267 2654294
14 55 443 801 296 1161 145766 377 3435068
9 39 251 529 209 911 112142 209 2613933
East
West
North
South
Central
Herm
County
-31.25% -15.00% -11.86% -12.95% 3.77% 19.35% 17.34%28.13% -15.45% -24.19%-16.67%
0.00% 2.63% -14.33% -27.34% -22.88% 31.46% 16.29%-12.50% -14.69% -17.67%-14.67%
68.42% -4.08% -19.21% -22.16% -27.57% -3.96% -7.30%-59.62% -14.29% -20.46%-17.85%
-26.32% -8.33% -35.52% -19.98% -14.20% -2.68% -5.27%-28.26% -36.64% -36.83%-13.97%
-50.00% -32.14% -23.84% -21.17% -17.28% -8.11% -12.90%60.00% -26.71% -47.65%-17.43%
20.00% 10.64% -8.12% -15.41% -7.11% -0.59% -1.81%-19.35% -5.65% -34.89%-16.41%
3.90% -6.11% -20.83% -19.61% -16.25% 5.20% 0.94%-21.65% -20.71% -29.19%-15.88%
21221692
1463
1068
1767
542
1304
82666670
1274
419
1144
1313
828
-12.92%
-22.47%
-20.26%
-25.69%
-22.69%
-12.27%
-19.31%
68375779
3454
5890
7972
2203
6593
3294928468
3136
1781
5589
6868
5315
-9.21%
-9.76%
-15.47%
-13.85%
-19.16%
-15.23%
-13.60%
89597471
4917
6958
9739
2745
7897
4121535138
4410
2200
6733
8181
6143
-10.31%
-11.71%
-16.61%
-16.00%
-19.85%
-14.74%
-14.74%
Prior 52 WeeksLast 52 Weeks
% Change
Prior 52 WeeksLast 52 Weeks
% Change
Prior 52 WeeksLast 52 Weeks
% Change
Prior 52 WeeksLast 52 Weeks
% Change
Prior 52 WeeksLast 52 Weeks
% Change
Prior 52 WeeksLast 52 Weeks
% Change
Prior 52 WeeksLast 52 Weeks
% Change
Source: Metropolitan Police Department's Incident Based Reporting System. The figures above were sourced from Incident Reports using Uniform Crime Reporting definitions and reporting guidlines. This report is intended to be a management and planning tool and does not reflect the official UCR counts for the department.
Begin Date 1/18/2009 End Date 12/28/2009
Begin Date 1/20/2008 End Date 1/17/2009Prior 52 Weeks
Last 52 Weeks
of Nashville and Davidson County
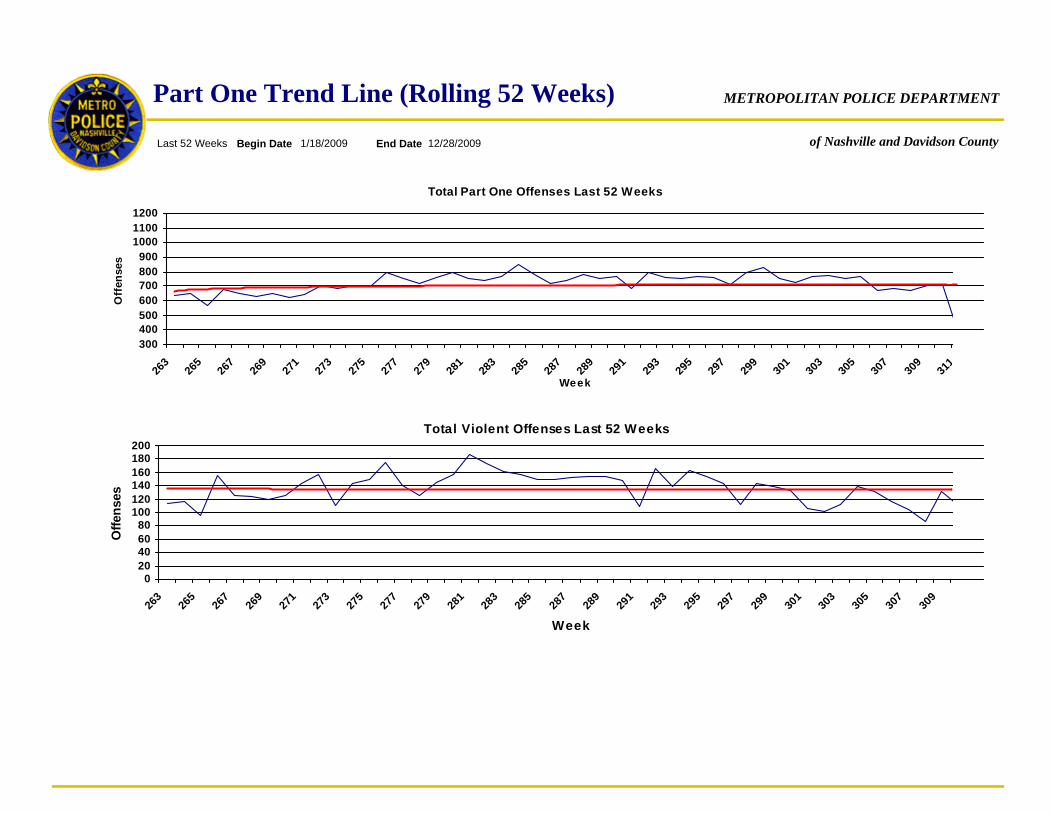
METROPOLITAN POLICE DEPARTMENTPart One Trend Line (Rolling 52 Weeks)
Begin Date 1/18/2009 End Date 12/28/2009Last 52 Weeks
Total Part One Offenses Last 52 Weeks
300400500600700800900
100011001200
263
265
267
269
271
273
275
277
279
281
283
285
287
289
291
293
295
297
299
301
303
305
307
309
311
Week
Off
ense
s
Total Violent Offenses Last 52 Weeks
020406080
100120140160180200
263
265
267
269
271
273
275
277
279
281
283
285
287
289
291
293
295
297
299
301
303
305
307
309
3
Week
Offe
nses

of Nashville and Davidson County
METROPOLITAN POLICE DEPARTMENTPart One Trend Line (Rolling 52 Weeks)
Begin Date 1/18/2009 End Date 12/28/2009Last 52 Weeks
Total Property Offenses Last 52 W eeks
350
450
550
650
750
850
950
263
265
267
269
271
273
275
277
279
281
283
285
287
289
291
293
295
297
299
301
303
305
307
309
W eek
Offe
nses
Tota l Robbery Offenses Last 52 W eeks
010
20304050
6070
263
265
267
269
271
273
275
277
279
281
283
285
287
289
291
293
295
297
299
301
303
305
307
3
W eek
Robb
erie
s

of Nashville and Davidson County
METROPOLITAN POLICE DEPARTMENTDetail LT Effectiveness Report Cover
*Note: All rankings are from 1 as the highest and 18 as the lowest.
The Detail Lieutenant Effectiveness Report is intended to help maintain focus on the core mission of our patrol units. By measuring our proactive abilities, our reactive responsibilities to Calls For Service, the success of deployment strategies that focus on quality police work (e.g., Terry Stops, Warrant Service, Traffic Stops, arrest for criminal behavior, etc.), then compared to officers available and on task, our ultimate goal of reducing UCR crimes can be continually evaluated. This is a tool to help Lieutenants observe the efforts of their detail by using a well known analysis called TOPSIS (used in the Military, Manufacturing, etc.). In this way, our Lieutenants can monitor the performance of their teams against their own actions, and how that compares to the most ideal state of all the details combined. (For example, In the NFL Quarterbacks have QB Ratings this is a measure of how effective the quarteback is, not how good, during a given season. But as with MOST effectiveness rankings it directly correlates to success.) This tool is intended to help better estimate our core efforts and how those efforts are being directed in our crime fighting, quality of life, and community policing strategies. Please direct any questions or recommendations to the SDD Crime Analysis Unit. *** Also please remember the data used for the calculations in NO WAY WHATSOEVER, in any realm of the imagination, has to do with the daily activity program.
~This is the difference of the last four weeks of self-initiated calls for service compared to the prior four weeks of self-initiated calls for service. If you are ranked highest in this category it means that the percentage of self-initiated activites by patrol designated officers for a given detail increased the most over the last four weeks.Weight: .15
Proactive:
~This is the difference of the last four weeks of dispatched calls for service compared to the prior four weeks of dispatched calls for service. If you are ranked highest in this category it means that the percentage of calls for service recieved by patrol designated officers for a given detail increased the most over the last four weeks.Weight: .15
Reactive:
~The ratio of the number of terry stops that result in an arrest divided by the total number of terry stops.~The ratio of the number of warrants served divided by the total number of warrant service attempts. This number has a threshold if the threshold number is breached the resulting ratio is zero. (For example you cannot serve a warrant without first attempting to serve. So if Spot has an outstanding warrant, you looked at his house, he wasnt there update WARAUD. 1 attempt. If the next day you pull Spot over you run him for warrants and he has one and you serve it update WARAUD this is 1 attempt and a service. Totals 2 attempts and 1 service = 50% service ratio. In laymans, if you touch a warrant touch WARAUD and update the file.)~The ratio of the number of traffic stops that result in an arrest divided by the total number of traffic stops. ~This is the difference of the last four weeks of persons arrested compared to the prior four weeks of persons arrested.~The ratio of the number of accidents that result in an injury divided by the total number of accidents. This measure is subtracted after all other values are summed.If you are ranked highest in this category it means the total combined score of the five measurements obove was the highest.Weight: 3
Quality: Is a series of ratios summed that result in an ending score.
~The difference of the last four weeks of UCR compared to the prior four weeks of UCR. Corrected with the multiplication of negative one to correct for the positive score. If you are ranked highest in this category it means that the percentage of UCR Part One crimes reported decreased the most over the last four weeks.Weight: .3
Results:
~This is a ratio of the total actual minutes worked by individuals in a given detail divided by the total expected minutes worked for the last four week period.If you are ranked highest in this category it means that the percentage wise you had the least amount of patrol resouces availible for the last four weeks.Weight: .10
Correction:
of Nashville and Davidson County
METROPOLITAN POLICE DEPARTMENTDetail LT Effectiveness Report (Patrol Only)12/20/2009 1/16/2010Begin Date End Date
This analysis is based on the personnel assigned to your unit and maintained through the personnel accountability system. This document is intended to be a management tool and is for LAW ENFORCEMENT USE ONLY.
of Nashville and Davidson County
METROPOLITAN POLICE DEPARTMENTPrecinct Effectiveness Report (Patrol Only)12/20/2009 1/16/2010Begin Date End Date
This analysis is based on the personnel assigned to your unit and maintained through the personnel accountability system. This document is intended to be a management tool and is for LAW ENFORCEMENT USE ONLY.
of Nashville and Davidson County
METROPOLITAN POLICE DEPARTMENT
ARREST MEASURES
Begin Date End Date
COMPSTAT WEEKLY ANALYSIS: Is provided by the MNPD Crime Analysis Section. This document does not reflect official UCR counts. This document is intended to be a management tool and is for LAW ENFORCEMENT USE ONLY.
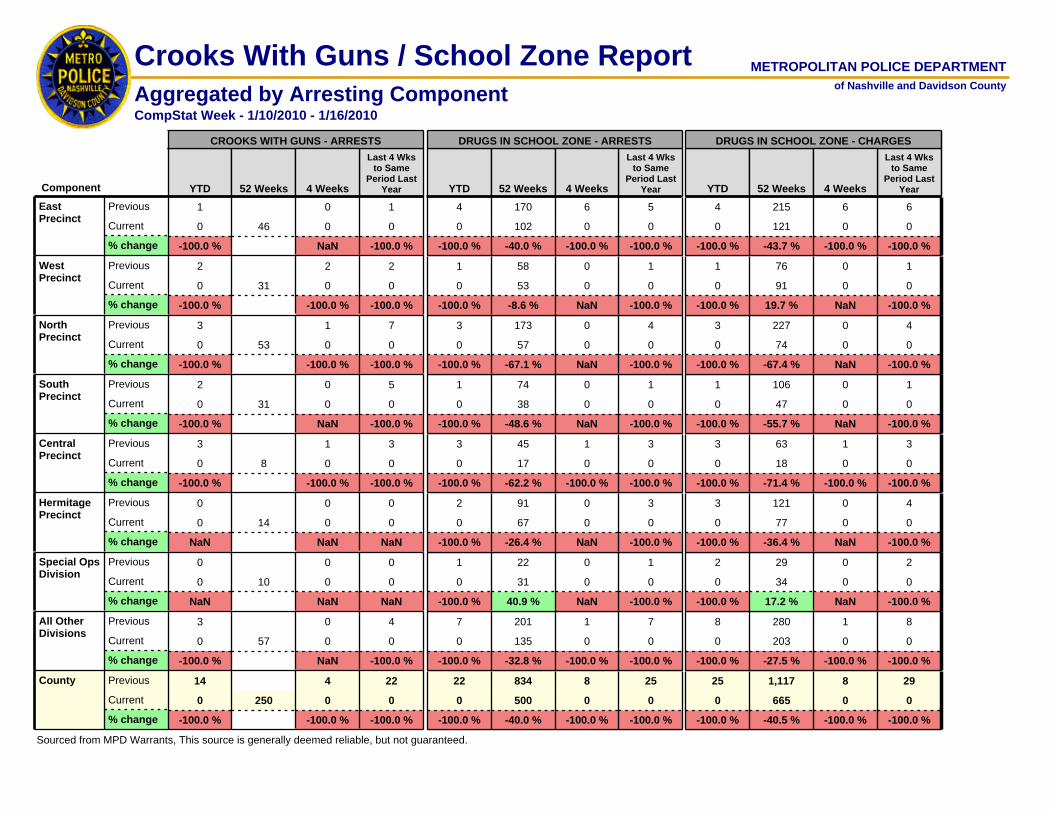
Aggregated by Arresting ComponentMETROPOLITAN POLICE DEPARTMENT
of Nashville and Davidson County
Crooks With Guns / School Zone Report
CompStat Week - 1/10/2010 - 1/16/2010
Last 4 Wks to Same
Period Last Year
Last 4 Wks to Same
Period Last Year
Last 4 Wks to Same
Period Last YearYTD 52 Weeks
DRUGS IN SCHOOL ZONE - ARRESTS
4 WeeksYTDComponent
NaN
10
0Previous
NaN% change
Special Ops Division
0Current
0
0
0
NaN
0
-100.0 %
22
40.9 %
31
1
-100.0 %
1
0
0
NaN
00
-100.0 %
29
17.2 %
34
2
-100.0 %
2
0
0
NaN
00
NaN
14
0Previous
NaN% change
Hermitage Precinct
0Current
0
0
0
NaN
0
-100.0 %
91
-26.4 %
67
2
-100.0 %
3
0
0
NaN
00
-100.0 %
121
-36.4 %
77
3
-100.0 %
4
0
0
NaN
00
-100.0 %
250
14Previous
-100.0 %% change
County
0Current
22
0
4
-100.0 %
0
-100.0 %
834
-40.0 %
500
22
-100.0 %
25
0
8
-100.0 %
00
-100.0 %
1,117
-40.5 %
665
25
-100.0 %
29
0
8
-100.0 %
00
-100.0 %
57
3Previous
-100.0 %% change
All Other Divisions
0Current
4
0
0
NaN
0
-100.0 %
201
-32.8 %
135
7
-100.0 %
7
0
1
-100.0 %
00
-100.0 %
280
-27.5 %
203
8
-100.0 %
8
0
1
-100.0 %
00
-100.0 %
8
3Previous
-100.0 %% change
Central Precinct
0Current
3
0
1
-100.0 %
0
-100.0 %
45
-62.2 %
17
3
-100.0 %
3
0
1
-100.0 %
00
-100.0 %
63
-71.4 %
18
3
-100.0 %
3
0
1
-100.0 %
00
-100.0 %
31
2Previous
-100.0 %% change
West Precinct
0Current
2
0
2
-100.0 %
0
-100.0 %
58
-8.6 %
53
1
-100.0 %
1
0
0
NaN
00
-100.0 %
76
19.7 %
91
1
-100.0 %
1
0
0
NaN
00
-100.0 %
46
1Previous
-100.0 %% change
East Precinct
0Current
1
0
0
NaN
0
-100.0 %
170
-40.0 %
102
4
-100.0 %
5
0
6
-100.0 %
00
-100.0 %
215
-43.7 %
121
4
-100.0 %
6
0
6
-100.0 %
00
-100.0 %
31
2Previous
-100.0 %% change
South Precinct
0Current
5
0
0
NaN
0
-100.0 %
74
-48.6 %
38
1
-100.0 %
1
0
0
NaN
00
-100.0 %
106
-55.7 %
47
1
-100.0 %
1
0
0
NaN
00
-100.0 %
53
3Previous
-100.0 %% change
North Precinct
0Current
7
0
1
-100.0 %
0
-100.0 %
173
-67.1 %
57
3
-100.0 %
4
0
0
NaN
00
-100.0 %
227
-67.4 %
74
3
-100.0 %
4
0
0
NaN
00
52 Weeks
CROOKS WITH GUNS - ARRESTS
4 Weeks YTD 52 Weeks
DRUGS IN SCHOOL ZONE - CHARGES
4 Weeks
Sourced from MPD Warrants, This source is generally deemed reliable, but not guaranteed.

Physical and Citation Arrest Analysis
of Nashville and Davidson County
METROPOLITAN POLICE DEPARTMENT
Begin Date 1/18/2008 to End Date
Prior Week
Last Week
Difference % Change
Prior 4Wks
Last 4Wks
Difference % Change
Prior YTD
YTD Difference % Change
Prior 52Wk
Last 52Wk
Difference % Change
East
West
North
South
Cent
Herm
Cnty
2570 2294
1775
1381
1673
1700
1609
14957 13040
1573
1440
1466
1649
1214
-11.38%
-12.09%
-10.74%
-1.43%
-15.29%
-8.89%
-12.82%
0 0
0
0
0
0
0
0 0
0
0
0
0
0
NC
NC
NC
NC
NC
NC
NC
83 0
51
35
58
38
72
458 0
0
0
0
0
0
-100.00%
-100.00%
-100.00%
-100.00%
-100.00%
-100.00%
-100.00%
101 0
67
63
71
73
80
650 0
0
0
0
0
0
-100.00%
-100.00%
-100.00%
-100.00%
-100.00%
#Div/0!
-100.00%
-202
-167
-276
-24
-260
-143
-1917
0
0
0
0
0
0
0
-51
-35
-83
-58
-38
-72
-458
-67
-63
-101
-71
-73
-80
-650
0 0
0 0
0 0
0
0
0
0 0
0
0
0
180 0
137
157
194
174
145
1190 0
0
0
0
0
0
231 0
148
219
205
301
180
1632 0
0
0
0
0
0
4758 4898
3394
4996
4509
6093
3944
35043 32989
3619
5958
3891
4714
4699
NC
NC
NC
NC
NC
NC
NC
0
0
0
0
0
0
0
-100.00%
-100.00%
-100.00%
-100.00%
-100.00%
-100.00%
-100.00%
-137
-157
-180
-194
-174
-145
-1190
-100.00%
-100.00%
-100.00%
-100.00%
-100.00%
-100.00%
-100.00%
-148
-219
-231
-205
-301
-180
-1632
6.63%
-5.94%
2.94%
4.55%
-2.22%
-1.34%
-5.86%
225
-297
140
205
-135
-53
-205442286 41448 -1.98%0 0 NC 1034 0 -100.00% 1776 0 -100.00% -8380 -1034 -1776
6794 6143 -9.58%0 0 NC 162 0 -100.00% 299 0 -100.00% -6510 -162 -299
3554 3969 11.68%0 0 NC 130 0 -100.00% 171 0 -100.00% 4150 -130 -171
9555 9548 -0.07%0 0 NC 202 0 -100.00% 388 0 -100.00% -70 -202 -388
9185 9613 4.66%0 0 NC 243 0 -100.00% 335 0 -100.00% 4280 -243 -335
5734 5065 -11.67%0 0 NC 133 0 -100.00% 224 0 -100.00% -6690 -133 -224
5309 4846 -8.72%0 0 NC 119 0 -100.00% 242 0 -100.00% -4630 -119 -242
Felony ArrestsMisdemeanor ArrestsCitation Arrests
CJC 2857 2574 -9.91%0 0 NC 93 0 -100.00% 126 0 -100.00% -2830 -93 -1260 0 149 0 190 0 3325 3277NC0 -100.00%-149 -100.00%-190 -1.44%-48
616 387 -37.18%0 0 NC 9 0 -100.00% 25 0 -100.00% -2290 -9 -25
Unk/OofC
1392 830 -40.37%0 0 NC 28 0 -100.00% 69 0 -100.00% -5620 -28 -690 0 54 0 158 0 4024 1933NC0 -100.00%-54 -100.00%-158 -51.96%-2091
1539 1877 21.96%0 0 NC 36 0 -100.00% 92 0 -100.00% 3380 -36 -92
Felony ArrestsMisdemeanor ArrestsCitation Arrests
Felony ArrestsMisdemeanor ArrestsCitation Arrests
Felony ArrestsMisdemeanor ArrestsCitation Arrests
Felony ArrestsMisdemeanor ArrestsCitation Arrests
Felony ArrestsMisdemeanor ArrestsCitation Arrests
Felony ArrestsMisdemeanor ArrestsCitation Arrests
Felony ArrestsMisdemeanor ArrestsCitation Arrests
Felony ArrestsMisdemeanor ArrestsCitation Arrests
92286 87477 -5.21%0 0 NC 2682 0 -100.00% 4058 0 -100.00% -48090 -2682 -4058Total
Source: Metropolitan Police Department's COMPSTAT Database System. The figures above were sourced from arrest reports. The figures above include both Juvenille and Adult prisoners. This report includes the number of physical arrests made for the above referenced time period and has a degree of error of approximately 1%. *A physical arrest represents an individual body and not the number of charges issued to a person. This report is intended to be a management and planning tool and does not reflect the official Physical Arrest counts for the department.
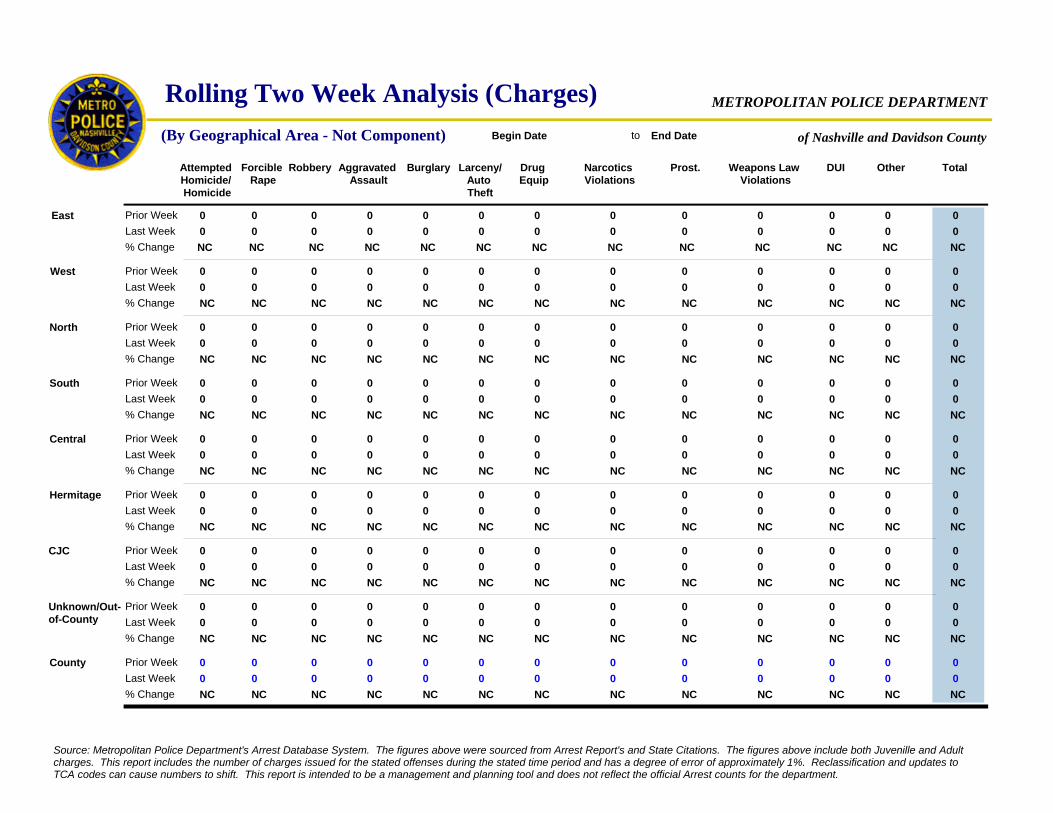
Rolling Two Week Analysis (Charges)of Nashville and Davidson County
METROPOLITAN POLICE DEPARTMENT
Forcible Rape
Aggravated Assault
Narcotics Violations
Drug Equip
Burglary Larceny/Auto Theft
Weapons Law Violations
Total Robbery Prost. DUI
Begin Date to End Date(By Geographical Area - Not Component)
OtherAttempted Homicide/ Homicide
0 0 0 0 0 0 00 0 0 00 0 0 0 0 0 00 0 00
0 0 0 0 0 0 00 0 0 0
0 0 0 0 0 0 00 0 0 0
0 0 0 0 0 0 00 0 0 0
0 0 0 0 0 0 00 0 0 0
0 0 0 0 0 0 00 0 0 0
0 0 0 0 0 0 00 0 0 00 0 0 0 0 0 00 0 00
0 0 0 0 0 0 00 0 00
0 0 0 0 0 0 00 0 00
0 0 0 0 0 0 00 0 00
0 0 0 0 0 0 00 0 00
0 0 0 0 0 0 00 0 00
East
West
North
South
Central
Hermitage
County
NC NC NC NC NC NC NCNC NC NCNC
Prior WeekLast Week% Change
Prior WeekLast Week% Change
Prior WeekLast Week% Change
Prior WeekLast Week% Change
Prior WeekLast Week% Change
Prior WeekLast Week% Change
Prior WeekLast Week% Change
NC NC NC NC NC NC NCNC NC NCNC
NC NC NC NC NC NC NCNC NC NCNC
NC NC NC NC NC NC NCNC NC NCNC
NC NC NC NC NC NC NCNC NC NCNC
NC NC NC NC NC NC NCNC NC NCNC
NC NC NC NC NC NC NCNC NC NCNC
00
0
0
0
0
0
00
0
0
0
0
0
NC
NC
NC
NC
NC
NC
NC
0 0 0 0 0 0 00 0 0 00 0 0 0 0 0 00 0 00
CJC Prior WeekLast Week% Change NC NC NC NC NC NC NCNC NC NCNC
00NC
0 0 0 0 0 0 00 0 0 00 0 0 0 0 0 00 0 00
Unknown/Out-of-County
Prior WeekLast Week% Change NC NC NC NC NC NC NCNC NC NCNC
00NC
00
0
0
0
0
0
00
0
0
0
0
0
NC
NC
NC
NC
NC
NC
NC
00NC
00NC
Source: Metropolitan Police Department's Arrest Database System. The figures above were sourced from Arrest Report's and State Citations. The figures above include both Juvenille and Adult charges. This report includes the number of charges issued for the stated offenses during the stated time period and has a degree of error of approximately 1%. Reclassification and updates to TCA codes can cause numbers to shift. This report is intended to be a management and planning tool and does not reflect the official Arrest counts for the department.

Rolling Eight Week Analysis (Charges)of Nashville and Davidson County
METROPOLITAN POLICE DEPARTMENT
Forcible Rape
Aggravated Assault
Narcotics Violations
Drug Equip
Burglary Larceny/Auto Theft
Weapons Law Violations
Total Robbery Prost. DUI
Begin Date 11/18/200 to End Date(By Geographical Area - Not Component)
OtherAttempted Homicide/ Homicide
0 0 4 38 29 63 10 17 3 230 0 0 0 0 0 00 0 00
0 0 2 13 23 55 107 8 2 19
0 0 3 30 8 13 70 7 6 43
0 0 3 54 30 42 43 10 0 36
0 0 0 11 9 20 51 4 3 17
0 0 6 27 25 60 56 18 1 24
5 12 23 199 130 262 3222 80 17 1700 0 0 0 0 0 00 0 00
0 0 0 0 0 0 00 0 00
0 0 0 0 0 0 00 0 00
0 0 0 0 0 0 00 0 00
0 0 0 0 0 0 00 0 00
0 0 0 0 0 0 00 0 00
East
West
North
South
Central
Hermitage
County
NC NC -100.00% -100.00% -100.00% -100.00% -100.00%-100.00% -100.00% -100.00%-100.00%
Prior WeekLast Week% Change
Prior WeekLast Week% Change
Prior WeekLast Week% Change
Prior WeekLast Week% Change
Prior WeekLast Week% Change
Prior WeekLast Week% Change
Prior WeekLast Week% Change
NC NC -100.00% -100.00% -100.00% -100.00% -100.00%NC -100.00% -100.00%-100.00%
NC NC -100.00% -100.00% -100.00% -100.00% -100.00%NC -100.00% -100.00%-100.00%
NC NC -100.00% -100.00% -100.00% -100.00% -100.00%-100.00% -100.00% -100.00%NC
NC NC NC -100.00% -100.00% -100.00% -100.00%-100.00% -100.00% -100.00%-100.00%
NC NC -100.00% -100.00% -100.00% -100.00% -100.00%-100.00% -100.00% -100.00%-100.00%
-100.00% -100.00% -100.00% -100.00% -100.00% -100.00% -100.00%-100.00% -100.00% -100.00%-100.00%
4330
309
275
411
332
346
25530
0
0
0
0
0
-100.00%
-100.00%
-100.00%
-100.00%
-100.00%
-100.00%
-100.00%
2 2 4 21 3 3 03 12 1 40 0 0 0 0 0 00 0 00
CJC Prior WeekLast Week% Change -100.00% -100.00% -100.00% -100.00% -100.00% -100.00% NC-100.00% -100.00% -100.00%-100.00%
3120
-100.00%
3 10 1 5 3 6 02 4 1 40 0 0 0 0 0 00 0 00
Unknown/Out-of-County
Prior WeekLast Week% Change -100.00% -100.00% -100.00% -100.00% -100.00% -100.00% NC-100.00% -100.00% -100.00%-100.00%
1350
-100.00%
2550
170
158
229
262
174
16010
0
0
0
0
0
-100.00%
-100.00%
-100.00%
-100.00%
-100.00%
-100.00%
-100.00%
2570
-100.00%
960
-100.00%
Source: Metropolitan Police Department's Arrest Database System. The figures above were sourced from Arrest Report's and State Citations. The figures above include both Juvenille and Adult charges. This report includes the number of charges issued for the stated offenses during the stated time period and has a degree of error of approximately 1%. Reclassification and updates to TCA codes can cause numbers to shift. This report is intended to be a management and planning tool and does not reflect the official Arrest counts for the department.

YTD Analysis (Charges)of Nashville and Davidson County
METROPOLITAN POLICE DEPARTMENT
Forcible Rape
Aggravated Assault
Narcotics Violations
Drug Equip
Burglary Larceny/Auto Theft
Weapons Law Violations
Total Robbery Prost. DUI
Begin Date 1/1/2009 to End Date(By Geographical Area - Not Component)
OtherAttempted Homicide/ Homicide
0 4 2 64 43 94 57 21 2 290 0 0 0 0 0 00 0 00
2 0 2 21 41 79 44 6 5 16
0 3 2 40 16 64 52 0 0 51
0 0 9 84 39 73 93 11 6 48
0 3 5 16 20 37 54 7 2 51
0 0 2 37 41 90 204 16 3 31
6 11 26 301 212 472 5248 87 26 2380 0 0 0 0 0 00 0 00
0 0 0 0 0 0 00 0 00
0 0 0 0 0 0 00 0 00
0 0 0 0 0 0 00 0 00
0 0 0 0 0 0 00 0 00
0 0 0 0 0 0 00 0 00
East
West
North
South
Central
Hermitage
County
-100.00% NC -100.00% -100.00% -100.00% -100.00% -100.00%-100.00% -100.00% -100.00%-100.00%
Prior YTDYTD% Change
NC -100.00% -100.00% -100.00% -100.00% -100.00% -100.00%-100.00% NC -100.00%NC
NC -100.00% -100.00% -100.00% -100.00% -100.00% -100.00%-100.00% -100.00% -100.00%-100.00%
NC NC -100.00% -100.00% -100.00% -100.00% -100.00%-100.00% -100.00% -100.00%-100.00%
NC -100.00% -100.00% -100.00% -100.00% -100.00% -100.00%-100.00% -100.00% -100.00%-100.00%
NC NC -100.00% -100.00% -100.00% -100.00% -100.00%-100.00% -100.00% -100.00%-100.00%
-100.00% -100.00% -100.00% -100.00% -100.00% -100.00% -100.00%-100.00% -100.00% -100.00%-100.00%
5970
370
429
491
552
475
36340
0
0
0
0
0
-100.00%
-100.00%
-100.00%
-100.00%
-100.00%
-100.00%
-100.00%
2 0 2 14 6 11 117 10 0 20 0 0 0 0 0 00 0 00
CJC
-100.00% NC -100.00% -100.00% -100.00% -100.00% -100.00%-100.00% -100.00% -100.00%NC
4270
-100.00%
2 1 2 25 6 24 37 6 8 100 0 0 0 0 0 00 0 00
Unknown/Out-of-County
-100.00% -100.00% -100.00% -100.00% -100.00% -100.00% -100.00%-100.00% -100.00% -100.00%-100.00%
2930
-100.00%
Prior YTDYTD% Change
Prior YTDYTD% Change
Prior YTDYTD% Change
Prior YTDYTD% Change
Prior YTDYTD% Change
Prior YTDYTD% Change
Prior YTDYTD% Change
Prior YTDYTD% Change
3260
190
246
209
402
231
21550
0
0
0
0
0
-100.00%
-100.00%
-100.00%
-100.00%
-100.00%
-100.00%
-100.00%
3620
-100.00%
1990
-100.00%
Source: Metropolitan Police Department's Arrest Database System. The figures above were sourced from Arrest Report's and State Citations. The figures above include both Juvenille and Adult charges. This report includes the number of charges issued for the stated offenses during the stated time period and has a degree of error of approximately 1%. Reclassification and updates to TCA codes can cause numbers to shift. This report is intended to be a management and planning tool and does not reflect the official Arrest counts for the department.
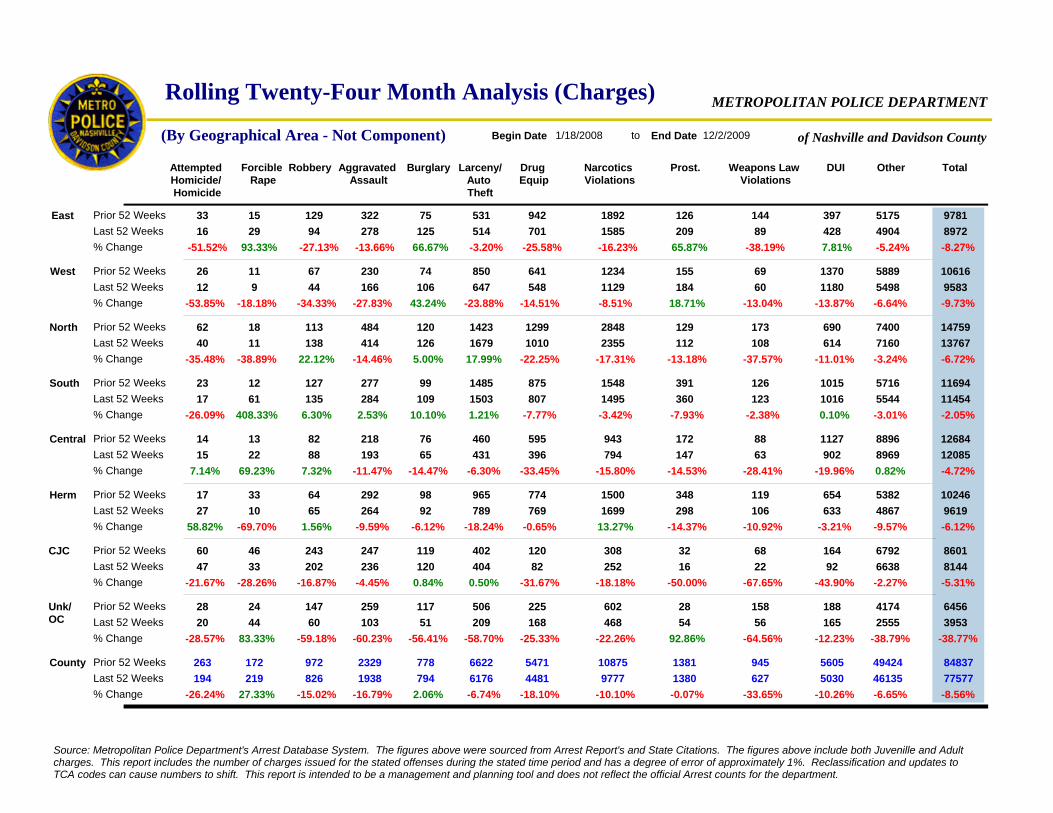
Rolling Twenty-Four Month Analysis (Charges)
of Nashville and Davidson County
METROPOLITAN POLICE DEPARTMENT
Attempted Homicide/ Homicide
Forcible Rape
Aggravated Assault
Narcotics Violations
Drug Equip
Burglary Larceny/Auto Theft
Weapons Law Violations
Total Robbery Prost. DUI
Begin Date 1/18/2008 to End Date 12/2/2009(By Geographical Area - Not Component)
Other
62 18 120 1423 1299 2848 129113 484 173 69040 11 126 1679 1010 2355 112138 414 614108
33 15 75 531 942 1892 126129 322 144 397
26 11 74 850 641 1234 15567 230 69 1370
23 12 99 1485 875 1548 391127 277 126 1015
14 13 76 460 595 943 17282 218 88 1127
17 33 98 965 774 1500 34864 292 119 654
263 172 778 6622 5471 10875 1381972 2329 945 5605194 219 794 6176 4481 9777 1380826 1938 5030627
16 29 125 514 701 1585 20994 278 42889
15 22 65 431 396 794 14788 193 90263
27 10 92 789 769 1699 29865 264 633106
17 61 109 1503 807 1495 360135 284 1016123
12 9 106 647 548 1129 18444 166 118060
East
West
North
South
Central
Herm
County
-51.52% 93.33% 66.67% -3.20% -25.58% -16.23% 65.87%-27.13% -13.66% 7.81%-38.19%
Prior 52 WeeksLast 52 Weeks% Change -53.85% -18.18% 43.24% -23.88% -14.51% -8.51% 18.71%-34.33% -27.83% -13.87%-13.04%
-35.48% -38.89% 5.00% 17.99% -22.25% -17.31% -13.18%22.12% -14.46% -11.01%-37.57%
-26.09% 408.33% 10.10% 1.21% -7.77% -3.42% -7.93%6.30% 2.53% 0.10%-2.38%
7.14% 69.23% -14.47% -6.30% -33.45% -15.80% -14.53%7.32% -11.47% -19.96%-28.41%
58.82% -69.70% -6.12% -18.24% -0.65% 13.27% -14.37%1.56% -9.59% -3.21%-10.92%
-26.24% 27.33% 2.06% -6.74% -18.10% -10.10% -0.07%-15.02% -16.79% -10.26%-33.65%
1475913767
9781
10616
11694
12684
10246
8483777577
8972
12085
9619
11454
9583
-8.27%
-9.73%
-6.72%
-2.05%
-4.72%
-6.12%
-8.56%
60 46 119 402 120 308 32243 247 68 16447 33 120 404 82 252 16202 236 9222
CJC
-21.67% -28.26% 0.84% 0.50% -31.67% -18.18% -50.00%-16.87% -4.45% -43.90%-67.65%
86018144-5.31%
28 24 117 506 225 602 28147 259 158 18820 44 51 209 168 468 5460 103 16556
Unk/OC
-28.57% 83.33% -56.41% -58.70% -25.33% -22.26% 92.86%-59.18% -60.23% -12.23%-64.56%
64563953
-38.77%
74007160
5175
5889
5716
8896
5382
4942446135
4904
8969
4867
5544
5498
-5.24%
-6.64%
-3.24%
-3.01%
0.82%
-9.57%
-6.65%
67926638-2.27%
41742555
-38.79%
Prior 52 WeeksLast 52 Weeks% Change
Prior 52 WeeksLast 52 Weeks% Change
Prior 52 WeeksLast 52 Weeks% Change
Prior 52 WeeksLast 52 Weeks% Change
Prior 52 WeeksLast 52 Weeks% Change
Prior 52 WeeksLast 52 Weeks% Change
Prior 52 WeeksLast 52 Weeks% Change
Prior 52 WeeksLast 52 Weeks% Change
Source: Metropolitan Police Department's Arrest Database System. The figures above were sourced from Arrest Report's and State Citations. The figures above include both Juvenille and Adult charges. This report includes the number of charges issued for the stated offenses during the stated time period and has a degree of error of approximately 1%. Reclassification and updates to TCA codes can cause numbers to shift. This report is intended to be a management and planning tool and does not reflect the official Arrest counts for the department.

of Nashville and Davidson County
METROPOLITAN POLICE DEPARTMENT
EFFICIENCY MEASURES BY COMPONENT
Begin Date End Date
COMPSTAT WEEKLY ANALYSIS: Is provided by the MNPD Crime Analysis Section. This document does not reflect official UCR counts. This document is intended to be a management tool and is for LAW ENFORCEMENT USE ONLY.
Aggregated by Reporting ComponentMETROPOLITAN POLICE DEPARTMENT
of Nashville and Davidson County
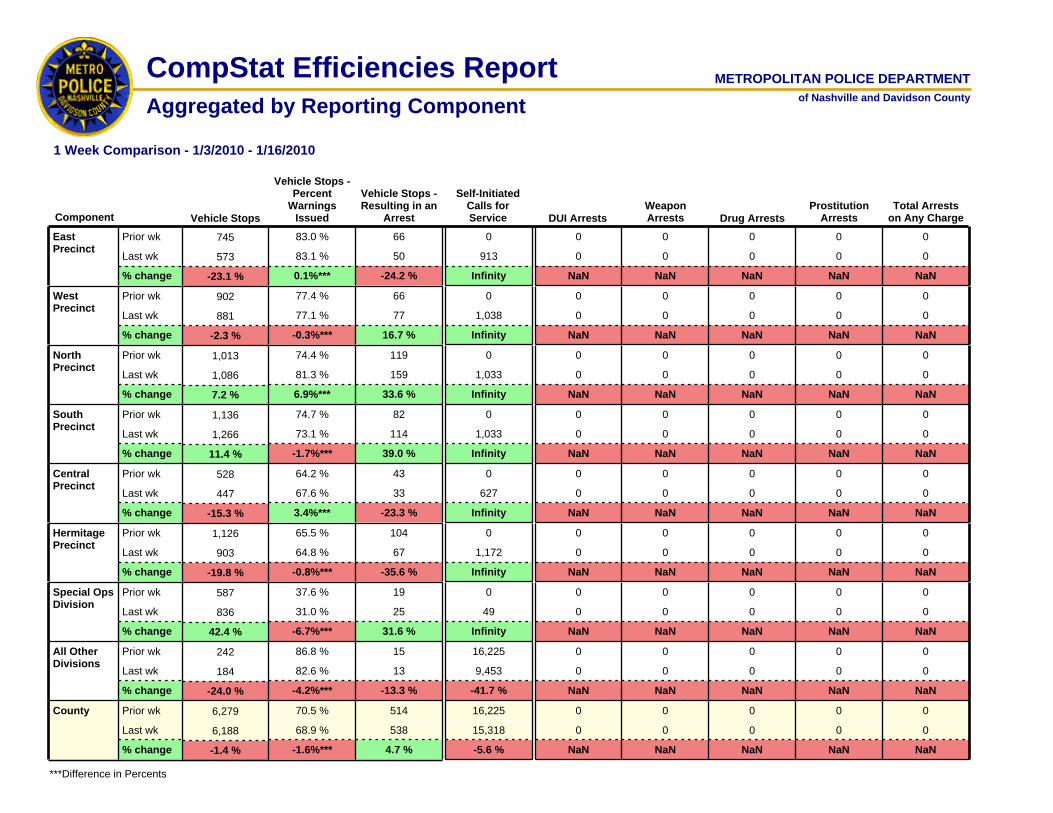
CompStat Efficiencies Report
1 Week Comparison - 1/3/2010 - 1/16/2010
Total Arrests on Any Charge
Prostitution ArrestsDrug ArrestsDUI Arrests
Weapon Arrests
***Difference in Percents
Vehicle StopsComponent
Vehicle Stops - Percent
Warnings Issued
Vehicle Stops - Resulting in an
Arrest
Self-Initiated Calls for Service
NaN
0
0
NaN
0
0
NaN
0
0
NaN
0
0
NaN
0
0
31.6 %-6.7%***
587Prior wk
42.4 %% change
Special Ops Division
836Last wk
37.6 %
31.0 %
19
25
Infinity
0
49
NaN
0
0
NaN
0
0
NaN
0
0
NaN
0
0
NaN
0
0
-35.6 %-0.8%***
1,126Prior wk
-19.8 %% change
Hermitage Precinct
903Last wk
65.5 %
64.8 %
104
67
Infinity
0
1,172
NaN
0
0
NaN
0
0
NaN
0
0
NaN
0
0
NaN
0
0
4.7 %-1.6%***
6,279Prior wk
-1.4 %% change
County
6,188Last wk
70.5 %
68.9 %
514
538
-5.6 %
16,225
15,318
NaN
0
0
NaN
0
0
NaN
0
0
NaN
0
0
NaN
0
0
-13.3 %-4.2%***
242Prior wk
-24.0 %% change
All Other Divisions
184Last wk
86.8 %
82.6 %
15
13
-41.7 %
16,225
9,453
NaN
0
0
NaN
0
0
NaN
0
0
NaN
0
0
NaN
0
0
-23.3 %3.4%***
528Prior wk
-15.3 %% change
Central Precinct
447Last wk
64.2 %
67.6 %
43
33
Infinity
0
627
NaN
0
0
NaN
0
0
NaN
0
0
NaN
0
0
NaN
0
0
16.7 %-0.3%***
902Prior wk
-2.3 %% change
West Precinct
881Last wk
77.4 %
77.1 %
66
77
Infinity
0
1,038
NaN
0
0
NaN
0
0
NaN
0
0
NaN
0
0
NaN
0
0
-24.2 %0.1%***
745Prior wk
-23.1 %% change
East Precinct
573Last wk
83.0 %
83.1 %
66
50
Infinity
0
913
NaN
0
0
NaN
0
0
NaN
0
0
NaN
0
0
NaN
0
0
39.0 %-1.7%***
1,136Prior wk
11.4 %% change
South Precinct
1,266Last wk
74.7 %
73.1 %
82
114
Infinity
0
1,033
NaN
0
0
NaN
0
0
NaN
0
0
NaN
0
0
NaN
0
0
33.6 %6.9%***
1,013Prior wk
7.2 %% change
North Precinct
1,086Last wk
74.4 %
81.3 %
119
159
Infinity
0
1,033
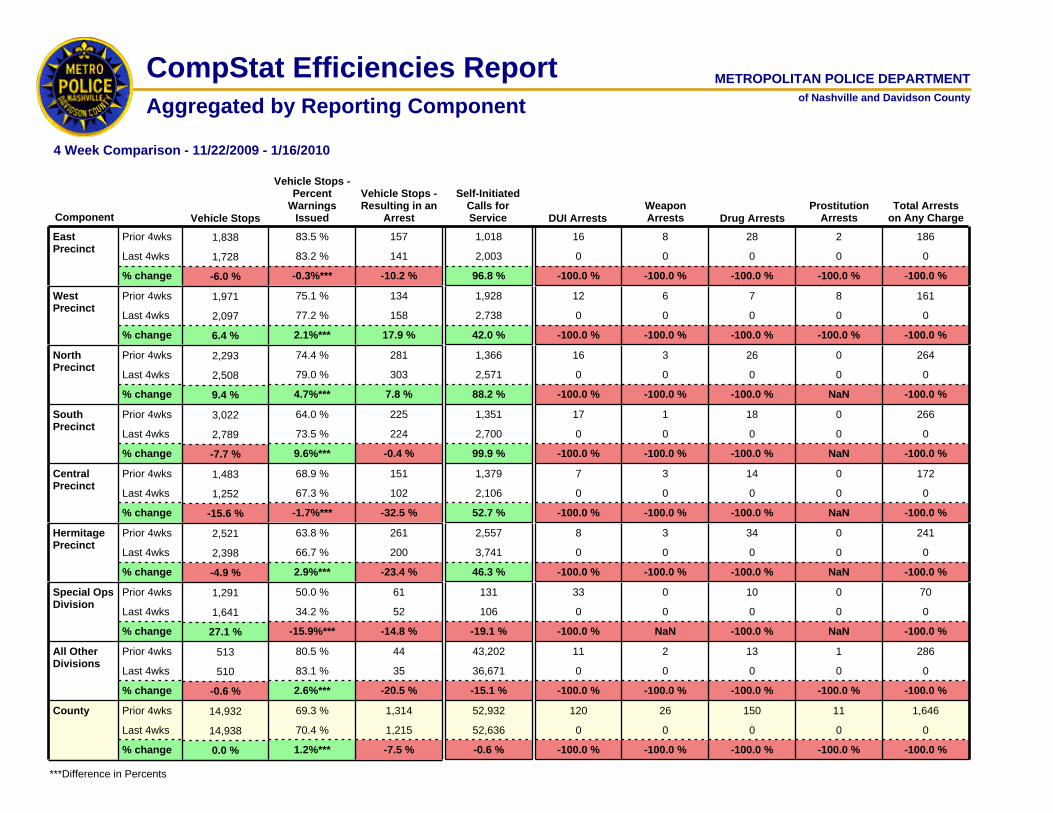
Aggregated by Reporting ComponentMETROPOLITAN POLICE DEPARTMENT
of Nashville and Davidson County
CompStat Efficiencies Report
4 Week Comparison - 11/22/2009 - 1/16/2010
Total Arrests on Any Charge
Prostitution ArrestsDrug ArrestsDUI Arrests
Weapon Arrests
***Difference in Percents
Vehicle StopsComponent
Vehicle Stops - Percent
Warnings Issued
Vehicle Stops - Resulting in an
Arrest
Self-Initiated Calls for Service
-100.0 %
33
0
NaN
0
0
-100.0 %
10
0
NaN
0
0
-100.0 %
70
0
-14.8 %-15.9%***
1,291Prior 4wks
27.1 %% change
Special Ops Division
1,641Last 4wks
50.0 %
34.2 %
61
52
-19.1 %
131
106
-100.0 %
8
0
-100.0 %
3
0
-100.0 %
34
0
NaN
0
0
-100.0 %
241
0
-23.4 %2.9%***
2,521Prior 4wks
-4.9 %% change
Hermitage Precinct
2,398Last 4wks
63.8 %
66.7 %
261
200
46.3 %
2,557
3,741
-100.0 %
120
0
-100.0 %
26
0
-100.0 %
150
0
-100.0 %
11
0
-100.0 %
1,646
0
-7.5 %1.2%***
14,932Prior 4wks
0.0 %% change
County
14,938Last 4wks
69.3 %
70.4 %
1,314
1,215
-0.6 %
52,932
52,636
-100.0 %
11
0
-100.0 %
2
0
-100.0 %
13
0
-100.0 %
1
0
-100.0 %
286
0
-20.5 %2.6%***
513Prior 4wks
-0.6 %% change
All Other Divisions
510Last 4wks
80.5 %
83.1 %
44
35
-15.1 %
43,202
36,671
-100.0 %
7
0
-100.0 %
3
0
-100.0 %
14
0
NaN
0
0
-100.0 %
172
0
-32.5 %-1.7%***
1,483Prior 4wks
-15.6 %% change
Central Precinct
1,252Last 4wks
68.9 %
67.3 %
151
102
52.7 %
1,379
2,106
-100.0 %
12
0
-100.0 %
6
0
-100.0 %
7
0
-100.0 %
8
0
-100.0 %
161
0
17.9 %2.1%***
1,971Prior 4wks
6.4 %% change
West Precinct
2,097Last 4wks
75.1 %
77.2 %
134
158
42.0 %
1,928
2,738
-100.0 %
16
0
-100.0 %
8
0
-100.0 %
28
0
-100.0 %
2
0
-100.0 %
186
0
-10.2 %-0.3%***
1,838Prior 4wks
-6.0 %% change
East Precinct
1,728Last 4wks
83.5 %
83.2 %
157
141
96.8 %
1,018
2,003
-100.0 %
17
0
-100.0 %
1
0
-100.0 %
18
0
NaN
0
0
-100.0 %
266
0
-0.4 %9.6%***
3,022Prior 4wks
-7.7 %% change
South Precinct
2,789Last 4wks
64.0 %
73.5 %
225
224
99.9 %
1,351
2,700
-100.0 %
16
0
-100.0 %
3
0
-100.0 %
26
0
NaN
0
0
-100.0 %
264
0
7.8 %4.7%***
2,293Prior 4wks
9.4 %% change
North Precinct
2,508Last 4wks
74.4 %
79.0 %
281
303
88.2 %
1,366
2,571
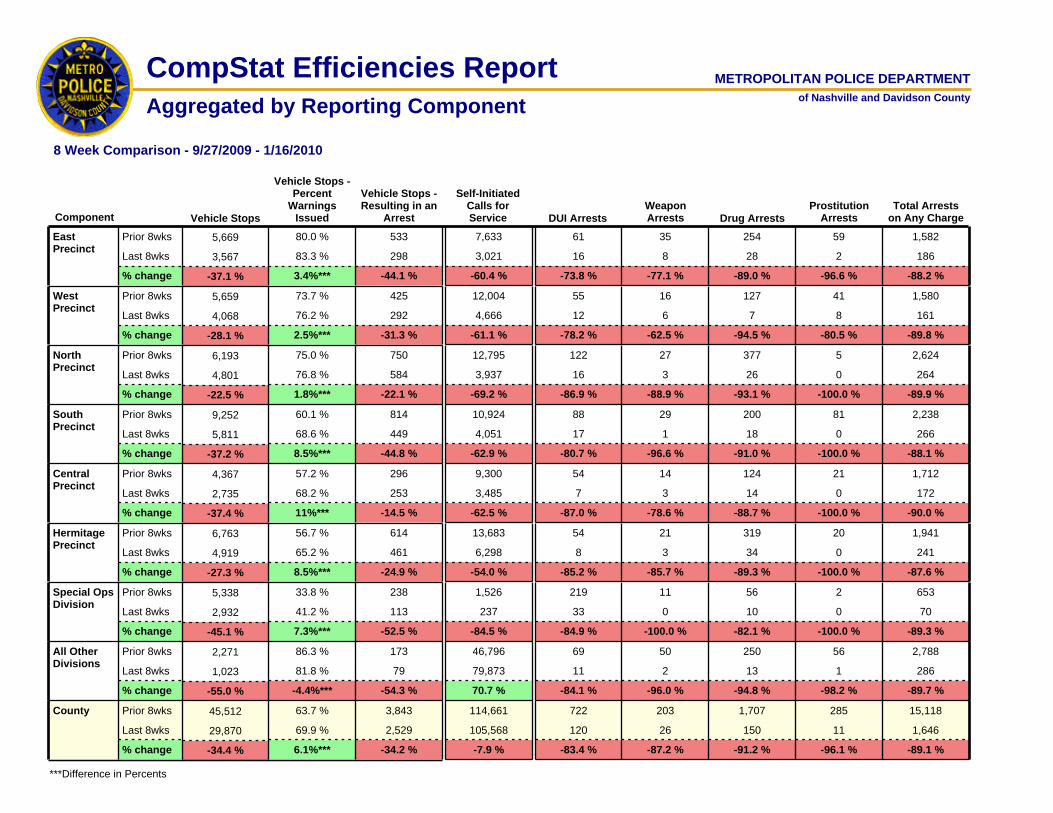
Aggregated by Reporting ComponentMETROPOLITAN POLICE DEPARTMENT
of Nashville and Davidson County
CompStat Efficiencies Report
8 Week Comparison - 9/27/2009 - 1/16/2010
Total Arrests on Any Charge
Prostitution ArrestsDrug ArrestsDUI Arrests
Weapon Arrests
***Difference in Percents
Vehicle StopsComponent
Vehicle Stops - Percent
Warnings Issued
Vehicle Stops - Resulting in an
Arrest
Self-Initiated Calls for Service
-84.9 %
219
33
-100.0 %
11
0
-82.1 %
56
10
-100.0 %
2
0
-89.3 %
653
70
-52.5 %7.3%***
5,338Prior 8wks
-45.1 %% change
Special Ops Division
2,932Last 8wks
33.8 %
41.2 %
238
113
-84.5 %
1,526
237
-85.2 %
54
8
-85.7 %
21
3
-89.3 %
319
34
-100.0 %
20
0
-87.6 %
1,941
241
-24.9 %8.5%***
6,763Prior 8wks
-27.3 %% change
Hermitage Precinct
4,919Last 8wks
56.7 %
65.2 %
614
461
-54.0 %
13,683
6,298
-83.4 %
722
120
-87.2 %
203
26
-91.2 %
1,707
150
-96.1 %
285
11
-89.1 %
15,118
1,646
-34.2 %6.1%***
45,512Prior 8wks
-34.4 %% change
County
29,870Last 8wks
63.7 %
69.9 %
3,843
2,529
-7.9 %
114,661
105,568
-84.1 %
69
11
-96.0 %
50
2
-94.8 %
250
13
-98.2 %
56
1
-89.7 %
2,788
286
-54.3 %-4.4%***
2,271Prior 8wks
-55.0 %% change
All Other Divisions
1,023Last 8wks
86.3 %
81.8 %
173
79
70.7 %
46,796
79,873
-87.0 %
54
7
-78.6 %
14
3
-88.7 %
124
14
-100.0 %
21
0
-90.0 %
1,712
172
-14.5 %11%***
4,367Prior 8wks
-37.4 %% change
Central Precinct
2,735Last 8wks
57.2 %
68.2 %
296
253
-62.5 %
9,300
3,485
-78.2 %
55
12
-62.5 %
16
6
-94.5 %
127
7
-80.5 %
41
8
-89.8 %
1,580
161
-31.3 %2.5%***
5,659Prior 8wks
-28.1 %% change
West Precinct
4,068Last 8wks
73.7 %
76.2 %
425
292
-61.1 %
12,004
4,666
-73.8 %
61
16
-77.1 %
35
8
-89.0 %
254
28
-96.6 %
59
2
-88.2 %
1,582
186
-44.1 %3.4%***
5,669Prior 8wks
-37.1 %% change
East Precinct
3,567Last 8wks
80.0 %
83.3 %
533
298
-60.4 %
7,633
3,021
-80.7 %
88
17
-96.6 %
29
1
-91.0 %
200
18
-100.0 %
81
0
-88.1 %
2,238
266
-44.8 %8.5%***
9,252Prior 8wks
-37.2 %% change
South Precinct
5,811Last 8wks
60.1 %
68.6 %
814
449
-62.9 %
10,924
4,051
-86.9 %
122
16
-88.9 %
27
3
-93.1 %
377
26
-100.0 %
5
0
-89.9 %
2,624
264
-22.1 %1.8%***
6,193Prior 8wks
-22.5 %% change
North Precinct
4,801Last 8wks
75.0 %
76.8 %
750
584
-69.2 %
12,795
3,937

Aggregated by Reporting ComponentMETROPOLITAN POLICE DEPARTMENT
of Nashville and Davidson County
CompStat Efficiencies Report
YTD Comparison - January 1 through January 16 in 2009 and 2010
Total Arrests on Any Charge
Prostitution ArrestsDrug ArrestsDUI Arrests
Weapon Arrests
***Difference in Percents
Vehicle StopsComponent
Vehicle Stops - Percent
Warnings Issued
Vehicle Stops - Resulting in an
Arrest
Self-Initiated Calls for Service
-100.0 %
81
0
-100.0 %
3
0
-100.0 %
16
0
NaN
0
0
-100.0 %
196
0
-13.2 %-2.6%***
1,229Prior YTD
20.2 %% change
Special Ops Division
1,477YTD
38.0 %
35.4 %
53
46
-87.8 %
426
52
-100.0 %
20
0
-100.0 %
5
0
-100.0 %
62
0
-100.0 %
6
0
-100.0 %
567
0
-9.5 %6.5%***
2,346Prior YTD
-4.8 %% change
Hermitage Precinct
2,234YTD
60.0 %
66.4 %
210
190
-61.2 %
3,105
1,206
-100.0 %
232
0
-100.0 %
59
0
-100.0 %
484
0
-100.0 %
52
0
-100.0 %
4,089
0
3.9 %9.8%***
13,065Prior YTD
2.9 %% change
County
13,445YTD
61.0 %
70.8 %
1,086
1,128
21.2 %
28,646
34,716
-100.0 %
43
0
-100.0 %
12
0
-100.0 %
101
0
-100.0 %
26
0
-100.0 %
873
0
-65.5 %7.3%***
948Prior YTD
-54.7 %% change
All Other Divisions
429YTD
77.5 %
84.8 %
84
29
112.6 %
13,483
28,664
-100.0 %
15
0
-100.0 %
8
0
-100.0 %
34
0
-100.0 %
2
0
-100.0 %
418
0
-15.5 %13.2%***
1,131Prior YTD
-4.1 %% change
Central Precinct
1,085YTD
54.1 %
67.3 %
103
87
-60.5 %
1,674
661
-100.0 %
12
0
-100.0 %
3
0
-100.0 %
36
0
-100.0 %
9
0
-100.0 %
418
0
16.8 %5.4%***
2,134Prior YTD
-9.0 %% change
West Precinct
1,942YTD
72.9 %
78.3 %
131
153
-55.7 %
2,433
1,078
-100.0 %
9
0
-100.0 %
11
0
-100.0 %
75
0
-100.0 %
2
0
-100.0 %
400
0
-18.0 %15.5%***
1,251Prior YTD
13.7 %% change
East Precinct
1,423YTD
68.2 %
83.7 %
150
123
-40.4 %
1,556
927
-100.0 %
33
0
-100.0 %
6
0
-100.0 %
61
0
-100.0 %
6
0
-100.0 %
566
0
18.0 %18.7%***
2,306Prior YTD
11.5 %% change
South Precinct
2,571YTD
55.9 %
74.6 %
178
210
-67.3 %
3,252
1,064
-100.0 %
19
0
-100.0 %
11
0
-100.0 %
99
0
-100.0 %
1
0
-100.0 %
651
0
63.8 %17.4%***
1,720Prior YTD
32.0 %% change
North Precinct
2,270YTD
61.0 %
78.4 %
177
290
-60.8 %
2,717
1,064

of Nashville and Davidson County
METROPOLITAN POLICE DEPARTMENT
EFFICIENCY MEASURES
Begin Date End Date
COMPSTAT WEEKLY ANALYSIS: Is provided by the MNPD Crime Analysis Section. This document does not reflect official UCR counts. This document is intended to be a management tool and is for LAW ENFORCEMENT USE ONLY.

Rolling Two Week Analysis (Incident)
of Nashville and Davidson County
METROPOLITAN POLICE DEPARTMENT
Prostitution Offenses
Drug/Narcotics Offenses
Weapons Law Violations
Begin Date to End Date
Theft From Building
Theft From Motor Vehicle
Drug/Narcotics Equipment
0 0 00 0 0
0 0 0
0 0 0
0 0 0
0 0 0
0 0 0
0 0 00 0 0
0 0 0
0 0 0
0 0 0
0 0 0
0 0 0
East
West
North
South
Central
Hermitage
County
NC NC NC
NC NC NC
NC NC NC
NC NC NC
NC NC NC
NC NC NC
NC NC NC
0 00 0
0 0
0 0
0 0
0 0
0 0
0 00 0
0 0
0 0
0 0
0 0
0 0
NC NC
NC NC
NC NC
NC NC
NC NC
NC NC
NC NC
00
0
0
0
0
0
00
0
0
0
0
0
NC
NC
NC
NC
NC
NC
NC
Prior WeekLast Week% Change
Prior WeekLast Week% Change
Prior WeekLast Week% Change
Prior WeekLast Week% Change
Prior WeekLast Week% Change
Prior WeekLast Week% Change
Prior WeekLast Week% Change
Begin Date End Date
Begin Date End Date Source: Metropolitan Police Department's Incident Based Reporting System. The figures above were sourced from Incident Reports using Uniform Crime Reporting definitions and reporting guidlines. This report is intended to be a management and planning tool and does not reflect the official UCR counts for the department.
Prior Week
Last Week
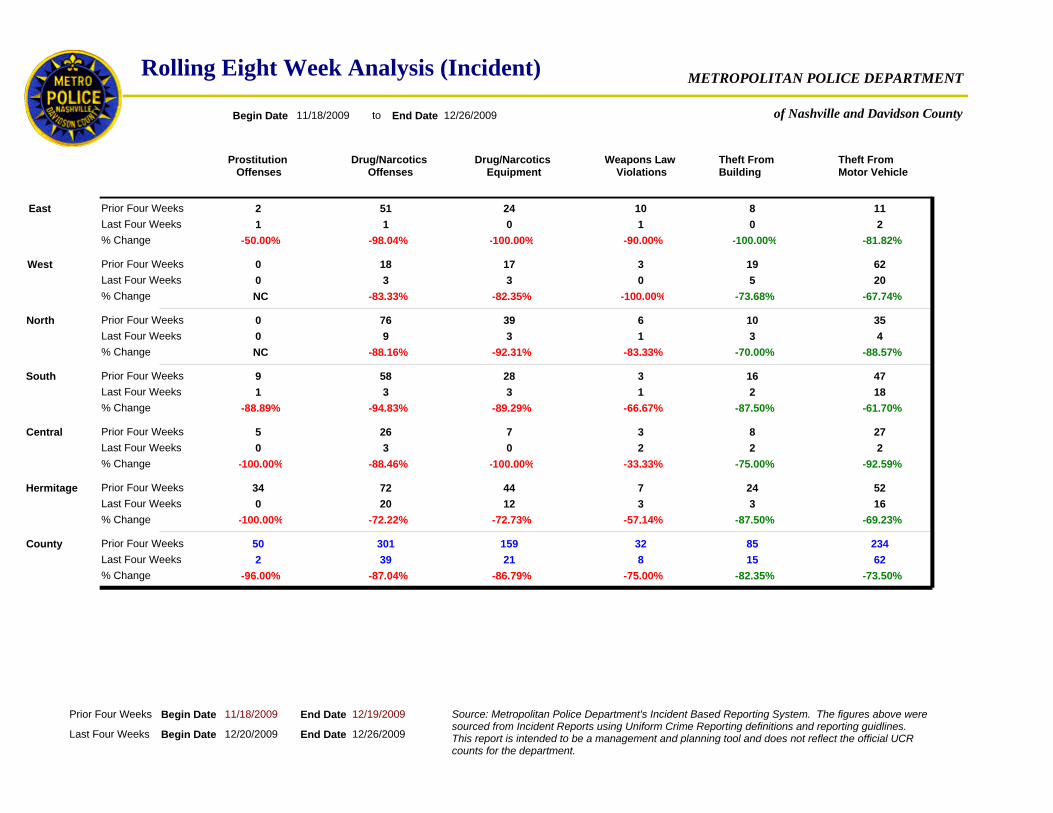
Rolling Eight Week Analysis (Incident)
of Nashville and Davidson County
METROPOLITAN POLICE DEPARTMENT
Prostitution Offenses
Drug/Narcotics Offenses
Weapons Law Violations
Begin Date 11/18/2009 to End Date 12/26/2009
Theft From Building
Theft From Motor Vehicle
Drug/Narcotics Equipment
0 76 60 9 1
2 51 10
0 18 3
9 58 3
5 26 3
34 72 7
50 301 322 39 8
1 1 1
0 3 2
0 20 3
1 3 1
0 3 0
East
West
North
South
Central
Hermitage
County
-50.00% -98.04% -90.00%
NC -83.33% -100.00%
NC -88.16% -83.33%
-88.89% -94.83% -66.67%
-100.00% -88.46% -33.33%
-100.00% -72.22% -57.14%
-96.00% -87.04% -75.00%
10 353 4
8 11
19 62
16 47
8 27
24 52
85 23415 62
0 2
2 2
3 16
2 18
5 20
-100.00% -81.82%
-73.68% -67.74%
-70.00% -88.57%
-87.50% -61.70%
-75.00% -92.59%
-87.50% -69.23%
-82.35% -73.50%
393
24
17
28
7
44
15921
0
0
12
3
3
-100.00%
-82.35%
-92.31%
-89.29%
-100.00%
-72.73%
-86.79%
Prior Four WeeksLast Four Weeks% Change
Prior Four WeeksLast Four Weeks% Change
Prior Four WeeksLast Four Weeks% Change
Prior Four WeeksLast Four Weeks% Change
Prior Four WeeksLast Four Weeks% Change
Prior Four WeeksLast Four Weeks% Change
Prior Four WeeksLast Four Weeks% Change
Begin Date 12/20/2009 End Date 12/26/2009
Begin Date 11/18/2009 End Date 12/19/2009 Source: Metropolitan Police Department's Incident Based Reporting System. The figures above were sourced from Incident Reports using Uniform Crime Reporting definitions and reporting guidlines. This report is intended to be a management and planning tool and does not reflect the official UCR counts for the department.
Prior Four Weeks
Last Four Weeks
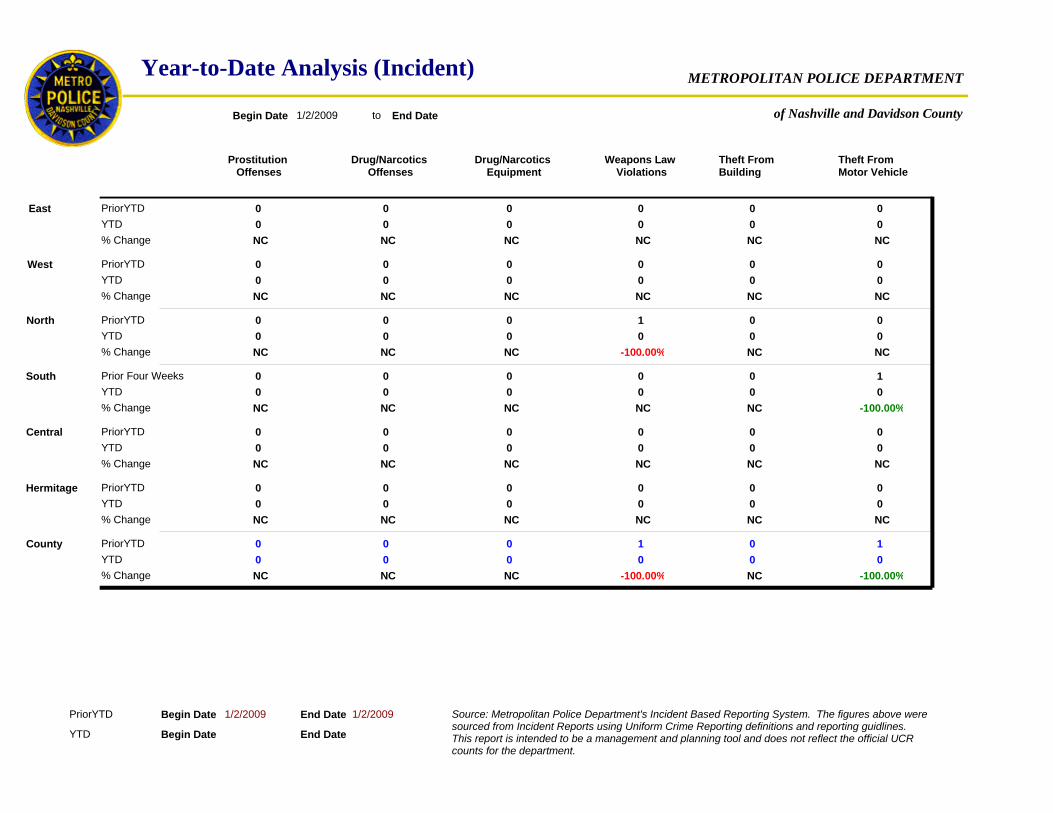
Year-to-Date Analysis (Incident)
of Nashville and Davidson County
METROPOLITAN POLICE DEPARTMENT
Prostitution Offenses
Drug/Narcotics Offenses
Weapons Law Violations
Begin Date 1/2/2009 to End Date
Theft From Building
Theft From Motor Vehicle
Drug/Narcotics Equipment
0 0 10 0 0
0 0 0
0 0 0
0 0 0
0 0 0
0 0 0
0 0 10 0 0
0 0 0
0 0 0
0 0 0
0 0 0
0 0 0
East
West
North
South
Central
Hermitage
County
NC NC NC
NC NC NC
NC NC -100.00%
NC NC NC
NC NC NC
NC NC NC
NC NC -100.00%
0 00 0
0 0
0 0
0 1
0 0
0 0
0 10 0
0 0
0 0
0 0
0 0
0 0
NC NC
NC NC
NC NC
NC -100.00%
NC NC
NC NC
NC -100.00%
00
0
0
0
0
0
00
0
0
0
0
0
NC
NC
NC
NC
NC
NC
NC
PriorYTDYTD% Change
PriorYTDYTD% Change
PriorYTDYTD% Change
Prior Four WeeksYTD% Change
PriorYTDYTD% Change
PriorYTDYTD% Change
PriorYTDYTD% Change
Begin Date End Date
Begin Date 1/2/2009 End Date 1/2/2009 Source: Metropolitan Police Department's Incident Based Reporting System. The figures above were sourced from Incident Reports using Uniform Crime Reporting definitions and reporting guidlines. This report is intended to be a management and planning tool and does not reflect the official UCR counts for the department.
PriorYTD
YTD

Rolling Twenty-Four Month Analysis (Incident)
of Nashville and Davidson County
METROPOLITAN POLICE DEPARTMENT
Prostitution Offenses
Drug/Narcotics Offenses
Weapons Law Violations
Begin Date 1/2/2009 to End Date 12/26/2009
Theft From Building
Theft From Motor Vehicle
Drug/Narcotics Equipment
0 0 10 86 7
0 0 0
0 0 0
0 0 0
0 0 0
0 0 0
0 0 152 345 44
3 53 14
5 29 5
34 92 10
10 63 4
0 22 4
East
West
North
South
Central
Hermitage
County
NC NC NC
Prior 52 WeeksLast 52 Weeks% Change
Prior 52 WeeksLast 52 Weeks% Change
Prior 52 WeeksLast 52 Weeks% Change
Prior 52 WeeksLast 52 Weeks% Change
Prior 52 WeeksLast 52 Weeks% Change
Prior 52 WeeksLast 52 Weeks% Change
Prior 52 WeeksLast 52 Weeks% Change
NC NC NC
NC NC 600.00%
NC NC NC
NC NC NC
NC NC NC
NC NC 4300.00%
0 013 39
0 0
0 0
0 1
0 0
0 0
0 1100 296
8 13
10 29
27 68
18 65
24 82
NC NC
NC NC
NC NC
NC 6400.00%
NC NC
NC NC
NC 29500.00%
042
0
0
0
0
0
0181
24
7
56
32
20
NC
NC
NC
NC
NC
NC
NC
Begin Date 8/21/2009 End Date 12/26/2009
Begin Date 1/2/2009 End Date 1/2/2009Prior 52 Weeks
Last 52 Weeks
Source: Metropolitan Police Department's Incident Based Reporting System. The figures above were sourced from Incident Reports using Uniform Crime Reporting definitions and reporting guidlines. This report is intended to be a management and planning tool and does not reflect the official UCR counts for the department.

Rolling Two Week Analysis (CAD)of Nashville and Davidson County
METROPOLITAN POLICE DEPARTMENT
Prowler/Suspicous Person
Vehicle Blocking Right-Of-Way
Vehicle Accident Property Damage
Total
Vehicle Accident Personal Injury
Traffic Violation
Shots Fired
Shooting
Begin Date 1/3/2010 to End Date 1/16/2010
Stabbings
10612 71 13 1213 6 09617 39 9 1460 9 0
11511 42 8 728 6 1
10822 117 24 1498 1 1
7721 97 19 1205 6 0
14437 24 0 589 0 0
8621 57 14 1350 3 0
652149 408 78 6760 22 2712155 361 67 7188 35 2
13010 23 2 788 2 0
13839 27 5 588 1 0
8623 74 14 1120 14 0
8412 88 17 1432 5 1
15444 110 20 1623 4 1
East
West
North
South
Central
Hermitage
County
13.04%-9.09% -45.24% -75.00% 8.24% -66.67% -100.00%
42.59%100.00% -5.98% -16.67% 8.34% 300.00% 0.00%
-9.43%41.67% -45.07% -30.77% 20.36% 50.00% NC
9.09%-42.86% -9.28% -10.53% 18.84% -16.67% NC
-4.17%5.41% 12.50% NC -0.17% NC NC
0.00%9.52% 29.82% 0.00% -17.04% 366.67% NC
9.20%4.03% -11.52% -14.10% 6.33% 59.09% 0.00%
Prior WeekLast Week% Change
Prior WeekLast Week% Change
Prior WeekLast Week% Change
Prior WeekLast Week% Change
Prior WeekLast Week% Change
Prior WeekLast Week% Change
Prior WeekLast Week% Change
21
1
0
0
3
0
61
0
0
0
0
0
-100.00%
NC
-50.00%
NC
-100.00%
NC
-83.33%
Begin Date 1/10/2010 End Date 1/16/2010
Begin Date 1/3/2010 End Date 1/9/2010 Source: Metropolitan Police Department's Computer Aided Dispatch system records. Figures include call ten codes of 10-45, 10-46, 10-93, 10-83, 10-58, 10-40, and 10-52. This report is intended to be a management and planning tool and does not reflect the official UCR counts for the department.
Prior Week
Last Week
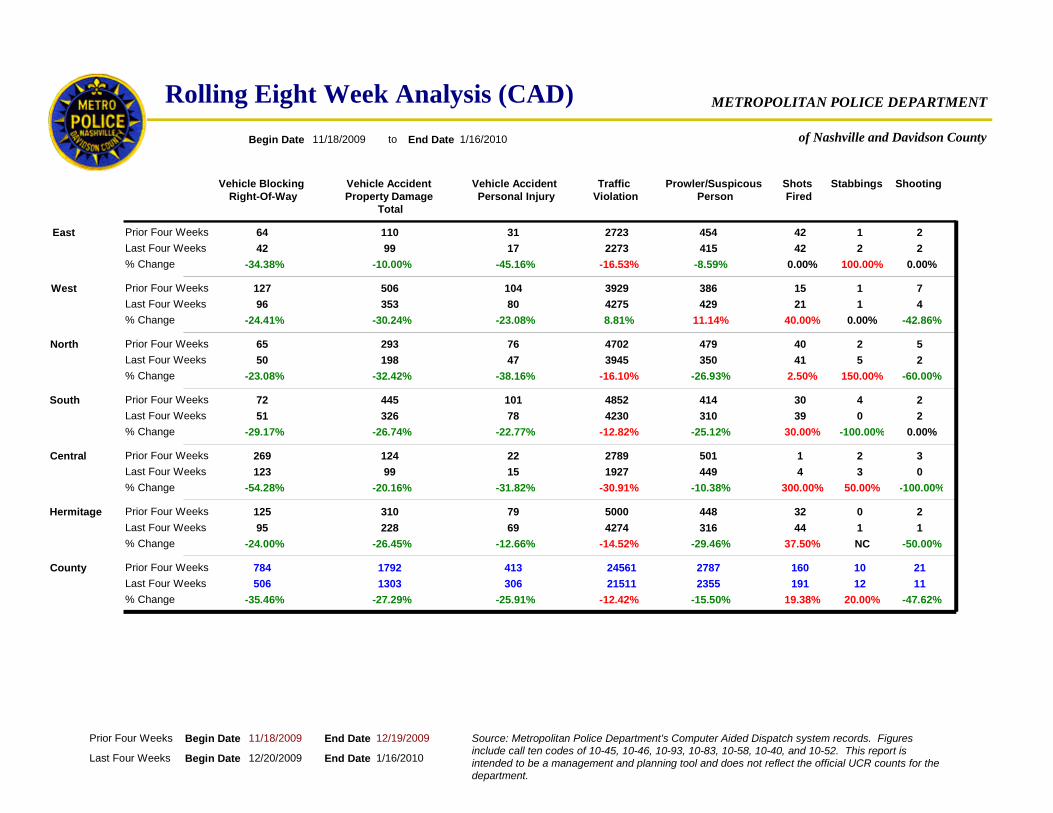
Rolling Eight Week Analysis (CAD)of Nashville and Davidson County
METROPOLITAN POLICE DEPARTMENT
Prowler/Suspicous Person
Vehicle Blocking Right-Of-Way
Vehicle Accident Property Damage
Total
Vehicle Accident Personal Injury
Traffic Violation
Shots Fired
Shooting
Begin Date 11/18/2009 to End Date 1/16/2010
Stabbings
47965 293 76 4702 40 535050 198 47 3945 41 2
45464 110 31 2723 42 2
386127 506 104 3929 15 7
41472 445 101 4852 30 2
501269 124 22 2789 1 3
448125 310 79 5000 32 2
2787784 1792 413 24561 160 212355506 1303 306 21511 191 11
41542 99 17 2273 42 2
449123 99 15 1927 4 0
31695 228 69 4274 44 1
31051 326 78 4230 39 2
42996 353 80 4275 21 4
East
West
North
South
Central
Hermitage
County
-8.59%-34.38% -10.00% -45.16% -16.53% 0.00% 0.00%
11.14%-24.41% -30.24% -23.08% 8.81% 40.00% -42.86%
-26.93%-23.08% -32.42% -38.16% -16.10% 2.50% -60.00%
-25.12%-29.17% -26.74% -22.77% -12.82% 30.00% 0.00%
-10.38%-54.28% -20.16% -31.82% -30.91% 300.00% -100.00%
-29.46%-24.00% -26.45% -12.66% -14.52% 37.50% -50.00%
-15.50%-35.46% -27.29% -25.91% -12.42% 19.38% -47.62%
Prior Four WeeksLast Four Weeks% Change
Prior Four WeeksLast Four Weeks% Change
Prior Four WeeksLast Four Weeks% Change
Prior Four WeeksLast Four Weeks% Change
Prior Four WeeksLast Four Weeks% Change
Prior Four WeeksLast Four Weeks% Change
Prior Four WeeksLast Four Weeks% Change
25
1
1
4
2
0
1012
2
3
1
0
1
100.00%
0.00%
150.00%
-100.00%
50.00%
NC
20.00%
Begin Date 12/20/2009 End Date 1/16/2010
Begin Date 11/18/2009 End Date 12/19/2009 Source: Metropolitan Police Department's Computer Aided Dispatch system records. Figures include call ten codes of 10-45, 10-46, 10-93, 10-83, 10-58, 10-40, and 10-52. This report is intended to be a management and planning tool and does not reflect the official UCR counts for the department.
Prior Four Weeks
Last Four Weeks

YTD Analysis (CAD)of Nashville and Davidson County
METROPOLITAN POLICE DEPARTMENT
Prowler/Suspicous Person
Vehicle Blocking Right-Of-Way
Vehicle Accident Property Damage
Total
Vehicle Accident Personal Injury
Traffic Violation
Shots Fired
Shooting
Begin Date 1/1/2009 to End Date 1/16/2010
Stabbings
22127 106 35 1814 34 022031 117 26 2847 20 0
21824 47 8 1480 32 1
16656 240 67 2669 20 1
17137 188 37 2646 18 0
294101 61 8 1374 0 1
19157 140 38 2707 16 1
1284337 782 193 13283 120 41491332 820 167 15113 95 4
26222 67 10 1609 24 1
29982 60 7 1285 2 0
19556 138 34 2784 22 0
18133 199 43 2821 16 1
29071 239 47 3389 11 2
East
West
North
South
Central
Hermitage
County
20.18%-8.33% 42.55% 25.00% 8.72% -25.00% 0.00%
74.70%26.79% -0.42% -29.85% 26.98% -45.00% 100.00%
-0.45%14.81% 10.38% -25.71% 56.95% -41.18% NC
5.85%-10.81% 5.85% 16.22% 6.61% -11.11% NC
1.70%-18.81% -1.64% -12.50% -6.48% NC -100.00%
2.09%-1.75% -1.43% -10.53% 2.84% 37.50% -100.00%
16.12%-1.48% 4.86% -13.47% 13.78% -20.83% 0.00%
Prior YTDYTD% Change
Prior YTDYTD% Change
Prior YTDYTD% Change
Prior YTDYTD% Change
Prior YTDYTD% Change
Prior YTDYTD% Change
Prior YTDYTD% Change
03
1
1
2
2
1
77
1
3
0
0
0
0.00%
-100.00%
NC
-100.00%
50.00%
-100.00%
0.00%
Begin Date 1/1/2010 End Date 1/16/2010
Begin Date 1/1/2009 End Date 1/16/2009 Source: Metropolitan Police Department's Computer Aided Dispatch system records. Figures include call ten codes of 10-45, 10-46, 10-93, 10-83, 10-58, 10-40, and 10-52. This report is intended to be a management and planning tool and does not reflect the official UCR counts for the department.
PriorYTD
YTD

Rolling Twenty-Four Month Analysis (CAD)of Nashville and Davidson County
METROPOLITAN POLICE DEPARTMENT
Prowler/Suspicous Person
Vehicle Blocking Right-Of-Way
Vehicle Accident Property Damage
Total
Vehicle Accident Personal Injury
Traffic Violation
Shots Fired
Shooting
Begin Date 1/18/2008 to End Date 1/16/2010
Stabbings
6295755 2941 931 42258 776 586314588 2742 931 49303 691 60
6030457 1459 374 28070 662 43
49861661 5372 1225 51832 329 84
5143988 5056 1231 49274 627 52
54623923 1627 299 21770 77 12
48721156 3487 1004 44089 570 39
333719432 19957 5065 244114 3042 288387077427 18919 4827 290651 2701 240
6690649 1413 316 32500 601 31
64742137 1527 240 28256 60 13
65801160 3330 951 57763 462 27
5973884 4750 1203 60899 559 35
55821366 5140 1186 54228 328 74
East
West
North
South
Central
Hermitage
County
10.95%42.01% -3.15% -15.51% 15.78% -9.21% -27.91%
Prior 52 WeeksLast 52 Weeks% Change
Prior 52 WeeksLast 52 Weeks% Change
Prior 52 WeeksLast 52 Weeks% Change
Prior 52 WeeksLast 52 Weeks% Change
Prior 52 WeeksLast 52 Weeks% Change
Prior 52 WeeksLast 52 Weeks% Change
Prior 52 WeeksLast 52 Weeks% Change
11.95%-17.76% -4.32% -3.18% 4.62% -0.30% -11.90%
0.30%-22.12% -6.77% 0.00% 16.67% -10.95% 3.45%
16.14%-10.53% -6.05% -2.27% 23.59% -10.85% -32.69%
18.53%-45.53% -6.15% -19.73% 29.79% -22.08% 8.33%
35.06%0.35% -4.50% -5.28% 31.01% -18.95% -30.77%
15.99%-21.26% -5.20% -4.70% 19.06% -11.21% -16.67%
7047
54
73
64
26
33
320195
37
19
31
28
33
-31.48%
-54.79%
-32.86%
-56.25%
-26.92%
-6.06%
-39.06%
Begin Date 1/17/2009 End Date 1/16/2010
Begin Date 1/18/2008 End Date 1/16/2009Prior 52 Weeks
Last 52 Weeks
Source: Metropolitan Police Department's Computer Aided Dispatch system records. Figures include call ten codes of 10-45, 10-46, 10-93, 10-83, 10-58, 10-40, and 10-52. This report is intended to be a management and planning tool and does not reflect the official UCR counts for the department.

of Nashville and Davidson County
METROPOLITAN POLICE DEPARTMENT
HOMICIDE MEASURES
Begin Date 1/10/2010 End Date 1/16/2010
COMPSTAT WEEKLY ANALYSIS: Is provided by the MNPD Crime Analysis Section. This document does not reflect official UCR counts. This document is intended to be a management tool and is for LAW ENFORCEMENT USE ONLY.
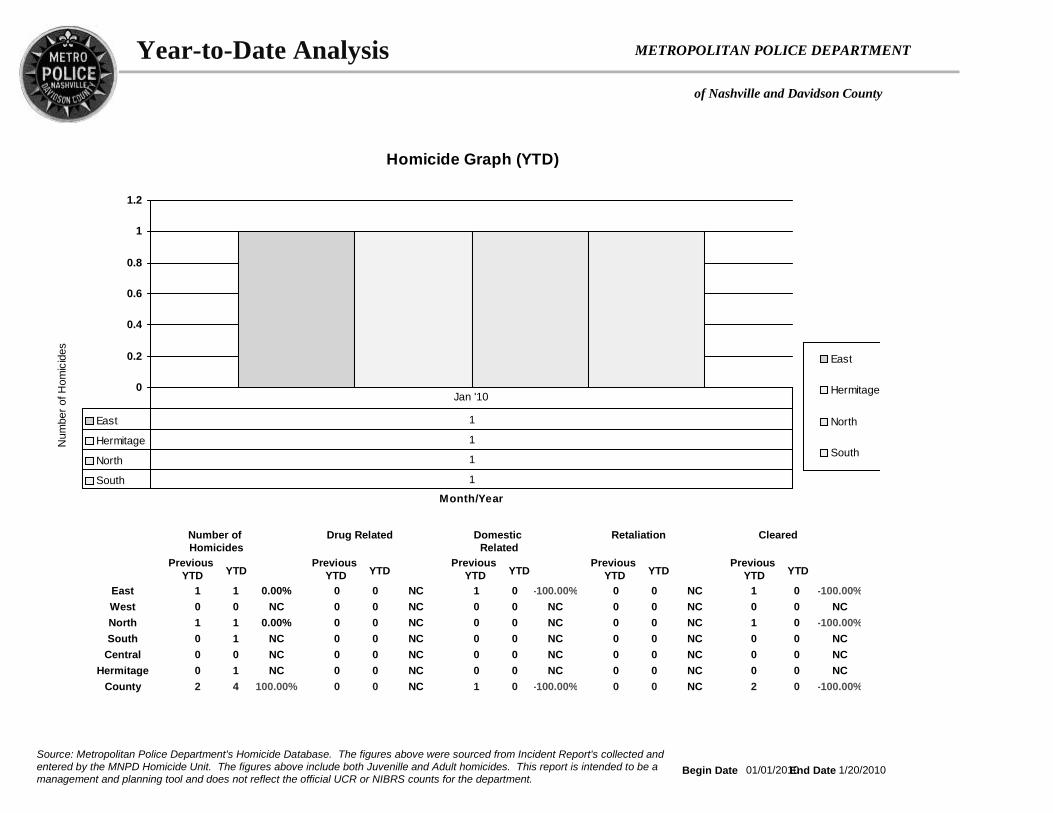
of Nashville and Davidson County
METROPOLITAN POLICE DEPARTMENTYear-to-Date Analysis
Homicide Graph (YTD)
0
0.2
0.4
0.6
0.8
1
1.2
Month/Year
Num
ber o
f Hom
icid
es
East
Hermitage
North
South
East 1
Hermitage 1
North 1
South 1
Jan '10
1 1
10
0002 4
1
01
1
0EastWestNorthSouth
HermitageCounty
0.00%NC
0.00%NCNCNC
100.00%
Central
Previous YTD YTD
Number of Homicides
0 0
00
0000 0
0
00
0
0NCNCNCNCNCNCNC
Previous YTD YTD
Drug Related
0 0
10
0001 0
0
00
0
0-100.00%
NCNCNCNCNC
-100.00%
Previous YTD YTD
Domestic Related
0 0
00
0000 0
0
00
0
0NCNCNCNCNCNCNC
Previous YTD YTD
Retaliation
1 0
10
0002 0
0
00
0
0-100.00%
NC-100.00%
NCNCNC
-100.00%
Previous YTD YTD
Cleared
Begin Date 01/01/2010End Date 1/20/2010Source: Metropolitan Police Department's Homicide Database. The figures above were sourced from Incident Report's collected and entered by the MNPD Homicide Unit. The figures above include both Juvenille and Adult homicides. This report is intended to be a management and planning tool and does not reflect the official UCR or NIBRS counts for the department.

of Nashville and Davidson County
METROPOLITAN POLICE DEPARTMENTRolling Twenty-Four Month Analysis
Homicide Graph (Rolling 52 Weeks)
0
1
2
3
4
5
Month/Year
Num
ber o
f Hom
icid
es
CenEasHermNortSouWes
Central 1 1 0 1 0 0 0 0 0 0 1 1
East 0 2 1 2 1 0 0 1 2 1 0 2
Hermitage 1 1 0 1 1 1 0 0 2 1 0 0
North 1 0 1 2 0 0 2 1 1 2 4 1
South 2 0 1 3 1 2 0 3 2 2 1 2
West 0 2 0 0 3 0 1 0 0 0 0 0
Apr '04 May '04 Jun '04 Jul '04 Aug '04 Sep '04 Oct '04 Nov '04 Dec '04 Jan '05 Feb '05 Mar '05
21 34
1713
2131186 85
13
213
14
9EastWestNorthSouth
HermitageCounty
-23.53%-30.77%61.90%-33.33%-33.33%18.18%-1.16%
Central
Prior 52 Weeks
Last 52 Weeks
Number of Homicides
0 0
01
2025 0
0
00
0
0NC
-100.00%NC
-100.00%NC
-100.00%-100.00%
Drug Related
2 1
12
4009 5
1
10
1
10.00%
-50.00%-50.00%-75.00%
NCNC
-44.44%
Domestic Related
0 0
20
1003 0
0
00
0
0-100.00%
NCNC
-100.00%NCNC
-100.00%
Retaliation
15 15
1212
130961 42
8
18
6
4-33.33%-66.67%0.00%
-53.85%NC
-11.11%-31.15%
Cleared
Prior 52 Weeks
Last 52 Weeks
Prior 52 Weeks
Last 52 Weeks
Prior 52 Weeks
Last 52 Weeks
Prior 52 Weeks
Last 52 Weeks
Begin Date 1/16/2009 End Date 1/16/2010Source: Metropolitan Police Department's Homicide Database. The figures above were sourced from Incident Report's collected and entered by the MNPD Homicide Unit. The figures above include both Juvenille and Adult homicides. This report is intended to be a management and planning tool and does not reflect the official UCR or NIBRS counts for the department.
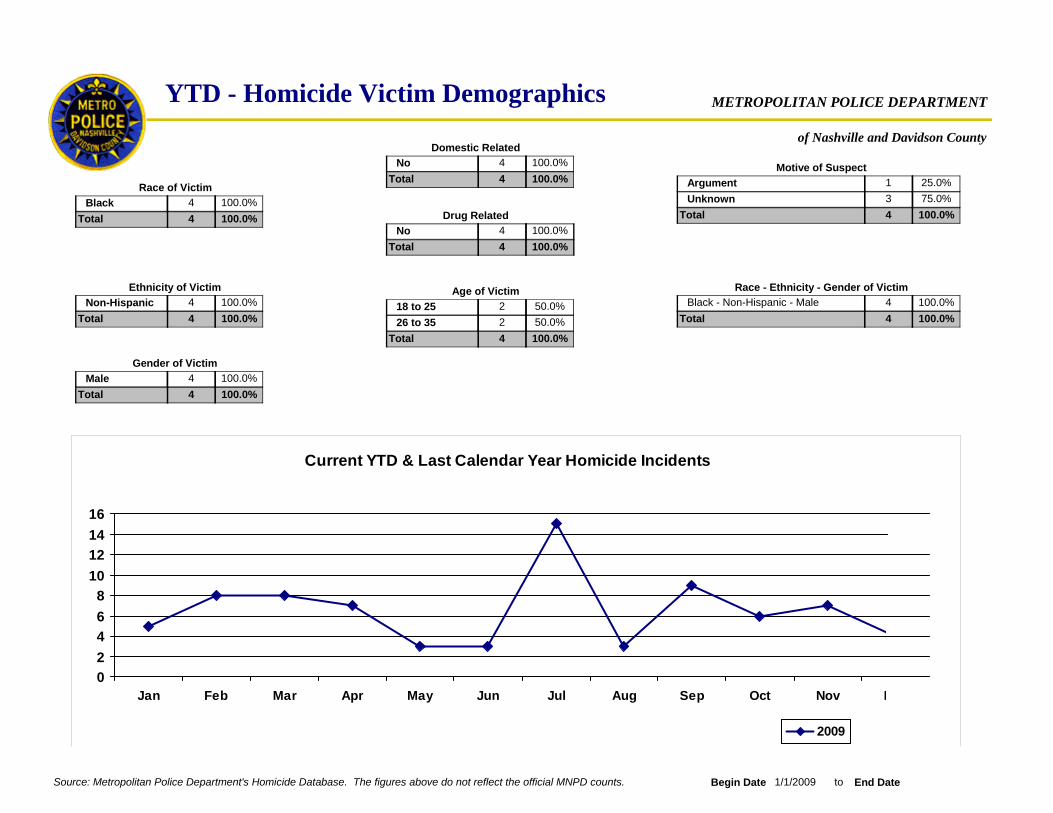
Current YTD & Last Calendar Year Homicide Incidents
02468
10121416
Jan Feb Mar Apr May Jun Jul Aug Sep Oct Nov D
2009
YTD - Homicide Victim Demographicsof Nashville and Davidson County
METROPOLITAN POLICE DEPARTMENT
Race - Ethnicity - Gender of VictimBlack - Non-Hispanic - Male 4 100.0%
4 100.0%Total
Ethnicity of VictimNon-Hispanic 4 100.0%
4 100.0%Total
Motive of SuspectArgument 1 25.0%Unknown 3 75.0%
4 100.0%TotalDrug RelatedNo 4 100.0%
4 100.0%Total
Domestic RelatedNo 4 100.0%
4 100.0%Total
Gender of VictimMale 4 100.0%
4 100.0%Total
Race of VictimBlack 4 100.0%
4 100.0%Total
Age of Victim18 to 25 2 50.0%26 to 35 2 50.0%
4 100.0%Total
Source: Metropolitan Police Department's Homicide Database. The figures above do not reflect the official MNPD counts. Begin Date 1/1/2009 to End Date

Total Homicides Reported Since 1966 by Month
0102030405060708090
Jan Feb Mar Apr May Jun Jul Aug Sep Oct Nov Dec
TOTAL - Homicide Victim Demographicsof Nashville and Davidson County
METROPOLITAN POLICE DEPARTMENT
Race - Ethnicity - Gender of VictimAm Indian/Alaskan - Non-Hispanic - 1 0.1%Asian - Non-Hispanic - Female 1 0.1%Asian - Non-Hispanic - Male 7 0.8%Black - Non-Hispanic - Female 92 11.0%Black - Non-Hispanic - Male 387 46.3%Unknown - Hispanic - Female 1 0.1%Unknown - Hispanic - Male 1 0.1%Unknown - Non-Hispanic - Female 10 1.2%Unknown - Non-Hispanic - Male 5 0.6%White - Hispanic - Female 7 0.8%White - Hispanic - Male 62 7.4%White - Non-Hispanic - Female 81 9.7%White - Non-Hispanic - Male 181 21.7%
836 100.0%Total
Ethnicity of VictimHispanic 71 8.5%Non-Hispanic 765 91.5%
836 100.0%Total
Motive of SuspectArgument 124 14.8%Commision of Another Crime 132 15.8%Domestic 45 5.4%Drugs 40 4.8%Gang Member 3 0.4%Gang Related 5 0.6%Non Gang Member 1 0.1%Not Gang Member 2 0.2%Random 5 0.6%Retaliation 27 3.2%Unknown 452 54.1%
836 100.0%Total
Drug RelatedYes 73 8.7%No 763 91.3%
836 100.0%Total
Domestic RelatedYes 71 8.5%No 765 91.5%
836 100.0%Total
Gender of VictimMale 643 76.9%Female 193 23.1%
836 100.0%Total
Race of VictimWhite 331 39.6%Black 479 57.3%Am Indian/Alas 1 0.1%Asian 8 1.0%Unknown 17 2.0%
836 100.0%Total
Age of VictimLess than 14 30 3.6%14 to 18 35 4.2%18 to 25 233 27.9%26 to 35 169 20.2%36 to 50 160 19.1%51 or Older 91 10.9%Unknown 118 14.1%
836 100.0%Total
Source: Metropolitan Police Department's Homicide Database. The figures above do not reflect the official MNPD counts. Begin Date 1/1/1966 to End Date
of Nashville and Davidson County
METROPOLITAN POLICE DEPARTMENT
JUVENILE SECTION
Begin Date End Date
COMPSTAT WEEKLY ANALYSIS: Is provided by the MNPD Crime Analysis Section. This document does not reflect official UCR counts. This document is intended to be a management tool and is for LAW ENFORCEMENT USE ONLY.

Juvenile Curfew Violation Analysis
of Nashville and Davidson County
METROPOLITAN POLICE DEPARTMENT
Prior Week
Last Week
Difference % Change
Prior 4Wks
Last 4Wks
Difference % Change
Prior YTD
YTD Difference % Change
Prior 52Wk
Last 52Wk
Difference % Change
Begin Date 1/18/2008 to End Date
East
West
North
South
Cent
Herm
Cnty
283 170
68
88
122
44
92
784 661
92
39
94
127
75
35.29%
-14.77%
-39.93%
4.10%
-11.36%
2.17%
-15.69%
0 0
0
0
0
0
0
0 0
0
0
0
0
0
NC
NC
NC
NC
NC
NC
NC
0 0
2
3
7
0
3
18 0
0
0
0
0
0
-100.00%
-100.00%
NC
-100.00%
NC
-100.00%
-100.00%
5 0
1
2
2
0
1
11 0
0
0
0
0
0
-100.00%
-100.00%
-100.00%
-100.00%
NC
#Div/0!
-100.00%
24
-13
-113
5
-5
2
-123
0
0
0
0
0
0
0
-2
-3
0
-7
0
-3
-18
-1
-2
-5
-2
0
-1
-11
0 0
0 0
0 0
0
0
0
0 0
0
0
0
0 0
0
1
0
0
10
11 0
0
0
0
0
0
2 0
6
1
4
1
1
18 0
0
0
0
0
0
55 42
32
36
50
20
56
340 319
20
21
108
60
40
NC
NC
NC
NC
NC
NC
NC
0
0
0
0
0
0
0
NC
-100.00%
NC
NC
NC
-100.00%
-100.00%
0
-1
0
0
0
-10
-11
-100.00%
-100.00%
-100.00%
-100.00%
-100.00%
-100.00%
-100.00%
-6
-1
-2
-4
-1
-1
-18
-37.50%
11.11%
-23.64%
20.00%
5.00%
92.86%
-6.18%
-12
4
-13
10
1
52
-211124 980 -12.81%0 0 NC 29 0 -100.00% 29 0 -100.00% -1440 -29 -29
148 202 36.49%0 0 NC 13 0 -100.00% 2 0 -100.00% 540 -13 -2
64 60 -6.25%0 0 NC 0 0 NC 1 0 -100.00% -40 0 -1
172 187 8.72%0 0 NC 7 0 -100.00% 6 0 -100.00% 150 -7 -6
338 212 -37.28%0 0 NC 0 0 NC 7 0 -100.00% -1260 0 -7
124 115 -7.26%0 0 NC 4 0 -100.00% 3 0 -100.00% -90 -4 -3
100 112 12.00%0 0 NC 2 0 -100.00% 7 0 -100.00% 120 -2 -7
Physical ArrestsCitations IssuedTotal
Other 85 62 -27.06%0 0 NC 3 0 -100.00% 0 0 NC -230 -3 00 0 0 0 3 0 88 26NC0 NC0 -100.00%-3 -70.45%-62
173 88 -49.13%0 0 NC 3 0 -100.00% 3 0 -100.00% -850 -3 -3
Physical ArrestsCitations IssuedTotal
Physical ArrestsCitations IssuedTotal
Physical ArrestsCitations IssuedTotal
Physical ArrestsCitations IssuedTotal
Physical ArrestsCitations IssuedTotal
Physical ArrestsCitations IssuedTotal
Physical ArrestsCitations IssuedTotal
Source: Metropolitan Police Department's COMPSTAT Database System. The figures above were sourced from Juvenile Citations and Arrest Reports. Assignment is given to the Precint in which the arresting officer is assigned. The figures above include only Juvenille records. This report includes the number of Juvenile Citations and Physical Arrests (Metro Code 11.28.210 Curfew for juveniles Ord. BL99-1 § 1 (part), 1999) for the above referenced time period and has a degree of error of approximately 1%. *Data integrity issues prevent historical figures from reflecting accurate numbers prior to 2004. This report is intended to be a management and planning tool and does not reflect the official Juvenile Citation and Physical Arrest counts for the department.

Truancy Violation Analysis
of Nashville and Davidson County
METROPOLITAN POLICE DEPARTMENT
Prior Week
Last Week
Difference % Change
Prior 4Wks
Last 4Wks
Difference % Change
Prior YTD
YTD Difference % Change
Prior 52Wk
Last 52Wk
Difference % Change
Begin Date 1/18/2008 to End Date
East
West
North
South
Cent
Herm
Cnty
86 67
72
39
22
34
79
401 364
124
8
45
36
45
72.22%
15.38%
-22.09%
63.64%
-76.47%
-43.04%
-9.23%
0 0
0
0
0
0
0
0 0
0
0
0
0
0
NC
NC
NC
NC
NC
NC
NC
6 0
1
2
1
0
3
14 0
0
0
0
0
0
-100.00%
-100.00%
-100.00%
-100.00%
NC
-100.00%
-100.00%
4 0
7
2
1
0
1
16 0
0
0
0
0
0
-100.00%
-100.00%
-100.00%
-100.00%
NC
#Div/0!
-100.00%
52
6
-19
14
-26
-34
-37
0
0
0
0
0
0
0
-1
-2
-6
-1
0
-3
-14
-7
-2
-4
-1
0
-1
-16
0 0
0 0
0 0
0
0
0
0 0
0
0
0
7 0
2
5
0
1
3
19 0
0
0
0
0
0
3 0
8
2
0
0
7
21 0
0
0
0
0
0
59 68
78
119
65
8
237
688 544
127
6
160
33
106
NC
NC
NC
NC
NC
NC
NC
0
0
0
0
0
0
0
-100.00%
-100.00%
-100.00%
NC
-100.00%
-100.00%
-100.00%
-2
-5
-7
0
-1
-3
-19
-100.00%
-100.00%
-100.00%
NC
NC
-100.00%
-100.00%
-8
-2
-3
0
0
-7
-21
62.82%
-10.92%
15.25%
-49.23%
-25.00%
-32.49%
-20.93%
49
-13
9
-32
-2
-77
-1441089 908 -16.62%0 0 NC 33 0 -100.00% 37 0 -100.00% -1810 -33 -37
316 205 -35.13%0 0 NC 6 0 -100.00% 8 0 -100.00% -1110 -6 -8
42 14 -66.67%0 0 NC 1 0 -100.00% 0 0 NC -280 -1 0
87 69 -20.69%0 0 NC 1 0 -100.00% 1 0 -100.00% -180 -1 -1
145 135 -6.90%0 0 NC 13 0 -100.00% 7 0 -100.00% -100 -13 -7
158 151 -4.43%0 0 NC 7 0 -100.00% 4 0 -100.00% -70 -7 -4
150 251 67.33%0 0 NC 3 0 -100.00% 15 0 -100.00% 1010 -3 -15
Physical ArrestsCitations IssuedTotal
Other 66 39 -40.91%0 0 NC 1 0 -100.00% 1 0 -100.00% -270 -1 -10 0 0 0 1 0 121 40NC0 NC0 -100.00%-1 -66.94%-81
187 79 -57.75%0 0 NC 1 0 -100.00% 2 0 -100.00% -1080 -1 -2
Physical ArrestsCitations IssuedTotal
Physical ArrestsCitations IssuedTotal
Physical ArrestsCitations IssuedTotal
Physical ArrestsCitations IssuedTotal
Physical ArrestsCitations IssuedTotal
Physical ArrestsCitations IssuedTotal
Physical ArrestsCitations IssuedTotal
Source: Metropolitan Police Department's COMPSTAT Database System. The figures above were sourced from Juvenile Citations and Arrest Reports. Assignment is given to the Precint in which the arresting officer is assigned. The figures above include only Juvenille records. This report includes the number of Juvenile Citations and Physical Arrests (Metro Code 11.28.080 Loitering during school hours -- Ord. 95-1329 § 2 (part), 1995) for the above referenced time period and has a degree of error of approximately 1%. *Data integrity issues prevent historical figures from reflecting accurate numbers prior to 2004. This report is intended to be a management and planning tool and does not reflect the official Juvenile Citation and Physical Arrest counts for the department.

Outstanding Juvenile Warrants Served-by-Arrest Analysis
of Nashville and Davidson County
METROPOLITAN POLICE DEPARTMENT
Prior Week
Last Week
Difference % Change
Prior 4Wks
Last 4Wks
Difference % Change
Prior YTD
YTD Difference % Change
Prior 52Wk
Last 52Wk
Difference % Change
Begin Date 1/18/2008 to End Date
East
West
North
South
Cent
Herm
Cnty
82 83
48
23
35
7
46
476 476
52
17
38
44
32
8.33%
39.13%
1.22%
25.71%
142.86%
-17.39%
0.00%
0 0
0
0
0
0
0
0 0
0
0
0
0
0
NC
NC
NC
NC
NC
NC
NC
2 0
0
0
1
0
1
5 0
0
0
0
0
0
NC
NC
-100.00%
-100.00%
NC
-100.00%
-100.00%
6 0
4
1
5
0
2
25 0
0
0
0
0
0
-100.00%
-100.00%
-100.00%
-100.00%
NC
#Div/0!
-100.00%
4
9
1
9
10
-8
0
0
0
0
0
0
0
0
0
0
-2
-1
0
-1
-5
-4
-1
-6
-5
0
-2
-25
0 0
0 0
0 0
0
0
0
0 0
0
0
0
1 0
0
0
1
0
4
8 0
0
0
0
0
0
9 0
1
2
1
0
3
23 0
0
0
0
0
0
71 49
44
22
40
14
46
362 329
48
16
43
40
27
NC
NC
NC
NC
NC
NC
NC
0
0
0
0
0
0
0
NC
NC
-100.00%
-100.00%
NC
-100.00%
-100.00%
0
0
-1
-1
0
-4
-8
-100.00%
-100.00%
-100.00%
-100.00%
NC
-100.00%
-100.00%
-1
-2
-9
-1
0
-3
-23
9.09%
22.73%
-30.99%
0.00%
14.29%
-6.52%
-9.12%
4
5
-22
0
2
-3
-331050 812 -22.67%0 0 NC 13 0 -100.00% 49 0 -100.00% -2380 -13 -49
114 81 -28.95%0 0 NC 5 0 -100.00% 5 0 -100.00% -330 -5 -5
27 33 22.22%0 0 NC 0 0 NC 0 0 NC 60 0 0
98 84 -14.29%0 0 NC 2 0 -100.00% 6 0 -100.00% -140 -2 -6
186 133 -28.49%0 0 NC 3 0 -100.00% 15 0 -100.00% -530 -3 -15
57 59 3.51%0 0 NC 0 0 NC 3 0 -100.00% 20 0 -3
137 102 -25.55%0 0 NC 0 0 NC 6 0 -100.00% -350 0 -6
Felony WarrantsMisdemeanor WarrantsTotal Warrants
WAR 7 7 0.00%0 0 NC 0 0 NC 0 0 NC 00 0 00 0 0 0 0 0 5 3NC0 NC0 NC0 -40.00%-2
12 10 -16.67%0 0 NC 0 0 NC 0 0 NC -20 0 0
Other/OofC
228 203 -10.96%0 0 NC 1 0 -100.00% 7 0 -100.00% -250 -1 -70 0 2 0 7 0 120 103NC0 -100.00%-2 -100.00%-7 -14.17%-17
419 310 -26.01%0 0 NC 3 0 -100.00% 14 0 -100.00% -1090 -3 -14
Felony WarrantsMisdemeanor WarrantsTotal Warrants
Felony WarrantsMisdemeanor WarrantsTotal Warrants
Felony WarrantsMisdemeanor WarrantsTotal Warrants
Felony WarrantsMisdemeanor WarrantsTotal Warrants
Felony WarrantsMisdemeanor WarrantsTotal Warrants
Felony WarrantsMisdemeanor WarrantsTotal Warrants
Felony WarrantsMisdemeanor WarrantsTotal Warrants
Felony WarrantsMisdemeanor WarrantsTotal Warrants
Source: Metropolitan Police Department's COMPSTAT Database System. The figures above were sourced from warrants issued. The figures above include Juvenille warrants only. This report includes the number of outstanding warrants served-by-arrest (not instant arrest) for the above referenced time period and has a degree of error of approximately 1%. *Data integrity issues prevent historical figures from reflecting accurate numbers prior to 2004. This report is intended to be a management and planning tool and does not reflect the official Outstanding Warrants Served counts for the department.

of Nashville and Davidson County
METROPOLITAN POLICE DEPARTMENT
Traffic Section
Begin Date End Date
COMPSTAT WEEKLY ANALYSIS: Is provided by the MNPD Crime Analysis Section. This document does not reflect official UCR counts. This document is intended to be a management tool and is for LAW ENFORCEMENT USE ONLY.

Vehicle Stop Data Form Analysis
of Nashville and Davidson County
METROPOLITAN POLICE DEPARTMENT
Prior Week
Last Week
Difference % Change
Prior 4Wks
Last 4Wks
Difference % Change
Prior YTD
YTD Difference % Change
Prior 52Wk
Last 52Wk
Difference % Change
Begin Date 1/18/2008 to End Date 1/16/2010
(By Geographical Area - Not Component)
East
West
North
South
Cent
Herm
Cnty
45497 42659
31614
65131
68762
32436
54784
298295 283941
35504
27110
52516
67369
48762
12.30%
-25.13%
-6.24%
-2.03%
-16.42%
-4.14%
-4.81%
980 1047
686
1393
1241
517
1329
6279 6188
689
447
1047
1521
1338
0.44%
-3.95%
6.84%
22.56%
-13.54%
-21.22%
-1.45%
3022 2434
2406
2987
4437
1821
3407
18481 14938
1744
1208
2920
3209
3133
-27.51%
4.89%
-19.46%
-27.68%
-33.66%
-14.29%
-19.17%
1732 2190
1373
2760
2918
1396
2842
13065 13446
1453
1046
2623
2942
2934
5.83%
6.30%
26.44%
0.82%
-25.07%
-8.35%
2.92%
3890
-16369
-2838
-1393
-5326
-2268
-14354
3
-55
67
280
-70
-282
-91
-662
146
-588
-1228
-613
-487
-3543
80
174
458
24
-350
-219
381
117 131
281 300
274 264
388
158
476
1741 1823
116
417
573
745 609
479
660
1700
490
1248
5481 4157
317
332
1078
1104
639
559 564
429
856
1310
564
1230
4972 3695
256
281
939
988
591
17543 12867
11842
25486
37101
17387
27270
136667 101323
8865
10535
22939
28867
12570
11.97%
6.76%
-3.65%
47.68%
-26.58%
-12.39%
4.71%
14
19
-10
185
-42
-59
82
-33.82%
-3.18%
-18.26%
-35.06%
-32.24%
-13.62%
-24.16%
-162
-21
-136
-596
-158
-170
-1324
-40.33%
-30.96%
0.89%
-24.58%
-50.18%
-23.66%
-25.68%
-173
-265
5
-322
-283
-291
-1277
-25.14%
-50.68%
-26.65%
-22.19%
-39.41%
-15.88%
-25.86%
-2977
-12916
-4676
-8234
-6852
-4331
-3534416614 18791 13.10%419 430 2.63% 1254 975 -22.25% 789 908 15.08% 217711 -279 119
113 122 407 275 333 252 7240 72897.96%9 -32.43%-132 -24.32%-81 0.68%49
2830 3233 14.24%81 55 -32.10% 253 164 -35.18% 157 151 -3.82% 403-26 -89 -621 11 65 37 59 33 1293 1130-90.91%-10 -43.08%-28 -44.07%-26 -12.61%-163
1396 1351 -3.22%27 24 -11.11% 103 60 -41.75% 91 51 -43.96% -45-3 -43 -407 11 49 23 43 19 855 74557.14%4 -53.06%-26 -55.81%-24 -12.87%-110
4436 4880 10.01%78 104 33.33% 286 210 -26.57% 174 195 12.07% 44426 -76 2121 26 76 55 56 51 1427 153323.81%5 -27.63%-21 -8.93%-5 7.43%106
3180 4044 27.17%100 127 27.00% 286 248 -13.29% 143 237 65.73% 86427 -38 9419 28 91 53 69 51 1304 134347.37%9 -41.76%-38 -26.09%-18 2.99%39
2148 2007 -6.56%66 61 -7.58% 126 137 8.73% 92 134 45.65% -141-5 11 4228 32 74 69 49 63 1287 133414.29%4 -6.76%-5 28.57%14 3.65%47
2619 2706 3.32%61 53 -13.11% 167 138 -17.37% 128 125 -2.34% 87-8 -29 -317 13 47 35 55 32 1071 975-23.53%-4 -25.53%-12 -41.82%-23 -8.96%-96
Vehicle StopsTraffic Citation IssuedState Citation IssuedArrest Made
Vehicle StopsTraffic Citation IssuedState Citation IssuedArrest Made
Vehicle StopsTraffic Citation IssuedState Citation IssuedArrest Made
Vehicle StopsTraffic Citation IssuedState Citation IssuedArrest Made
Vehicle StopsTraffic Citation IssuedState Citation IssuedArrest Made
Vehicle StopsTraffic Citation IssuedState Citation IssuedArrest Made
Vehicle StopsTraffic Citation IssuedState Citation IssuedArrest Made
Source: Metropolitan Nashville Police Department's Vehicle Stop Data Form Database. Traffic Citation Issued, State Citation Issued, and Arrest Made are not the total number of citations or arrest issued/made rather, the number of times a citation or arrest was issued/made. This report is intended to be a management and planning tool and does not reflect the official Vehicle Stop counts for the department.
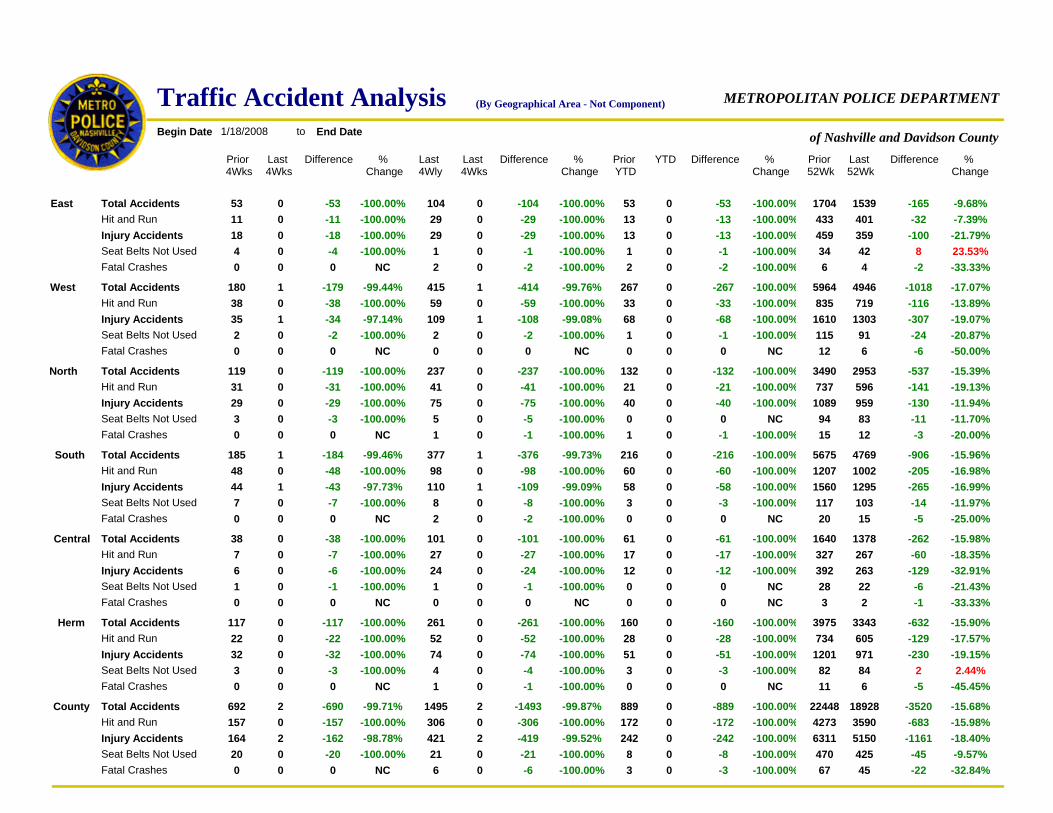
of Nashville and Davidson County
METROPOLITAN POLICE DEPARTMENT
Prior 4Wks
Last 4Wks
Difference % Change
Last 4Wly
Last 4Wks
Difference % Change
Prior YTD
YTD Difference % Change
Prior 52Wk
Last 52Wk
Difference % Change
Traffic Accident Analysis (By Geographical Area - Not Component)
Begin Date 1/18/2008 to End Date
East 1704 1539 -9.68%53 0 -100.00% 104 0 -100.00% 53 0 -100.00% -165-53 -104 -53Total Accidents
Injury AccidentsSeat Belts Not UsedFatal Crashes
Hit and Run
West 5964 4946 -17.07%180 1 -99.44% 415 1 -99.76% 267 0 -100.00% -1018-179 -414 -267Total Accidents
Injury AccidentsSeat Belts Not UsedFatal Crashes
Hit and Run
North 3490 2953 -15.39%119 0 -100.00% 237 0 -100.00% 132 0 -100.00% -537-119 -237 -132Total Accidents
Injury AccidentsSeat Belts Not UsedFatal Crashes
Hit and Run
South 5675 4769 -15.96%185 1 -99.46% 377 1 -99.73% 216 0 -100.00% -906-184 -376 -216Total Accidents
Injury AccidentsSeat Belts Not UsedFatal Crashes
Hit and Run
Central 1640 1378 -15.98%38 0 -100.00% 101 0 -100.00% 61 0 -100.00% -262-38 -101 -61Total Accidents
Injury AccidentsSeat Belts Not UsedFatal Crashes
Hit and Run
Herm 3975 3343 -15.90%117 0 -100.00% 261 0 -100.00% 160 0 -100.00% -632-117 -261 -160Total Accidents
Injury AccidentsSeat Belts Not UsedFatal Crashes
Hit and Run
County 22448 18928 -15.68%692 2 -99.71% 1495 2 -99.87% 889 0 -100.00% -3520-690 -1493 -889Total Accidents
Injury AccidentsSeat Belts Not UsedFatal Crashes
Hit and Run
433 401 -7.39%11 0 -100.00% 29 0 -100.00% 13 0 -100.00% -32-11 -29 -13
835 719 -13.89%38 0 -100.00% 59 0 -100.00% 33 0 -100.00% -116-38 -59 -33
737 596 -19.13%31 0 -100.00% 41 0 -100.00% 21 0 -100.00% -141-31 -41 -21
1207 1002 -16.98%48 0 -100.00% 98 0 -100.00% 60 0 -100.00% -205-48 -98 -60
327 267 -18.35%7 0 -100.00% 27 0 -100.00% 17 0 -100.00% -60-7 -27 -17
734 605 -17.57%22 0 -100.00% 52 0 -100.00% 28 0 -100.00% -129-22 -52 -28
4273 3590 -15.98%157 0 -100.00% 306 0 -100.00% 172 0 -100.00% -683-157 -306 -172
459 359 -21.79%18 0 -100.00% 29 0 -100.00% 13 0 -100.00% -100-18 -29 -13
1610 1303 -19.07%35 1 -97.14% 109 1 -99.08% 68 0 -100.00% -307-34 -108 -68
1089 959 -11.94%29 0 -100.00% 75 0 -100.00% 40 0 -100.00% -130-29 -75 -40
1560 1295 -16.99%44 1 -97.73% 110 1 -99.09% 58 0 -100.00% -265-43 -109 -58
392 263 -32.91%6 0 -100.00% 24 0 -100.00% 12 0 -100.00% -129-6 -24 -12
1201 971 -19.15%32 0 -100.00% 74 0 -100.00% 51 0 -100.00% -230-32 -74 -51
6311 5150 -18.40%164 2 -98.78% 421 2 -99.52% 242 0 -100.00% -1161-162 -419 -242
34 42 23.53%4 0 -100.00% 1 0 -100.00% 1 0 -100.00% 8-4 -1 -16 4 -33.33%0 0 NC 2 0 -100.00% 2 0 -100.00% -20 -2 -2
115 91 -20.87%2 0 -100.00% 2 0 -100.00% 1 0 -100.00% -24-2 -2 -112 6 -50.00%0 0 NC 0 0 NC 0 0 NC -60 0 0
94 83 -11.70%3 0 -100.00% 5 0 -100.00% 0 0 NC -11-3 -5 015 12 -20.00%0 0 NC 1 0 -100.00% 1 0 -100.00% -30 -1 -1
117 103 -11.97%7 0 -100.00% 8 0 -100.00% 3 0 -100.00% -14-7 -8 -320 15 -25.00%0 0 NC 2 0 -100.00% 0 0 NC -50 -2 0
28 22 -21.43%1 0 -100.00% 1 0 -100.00% 0 0 NC -6-1 -1 03 2 -33.33%0 0 NC 0 0 NC 0 0 NC -10 0 0
82 84 2.44%3 0 -100.00% 4 0 -100.00% 3 0 -100.00% 2-3 -4 -311 6 -45.45%0 0 NC 1 0 -100.00% 0 0 NC -50 -1 0
470 425 -9.57%20 0 -100.00% 21 0 -100.00% 8 0 -100.00% -45-20 -21 -867 45 -32.84%0 0 NC 6 0 -100.00% 3 0 -100.00% -220 -6 -3

of Nashville and Davidson County
METROPOLITAN POLICE DEPARTMENT
Prior 52Wk
Last 52Wk
Difference % Change
52 Week Traffic Accident Trend Analysis (By Precinct and Component)Begin Date 1/18/2008 to End Date
East 1654 1627 -1.63%-27Total Accidents Handled by Patrol, Bikes, Motors, etc.Total Accidents Handled by Precinct Crash Unit
West 4631 4003 -13.56%-628
North 2688 2736 1.79%48
South 4174 3662 -12.27%-512
Central 1602 1356 -15.36%-246
Hermitage 3212 2853 -11.18%-359
County 22448 18928 -15.68%-3520Total Accidents by All Units County Wide
0 0 NC0
605 509 -15.87%-96
647 3 -99.54%-644
1261 3 -99.76%-1258
623 492 -21.03%-131
Last 52 Week County Wide (Hour of Day)
0
500
1000
1500
2000
0 1 2 3 4 5 6 7 8 9 10 11 12 13 14 15 16 17 18 19 20 21 22
Hour
Num
ber o
f Ac
cice
nts
Total Accidents Handled by Patrol, Bikes, Motors, etc.Total Accidents Handled by Precinct Crash Unit
Total Accidents Handled by Patrol, Bikes, Motors, etc.Total Accidents Handled by Precinct Crash Unit
Total Accidents Handled by Patrol, Bikes, Motors, etc.Total Accidents Handled by Precinct Crash Unit
Total Accidents Handled by Patrol, Bikes, Motors, etc.Total Accidents Handled by Precinct Crash Unit
Total Accidents Handled by Patrol, Bikes, Motors, etc.
32842687
2427
193527972817
2981
1500 2000 2500 3000 3500 4000 4500
Number of Accidents
Friday
Monday
Saturday
Sunday
Thursday
Tuesday
Wednesday
Day
of W
eek
Last 52 Week County Wide (Day of Week)

of Nashville and Davidson County
METROPOLITAN POLICE DEPARTMENT
MISCELLANEOUS MEASURES
Begin Date End Date
COMPSTAT WEEKLY ANALYSIS: Is provided by the MNPD Crime Analysis Section. This document does not reflect official UCR counts. This document is intended to be a management tool and is for LAW ENFORCEMENT USE ONLY.
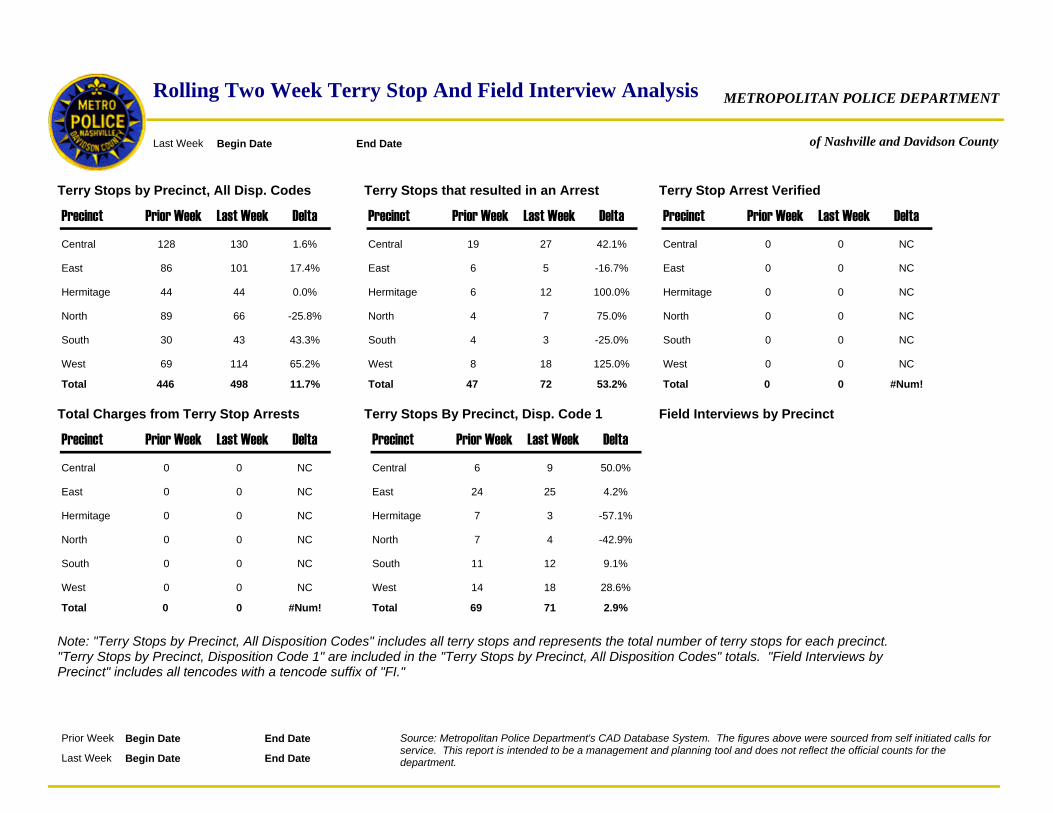
of Nashville and Davidson County
METROPOLITAN POLICE DEPARTMENTRolling Two Week Terry Stop And Field Interview Analysis
Begin Date End DateLast Week
Terry Stops by Precinct, All Disp. Codes Terry Stops that resulted in an Arrest Terry Stop Arrest Verified
Total Charges from Terry Stop Arrests Field Interviews by PrecinctTerry Stops By Precinct, Disp. Code 1
Note: "Terry Stops by Precinct, All Disposition Codes" includes all terry stops and represents the total number of terry stops for each precinct. "Terry Stops by Precinct, Disposition Code 1" are included in the "Terry Stops by Precinct, All Disposition Codes" totals. "Field Interviews by Precinct" includes all tencodes with a tencode suffix of "FI."
Precinct Prior Week Last Week DeltaCentral 128 130 1.6%
East 86 101 17.4%
Hermitage 44 44 0.0%
North 89 66 -25.8%
South 30 43 43.3%
West 69 114 65.2%
446 498Total 11.7%
Precinct Prior Week Last Week DeltaCentral 19 27 42.1%
East 6 5 -16.7%
Hermitage 6 12 100.0%
North 4 7 75.0%
South 4 3 -25.0%
West 8 18 125.0%
47 72Total 53.2%
Precinct Prior Week Last Week DeltaCentral 0 0 NC
East 0 0 NC
Hermitage 0 0 NC
North 0 0 NC
South 0 0 NC
West 0 0 NC
0 0Total #Num!
Precinct Prior Week Last Week DeltaCentral 0 0 NC
East 0 0 NC
Hermitage 0 0 NC
North 0 0 NC
South 0 0 NC
West 0 0 NC
0 0Total #Num!
Precinct Prior Week Last Week DeltaCentral 6 9 50.0%
East 24 25 4.2%
Hermitage 7 3 -57.1%
North 7 4 -42.9%
South 11 12 9.1%
West 14 18 28.6%
69 71Total 2.9%
Begin Date End Date
Begin Date End DatePrior Week
Last Week
Source: Metropolitan Police Department's CAD Database System. The figures above were sourced from self initiated calls for service. This report is intended to be a management and planning tool and does not reflect the official counts for the department.

Auto Theft Four Week Analysisof Nashville and Davidson County
METROPOLITAN POLICE DEPARTMENT
to End Date 12/28/2009Begin Date 11/22/2009
43
0 0 0 0 0 0 0 0 0 0
8
5
0
5
2
1
2
2
2
East
West
North
South
Central
Hermitage
TheftsRecoveries 1 1 0 0 0 0 0 0 0
2 1 0 0 1 0 0 0 0 2TheftsRecoveries
10 0 0 0 0 0 0 0 0 0 1
0 0 1 1 0 0 0 0 1 0TheftsRecoveries
10 0 0 1 1 0 1 0 0 0 0
0 0 1 0 0 0 0 0 0 1TheftsRecoveries
01 0 0 0 0 0 0 0 0 0 1
0 0 0 0 0 0TheftsRecoveries 0 0 1 0 0 0
0 1 0 0 0 1 0 0 2 1TheftsRecoveries 0 1 0 0 0 0 1 0 0 0
211 213 215 221 223 225 231 233 235
111 113 115 117 119 121 123 125 127 131 133
0 10 1
135 137
0 00 0
611 613 615 617 621 623 625 627 631 633 635 637 639
20
311 313 315 317 321 323 325 327 331 333 335 337
411 413 415 421 423 425
511 513 515 517 521 523 525 531 533 535
2212
Total Auto TheftsTotal Recoveries
Zone
Zone
Zone
Zone
Zone
Zone
339
10
537
00
Source: Metropolitan Police Department's Incident Based Reporting System. The figures above were sourced from Incident Reports using Uniform Crime Reporting definitions and reporting guidlines. This report is intended to be a management and planning tool and does not reflect the official UCR counts for the department.
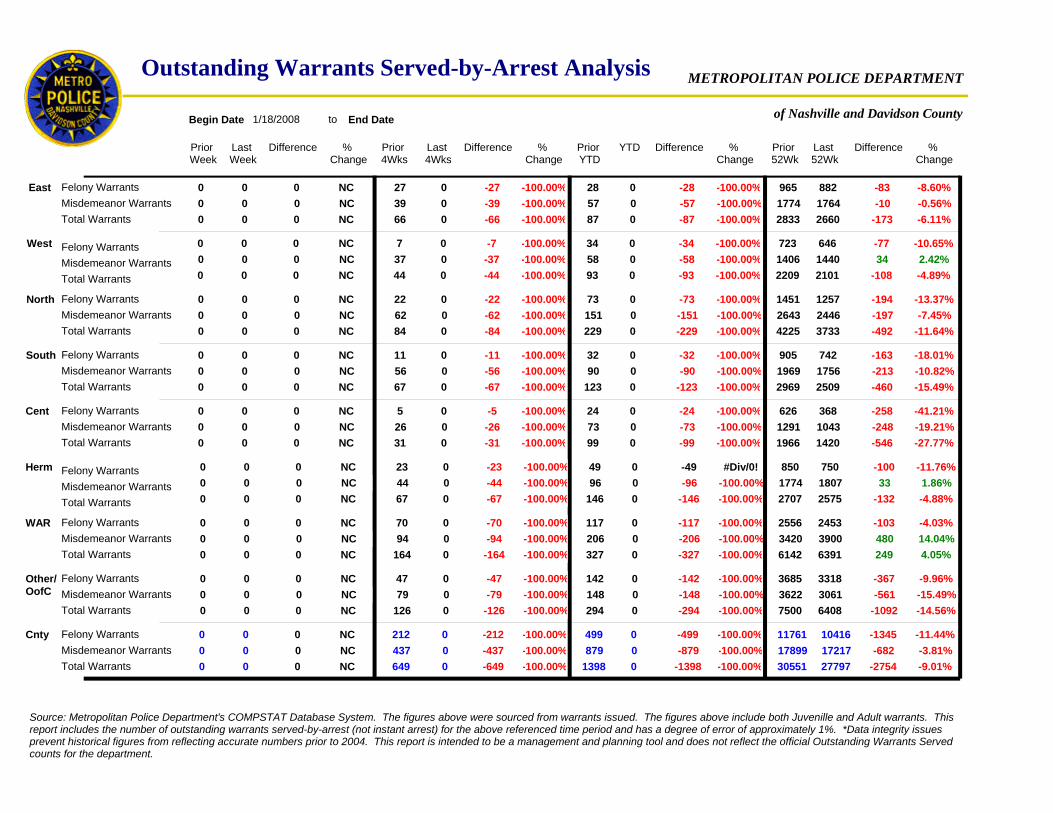
Outstanding Warrants Served-by-Arrest Analysis
of Nashville and Davidson County
METROPOLITAN POLICE DEPARTMENT
Prior Week
Last Week
Difference % Change
Prior 4Wks
Last 4Wks
Difference % Change
Prior YTD
YTD Difference % Change
Prior 52Wk
Last 52Wk
Difference % Change
Begin Date 1/18/2008 to End Date
East
West
North
South
Cent
Herm
Cnty
1451 1257
965
723
905
626
850
11761 10416
882
368
750
742
646
-8.60%
-10.65%
-13.37%
-18.01%
-41.21%
-11.76%
-11.44%
0 0
0
0
0
0
0
0 0
0
0
0
0
0
NC
NC
NC
NC
NC
NC
NC
22 0
27
7
11
5
23
212 0
0
0
0
0
0
-100.00%
-100.00%
-100.00%
-100.00%
-100.00%
-100.00%
-100.00%
73 0
28
34
32
24
49
499 0
0
0
0
0
0
-100.00%
-100.00%
-100.00%
-100.00%
-100.00%
#Div/0!
-100.00%
-83
-77
-194
-163
-258
-100
-1345
0
0
0
0
0
0
0
-27
-7
-22
-11
-5
-23
-212
-28
-34
-73
-32
-24
-49
-499
0 0
0 0
0 0
0
0
0
0 0
0
0
0
62 0
39
37
56
26
44
437 0
0
0
0
0
0
151 0
57
58
90
73
96
879 0
0
0
0
0
0
2643 2446
1774
1406
1969
1291
1774
17899 17217
1764
1043
1807
1756
1440
NC
NC
NC
NC
NC
NC
NC
0
0
0
0
0
0
0
-100.00%
-100.00%
-100.00%
-100.00%
-100.00%
-100.00%
-100.00%
-39
-37
-62
-56
-26
-44
-437
-100.00%
-100.00%
-100.00%
-100.00%
-100.00%
-100.00%
-100.00%
-57
-58
-151
-90
-73
-96
-879
-0.56%
2.42%
-7.45%
-10.82%
-19.21%
1.86%
-3.81%
-10
34
-197
-213
-248
33
-68230551 27797 -9.01%0 0 NC 649 0 -100.00% 1398 0 -100.00% -27540 -649 -1398
2707 2575 -4.88%0 0 NC 67 0 -100.00% 146 0 -100.00% -1320 -67 -146
1966 1420 -27.77%0 0 NC 31 0 -100.00% 99 0 -100.00% -5460 -31 -99
2969 2509 -15.49%0 0 NC 67 0 -100.00% 123 0 -100.00% -4600 -67 -123
4225 3733 -11.64%0 0 NC 84 0 -100.00% 229 0 -100.00% -4920 -84 -229
2209 2101 -4.89%0 0 NC 44 0 -100.00% 93 0 -100.00% -1080 -44 -93
2833 2660 -6.11%0 0 NC 66 0 -100.00% 87 0 -100.00% -1730 -66 -87
Felony WarrantsMisdemeanor WarrantsTotal Warrants
WAR 2556 2453 -4.03%0 0 NC 70 0 -100.00% 117 0 -100.00% -1030 -70 -1170 0 94 0 206 0 3420 3900NC0 -100.00%-94 -100.00%-206 14.04%480
6142 6391 4.05%0 0 NC 164 0 -100.00% 327 0 -100.00% 2490 -164 -327
Other/OofC
3685 3318 -9.96%0 0 NC 47 0 -100.00% 142 0 -100.00% -3670 -47 -1420 0 79 0 148 0 3622 3061NC0 -100.00%-79 -100.00%-148 -15.49%-561
7500 6408 -14.56%0 0 NC 126 0 -100.00% 294 0 -100.00% -10920 -126 -294
Felony WarrantsMisdemeanor WarrantsTotal Warrants
Felony WarrantsMisdemeanor WarrantsTotal Warrants
Felony WarrantsMisdemeanor WarrantsTotal Warrants
Felony WarrantsMisdemeanor WarrantsTotal Warrants
Felony WarrantsMisdemeanor WarrantsTotal Warrants
Felony WarrantsMisdemeanor WarrantsTotal Warrants
Felony WarrantsMisdemeanor WarrantsTotal Warrants
Felony WarrantsMisdemeanor WarrantsTotal Warrants
Source: Metropolitan Police Department's COMPSTAT Database System. The figures above were sourced from warrants issued. The figures above include both Juvenille and Adult warrants. This report includes the number of outstanding warrants served-by-arrest (not instant arrest) for the above referenced time period and has a degree of error of approximately 1%. *Data integrity issues prevent historical figures from reflecting accurate numbers prior to 2004. This report is intended to be a management and planning tool and does not reflect the official Outstanding Warrants Served counts for the department.

Outstanding Warrants Cleared Analysis
of Nashville and Davidson County
METROPOLITAN POLICE DEPARTMENT
Prior Week
Last Week
Difference % Change
Prior 4Wks
Last 4Wks
Difference % Change
Prior YTD
YTD Difference % Change
Prior 52Wk
Last 52Wk
Difference % Change
Begin Date 1/18/2008 to End Date
Served without Arrest
Recalled
Cancelled
Dismissed
Retired
Five Year Rule
Warrant Totals
44 55
30
552
19
3
164
977 746
17
0
24
8
446
-43.33%
-19.20%
25.00%
-57.89%
-100.00%
-85.37%
-23.64%
0 0
0
0
0
0
0
0 0
0
0
0
0
0
NC
NC
NC
NC
NC
NC
NC
1 0
2
8
0
0
0
17 0
0
0
0
0
0
-100.00%
-100.00%
-100.00%
NC
NC
NC
-100.00%
0 0
2
13
0
0
1
19 0
0
0
0
0
0
-100.00%
-100.00%
NC
NC
NC
#Div/0!
-100.00%
-13
-106
11
-11
-3
-140
-231
0
0
0
0
0
0
0
-2
-8
-1
0
0
0
-17
-2
-13
0
0
0
-1
-19
0 0
0 0
0 0
0
0
0
0 0
0
0
0
3 0
13
42
4
0
0
62 0
0
0
0
0
0
0 0
18
100
1
0
103
234 0
0
0
0
0
0
52 35
695
2088
32
0
2884
6056 5649
431
0
3008
57
1844
NC
NC
NC
NC
NC
NC
NC
0
0
0
0
0
0
0
-100.00%
-100.00%
-100.00%
-100.00%
NC
NC
-100.00%
-13
-42
-3
-4
0
0
-62
-100.00%
-100.00%
NC
-100.00%
NC
-100.00%
-100.00%
-18
-100
0
-1
0
-103
-234
-37.99%
-11.69%
-32.69%
78.13%
NC
4.30%
-6.72%
-264
-244
-17
25
0
124
-407
Felony WarrantsMisdemeanor Warrants
Abated by Death49 62 26.53%0 0 NC 0 0 NC 0 0 NC 130 0 0
0 0 0 0 0 0 90 70NC0 NC0 NC0 -22.22%-20
Other116 134 15.52%0 0 NC 6 0 -100.00% 3 0 -100.00% 180 -6 -3
0 0 0 0 12 0 215 204NC0 NC0 -100.00%-12 -5.12%-11
Felony WarrantsMisdemeanor Warrants
Felony WarrantsMisdemeanor Warrants
Felony WarrantsMisdemeanor Warrants
Felony WarrantsMisdemeanor Warrants
Felony WarrantsMisdemeanor Warrants
Felony WarrantsMisdemeanor Warrants
Felony WarrantsMisdemeanor Warrants
Felony WarrantsMisdemeanor Warrants
Source: Metropolitan Police Department's COMPSTAT Database System. The figures above were sourced from warrants issued. The figures above include both Juvenille and Adult warrants. This report includes the number of outstanding warrants cleared for the above referenced time period and has a degree of error of approximately 1%. *Data integrity issues prevent some numbers from being accurate prior to 2004. This report is intended to be a management and planning tool and does not reflect the official Outstanding Warrants Cleared counts for the department.

Outstanding Warrant Service Attempts Analysis
of Nashville and Davidson County
METROPOLITAN POLICE DEPARTMENT
Prior Week
Last Week
Difference % Change
Prior 4Wks
Last 4Wks
Difference % Change
Prior YTD
YTD Difference % Change
Prior 52Wk
Last 52Wk
Difference % Change
Begin Date 1/18/2008 to End Date
East
West
North
South
Central
Hermitage
County
48826 54067 10.73%0 0 NC 1498 4 -99.73% 2018 0 -100.00% 52410 -1494 -2018
5889 7424 26.07%0 0 NC 207 0 -100.00% 248 0 -100.00% 15350 -207 -248
1893 3069 62.12%0 0 NC 92 0 -100.00% 61 0 -100.00% 11760 -92 -61
7349 8060 9.67%0 0 NC 189 2 -98.94% 273 0 -100.00% 7110 -187 -273
9476 8397 -11.39%0 0 NC 294 2 -99.32% 428 0 -100.00% -10790 -292 -428
4772 6059 26.97%0 0 NC 136 0 -100.00% 201 0 -100.00% 12870 -136 -201
5263 7402 40.64%0 0 NC 236 0 -100.00% 254 0 -100.00% 21390 -236 -254Total Warrant Service Attempts
Warrants
11022 11465 4.02%0 0 NC 318 0 -100.00% 450 0 -100.00% 4430 -318 -450
Other/OofC 3162 2191 -30.71%0 0 NC 26 0 -100.00% 103 0 -100.00% -9710 -26 -103
Total Warrant Service Attempts
Total Warrant Service Attempts
Total Warrant Service Attempts
Total Warrant Service Attempts
Total Warrant Service Attempts
Total Warrant Service Attempts
Total Warrant Service Attempts
Total Warrant Service Attempts
Source: Metropolitan Police Department's COMPSTAT Database System. The figures above were sourced from warrants issued and attempted to be served, these attempts may have or may not have resulted in an arrest. The figures above include both Juvenille and Adult warrants. This report includes the number of outstanding warrant service attempts for the above referenced time period and has a degree of error of approximately 1%. *Data integrity issues prevent historical figures from reflecting accurate numbers prior to 2004. This report is intended to be a management and planning tool and does not reflect the official Outstanding Warrant Service Attempt counts for the department.
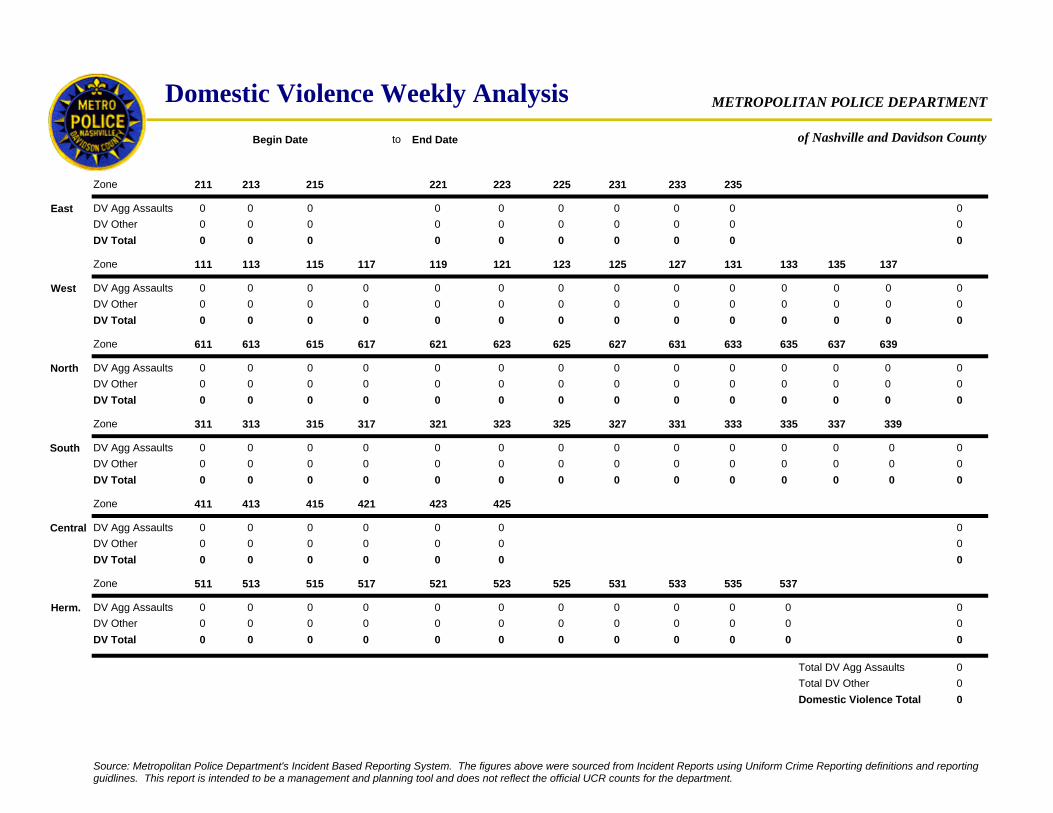
Domestic Violence Weekly Analysisof Nashville and Davidson County
METROPOLITAN POLICE DEPARTMENT
to End DateBegin Date
0
0 0 0 0 0 0 0 0 0 0
0
0
0
0
0East
West
North
South
Central
Herm.
DV Agg AssaultsDV Other
0 0 0 0 0 0 0 0 0 0 0
0 0 0 0 0 0 0 0 0 0 0
0 0 0 0 0 0 0 0 0 0 0
0 0 0 0 0 0
0 0 0 0 0 0 0 0 0 0
211 213 215 221 223 225 231 233 235
111 113 115 117 119 121 123 125 127 131 133
0 0
135 137
0 0
611 613 615 617 621 623 625 627 631 633 635 637 639
0
311 313 315 317 321 323 325 327 331 333 335 337
411 413 415 421 423 425
511 513 515 517 521 523 525 531 533 535
DV Total 0
DV Agg AssaultsDV OtherDV Total
DV Agg AssaultsDV OtherDV Total
DV Agg AssaultsDV OtherDV Total
0 0 0 0 0 0 0 0 00 0 0 0 0 0 0 0 0
00 0 0 0 0 0 0 0 0 0 0 0 000 0 0 0 0 0 0 0 0 0 0 0 0
00 0 0 0 0 0 0 0 0 0 0 0 000 0 0 0 0 0 0 0 0 0 0 0 0
00 0 0 0 0 0 0 0 0 0 0 000 0 0 0 0 0 0 0 0 0 0 0
DV Agg AssaultsDV OtherDV Total
00 0 0 0 0 000 0 0 0 0 0
00 0 0 0 0 0 0 0 0 000 0 0 0 0 0 0 0 0 0
DV Agg AssaultsDV OtherDV Total
000
Total DV Agg AssaultsTotal DV OtherDomestic Violence Total
Zone
Zone
Zone
Zone
Zone
Zone
339
000
537
000
Source: Metropolitan Police Department's Incident Based Reporting System. The figures above were sourced from Incident Reports using Uniform Crime Reporting definitions and reporting guidlines. This report is intended to be a management and planning tool and does not reflect the official UCR counts for the department.

Recovered Firearms
of Nashville and Davidson County
METROPOLITAN POLICE DEPARTMENT
Begin Date 1/20/2008 to End Date 12/28/2009
Prior Week
Last Week
Difference % Change
Prior 4Wks
Last 4Wks
Difference % Change
Prior YTD
YTD Difference % Change
Prior 52Wk
Last 52Wk
Difference % Change
East
West
North
South
Central
Hermitage
County
Recovered Guns% Handguns
502 489
359
228
368
125
314
2115 2283
341
167
294
365
241
-5.01%
5.70%
-2.59%
-0.82%
33.60%
-6.37%
7.94%
Recovered Guns% Handguns
Recovered Guns% Handguns
Recovered Guns% Handguns
Recovered Guns% Handguns
Recovered Guns% Handguns
Recovered Guns% Handguns
83.27% 78.32%
83.29%
80.70%
82.34%
89.60%
78.98%
81.75% 76.35%
80.94%
80.84%
75.51%
74.52%
79.25%
0 0
0
0
0
0
0
25 37
0
0
0
0
0
NC
NC
NC
NC
NC
NC
48.00%
NC NC
NC
NC
NC
NC
NC
84.00% 83.78%
NC
NC
NC
NC
NC
28 17
23
33
9
15
34
164 127
2
4
4
2
3
-91.30%
-90.91%
-39.29%
-77.78%
-73.33%
-88.24%
-22.56%
71.43% 52.94%
91.30%
72.73%
44.44%
73.33%
85.29%
74.39% 79.53%
50.00%
100.00%
50.00%
100.00%
33.33%
15 0
20
5
11
6
13
82 66
0
0
0
0
0
-100.00%
-100.00%
-100.00%
-100.00%
-100.00%
#Div/0!
-19.51%
100.00% NC
65.00%
60.00%
90.91%
100.00%
84.62%
82.93% 84.85%
NC
NC
NC
NC
NC
-18
13
-13
-3
42
-20
168
0
0
0
0
0
0
12
-21
-30
-11
-7
-11
-30
-37
-20
-5
-15
-11
-6
-13
-16
98.30% 96.67%84.00% 100.00% 73.17% 92.91% 98.78% 92.42%9.98% 16.82%100.00% 100.00% 13.41% 74.80% 14.63%100.00%
% Traced% w/o Inc. Rpt.
Source: Metropolitan Police Department's Property Tracking System. The figures above were sourced from Arrest Reports, State Citations, and Incident Reports. The numbers reflect actual firearms, they do not include paintball guns, bb-guns, ammunition, or evidence. This report is intended to be a management and planning tool and does not reflect the official UCR counts for the department.
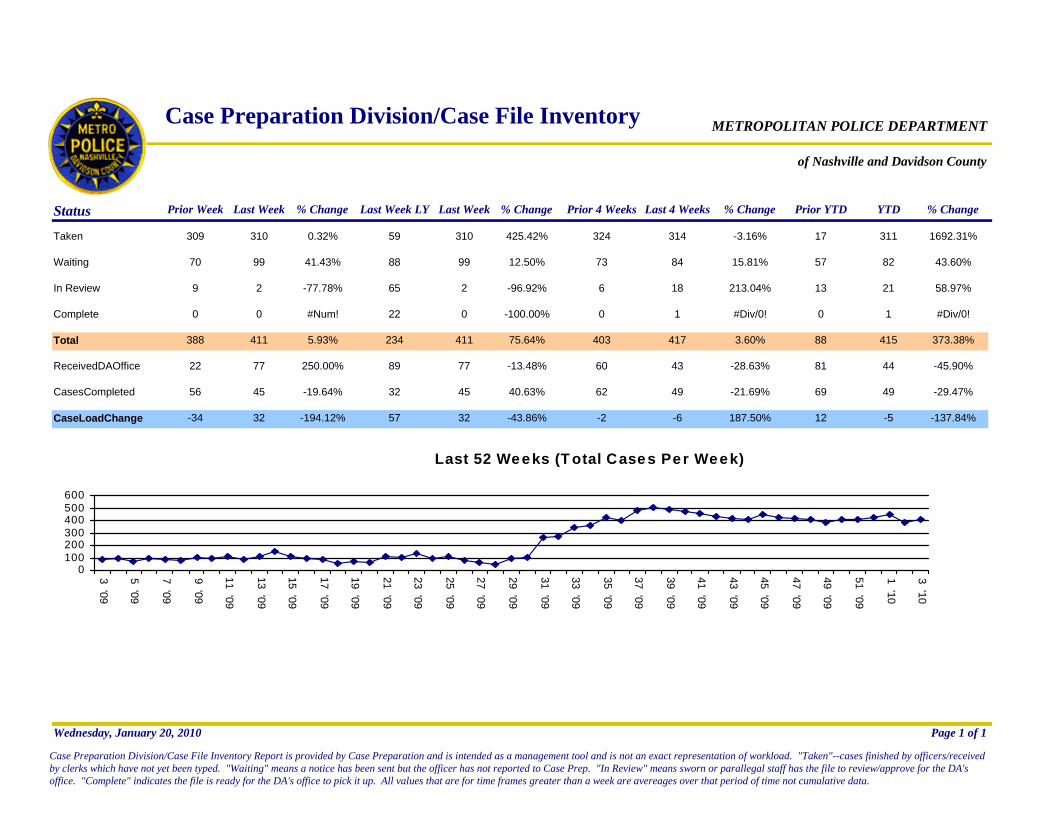
of Nashville and Davidson County
METROPOLITAN POLICE DEPARTMENTCase Preparation Division/Case File Inventory
Status Prior Week Last Week Last Week LY Last Week Prior 4 Weeks Last 4 Weeks Prior YTD YTD% Change % Change % Change % Change
Taken 309 310 59 310 324 314 17 3110.32% 425.42% -3.16% 1692.31%
Waiting 70 99 88 99 73 84 57 8241.43% 12.50% 15.81% 43.60%
In Review 9 2 65 2 6 18 13 21-77.78% -96.92% 213.04% 58.97%
Complete 0 0 22 0 0 1 0 1#Num! -100.00% #Div/0! #Div/0!
Total 388 411 234 411 403 417 88 4155.93% 75.64% 3.60% 373.38%
ReceivedDAOffice 22 77 89 77 60 43 81 44250.00% -13.48% -28.63% -45.90%
CasesCompleted 56 45 32 45 62 49 69 49-19.64% 40.63% -21.69% -29.47%
CaseLoadChange -34 32 57 32 -2 -6 12 -5-194.12% -43.86% 187.50% -137.84%
Last 52 Weeks (T otal Cases Per Week)
0100200300400500600
3 '09
5 '09
7 '09
9 '09
11 '09
13 '09
15 '09
17 '09
19 '09
21 '09
23 '09
25 '09
27 '09
29 '09
31 '09
33 '09
35 '09
37 '09
39 '09
41 '09
43 '09
45 '09
47 '09
49 '09
51 '09
1 '10
3 '10
Wednesday, January 20, 2010 Page 1 of 1
Case Preparation Division/Case File Inventory Report is provided by Case Preparation and is intended as a management tool and is not an exact representation of workload. "Taken"--cases finished by officers/received by clerks which have not yet been typed. "Waiting" means a notice has been sent but the officer has not reported to Case Prep. "In Review" means sworn or parallegal staff has the file to review/approve for the DA's office. "Complete" indicates the file is ready for the DA's office to pick it up. All values that are for time frames greater than a week are avereages over that period of time not cumalative data.

METROPOLITAN POLICE DEPARTMENT
of Nashville and Davidson County
RESPONSE TIME CRITERIA
Explanations:Code 1 calls are routine calls. Code 2 calls are urgent calls without emergency equipment. Code 3 calls are urgent calls with emergency equipment. Times represent fractions of whole minutes, not minutes and seconds.Includes Ten Codes 10 – 90.Excludes self-initiated activities.Disposition Code 11 (Signal 9) calls are excluded.Records must have dispatch to arrival times greater than 0 minutes. Records with missing dispatch or arrival times are excluded.Records with dispatch to arrival times greater than 240 minutes for Response Code 1 and 2 calls are excluded.Records with dispatch to arrival times greater than 30 minutes for Response Code 3 calls are excluded.
Source: MNPD Crime Analysis Section
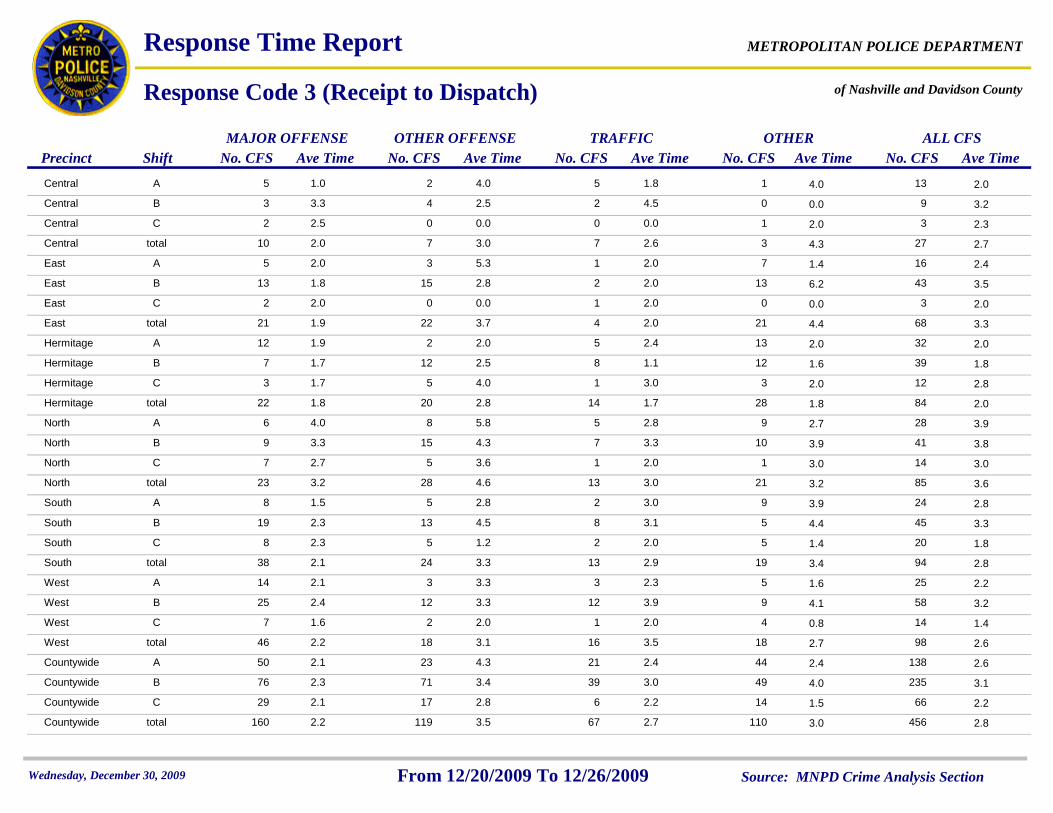
of Nashville and Davidson County
METROPOLITAN POLICE DEPARTMENT
Response Code 3 (Receipt to Dispatch)
Precinct Shift No. CFS Ave TimeMAJOR OFFENSE
No. CFS Ave TimeOTHER OFFENSE
No. CFS Ave TimeTRAFFIC
No. CFS Ave TimeOTHER
No. CFS Ave TimeALL CFS
Response Time Report
Central A 5 2 5 11.0 4.0 1.8 4.0 13 2.0
Central B 3 4 2 03.3 2.5 4.5 0.0 9 3.2
Central C 2 0 0 12.5 0.0 0.0 2.0 3 2.3
Central total 10 7 7 32.0 3.0 2.6 4.3 27 2.7
East A 5 3 1 72.0 5.3 2.0 1.4 16 2.4
East B 13 15 2 131.8 2.8 2.0 6.2 43 3.5
East C 2 0 1 02.0 0.0 2.0 0.0 3 2.0
East total 21 22 4 211.9 3.7 2.0 4.4 68 3.3
Hermitage A 12 2 5 131.9 2.0 2.4 2.0 32 2.0
Hermitage B 7 12 8 121.7 2.5 1.1 1.6 39 1.8
Hermitage C 3 5 1 31.7 4.0 3.0 2.0 12 2.8
Hermitage total 22 20 14 281.8 2.8 1.7 1.8 84 2.0
North A 6 8 5 94.0 5.8 2.8 2.7 28 3.9
North B 9 15 7 103.3 4.3 3.3 3.9 41 3.8
North C 7 5 1 12.7 3.6 2.0 3.0 14 3.0
North total 23 28 13 213.2 4.6 3.0 3.2 85 3.6
South A 8 5 2 91.5 2.8 3.0 3.9 24 2.8
South B 19 13 8 52.3 4.5 3.1 4.4 45 3.3
South C 8 5 2 52.3 1.2 2.0 1.4 20 1.8
South total 38 24 13 192.1 3.3 2.9 3.4 94 2.8
West A 14 3 3 52.1 3.3 2.3 1.6 25 2.2
West B 25 12 12 92.4 3.3 3.9 4.1 58 3.2
West C 7 2 1 41.6 2.0 2.0 0.8 14 1.4
West total 46 18 16 182.2 3.1 3.5 2.7 98 2.6
Countywide A 50 23 21 442.1 4.3 2.4 2.4 138 2.6
Countywide B 76 71 39 492.3 3.4 3.0 4.0 235 3.1
Countywide C 29 17 6 142.1 2.8 2.2 1.5 66 2.2
Countywide total 160 119 67 1102.2 3.5 2.7 3.0 456 2.8
Wednesday, December 30, 2009 Source: MNPD Crime Analysis SectionFrom 12/20/2009 To 12/26/2009

Response Time Report of Nashville and Davidson County
METROPOLITAN POLICE DEPARTMENT
Response Code 3 (Dispatch to Arrival)
Precinct Shift No. CFS Ave TimeMAJOR OFFENSE
No. CFS Ave TimeOTHER OFFENSE
No. CFS Ave TimeTRAFFIC
No. CFS Ave TimeOTHER
No. CFS Ave TimeALL CFS
Central A 5 2 5 13.2 4.0 4.6 7.0 13 4.2
Central B 3 4 2 04.0 3.0 2.5 0.0 9 3.2
Central C 2 0 0 12.5 0.0 0.0 1.0 3 2.0
Central total 10 7 7 33.3 3.1 4.0 3.3 27 3.4
East A 5 3 1 74.2 3.0 6.0 4.4 16 4.2
East B 13 15 2 134.5 6.1 3.5 5.5 43 5.3
East C 2 0 1 02.5 0.0 20.0 0.0 3 8.3
East total 21 22 4 214.2 5.2 8.3 5.1 68 5.1
Hermitage A 12 2 5 135.9 5.0 6.6 7.8 32 6.7
Hermitage B 7 12 8 124.0 6.4 8.0 6.8 39 6.4
Hermitage C 3 5 1 35.0 4.4 8.0 7.7 12 5.7
Hermitage total 22 20 14 285.2 5.7 7.5 7.3 84 6.4
North A 6 8 5 96.7 9.5 7.0 10.8 28 8.9
North B 9 15 7 107.8 8.1 6.9 4.7 41 7.0
North C 7 5 1 16.0 3.8 3.0 15.0 14 5.6
North total 23 28 13 216.9 7.8 6.6 7.6 85 7.3
South A 8 5 2 95.5 11.0 10.0 7.7 24 7.8
South B 19 13 8 56.4 6.7 9.0 9.0 45 7.2
South C 8 5 2 52.4 8.8 7.0 6.2 20 5.4
South total 38 24 13 195.3 8.0 8.8 7.6 94 6.9
West A 14 3 3 54.7 5.7 7.7 12.0 25 6.6
West B 25 12 12 96.1 6.9 7.8 8.2 58 6.9
West C 7 2 1 44.9 4.5 10.0 5.8 14 5.4
West total 46 18 16 185.5 6.3 7.9 8.7 98 6.6
Countywide A 50 23 21 445.2 7.6 6.7 8.3 138 6.8
Countywide B 76 71 39 495.8 6.6 7.4 6.5 235 6.5
Countywide C 29 17 6 144.1 5.5 9.2 6.6 66 5.5
Countywide total 160 119 67 1105.3 6.5 7.3 7.1 456 6.4
Wednesday, December 30, 2009 Source: MNPD Crime Analysis SectionFrom 12/20/2009 To 12/26/2009

Response Time Report of Nashville and Davidson County
METROPOLITAN POLICE DEPARTMENT
Response Code 3 (Receipt to Arrival)
Precinct Shift No. CFS Ave TimeMAJOR OFFENSE
No. CFS Ave TimeOTHER OFFENSE
No. CFS Ave TimeTRAFFIC
No. CFS Ave TimeOTHER
No. CFS Ave TimeALL CFS
Central A 5 2 5 14.2 8.0 6.4 11.0 13 6.2
Central B 3 4 2 07.3 5.5 7.0 0.0 9 6.4
Central C 2 0 0 15.0 0.0 0.0 3.0 3 4.3
Central total 10 7 7 35.3 6.1 6.6 7.7 27 6.1
East A 5 3 1 76.2 8.3 8.0 5.9 16 6.6
East B 13 15 2 136.4 8.9 5.5 11.6 43 8.8
East C 2 0 1 04.5 0.0 22.0 0.0 3 10.3
East total 21 22 4 216.1 9.0 10.3 9.5 68 8.3
Hermitage A 12 2 5 137.8 7.0 9.0 9.8 32 8.8
Hermitage B 7 12 8 125.7 8.9 9.1 8.3 39 8.2
Hermitage C 3 5 1 36.7 8.4 11.0 9.7 12 8.5
Hermitage total 22 20 14 287.0 8.5 9.2 9.1 84 8.4
North A 6 8 5 910.7 15.3 9.8 13.4 28 12.7
North B 9 15 7 1011.1 12.4 10.1 8.6 41 10.8
North C 7 5 1 18.7 7.4 5.0 18.0 14 8.6
North total 23 28 13 2110.1 12.3 9.6 10.8 85 10.9
South A 8 5 2 97.0 13.8 13.0 11.6 24 10.6
South B 19 13 8 58.7 11.2 12.1 13.4 45 10.5
South C 8 5 2 54.6 10.0 9.0 7.6 20 7.2
South total 38 24 13 197.4 11.4 11.7 11.0 94 9.7
West A 14 3 3 56.9 9.0 10.0 13.6 25 8.8
West B 25 12 12 98.4 10.3 11.7 12.3 58 10.1
West C 7 2 1 46.4 6.5 12.0 6.5 14 6.9
West total 46 18 16 187.7 9.3 11.4 11.4 98 9.3
Countywide A 50 23 21 447.2 11.9 9.0 10.7 138 9.4
Countywide B 76 71 39 498.2 10.1 10.4 10.5 235 9.6
Countywide C 29 17 6 146.3 8.4 11.3 8.1 66 7.7
Countywide total 160 119 67 1107.5 10.0 10.1 10.2 456 9.2
Wednesday, December 30, 2009 Source: MNPD Crime Analysis SectionFrom 12/20/2009 To 12/26/2009
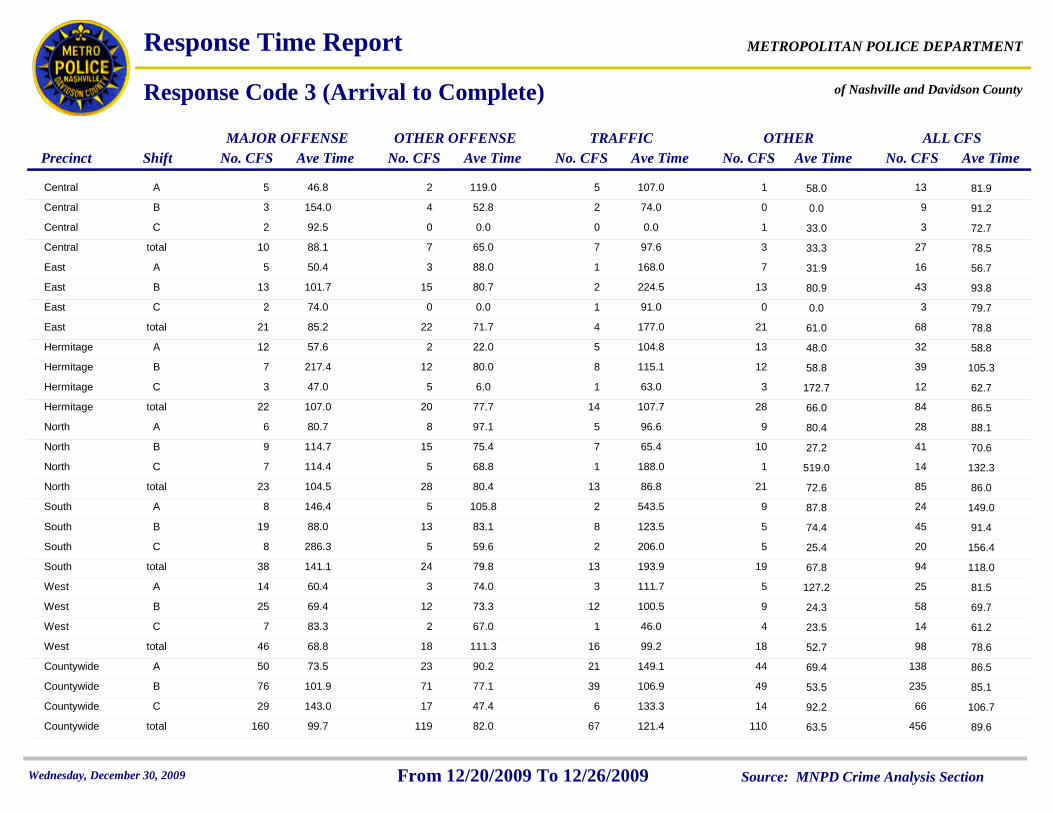
Response Time Report of Nashville and Davidson County
METROPOLITAN POLICE DEPARTMENT
Response Code 3 (Arrival to Complete)
Precinct Shift No. CFS Ave TimeMAJOR OFFENSE
No. CFS Ave TimeOTHER OFFENSE
No. CFS Ave TimeTRAFFIC
No. CFS Ave TimeOTHER
No. CFS Ave TimeALL CFS
Central A 5 2 5 146.8 119.0 107.0 58.0 13 81.9
Central B 3 4 2 0154.0 52.8 74.0 0.0 9 91.2
Central C 2 0 0 192.5 0.0 0.0 33.0 3 72.7
Central total 10 7 7 388.1 65.0 97.6 33.3 27 78.5
East A 5 3 1 750.4 88.0 168.0 31.9 16 56.7
East B 13 15 2 13101.7 80.7 224.5 80.9 43 93.8
East C 2 0 1 074.0 0.0 91.0 0.0 3 79.7
East total 21 22 4 2185.2 71.7 177.0 61.0 68 78.8
Hermitage A 12 2 5 1357.6 22.0 104.8 48.0 32 58.8
Hermitage B 7 12 8 12217.4 80.0 115.1 58.8 39 105.3
Hermitage C 3 5 1 347.0 6.0 63.0 172.7 12 62.7
Hermitage total 22 20 14 28107.0 77.7 107.7 66.0 84 86.5
North A 6 8 5 980.7 97.1 96.6 80.4 28 88.1
North B 9 15 7 10114.7 75.4 65.4 27.2 41 70.6
North C 7 5 1 1114.4 68.8 188.0 519.0 14 132.3
North total 23 28 13 21104.5 80.4 86.8 72.6 85 86.0
South A 8 5 2 9146.4 105.8 543.5 87.8 24 149.0
South B 19 13 8 588.0 83.1 123.5 74.4 45 91.4
South C 8 5 2 5286.3 59.6 206.0 25.4 20 156.4
South total 38 24 13 19141.1 79.8 193.9 67.8 94 118.0
West A 14 3 3 560.4 74.0 111.7 127.2 25 81.5
West B 25 12 12 969.4 73.3 100.5 24.3 58 69.7
West C 7 2 1 483.3 67.0 46.0 23.5 14 61.2
West total 46 18 16 1868.8 111.3 99.2 52.7 98 78.6
Countywide A 50 23 21 4473.5 90.2 149.1 69.4 138 86.5
Countywide B 76 71 39 49101.9 77.1 106.9 53.5 235 85.1
Countywide C 29 17 6 14143.0 47.4 133.3 92.2 66 106.7
Countywide total 160 119 67 11099.7 82.0 121.4 63.5 456 89.6
Wednesday, December 30, 2009 Source: MNPD Crime Analysis SectionFrom 12/20/2009 To 12/26/2009

Response Time Report of Nashville and Davidson County
METROPOLITAN POLICE DEPARTMENT
Response Code 2 (Receipt to Dispatch)
Precinct Shift No. CFS Ave TimeMAJOR OFFENSE
No. CFS Ave TimeOTHER OFFENSE
No. CFS Ave TimeTRAFFIC
No. CFS Ave TimeOTHER
No. CFS Ave TimeALL CFS
Central A 18 21 3 83.5 4.6 1.7 3.6 50 3.9
Central B 8 20 1 123.9 4.4 2.0 6.3 41 4.8
Central C 17 9 1 62.1 2.8 8.0 3.5 33 2.7
Central total 44 53 5 283.0 4.1 3.0 5.3 130 3.9
East A 30 40 5 223.4 5.6 21.0 7.2 97 6.1
East B 45 69 3 3024.2 21.2 15.0 19.1 147 21.6
East C 20 27 0 63.4 5.7 0.0 10.3 53 5.3
East total 96 149 8 6013.2 12.8 18.8 13.4 313 13.2
Hermitage A 39 35 3 456.3 7.3 2.7 7.4 122 6.9
Hermitage B 45 53 13 6018.0 15.3 18.9 11.6 171 15.0
Hermitage C 13 39 1 128.8 8.9 2.0 9.0 65 8.8
Hermitage total 101 134 18 11912.7 11.1 14.9 9.7 372 11.3
North A 46 39 5 2416.8 12.5 16.4 14.5 114 14.8
North B 51 79 10 7622.7 20.5 11.8 21.0 216 20.8
North C 23 19 2 1610.7 15.2 2.0 6.4 60 10.7
North total 121 145 18 12518.4 17.7 11.7 17.3 409 17.5
South A 63 53 11 3117.4 20.5 10.5 15.3 158 17.5
South B 47 72 13 4425.5 20.8 14.5 28.9 176 23.6
South C 40 47 2 216.8 9.3 1.5 11.9 110 8.7
South total 156 183 26 9916.7 17.0 11.8 20.3 464 17.3
West A 61 41 9 3920.2 19.2 37.1 20.1 150 20.9
West B 74 62 10 5125.0 15.0 40.5 27.5 197 23.3
West C 47 26 4 124.0 4.6 4.3 6.1 89 4.4
West total 194 142 24 10417.8 13.3 31.7 21.8 464 18.0
Countywide A 257 229 36 17013.7 12.8 18.1 12.5 692 13.3
Countywide B 270 355 50 28522.7 18.0 20.1 20.3 960 20.1
Countywide C 160 167 10 765.8 8.2 3.4 8.3 413 7.2
Countywide total 713 806 99 55115.4 13.9 17.3 15.9 2,169 15.0
Wednesday, December 30, 2009 Source: MNPD Crime Analysis SectionFrom 12/20/2009 To 12/26/2009
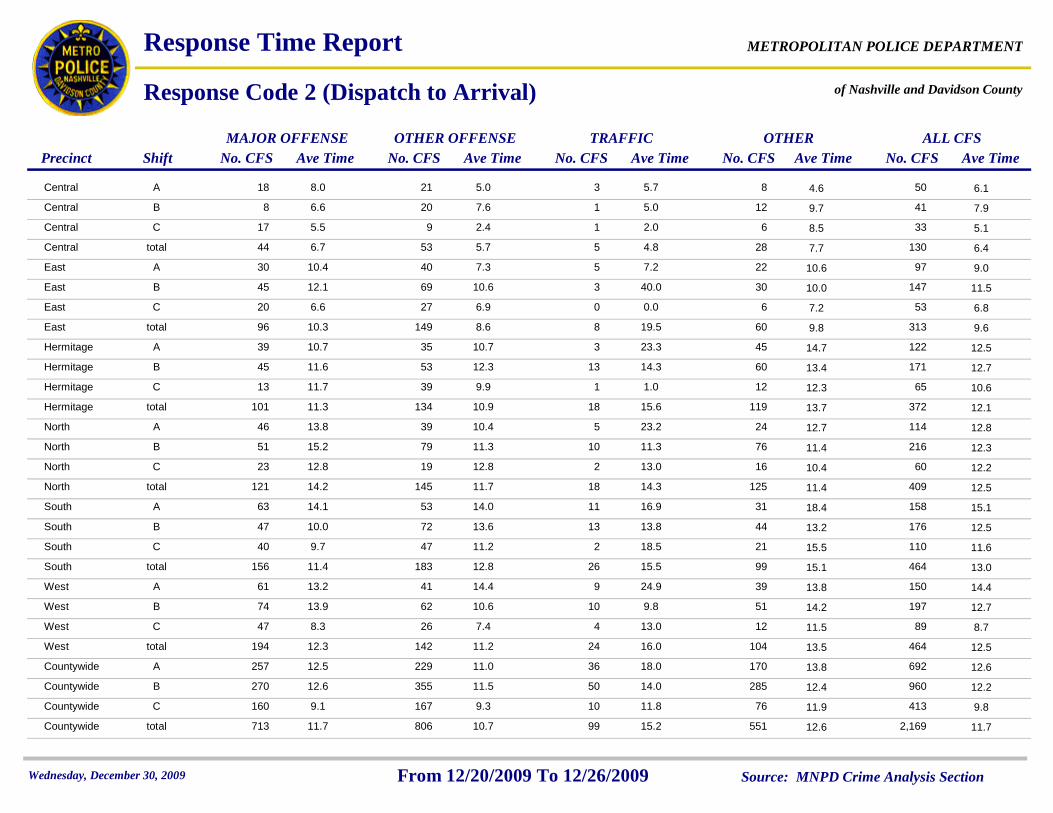
Response Time Report of Nashville and Davidson County
METROPOLITAN POLICE DEPARTMENT
Response Code 2 (Dispatch to Arrival)
Precinct Shift No. CFS Ave TimeMAJOR OFFENSE
No. CFS Ave TimeOTHER OFFENSE
No. CFS Ave TimeTRAFFIC
No. CFS Ave TimeOTHER
No. CFS Ave TimeALL CFS
Central A 18 21 3 88.0 5.0 5.7 4.6 50 6.1
Central B 8 20 1 126.6 7.6 5.0 9.7 41 7.9
Central C 17 9 1 65.5 2.4 2.0 8.5 33 5.1
Central total 44 53 5 286.7 5.7 4.8 7.7 130 6.4
East A 30 40 5 2210.4 7.3 7.2 10.6 97 9.0
East B 45 69 3 3012.1 10.6 40.0 10.0 147 11.5
East C 20 27 0 66.6 6.9 0.0 7.2 53 6.8
East total 96 149 8 6010.3 8.6 19.5 9.8 313 9.6
Hermitage A 39 35 3 4510.7 10.7 23.3 14.7 122 12.5
Hermitage B 45 53 13 6011.6 12.3 14.3 13.4 171 12.7
Hermitage C 13 39 1 1211.7 9.9 1.0 12.3 65 10.6
Hermitage total 101 134 18 11911.3 10.9 15.6 13.7 372 12.1
North A 46 39 5 2413.8 10.4 23.2 12.7 114 12.8
North B 51 79 10 7615.2 11.3 11.3 11.4 216 12.3
North C 23 19 2 1612.8 12.8 13.0 10.4 60 12.2
North total 121 145 18 12514.2 11.7 14.3 11.4 409 12.5
South A 63 53 11 3114.1 14.0 16.9 18.4 158 15.1
South B 47 72 13 4410.0 13.6 13.8 13.2 176 12.5
South C 40 47 2 219.7 11.2 18.5 15.5 110 11.6
South total 156 183 26 9911.4 12.8 15.5 15.1 464 13.0
West A 61 41 9 3913.2 14.4 24.9 13.8 150 14.4
West B 74 62 10 5113.9 10.6 9.8 14.2 197 12.7
West C 47 26 4 128.3 7.4 13.0 11.5 89 8.7
West total 194 142 24 10412.3 11.2 16.0 13.5 464 12.5
Countywide A 257 229 36 17012.5 11.0 18.0 13.8 692 12.6
Countywide B 270 355 50 28512.6 11.5 14.0 12.4 960 12.2
Countywide C 160 167 10 769.1 9.3 11.8 11.9 413 9.8
Countywide total 713 806 99 55111.7 10.7 15.2 12.6 2,169 11.7
Wednesday, December 30, 2009 Source: MNPD Crime Analysis SectionFrom 12/20/2009 To 12/26/2009

Response Time Report of Nashville and Davidson County
METROPOLITAN POLICE DEPARTMENT
Response Code 2 (Receipt to Arrival)
Precinct Shift No. CFS Ave TimeMAJOR OFFENSE
No. CFS Ave TimeOTHER OFFENSE
No. CFS Ave TimeTRAFFIC
No. CFS Ave TimeOTHER
No. CFS Ave TimeALL CFS
Central A 18 21 3 811.5 9.6 7.3 8.3 50 9.9
Central B 8 20 1 1210.5 11.9 7.0 15.9 41 12.7
Central C 17 9 1 67.6 5.2 10.0 12.0 33 7.8
Central total 44 53 5 289.7 9.7 7.8 13.0 130 10.3
East A 30 40 5 2213.8 12.9 28.2 17.8 97 15.1
East B 45 69 3 3036.3 31.8 55.0 29.1 147 33.1
East C 20 27 0 69.9 12.5 0.0 17.5 53 12.1
East total 96 149 8 6023.5 21.4 38.3 23.1 313 22.8
Hermitage A 39 35 3 4516.9 18.0 26.0 22.1 122 19.4
Hermitage B 45 53 13 6029.6 27.6 33.2 25.0 171 27.7
Hermitage C 13 39 1 1220.5 18.8 3.0 21.3 65 19.4
Hermitage total 101 134 18 11924.0 22.0 30.5 23.4 372 23.4
North A 46 39 5 2430.6 22.9 39.6 27.3 114 27.6
North B 51 79 10 7637.9 31.8 23.1 32.4 216 33.0
North C 23 19 2 1623.5 28.0 15.0 16.8 60 22.9
North total 121 145 18 12532.6 29.4 25.9 28.8 409 30.0
South A 63 53 11 3131.5 34.5 27.5 33.6 158 32.6
South B 47 72 13 4435.4 34.3 28.3 42.1 176 36.1
South C 40 47 2 2116.5 20.5 20.0 27.3 110 20.3
South total 156 183 26 9928.2 29.7 27.3 35.4 464 30.3
West A 61 41 9 3933.4 33.6 62.0 33.9 150 35.3
West B 74 62 10 5138.9 25.6 50.3 41.6 197 36.0
West C 47 26 4 1212.3 12.0 17.3 17.6 89 13.1
West total 194 142 24 10430.1 24.5 47.7 35.4 464 30.5
Countywide A 257 229 36 17026.1 23.8 36.1 26.3 692 25.9
Countywide B 270 355 50 28535.3 29.5 34.1 32.7 960 32.3
Countywide C 160 167 10 7614.8 17.5 15.2 20.3 413 16.9
Countywide total 713 806 99 55127.0 24.6 32.5 28.5 2,169 26.8
Wednesday, December 30, 2009 Source: MNPD Crime Analysis SectionFrom 12/20/2009 To 12/26/2009
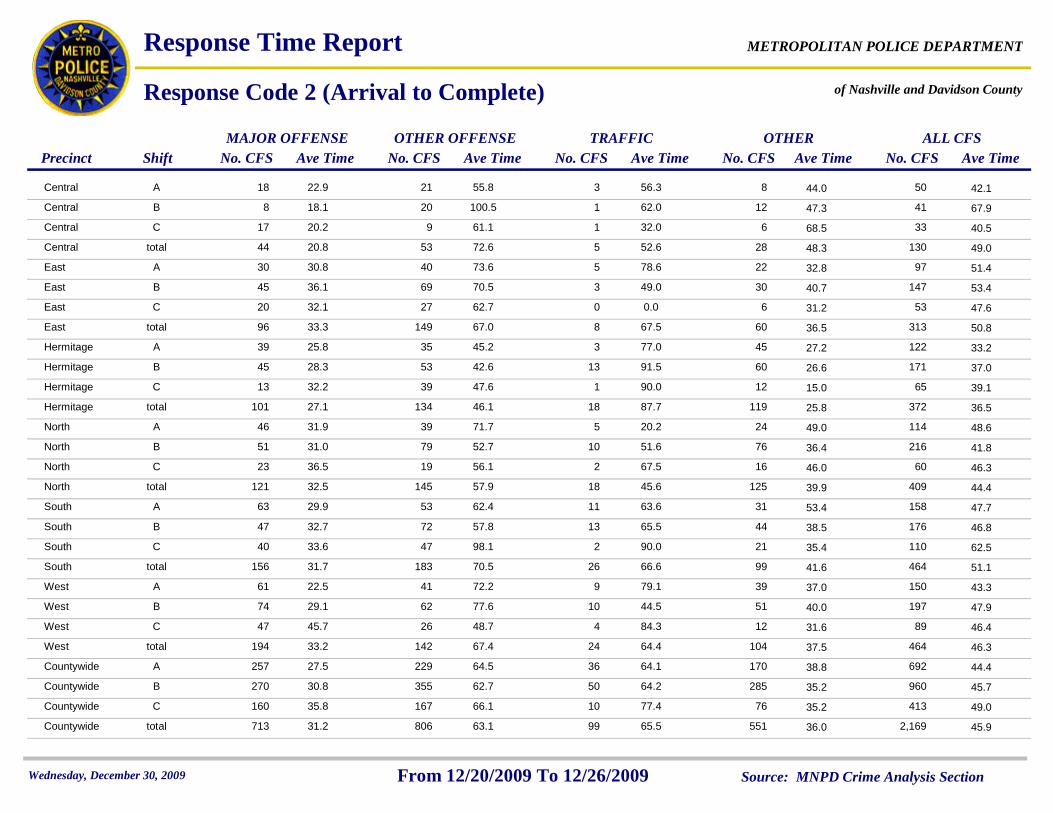
Response Time Report of Nashville and Davidson County
METROPOLITAN POLICE DEPARTMENT
Response Code 2 (Arrival to Complete)
Precinct Shift No. CFS Ave TimeMAJOR OFFENSE
No. CFS Ave TimeOTHER OFFENSE
No. CFS Ave TimeTRAFFIC
No. CFS Ave TimeOTHER
No. CFS Ave TimeALL CFS
Central A 18 21 3 822.9 55.8 56.3 44.0 50 42.1
Central B 8 20 1 1218.1 100.5 62.0 47.3 41 67.9
Central C 17 9 1 620.2 61.1 32.0 68.5 33 40.5
Central total 44 53 5 2820.8 72.6 52.6 48.3 130 49.0
East A 30 40 5 2230.8 73.6 78.6 32.8 97 51.4
East B 45 69 3 3036.1 70.5 49.0 40.7 147 53.4
East C 20 27 0 632.1 62.7 0.0 31.2 53 47.6
East total 96 149 8 6033.3 67.0 67.5 36.5 313 50.8
Hermitage A 39 35 3 4525.8 45.2 77.0 27.2 122 33.2
Hermitage B 45 53 13 6028.3 42.6 91.5 26.6 171 37.0
Hermitage C 13 39 1 1232.2 47.6 90.0 15.0 65 39.1
Hermitage total 101 134 18 11927.1 46.1 87.7 25.8 372 36.5
North A 46 39 5 2431.9 71.7 20.2 49.0 114 48.6
North B 51 79 10 7631.0 52.7 51.6 36.4 216 41.8
North C 23 19 2 1636.5 56.1 67.5 46.0 60 46.3
North total 121 145 18 12532.5 57.9 45.6 39.9 409 44.4
South A 63 53 11 3129.9 62.4 63.6 53.4 158 47.7
South B 47 72 13 4432.7 57.8 65.5 38.5 176 46.8
South C 40 47 2 2133.6 98.1 90.0 35.4 110 62.5
South total 156 183 26 9931.7 70.5 66.6 41.6 464 51.1
West A 61 41 9 3922.5 72.2 79.1 37.0 150 43.3
West B 74 62 10 5129.1 77.6 44.5 40.0 197 47.9
West C 47 26 4 1245.7 48.7 84.3 31.6 89 46.4
West total 194 142 24 10433.2 67.4 64.4 37.5 464 46.3
Countywide A 257 229 36 17027.5 64.5 64.1 38.8 692 44.4
Countywide B 270 355 50 28530.8 62.7 64.2 35.2 960 45.7
Countywide C 160 167 10 7635.8 66.1 77.4 35.2 413 49.0
Countywide total 713 806 99 55131.2 63.1 65.5 36.0 2,169 45.9
Wednesday, December 30, 2009 Source: MNPD Crime Analysis SectionFrom 12/20/2009 To 12/26/2009

Response Time Report of Nashville and Davidson County
METROPOLITAN POLICE DEPARTMENT
Response Code 1 (Receipt to Dispatch)
Precinct Shift No. CFS Ave TimeMAJOR OFFENSE
No. CFS Ave TimeOTHER OFFENSE
No. CFS Ave TimeTRAFFIC
No. CFS Ave TimeOTHER
No. CFS Ave TimeALL CFS
Central A 6 1 6 710.2 1.0 4.0 6.3 20 6.5
Central B 5 1 3 54.6 6.0 0.7 6.8 14 4.6
Central C 7 0 2 818.1 0.0 3.5 10.3 17 12.7
Central total 18 2 11 2111.7 3.5 3.0 9.6 52 8.7
East A 19 3 8 1422.9 16.7 16.0 10.4 44 17.2
East B 17 3 3 2036.5 38.3 41.0 45.9 43 41.3
East C 3 1 0 167.7 0.0 0.0 4.7 20 4.9
East total 39 7 12 5127.6 23.6 22.6 22.6 109 24.5
Hermitage A 37 6 15 3112.0 34.2 11.5 11.7 89 13.3
Hermitage B 14 3 15 5143.7 1.7 11.0 15.2 83 18.8
Hermitage C 10 3 3 2012.9 23.3 13.0 13.1 36 13.9
Hermitage total 62 14 35 10819.8 21.3 13.5 13.9 219 16.0
North A 36 5 16 2048.3 21.6 17.8 24.5 77 34.0
North B 26 5 14 3653.2 56.6 14.2 24.2 81 33.8
North C 9 0 1 1722.3 0.0 1.0 16.5 27 17.9
North total 73 10 31 7446.4 39.1 15.6 22.3 188 31.4
South A 32 7 21 3332.8 36.4 19.4 38.3 93 32.0
South B 24 3 15 3660.1 68.7 30.4 29.9 78 40.8
South C 15 1 4 249.4 2.0 13.5 14.2 44 12.2
South total 73 12 43 9736.3 38.7 22.2 27.9 225 30.1
West A 41 4 24 2746.4 56.5 18.4 43.5 96 39.0
West B 28 2 18 2542.7 6.5 30.3 35.6 73 36.2
West C 7 1 5 153.1 3.0 4.6 6.8 28 5.4
West total 79 7 47 7139.7 34.6 21.5 32.1 204 32.7
Countywide A 171 26 90 13232.9 32.5 16.2 26.3 419 27.2
Countywide B 114 17 68 17346.3 36.9 21.9 26.4 372 32.1
Countywide C 51 6 15 10012.6 12.5 8.3 11.4 172 11.5
Countywide total 344 52 179 42234.0 30.1 18.0 22.5 997 26.1
Wednesday, December 30, 2009 Source: MNPD Crime Analysis SectionFrom 12/20/2009 To 12/26/2009

Response Time Report of Nashville and Davidson County
METROPOLITAN POLICE DEPARTMENT
Response Code 1 (Dispatch to Arrival)
Precinct Shift No. CFS Ave TimeMAJOR OFFENSE
No. CFS Ave TimeOTHER OFFENSE
No. CFS Ave TimeTRAFFIC
No. CFS Ave TimeOTHER
No. CFS Ave TimeALL CFS
Central A 6 1 6 712.8 1.0 11.3 5.7 20 9.3
Central B 5 1 3 512.6 3.0 5.7 5.0 14 7.7
Central C 7 0 2 820.1 0.0 7.5 5.4 17 11.7
Central total 18 2 11 2115.6 2.0 9.1 5.4 52 9.6
East A 19 3 8 1434.0 18.3 15.0 11.6 44 22.4
East B 17 3 3 2020.4 8.0 17.7 15.7 43 17.1
East C 3 1 0 1612.3 6.0 0.0 7.4 20 8.1
East total 39 7 12 5126.4 12.1 15.2 11.8 109 17.4
Hermitage A 37 6 15 3117.4 26.8 12.4 18.5 89 17.6
Hermitage B 14 3 15 5130.0 12.0 12.4 15.7 83 17.4
Hermitage C 10 3 3 2014.0 15.0 17.7 16.5 36 15.8
Hermitage total 62 14 35 10819.6 17.9 13.1 16.6 219 17.0
North A 36 5 16 2020.4 15.8 15.3 13.4 77 17.2
North B 26 5 14 3613.0 14.8 18.4 11.1 81 13.2
North C 9 0 1 1711.9 0.0 7.0 10.5 27 10.8
North total 73 10 31 7416.5 15.3 16.5 11.6 188 14.5
South A 32 7 21 3320.0 17.7 15.4 18.9 93 18.4
South B 24 3 15 3621.1 14.7 15.7 11.1 78 15.2
South C 15 1 4 2423.2 17.0 22.5 13.3 44 17.6
South total 73 12 43 9720.6 15.8 15.7 14.5 225 16.8
West A 41 4 24 2726.4 9.3 18.5 28.2 96 24.2
West B 28 2 18 2516.1 9.5 16.6 12.7 73 14.9
West C 7 1 5 1516.9 14.0 8.0 22.9 28 18.4
West total 79 7 47 7121.2 10.0 16.6 20.8 204 19.6
Countywide A 171 26 90 13222.3 17.6 15.4 18.4 419 19.3
Countywide B 114 17 68 17318.6 11.8 15.4 13.1 372 15.1
Countywide C 51 6 15 10017.5 13.7 13.7 13.3 172 14.6
Countywide total 344 52 179 42220.1 14.5 15.1 14.8 997 16.7
Wednesday, December 30, 2009 Source: MNPD Crime Analysis SectionFrom 12/20/2009 To 12/26/2009
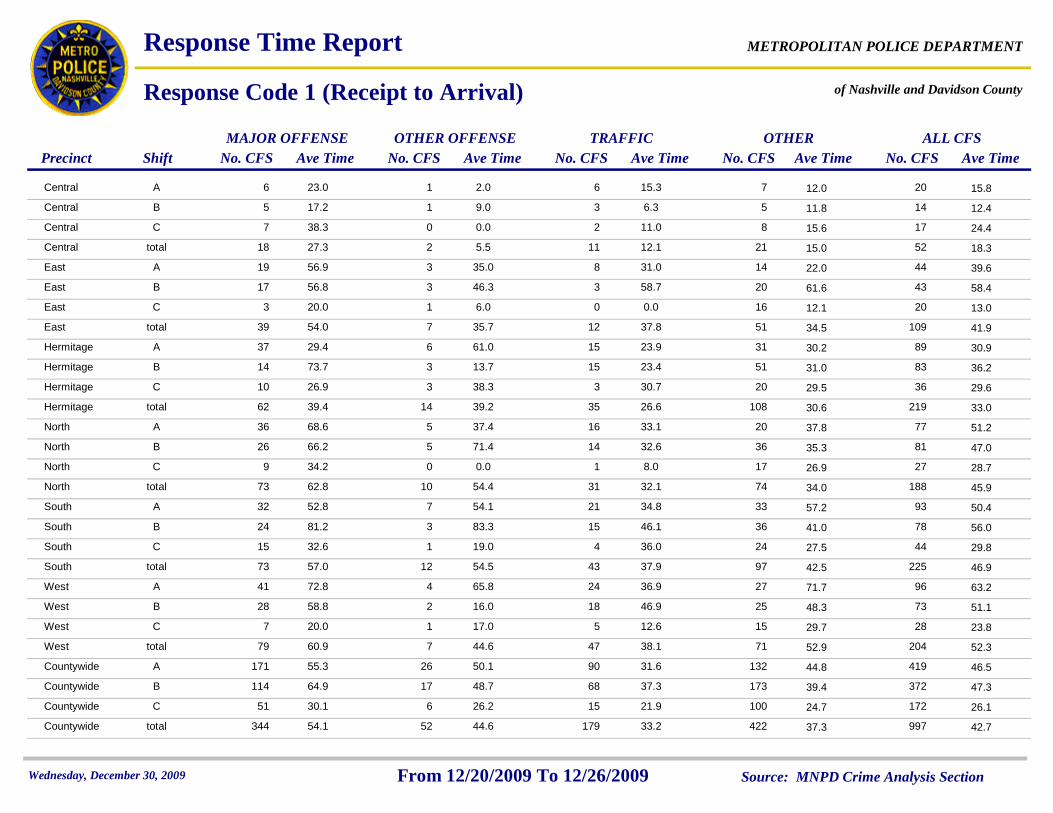
Response Time Report of Nashville and Davidson County
METROPOLITAN POLICE DEPARTMENT
Response Code 1 (Receipt to Arrival)
Precinct Shift No. CFS Ave TimeMAJOR OFFENSE
No. CFS Ave TimeOTHER OFFENSE
No. CFS Ave TimeTRAFFIC
No. CFS Ave TimeOTHER
No. CFS Ave TimeALL CFS
Central A 6 1 6 723.0 2.0 15.3 12.0 20 15.8
Central B 5 1 3 517.2 9.0 6.3 11.8 14 12.4
Central C 7 0 2 838.3 0.0 11.0 15.6 17 24.4
Central total 18 2 11 2127.3 5.5 12.1 15.0 52 18.3
East A 19 3 8 1456.9 35.0 31.0 22.0 44 39.6
East B 17 3 3 2056.8 46.3 58.7 61.6 43 58.4
East C 3 1 0 1620.0 6.0 0.0 12.1 20 13.0
East total 39 7 12 5154.0 35.7 37.8 34.5 109 41.9
Hermitage A 37 6 15 3129.4 61.0 23.9 30.2 89 30.9
Hermitage B 14 3 15 5173.7 13.7 23.4 31.0 83 36.2
Hermitage C 10 3 3 2026.9 38.3 30.7 29.5 36 29.6
Hermitage total 62 14 35 10839.4 39.2 26.6 30.6 219 33.0
North A 36 5 16 2068.6 37.4 33.1 37.8 77 51.2
North B 26 5 14 3666.2 71.4 32.6 35.3 81 47.0
North C 9 0 1 1734.2 0.0 8.0 26.9 27 28.7
North total 73 10 31 7462.8 54.4 32.1 34.0 188 45.9
South A 32 7 21 3352.8 54.1 34.8 57.2 93 50.4
South B 24 3 15 3681.2 83.3 46.1 41.0 78 56.0
South C 15 1 4 2432.6 19.0 36.0 27.5 44 29.8
South total 73 12 43 9757.0 54.5 37.9 42.5 225 46.9
West A 41 4 24 2772.8 65.8 36.9 71.7 96 63.2
West B 28 2 18 2558.8 16.0 46.9 48.3 73 51.1
West C 7 1 5 1520.0 17.0 12.6 29.7 28 23.8
West total 79 7 47 7160.9 44.6 38.1 52.9 204 52.3
Countywide A 171 26 90 13255.3 50.1 31.6 44.8 419 46.5
Countywide B 114 17 68 17364.9 48.7 37.3 39.4 372 47.3
Countywide C 51 6 15 10030.1 26.2 21.9 24.7 172 26.1
Countywide total 344 52 179 42254.1 44.6 33.2 37.3 997 42.7
Wednesday, December 30, 2009 Source: MNPD Crime Analysis SectionFrom 12/20/2009 To 12/26/2009

Response Time Report of Nashville and Davidson County
METROPOLITAN POLICE DEPARTMENT
Response Code 1 (Arrival to Complete)
Precinct Shift No. CFS Ave TimeMAJOR OFFENSE
No. CFS Ave TimeOTHER OFFENSE
No. CFS Ave TimeTRAFFIC
No. CFS Ave TimeOTHER
No. CFS Ave TimeALL CFS
Central A 6 1 6 759.5 38.0 61.2 99.9 20 73.1
Central B 5 1 3 550.8 62.0 84.0 65.0 14 63.8
Central C 7 0 2 827.7 0.0 41.5 24.3 17 27.7
Central total 18 2 11 2144.7 50.0 63.8 62.5 52 56.2
East A 19 3 8 1480.3 55.0 58.6 53.0 44 65.9
East B 17 3 3 2058.2 66.7 115.7 67.1 43 66.9
East C 3 1 0 1649.7 22.0 0.0 32.1 20 34.3
East total 39 7 12 5168.3 55.3 68.3 51.2 109 59.5
Hermitage A 37 6 15 3151.3 42.3 68.5 39.6 89 49.5
Hermitage B 14 3 15 5148.4 37.3 40.2 39.6 83 41.1
Hermitage C 10 3 3 2059.1 38.0 36.7 29.7 36 39.1
Hermitage total 62 14 35 10852.1 40.3 51.7 37.4 219 44.1
North A 36 5 16 2076.4 52.0 44.9 95.8 77 73.3
North B 26 5 14 3672.3 47.8 54.6 40.6 81 53.6
North C 9 0 1 17100.3 0.0 34.0 41.1 27 60.6
North total 73 10 31 7477.2 49.9 48.9 55.9 188 62.7
South A 32 7 21 3356.5 38.7 53.2 57.6 93 54.8
South B 24 3 15 3658.1 55.0 57.9 48.3 78 53.4
South C 15 1 4 2470.7 44.0 70.3 28.7 44 47.1
South total 73 12 43 9760.2 48.0 55.7 45.8 225 52.5
West A 41 4 24 2763.4 31.3 57.2 68.7 96 62.0
West B 28 2 18 2576.1 70.5 63.2 34.9 73 58.7
West C 7 1 5 15110.7 4.0 66.4 32.5 28 57.1
West total 79 7 47 7171.8 38.6 60.5 46.6 204 59.3
Countywide A 171 26 90 13264.0 42.8 56.3 63.2 419 60.8
Countywide B 114 17 68 17364.3 54.1 58.4 44.9 372 53.7
Countywide C 51 6 15 10072.0 30.7 56.0 31.8 172 45.8
Countywide total 344 52 179 42265.1 46.1 56.3 47.1 997 54.9
Wednesday, December 30, 2009 Source: MNPD Crime Analysis SectionFrom 12/20/2009 To 12/26/2009
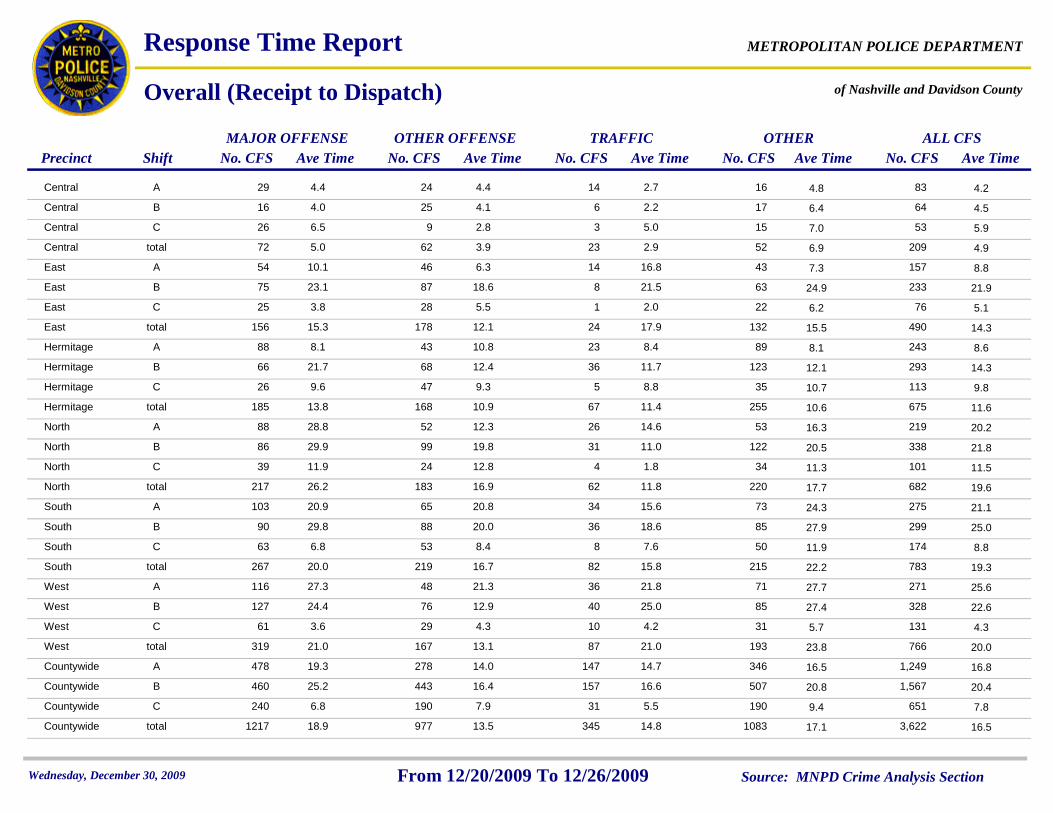
Response Time Report of Nashville and Davidson County
METROPOLITAN POLICE DEPARTMENT
Overall (Receipt to Dispatch)
Precinct Shift No. CFS Ave TimeMAJOR OFFENSE
No. CFS Ave TimeOTHER OFFENSE
No. CFS Ave TimeTRAFFIC
No. CFS Ave TimeOTHER
No. CFS Ave TimeALL CFS
Central A 29 24 14 164.4 4.4 2.7 4.8 83 4.2
Central B 16 25 6 174.0 4.1 2.2 6.4 64 4.5
Central C 26 9 3 156.5 2.8 5.0 7.0 53 5.9
Central total 72 62 23 525.0 3.9 2.9 6.9 209 4.9
East A 54 46 14 4310.1 6.3 16.8 7.3 157 8.8
East B 75 87 8 6323.1 18.6 21.5 24.9 233 21.9
East C 25 28 1 223.8 5.5 2.0 6.2 76 5.1
East total 156 178 24 13215.3 12.1 17.9 15.5 490 14.3
Hermitage A 88 43 23 898.1 10.8 8.4 8.1 243 8.6
Hermitage B 66 68 36 12321.7 12.4 11.7 12.1 293 14.3
Hermitage C 26 47 5 359.6 9.3 8.8 10.7 113 9.8
Hermitage total 185 168 67 25513.8 10.9 11.4 10.6 675 11.6
North A 88 52 26 5328.8 12.3 14.6 16.3 219 20.2
North B 86 99 31 12229.9 19.8 11.0 20.5 338 21.8
North C 39 24 4 3411.9 12.8 1.8 11.3 101 11.5
North total 217 183 62 22026.2 16.9 11.8 17.7 682 19.6
South A 103 65 34 7320.9 20.8 15.6 24.3 275 21.1
South B 90 88 36 8529.8 20.0 18.6 27.9 299 25.0
South C 63 53 8 506.8 8.4 7.6 11.9 174 8.8
South total 267 219 82 21520.0 16.7 15.8 22.2 783 19.3
West A 116 48 36 7127.3 21.3 21.8 27.7 271 25.6
West B 127 76 40 8524.4 12.9 25.0 27.4 328 22.6
West C 61 29 10 313.6 4.3 4.2 5.7 131 4.3
West total 319 167 87 19321.0 13.1 21.0 23.8 766 20.0
Countywide A 478 278 147 34619.3 14.0 14.7 16.5 1,249 16.8
Countywide B 460 443 157 50725.2 16.4 16.6 20.8 1,567 20.4
Countywide C 240 190 31 1906.8 7.9 5.5 9.4 651 7.8
Countywide total 1217 977 345 108318.9 13.5 14.8 17.1 3,622 16.5
Wednesday, December 30, 2009 Source: MNPD Crime Analysis SectionFrom 12/20/2009 To 12/26/2009

Response Time Report of Nashville and Davidson County
METROPOLITAN POLICE DEPARTMENT
Overall (Dispatch to Arrival)
Precinct Shift No. CFS Ave TimeMAJOR OFFENSE
No. CFS Ave TimeOTHER OFFENSE
No. CFS Ave TimeTRAFFIC
No. CFS Ave TimeOTHER
No. CFS Ave TimeALL CFS
Central A 29 24 14 168.2 4.8 7.7 5.3 83 6.6
Central B 16 25 6 178.0 6.6 4.5 8.3 64 7.2
Central C 26 9 3 159.2 2.4 5.7 6.3 53 7.1
Central total 72 62 23 528.4 5.3 6.6 6.5 209 6.8
East A 54 46 14 4318.1 7.7 11.6 10.0 157 12.3
East B 75 87 8 6312.7 9.7 22.5 10.9 233 11.4
East C 25 28 1 226.9 6.8 20.0 7.3 76 7.2
East total 156 178 24 13213.5 8.3 15.5 9.8 490 10.7
Hermitage A 88 43 23 8912.8 12.7 12.6 15.0 243 13.6
Hermitage B 66 68 36 12314.7 11.3 12.1 13.7 293 13.2
Hermitage C 26 47 5 3511.8 9.7 12.4 14.3 113 11.7
Hermitage total 185 168 67 25513.4 10.9 12.6 14.3 675 13.0
North A 88 52 26 5316.0 10.8 15.2 12.6 219 13.8
North B 86 99 31 12213.8 11.0 13.5 10.8 338 11.8
North C 39 24 4 3411.4 11.0 9.0 10.6 101 10.9
North total 217 183 62 22014.2 11.3 13.8 11.1 682 12.4
South A 103 65 34 7315.3 14.2 15.6 17.3 275 15.6
South B 90 88 36 8512.2 12.6 13.5 12.1 299 12.4
South C 63 53 8 5012.0 11.1 17.6 13.5 174 12.4
South total 267 219 82 21513.1 12.4 14.6 14.2 783 13.3
West A 116 48 36 7116.8 13.4 19.2 19.1 271 17.1
West B 127 76 40 8512.9 10.0 12.3 13.1 328 12.2
West C 61 29 10 318.9 7.4 10.2 16.3 131 10.4
West total 319 167 87 19313.5 10.6 14.9 15.8 766 13.6
Countywide A 478 278 147 34615.2 11.3 14.8 14.9 1,249 14.2
Countywide B 460 443 157 50713.0 10.7 13.0 12.1 1,567 12.0
Countywide C 240 190 31 19010.3 9.1 12.2 12.3 651 10.6
Countywide total 1217 977 345 108313.2 10.4 13.6 12.9 3,622 12.4
Wednesday, December 30, 2009 Source: MNPD Crime Analysis SectionFrom 12/20/2009 To 12/26/2009
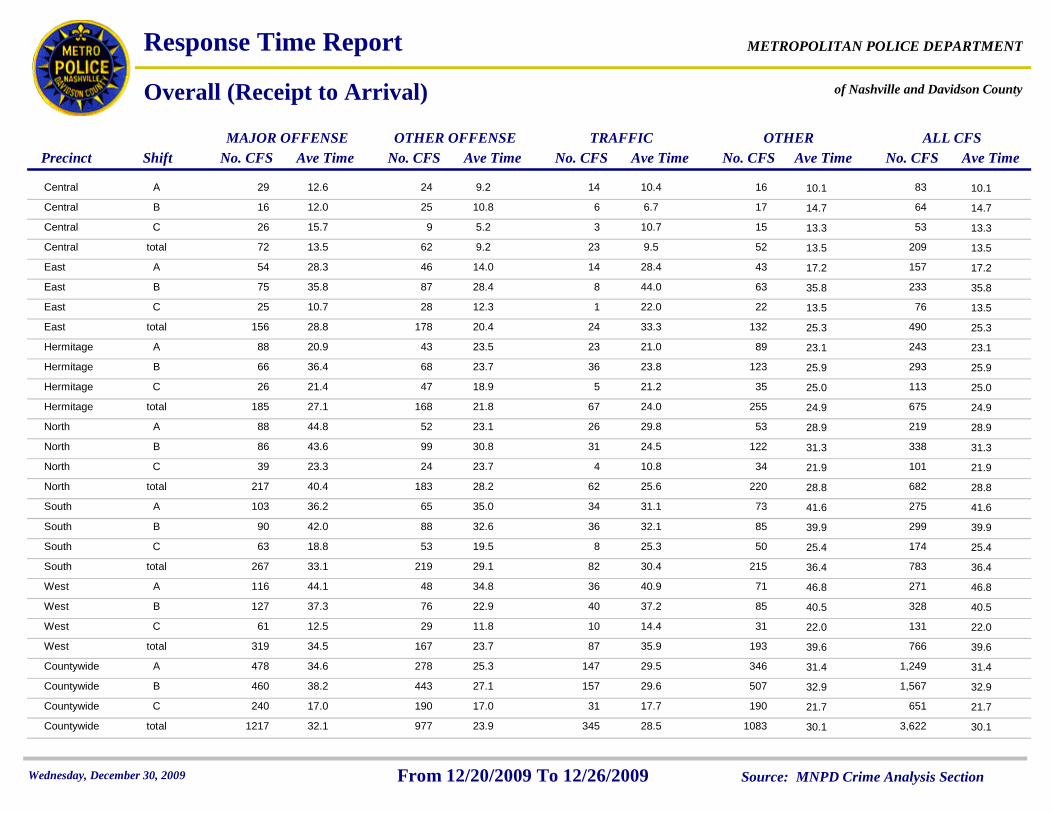
Response Time Report of Nashville and Davidson County
METROPOLITAN POLICE DEPARTMENT
Overall (Receipt to Arrival)
Precinct Shift No. CFS Ave TimeMAJOR OFFENSE
No. CFS Ave TimeOTHER OFFENSE
No. CFS Ave TimeTRAFFIC
No. CFS Ave TimeOTHER
No. CFS Ave TimeALL CFS
Central A 29 24 14 1612.6 9.2 10.4 10.1 83 10.1
Central B 16 25 6 1712.0 10.8 6.7 14.7 64 14.7
Central C 26 9 3 1515.7 5.2 10.7 13.3 53 13.3
Central total 72 62 23 5213.5 9.2 9.5 13.5 209 13.5
East A 54 46 14 4328.3 14.0 28.4 17.2 157 17.2
East B 75 87 8 6335.8 28.4 44.0 35.8 233 35.8
East C 25 28 1 2210.7 12.3 22.0 13.5 76 13.5
East total 156 178 24 13228.8 20.4 33.3 25.3 490 25.3
Hermitage A 88 43 23 8920.9 23.5 21.0 23.1 243 23.1
Hermitage B 66 68 36 12336.4 23.7 23.8 25.9 293 25.9
Hermitage C 26 47 5 3521.4 18.9 21.2 25.0 113 25.0
Hermitage total 185 168 67 25527.1 21.8 24.0 24.9 675 24.9
North A 88 52 26 5344.8 23.1 29.8 28.9 219 28.9
North B 86 99 31 12243.6 30.8 24.5 31.3 338 31.3
North C 39 24 4 3423.3 23.7 10.8 21.9 101 21.9
North total 217 183 62 22040.4 28.2 25.6 28.8 682 28.8
South A 103 65 34 7336.2 35.0 31.1 41.6 275 41.6
South B 90 88 36 8542.0 32.6 32.1 39.9 299 39.9
South C 63 53 8 5018.8 19.5 25.3 25.4 174 25.4
South total 267 219 82 21533.1 29.1 30.4 36.4 783 36.4
West A 116 48 36 7144.1 34.8 40.9 46.8 271 46.8
West B 127 76 40 8537.3 22.9 37.2 40.5 328 40.5
West C 61 29 10 3112.5 11.8 14.4 22.0 131 22.0
West total 319 167 87 19334.5 23.7 35.9 39.6 766 39.6
Countywide A 478 278 147 34634.6 25.3 29.5 31.4 1,249 31.4
Countywide B 460 443 157 50738.2 27.1 29.6 32.9 1,567 32.9
Countywide C 240 190 31 19017.0 17.0 17.7 21.7 651 21.7
Countywide total 1217 977 345 108332.1 23.9 28.5 30.1 3,622 30.1
Wednesday, December 30, 2009 Source: MNPD Crime Analysis SectionFrom 12/20/2009 To 12/26/2009

Response Time Report of Nashville and Davidson County
METROPOLITAN POLICE DEPARTMENT
Overall (Arrival to Complete)
Precinct Shift No. CFS Ave TimeMAJOR OFFENSE
No. CFS Ave TimeOTHER OFFENSE
No. CFS Ave TimeTRAFFIC
No. CFS Ave TimeOTHER
No. CFS Ave TimeALL CFS
Central A 29 24 14 1634.6 60.3 76.5 69.3 83 55.8
Central B 16 25 6 1753.8 91.3 77.0 52.5 64 70.3
Central C 26 9 3 1527.8 61.1 38.3 42.5 53 38.2
Central total 72 62 23 5236.1 71.0 71.7 53.2 209 54.6
East A 54 46 14 4350.0 73.3 73.6 39.2 157 56.0
East B 75 87 8 6352.5 72.1 117.9 57.4 233 63.4
East C 25 28 1 2237.6 61.3 91.0 31.9 76 45.3
East total 156 178 24 13249.0 67.2 86.2 46.1 490 56.6
Hermitage A 88 43 23 8940.9 43.7 77.5 34.6 243 42.5
Hermitage B 66 68 36 12352.6 49.0 75.4 35.1 293 47.2
Hermitage C 26 47 5 3544.2 42.6 52.6 36.9 113 41.6
Hermitage total 185 168 67 25545.0 49.4 73.1 35.1 675 45.2
North A 88 52 26 5353.4 73.7 50.1 72.0 219 62.3
North B 86 99 31 12252.3 55.9 56.1 36.9 338 48.1
North C 39 24 4 3465.2 58.8 89.3 57.4 101 62.0
North total 217 183 62 22055.2 60.9 55.9 48.4 682 54.6
South A 103 65 34 7347.2 63.2 85.4 59.5 275 59.0
South B 90 88 36 8551.1 61.4 75.2 44.8 299 55.3
South C 63 53 8 5074.5 93.5 109.1 31.2 174 69.4
South total 267 219 82 21555.1 70.3 81.1 45.8 783 59.5
West A 116 48 36 7141.5 68.9 67.2 55.4 271 53.4
West B 127 76 40 8547.4 76.7 69.7 36.8 328 54.2
West C 61 29 10 3157.5 48.4 71.5 31.0 131 50.3
West total 319 167 87 19347.9 70.9 68.7 42.3 766 53.9
Countywide A 478 278 147 34645.4 64.6 71.5 52.0 1,249 54.5
Countywide B 460 443 157 50750.8 64.7 72.3 40.3 1,567 53.5
Countywide C 240 190 31 19056.5 63.3 77.9 37.6 651 54.0
Countywide total 1217 977 345 108349.8 64.5 71.6 43.1 3,622 53.9
Wednesday, December 30, 2009 Source: MNPD Crime Analysis SectionFrom 12/20/2009 To 12/26/2009
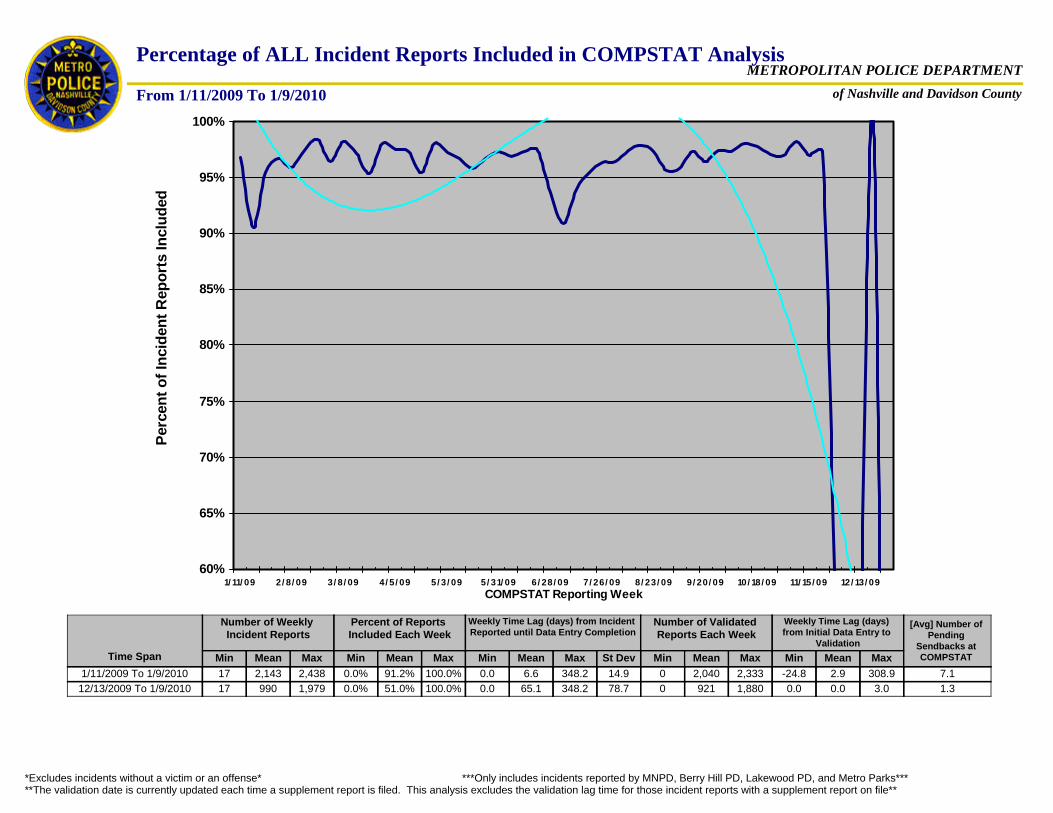
60%
65%
70%
75%
80%
85%
90%
95%
100%
1/ 11/ 09 2/ 8/ 09 3/ 8/ 09 4/ 5/ 09 5/ 3/ 09 5/ 31/ 09 6/ 28/ 09 7/ 26/ 09 8/ 23/ 09 9/ 20/ 09 10/ 18/ 09 11/ 15/ 09 12/ 13/ 09COMPSTAT Reporting Week
Perc
ent o
f Inc
iden
t Rep
orts
Incl
uded
Percentage of ALL Incident Reports Included in COMPSTAT Analysis
of Nashville and Davidson County
METROPOLITAN POLICE DEPARTMENT
From 1/11/2009 To 1/9/2010
Min17
Max2,438
Mean2,143
Number of Weekly Incident Reports
Min0.0%
Max100.0%
Mean91.2%
Percent of Reports Included Each Week
Min0.0
Max348.2
Mean6.6
Weekly Time Lag (days) from Incident Reported until Data Entry Completion
Min0
Max2,333
Mean2,040
Number of Validated Reports Each Week
Min-24.8
Max308.9
Mean2.9
Weekly Time Lag (days) from Initial Data Entry to
ValidationTime Span St Dev
14.91/11/2009 To 1/9/2010
[Avg] Number of Pending
Sendbacks at COMPSTAT
7.117 1,979990 0.0% 100.0%51.0% 0.0 348.265.1 0 1,880921 0.0 3.00.078.712/13/2009 To 1/9/2010 1.3
*Excludes incidents without a victim or an offense* ***Only includes incidents reported by MNPD, Berry Hill PD, Lakewood PD, and Metro Parks*****The validation date is currently updated each time a supplement report is filed. This analysis excludes the validation lag time for those incident reports with a supplement report on file**

60%
65%
70%
75%
80%
85%
90%
95%
100%
1/ 4/ 09 2/ 1/ 09 3/ 1/ 09 3/ 29/ 09 4/ 26/ 09 5/ 24/ 09 6/ 21/ 09 7/ 19 / 09 8/ 16 / 09 9/ 13 / 09 10/ 11/ 09 11/ 8/ 09 12/ 6/ 09COMPSTAT Reporting Week
Perc
ent o
f Inc
iden
t Rep
orts
Incl
uded
Percentage of PART I Incident Reports Included in COMPSTAT Analysis
of Nashville and Davidson County
METROPOLITAN POLICE DEPARTMENT
From 1/11/2009 To 1/9/2010
Min2
Max837
Mean691
Number of Weekly Incident Reports
Min0.0%
Max100.0%
Mean93.4%
Percent of Reports Included Each Week
Min0.0
Max333.3
Mean4.5
Weekly Time Lag (days) from Incident Reported until Data Entry Completion
Min0
Max837
Mean688
Number of Validated Reports Each Week
Min0.0
Max305.1
Mean4.5
Weekly Time Lag (days) from Initial Data Entry to
ValidationTime Span St Dev
6.91/11/2009 To 1/9/20102 705353 0.0% 100.0%58.5% 0.0 316.346.0 0 699348 0.0 1.80.053.012/13/2009 To 1/9/2010
*Excludes incidents without a victim or an offense* ***Only includes incidents reported by MNPD, Berry Hill PD, Lakewood PD, and Metro Parks*****The validation date is currently updated each time a supplement report is filed. This analysis excludes the validation lag time for those incident reports with a supplement report on file**