comprehensive student support (css)/response to ... forms/eli/breakout session 8 cs… ·...
TRANSCRIPT

Comprehensive Student Support
(CSS)/Response to Intervention (RTI)
July 19, 2013
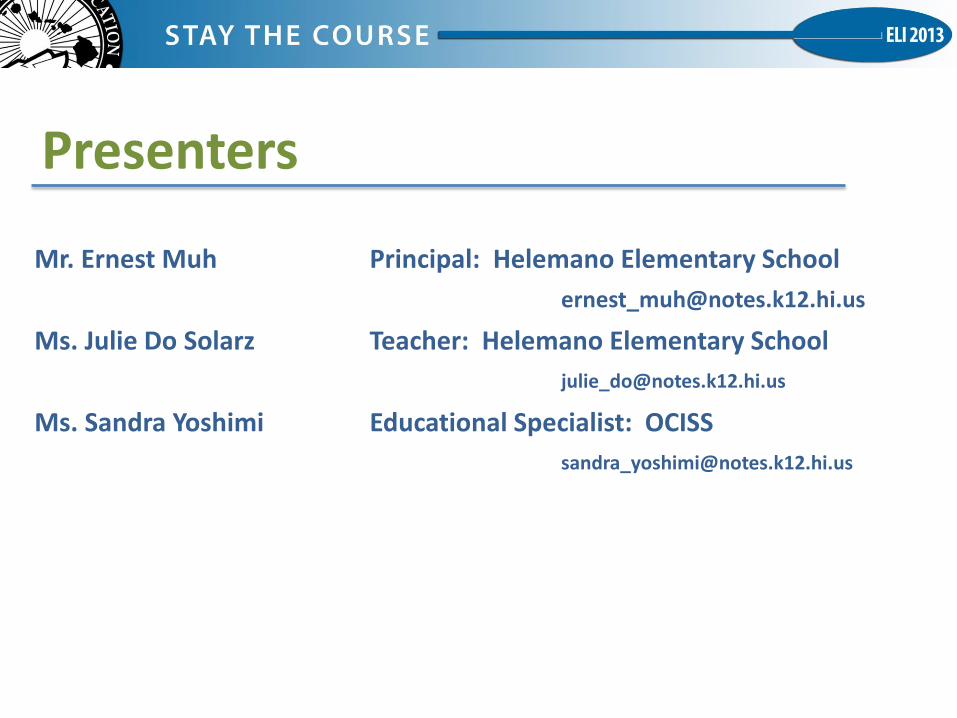
Presenters
Mr. Ernest Muh Principal: Helemano Elementary School
Ms. Julie Do Solarz Teacher: Helemano Elementary School
Ms. Sandra Yoshimi Educational Specialist: OCISS

Objectives Participants will gain an understanding of:
• CSS and RTI
• what is involved in the implementation of CSS/RTI in schools.
• the impact CSS and RTI have on Student Success.

WHY CSSS and RTI?

To provide support for all students to achieve success!

Helping Today’s Students Navigate Tomorrow’s World
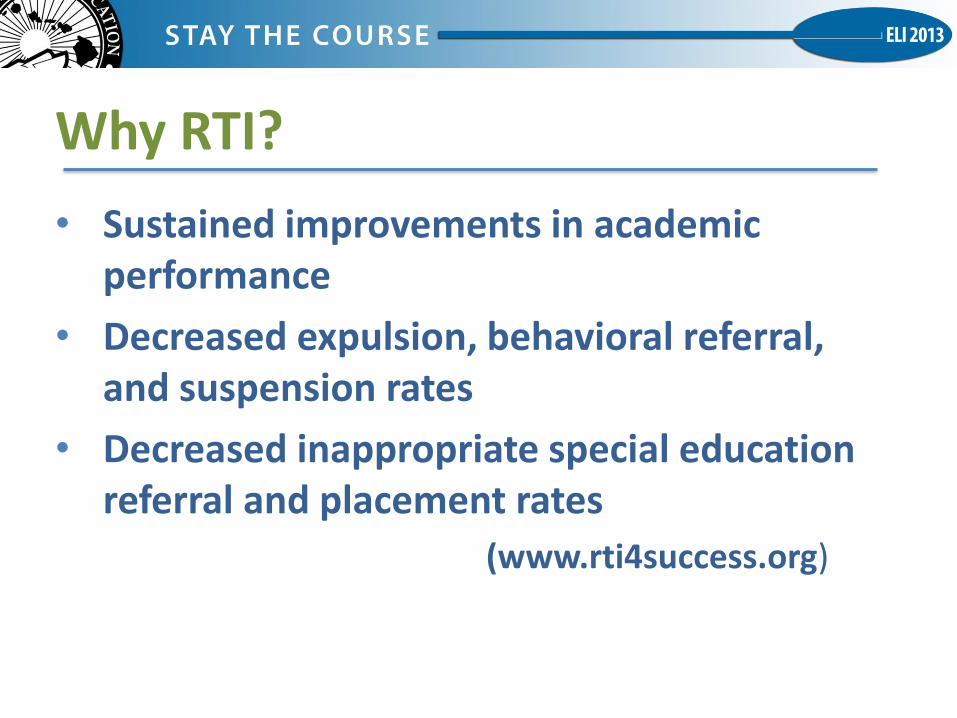
Why RTI?
• Sustained improvements in academic performance
• Decreased expulsion, behavioral referral, and suspension rates
• Decreased inappropriate special education referral and placement rates
(www.rti4success.org)

What is CSSS and RTI?
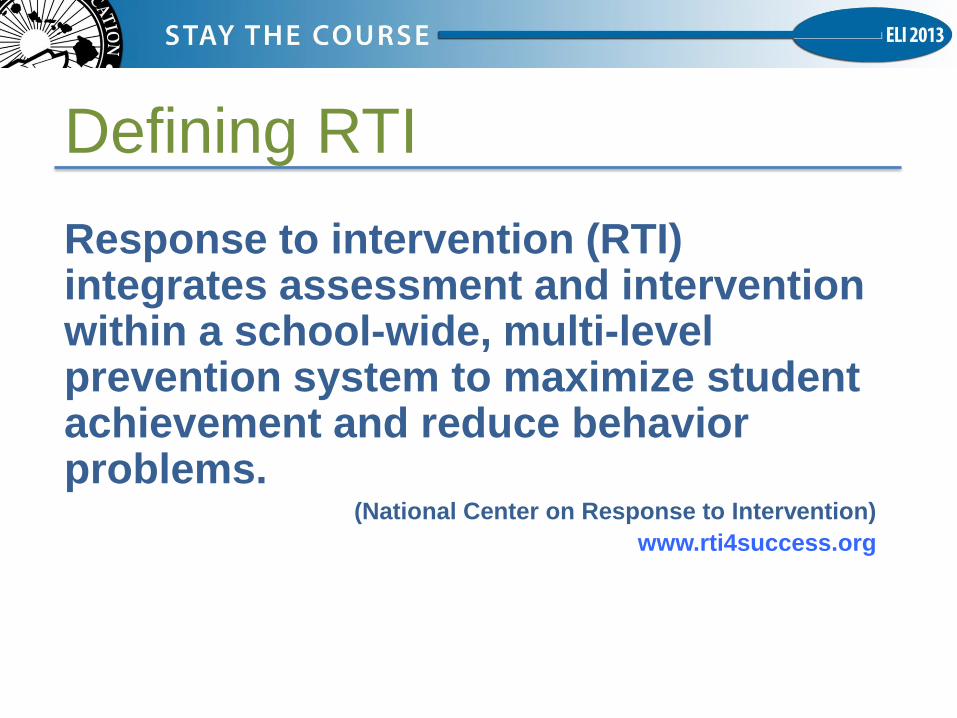
Defining RTI
Response to intervention (RTI) integrates assessment and intervention within a school-wide, multi-level prevention system to maximize student achievement and reduce behavior problems.
(National Center on Response to Intervention)
www.rti4success.org

Essential Components of RTI
• Universal Screening
• Progress Monitoring
• School-wide, Multi-Tiered Prevention System
• Data-Based Decision Making for:
• Instruction
• Evaluating effectiveness
• Fluid movement within the multi-level system
• Disability identification (in accordance with IDEA and Hawaii state law)

Universal Screening
PURPOSE: To identify students who are at risk for poor learning outcomes.
FOCUS: ALL students
TOOLS: Brief assessments that are valid, reliable, and demonstrate diagnostic accuracy for predicting learning or behavioral problems.
TIMEFRAME: Administered more than one time per year (e.g., fall, winter, spring)

NCRTI Screening Tools Chart
www.rti4success.org

Progress Monitoring
PURPOSE: Monitor students’ response to instruction and intervention.
FOCUS: Students who are identified through screening as at risk for poor learning outcomes.
TOOLS: Brief assessments that are valid, reliable, and evidence based.
TIMEFRAME: Students are assessed at regular intervals (e.g., weekly, biweekly, or monthly).

NCRTI Progress Monitoring Tools Chart
www.rti4success.org

Multi-Tiered System of Instruction and Intervention
Behavioral Academics
• Few students • Small group or individual • Increased intensity and duration • Specialized, intensive interventions for high-risk behavior • Progress monitoring weekly or more
Tier 2 TARGETED 10-15%
Tier 3 INTENSIVE 1-5%
Tier 1 UNIVERSAL 80-90%
• All Students • High quality core instruction • School-wide positive behavior support • Differentiated instruction • All students screened and monitored 3x year
• Some students • Small group • Targeted skill instruction • Positive behavior group interventions • Progress monitoring every other week

Tier 1: Universal
FOCUS: ALL students
INSTRUCTION: High quality curriculum (CCS)
High quality evidence-based instruction
SETTING: General education classroom
ASSESSMENTS: Screening, continuous progress monitoring, formative and summative assessments

Tier 2: Targeted
FOCUS: Students who are identified through screening as at risk for poor learning outcomes.
INSTRUCTION: Targeted, supplemental instruction delivered to small groups
SETTING: General education classroom or other general education location within the school
ASSESSMENTS: Progress monitoring, formative and
summative assessments.
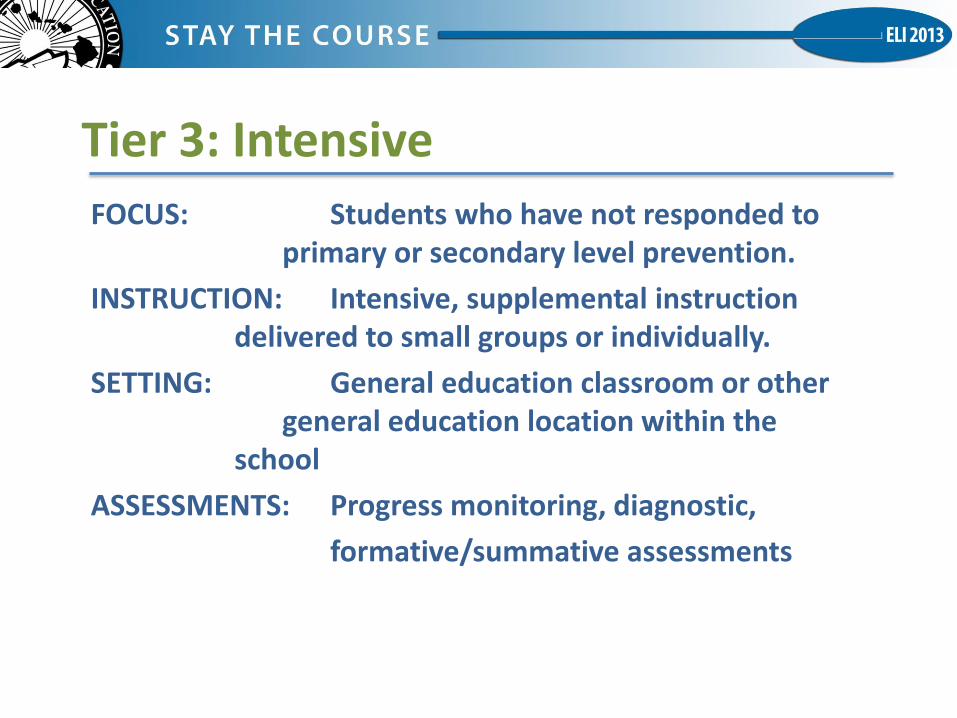
Tier 3: Intensive
FOCUS: Students who have not responded to primary or secondary level prevention.
INSTRUCTION: Intensive, supplemental instruction delivered to small groups or individually.
SETTING: General education classroom or other general education location within the school
ASSESSMENTS: Progress monitoring, diagnostic,
formative/summative assessments

NCRTI Instructional Intervention Tools Chart
www.rti4success.org

Data-Based Decision Making: • Analyze data at all levels of RTI implementation (e.g.,
state, district, school, grade level) and all tiers of intervention.
• Establish routines and procedures for making decisions.
• Set explicit decision rules for assessing student progress (e.g., stat benchmarks, level, and/or rate).
• Use data to compare and contrast the adequacy of the core curriculum and the effectiveness of different instructional and behavioral strategies.

Data-Based Decision Making: Types of Decisions
• Instruction
• Evaluate Effectiveness
• Movement within the multi-tiered prevention system
• Disability identification (in accordance with IDEA and Hawaii state law)
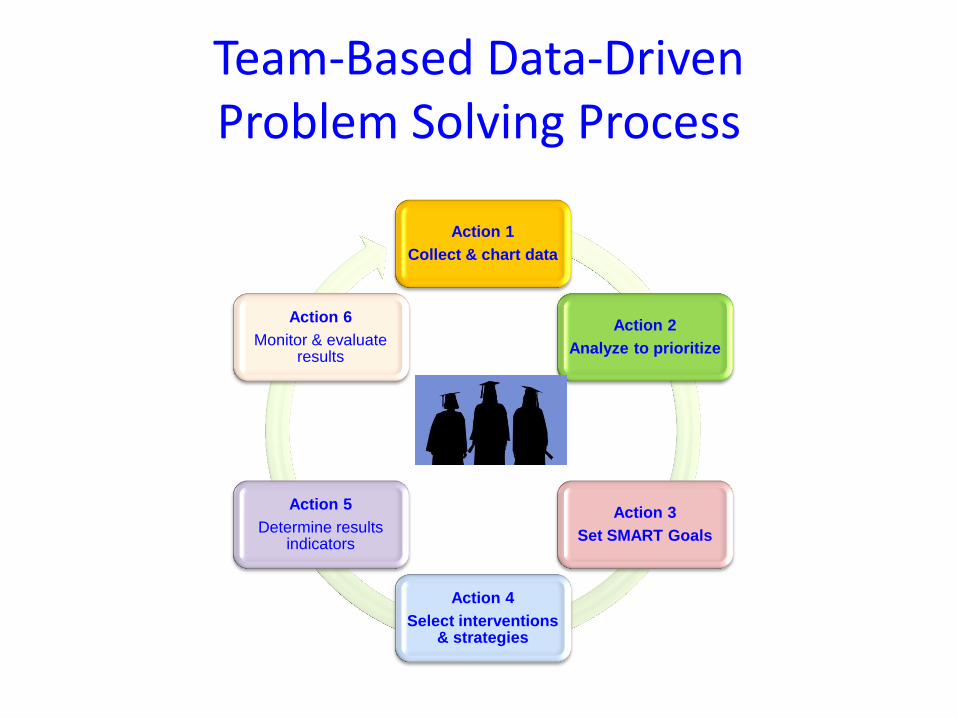
Team-Based Data-Driven Problem Solving Process
Action 1
Collect & chart data
Action 2
Analyze to prioritize
Action 3
Set SMART Goals
Action 4
Select interventions & strategies
Action 5
Determine results indicators
Action 6
Monitor & evaluate results

Data-Based Decision Making: IDEA 2004 Learning Disability Eligibility
To ensure that underachievement in a child suspected of having a specific learning disability is not due to lack of appropriate instruction in reading or math, the group must consider, as part of the evaluation described in 34 CFR 300.304 through 300.306:
• Data that demonstrate that prior to, or as a part of, the referral process, the child was provided appropriate instruction in regular education settings, delivered by qualified personnel; and
• Data-based documentation of repeated assessments of achievement at reasonable intervals, reflecting formal assessment of student progress during instruction, which was provided to the child’s parents.
(www.idea.ed.gov)

How do you implement RTI?
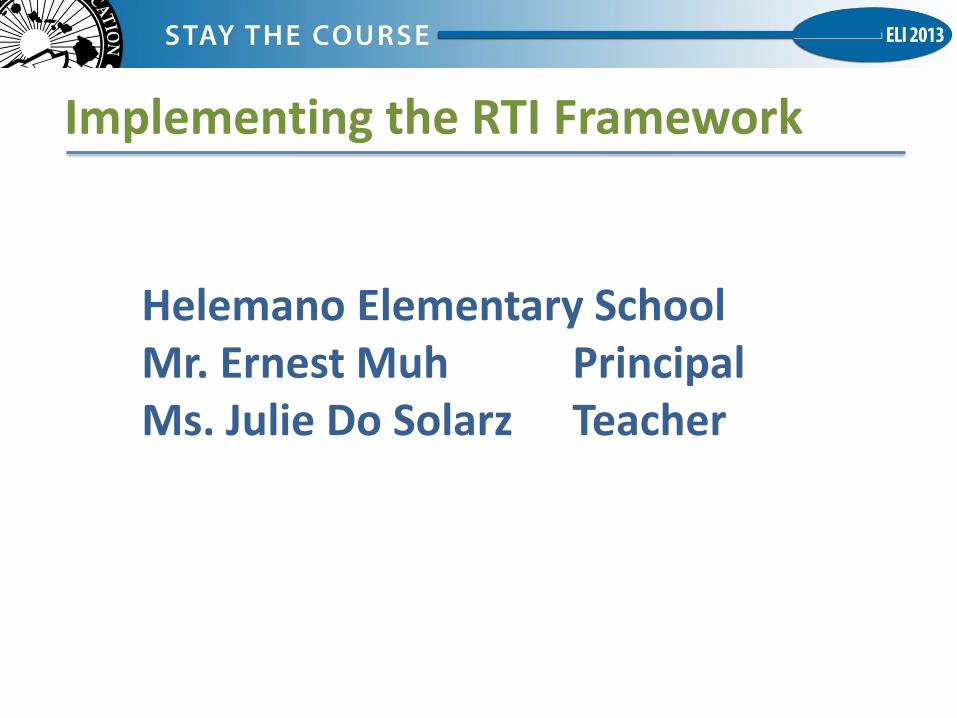
Implementing the RTI Framework
Helemano Elementary School Mr. Ernest Muh Principal Ms. Julie Do Solarz Teacher

Desired Outcome
• Share Helemano Elementary School’s implementation of a school wide Response to Intervention System (RTI)
• Share a RTI implementation checklist
• Disclaimer/We are not experts
• Every school is different

Helemano Elementary School
K-5 school located in Whitmore Village
640 students
30% military dependents
70% local students
65% economically disadvantaged students
10% English Language Learners
10% receive Special Education Services
36% attend pre-school before kindergarten

Where have I worked?
• Kahuku Elementary School
(1995-1997) 6th grade
• Mililani Mauka Elementary School
(1997- 2003) 5th and 6th grade teacher
• Mililani ‘Ike Elementary School
(2003-2005) 4th and 5th grade teacher
• Waimalu Elementary School
(2005-2008) Vice Principal
• Helemano Elementary School
(2008-present) Principal
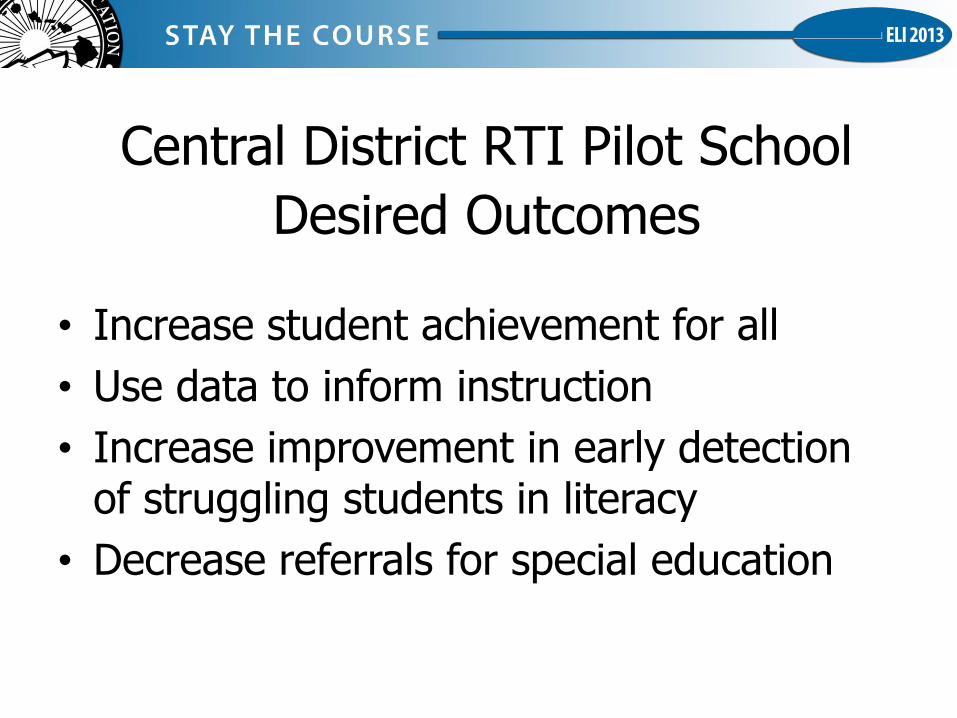
Central District RTI Pilot School
Desired Outcomes
• Increase student achievement for all
• Use data to inform instruction
• Increase improvement in early detection of struggling students in literacy
• Decrease referrals for special education

Why Response to Intervention?
• Placement in special education is not the MAGIC BULLET!
• 50%-60% of students in SPED are identified as SLD (Specific Learning Disabled)
• 40% of SLD students do not need SPED services
(Reschly)

Why Response to Intervention?
It answers one of the critical questions that professional learning communities must address
How will we respond if students are not learning?
Revisiting PLCs at Work, 2008

RTI Implementation Checklist
• Belief that all children can learn
• Consistent school wide curriculum/interventions
• Universal Screening /Progress Monitoring Tool
• Trained test administrators
• Personnel to interpret the data
• Time in school for interventions to be provided
• Personnel to provide timely and appropriate interventions
• Time to conduct problem solving meetings

Universal Screening
• Definition: Brief assessments of age appropriate critical skills
• Standardized or curriculum based measures (CBM)
• Purpose: To provide feedback about class performance and identify students who need closer monitoring in the general education curriculum
• Frequency: 3 times a year

Universal Screening Tool Phoneme Segmentation Fluency

Universal Screening Tool Nonsense Word Fluency

Universal Screening Tool Reading - Curriculum Based Measurement

Three Tiers of Intervention/Tier 1
Tier I (80-90% of the student population)
Teachers identify students who may be at-risk for failure by assessing all students.
Teachers provide core instruction to all students

Tier 2
Tier II (10-15% of the student population): Targeted Interventions
Teachers give students in Tier 2 more intensive services and interventions. The services are provided in small group settings and they are in addition to the core instruction

Tier 3
Tier III (5-10% of the student population): Intensive Interventions
Teachers give students in Tier 3 individualized, intensive interventions that target their skills deficit. Students who do not respond to the targeted interventions are considered for special education testing.

Interventions
• K-1 Phonics: letter names, sounds, phoneme segmentation, regular/irregular sight words, and spelling rules
• K-1 Fluency: regular/irregular sight words in stories, spelling rules, reading comprehension, and writing
• 2-3: phonics, fluency, comprehension, syllabication/morphology, and writing
• 4-5: phonics, syllabication/morphology, fluency, and comprehension, and writing

Progress Monitoring
• Definition: Assessment procedures for determining the extent to which students are benefiting from effectiveness of instruction
• Frequency: Once every two to three weeks
• Which students: Tier 2 and Tier 3

Use of data/Progress Monitoring
Phoneme Segmentation


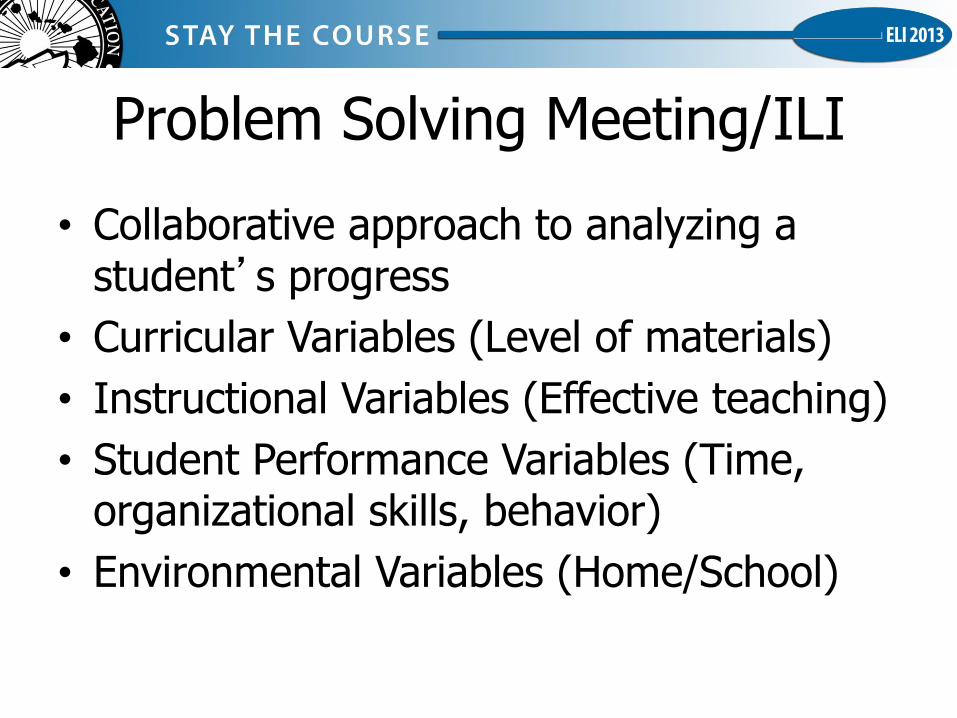
Problem Solving Meeting/ILI
• Collaborative approach to analyzing a student’s progress
• Curricular Variables (Level of materials)
• Instructional Variables (Effective teaching)
• Student Performance Variables (Time, organizational skills, behavior)
• Environmental Variables (Home/School)

Implementation Timeline
• SY 2008-2009-Introduction to universal screening tool, analysis of data, and problem solving meetings for grades K-1
• SY 2009-2010-Formation of tiered intervention groups and progress monitoring in grade 1. Introduction to universal screening tool and analysis of data in grades 2-3
• SY 2010-2011: K-5 implementation of universal screening tool, progress monitoring, tiered intervention groups, and problem solving meetings
• SY 2011-2013: Refining the RTI System

Initial Special Education Evaluations
School Year
2010-2011 2011-2012 2012-2013
Enrollment 536 580 619
Number of evaluations
36 19 20
Number of students qualified under SLD
8 5 7

Universal Screening/HSA Correlation
HSA Reading Spring 2012
80% Probability of students passing the HSA with a score of 143 on the R-CBM
Grade 5 results: 36 out of 39 passed=92.3%
80% Probability of students passing the HSA with a score of 136 on the R-CBM
Grade 4 results: 25 out of 25 passed=100%
80% Probability of students passing the HSA with a score of 119 on the R-CBM
Grade 3 results: 40 out of 40=100%

Universal Screening/HSA Correlation
HSA Reading Spring 2013
80% Probability of students passing the HSA with a score of 143 on the R-CBM
Grade 5 results: 38 out of 41 passed=93%
80% Probability of students passing the HSA with a score of 136 on the R-CBM
Grade 4 results: 40 out of 43 passed=93%
80% Probability of students passing the HSA with a score of 119 on the R-CBM
Grade 3 results: 53 out of 56=95%

HSA Reading Scores Groups 2009
(58%)
2010
(58%)
2011
(72%)
2012
All Students
58% 65% 83%
Disadvantaged
53% 61% 78%
Asian-Pacific Islanders
59% 65% 83%
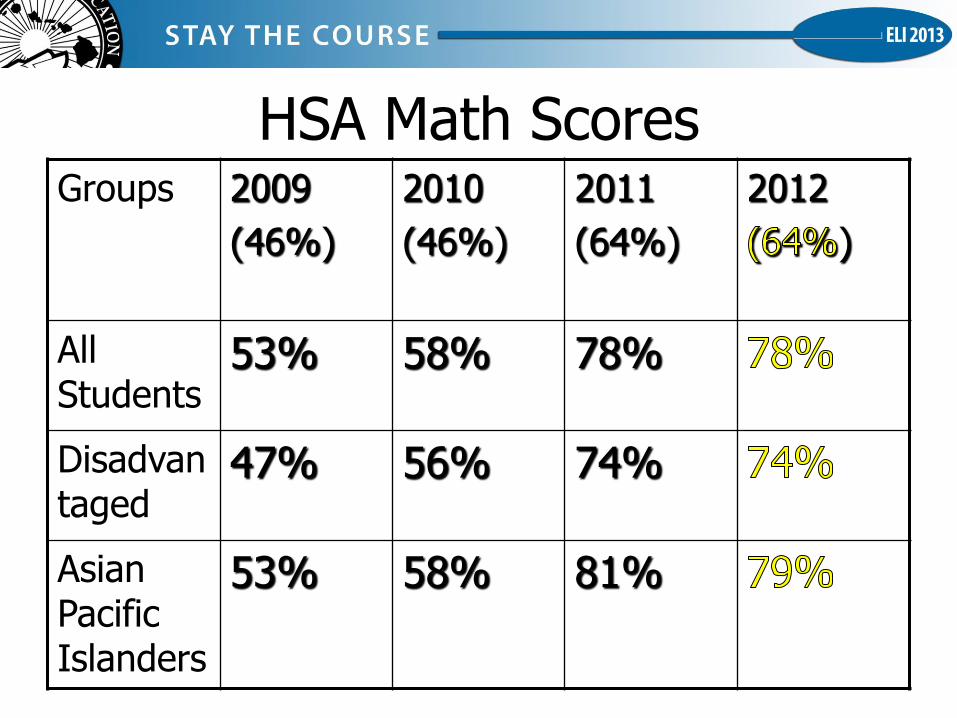
HSA Math Scores Groups 2009
(46%)
2010
(46%)
2011
(64%)
2012
)
All Students
53% 58% 78%
Disadvantaged
47% 56% 74%
Asian Pacific Islanders
53% 58% 81%

RTI Implementation Checklist
• Belief that all children can learn
• Consistent school wide curriculum/interventions
• Universal Screening /Progress Monitoring Tool
• Trained test administrators
• Personnel to interpret the data
• Time for interventions to be provided
• Personnel to provide timely and appropriate interventions
• Time to conduct problem solving meetings

Why Response to Intervention?
• Placement in special education is not the MAGIC BULLET!
• 50%-60% of students in SPED are identified as SLD (Specific Learning Disabled)
• 40% of SLD students do not need SPED services
• CCSS/SBAC/College and Career Readiness

Questions

Need More Information?
National Center on Response to Intervention www.rti4success.org RTI Action Network www.rtinetwork.org IDEA Partnership www.ideapartnership.org

Comprehensive Student Support System Implementation Continuum
Supporting Quality Implementation of the Hawaii Department of Education's 6 Priority Strategies
Schools will use the Continuum to self assess their current status in program implementation of the priority strategies as part of the Academic Review Team Process. (7/2013)

Mahalo!