comprehensive programme completion report · chapter 2: programme details . 2.1 planning phase . as...
TRANSCRIPT

i
Rural Reconstruction Nepal
COMPREHENSIVE PROGRAMME COMPLETION REPORT
November 2018
A programme supported by Government of Nepal and the UKaid
Community Development Programme (CDP)
Submitted to: Development Cooperation Coordination Section,
Planning and Development Cooperation Coordination Division,
Ministry of Federal Affairs and General Administration Singhadurbar, Kathmandu
And Department for International Development (DFID)
Nepal Office, Ekantakuna, Lalitpur
Submitted by: Rural Reconstruction Nepal (RRN)
(Lead Organization of the CDP Consortium)

ii
LIST OF ABBREVIATIONS CAC Community Awareness Centers CBDRMC Community Based Disaster Risk Management Committee CDP Community Development Programmes CSP Community Support Programme DADO District Agriculture Development Office DAGs Disadvantaged Groups DCC District Coordination Committee DDR Disaster Risk Reduction DDRC Disaster Risk Reduction Committee DEO District Education Office DFID Department for International Development DLSO District Livestock Service Office DSMC District Social Mobilization Committee DSMCC District Social Mobilization Coordination Committee DWS Drinking Water System GBP Great Britain Pound GESI Gender and Social Inclusion GIS Geographical Information System HFA Hyogo Framework of Action IPFC Integrated Plan Formulation Committee LDRMC Local Disaster Risk Management Committee LDRMP Local Disaster Risk Management Plan LGCDP Local Governance and Community Development Programme LG Local Government LIP Livelihood Improvement Programme LSGA Local Self Government Act MoFAGA Ministry of Federal Affairs and General Administration MoFALD Ministry of Federal Affairs and Local Development OPM Oxford Policy management PCR Project Completion Report RBA Risk Based Assessment RRN Rural Reconstruction Nepal ToC Theory of Change ToR Terms of the Reference UCPA Underlying Cause of Poverty Assessment VDC Village District Community WCF Ward Citizen Forum WDO Women Development Office WFP World Food Programme

iii
List of Tables Table 2.1: Distribution and coverage of Local Government Unit in CDP Table 2.2: Outputs and respective indicators Table 2.3: Expenditure details by year for CDP Table 2.4: Financial plan of CDP (July 2018 – October 2018) Table 3.1: No. of CAC, poor and excluded non-CAC members supported for skill training Table 3.2: No. of individuals that established business upon receiving LIP support Table 3.3: No. of CBDRMC/LDRMC formed Table 3.4: No. of awareness-raising events on DRR Table 3.5: No. of projects and total number of beneficiaries Table 3.6: Total number of individuals employed by various infrastructure projects by
region Table 3.7: Employment Days created by Infrastructure type by region Table 3.8: Households receiving relief materials by CDP Table 3.9: Distribution of relief materials by districts in hilly region Table 3.10: Name of local government selected for grievance handling component under
CDP List of Figures: Figure 3.1: No. of CACs formed by CDP Figure 3.2: No. of social campaigns conducted by CACs Figure 3.3: Number of training (blue) and individuals trained (orange) by CDP Figure 3.4: No. of CBDRMPs and School Contingency Plan formulated Figure 3.5: Total Community Score Card administered by CDP in the two cycles Figure 3.6: No. of orientation (blue) provided and No. of individuals trained (orange) Figure 3.7: No. of LGs where operation capacity building training was conducted (blue)
and No. of individuals trained (orange) Figure 3.8: No. of joint monitoring visit conducted under CDP by different level of
stakeholders Figure 3.9: Total number of training provided to management and users committee Figure 3.10: No. of infrastructure projects by category Figure 3.11: District-wise disaggregation of HHs that received relief support from CDP Figure 3.12: No. of HHs supported by CDP as part of the relief effort in hills/mountains Figure 3.13: Distribution local bodies by region with grievances handling mechanisms

iv
TABLE OF CONTENTS
CHAPTER 1: INTRODUCTION ......................................................................................................... 1
1.1 Background ................................................................................................................. 1 1.2 Objectives.................................................................................................................... 1 1.3 Methodology ............................................................................................................... 2 1.4 Expected Results .......................................................................................................... 2 1.5 Organization of the PCR ............................................................................................... 2
CHAPTER 2: PROGRAMME DETAILS .............................................................................................. 3
2.1 Planning Phase ................................................................................................................... 3 2.2 Political deadlock and Brexit ............................................................................................... 3 2.3 Programme Coverage ......................................................................................................... 3 2.4 Target Group ...................................................................................................................... 4 2.5 Programme Components .................................................................................................... 4
2.5.1 Community Empowerment ............................................................................................... 4 2.5.2 Ensuring Enabling Environment ........................................................................................ 5 2.5.3 Ensuring Service Delivery ................................................................................................... 6
2.6 Programme outcome and outputs ...................................................................................... 6 2.7 Budget ............................................................................................................................... 8
CHAPTER 3: MILESTONES AND ACHIEVEMENTS ............................................................................. 9
3.1 Outcome level ............................................................................................................. 9 3.1.1 Implementation related Findings ...................................................................................... 9 3.1.2 Economic empowerment related findings ........................................................................ 9 3.1.3 Service delivery related findings ........................................................................................ 9 3.1.4 Governance related findings ............................................................................................. 9
3.2 Output level............................................................................................................... 10 3.3 Additional Activities carried out by CDP ...................................................................... 30
3.3.1 Grievance handling mechanism ...................................................................................... 30 3.3.2 Program introduction to LGs ........................................................................................... 32 3.3.3 Formulation of Post-Flood Reconstruction Plan (PFRP) .................................................. 32 3.3.4 Public Audit of local government’s interventions ............................................................ 32
3.4 Publications and visibility of CDP ...................................................................................... 32
CHAPTER 4: ACHIEVEMENT AND LESSONS FROM CDP ................................................................. 34
4.1 Background ............................................................................................................... 34 4.2 CAC as a platform to strengthen and involve the poorest of the poor ................................ 34 4.3 Economic empowerment through LIP ......................................................................... 35 4.4 Increased participation of community members during social campaigns .................... 36 4.5 Holistic package and coordination under DRR component ........................................... 36 4.6 Adaptive capacity building work for enhancing governance ........................................ 37 4.7 A robust monitoring mechanism in place .......................................................................... 38
CHAPTER 5: RECOMMENDATION ................................................................................................ 39
REFERENCES .............................................................................................................................. 41

1
CHAPTER 1: INTRODUCTION
1.1 Background Community Development Programme (CDP) is a non-state led programme funded by Ukaid/DFID. The programme is being implemented by a consortium led by Rural Reconstruction Nepal (RRN) along with the World Food Programme (WFP) and Oxford Policy Management (OPM). The programme complemented to the Local Governance and Community Development Programme (LGCDP) which was implemented by the then Ministry of Federal Affairs and Local Development (MoFALD), now Ministry of Federal Affairs and General Administration (MoFAGA). The programme was implemented in 18 districts of Nepal. From Province number 1 Sunsari is covered by the programme including all the eight districts of Province number 2 namely Saptari, Siraha, Dhanusa, Mahottari, Sarlahi, Rautahat, Bara and Parsa. Six districts namely Jajarkot, Kalikot, Jumla, Dolpla, Mugu and Humla from the Karnali and three districts of Sudur Pashchim Province namely Achham, Bajura and Bajhang were covered by the programme.
The total duration of the project is three years and ten months from January 2015 till October 2018 with a total budget of Great Britain Pound (GBP) 19,958,350.00. The overall target groups of the programme are the poor and excluded communities of the working eighteen districts of Nepal.
1.2 Objectives Specific objectives of the programme are as follows:
• To support the systems for strengthening local governance mechanisms, • To promote effective citizen participation in local decision-making structures, • To provide support to strengthen transparency and accountability mechanisms, and • To improve the provision and delivery of public services.

2
1.3 Methodology The ‘Comprehensive Project Completion Report (PCR)’ of CDP has been prepared using two methods, namely desk review of following existing reports and field level observations and consultations.
• CDP Inception Report 2015 • CDP Implementation Guidelines Report 2015 • CDP Situational Analysis Report 2015 • CDP Baseline Research Report 2016 • CDP Annual Report 2017 and 2018 • UCPA reports • CSP CAC Report 2013 • LGCDP II reports • LDRMP guidelines • DRR guidelines • GESI report 2017
1.4 Expected Results The programme has stipulated certain results by the end of the programme. The expected outcome of the programme as defined in the programme document is “Strengthened, coherent, resilient and inclusive local government system for effective service delivery, and this outcome will be contributed with the attribution of following programme outputs:
• Poor and excluded people empowered to claim their rights and access to the economic opportunity;
• The structure, systems and processes of the local bodies strengthened to be inclusive, accountable and transparent; and
• Improved service delivery for poor and excluded people, including disaster resilient infrastructures.
1.5 Organization of the PCR This comprehensive programme completion report has a total of five chapters. With introduction, background, objectives, programme expected results presented in this chapter, the second chapter provides an programme details of CDP. Chapter three deals with the achievements by each output and its respective indicators whereas fourth chapter presents the achievements from CDP. Likewise, the last chapter presents some key recommendations out of this review. References are provided at the end.

3
CHAPTER 2: PROGRAMME DETAILS
2.1 Planning Phase As per the original design, the inception phase was scheduled from January to March 2015. However the programme had to extend its inception phase by five months till August 2015 to adjust on some changes in the programme document against the original Terms of the Reference (ToR). This process was delayed by the devastating earthquake of April 2015. The extended duration was crucial as it not only revised the theory of change (ToC) but also the individual outcomes and outputs of the logical framework of the programme were revised. During this inception phase, a situational analysis conducted by RRN and a DFID mission shared the outcomes of its fact-finding mission both of which largely identified the need to increase focus on a major thematic/strategic component to the programme on ‘coherency’ mainly to improve upon the eminent fragmented planning system of the then government. This phase proved to be very vital as it's not only helped in streamlining programme’s activities against the revised ToC but also helped in ensuring renewed focus on the theme of disaster risk reduction out of the country’s experience from the earthquake. The need to focus on strengthening grassroot level planning process through capacity building of local leaders at vital forums such as Ward Citizen Forum (WCF) and Integrated Planning Formulation Committee (IPFC), strengthening the Disadvantaged Groups (DAGs) institutionalized through Community Awareness Centers (CACs) were further highlighted. The need to work very closely with the then local bodies not just at the strategic level but also on a day-to-day basis being directly involved in the vital government forums such as WCF, Ilaka offices and DDC was the core focus made during the inception phase. The implementation strategy including the Monitoring and Evaluation strategies and other planned documents under the inception phase were accordingly revised and strengthened.
2.2 Political deadlock and Brexit While the programme was gradually recovering from the impacts of the devastating earthquake, right after the inception phase, as the programme entered into the implementation phase, the programme faced another major political deadlock in the country following the promulgation of the new constitution. Due to Terai strike, development projects were highly impacted. CDP, with major intervention in Province No. 2- an area that was at the height of political turmoil that time, continued its implementation despite challenges. The programme continued as planned as the political situation gradually came to normal. The programme had to undertake one additional adaptation following Brexit. This resulted into high devaluation of Great Britain Pound (GBP) and the programme re-adjusted its resources, interventions and priorities in order to account for the decrease in funding.
2.3 Programme Coverage The programme is being implemented in 163 wards of 57 municipalities and in 243 wards of 74 rural municipalities spread across 18 districts of Nepal. Table 2.1 shows the distribution based on the current restructuring of the government. Compared to hilly region, Terai has more coverage in terms of municipality compared to rural municipality. Total number of wards in both the regions are nearly the same.

4
Table 2.1: Distribution and coverage of Local Government Unit in CDP
Region Municipality Rural Municipality
Total
MP Wards RM Wards Local Government Unit
Wards
West (Hill and Mountain)
10 50 34 150 44 200
East (Terai) 47 113 40 93 87 206 Total 57 163 74 243 131 406
Source: CDP 3rd Annual Report
2.4 Target Group CDP aimed to provide direct and indirect benefits to various types of stakeholders. Direct beneficiaries of the programme include the poor and marginalized groups situated in the 131 municipalities and rural municipalities. These individuals have been reached through mechanisms such as Citizen Awareness Center (CAC) where the most dis-advantaged groups (DAGs) have been identified for launching the programme. Likewise, other direct beneficiaries include the local government units (Municipalities and Rural Municipalities) which received various capacity building and governance strengthening activities. CDP has also facilitated and assisted in increasing capacity of the then District Development Committee (DDC) situated in the selected 18 districts. Indirect target groups include individuals and institutions whose roles and functions relate to the overall goal and objectives of the programme. Senior officials of the newly elected local government such as Mayors, deputy Mayors, elected chairperson and members have been trained on various legal and policy provisions which could be vital learnings as they engage in forming policies and programmes in their respective areas. In addition, various the then district line agencies have also been engaged in the overall implementation and resources have been dedicated to seek their technical inputs during the course of programme implementation. These agencies include District Agriculture Development Office (DADO), District Livestock Service Office (DLSO), District Education Office (DEO), District Health Office (DHO), District Water and Sanitation Office, Nepal Red Cross Society, District Women Development Office (WDO) including NGOs and their networks.
2.5 Programme Components As outlined in the inception report, CDP broadly has three components namely (a) Community empowerment (b) Ensuring enabling environment and (c) Enhancing service delivery. 2.5.1 Community Empowerment This component is one of the leading focus of CDP. The core theme of this component is to increase the capacity of citizen such that they could raise their voice and place demands on their rights and entitlements from both state and non-state actors. There were mainly three sub-components under this theme as briefly discussed below:
Social Mobilization: Social mobilization was the starting point of community empowerment under CDP. Social mobilizers under the programme acted as a bridge between programme and local communities. As the programme selected some of the most remote and disadvantaged communities in Nepal, social mobilization acted as a very vital step for structuring the upcoming programmes and interventions. During the initial stage when the former governance structure was in place, CDP ensured that its

5
district office worked very closely with the District Social Mobilization Committee (DSMC). Likewise, social mobilizers of CDP and LGCDP worked very closely complimenting on each others activities. One of the outcome of social mobilization was the linking it would build with the existing CACs in the area. CAC Support: CAC is the lowest form of citizens’ aggregation at the local level that are mobilized by both government and non-government agencies as part of their programme implementation. CDP used CAC as the unit for many of its planned interventions. Facilitated by the local resource persons (LRPs) under CDP, fifty-two weeks long REFLECT sessions were organized wherein citizens engaged in discussion over topics that related to their live and livelihoods. These sessions acted as the main platform to create awareness about their rights and entitlements. As an outcome of this interventions, households have gained access to funds such as social security funds, special target funds for women etc. Apart from the REFLECT sessions other activities that were channeled through this sub-component included (a) formation of new CACs to assist the government in reaching its targets (b) providing vocational skill based training (c) supporting small scale enterprises (d) supporting social events and campaigns (e) providing training for livelihood improvement among others.
Economic Empowerment: As noted above, REFLECT sessions were vital in identifying key livelihood needs of the community members. Based on the demand identified by the CAC members, CDP provided seed grant money of one lakh Nepalese Rupees to each CAC in order to improve their livelihood status through economic engagement. The decision of who gets the funds out of the CAC members was mutually agreed upon by the members and demands. This selection process ensured that the neediest in the CAC got the fund. This intervention has been successful in increasing economic activities at the local level. Notable part of this strategy is that the money reaches directly to the most disadvantaged households of a particular community.
CDP had clear sets of targeting strategy and DAG identification criteria which were applied to select beneficiaries. Underlying Cause of Poverty Analysis (UCPA) tool was the leading basis to select beneficiaries which was applied in communities in coordination with the then VDC secretaries and social mobilizer from LGCDP. Likewise, CDP ensured that interventions were not just centered around a single cluster but rather were distributed based on the DAG categorization of the government. 2.5.2 Ensuring Enabling Environment This component acted as a supporting element for the entire CDP implementation as it dealt mainly with functions required to run and operationalize the planned implementation. At the central level, a coordinator responsible to build capacity of NGO facility was involved which that time supported both MoFALD and LGCDP implementation. District level facilitation and coordination was a crucial component of CDP implementation wherein respective district offices worked closely with the then District Social Mobilization Coordination Committee (DSMC). District coordinator took the lead role in supporting the required functions. CDP assisted all the 18 districts’ integrated planning processes by directly engaging in the periodic planning events. The Programme staff helped ensure that all the standard steps and processes were complied during the regular planning process of the government. The then 14-steps planning process was the leading basis for programme design. CDP selected only those projects that came out of the regular planning of the government. Given the scope of the project, out of the 14 steps, the domain which extended from settlement level planning till IPFC level at the district were considered by the programme. Among other, CDP supported the then DDC to enhance coordination between other development projects to come under same window. It helped to link district line agencies with citizens through forums such as

6
CACs. Under this component, CDP gave high priority to promoting coherence among actors- from central to CAC level. Coherency component mainly dealt with ensuring that state and non-state actors alike follow a common and efficient planning and implementation cycle- instead of what appeared to be vertical linked mechanisms. Separate sets of activities were implemented from central to CAC level ensuring both vertical and horizontal coordination, linkages and resource sharing strategies. 2.5.3 Ensuring Service Delivery One of the main aim of CDP was to assist government to provide timely and quality services to the people. Fundamental to this was to increase the capacity of local communities such that they can claim their rights and entitlements for which the programme had a strong component of awareness raising and sensitization such as REFLECT sessions. The programme also worked directly with the local government to assist them in their regular planning process- assisting in the 14-steps planning process before the restructuring and on the 7 steps planning after the promulgation of the new constitution. Contrary to other non-state led projects as a main principle, CDP ensured that all the projects to be supported by the programme come from the regular planning process of the government. For all the support provided by the programme, this principle was strongly adhered. CDP supported the construction of various types of disaster resilient infrastructures such as school building, health posts, water supply scheme, irrigation schemes, culverts, community building, bio-engineering works among others identified by the communities through the regular planning process of the government. CDP coordinated with the then District Technical Office and ran several types of training for required construction. Some of them included pre-construction training, post-construction training, basic care and maintenance training and other training on cross-cutting themes such as gender, equity, public audits etc. CDP worked with state and non-state actors to help train communities on disaster preparedness. All the infrastructure support provided by the programme were disaster resilient. First step under the DRR component was identification of VDC. This identification was carried out in consultation with DDMC. In each of the then VDC, Local Disaster Risk Management Committee (LDRMC) were formed. In each of these VDC, four most vulnerable communities were identified. This identification was carried out using Participatory Vulnerability Capacity Assessment (PVCA) and in each of the communities, Community Based Risk Management Committee (CBDRMC) were formed. In each community, task force were formed for early warning, light search and rescue and first aid and for each of the task force, respective trainings were provided. These stakeholders took the lead in the formulation of Community Based Disaster Risk Management Plan (CBDRMP). This was followed by the preparation of Local Disaster Risk Reduction Management Plan (LDRMP). Pre-positioning material support was provided to 18 DDMCs and 54 the then VDCs.
2.6 Programme outcome and outputs Outcome of CDP reads as “Strengthened, coherent, resilient and inclusive local government systems for effective service delivery”. In order to achieve these outcomes, there are a total of three outputs measured through multiple indicators as shown in Table 2.2 below:

7
Table 2.2: Outputs and respective indicators
Outputs Indicators Output 1: Poor and excluded people empowered to claim their rights and receive the economic opportunity.
1. Indicator 1.1: Number of CACs formed by CDP 2. Indicator 1.2: Number of awareness raising session (REFLECT
model) provided to CAC 3. Indicator 1.3: Number of social campaigns conducted by CAC 4. Indicator 1.4: Number of trained people on community mediation. 5. Indicator 1.5: Number of CAC and poor and excluded non-CAC
members received skill training and support 6. Indicator 1.6: Number of enterprises established by CAC
households as livelihood support 7. Indicator 1.7: Number of CBDRMC/LDRMCs formed 8. Indicator 1.8: Number of CBDRMC and task force members trained 9. Indicator 1.9: Number of CBDRMP and school contingency plans
formulated 10. Indicator 1.10: Number of awareness-raising events on disaster
risks reduction (DRR) Output 2: Strengthened local bodies' structure, systems and processes to be inclusive, accountable and transparent. 1
1. Indicator 2.1: WCF members trained on their roles and planning process
2. Indicator 2.2: IPFC members trained on their roles and planning process at VDC level
3. Indicator 2.3: IPFC members trained on their roles and planning process at district level
4. Indicator 2.4: VDCs undertaking 'scorecards' exercise 5. Indicator 2.5: Capacities of newly created local governments
strengthened (Local level profile. capacity development training and integrated periodic plan formulation (Previously 'VDC periodic plans prepared') 2.5.1: Newly elected officials and government staff and stakeholders at local level supported for local government operation and planning management capacity building training 2.5.2: LGs are supported for the development of digital profile with sectoral information and resource maps 2.5.3: LGs are supported for process facilitation for the formulation of Integrated Periodic Development Plan
6. Indicator 2.6: Trimester progress sharing events conducted 7. Indicator 2.7: Joint monitoring conducted at all levels 8. Indicator 2.8: Functional DSMCC and NGO Coordination
Mechanism (DSMCC, NGOCC or NGO Desk) 9. Indicator 2.9: LDRMC and task force members trained 10. Indicator 2.10: Number of LDRMP formulated and gets approval
Output 3: Improved service delivery for poor and excluded people including disaster resilient infrastructures
1. Indicator 3.1: Number of CDP funds established in compliance with the local planning process
2. Indicator 3.2: Relief and rehabilitation support for disaster affected families (HHs)
1 After the promulgation of the 2015 Constitution, Nepal went through the massive restructuring process in line with the new constitution and accordingly this output has been revized to cater the need of the newly formulated local governments.

8
2.7 Budget As of October 2018, total cumulative expenditure of the project was 19,810,917.00 GBP (99.26% of total Budget). There is 100% expenditure in Output 1, 99.05% expenditure in Output 2, 98.26% expenditure in Output 3, 99.14% expenditure in Programme operational support activities and 99.84% expenditure in Administration cost. Summary of Budget and Expenditure is shown in table 2.3.
Table 2.3: Expenditure details by year for CDP Amount in GBP
S.N Particular Total Budget Cumulative expenses till October end 2018
Balance Amount
Amount Percent 1 Output 1 6,098,971 6,098,971 100.00% 0 2 Output 2 1,308,077 1,295,700 99.05% 12,377
3 Output 3 (Infrastructure)
6,487,771 6,374,818 98.26% 112,953
4 Programme Operational support activities
1,762,301 1,747,218 99.14% 15,083
5 Administration Cost 4,301,229 4,294,209 99.84% 7,020 6 Grand total 19,958,350 19,810,917 99.26% 147,432
Source: Financial report October 2018 Output No. 1 is one of the major entry point of the project wherein CACs are supported in different dimensions. Starting from the formation process to conducting 52 weeks REFLECT session to providing various types of training, to launching social campaigns, to providing livelihood support to forming disaster response committees (CBDRMC/LDRMCs) and preparing various contingency plan to increasing DRR related awareness are part of this output. Even though the cost per interventions is highest in case of output 3 (dealing with infrastructure), the output 1 forms the core software component of the project which enables the implementation under other outputs.

9
CHAPTER 3: MILESTONES AND ACHIEVEMENTS
3.1 Outcome level The expected outcome of CDP was “"Strengthened, coherent, resilient and inclusive local government systems for effective service delivery." Oxford Policy and Management (OPM) was a CDP partner responsible for the MEL component. End line study was carried in order to help generate insights into whether and to what extent expected outcomes were reached and to generate data to satisfy reporting requirements to inform log-frame indicators. For a programme that witnessed many political atmospheres, the lessons drawn from this study could be vital for similar future interventions. This section presents the findings from the endline survey as well as those collected during the field visit. 3.1.1 Implementation related Findings
• Household work and traditional roles of community members have emerged as barrier for full and effective participation in the programme
• There was increase in the capacity of CAC members to collectively demand for their rights
• REFLECT sessions was one of the effective tool to increase awareness of CAC members which also increased their capacity to participate in other economic activities in addition to their engagements in household chores
• Due to vocational training, many individuals were found to running small scale enterprise and business due to which they were not only increasing their individual income but also providing services to their community
3.1.2 Economic empowerment related findings • Certain types of enterprise such as those requiring less technical knowledge, less start
up investments, ability to be replicated in local communities brought quick impacts on the livelihood of the communities
• Communities did attribute increase in individual income to LIP but they demanded that for interventions to be able to contribute largely to increase household income, more time would be required for the programme.
3.1.3 Service delivery related findings • In terms of improving services to communities from infrastructure projects, depending
upon the projects there are mixed results with education and health sector showing more favorable results compared to sectors such as drinking water schemes where there were more challenges
• As there are many projects being implemented in the area, attributing changes to CDP alone cannot be done where in communities showed higher satisfaction in areas where CDP was not heavily engaged
3.1.4 Governance related findings • Infrastructure projects have been successful in delivering transparent and accountable
activities through the various committees formed
• There is much to be learnt from the information exchange mechanism that take place in communities wherein there is difference in the priority and importance given by communities to informal, verbal and on one to one conversation whereas authorities largely relying on formal means such as radio, TV, notice boards etc

10
3.2 Output level FIRST OUTPUT: This output was related to the empowerment of poor and excluded people to enhance their capacity to claim their rights and also focuses on interventions to enhance economic opportunities of such people. Flagship activities of CDP such as CAC formation, REFLECT sessions, skill based training, committee formation, awareness raising exercise etc all fall within this output category. Indicator 1.1: Number of CACs formed by CDP CAC formation and strengthening was one of the leading interventions of the programme. CDP provided series of awareness building and strengthening inputs to these CACs on top of providing support in livelihood improvement related activities. Through facilitation from CDP’s local resource person, every CACs were carefully monitored to understand their capacity to be independent in long run.
Photo caption: Though there have been many lessons on the process, all the supported CACs graduated and received livelihood support during the course of the programme. Out of the total CACs about sixty percent were from Terai district with remaining from the hilly and mountainous districts.

11
Figure 3.1: No. of CACs formed by CDP
Indicator 1.2: Number of awareness raising session (REFLECT model) provided to CAC CDP has formed CACs by including the most vulnerable and poorest members in its intervention areas. The central theme of the programme is to increase awareness and capacity of such members in order to bring them into the mainstream social and economic development. REFLECT sessions have proved to be an appropriate tool for this task. As originally targeted, a total of 198,900 REFLECT sessions were carried for the total 3,825 CACs with 52 sessions per session. Achievement against this indicator is cent percent. Due to higher number of CACs in the terai, number of these REFLECT sessions were accordingly higher in the area. Not only have CAC members demonstrated increased awareness about their rights and responsibilities but have also started participating in local level planning and decisions making processes. REFLECT sessions have been pivotal to increase confidence of women and dalits in the communities. People who earlier either had no voice or were shy to express their opinion have slowly started to participate in local level discussions processes. Local leaders in the community report that women are constantly engaging in community development work and they give a lot of credit to the REFLECT sessions. Husbands have learnt a lot and applied knowledge that their spouse bring from such sessions. Indicator 1.3: Number of social campaigns conducted by CAC One of the outcomes of the REFLECT sessions is the increased engagement of CAC members seen in social events. This is demonstrated by the increased number of social campaigns conducted by the CAC members. Women members have organized and carried out social campaigns raising voice against social mal-practices such as Chaupadi, child-marriage, HIV AIDS among others. Other topics covered in social campaigns include promotion of good sanitation and hygiene practice and disaster risk reduction. These CAC members have also invited other prominent society members into such events such as government officials, recently elected local leaders, police among others. By the end of the programme, a total of 7,650 different social campaigns were planned all of which have been achieved according to the targets.
2,334
1,491
3,825
0500
1,0001,5002,0002,5003,0003,5004,0004,500
Terai Districts Hill/Mountain Districts Total
Picture: Confidence to open up in the society largely attributed to REFLECT sessions

12
Figure 3.2: No. of social campaigns conducted by CACs
Indicator 1.4: Number of trained people on community mediation. Despite the plan to undertake community mediation events, this activity was dropped from June 2016 by the programme. RRN under the advice from DFID and MoFAGA undertook preliminary assessment of other on-going projects in the area that implemented programs related to community mediation. It was concluded that there were already several ongoing programmes with similar components. Thus in order to avoid duplication of activities in the communities, the activities related to community mediation was stopped. Likewise, the amount of budget allocated for this output was not sufficient enough to run all the planned activities. Also given the newly formed structures at the local level, CDP realized that prior to initiating activities such as mediation, conflict resolution etc, many preparatory activities needed to be done at local government in light of the newly elected representative. Thus instead of scattering few activities here and there, CDP pulled out of this activity.
4,668
2,982
7,650
0
1,000
2,000
3,000
4,000
5,000
6,000
7,000
8,000
9,000
Terai Districts Hill/Mountain Districts Total

13
Indicator 1.5: Number of CAC, poor and excluded non-CAC members received skill training and support As of September 2018, a total of 4000 members of CAC, poor and excluded non-CAC have been involved in diverse types of skill training and support. Total target set by the programme has been met. Table 3.1 shows the number of CAC, poor and excluded non-CAC members trained by the programme. Oxford Policy Management (OPM) undertook a detailed assessment of the programme and has published series of policy briefs. The Deep-Dive Rapid Assessment for the Poverty Study provides an analytical view of the process of social, political and economic empowerment among a small sample of the CDP CAC groups. The focus was to measure the empowerment in the social, political and economic aspects for the CAC members in two different regions, using mainly qualitative approaches. Box 2.1 shows the policy brief findings relating to the outcomes of CACs at the community level, particularly in relation to increasing awareness.
In terms of sex category, both male and female beneficiaries are almost equal in proportion. In case of Terai, 49 percent are male and remaining 51% are female whereas in case of hill/mountain region, 58.4% are male and remaining 41.6% are female.
Table 3.1: No. of CAC, poor and excluded non-CAC members supported for skill training
Regions Total Target Total Achievement
Terai Districts 2,423 2420 Hill/Mountain Districts 1,577 1580 Total 4,000 4,000
Indicator 1.6: Number of enterprises established by CAC households as livelihood support The programme has provided livelihood support to thousands of poorest of the poor in the community through CACs. Livelihood Improvement Programme (LIP) is one of the lead interventions done by CDP where in cash support up to one hundred thousand Nepalese rupees is provided to each CAC.
Box 2.1: Glimpse of findings from OPM reported in the policy brief
• Husbands of CAC members are supportive of their wives belonging to a CAC group and encouraged their learning via the REFLECT sessions.
• However, intra-household decision making is still largely driven by husbands and male heads of the household, even though some signs of women feeling more enabled to be part of consultations.
• There is evidence of collective empowerment of the CAC groups enabling rights to be demanded – there were some examples of collective empowerment of the CAC groups proving to show collective action in demanding their rights.
• Collective action of the CAC groups has produced promising results through claiming their rights.
• REFLECT appears to be the main reason for the CAC members’ empowerment. However, at an individual level, CAC members (who are mostly women) continue to be constrained by traditional gender roles within the household that are proving to hinder their full participation in more high-level public and political affairs.

14
CDP followed standard procedure and a lot of homework was done in undertaking maturity assessment of CACs before they received LIP support. CACs identified diverse types of livelihood activities such as goat, sheep/rabbit raising, retail shop, poultry, vegetable farming, vegetable farming, bean production, sheep rearing, apiculture, yak keeping, tailoring, small business/enterprise among others. This is one of the popular components of the programme wherein apart from software support, households get direct benefit opportunities to plan and invest in their desired economic activities. As of June 2018, a total of 20,797 individuals were given LIP grants. According to the plan, each CAC gets Rs. 1,00,000.00. Initially, the fund was supposed to distribute to 5 members of CAC. However, according to local needs the fund was distributed to more than 5 members in some CACs. Hence a total of 1672 extra number of individuals have been benefitted by the programme. Highest support was given for goat farming, poultry, vegetable production, small retail shops and mobile repairing. Table 3.2 provides the distribution individuals that have benefitted through establishment of small scale enterprise.
Table 3.2: No. of individuals that established business upon receiving LIP support Region Total Target Total Achievement
Terai districts 11,670 1,2867 Hill/Mountain districts 7,455 7,930 Total 19,125 20,797
Indicator 1.7: Number of CBDRMC/LDRMCs formed CDP has provided strong focus on DRR related activities. By working with local communities and local leaders, the programme has adopted series of approaches, strategies and activities to increase capacity communities and institutions to reduce the risks associated with disasters. At the ward level (former VDC level), Local Disaster Risk Management Committee (LDRMC) have been formed. The first role of LDRMC is to undertake coordination with all the stakeholders for vulnerability and capacity assessment and for the preparation of LDRMP. This committee also coordinates disaster reduction related activities such as early warning system establishment, disaster response, light search and rescue operation and first-aid related activities. Local Disaster Risk Management Committee (LDRMC) and Community Based Disaster Risk Management Committee (CBDRMC) is provisioned at VDC and community level to act on DRR field. LDRMCs are formed/activated in all 54 DRR focused local governments. Likewise, four CBDRMCs were formed in each 4 highly vulnerable communities of the 54 DRR focused the then VDCs. These committees have been involved in coordination among different stakeholders, vulnerability and capacity assessment, capacity building and raising awareness of the community. 54 LDRMCs and 216 CBDRMCs were formed by the programme.
Table 3.3: No. of CBDRMC/LDRMC formed
Region Total Target Total Achievement
Terai Districts 135 135 Hill/Mountain Districts 135 135 Total 270 270

15
Output Indicator 1.8: Number of CBDRMC and task force members trained CDP has worked in the selected sites to train community members for better management of disasters related hazards particularly focusing on vulnerable population. Communities have demonstrated their capacity to respond to disasters because of such training provided by the programme. This has been demonstrated through the response communities across the flood affected areas demonstrated in August 2017. As part of the training, communities taught on how to identify and forecast the hazards. Community work together to analyse the severity and scale of the hazards. They were also taught about ways to mitigate such hazards. They were also taught about various ways to approaches and methods to monitor the mitigation measures and their effectiveness once they are operationalized in the disaster sites. There are broadly four types of training provided namely (a) Community Based Disaster Management (CBDRM) training (b) early warning system (c) light search and rescue and (d) first aid. Under each of these categories all of the planned targets were completed where in a total of 216 Community Based Disaster Risk Management training were provided to all the LDRMC and CBDRMC members. Likewise, 54 early warning system training to early warning task forces in 54 the then VDCs. Similarly, 54 light search and rescue training were provided to the 54 task force to the then 54 VDCs. Similarly, 54 first aid trainings were successfully provided to the then 54 first aid task force. A total of 4591 individuals (1999 more than the initial target of 2592) were trained for CDBRM, a total of 635 individuals were trained for early warning system, a total of 644 individuals were trained for light search and rescue and 644 individuals were trained for first aid. According to the progress report, this small fraction of off-balance target was due to few instances were participants did not turnout during the training. These trained individuals are now the disaster response team in the communities where CDP was implemented. Not only the capacity of communities to response to disasters have been enhanced, but also has made communities more resilient to disasters.

16
Figure 3.3: Number of training (blue) and individuals trained (orange) by CDP
Source: CDP Annual Report 2018 Output Indicator 1.9: Number of CBDRMP and school contingency plans formulated As a starting step, Participatory Vulnerability and Capacity Assessment (PVCA) was carried out in all the selected vulnerable communities. Based on the data obtained from PVCA, CBDRMP were formulated. CDP aimed at preparing a total 216 CBDRMPs all of were completed. In order to prepare the school during disaster events, simulation drills were conducted in all the schools of the then 54 VDCs along with the preparation of contingency plans. This events assisted communities and school administration to better plan during disaster related events.
Figure 3.4: No. of CBDRMPs and School Contingency Plan formulated
Source: CDP Annual Report 2018 Output Indicator 1.10: Number of awareness-raising events on disaster risks reduction (DRR) Broadly three categories of activities were implemented as part of awareness raising for DRR namely (a) street drama (b) celebration of International day of DRR and (c) conducting workshop on HFA for disaster risk reduction. For this output indicator as well CDP achieved all of its target. A total of 108 street dramas were completed. These drama focused on the
216 54 54 54
4,591
635 644 644
0
500
1000
1500
2000
2500
3000
3500
4000
4500
5000
CBDRM Early Warning Light Search and Rescue First Aid
Training No. of Individuals trained
162
216
0
50
100
150
200
250
School contingency plan Number of CBDRMPs

17
importance and significance of DRR preparedness and methods to respond to disasters. Likewise, a total 216 international day for DRR was celebrated and a total of 18 HFA workshops for DRR were conducted. Table 3.4 provides the disaggregated data.
Table 3.4: No. of awareness-raising events on DRR
Indicator Region/Districts Total Target
Total Achievement
Street drama Terai 54 54 Hill/Mountain 54 54 Total 108 108
Celebration of IDDR Terai 108 108 Hill/Mountain 108 108 Total 216 216
Workshop on HFA for disaster risk reduction
Terai 9 9 Hill/Mountain 9 9 Total 18 18
SECOND OUTPUT : This output is related to strengthening local bodies structure, systems, processes in order to be more inclusive, accountable and transparent. It should be noted here that one of the lead objective of the CDP was to compliment the services provided by Local Governance and Community Development Programme (LGCDP) to poor and marginalized communities. LGCDP as a state led mechanism largely relied on government system (in both administrative and technical fronts) and at times many of its operations faced some delays in services delivery. CDP as a non-state function attempted to fulfill those gaps and adopted the same planning process as that of the government without bypassing the existing government system. In its entire implementation process, the programme had a lead priority to comply with the existing planning process and system and while doing it also improve the entire system by increase the capacity of different stakeholders. CDP measured the progress of the second output through ten different indicators. Before covering this output it should be noted that CDP planning of outcomes and indicators were based on the earlier system of local level planning under the then Local Self Governance Act (LGSA 2055). After the promulgation of the new Constitution in Nepal in 2015, the entire local level governance including planning and implementation system of development interventions also entirely changed which like any other projects also impacted CDP. So some of the initially planned indicators have become irrelevant at the present context. In this context, three out of the ten indicators (Output indicator 2.1, 2,2 and 2.3) related to Ward Citizen Forum and Integrated Programme Formulation Committee (IPFC) are irrelevant at present. The upcoming section will cover indicators beyond those three. Output Indicator 2.1: Number of WCF members trained on their roles and planning process Prior to state restructuring, WCF was one of the main body at the ward and settlement level to undertake planning, implementation and monitoring of local development processes. There was however limitations in their capacity in terms of awareness about the 14-steps planning processes, planning tools and steps among others. CDP worked with the then WCF and provided training and capacity building exercise to properly engage them in local planning processes. SN Indicator Target Achievement 1 WCF members trained on their roles and
planning process 6075 6313

18
A total of 6313 WCF members were trained by CDP. During these trainings three WCF members form each ward and few political representatives were involved. It was reported that before providing such trainings, most of the planning used to take place at the district level. These WCF trainings were vital because after taking such training, WCF members started to undertake local level planning at the ward level itself. This activity was cancelled following the state restructuring. However, CDP continued to work with locally elected bodies to provide them necessary capacity building inputs. Output Indicator 2.2: Number of IPFC members trained on their roles and planning process at VDC level At the then VDCs, there was an Integrated Plan Formulation Committee (IPFC) which prepared detailed planning of the entire VDCs. Plans forwarded by WCF were reviewed and recommended to districts. There was lack of capacity of IPFC members to undertake detailed review and assessment of such demands. SN Indicator Target Achievement 1 IPFC Members trained 4500 5454
CDP took the lead role in its selected sites to provide capacity building inputs to increase the capacity of IPFC members to properly implement the provisions of the 14-steps planning process. IPFCs were taught about the overall tools and techniques of demand collection, prioritization and selection. A total of 5454 IPFC members were trained to undertake better planning at the then VDC level. Similar to the above case, this activity was pulled out after state restructuring. Output Indicator 2.3: Number of IPFC members trained on their roles and planning process at district level Like in the case of wards and VDCs, there was a planning body at the district level. CDP provided training on the 14-steps planning process to the district staff in order to ensure adequate compliance with the existing government planning system. A total of 173 of such trainings were provided to IPFCs. As CDP had to work in the periodic planning cycle of the government and due to changes in the state structure all the planned activities could not be completed. Nonetheless, these trainings were very vital to ensure proper engagement of local leaders in the planning process. This exercise also largely contributed in increasing ownership of stakeholders towards CDP interventions. Due to state restructuring, this activity had to be pulled out hence the achievement is lower than the intended target.
SN Indicator Target Achievement 1 IPFC Members trained at district level 450 173
Output Indicator 2.4: Number of institutions (Health post, Schools, Rural municipality etc) undertaking 'score cards' exercise The Community Score Card is a citizen-driven accountability measure for the assessment, planning, monitoring and evaluation of service delivery. It is one of the widely used tools to gather feedback from those receiving services. This tool is very instrumental in improving communication between communities and service providers. At the planning stage, CDP envisaged using CSC at the then VDCs but due to several procedural issues coupled with the changing governance structure at the local level, CSC’s scope was diverted to schools and sub-health posts. Before the restructuring however, CSC were applied in 18 VDCs during the first cycle. Later, its application was focused at the ward level in the second cycle. As of October 2018, 18 VDC/ward of RM level CSC were conducted.. At total of 23 health post level CSCs, and 10 school level CSCs were conducted This tool was very fundamental in monitoring the performance of service providers.

19
Figure 3.5: Total Community Score Card administered by CDP in the two cycles
Source: CDP Annual Report, 2018 Some of the visible impacts made by the programme upon introducing CSC was the increase in the supply of medical supplies, regularity of clinics, attendance of staff at the health post, improved quality of drinking water and sanitation at the level health post offices. In schools particularly, School Management Committee (SMC) particularly showed more proactive involvement to hold teacher parent meetings. Likewise, SMCs were more engaged with students and teachers to monitor school activities and outcomes. Concept and outcomes of the CSCs were admired by the recently elected government and they expressed interest to apply the concept in their regular service delivery mechanisms. CDP’s interventions as well as the new changes in the local governance structure both have contributed in this progress. Indicator 2.5: Output Indicator 2.5: Support to strengthen newly elected local governments (Profile and plan preparation and capacity development) (Previously 'VDC periodic plans prepared') (WFP) Under this indicator, broadly four types of activities were implemented as below (a) Policy support to formulate local level profile standard framework, capacity building training package and periodic plan preparation sample procedure (b) support to local government for profile and information management system preparation based on the standard framework (c) support to capacity building training to local governments and (c) support to local government for integrated periodic plan in selected local governments. (a) Local Level Profile Standard Framework and Information Management System and
Profile Preparation Support: The World Food Programme (WFP) provided technical support to the Ministry of Federal Affairs and General Administration (MoFAGA) for the preparation of the local level profile Digital Information Management system.. An interdisciplinary task team was formulated which comprises of key Technical ministries and departments namely the then Ministry of Agriculture, Ministry of Education, and Ministry of Health, and Ministry of Women, Children and Social Welfare and Central Bureau of Statistics . This high level task team developed a local level profile framework including (standard template, local level information management system-data collection, analysis, updating and presenting and profile preparation procedure) (Annex WFP 1)which is nationalized and the standard framework is made applicable across the country2. WFP provided technical support to 64 CDP operating LGs in 12 districts
2 The key elements of this format included general background, objective, data collection tools and methods, profile preparation procedure and the overall profile content. Sectoral information of the local government required for local level planning, implementation, monitoring have been included in the content. It should be noted that this profile was finalized based on the piloting done in three districts of Nepal namely Jumla, Bajhang and Sunsari. For this the technical and logistic support was given by WFP.
18
23
10
18
23
10
0
5
10
15
20
25
Ward/Municipality Sub-health post School
First Cycle Second Cycle

20
for the preparation of digital profiles with sectoral information and GIS aided resource maps (Annex WFP 2) The programme also supported IT based application and information management system for collection, analysis, presentation and updating of the information. WFP oriented the local government officials, staff and stakeholders on profile standard framework, local level information management system, data collection, processing, mapping, presenting, validating, updating and validating and prepare document. A total of 4234 individuals have been orientated about the local level profile and information management system, out of which 35 percent of the participants were women.
Figure 3.6: No. of orientation (blue) provided and No. of individuals trained (orange)
Source: CDP Annual Report, 2018
(a) Capacity building training to LGs: (b) CDP focused on building the capacity of local governments on local government
operation and planning management. All the newly elected local government officials have limited knowledge on the standard procedures of governance structures, planning and implementation arrangement, WFP supported MoFAGA for developing standard training packages which include (a) Reference Book on local government
6 8 6 7 8 7 3 5 4 2 6 2
420
560
422
497
578
509
162
275240
122
324
125
0
100
200
300
400
500
600
700
Sunsari Saptari SirahaRautahat
Bara Parsa Achham Bajhang Bajura Kalikot Jumla Mugu
No. of LGs
Some of the outcomes of local level profile and information management system are summarized as follows: • LG officials and staff informed on profile standard content, procedure, tools and
processes. • Database and resource map prepared and sectoral information generated. • The collected information are used in policy formulation, planning, monitoring and
reporting. • Evidence based planning process initiated. • Informed decision & plan formulation. • Service delivery become more functional. • Access of profile information offline and online.
21
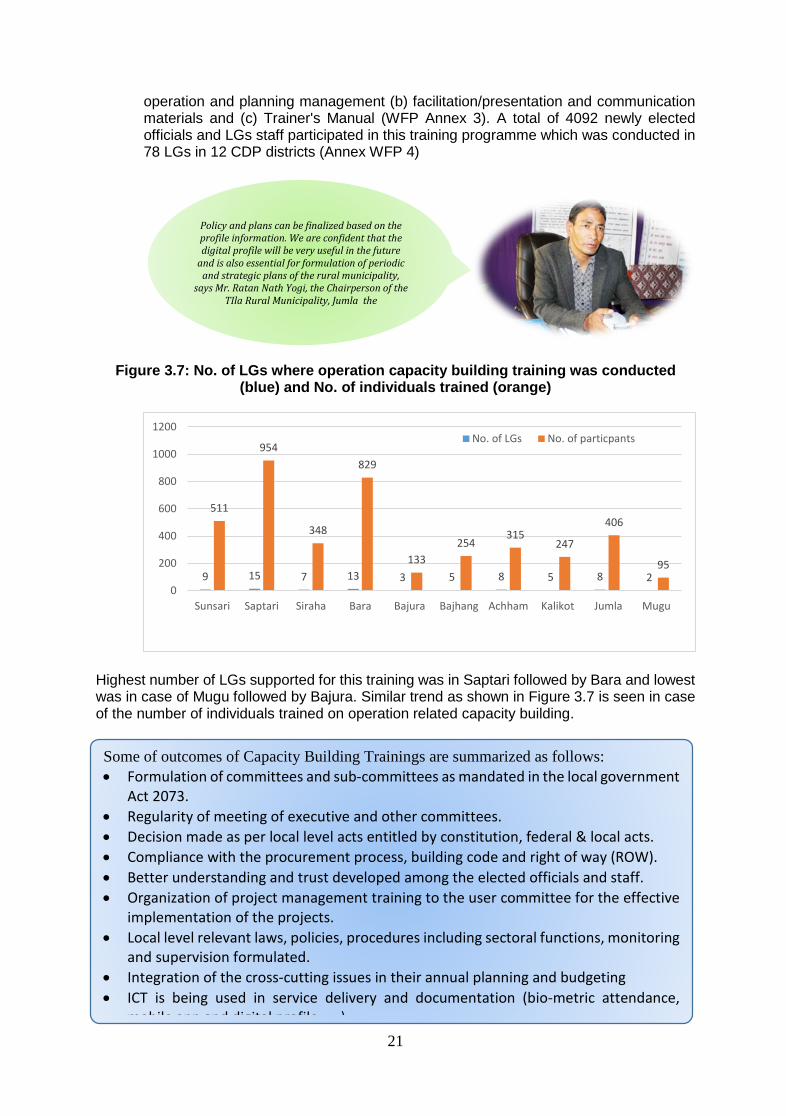
operation and planning management (b) facilitation/presentation and communication materials and (c) Trainer's Manual (WFP Annex 3). A total of 4092 newly elected officials and LGs staff participated in this training programme which was conducted in 78 LGs in 12 CDP districts (Annex WFP 4)
Figure 3.7: No. of LGs where operation capacity building training was conducted (blue) and No. of individuals trained (orange)
Highest number of LGs supported for this training was in Saptari followed by Bara and lowest was in case of Mugu followed by Bajura. Similar trend as shown in Figure 3.7 is seen in case of the number of individuals trained on operation related capacity building.
9 15 7 13 3 5 8 5 8 2
511
954
348
829
133254
315247
406
95
0
200
400
600
800
1000
1200
Sunsari Saptari Siraha Bara Bajura Bajhang Achham Kalikot Jumla Mugu
No. of LGs No. of particpants
Policy and plans can be finalized based on the profile information. We are confident that the digital profile will be very useful in the future
and is also essential for formulation of periodic and strategic plans of the rural municipality,
says Mr. Ratan Nath Yogi, the Chairperson of the TIla Rural Municipality, Jumla the
Some of outcomes of Capacity Building Trainings are summarized as follows: • Formulation of committees and sub-committees as mandated in the local government
Act 2073. • Regularity of meeting of executive and other committees. • Decision made as per local level acts entitled by constitution, federal & local acts. • Compliance with the procurement process, building code and right of way (ROW). • Better understanding and trust developed among the elected officials and staff. • Organization of project management training to the user committee for the effective
implementation of the projects. • Local level relevant laws, policies, procedures including sectoral functions, monitoring
and supervision formulated. • Integration of the cross-cutting issues in their annual planning and budgeting • ICT is being used in service delivery and documentation (bio-metric attendance,
mobile app and digital profile )

22
(c) Integrated and Periodic Plan Preparation support: Following the orientation and
training provided to local governments, CDP took one step ahead to assist these newly created structures to prepare their integrated periodic plans with vision, goal and strategies, priorities and implementation plan. As guided by MoFAGA, WFP developed a periodic plan procedure as a sample and provided a process facilitation support to 12 local governments for piloting the periodic development planning process. A total of 12 LGs were supported for preparation of the integrated periodic development plan with post flood infrastructure reconstruction plan in 6 flood prone CDP districts (Annex: …WFP 5).
It can be noted that CDP has adapted to the newly formed federal governance structure and has worked closely with local governments to enhance their capacity for improving inclusive and local level governance and service delivery. Since the process of capacity development package is led by MoFAGA, federal ministry and local governments the outputs generated in terms of governance improvement would remain sustainable. Documentation and Resource Materials WFP provided support to MoFAGA to prepare local level profile preparation procedure and digital information management system, local government capacity building training materials with facilitator manual and presentation materials. WFP also supported LGs which are remote and inaccessible to document their profile with sectoral and disaggregated information and resource maps. WFP also documented capacity development training process report with pre and post training evaluation and major learnings and reflections. While piloting integrated periodic plan formulation support to LGs, WFP provided technical assistance to LGs for the documentation of periodic planning process. With a view to share the information with development partners, WFP also prepared snapshots of profile as a summary profile information. WFP commissioned a case study survey with LG elected officials and staff, to learn usefulness of the training, information, skills and knowledge and how they have benefitted to deliver local level services. These learning were documented as the voice of people and published the results as case study stories. The following documents were produced and published for wider dissemination
• Training Resource Book • Procedure for Profile Preparation • Profile preparation: 64 Local government (LG) • Training reports: 78 LGs • Periodic Plan: 12 LGs • Snapshot of Profile: 64
Some of the outcomes of local level periodic planning process are summarized as below: • Sample procedure developed and nationalized for wider used by all the local
governments • Situation analysis and visioning process and methodology piloted and
institutionalized • Planning workshop process and methods piloted and formalized • Thematic group discussion/consultations process established • Periodic plan document piloted and standardized
“As the elected women member of ward I learnt that I too have a big role”
says, ward member, Dewangunj, Sunsari

23
• Case study: 12 cases • Periodic Village Development Plan (PVDP) Preparation Guidelines • Participatory and Integrated Planning Training Manual
Indicator 2.6: Trimester progress sharing events conducted Trimester progress sharing events were conducted in the first two years of programme implementation. Out of the total planned 171 sharing events, 36 were completed. Following the change in local government structure, this event was left out by the programme. DDC, which was the main entity associated with this output, was no longer functional at the district level after the changes. This event was left out right after this structural change thus the achievement is short of the planned target. Indicator 2.7: Joint monitoring conducted One of the essential feature of CDP is its mechanism to undertake joint monitoring. Central, district and local level stakeholders jointly conducted this type of monitoring and this was pivotal to understand the key issues, challenges and opportunities associated with the programme. Ministerial and department level staff engaged in discussion with District Coordination Committee (DCC) to undertake future planning in the area. This monitoring established a good coordination mechanism between diverse stakeholders and during the discussion with project officials, it was reported that ownership towards the project was also established due to this task. Members of this monitoring included representatives from rural municipalities/municipalities, development agencies including civil society organization as well as media personnel. All of the targeted 22 joint monitoring at the local government level, 31 at district level and 9 at central level were successfully completed
Figure 3.8: No. of joint monitoring visit conducted under CDP by different level of
stakeholders
Indicator 2.8: Functional DSMCC and NGO Coordination Mechanisms (DSMCC, NGOCC or NGO Desk) Before the restructuring a total of 91 meetings of DSMCC and NGOCC were carried out. However, following the state restructuring mechanisms such as District Social Mobilization Coordination Committee (DSMCC) and NGO coordination mechanism such as DSMCC, NGO
22
31
9
0
5
10
15
20
25
30
35
VDC/LG Level District Level Central Level

24
coordination committee or NGO desk were not functional. Thus the activity was left out after the structural changes. Indicator 2.9: LDRMC and task force member trained A total of 984 LDRMC members were trained which included 767 males and 217 females. However, after restructuring of local structures, district level task force training activity was dropped. Indicator 2.10: Number of LDRMP formulated and approved LDRMP is one of the mechanism to assist communities to respond towards disasters. A total of 20 LDRMPs were formulated which included 14 from Terai districts and 6 from Hills/mountain districts. LDRMCs were provided technical support by the programme. Ownership of this plan has also been taken by the newly formed local governments as all of these LDRMPs have already been endorsed by them. THIRD OUTPUT: This output is related to improving service delivery for poor and excluded people including disaster resilient infrastructures. CDP has worked with local governments to assist them in constructing diverse types of disaster resilient infrastructures such as school building, health post/birthing centers, community buildings, culverts, drinking water schemes, irrigation schemes, market sheds, WASH related structures, micro-hydro, mitigation related works and ward offices. Output Indicator 3.1: Number of CDP funds established in compliance with the local planning process This is the main output of the programme both in terms of resources allocation and demand from the communities. Being the largest component of the programme requiring both software and hardware related interventions, CDP implemented series of preparatory activities in order to prepare the communities to lead and implement this component. The programme formulated management committee and provided series of training prior to starting construction. Likewise, post-construction activities were also implemented. Management Committees: Based on the standard programme implementation guideline, different sets of committees were formed at the local level prior to construction of the infrastructures. A total of 430 management committee were formed. However, for certain types of additional infrastructures such as WASH and mitigation works in already constructed project sites, such committees are not required because the same committees were responsible for the work which totals to 13. Except for these thirteen, management committees have been formed for all of the remaining infrastructures. These 430 management committees have involved 4202 members. There are also sub-committees created for proper work operations and management such as (a) procurement sub-committee (b) finance/account sub-committee (c) inventory sub-committee (d) people mobilization sub-committee (e) monitoring sub-committee (f) public audit sub-committee. All of these bodies formed under the programme work in strong coordination with the RRN field staff and related stakeholders to construct the planned infrastructures. CDP draws its projects from the list obtained from 14-steps planning process of the government. Before starting the infrastructure projects, user and management committees were provided required trainings under various categories. A three-day training was provided in the areas of Gender and Social Inclusion (GESI), Public audit, Right Based Approach (RBA) and DRR. A one-day pre-construction training was provided to the management committee and to the skilled masons for basic construction related orientation and inventory

25
management. Overall project construction cycle including information about the steps, compliance mechanism, M&E procedures were taught to these committee members. Likewise, training on design and construction of infrastructures, maintaining quality of construction inputs and construction, importance of public audit, steps for estimating cost, co-financing by users were taught during these trainings. Most importantly, these committees were taught about the various considerations to be made during implementation of the infrastructure projects. A post-construction orientation training was done upon the successful completion of the project. Training mainly focused on future operations and maintenance of the infrastructures. For drinking water, irrigation and micro-hydro projects, a three-days basic care and maintenance training was provided to the users committee and to the care takers of the infrastructures. They were trained in the areas of operation and maintenance of the schemes including the issues related to tools, pipes, fitting, laying, joining etc. A total of 418 pre-construction training, 418 GESI, PA, RBA, DRR related training, 418 post-construction training and 71 basic care and maintenance related training were provided by the programme, making the total number of training to 1325 as shown in Chart 3.9.
Box 3.1: Some highlights on the disaster resilient basic infrastructure
• CDP supported construction of a total of 443 disaster resilient infrastructures, focusing on poor and excluded communities in deprived locations, identified through local level planning processes.
• 2,923 HHs have access to drinking water, 9,683 HHs have access to sanitation facility and 13,081 HHs have improved their hygiene practices through construction of 35 water supply schemes and sanitation campaign/education.
• 18,953 HHs have benefitted from 57 health facilities which include health post and birthing centers construction and equipment support.
• 715 hectares of land got irrigation facility from 38 irrigation schemes. • 16,038 school children have got safe learning environment through the construction of
148 schools. • Construction of 110 culverts and bridge ensured safe access to 19,860 HHs for marketing
and other purposes. • CDP implemented it's all infrastructure projects through the User's Committee (40%
women) along with following six Sub- Committees in order to ensure community participation and make them responsible to the project:
1. Procurement sub-committee 2. Finance/account sub-committee 3. Inventory sub-committee 4. People mobilization sub-committee 5. Monitoring sub-committee 6. Public audit sub-committee
(Source: CDP Photo Story)

26
Figure 3.9: Total number of training provided to management and users committee
Source: Annual Report, 2018 Upon successful completion of these trainings, members of the users/management committee took the lead role in undertaking the physical infrastructure construction related projects. Infrastructure project: a total of 443 infrastructure projects were built- 224 projects in the Eastern terai region and remaining 219 were built in the Western hills. Items West East Total Total projects 219 224 443 Total number of Beneficiaries 117257 225032 342289
Figure 3.10: No. of infrastructure projects by category
Source: CDP, 2018
418 418 418
71
1,325
0
200
400
600
800
1000
1200
1400
Pre- Construction RBA / GESI / PA / DRR Post- Construction Basic Care &Maintenance
Total
148110
5738 35 20 14 7 6 4 4
443
0
50
100
150
200
250
300
350
400
450
500
27
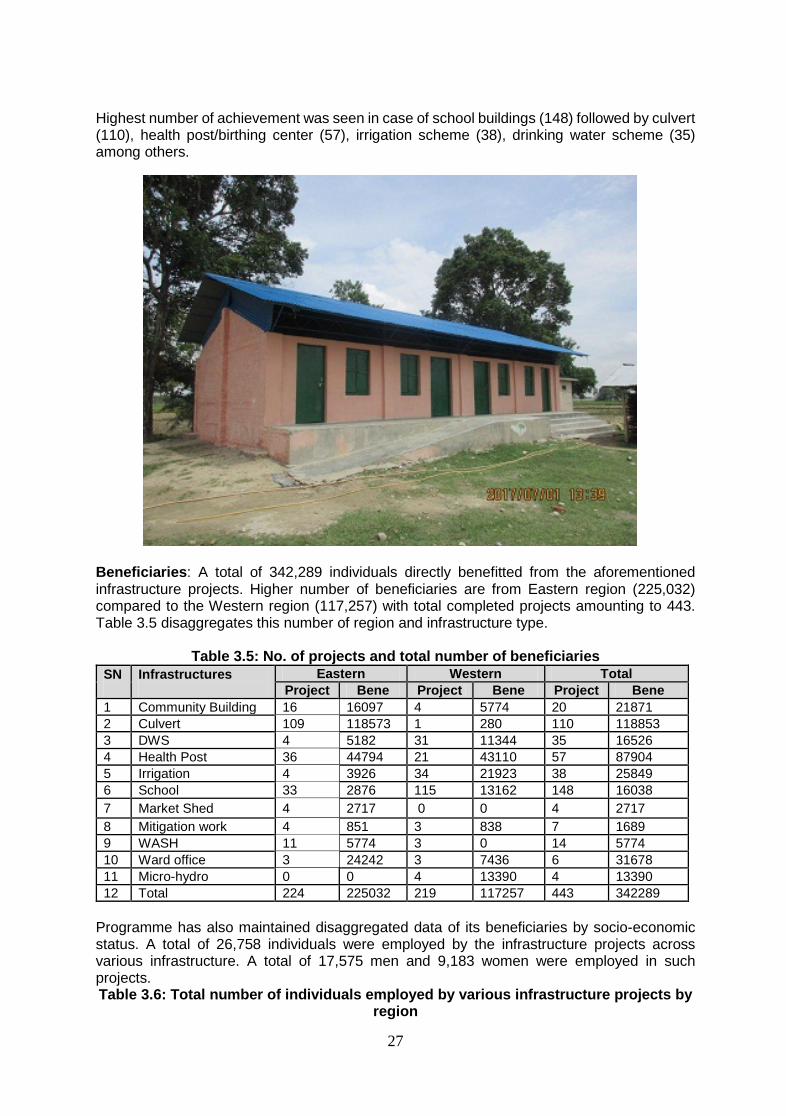
Highest number of achievement was seen in case of school buildings (148) followed by culvert (110), health post/birthing center (57), irrigation scheme (38), drinking water scheme (35) among others.
Beneficiaries: A total of 342,289 individuals directly benefitted from the aforementioned infrastructure projects. Higher number of beneficiaries are from Eastern region (225,032) compared to the Western region (117,257) with total completed projects amounting to 443. Table 3.5 disaggregates this number of region and infrastructure type.
Table 3.5: No. of projects and total number of beneficiaries SN
Infrastructures
Eastern Western Total
Project Bene Project Bene Project Bene 1 Community Building 16 16097 4 5774 20 21871 2 Culvert 109 118573 1 280 110 118853 3 DWS 4 5182 31 11344 35 16526 4 Health Post 36 44794 21 43110 57 87904 5 Irrigation 4 3926 34 21923 38 25849 6 School 33 2876 115 13162 148 16038 7 Market Shed 4 2717 0 0 4 2717 8 Mitigation work 4 851 3 838 7 1689 9 WASH 11 5774 3 0 14 5774 10 Ward office 3 24242 3 7436 6 31678 11 Micro-hydro 0 0 4 13390 4 13390 12 Total 224 225032 219 117257 443 342289
Programme has also maintained disaggregated data of its beneficiaries by socio-economic status. A total of 26,758 individuals were employed by the infrastructure projects across various infrastructure. A total of 17,575 men and 9,183 women were employed in such projects. Table 3.6: Total number of individuals employed by various infrastructure projects by
region

28
Infrastructure Type
Western region Eastern region Total Male Female Total Male Female Total Male Female Total
School Support 6024 4597 10621 1186 16 1202 7210 4613 11823 Health Support 1137 629 1766 1088 28 1116 2225 657 2882 DWS Support 1411 982 2393 43 0 43 1454 982 2436 WASH Support 127 79 206 202 1 203 329 80 409 Irrigation Support 2083 1647 3730 152 9 161 2235 1656 3891
Bridge/culvert 28 13 41 2079 92 2171 2107 105 2212 Community Building 267 207 474 423 10 433 690 217 907
Micro hydro 572 436 1008 572 436 1008 Mitigation Work 71 60 131 53 4 57 124 64 188 Ward Office Building 423 365 788 131 8 139 554 373 927
Market Shed 75 0 75 75 0 75 Total 12143 9015 21158 5432 168 5600 17575 9183 26758
A total of 377,725 days of employment was generated by the programme with highest seen in case school support- both in Eastern and Western region. Higher number of employment days was generated in western region.
Table 3.7: Employment Days created by Infrastructure type by region SN Infrastructure Type West East Total
1 School Support 122907 29299 152206 2 Health Support 25882 31838 57720 3 DWS Support 29299 530 29829 4 WASH Support 744 2751 3495 5 Irrigation Support 50983 3626 54609 6 Bridge/culvert 233 39934 40167 7 Community Building 4368 10934 15302 8 Micro hydro 3684 3684 9 Mitigation Work 1920 736 2656
10 Ward Office Building 12321 11764 16585 11 Market Shed 1472 1472 12 Total 252341 132884 377725
All of the infrastructure created were disaster resilient in nature. Box 3.1 presents some of the key highlights of the disaster resilient basic infrastructures. Output 3.1: Relief and rehabilitation support for disaster affected families (HHs) CDP provided relief support to its Terai and Hilly working districts benefitting 16945 households. Table 3.8 presents the number of households benefitted from the relief activities. In case of Terai, the response was during 2016/17 and 2017/18 cold waves, during the August 2017 flood and during fire related disasters. During 2016/17 cold wave event, relief materials were supported to 3782 households (from Siraha, Dhanusha, Mahottari, Siraha, Sunsari, Sarlahi, Bara and Parsa) whereas in case of 2017/18 cold waves, a total of 4871 households received blankets each (as shown in Figure 3.11). Likewise, in Siraha the programme supported fire victims where relief materials were provided to 32 affected households. In Terai, flood is a major disaster that claims hundreds of lives and millions worth of property. CDP

29
provided relief materials- which included both food and non-food items to the affected 7961 households.
Table 3.8: Households receiving relief materials by CDP
SN Activity No. of supported HHs 1 Relief material support (Blanket distribution) during 2016/17
cold waves in Teari 3782
2 Relief distribution to fire victims 2017 Siraha 32 3 Relief distribution (Blanket) to 2017/18 cold wave victims in
Terai 4871
4 Relief materials support (food and non-food items) to flood victims of August flooding 2017 in Terai
7961
5 Relief material distribution to western hills (Mugu, Dolpa, Humla and Jajarkot)
299
Total 16,945 Figure 3.11: District-wise disaggregation of HHs that received relief support from CDP
during 2017/18 cold wave incidence
Source: CDP Annual Report, 2018 In case of hilly districts, three western hills districts received relief materials for fire. In case of Mugu district CGI sheet and construction of temporary shelters were done for 19 fire victims. Likewise, in case of Dolpa 14 households received blanket support to fire victims. In case of Humla, 16 fire affected households were provided blankets, mattress and WASH kits. Lastly, in case of Jajarkot 250 viral fever impacted households received baby suits and baby blankets. .
Table 3.9: Distribution of relief materials by districts in hilly region
SN District Description 1. Mugu CGI sheet support to fire victim for temporary shelter construction– 19
households 2. Dolpa Blanket support to fire victims -14 households 3. Humla Blanket, Matress and WASH kit support to fire victims- 16 households 4 Jajarkot Baby suits and baby blankets support to viral fever victim children -250
households
616 600630 630
315
630
250
600 600
0
100
200
300
400
500
600
700
Sunsari Saptari Siraha Dhanusa Mahottari Sarlahi Rautahat Bara Parsa
Households

30
Figure 3.12: No. of HHs supported by CDP as part of the relief effort in hills/mountains
Source: CDP Annual Report, 2018
3.3 Additional Activities carried out by CDP CDP has succeeded in terms of its adaptation with changing socio-political contexts in Nepal. Due to state restructuring, it had to leave behind few of its initially planned interventions related to governance support, whereas it had to take up new and demanded interventions at the local level. Mainly four categories of activities were conducted as described below: 3.3.1 Grievance handling mechanism In order to increase the efficiency in service delivery of the recently formed rural municipalities and municipalities, as a piloting, CDP took one step forward to link community issues with the services being provided by these local bodies. CDP realized the need to establish a formal channel at these local governments in order manage the complains and issues raised by communities. Local governments are now taking the leading role for local level planning, service delivery and development and accordingly the expectations from their constituency has highly increased. Given the limited resources, gaps in various legal and institutional setup, unclear roles and responsibilities between actors etc, local governments are taking more time to translate community demands into actions which may fuel dissatisfaction among community members. The objective of this activity was to help local government to assist the local governments to better understand the issues and concerns of the local communities. A total of 36 local governments (2 from each district) were selected for the execution of this activity. Distribution of these sites by the category of the local government is provided in Figure 3.13.
250
14 16 19
0
50
100
150
200
250
300
Jajarkot Dolpa Humla Mugu
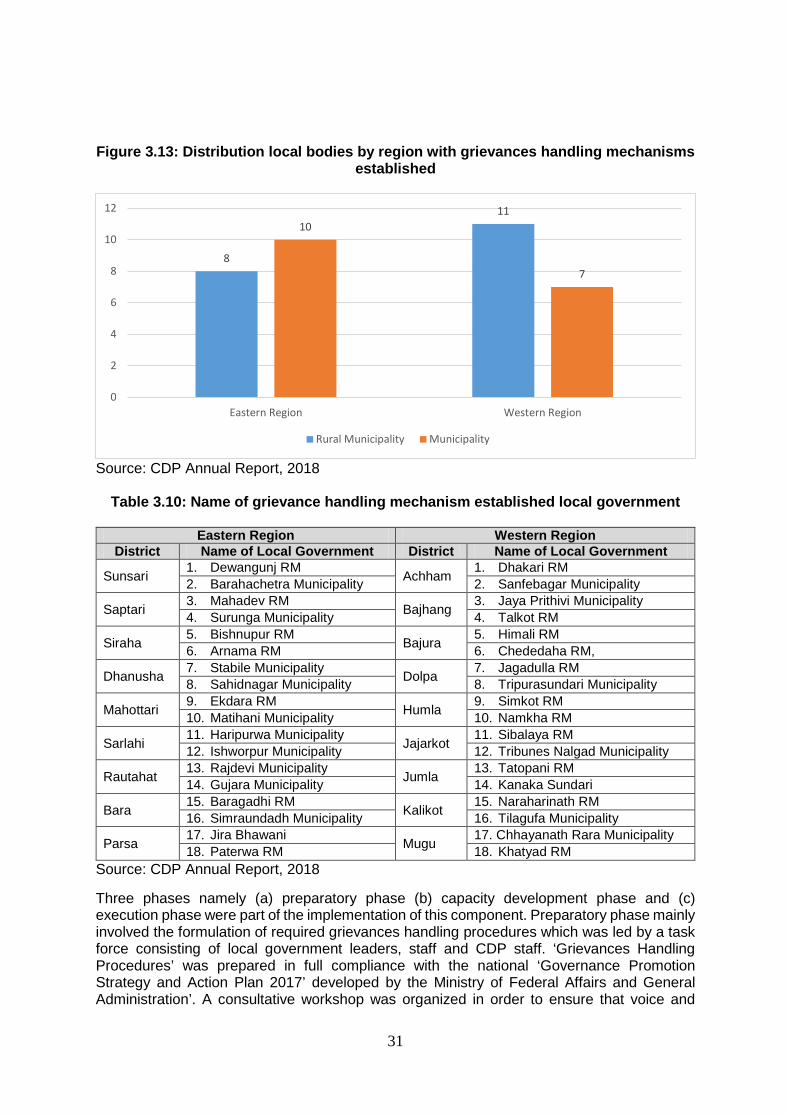
31
Figure 3.13: Distribution local bodies by region with grievances handling mechanisms established
Source: CDP Annual Report, 2018
Table 3.10: Name of grievance handling mechanism established local government
Eastern Region Western Region District Name of Local Government District Name of Local Government
Sunsari 1. Dewangunj RM Achham 1. Dhakari RM 2. Barahachetra Municipality 2. Sanfebagar Municipality
Saptari 3. Mahadev RM Bajhang 3. Jaya Prithivi Municipality 4. Surunga Municipality 4. Talkot RM
Siraha 5. Bishnupur RM Bajura 5. Himali RM 6. Arnama RM 6. Chededaha RM,
Dhanusha 7. Stabile Municipality Dolpa 7. Jagadulla RM 8. Sahidnagar Municipality 8. Tripurasundari Municipality
Mahottari 9. Ekdara RM Humla 9. Simkot RM 10. Matihani Municipality 10. Namkha RM
Sarlahi 11. Haripurwa Municipality Jajarkot 11. Sibalaya RM 12. Ishworpur Municipality 12. Tribunes Nalgad Municipality
Rautahat 13. Rajdevi Municipality Jumla 13. Tatopani RM 14. Gujara Municipality 14. Kanaka Sundari
Bara 15. Baragadhi RM Kalikot 15. Naraharinath RM 16. Simraundadh Municipality 16. Tilagufa Municipality
Parsa 17. Jira Bhawani Mugu 17. Chhayanath Rara Municipality 18. Paterwa RM 18. Khatyad RM
Source: CDP Annual Report, 2018 Three phases namely (a) preparatory phase (b) capacity development phase and (c) execution phase were part of the implementation of this component. Preparatory phase mainly involved the formulation of required grievances handling procedures which was led by a task force consisting of local government leaders, staff and CDP staff. ‘Grievances Handling Procedures’ was prepared in full compliance with the national ‘Governance Promotion Strategy and Action Plan 2017’ developed by the Ministry of Federal Affairs and General Administration’. A consultative workshop was organized in order to ensure that voice and
8
1110
7
0
2
4
6
8
10
12
Eastern Region Western Region
Rural Municipality Municipality

32
opinions of experts from various field were included. Second phase involved increasing the capacity of stakeholders to fully understand and operationalize the development procedure. For this, detailed orientation was provided to the staff and elected officials of the local governments. The overall process to be adopted for collecting the grievances, methods to forward it to higher authorities, ways to address the issues raised were adequately shared. This basically involved undertaking overall orientation about the procedure itself. As part of the third phase, CDP assisted local governments to form their respective grievances handling committee at rural/municipality and ward level. 3.3.2 Program introduction to LGs Following the state restructuring after the election, CDP realized the need to provide an overall orientation about the programme to the newly elected representatives. The main objective of this activity was to forge coordination and collaboration between the programme and these local governments. Introduction about the programme was provided to Mayors, Deputy Mayors, Chairpersons, Vice-chairpersons, ward members and other concerned staff of the local governments. Vital details of the programme such as (a) vision, goals and objectives (b) intended outputs (c) planned activities (d) project designing and implementation mechanism (d) monitoring and evaluation system among others were communicated to the leader. This exercise was key to helping both CDP and local representative understand their forthcoming plans and strategies. It was reported that following this orientation, many cases of resources sharing by local government was done as part of co-financing of interventions. This activity was important in terms of increasing ownership of local leaders towards the programme. Given the very holistic nature of support of the programme ranging from supporting CACs to building infrastructures to collaborating with local leaders, newly elected members showed huge regard and appreciation towards the project. 3.3.3 Formulation of Post-Flood Reconstruction Plan (PFRP) Following the August 2017 flooding in Terai, the programme realized the need to formulate separate post-flood reconstruction Plan- based on which future infrastructures were to be built. In 48 local governments spread over 9 districts, starting from November 2017, this planning process was initiated and were finalized by February 2018. This plan was adopted in all the construction related activities. 3.3.4 Public Audit of local government’s interventions One of the core objectives of the programme was to improve good governance through accountable and transparent approach and methods. Normally, CDP undertakes 3-4 public audits per project as part of its regular activity. CDP identified the need to increase the capacity of local governments to undertake public audit. In order to do so, the CDP provided technical assistance to the local government to do public audit of the regular programme implemented by these local governments. A total of 73 public audits were conducted cumulatively by the rural municipalities and municipalities under the technical support from CDP staff. These audits had good representation of community members, recently elected local leaders, representatives of other political parties, government officials, school teachers, leader farmers among others. A total of 2,555 individuals took part on these public audits. During the field visit it was reported that these audits were helpful for leaders- particularly for elected representative new to the field of development, to be familiar with the various technical and financial elements of the projects. It was an appreciated activity and local leaders also reported that it helped them to undertake similar activities in their respective wards in upcoming years.
3.4 Publications and visibility of CDP CDP has generated number of publications which can be referenced for future applications and lessons. While all of these publications were done jointly through mutual coordination and sharing, depending upon the sector assigned to each collaborating partners they took lead in

33
their respective publications. Different categories of documents include Brochures, IEC materials on DRR, Video documentary, Deep dive studies, Rapid assessments, Success story, Process documentation, Training Reference Book, Local Level profile preparation, and Photo Story among others. Refer to Annex 1 for the list of publication made by the programme.

34
CHAPTER 4: ACHIEVEMENT AND LESSONS FROM CDP
4.1 Background As part of this report preparation, the consultant visited several districts in order to get a firsthand information about the achievements and lessons drawn by the programme. Likewise, the consultant reviewed several reports prepared by RRN, WFP as well as Oxford Policy Management (OPM) in order to draw key qualitative inferences about the programme. It should be noted here that given the scope of the work provided to the consultant, this is not an evaluation exercise but rather a documentation work of some of the achievements and lessons drawn by the programme. Achievements and lessons have been drawn based on the core activities implemented by CDP which mainly include:
• Citizen mobilisation for effective planning, resource allocation and decision-making process through CAC, WCF, IPFC and DSMCC for participation, transparency and accountability;
• Support DDCs/VDCs/Local government in the local governance strengthening: • Entrepreneurship development and economic empowerment of disadvantaged
groups; • Coherence amongst the State and non-State actors in supporting local bodies,
including NGO Desk; • Support Rural Municipalities and Municipalities for periodic plan; • Disaster resilient community infrastructure; and • Disaster Risk Reduction (DRR) and climate change preparedness.
As a complimentary project to the then Local Governance and Community Development Programme (LGCDP), CDP acted as a non-state function to provide services to marginalized communities that are/were not on reach by the government- due to remoteness, government resources and capacity among others. CDP through this holistic approach intervened in some of the remote area of the district with an aim to achieve its targets and objectives.
4.2 CAC as a platform to strengthen and involve the poorest of the poor Despite differences in the level of achievements made by CACs across districts and communities, it can be inferred that CACs have been strengthened and institutionalized by CDP through both capacity building/empowerment related support and economic/livelihood related support. CDP applied Underlying Cause of Poverty Assessment (UCPA) tool to identify the poorest in the community by involving local communities themselves. Members of the CAC- which includes women- clearly attributed their progress to CDP. They reported that due to REFLECT session, CAC members have garnered an increased sense of awareness and economic empowerment. Due to increased awareness, despite the pressure to undertake their traditional family functions, women have been involved in household decision making and economic activities. The fact that husbands have gradually shown interest to involve their spouses to such classes is also a reflection that household dynamics are also positively impacted by the programme. Deep Dive study done by OPM also reports that despite pressure from mother in laws to involve women in traditional duties, many women have balanced their roles and have engaged in economic activities of the households. Despite these positive markers, there are many challenges. As reported by OPM, despite the fact that there are ample opportunities for CAC groups post-REFLECT to build on their existing

35
learning and empowerment, this would require further support and continuation of support from REFLECT sessions to ensure its sustainability. The report also mentions that the vocational training did not always guarantee employment for the CAC members and they found it difficult commit time to the training. Likewise, due to differences in the capacity of women and depending upon how they open up in a society (mostly during group meetings), the involvement of members in CAC vary. During the field visit carried out in Saptari, only few members of the CAC were actively participating in decision making roles and majority were just listeners and followers. It will take time for all members to reach to a minimum level of participation in group meetings but if CACs hold meeting regularly and with the spirit to include all, wider participation would be possible. This remains a challenges particularly after the programme phases out when the local resource persons have less incentive to undertake follow up of these CACs.
4.3 Economic empowerment through LIP CDP’s central objective was to strength communities through economic empowerment of the poorest and excluded in the community. Following the REFLECT sessions, CAC members were engaged in identifying various livelihood activities that suite their capacity and requirement. A seed grant of NRs. 100,000.00 was provided to each CAC the use of which was decided mutually by all the CAC members. Depending upon the gravity of the need, capacity, willingness of the members etc this fund was divided among 5-7 members in the CAC. CAC members have used it for various income generating purposes. Livelihood Improvement Programme (LIP) has been pivotal to engage women in various livelihood strategies and the extra income made by women through LIP support in poorest households of communities (which are primarily men controlled)- do reflect positive changes in the society. Likewise, savings done by CAC members have provided some security to its members during event of emergency and for other essential household requirements. This also include the tea money they collect periodically. There is no single thumb rule regarding the number of CAC members to be given LIP money. CACs have also maintained flexibility about the amount of loan to be given to its members wherein in some place five members have taken Rs. 20,000.00 equally whereas in some places depending upon CAC decision the money has been distributed with 6-7 members. Among the CACs that were visited, all of them had clear cut plan about the future loan rotation to its waiting members. The chances of conflict to get access to this loan is minimum because decisions on who receives the fund is mutually agreed upon by each of the CAC members and they provide loans to the neediest member within the CAC. CDP has also ensured sustainability measures for LIP. Grants were distributed in the presence of ward chair through a tripartite agreement among CAC, CDP and local government. There is a monitoring committee which is comprised of the CAC members that are waiting for the fund. This system also ensured that the money is properly circulated and monitored. Despite plenty of good examples associated with LIP, there are several challenges in order to attain the intended objective of the grant. Technical backstopping for agriculture related interventions such as vegetable farming, goat raising, pig rearing etc was very limited. Particularly in the present context where the roles of the then agriculture and livestock technician (JT/JTAs) working in these sectors are not very clear. Especially for livestock
Ms. Jarina Khatun, from Bairawa, Kanchanpur Municipality-1, Saptari took a loan of Rs. 14,000.00 from her CAC via the LIP by adding Rs. 6,000.00 herself to buy three goats from Beltar, Udayapur. She is planning to sale a goat at Rs. 15,000 for the upcoming Dashain festival. She says that this intervention has helped her gain independence. From the money, she plans to pay back the loan taken from CAC and with the remaining goats, she plans to make more income. (Source: Field Visit, 2018)

36
related LIPs, due to lack of timely service delivery during diseases and veterinary medical emergencies, getting the intended outputs was challenging. Likewise, due to limited size of grant, members had limited option to choose for adoption which has resulted into crowding in demands for goat rearing and mushroom farming. Not having adequate market for the products supported under LIP has also been reported as a problem at the community level. Deep dive study done by OPM has presented a case from Kalikot wherein CAC members who were supported for potato did not find adequate market after harvesting. Several delays under CDP in implementing LIP also resulted into less time for the programme to monitor the changes. Geographical spread of CACs and limited number of district level staff for monitoring was a challenges for understanding the true impacts of LIP. Nonetheless it should be noted that proactive groups have properly utilized and benefitted from LIPs.
4.4 Increased participation of community members during social campaigns Community members particularly women have demonstrated increased sense of participation during social campaign activities. Particularly in the Terai region where social taboos and traditional beliefs are very much deep rooted, CAC members have been very vocal on core issues such as women rights, health and hygiene, adolescent health, use of sanitary pads among others. In the past these topics were barely discussed in public gathering but within CDP supported CACs that were consulted, women participated in informed discussion in relation to women and hygiene related issues. Likewise, community members were shy to speak on issues such as HIV/AID but now it was clearly seen that women do not hesitate to speak about the causes and preventive measure against the disease.
4.5 Holistic package and coordination under DRR component CDP involved vast range of stakeholders at various levels to increase their capacity to respond to disasters. One of the flagship activity of the programme was its provision to form LDRMC and CBDRMC- both key to aggregating local communities and institutions to work collectively to respond to disaster. One core feature of the intervention was the focus it provided to collaborating with existing district level mechanisms such as DDRC and with other experienced agencies such as Red Cross. Through these structures communities have been trained on tools and techniques to forecast, analyze and respond to disasters. CDP supported the entire DRR cycle from preparatory to response phases. Community members were trained on early warning system, light search and rescue operations and first aid facilities. Required equipment and materials to respond to disaster were also provided to communities. These support was complemented through initiation of awareness raising activities related to DRR via street dramas. During the flooding of 2018, it was reported during the field visit that communities were proactive and applied their knowledge and skills for responding to the disaster. In certain communities, there was a need to customize the types of support depending upon the types of demand and situation of disaster. During the field visit in Saptari, it was seen that the communities ranked ‘human wildlife conflict’ mainly due to elephants as their first hazard.
Mr. Maya Kalwar of Saptari said that earlier in the family, she was very shy to speak about menstrual cycle and related health difficulties with her mother in law. After participating in the REFELECT session she said she learnt a lot and also brought home the knowledge. Now her family members openly discuss about such issues in front of her own daughter.

37
The site also faces problems associated with flooding for which all the planned equipment and materials have been provided by CDP. However, no support was seen to abate the impacts of wild elephants. Thus in similar cases, depending upon the intensity and severity problems, certain adjustments seemed apparent.
4.6 Adaptive capacity building work for enhancing governance While CDP was conceptualized and during the time when the inception phase was designed, there were no certainty about the changes in the governance and state restructuring mechanism. During the time that the project was implemented, many institutional changes took place in the country which provided large and many times sole authority to local government during decision making. The earlier planning and development system became obsolete and country adopted to federal, provincial and local government structure. CDP however in its design was based on the 14 steps planning system under the then LSGA. CDP however as one of the largest projects working in good governance, completely adapted to the new system and revised its programme activities. At a time when the entire nation had limited knowledge and capacity about the new restructuring, CDP was one of the programme already taking the lead role in increasing capacity of newly elected local leaders. Under the supervision and advise from Ministry of Federal Affairs and General Administration, several guidelines, working procedure were adopted. From the 14 steps planning process to the newly adopted steps planning process, CDP complied with the constitutional provisions. Not only did the project adapt to the changes but also took the lead role in providing required orientation and training to the elected leaders and their officials to better understand and implement the legal and institutional provision of local government as directed by the constitution. Another flagship activity done by the programme was to orient the newly elected leaders in its working sites about the entire programme- from planning, implementation to monitoring stages. This was duly regarded by many parties as the local leaders not only understood about the programme but also could find avenues for synergism with their regular
38
interventions- which in turn assisted to a larger degree to avoiding project duplication in the same area.
4.7 A robust monitoring mechanism in place Joint monitoring conducted by CDP is one of its flagship approach. From center to grass root level stakeholders are engaged to monitor the work progress and to get updated information about the programme. This activity assisted in ensuring that activities were properly executed. And by periodically involving diverse stakeholders, this exercise created an increased sense of ownership towards the project- especially among government officials. At the local level, joint monitoring involved parties such as media and local leaders- which was key to communicating the pros and cons of interventions in a particular locality. This exercise was a check and balance even to the RRN which got periodic feedback from such monitoring exercise. Apart from joint monitoring, there was community monitoring where user committee, beneficiaries, local leaders undertook periodic observation of the projects. At the operation level community monitoring was very effective in checking the operation, maintenance and continuation of the projects. Likewise, there was a project level monitoring where RRN staff from center to district engage in undertaking monitoring of the interventions. This 3-tier monitoring was one of the successful models of CDP. There was also a third party monitoring and verification by DAI- which was involved in the key steps of infrastructure construction and operations. CDP has maintained a Management Information System (MIS) for effective planning, implementation and monitoring. MIS has maintained a comprehensive database of all the activities and outputs.

39
CHAPTER 5: RECOMMENDATION
Based on the review of the documents, discussion with programme staff at RRN and observations from the short field visits, review of other study reports generated in the programme, some recommendations have been drawn as part of this comprehensive review as indicated below:
• Local government should use the base created by CDP to launch their respective programmes- particularly by working very closely with the already formed CACs. Social mobilization approach, action and achievements needs to be up scaled by local government
• In terms of awareness creation and strengthening, modalities like REFLECT sessions
should be introduced in many disadvantaged communities particularly to their women members. Government should also be proactive in policy adjustments and prioritization in such a manner that women can fully participate in decision making roles in the communities
• Development partners (both government and non-government) should understand the
capacities and limitations at the community level to draw services from service providers (both public and private) and accordingly devise means and methods to properly disseminate information in such a manner that communities can understand and draw services
• In order to ensure good governance, mechanisms such as public audit, information board display, joint monitoring visits etc- which were a core modality of CDP during infrastructure projects- needs to be mandated and up-scaled by the local government for other relevant interventions
• Provision of users committees and sub-committees in all infrastructure development projects played vital role to delegate roles and responsibilities which not only ensured proper work delegation to respective thematic sub-committees but also ensured that tasks are accountable, participatory and transparent
• Local level DRR mechanisms such as LDRMC, CBDRMC and task forces formed and
trained by CDP needs to be replicated to other disaster-prone areas and should be up-scaled
• The periodic plans prepared under CDP facilitation needs to be further expanded to other local government and they should take the lead role in formulating profile and in updating the information system of their respective demographics and undertake informed decision making using the information of such profiles
• LDRMP and CBDRMP formulated by CDP needs to be incorporated into the overall planning process of the local government and such good practices need to be scaled up in other areas
• Local government should give continuity towards processes such as ‘joint monitoring’
in their regular projects and programmes. Lessons from CDP could be vital to ensure sustainability of interventions
• Local government and other development partners should heavily engage in social
mobilization related activities as the information base, capacity, awareness at the local

40
level is low. This situation is particularly true now as new governance system is in place and community members don’t know how to access services
• For individuals that are trained by such programmes, local government should take a
lead to certify their skills (eg via institutions such as CTEVT) so that in future they get credibility and trust to engage in similar enterprise and provide services to the communities. The list of individuals submitted by CDP to the local government needs to be referred to identify and certify the skilled human resources in the community
• Promotion of livelihood related activities require proper understanding of the various
environments required to sustain those activities. Market assessments are a must prior to introducing any enterprise related activities in rural setup. Seed grant programmes such as LIP for CAC members could be vital if proper planning are done and feasible livelihood schemes are launched.
• Seed grants to communities largely contribute to economic engagements of its
members but macro-level impacts out of such inputs should be planned by linking groups with enterprise related financial institutions and local government; for example, linking agriculture groups with vegetable cooperatives etc.
• Local government should find a means to effectively communicate information to
community members. It was seen that local communities relied and trusted more on informal information network whereas government mechanism used formal networks. Trends and capacities at local level should be understood and accordingly information dissemination mechanisms should be established
• Elected local government officials, government staff deputed at local level and other pertinent stakeholders should be capacitated on the processes and mechanisms of service delivery in the changed context of federal structure. Training should be given to all the newly formed local governments and periodic refreshers training should also be continued.

41
REFERENCES
Community Development Programme. (2015). CDP Implementation Guidelines. Community Development Programme. (2015). CDP Inception Report. Community Development Programme. (2015). CDP Programme Document. Community Development Programme. (2015). Situational Analysis of community Development Program. Community Development Programme. (2016). Baseline Research Report. Community Development Programme. (2017). Rapid Assessment Report on Infrastructure Development. Community Development Programme. (2017). Rapid Assessment Report on CACs and livelihoods. Community Development Programme. (2017). A Rapid Assessment of Candidacy of CAC Members and LRPs in Local Level Election 2017. Community Development Programme. (2017). Annual Report: For the second year of implementation. Community Development Programme. (2018). Deep Dive Assessment- Poverty Study. Community Development Programme. (2018). Deep Dive Assessment- Resilience Study. Community Development Programme. (2018). Deep Dive Assessment- Transparency and accountability study. Community Development Programme. (2018). Annual Report: For the Third year of implementation. Community Development Programme. (2018). Social mobilization for Strengthening Local Governance. Community Development Programme. (2017). Photo Story of Community Development Programme. Community Development Programme. (2018). CDP Change Story. Community Development Programme. (2017). CDP Video Documentary Community Development Programme. (2017). Regional Fact Sheets on Community Score Cards Community Development Programme. (2018). CDP Endline Report.

42
Annex 1: List of publication under CDP
Type of Document SN Title
Documents
Publi-shed
Unpub-lished
Annual Reports
1 CDP Third Annual Year Report (July 2017 – June 2018)
2 CDP Second Annual Report (July 2016 – June 2017)
3 CDP First Annual Report (July 2015- June 2016)
Comprehensive Report
1 CDP Programme Completion Comprehensive Report
Booklets
1 सामुदा�यक �वकास कायर्क्रम )�स�ड�प :(
प�रवतर्नका कथाहरू (Community Development Programme: Change Stories)
2 Social Mobilisation for Strengthening Local Governance: Implementation process of Community Development Programme (CDP)
3 CDP Photo Story
CDP Brochures/Fliers
1 CDP Brochure (Nepali)
2 CDP Brochure (English)
3 स्थानीय तहमा गुनासो सम्बोधन तथा व्यवस्थापन
CDP District Brochures (18 separate CDP District Brochures)
1
CDP District Brochures
CDP Bulletins
1 CDP Bulletin (No. 2, July 2018) Nepali
2 CDP Bulletin (No. 1, December 2016) Nepali
3 CDP Bulletin (No. 1, December 2016) English
IEC Materials on DRR Posters in Nepali language on following subjects: 1. Earthquake 2. Epidemics
1 • भूकम्पीय जो�खम न्यू�नकरणका ला�ग सामुदा�यक पूवर्तयार�
2 • महामार�बाट हुने ��त रोकथामका उपायहरू
3 • आगलागी रोकथामका उपायहरू

43
Type of Document SN Title
Documents
Publi-shed
Unpub-lished
3. Fire 4. Floods
4 • बाढ� –प�हरोको जो�खम न्यू�नकरणका ला�ग गनुर्पन� सामुदा�यक �क्रयाकलापहरू
Posters in Maithili language on following subjects: 1. Earthquake 2. Epidemics 3. Fire 4. Floods
1 • भुकम्पसँ होबबला खतरासँ प�हने गाउँ घरमे करबाला कामकाज
2 • महामार� )हैजा (सा होबबाला ��तके रोकबाक उपाय सब
3 • आइगलागस रोकके उपायसब
4 • बाइर पाइनधसनासे जो�खमकम करके ला�ग करवाला सामुदा�यककामसब
Posters in Bhojpuri language on following subjects: 1. Earthquake 2. Epidemics 3. Fire 4. Floods
1 • भुकम्प से होखेवला खतरा कम करेला हमरा कथी कथी करेगे पर� ?
2 • माहामार� से होखेवाला खतराके रोकथामके उपाय सब ।
3 • आगलागी रोकेवाला तर�का
4 • बाढ�से होखेवला खतरा कम करे खातीर सामुखायक �क्रयाकलाप सब इबा
Video Documentary
1 Pathway to Community Development
Publications on Capacity Building of Local Government
1 Training Reference Book, 2018
2 Local Level Profile Preparation, 2018
3 Capacity strengthening case studies (Nepali and English Version): 12 Cases
4 Snapshot of Profile: 64
Documents on Capacity Building of Local Government
1 Local Level Profile Information Management System Operational Manual, 2018
2 Local Level Profile Documents: 64 Local Government (LGs)
3 Local Government Periodic Plan Document: 12 Local Governments
4 Training Completion Reports : 78 LGs

44
Type of Document SN Title
Documents
Publi-shed
Unpub-lished
5 Periodic Village Development Plan (PVDP) Preparation Guidelines, 2016
6 Participatory and Local Level Planning Facilitation Manual, 2017
7 Village and Distirct Level Integrated Planning Tools 2017
8 Periodic Village Development Plan Preparation Brochure
Political & Economic Analysis Report
1 Political Economy of Development in the Central and Eastern Terai and Mid and Far-Western Mountain/Hill Regions of Nepal
Deep Dive Assessments
1 Resilience Study Report
2 Transparency and Accountability Study Report
3 Poverty Study Report
Rapid Assessment Reports
1 Report of the Second Snapshot Rapid Assessment – Citizen Awareness Centre and Livelihood Projects
2 Report of the First Snapshot Rapid Assessment – Infrastructure Development
3 Vocational Training (VT) Grantee Profile: Outlining the Trajectory Post CDP Training
4 Regional Fact Sheet on Community Score Cards under CDP: Analysis of Results and Process
Baseline Report 1 Community Development Programme:
Baseline Report
End line Report 1 Community Development Programme:
Endline Report