comprehensive integrated master plan for chennai …comprehensive integrated master plan for chennai...
TRANSCRIPT

Comprehensive Integrated Master
Plan for Chennai Bengaluru
Industrial Corridor Final Report
Regional Comprehensive Plan
October 2015
Japan International Cooperation Agency
PricewaterhouseCoopers Co., Ltd.
Nippon Koei Co., Ltd.
4R
JR
15-050

Final Report – Comprehensive Regional PlanPwC/ Nippon Koei 1
Table of Contents
1 Introduction ...........................................................................................................................................................15
1.1 Background and Objective...........................................................................................................................15
1.2 Counterparts Involved .................................................................................................................................15
1.3 Scope of Work...............................................................................................................................................16
2 Regional Profiling of the Corridor.........................................................................................................................18
2.1 Socio Economic profiling of the corridor....................................................................................................18
2.2 GDP growth ................................................................................................................................................. 27
3 Investment Environment of CBIC........................................................................................................................ 33
3.1 Quantitative Assessment–Comparative Analysis with Other Countries/Regions .................................. 33
3.2 Qualitative Assessment - Investor’s View ...................................................................................................51
3.3 Summary of Key Findings .......................................................................................................................... 60
3.4 Key Issues on Overview of Investment Environment ............................................................................... 62
4 Industry Scenario .................................................................................................................................................. 66
4.1 India as an industrial hub for the world .................................................................................................... 66
4.2 India’s manufacturing sector – the accelerated growth plan ....................................................................71
4.3 Corridor’s vision, strategy and framework .................................................................................................75
4.4 Analysis of CBIC-Key growth drivers......................................................................................................... 83
4.5 CBIC – Key interventions ..........................................................................................................................156
4.6 Competitiveness of the corridor – key interventions.............................................................................. 160
5 Node Selection......................................................................................................................................................162
5.1 Introduction ...............................................................................................................................................162
5.2 Identification of broad locations for zones ...............................................................................................162
5.3 Identification of potential area at a sub-district level ..............................................................................167
5.4 Shortlist of Industrial Nodes .....................................................................................................................176
5.5 Regional Structural Plan............................................................................................................................183
5.6 Priority of Shortlisted Industrial Nodes ...................................................................................................185
6 Strategies for Infrastructure Development.........................................................................................................195
6.1 Transport Infrastructure............................................................................................................................196
6.2 Ports ............................................................................................................................................................199
6.3 Road ........................................................................................................................................................... 249
6.4 Railways..................................................................................................................................................... 295
6.5 Urban/Public Transport ........................................................................................................................... 332

Final Report – Comprehensive Regional PlanPwC/ Nippon Koei 2
6.6 Airports ...................................................................................................................................................... 366
6.7 Logistics .....................................................................................................................................................380
6.8 Power & Renewable Energy...................................................................................................................... 393
6.9 Town Development and Industrial Development ................................................................................... 449
6.10 Water ................................................................................................................................................... 463
6.11 Solid Waste Management .........................................................................................................................491
7 Strategic Environmental Assessment .................................................................................................................518
7.1 Overview of Environmental Conditions and Issues .................................................................................518
7.2 Objectives and Methodology of "SEA" ..................................................................................................... 520
7.3 Review of Process of Structure Plan Formulation................................................................................... 522
7.4 Environmental Scoping and Evaluation .................................................................................................. 523
7.5 Alternatives for the Structure Plan........................................................................................................... 528
7.6 Environmental Mitigation Plan................................................................................................................ 534
7.7 Environmental Monitoring Plan .............................................................................................................. 534
7.8 Stakeholders Meeting (SHM)................................................................................................................... 535
7.9 Conclusion and Recommendation ........................................................................................................... 538
7.10 Necessary Actions for Part B.................................................................................................................... 539
8 Comprehensive Regional Plan.............................................................................................................................541
8.1 CBIC’s Regional Potentials and Challenges..............................................................................................541
8.2 Vision and Target .......................................................................................................................................541
8.3 Development Plan ..................................................................................................................................... 552
8.4 Phasing Plan .............................................................................................................................................. 582
8.5 Policy Recommendation on Improvement of Soft Issues....................................................................... 587
9 Conclusion and Way forward ............................................................................................................................. 594
Annexes ..................................................................................................................................................................... 596

Final Report – Comprehensive Regional PlanPwC/ Nippon Koei 3
List of tablesTable 1.2.1: Related stakeholders and supporting agencies ......................................................................................16
Table 1.3.1: Scope of work of the study.......................................................................................................................16
Table 1.3.2: Contents and timelines of the report......................................................................................................17
Table 2.1.1: Districts under the corridor influence ....................................................................................................19
Table 2.1.2: Area of the CBIC region ..........................................................................................................................19
Table 2.2.1: Total Population-All CBIC ..................................................................................................................... 28
Table 3.1.1: Global Competitiveness Index Ranking in Detail (Rank out of 148 countries) .................................. 39
Table 3.1.2: Direct Taxes ............................................................................................................................................ 46
Table 3.1.3: Indirect Taxes ......................................................................................................................................... 46
Table 3.3.1: SWOT Analysis ........................................................................................................................................61
Table 3.4.1: Period of Proceduresin CBIC ................................................................................................................. 63
Table 3.4.2: Key Bottlenecks in Administrative Issue in CBIC................................................................................ 63
Table 3.4.3: Current and Recommended Tax Rates for CBIC ................................................................................. 65
Table 4.3.1: Focus sectors across corridor’s objectives ............................................................................................ 76
Table 4.3.2: Business regulations in India - Ranking of Indian cities..................................................................... 82
Table 4.4.1: Current Strengths for CEO products sector in the Corridor................................................................ 86
Table 4.4.2: Shortcomings and key interventions required for increasing investments in the corridor - CEO
sector – economic enhancers..................................................................................................................................... 87
Table 4.4.3: Shortcomings and key interventions required for increasing investments in the corridor - CEO
sector – Administrative enhancers............................................................................................................................88
Table 4.4.4: Shortcomings and key interventions required for increasing investments in the corridor - CEO
sector – Value enhancers ........................................................................................................................................... 89
Table 4.4.5: Competitiveness analysis for CEO sector ............................................................................................. 90
Table 4.4.6: Existing status, challenges and interventions required to increase investment in corridor –
Metallurgy sector ........................................................................................................................................................ 93
Table 4.4.7: Existing status, challenges and interventions required to increase investment in corridor – Medical
equipment sector ........................................................................................................................................................ 99
Table 4.4.8: Existing asset profile, challenges and interventions required to increase investment in corridor –
Textiles and Apparels sector .................................................................................................................................... 103
Table 4.4.9: Current shortcomings and key interventions necessary in the corridor – Textiles and Apparels
sector ......................................................................................................................................................................... 104
Table 4.4.10: Competitiveness analysis of Textiles and Apparels sector ...............................................................105
Table 4.4.11: Percentage of food processed in India vis-a-vis in developed countries - 2010 ..............................107
Table 4.4.12: Sub-sector wise projected growth rates – Food processing sector ................................................. 108
Table 4.4.13: Existing asset profile, key success factors and sub-segments district wise for Food processing
sector in the corridor ................................................................................................................................................ 109
Table 4.4.14: Current shortcomings and key interventions necessary in the corridor – Food processing sector110
Table 4.4.15: Competitiveness analysis for Food processing sector ....................................................................... 112
Table 4.4.16: Existing status, challenges and interventions required to increase investment in corridor –
Pharmaceuticals sector ............................................................................................................................................. 117
Table 4.4.17: Existing status, challenges and interventions required to increase investment in corridor –
Chemical and petrochemical sector..........................................................................................................................124
Table 4.4.18 Existing status, challenges and interventions required to increase investment in corridor –
Machinery and Electrical Machinery .......................................................................................................................133
Table 4.4.19: Current status, shortcomings and recommendations – Machinery and Electrical Machinery......134
Table 4.4.20: Current shortcomings and key interventions at administrative level – Machinery and Electrical
Machinery ..................................................................................................................................................................137
Table 4.4.21: Current shortcomings & key interventions – Value enhancers – Machinery & Electrical Machinery
....................................................................................................................................................................................138

Final Report – Comprehensive Regional PlanPwC/ Nippon Koei 4
Table 4.4.22: Top 10 countries of Service industry index ...................................................................................... 140
Table 4.4.23: Existing status, challenges and interventions required to increase investment in corridor – IT and
Financial services.......................................................................................................................................................143
Table 4.4.24: Competitiveness analysis of Automobile sector................................................................................154
Table 4.5.1: Key Interventions ..................................................................................................................................157
Table 5.2.1: Potential zones proposed by the State governments...........................................................................162
Table 5.2.2: List of Potential Sub Districts...............................................................................................................164
Table 5.2.3: Summary of key sectors by zone ..........................................................................................................166
Table 5.3.1: Assessment Criteria 1 – Linear Density of Trunk Road Network.......................................................167
Table 5.3.2: Assessment Criteria 2 – Distribution of Protected/Restriction Area ............................................... 168
Table 5.3.3: Assessment Criteria 3 – Government Land Availability and Proposed Plans ..................................169
Table 5.3.4: Assessment Criteria 4 – Gap between Water Supply and Demand...................................................170
Table 5.3.5: Assessment Criteria 5 – Accessibility to Electricity Network............................................................. 171
Table 5.3.6: Assessment Criteria 6 – Urban Planning Strategy .............................................................................172
Table 5.3.7: Assessment Criteria 7 – Existing / Planned Industrial Parks ............................................................173
Table 5.3.8: Assessment Criteria8 – Accessibility to Major Transport Facilities..................................................174
Table 5.4.1: Summary of Potential Sub District and Candidate Industrial Nodes (Karnataka State).................. 177
Table 5.4.2: Summary of Potential Sub District and Candidate Industrial Nodes (Tamil Nadu State)...............179
Table 5.4.3: Summary of Potential Sub District and Candidate Industrial Nodes (Andhra Pradesh State) ....... 181
Table 5.6.1: Comparison of Land Details .................................................................................................................185
Table 5.6.2: Breakdown of Ground Condition........................................................................................................ 186
Table 5.6.3: Conformity to the possibility of developing Master Plan by the Government .................................. 191
Table 5.6.4: List of the Core Japanese Companies in CBIC ....................................................................................192
Table 6.1.1: Activity - Time chart for transportation of Import Containers from Chennai Port to Bidadi...........197
Table 6.1.2: Activity - Time chart for transportation of Export Containers from Bidadi to Chennai Port...........197
Table 6.2.1: Commodity-wise capacity at the four existing ports in the CBIC region ...........................................199
Table 6.2.2: Major import & export commodities handled at the four existing ports in CBIC region .................199
Table 6.2.3: Growth rates for forecasting iron ore traffic at ports in CBIC region ............................................... 207
Table 6.2.4: Comparison of historical CAGR witnessed and projected growth rates as per Maritime Agenda..208
Table 6.2.5: Growth rates for forecasting BIS scenario traffic at ports in CBIC region .......................................208
Table 6.2.6: BAU and BIS traffic numbers for ports in corridor region................................................................209
Table 6.2.7: List of committed / confirmed projects for Chennai & Ennore ports............................................... 210
Table 6.2.8: List of proposed projects at ideation stage for Chennai, Ennore ports ............................................. 211
Table 6.2.9: Proposed capacity expansion projects planned at other ports in CBIC region .................................212
Table 6.2.10: Proposed land-side evacuation projects for ports in CBIC region ...................................................213
Table 6.2.11: Proposed Road connectivity projects for enhancing land-side road based evacuation capacity at
Chennai port ..............................................................................................................................................................216
Table 6.2.12: Limitation imposed on cargo movement due to access gates at Chennai port and maximum
tonnage handling possible at Chennai Port with improved truck gate movement................................................217
Table 6.2.13: Constraints due to rail based evacuation at Chennai port ............................................................... 218
Table 6.2.14: Total land based evacuation possible for Chennai Port ................................................................... 218
Table 6.2.15: Comparison of Berth Side capacity and total land-side evacuation capacity at Chennai Port .......219
Table 6.2.16: Excess / Deficit in land-side evacuation capacity at Chennai port ..................................................219
Table 6.2.17: Constraints due to land-side road based cargo handling capacity for Ennore & Kattupalli ports 220
Table 6.2.18: Limitation imposed on cargo movement due to access gates at Ennore & Kattupalli ports ..........221
Table 6.2.19: Constraints due to rail based evacuation at Ennore port .................................................................221
Table 6.2.20: Total Land-side evacuation capacity at both Ennore & Kattupalli ports combined.......................221
Table 6.2.21: Excess / Deficit in land-side evacuation capacity at Chennai port ................................................. 222
Table 6.2.22: Total cargo handling potential at Chennai, Ennore & Kattupalli ports.......................................... 222
Table 6.2.23: Road-based evacuation capacity at Krishnapatnam Port................................................................ 223
Table 6.2.24: Commodity-wise Demand-Supply gaps at 100% capacity utilization ............................................ 223
Table 6.2.25: Commodity-wise Demand-Supply Gaps (Assuming 70% capacity utilization) ............................. 225

Final Report – Comprehensive Regional PlanPwC/ Nippon Koei 5
Table 6.2.26: Key projects planned for container capacity addition at the Chennai, Ennore & Kattupalli ports
over the short & medium term.................................................................................................................................228
Table 6.2.27: Comparison of slot costs with change in vessel size ........................................................................ 229
Table 6.3.1: Intercity Road Network in CBIC Area ............................................................................................. 249
Table 6.3.2: NHDP and Other NHAI Projects (Status: 31st October 2011) ...........................................................251
Table 6.3.3: NHDP and Other NHAI Projects(Status: 31st October 2011) ............................................................251
Table 6.3.4 Major Issues on Road Infrastructure Development for Logistic....................................................... 252
Table 6.3.5 Comparison of Development Ratio of Urban Ring Road.................................................................... 254
Table 6.3.6 Road Network Functions and Connectivity......................................................................................... 256
Table 6.3.7: Elasticity of Traffic Demand................................................................................................................ 259
Table 6.3.8: District-wise Traffic Growth by Vehicle Type (Year-on-Year2013, BAU, BIS) ................................260
Table 6.3.9: Distribution of Present Vehicle Congestion Ratio of National Highways ........................................ 264
Table 6.3.10: Distribution of Present Vehicle Congestion Ratio of State Highways ........................................... 264
Table 6.3.11: Distribution of Vehicle Congestion Ratio of National Highways in Tamil Nadu (BAU) ................ 266
Table 6.3.12: Distribution of Vehicle Congestion Ratio of National Highways in Karnataka (BAU) .................. 266
Table 6.3.13: Distribution of Vehicle Congestion Ratio of National Highways in Andhra Pradesh (BAU) ........ 266
Table 6.3.14: Distribution of Vehicle Congestion Ratio of State Highways in Tamil Nadu (BAU)..................... 266
Table 6.3.15: Distribution of Vehicle Congestion Ratio of State Highways in Karnataka (BAU) ....................... 267
Table 6.3.16: Distribution of Vehicle Congestion Ratio of National Highways in Tamil Nadu (BIS) ................. 267
Table 6.3.17: Distribution of Vehicle Congestion Ratio of National Highways in Karnataka (BIS) ................... 267
Table 6.3.18: Distribution of Vehicle Congestion Ratio of National Highways in Andhra Pradesh (BIS)..........268
Table 6.3.19: Distribution of Vehicle Congestion Ratio of State Highways in Tamil Nadu (BIS) .......................268
Table 6.3.20: Distribution of Vehicle Congestion Ratio of State Highways in Karnataka (BIS) .........................268
Table 6.3.21: Road Development Strategies ............................................................................................................271
Table 6.3.22: Corridor Function on CBIC Logistic Road Network.........................................................................277
Table 6.3.23: Description of Traffic Condition by Classification of V/C ............................................................... 278
Table 6.3.24: Committed Projects on CBIC Logistic Corridors ............................................................................ 278
Table 6.3.25: Volume Capacity Ratio and Necessary Road Widening ..................................................................280
Table 6.3.26: Description of Traffic Condition by Classification of V/C ..............................................................284
Table 6.3.27: Current and Proposed Road Projects on identified Logistic Corridors within the CBIC area ...... 285
Table 6.3.28: Summary of Identified Projects on CBIC Logistic Road Network Plan .........................................288
Table 6.3.29: Phasing Plan of CBIC Logistic Road Network Plan .........................................................................289
Table 6.4.1 Expansion factors used for train and traffic volume forecasts ...........................................................300
Table 6.4.2 Sample train forecast sheet (Arakkonam-Katpadi section), BIS case................................................ 301
Table 6.4.3 Forecast of rail freight volume moving between Chennai and Bengaluru in the “Business as Usual”
case ............................................................................................................................................................................303
Table 6.4.4 Forecast of rail freight volume moving between Chennai and Bengaluru in the “Business Induced”
case ............................................................................................................................................................................304
Table 6.4.5 Trend in number of passenger trips, 3 zonal railways ....................................................................... 307
Table 6.4.6 Passenger Traffic Estimates between Chennai and Bengaluru in the BIS Case................................308
Table 6.4.7 Estimated route capacity expansion (in km) (BAU case) ....................................................................313
Table 6.4.8 Estimated route capacity expansion (in km) (BIS case)......................................................................314
Table 6.4.9 Summary of Capacity Expansion (D/L = 100 trains/day)...................................................................316
Table 6.4.10 Summary of Capacity Expansion (D/L = 90 trains/day)...................................................................316
Table 6.4.11 Capacity Expansion for the Chennai – Bengaluru Route ...................................................................316
Table 6.4.12 Reduction in Capacity Expansion for Chennai – Bengaluru main line due to construction of a
Dedicated Freight Corridor...................................................................................................................................... 323
Table 6.4.13 Design Standards for Expressways and Dedicated Freight Corridors ............................................. 324
Table 6.4.14 List of Railway Subsector Projects ..................................................................................................... 326
Table 6.4.15 Summary of Phasing Plan for Railway Subsector Projects (Rs. Crore)............................................ 327
Table 6.4.16 Detailed Phasing Plan for Railway Subsector Projects ..................................................................... 327
Table 6.4.17 Estimated Capex profile for route capacity expansion (BAU scenario) ...........................................330
Table 6.4.18 Estimated Capex profile for route capacity expansion (BIS scenario)..............................................331

Final Report – Comprehensive Regional PlanPwC/ Nippon Koei 6
Table 6.5.1: Modal Share.......................................................................................................................................... 338
Table 6.5.2: Traffic Survey Result in Chennai Metropolitan Area ................................................................... 342
Table 6.5.3: Traffic Survey Result in Bengaluru Metropolitan Area ................................................................ 343
Table 6.5.4: Future Demographic Projection.......................................................................................................... 345
Table 6.5.5: Projection of Per Capita Trip Rate ...................................................................................................... 345
Table 6.5.6: Projection of Modal Shares ................................................................................................................. 346
Table 6.5.7: Future Traffic Demand on Proposed Public Transport Network 2026 (CMA) ................................ 346
Table 6.5.8: Growth of Future Population in BMA ................................................................................................348
Table 6.5.9: Per-Capita Trip (PCTR) Rates by Purpose in BMA............................................................................348
Table 6.5.10: Forecast of Modal Share (excluding Walk trips) ..............................................................................348
Table 6.5.11: Future Traffic Demand on Proposed Public Transport Network 2025 (BMA)............................... 349
Table 6.5.12: Strategy for Urban Transport Development adopted in Existing Transport Master Plans ........... 353
Table 6.5.13: Summary of Urban/Public Transport Subsector Objective and Strategy....................................... 355
Table 6.5.14: Goals and Indicators .......................................................................................................................... 356
Table 6.5.15: Summary of Urban/Public Transport Subsector Goals and Targets............................................... 356
Table 6.5.16: Capacity Augmentation Projects for Port Connectivity ................................................................... 357
Table 6.5.17: List of Urban/Public Transport Subsector Projects (Chennai)........................................................ 358
Table 6.5.18: List of Urban/Public Transport Subsector Projects (Bengaluru).....................................................361
Table 6.5.199 Relationship between Strategy and Demand/ Supply Gaps (Bottlenecks) and Projects ..... 363
Table 6.5.2020: Summary of Phasing Plan for Urban/ Public Transport Subsector (Chennai) .................... 365
Table 6.5.211: Summary of Phasing Plan for Urban/ Public Transport Subsector (Bengaluru) ......................... 365
Table 6.8.1: Electricity demand projections for BAU (MU) based on 18th EPS (growth rates) ........................... 394
Table 6.8.2: Electricity demand projections for BAU (MU) based on historical trend ........................................ 395
Table 6.8.3: Electricity demand projections for BAU (MU) based on hybrid approach ...................................... 396
Table 6.8.4: Projections for district wise GDP (in Billion USD)............................................................................398
Table 6.8.5: Additional electricity demand projections in accelerated growth scenario (Million Units) ...........398
Table 6.8.6: Summary of total state demand projections in CBIC scenario (Million Units) ............................... 399
Table 6.8.7: Coal equivalent demand for the three states (MW) ........................................................................... 401
Table 6.8.8: Andhra Pradesh – Expected installed capacity as per plans (MW)..................................................402
Table 6.8.9: Andhra Pradesh – Expected generation as per plans (Million Units)..............................................403
Table 6.8.10: Karnataka – Expected installed capacity as per plans (MW)..........................................................404
Table 6.8.11: Karnataka – Expected generation as per plans (Million Units) ......................................................404
Table 6.8.12: Tamil Nadu – Expected installed capacity as per plans (MW) .......................................................406
Table 6.8.13: Tamil Nadu – Expected generation as per plans (Million Units) ...................................................406
Table 6.8.14: Year wise demand supply gap forecast, Source: PwC analysis........................................................ 407
Table 6.8.15: Coal equivalent requirement for filling the gap in the CBIC region................................................408
Table 6.8.16: Renewable capacity addition proposed for CBIC states ..................................................................408
Table 6.8.17: Hydro capacity addition for CBIC states...........................................................................................409
Table 6.8.18: Nuclear capacity addition for CBIC states........................................................................................409
Table 6.8.19: Gas capacity addition for CBIC states...............................................................................................409
Table 6.8.20: Thermal capacity addition for CBIC states ...................................................................................... 410
Table 6.8.21: Andhra Pradesh – Generation projects planned...............................................................................412
Table 6.8.22: Karnataka – Generation projects planned........................................................................................415
Table 6.8.23: Tamil Nadu – Generation projects planned .....................................................................................417
Table 6.8.24: Investment in the past 4 years by APTRANSCO (INR Crs.), Source: Andhra Pradesh Transmission
Corporation Tariff order FY 2009-14 ......................................................................................................................420
Table 6.8.25: Andhra Pradesh transmission schemes; Source: National Electricity Plan...................................420
Table 6.8.26: Transmission lines to be added by KPTCL (Ckt Kms.); Source: Karnataka Transco Tariff order FY
2013-14.......................................................................................................................................................................421
Table 6.8.27: Terminal Bays to be added by KPTCL (Nos.), Source: Karnataka Transco Tariff order FY 2013-14
....................................................................................................................................................................................421
Table 6.8.28: Capital investments; Source: Karnataka Transco Tariff order FY 2013-14 ....................................421
Table 6.8.29: Karnataka transmission schemes; Source: National Electricity Plan ............................................ 422

Final Report – Comprehensive Regional PlanPwC/ Nippon Koei 7
Table 6.8.30: Planned capital investments by Tamil Nadu in transmission, Source: TNERC, Tariff order, FY
2013-14...................................................................................................................................................................... 422
Table 6.8.31: Details of upcoming Transmission network in Tamil Nadu, Source: TANTRASCO...................... 423
Table 6.8.32: Tamil Nadu transmission schemes; Source: National Electricity Plan – Transmission ............... 423
Table 6.8.33: Capex plan BESCOM (Million USD); Source: BESCOM Tariff Order, FY 2013-14....................... 424
Table 6.8.34: Capex plan of TANGEDCO; Source: Tariff order 2013 ................................................................... 425
Table 6.8.35: Smart grid pilot projects in distribution........................................................................................... 427
Table 6.8.36: Assumptions for estimating investment in proposed projects (Million USD)............................... 427
Table 6.8.37: New generation projects proposed in the region ............................................................................. 427
Table 6.8.38: New transmission projects proposed in the region .........................................................................428
Table 6.8.39: Cumulative investment proposed in distribution projects in CBIC area (Million USD)............... 429
Table 6.8.40: CBIC region – Power supply and generation mix (MU) ..................................................................431
Table 6.8.41: Coal requirement (Million Tonnes) ...................................................................................................431
Table 6.8.42: Coal reserves in some major states of India (Billion Tonnes); Source: GSI ...................................431
Table 6.8.43: Gas requirement (mm scmd) ............................................................................................................ 433
Table 6.8.44: Natural gas demand (mmscmd); Source: PNGRB Report on natural gas ..................................... 433
Table 6.8.45: Natural gas supply (mmscmd); Source: PNGRB Report on natural gas........................................ 434
Table 6.8.46: Power sector goals and performance indicators...............................................................................441
Table 6.8.47: Power sector development strategy .................................................................................................. 445
Table 6.8.48: Expected investments in power across G, T and D in the CBIC region (Million USD)................. 447
Table 6.9.1: Number of Local Government Bodies in CBIC Area by Census 2011 .............................................. 453
Table 6.9.2: List of Sub District to be defined as “Town”...................................................................................... 454
Table 6.9.3: District-wise Land Demand for Industrial Use (Unit : ha) ............................................................... 455
Table 6.9.4: Number of High-populated Towns..................................................................................................... 456
Table 6.9.5: Objectives and Strategies of Town and Industrial Development ...................................................... 459
Table 6.9.6: Growth targets of Urban and Industrial Development .....................................................................460
Table 6.9.7 : List of Town Development and Industrial Development Projects ....................................................461
Table 6.9.8: Summary of Phasing Plan for Town Development and Industrial Development Sector Projects
(Unit : Million USD)................................................................................................................................................. 462
Table 6.111.1 Classification of solid waste in India ........................................................................................491
Table 6.11.2 Types of recycling facilities registered.......................................................................................... 493
Table 6.11.3 Summary of existing and planned infrastructure........................................................................ 493
Table 6.11.4 Supply-Demand Gap: Tamil Nadu ............................................................................................... 494
Table 6.11.5 Supply-Demand Gap: Karnataka ........................................................................................................ 495
Table 6.11.6 Supply-Demand Gap: Andhra Pradesh ........................................................................................ 496
Table 6.11.7 Hazardous waste generated by district of target area in future ..................................................498
Table 6.11.8 Existing facilities and future plans in Tamil Nadu .......................................................................501
Table6.11.9 Existing facilities and future plans in Karnataka......................................................................... 502
Table 6.11.10 Summary of SWM Subsector Objectives and Strategies........................................................ 504
Table 6.11.11 Summary of HWM Subsector Goals and Targets................................................................... 505
Table 6.11.12 Scale of infrastructure needed in each state ........................................................................... 507
Table 6.11.13 Scale of Infrastructure Needed in Tamil Nadu State (in Business As Usual Scenario)........ 507
Table 6.11.14 Scale of infrastructure needed in Karnataka state ................................................................. 509
Table6.11.15 Scale of Infrastructure Needed in Karnataka State (in Business As Usual Scenario) ............... 509
Table 6.11.16 Scale of infrastructure needed in Andhra Pradesh state.........................................................510
Table 6.11.17 Scale of Infrastructure Needed in Andhra Pradesh State (in Business As Usual Scenario) . 511
Table 6.11.18 Operation schedule of infrastructure for hazardous waste management by state ................ 511
Table 6.11.19 List of SWM Subsector Projects ...............................................................................................512
Table 6.11.20 Waste management facilities in 8 nodes..................................................................................513
Table 6.11.21 Waste management facilities by type of waste ........................................................................514
Table 6.11.22 The Main Recycling Facilities in Kawasaki Eco Town ............................................................516
Table 6.11.23 Main Facilities of Saitama Prefectural Environmental Management Centre........................516
Table 6.11.24 Summary of Phasing Plan for SWM Subsector Projects (Million US$).................................517

Final Report – Comprehensive Regional PlanPwC/ Nippon Koei 8
Table 7.1.1: Summary of Suspended Projects Due to Land Issues..........................................................................519
Table 7.1.2: Comparative Analysis between Old Law and New Law of Land Acquisition.................................... 520
Table 7.4.1: Development Policies for the Structure Plan...................................................................................... 523
Table 7.4.2: Environmental Impact Matrix for the Structure Plan ....................................................................... 525
The summary of evaluation matrix of the environmental impact for the plan is shown in the Table 7.4.3 ....... 527
Table 7.4.4: Summary of the Anticipated Environmental Impact......................................................................... 527
Table 7.5.1: Pattern of Implementation Scheme..................................................................................................... 528
Table 7.5.2: Characteristics of the Alternatives including Proposed Plan ............................................................ 530
Table 7.5.3: Comparative Evaluation of Alternatives ..............................................................................................531
Table 7.7.1: General Environmental Monitoring Plan............................................................................................ 535
Table 8.2.1: Five Principle Themes.......................................................................................................................... 542
Table 8.2.2 Focus sectors across corridor’s objectives ........................................................................................... 543
Table 8.2.3: Enhancers by Industry ........................................................................................................................ 548
Table 8.2.4: Summary of key sectors – historical growth rates and key districts for investment ........................551
Table 8.3.1: Criticality of Infrastructure by Industry ............................................................................................. 553
Table 8.3.2: Global Competitiveness Index ........................................................................................................... 553
Table 8.3.3: Deficiencies in Port Handling Capacities ........................................................................................... 558
Table 8.3.4: Length of Committed and Proposed Projects in the Short Term.......................................................561
Table 8.3.5: Length of Committed and Proposed Projects in the Medium Term................................................. 562
Table 8.3.6: Typical Logistic Facilities .................................................................................................................... 566
Table 8.3.7: Improvements of Demand Supply Gap .............................................................................................. 574
Table 8.3.8: Commissioning Status of upcoming Plants ....................................................................................... 576
Table 8.3.9: Source and responsibility wise breakup of meeting demand for CBIC region in medium term, FY
2022........................................................................................................................................................................... 578
Table 8.3.10 : Source and responsibility wise breakup of meeting demand for CBIC region in long term, FY 2032
................................................................................................................................................................................... 579
Table 8.3.11 : Exsiting and Planed Solid Waste Managment Infrastructures.......................................................580
Table 8.4.1: Invetsments by Sector.......................................................................................................................... 582
Table 8.4.2: Investments by Sector over the Short Term....................................................................................... 583
Table 8.4.3: Investments by Sector over the Medium Term.................................................................................. 584
Table 8.4.4: Investments by Sector over the Long Term ....................................................................................... 585
Table 8.4.5: Summary of Investments Required by Implementing Agency (amount) ........................................ 585
Table 8.4.6: Summary of Investments Required by Implementing Agency (%) .................................................. 586
Table 8.5.1: Period of Procedures in CBIC Region ....................................................................................588
Table 8.5.2: Key Bottlenecks in Administrative Issue in CBIC Region ............................................... 589
Table 8.5.3: Current and Recommended Tax Rates for CBIC................................................................ 590

Final Report – Comprehensive Regional PlanPwC/ Nippon Koei 9
List of figuresFigure 2.1.1: Overview of Corridor influence zone.....................................................................................................18
Figure 2.1.2: Breakup of population along corridor region...................................................................................... 20
Figure 2.1.3: Density in the CBIC region....................................................................................................................21
Figure 2.1.4: Breakup of population along corridor region...................................................................................... 22
Figure 2.1.5: Gender balance in the CBIC region...................................................................................................... 23
Figure 2.1.6: Urbanization ratio in the CBIC region................................................................................................. 24
Figure 2.1.7: Scheduled Caste in the CBIC Region ................................................................................................... 25
Figure 2.1.8: Scheduled Tribes in the CBIC region................................................................................................... 25
Figure 2.1.9: Literacy rate in corridor region............................................................................................................ 26
Figure 2.1.10: Worker ratio in corridor region ......................................................................................................... 27
Figure 3.1.1: Top Prospective Host Economies (2013-2015) ................................................................................... 33
Figure3.1.2: Expected contribution to World GDP growth (2020 estimated)........................................................ 34
Figure3.1.3: India’s Position: GDP Scale, Growth and Share in the world (2012) ................................................. 35
Figure3.1.4: Long-term GDP Growth (Past 20 Years).............................................................................................. 35
Figure3.1.5: GDP Scale, Growth and Share in the world (2018) ............................................................................. 36
Figure3.1.6: World Population and Share of India................................................................................................... 37
Figure3.1.7: Current GDP per capita (2012) ............................................................................................................. 38
Figure3.1.8: Global Competitiveness Index Ranking (2013-2014).......................................................................... 38
Figure3.1.9: Doing Business Global Ranking (2012)................................................................................................ 40
Figure3.1.10: Per Capita Income at Current Prices (2010-11)...................................................................................41
Figure3.1.11: Received FDI Equity (April 2000 - November 2013)......................................................................... 42
Figure3.1.12: Doing Business Ranking in India (Latest-2009) ............................................................................... 42
Figure3.1.13: Dealing with Construction Permits..................................................................................................... 43
Figure3.1.14:Trading Across Borders - Import ......................................................................................................... 43
Figure3.1.15:Trading Across Borders – Export......................................................................................................... 44
Figure3.1.16: Getting Electricity ................................................................................................................................ 44
Figure3.1.17: Starting a Business ............................................................................................................................... 45
Figure3.1.18: Tax Rates (2013) .................................................................................................................................. 45
Figure3.1.19: Paying Taxes......................................................................................................................................... 47
Figure3.1.20: Enforcing Contract .............................................................................................................................. 48
Figure3.1.21: Minimum Wages (Latest-2011)........................................................................................................... 48
Figure3.1.22: Average Monthly Wages – Service Sector (2012) .............................................................................. 49
Figure3.1.23: Average Monthly Wages – Industry Sector (2012)............................................................................ 49
Figure3.1.24: Wage Increase Ratio in (Latest-2011) ................................................................................................ 50
Figure3.1.25: Regulations on FDI...............................................................................................................................51
Figure3.2.1: Summary of CBIC’s Key Appeals to Foreign Investors ....................................................................... 53
Figure3.2.2: Summary of CBIC’s Major Weakness Alienating Potential Foreign Investors.................................. 54
Figure3.4.1: Number of Procedures .......................................................................................................................... 62
Figure3.4.2: Comparison of Tax Rates between CBIC and Hong Kong .................................................................. 64
Figure4.1.1: Indian Manufacturing GDP and contribution...................................................................................... 66
Figure 4.1.2: Change in Manufacturing GDP contribution in past 45 years ........................................................... 66
Figure 4.1.3: Trend in manufacturing GDP contribution in past 10 years.............................................................. 66
Figure4.1.4: Manufacturing sector’s contribution to the economy ......................................................................... 67
Figure4.1.5: Key export commodities........................................................................................................................ 67
Figure4.1.6: Country wise trade performance scores for key sectors ...................................................................... 68
Figure4.1.7: Relationship between Return on Invested Capital (ROIC) and Weighted Average Cost of Capital
(WACC) across major sectors in India ...................................................................................................................... 68
Figure4.1.8: Logistics performance and labour productivity benchmarks – India vs. Other competing nations 69
Figure4.1.9: Relationship of labour and logistics productivity to production costs ............................................... 69

Final Report – Comprehensive Regional PlanPwC/ Nippon Koei 10
Figure4.1.10: Industrial water productivity – India vs. Other competing nations ................................................. 69
Figure4.1.11: Labour productivity benchmarks – India vs. Other competing nations ........................................... 70
Figure4.1.12: Capital productivity (cost as a % of total sales) – India vs. China .................................................... 70
Figure4.2.1: India’s vision for the manufacturing sector – National Manufacturing Policy...................................71
Figure4.2.2: Map of CBIC region............................................................................................................................... 72
Figure4.2.3: Demographic dividend of the corridor ................................................................................................ 72
Figure4.2.4: Economic performance of the corridor................................................................................................ 73
Figure4.2.5: Sector-wise investments in the corridor .............................................................................................. 73
Figure4.2.6: parameters used for short-listing of potential sector in the corridor................................................. 74
Figure4.2.7: Sectors shortlisted as potential sectors for the corridor ..................................................................... 74
Figure4.3.1: Strategic framework for CBIC................................................................................................................75
Figure4.3.2: Contribution of top Sector’s to corridor’s Gross Value Added ............................................................77
Figure4.3.3: Expected employment in corridor’s manufacturing sector in 2033-34..............................................77
Figure4.3.4: Contribution of major sectors to employment in the MSME sector .................................................. 78
Figure4.3.5: Focus sectors to increase corridor’s value addition in the manufacturing sector ............................. 79
Figure4.3.6: Doing Business in India - Index ........................................................................................................... 83
Figure 4.4.1: Contribution of sub-sectors to metallurgy sector GDP .......................................................................91
Figure 4.4.2: Growth rate of India’s GDP vs. Metallurgy sector...............................................................................91
Figure 4.4.3: Yearly trade volume of Iron and steel commodities expressed as ‘x’ times of 2003 trade volume . 92
Figure 4.4.4: Asia Pacific outlook .............................................................................................................................. 97
Figure 4.4.5: Demand capacity gap forecast – Medical equipment ........................................................................ 98
Figure 4.4.6: Segment separation of Textiles and Apparel industry in India ........................................................101
Figure4.4.7: Demand drivers for India's pharmaceutical industry ........................................................................ 116
Figure4.4.8: Market size of IT industry in India (USD billion) ............................................................................. 140
Figure4.4.9: Export revenue of Indian IT sector - (USD billion) ........................................................................... 141
Figure4.4.10: Export revenue across IT-BPM segments. %, 2013.......................................................................... 141
Figure 4.4.11: Past Trends in production of passenger vehicle production (in million units) ..............................146
Figure 4.4.12: Past Trends in production of passenger vehicle production (in million units) .............................147
Figure 4.4.13 : Past Trends in production of passenger vehicle production (in million units).............................147
Figure 4.4.14: Past Trends in production of passenger vehicle production (in million units) ............................ 148
Figure 4.4.15: Past Trends in production of passenger vehicle production (unit: million units for completed
vehicles, billion USD for auto components) ............................................................................................................149
Figure 4.4.16: Past Trends of domestic vehicle sales and exports (in million units).............................................149
Figure 4.4.17 : Type of vehicle and share by manufacturers ...................................................................................150
Figure 5.2.1: Methodology and assessment framework for the broad selection of industrial nodes ...................163
Figure 5.2.2: Location of Potential Sub Districts ....................................................................................................164
Figure 5.3.1: Assessment of Road Network Accessibility........................................................................................167
Figure 5.3.2: Assessment of Protected/Restriction Area ....................................................................................... 168
Figure 5.3.3: Assessment of Government Land Availability and Proposed Industrial Development..................169
Figure 5.3.4: Assessment of Water Availability.......................................................................................................170
Figure 5.3.5: Assessment of Accessibility of Electricity Network........................................................................... 171
Figure 5.3.6: Assessment of Urban Planning Strategy............................................................................................172
Figure 5.3.7: Assessment of Existing and Proposed Industrial Parks ....................................................................173
Figure 5.3.8: Assessment of Accessibility to Major Transport Facilities ...............................................................174
Figure 5.3.9: Potential Assessment Result at Sub District Level ............................................................................175
Figure 5.4.1: Location of candidate industrial nodes ..............................................................................................176
Figure 5.5.1: Structure Plan for CBIC Area ............................................................................................................. 184
Figure 5.6.1: Location of Proposed Area in Ponneri............................................................................................... 186
Figure 5.6.2: Proposed Area in Hosur......................................................................................................................187
Figure 5.6.3: Conceptual Plan of “Bidadi Knowledge City” ................................................................................... 188
Figure 5.6.4: Master Plan of Tumkur NIMZ ........................................................................................................... 188
Figure 5.6.5: Current Condition of Mulbagal NIMZ (left : rocky ground, right : access road)............................ 189
Figure 5.6.6: Master Plan of Tumkur NIMZ ........................................................................................................... 189

Final Report – Comprehensive Regional PlanPwC/ Nippon Koei 11
Figure 5.6.7: Layout Plan of Gollapuram Industrial Area...................................................................................... 190
Figure 5.6.8: Boundary of Chittoor NIMZ .............................................................................................................. 190
Figure 5.6.9: Layout Plan of Krisnapatnam Industrial Area................................................................................... 191
Figure 5.6.10: Location of the Core Japanese Companies in CBIC ........................................................................192
Figure 6.1.1: Time taken in movement of Export and Import containers between Chennai Port and Bidadi
Industrial Area...........................................................................................................................................................196
Figure 6.2.1: Combined primary hinterland for container traffic of the Chennai, Ennore, Kattupalli and
Krishnapatnam Ports ...............................................................................................................................................200
Figure 6.2.2: Primary hinterland for Coal traffic handled at Ennore & Krishnapatnam ports ........................... 201
Figure 6.2.3: Primary hinterland for Break Bulk Traffic at the existing ports in the CBIC region...................... 201
Figure 6.2.4: Port performance efficiency parameters - Turn Around Time & Pre-berthing Detention time....202
Figure 6.2.5: Growth in container traffic across ports in India .............................................................................204
Figure 6.2.6: Map depicting proposed port connectivity road projects for Chennai, Ennore & Kattupalli ports215
Figure 6.2.7: Container Capacity landscape for existing ports in the CBIC region .............................................. 226
Figure 6.2.8: Medium Term Container capacity and demand landscape at existing ports in the region ........... 227
Figure 6.2.9: Orderbook of container ships till 2016 .............................................................................................228
Figure 6.2.10: Comparative analysis of berth drafts and container vessels at ports in the CBIC regoin and
international ports.................................................................................................................................................... 229
Figure 6.2.11: Container Traffic and Capacity in CBIC - Long Term scenario......................................................230
Figure 6.2.12: Berth capacity addition, evacuation capacity and capacity requirements in the Short, Medium &
Long Term for CBIC region.......................................................................................................................................231
Figure 6.2.13: Overall commodity-wise demand-supply gap scenario in the Short, Medium & Long Term in
CBIC region - BIS case..............................................................................................................................................231
Figure 6.3.1: Intercity Road Network in CBIC Area ........................................................................................... 250
Figure 6.3.2: Container Movement by Road Transport & Railways: 2004 to 2012of Chennai Port ........... 252
Figure 6.3.3 Traffic Congestion on TPP Road due to Parking of Waiting Cargo Vehicle..................................... 254
Figure 6.3.4 Comparison of Urban Ring Road Development ........................................................................... 255
Figure 6.3.5: Number of Lanes of Connecting Road for Industrial Nodes and Sub Centres ............................... 256
Figure 6.3.6 Road Conditions in Chennai – Bengaluru Area................................................................................. 257
Figure 6.3.7:Road Conditions in Chennai Metropolitan Area ............................................................................... 258
Figure 6.3.8: Number of Lanes in CBIC Area (Present)..................................................................................... 265
Figure 6.3.9: Volume Capacity Ratio in CBIC Area (Present)........................................................................... 265
Figure 6.3.10: Volume Capacity Ratio (BAU, 2018, 2023, 2028, 2033, without project) ............................ 269
Figure 6.3.11: Volume Capacity Ratio (BIS, 2018, 2023, 2028, 2033, without project) ............................... 270
Figure 6.3.12: Proposed Primary Logistic Road Network.................................................................................. 273
Figure 6.3.13: Proposed Secondary Logistic Road Network.............................................................................. 274
Figure 6.3.14: Proposed Urban Primary Road Network .................................................................................... 275
Figure 6.3.15:CBIC Logistic Road Network .............................................................................................. 276
Figure 6.3.16: Volume Capacity Ratio (2018, 2023, 2028, 2033, with widening projects)..........................282
Figure 6.3.17: Necessary Widening for Future Traffic Demand (2018, 2023, 2028, 2033) ......................... 283
Figure 6.3.18: Current and Proposed Road Projects on identified Logistic Corridors within the CBIC area ..... 287
Figure 6.3.19: Phasing Plan of CBIC Logistic Road Network Plan (~2018) .................................................. 292
Figure 6.3.20: Phasing Plan of CBIC Logistic Road Network Plan (2019~2023) ........................................ 293
Figure 6.3.21: Phasing Plan of CBIC Logistic Road Network Plan (2024~2033)......................................... 294
Figure 6.4.1 Railway network within the CBIC area............................................................................................... 296
Figure 6.4.2 Line capacity utilisation on CBIC railway network (by route km) ................................................... 297
Figure 6.4.3 Distribution of route-km by number of running lines ......................................................................298
Figure 6.4.4 Chennai-Bengaluru freight tonnage forecasts (BIS case) - Up Direction ........................................306
Figure 6.4.5 Chennai-Bengaluru freight tonnage forecasts (BIS case) - Down Direction....................................306
Figure 6.4.6 Chennai-Bengaluru freight tonnage forecasts (BIS case) - Both Directions....................................306
Figure 6.4.7 Projected growth in Rail Traffic by Commodity to and from CBIC Ports (BIS Case)..................... 310
Figure 6.4.8 Capacity Expansion required in 5-year periods (BIS Case)...............................................................315

Final Report – Comprehensive Regional PlanPwC/ Nippon Koei 12
Figure 6.4.9 New lines committed, planned or proposed for the CBIC Area.........................................................319
Figure6.5.1: Main Road Network in Chennai Metropolitan Area.......................................................................... 333
Figure6.5.2: Rail Network in Chennai City ......................................................................................................... 335
Figure6.5.3: Growth of Motor Vehicles in Chennai........................................................................................... 336
Figure6.5.4: Average Speed in Peak Hours on Selected Corridor ......................................................................... 337
Figure6.5.5: Main Road Network in Bengaluru Metropolitan Region.................................................................. 339
Figure6.5.6: Namma Metro Network ......................................................................................................................340
Figure6.5.7: Growth of Motor Vehicles in Bengaluru ........................................................................................341
Figure6.5.8: Modal Split with Walk Trips................................................................................................................341
Figure6.5.9: Location Map of Traffic Survey ....................................................................................................... 342
Figure6.5.10: Location Map of Traffic Survey ..................................................................................................... 343
Figure6.5.11: Proposed Public Transport Corridors (2026) .................................................................................. 347
Figure6.5.12: Proposed Integrated Public Transport Network (2025) ................................................................. 350
Figure6.5.13: Example of Demand/ Supply Gap (Case of Corridor No.2 in CMA) ..............................................351
Figure6.5.14: Impact on Reduce of Demand/ Supply Gaps by Proposed Public Transport Network ........ 352
Figure6.5.15: Project Locations and Connectivity to Main Industrial Cores (Chennai) ...................................... 359
Figure6.5.16: Location Map for Public Transport Projects (Chennai) ..................................................................360
Figure6.5.17: Project Locations and Connectivity to Main Industrial Cores (Bengaluru) ................................... 363
Figure 6.7.1: Modal Split of container traffic movement for Chennai Port...........................................................380
Figure 6.7.2: Location of CFS/ICD-Chennai............................................................................................................381
Figure 6.7.3: Capacity Utilization of CFSs and ICDs in CBIC region .................................................................... 382
Figure 6.7.4: Chain of activities taking place in import and export of containers................................................ 382
Figure 6.7.5: Container Traffic at Ports in CBIC Region (BAU) ............................................................................384
Figure 6.7.6: Container Traffic at Ports in CBIC Region (BIS) ..............................................................................384
Figure 6.7.7: Demand and Supply of containers at CFSs .......................................................................................386
Figure 6.8.1: Historical trend of demand and supply in CBIC state; Source: CEA............................................... 394
Figure 6.8.2: Andhra Pradesh installed capacity (CEA) ........................................................................................ 401
Figure 6.8.3: Andhra Pradesh demand supply gap (CEA).....................................................................................402
Figure 6.8.4: Andhra Pradesh: Capacity addition plans (MW) .............................................................................402
Figure 6.8.5: Karnataka installed capacity (CEA) ..................................................................................................403
Figure 6.8.6: Karnataka demand supply gap (CEA)...............................................................................................403
Figure 6.8.7: Karnataka: Capacity addition plans (MW); Source: PwC research.................................................404
Figure 6.8.8: Tamil Nadu installed capacity (CEA)................................................................................................ 405
Figure 6.8.9: Tamil Nadu demand supply gap (CEA) ............................................................................................ 405
Figure 6.8.10: Tamil Nadu: Capacity addition plans (MW); Source: PwC research ............................................406
Figure 6.8.11: CBIC Region Demand Supply Gap (MW); Source: PwC research ................................................. 407
Figure 6.8.12: Source wise proposed capacity addition, Source: PwC research ................................................... 410
Figure 6.8.13: Generation capacity fuel mix in FY 2032......................................................................................... 411
Figure 6.8.14:District wise status of planned power projects in Andhra Pradesh.................................................414
Figure 6.8.15: District wise status of planned power projects in Karnataka..........................................................416
Figure 6.8.16: District wise status of planned power projects in Tamil Nadu .......................................................419
Figure 6.8.17: International coal production (2011, MT) and coal reserves (2008, BT); Source: EIA ............... 432
Figure 6.8.18 : Coal price movement of international indices; Source: PwC research......................................... 433
Figure 6.8.19: Projected demand-supply gap of gas in India (mmscmd); Source MoPNG ................................. 434
Figure 6.8.20: Domestic gas prices in India; Source: MoPNG .............................................................................. 436
Figure 6.8.21: Wind capacity in India (MW); Source: MNRE ............................................................................... 437
Figure 6.8.22: Wind capacity in India (MW); Source: MNRE...............................................................................438
Figure 6.8.23: Small hydro capacity in India (MW); Source: MNRE.................................................................... 439
Figure 6.8.24: Policy incentives for Small hydro; Source: FOR’s study on RPO.................................................. 439
Figure 6.8.25: Biomass capacity in India (MW); Source: MNRE..........................................................................440
Figure 6.8.26: Biomass capacity in India (MW); Source: MNRE..........................................................................440
Figure 6.9.1: Functions of Master/Development Plan in India ............................................................................. 449
Figure 6.9.2: Urban Development Planning system as per UDPFI Guidelines .................................................. 450

Final Report – Comprehensive Regional PlanPwC/ Nippon Koei 13
Figure 6.9.3: Outline of Master/Development Plan formulation procedure ...................................................... 450
Figure 6.9.4: Location of Existing Industrial Parks ...............................................................................................451
Figure 6.9.5:Sub district-wise Projected Population Density of 2033 ................................................................. 452
Figure 6.9.6: Sub district-wise Projected Population Density of 2033 ................................................................ 454
Figure 6.9.7: Estimated Urbanized Land Volume .................................................................................................. 456
Figure 6.9.8: Distribution of the Areas Need to Plan Urban Master Plans by 2033 ............................................ 457
Figure 6.9.9: Projected Land Demand and Planned Land (Accelerated Scenario) .............................................. 458
Figure 6.9.10: Projected Land Demand and Planned land (Business As Usual Scenario)................................... 458
Figure 7.2.1: Work Flow for SEA ............................................................................................................................. 522
Figure 7.3.1: Proposed Structure Plan..................................................................................................................... 522
Figure 7.5.1: Alternative A........................................................................................................................................ 529
Figure 7.5.2: Alternative B ....................................................................................................................................... 529
Figure 7.10.7.10.1: Process of EIA Study for the DMIC.......................................................................................... 539
Figure.7.10.2: Necessary Action for Part B ............................................................................................................. 540
Figure 8.2.1:Trend in manufacturing GDP contribution in past 10 years..............................................................541
Figure 8.2.2: National Manufacturing Policy 2011................................................................................................. 542
Figure 8.2.3: Strategic framework for CBIC ........................................................................................................... 543
Figure 8.2.4: Contribution of top Sector’s to corridor’s Gross Value Added ........................................................ 544
Figure 8.2.5: Expected employment in corridor’s manufacturing sector in 2033-24 .......................................... 544
Figure 8.2.6: Contribution of major sectors to employment in the MSME sector ............................................... 545
Figure 8.2.7: Focus sectors to increase corridor’s value addition in the manufacturing sector .......................... 545
Figure 8.2.8: Corridor GDP ..................................................................................................................................... 546
Figure 8.2.9: Key Potential Sectors ..........................................................................................................................551
Figure 8.3.1: Location of Shortlist Nodes................................................................................................................ 552
Figure 8.3.2: Time taken in movement of Export and Import containers between Chennai Port and Bidadi
Industrial Area.......................................................................................................................................................... 554
Figure 8.3.3: Port Traffic in the CBIC Region......................................................................................................... 555
Figure 8.3.4: Demand Supply Scenario in CBIC Region Ports (BIS) ................................................................... 555
Figure 8.3.5: Container Cpacity Landscape for Four Ports in CBIC Region (Short-Term) ................................. 556
Figure 8.3.6: Major Capacity Additions for Containers in CBIC Region .............................................................. 556
Figure 8.3.7: Container Cpacity Required in CBIC Region....................................................................................557
Figure 8.3.8: Coal Handling Capacity at the Ports in CBIC Region ......................................................................557
Figure 8.3.9: Benchmark of Draft at Ports.............................................................................................................. 558
Figure 8.3.10: Comparison of V/C rate in the Short Term......................................................................................561
Figure 8.3.11: Comparison of V/C rate in the Medium Term .................................................................................561
Figure 8.3.12: Suppy and Demnd of Rialway Track km......................................................................................... 563
Figure 8.3.13: Demand and Supply of Containers Handled at CFS in CBIC Region............................................ 565
Figure 8.3.14: Three Regions for Development of Logistic Parks ......................................................................... 567
Figure 8.3.15: Demand and Supply at Chennai Airport ......................................................................................... 567
Figure 8.3.16: Demand and Supply at Bengaluru Airport...................................................................................... 568
Figure 8.3.17: Existing and Proposed Airports ....................................................................................................... 569
Figure 8.3.18: Average Dwell Times for Imports and Exports Clearance ............................................................. 570
Figure 8.3.19: Comparison of Tonnage Handled.................................................................................................... 570
Figure 8.3.20:Comparison of Industrial Area Supply and Demand ......................................................................571
Figure 8.3.21: District-wise demand/supply gap of domestic water in CBIC in 2033 ......................................... 572
Figure 8.3.22: District-wise demand/supply gap of domestic water in CBIC in 2013 ......................................... 572
Figure 8.3.23: District-wise demand/supply gap of industrial water in CBIC in 2013........................................ 573
Figure 8.3.24: District-wise demand/supply gap of industrial water in CBIC in 2033 ....................................... 573
Figure 8.3.25: Comparison of Industrial Water Supply and Demand .................................................................. 573
Figure 8.3.26: Generation Mix (MU), CBIC States .................................................................................................575
Figure 8.3.27: Demand Supply Gap (MU), CBIC States .........................................................................................575
Figure 8.3.28: Expected Short Term Gap, CBIC Region........................................................................................ 576
Figure 8.3.29: Expected Medium Term Gap, CBIC Region................................................................................... 576

Final Report – Comprehensive Regional PlanPwC/ Nippon Koei 14
Figure 8.3.30: Source Wise Capacity Enhancement, CBIC.....................................................................................577
Figure 8.3.31: Expected Long Term Gap, CBIC Region ......................................................................................... 578
Figure 8.3.32 Comparison of Landfill Supply and Demand ...................................................................................581
Figure 8.5.1: Number of Procedures........................................................................................................................588
Figure 8.5.2: Comparison of Tax Rates between CBIC Region and Hong Kong .................................................. 590

Final Report – Comprehensive Regional PlanPwC/ Nippon Koei 15
1 Introduction1.1 Background and Objective
1.1.1 BackgroundBoth Bengaluru and Chennai are developing rapidly and accept increasing number of private companiesincluding Japanese. On the other hand, the private sector claims that bad access to ports, bad road condition,frequent blackouts, tax system, not transparent visa procedure, incomplete policy etc, are bottlenecks of theirinvestments in India.
Joint Statement between Government of Japan (GOJ) and Government of India (GOI) at December 2011emphasized the importance of infrastructure at Chennai-Bengaluru area, and Japan informed to provide withfinancial and technical support for the preparation of the comprehensive master plan for this area.
Based on the request from GOI to formulate “Infrastructure Development Program for Chennai-BengaluruIndustrial Corridor” (the Program), GOI and JICA agreed to develop “Comprehensive Regional PerspectivePlan for Chennai-Bengaluru Industrial Corridor Region,” (the Perspective Plan) in May 2013. In addition tothe development of the Perspective Plan, the Program consists of: (ii) feasibility studies for prioritizedinfrastructure projects; (iii) development of infrastructure; (iv) technical assistance for performanceimprovement support.
JICA hired a consortium for the preparation of the Perspective Plan and a consortiumprepared this report withconsultation of related stakeholders and JICA.
1.1.2 ObjectiveThe basic understanding of the study framework is the following.
Aim and Objectives of the Consulting Assignment:
• To prepare a Comprehensive Regional Perspective Plan for the Chennai-Bengaluru Industrial CorridorRegion, along with developing Strategy for transforming the region into a globally competitive investmentdestination
• Identify suitable nodes to be taken up for industrial development within the project influence area (statesof Karnataka, Andhra Pradesh and Tamil Nadu) and prepare Master Plan and Development Plan for atleast two selected Industrial nodes (amongst the various nodes identified under the study)
Target Year:
• The Master Plan will cover 20 years, during 2013-2033.
Target Area:
• Target of the study would be an Influence Area spread across the States of Karnataka, Andhra Pradesh andTamil Nadu, along the corridor between Chennai-Bengaluru (around 560 km).
1.2 Counterparts InvolvedMain counterparts include Department of Industrial Policy and Promotion (DIPP) of Ministry of Commerceand Industry and three State Governments, Government of Tamil Nadu, Karnataka, and Andhra Pradesh. Thestudy team consults with related Ministries, including Ministry of External Affairs, Finance, Shipping, Railways,Civil Aviation, Road Transport and Highways, Power, Environment and Forests, and related agencies, such asNHAI.
It was agreed between GOI and GOJ that the Monitoring Committee is established to monitor the studyprogress. The Monitoring Committee is chaired by Prime Minister’s Office of at India and Embassy of Japanwith the structure described in the chart below.

Final Report – Comprehensive Regional PlanPwC/ Nippon Koei 16
In addition, a monthly meeting is held between DIPP and JICA to update and share the progress of the study.
1.3 Scope of Work
1.3.1 Overall scope of workGOJ and GOI agreed with the detail scope of the work and structure is summarized below. The scope of work isdivided to two parts which correlates to the study objectives. Part A aims to prepare comprehensive regionalperspective plan for CBIC region, which is assumed to be conducted in about 6-8 months, during October 2013-March 2014. The main steps include (i) defining the delineation of the Corridor; (ii) reviewing industry andinfrastructure; (iii) short listing of nodes; and (iv) developing a comprehensive regional plan.
Part
Table 1.3.1: Scope of work of the study
Part A:Preparation of ComprehensiveRegional Perspective Planfor CBIC Region
(6-8 months)
1. Define delineation of the Corridorand its influence area
2. Identify the macro leveldevelopment vision and target forthe corridor
3. Evolve the industrial developmentplan in the CBIC region
4. Identify potential nodes for futuredevelopment
5. Recommend development of theregional infrastructure
6. Develop phasing plan andcomprehensive regional perspectiveplan
Part B:Preparation of Concept MasterPlan and Development Planfor two Industrial Nodes
(10-12 months)
1. Conduct market potential and criticalgap assessment study of industries andinfrastructure
2. Evolve concept master plan by sectorwith block cost estimates
3. Prepare development plan for theindustrial node
Table 1.2.1: Related stakeholders and supporting agencies

Final Report – Comprehensive Regional PlanPwC/ Nippon Koei 17
After the completion of Part A, GOJ and GOI will agree on the selection of two nodes for the further study underPart B. Part B aims to prepare a concept master plan and development plan for two nodes in about 10-12months. The detail work plan will be developed by the study team at the beginning of Part B, April 2014.
1.3.2 Coverage of the Interim ReportThis Interim Report 2 (ITR2) covers the conclusion of Part A of the study. Possible industry developmentscenario and shortlist of nodes were developed after a series of the analyses and consultation meeting with StateGovernments and a comprehensive regional plan was developed.
The main contents of the reports and indicative timeline are summarized in the table below.
Main Reports Main Contents IndicativeTimeline
Review byMonitoringCommittee
Part AInceptionReport
• Plan and Deliverables October 2013 ✓
InterimReport 1
• Regional profiling• Industry potential analysis• Infrastructure study• View on broad locations for
industrial nodes
December 2013 ✓
Sub-interimnote
• Shortlists of nodes January 2014 ✓
InterimReport 2
• Phasing Plan• Comprehensive Regional
Plan
March 2014 ✓
Part BInceptionReport
• Plan and Deliverables April 2014
InterimReport 3
• Concept Master Plan ofnodes with block costestimates
July 2014 ✓
Draft FinalReport
• Development plan of Nodes December 2014 ✓
Table 1.3.2: Contents and timelines of the report

Final Report – Comprehensive Regional PlanPwC/ Nippon Koei 18
2 Regional Profiling of theCorridor
2.1 Socio Economic profiling of the corridorThe CBIC region is composed of parts of 3 states, Tamil Nadu, Karnataka and Andhra Pradesh. Delineation ofthe region is basically along district administrative boundary; however, in Anantapur and Nellore districts inAndhra Pradesh state, they are under discussion how large the parts of these districts will be components of theregion. At the stage of 1st Interim report issued on December 6 2013, the south part of Nellore and south west ofAnantapur would be regarded as potential CBIC region so that at this section, we reviewed socio-economicparameters of 7 districts of Tami Nadu state, 7 district of Karnataka state, 1 district and also 2 parts of district ofAndhra Pradesh state.
Source: PwC Analysis
Figure 2.1.1: Overview of Corridor influence zone

Final Report – Comprehensive Regional PlanPwC/ Nippon Koei 19
Table 2.1.1: Districts under the corridor influence
Districts coveredTamil Nadu Karnataka Andhra Pradesh
1. Chennai2. Tiruvallur3. Kancheepuram4. Tiruvannamalai5. Vellore6. Dharmapuri7. Krishnagiri
8. Bengaluru (urban andrural)
9. Ramnagara10. Kolar11. Chikkaballapura12. Tumkur13. Chitradurga
14. ChittoorPotential area
15. South part of Nellore16. South west part of
Anantapur
Table 2.1.2: Area of the CBIC region
State CBIC districts Area covered(Sq. Km)
Tamil Nadu Chennai 175
Thiruvallur 3,394
Kancheepuram 4,483
Tiruvannamalai 6,188
Vellore 6,075
Dharmapuri 4,497
Krishnagiri 5,129
Karnataka Bengaluru 2,196
Bengaluru rural 2,298
Ramanagara 3,516
Kolar 3,979
Chikkaballapura 4,244
Tumkur 10,597
Chitradurga 8,436
Andhra Pradesh Chittoor 15,152
Nellore 6,400
Anantapur 4,300
Total CBIC 91,059
All India 3,166,414
CBIC as a % of India 2.9%
Source: Census 2011
2.1.1 Population and related parameters
2.1.1.1Total populationAccording to Census 2011, the total population of India is 1,210.57million, while that of the CBIC region is47.53million. Compared with 2001, the total population of India has increased by 17.69% from 1,028.61 to1,210.57million while that of the CBIC region was 26.60% from 37.54 to 47.53million. It clearly indicates thepopulation growth speed of CBIC region for the last decade has been greater than that of all India.

Final Report – Comprehensive Regional PlanPwC/ Nippon Koei 20
The most populated district is Bengaluru which has 9.62 million (20.24% of the CBIC region) in 2011. Chittoorn Andhra Pradesh state and Chennai in Tamil Nadu state, the 2nd populated districts in the region, haverespectively over 4 million. Also the 3 eastern districts in Tamil Nadu, Tiruvallur, Kancheepuram, and Vellore,have a population of over 3.5 million respectively despite their relatively smaller areas. It could be suggestedthat east coast districts closer to the Bay of Bengal are populous area rather than inland area except Bengalurudistrict.
2.1.1.2 Density, gender balance and urbanization ratioAverage density of the CBIC region is 464 persons per Sq. km as per census 2011. The density map abovetypically suggests that the density of Chennai in Tamil Nadu state and Bengaluru in Karnataka state areenormously higher dense than the other district.
Also it can be suggested that in the eastern side of the CBIC region, Tiruvallur, Vellore and Kanchipuramdistricts in Tamil Nadu states nearer the Bay of Bengal are populous and dense which is higher than the averageof the CBIC region.
Source: PwC, NK Analysis, data from respective state governments
Figure 2.1.2: Breakup of population along corridor region

Final Report – Comprehensive Regional PlanPwC/ Nippon Koei 21
Between Chennai and Bengaluru districts, the ones along NH-4 (one of the alignments in CBIC) tend to bedenser than the other districts. Especially the inland or north districts of CBIC region are less dense than NH-4between Chennai and Bengaluru.
Figure 2.1.3: Density in the CBIC region

Final Report – Comprehensive Regional PlanPwC/ Nippon Koei 22
The gender balance indicates as district-wise number of females per thousand males. Average gender balance inthe CBIC region is 971. This figure shows better balance than all India which is 943 as per Census 2011.Bengaluru is the only district which has a lower gender balance of 916 which is below the national threshold.Bengaluru Rural and Dharmapuri districts have relatively lower gender balance in the CBIC region, both ofthem indicate 946. The other districts account for a gender balance of over 970.
Source: PwC, NK Analysis, data from respective state governments
Figure 2.1.4: Breakup of population along corridor region

Final Report – Comprehensive Regional PlanPwC/ Nippon Koei 23
Urbanization ratio is percentage of urban population to total population. The terms urban or rural is definedwith respect to minimum administrative unit of village or town. The all India urbanization ratio is 31.15%, whilethat of the CBIC region is 51.17%. Chennai and Bengaluru, which are two most populous districts in Karnatakastate and Tamil Nadu state respectively, are the most urbanized districts in the CBIC region. Additionally, ineastern area, the districts of Tiruvallur and Kanchipuram have an urbanization ratio over 60%. The other inlanddistricts such as Dharmapuri in Tamil Nadu and Chitradurga in Karnataka are under the average urbanizationratio of the CBIC region.
Source: PwC, NK Analysis; data from respective state governments
Figure 2.1.5: Gender balance in the CBIC region

Final Report – Comprehensive Regional PlanPwC/ Nippon Koei 24
2.1.1.3 Scheduled Caste & Scheduled TribeIt is important to study demographic distribution of Scheduled Caste (SC) and Scheduled Tribe (ST) in thisregion from the perspective of achieving inclusive growth in the CBIC region.
The SC and ST ratio of all India are 16.63% and 8.61% respectively, while average SC and ST ratio of the CBICregion is 18.80% and 3.76%. The SC ratio in Kolar district is the highest at 30.32%, while Bengaluru accountsfor the lowest of 12.46%. The ST ratio of Chitradurga district, 18.23% is the highest in this region, and that ofChennai, 0.22%, is the lowest. Districts with high or low SC ratio are randomly spread in the region, and there isno suggestion for the trend of SC ratio from the map. On the other hand, ST ratio in south eastern areas of theCBIC region is relatively low compared with other areas such as the north western areas where the ratio isrelatively high.
Source: PwC, NK Analysis; data from respective state governments
Figure 2.1.6: Urbanization ratio in the CBIC region

Final Report – Comprehensive Regional PlanPwC/ Nippon Koei 25
Source: PwC, NK Analysis; data from respective state governments
Figure 2.1.8: Scheduled Tribes in the CBIC region
Source: PwC, NK Analysis; data from respective state governments
Figure 2.1.7: Scheduled Caste in the CBIC Region

Final Report – Comprehensive Regional PlanPwC/ Nippon Koei 26
2.1.1.4 Literacy rateThe following map shows literacy rate which is the ratio of literate persons to total population except the agegroup of 0-6 years. It could be suggested that industries generally would tend to be aggregated in and aroundareas with relatively high literacy rates. The average literacy rate of all India is 72.99%, and that of the CBICregion is 78.27%. The places where many foreign enterprises have been invested, especially Chennai andBengaluru, have high literacy rates of over 85%. The high average of literacy rate of the CBIC region, comparedto that of all India, suggests that the region has high potential to incubate industries from foreign countries.Also these districts have a large number of educational and skill development institutions. The Corridor is hometo about 2,500 graduate and higher education institutions, which constitute about 47% of such institutions inTamil Nadu and Karnataka states in total. Particularly, Bengaluru district is an educational institution hub inIndia with presence of leading educational institutions such as the Indian Institute of Science (IISc.), IndianInstitute of Management and many other leading educational institutions.
2.1.1.5 Workers ratioThe workers1 ratio is caluculated as percentage of workers to total population except age 0-6 group2.
The average workers ratio in India is 46.05% as per census 2011, and that of the CBIC region is 50.81%. Theworkers ratio in the districts of Tiruvallur and Kanchipuram (46.29% and 46.93% respectively) is slightly over
1As per the Census of India, “Main workers” are defined as “those workers who had worked for the major part of the reference period (i.e. 6months or more)”, and “Marginal workers” are defined as “those workers who had not worked for the major part of the reference period (i.e.less than 6 months)”. Only difference of these workers are the working period in the referencing dates for census, so that Main andMarginal workers are both regarded as workforce.2 Further classification of population by age is not available through Census 2011
Source: PwC, NK Analysis; data from respective state governments
Figure 2.1.9: Literacy rate in corridor region

Final Report – Comprehensive Regional PlanPwC/ Nippon Koei 27
the average of the CBIC region. The inland districts of the CBIC region appear to have high workers ratiocompared to the eastern area of the CBIC region.
Map xx: Workers Ratio in CBIC region
2.2 GDP growth
2.2.1 Future population GrowthThe objective of this chapter is to explore future population of each district within CBIC area until 2033. Thisprojected future population is utilized to estimate required capacity of infrastructure, such as road, railway, port,airport, logistics, water, solid waste management and so on.
In 2006, the population growth of India by State from 2001 to 2026 was forecasted by The Office of TheRegister General & Census Commissioner India based on fertility, mortality and migration rates of India alongwith universally accepted way3. The working group made assumptions on fertility rate, mortality rate, andvarious factors and then projected future population.
The above mentioned projection is used as the basis of the future population projection up to 2033 under thisstudy with the adjustment based on actual demographic data of the latest census, which was conducted in 2011.In addition,
3 http://gujhealth.gov.in/pdf/projection_report.pdf
Source: PwC, NK Analysis; data from respective state governments
Figure 2.1.10: Worker ratio in corridor region

Final Report – Comprehensive Regional PlanPwC/ Nippon Koei 28
Future population was calculated by sub-district from 2013 to 2033 for 20 years under Business As Usualscenario (BAU) and Business in Induced Scenario (BIS) according to the GDP growth scenario defined underSection 2.2.1.
Followings are the result of future population projection in CBIC area.
All CBIC
Table 2.2.1: Total Population-All CBIC
Regarding to future population of all CBIC area until 2033 under BIS, the population will increaseby 47% from 54,464 thousand in 2013 to 79,182 thousand in 2033. The compound averagepopulation growth rate from 2013 to 2033 is estimated as 1.89%, which is slightly higher thanactual growth rate from 2001 to 2011 of 1.82%.
On the other hand, the average growth rate from 2013 to 2033 under BAU scenario is estimated as1.37%. In 2033, population will reach at 70,432 thousand, the level which will be achieved in 2026under BIS.
54,464
79,182
53,943
70,432
50,00055,00060,00065,00070,00075,00080,00085,000
20
13
20
14
20
15
20
16
20
17
20
18
20
19
20
20
20
21
20
22
20
23
20
24
20
25
20
26
20
27
20
28
20
29
20
30
20
31
20
32
20
33
Total Population - All CBIC
All CBIC BIS
All CBIC BAU
0
10,000
20,000
30,000
40,000
50,000
60,000
70,000
80,000
90,000
2013BAU
2013ACCE
2018BAU
2018ACCE
2023BAU
2023ACCE
2033BAU
2033ACCE
Total Population - All CBIC breakdown
Nellore
Anantapur
Chittoor
Chitradurga
Tumkur
Kolar, Chikkaballapura
Bangalore rural, Ramanagara
Bangalore
Dharmapuri, Krishnagiri
Vellore
Tiruvannamalai
Kancheepuram
Thiruvallur
Chennai

Final Report – Comprehensive Regional PlanPwC/ Nippon Koei 29
The followings are population projection for each district;
Tamil Nadu State
Table 2.2.2 : Population of each district in Tamil Nadu state
Total population of these 7 districts are estimated to increase from 23,345 thousand in 2013 to30,718 thousand in 2033by 32%. According to the actual data on Census 2011, the population ofthese 7 districts account for 42% of CBIC area. In 2033, the share of the population in CBIC area isassumed to increase to 45%.The average population growth rate from 2013 to 2033 is estimated at2.17%, which is higher than actual State average growth rate from 2001 to 2011 of 1.82%.
Kancheepuram district and Tiruvallur district are estimated to show the highest population growthrate until 2033 based on the actual data during 2001-2011. In Kancheepuram District, populationis estimated to increase in almost double from 4,367 thousand in 2013 to 8,694 thousand in 2033and in Tiruvallur district, population is estimated to increase by 89% from 4,051 thousand in 2013to 7,648 thousand in 2033.
4,816
5,669
4,686
4,979
4,500
4,700
4,900
5,100
5,300
5,500
5,700
5,900
20
13
20
15
20
17
20
19
20
21
20
23
20
25
20
27
20
29
20
31
20
33
Total Population - Chennai
ChennaiBIS
ChennaiBAU
4,051
7,648
3,941
6,716
3,800
4,800
5,800
6,800
7,800
8,800
20
13
20
15
20
17
20
19
20
21
20
23
20
25
20
27
20
29
20
31
20
33
Total Population - Thiruvallur
Thiruvallur BIS
ThiruvallurBAU
4,367
8,694
4,249
7,635
4,000
5,000
6,000
7,000
8,000
9,000
20
13
20
15
20
17
20
19
20
21
20
23
20
25
20
27
20
29
20
31
20
33
Total Populaiton - Kancheepuram
Kancheepuram BIS
Kancheepuram BAU 2,536
3,335
2,512
2,966
2,300
2,500
2,700
2,900
3,100
3,300
3,5002
013
20
15
20
17
20
19
20
21
20
23
20
25
20
27
20
29
20
31
20
33
Total Population - Tiruvannamalai
Tiruvannamalai BIS
Tiruvannamalai BAU
4,054
5,372
4,015
4,779
3,800
4,300
4,800
5,300
5,800
20
13
20
15
20
17
20
19
20
21
20
23
20
25
20
27
20
29
20
31
20
33
Total Population - Vellore
VelloreBIS
VelloreBAU
3,520
5,120
3,487
4,555
3,200
3,700
4,200
4,700
5,200
5,700
20
13
20
15
20
17
20
19
20
21
20
23
20
25
20
27
20
29
20
31
20
33
Total Population - Dharmapuri,Krishnagiri
Dharmapuri,KrishnagiriBIS
Dharmapuri,KrishnagiriBAU

Final Report – Comprehensive Regional PlanPwC/ Nippon Koei 30
Chennai District, where is the most populated area among these 7 districts in Census 2011, isestimated to have less population increase than the above two districts due to the high density. Asper census 2011, the density of Chennai District in 2011 was 26,553 people per square km, whichwas prominently high in the CBIC region. The density of the district of second highest density,Bangalore in Karnataka state, was 4,381 people per square km.
Karnataka State
Table 2.2.3 : Population of each district in Karnataka state
In 2023, Bangalore urban area is estimated to reach urbanization of 100%. Population inflow intoBangalore urban would be forecasted to slow down and the population would tend to spread out todistricts around Bangalore urban.
Total population of these 7 districts will increase by 46% and is estimated to reach at 28,873thousand in 2033, of which 60% will be in Bangalore.
According to the Census 2011, the population of these 7 districts account for 36% of that of CBICarea. In 2033, the share of population in CBIC region will be about 36% as well. The average
10,445
17,593
10,345
15,649
10,000
12,000
14,000
16,000
18,000
20
13
20
15
20
17
20
19
20
21
20
23
20
25
20
27
20
29
20
31
20
33
Total Population - Bangalore
BangaloreBIS
BangaloreBAU 2,124
2,650
2,104
2,357
2,000
2,200
2,400
2,600
2,800
20
13
20
15
20
17
20
19
20
21
20
23
20
25
20
27
20
29
20
31
20
33
Total Population - Bangalore rural,Ramanagara
Bangalorerural,RamanagaraBIS
Bangalorerural,RamanagaraBAU
2,859
3,558
2,832
3,165
2,500
2,700
2,900
3,100
3,300
3,500
3,700
20
13
20
15
20
17
20
19
20
21
20
23
20
25
20
27
20
29
20
31
20
33
Total Population - Kolar,Chikkaballapura
Kolar,ChikkaballapuraBIS
Kolar,ChikkaballapuraBAU
2,711
2,989
2,685 2,659
2,400
2,500
2,600
2,700
2,800
2,900
3,000
3,100
20
13
20
15
20
17
20
19
20
21
20
23
20
25
20
27
20
29
20
31
20
33
Total Populationi - Tumkur
TumkurACCE
TumkurBAU
1,697
2,083
1,681
1,853
1,500
1,600
1,700
1,800
1,900
2,000
2,100
2,200
20
13
20
15
20
17
20
19
20
21
20
23
20
25
20
27
20
29
20
31
20
33
Total Population - Chitradurga
ChitradurgaBIS
ChitradurgaBAU

Final Report – Comprehensive Regional PlanPwC/ Nippon Koei 31
population growth rate from 2013 to 2033 is estimated as 1.89%, which is lower than actual Stateaverage growth rate from 2001 to 2011 of 2.26%.
Andhra Pradesh state
Table 2.2.4 : Population of each district in Andhra Pradesh state
Total population of these 3 districts is estimated to increase by 23% from 11,517 thousand in 2013to 14,751 thousand in 2033. According to the Census 2011, the population of these 3 districtsaccount for 20% of that of CBIC area and expected to slightly decrease to 19% in 2033. The averagepopulation growth rate from 2013 to 2033 is estimated at 1.25%, which is higher than actual Stategrowth rate from 2001 to 2011 of 1.10%.
As for the districts of Chittoor and Anantapur, the population is estimated to increase over 1,000thousand people during 20 years by 2033. Population in Chittoor and Anantapur Districts areexpected to increase by 28% from 4,284 thousand in 2013 to 5,472 thousand in 2033, and by 29%from 4,194 thousand to 5,422 thousand, respectively. The relatively low density of population atthe area expected to allow some room for future population increase.
The table below shows the summary of population projection of each district in 2013, 2018, 2023 and 2033. Thepopulation of 2011 was actual data from Census 2011.
4,284
5,472
4,243
4,868
4,0004,2004,4004,6004,8005,0005,2005,4005,600
20
13
20
15
20
17
20
19
20
21
20
23
20
25
20
27
20
29
20
31
20
33
Total Population - Chittoor
ChittoorBIS
ChittoorBAU
(Unit: thousand people)
4,194
5,422
4,153
4,823
4,0004,2004,4004,6004,8005,0005,2005,4005,600
20
13
20
15
20
17
20
19
20
21
20
23
20
25
20
27
20
29
20
31
20
33
Total Population - Anantapur
AnantapurBIS
AnantapurBAU
3,039
3,856
3,010
3,430
2,800
3,000
3,200
3,400
3,600
3,800
4,000
20
13
20
15
20
17
20
19
20
21
20
23
20
25
20
27
20
29
20
31
20
33
Total Population - Nellore
NelloreBIS
NelloreBAU

Final Report – Comprehensive Regional PlanPwC/ Nippon Koei 32
Table 2.2.5 : District wise population projection
(in 000) Actual Projected Projected Projected Projected
State District Level 2011 2013 2018 2023 2033
TN
Chennai District 4,647 4,816 4,946 5,144 5,597
Thiruvallur District 3,728 4,051 4,680 5,477 7,550
Kancheepuram District 3,998 4,367 5,113 6,063 8,583
Tiruvannamalai District 2,465 2,536 2,722 2,907 3,335
Vellore District 3,936 4,054 4,359 4,664 5,372
Dharmapuri, Krishnagiri District 3,387 3,520 3,874 4,243 5,120
KA
Bangalore District 9,622 10,445 12,808 15,185 17,593
Bangalore Rural, Ramanagara District 2,074 2,124 2,253 2,373 2,650
Kolar, Chikkaballapura District 2,792 2,859 3,031 3,190 3,558
Tumkur District 2,679 2,711 2,788 2,847 2,989
Chitradurga District 1,659 1,697 1,793 1,881 2,083
AP
Chittoor District 4,174 4,284 4,567 4,849 5,472
Nellore District 2,964 3,039 3,235 3,429 3,856
Anantapur District 4,081 4,194 4,485 4,776 5,422

Final Report – Comprehensive Regional PlanPwC/ Nippon Koei 33
3 Investment Environment ofCBIC
The purpose of this chapter is to describe strength and weakness of CBIC as a global investment destinationthrough statistical comparison with rival countries/regions, as well as investors’ view on the ground. As to theformer, quantitative analysis of 12 countries will be conducted at each level of country, state and city. As for thelatter, the comparative advantages/disadvantages as well as bottlenecks will be clarified based on qualitativeanalysis through the result of interview surveys to Japanese companies those already operating in CBIC on theground.
3.1 Quantitative Assessment–Comparative Analysis withOther Countries/Regions
3.1.1 Country Level Comparison
(1) Selection of Competitors
According to the latest World Investment Report published by UNCTAD, the following countries are nominatedas the most promising investment destinations founded on the interview survey to globally influential investors.
OECD: US, Germany, UK, Japan, Australia, France, Canada
BRICS: Brazil, Russia, India, China, South Africa
Growing Asia: Indonesia, Thailand, Malaysia and Philippines
Emerging G20: Turkey, Mexico
Above all, USA and China outstandingly attract investor’s attention. Then India is following ranked at the 3rd
position. For the comparative analysis, the 12 countries, i.e., the countries listed above except OECD, aredefined as the competitors of India.
Figure 3.1.1: Top Prospective Host Economies (2013-2015)
0 10 20 30 40 50 60
PhilippinesTurkeyCanadaFrance
MalaysiaSouth Africa
PolandAustraliaRussian
Viet NamJapan
U.K.Thailand
MexicoGermany
BrazilIndonesia
IndiaUS
China
Source: World Investment Report 2013 by UNCTADUnit: Number of Companies

Final Report – Comprehensive Regional PlanPwC/ Nippon Koei 34
The 12 countries have similarities in their large population and GDP scale, as well as high growth rate.According to Harvard University & MIT estimation, those countries occupy one third of world’s GDP in 2020.China is the largest country among them and occupies 14% of world total. India is placed at the 2nd position (4th
in world total) and occupies 4.9%.
Figure3.1.2: Expected contribution to World GDP growth (2020 estimated)
(2) Comparison of Economic Scale and Growth Potential
In order to overview their economic condition, 1) GDP scale, 2) GDP growth rate and 3) global share of GDP areto be reviewed. China shows outstanding performance in all parameters. The other countries can be dividedinto the following two groups; 1) small scale and high growth mostly from Asia, 2) large scale and low growthmostly from BRICS. This explains more or less a historical theory of Economics that marginal growth ratedecreases over the time. However, China has been succeeded in increasing the economic scale and marginalgrowth rate simultaneously by the continuous innovation and renovation of economic structure. Indonesia alsoshows similar performance to China.
14.2%
4.9%
China (2nd)
India (4th)
Brazil (8th)
Mexco (10th)
Russia (14th)
Turkey (15th)
Indonesia (16th)
Thailand (21st)
Malyaisia (26th)
South Africa (28th)
Philippines (30th)
Viet Nam (49th)
OtherSource: Harvard & MIT

Final Report – Comprehensive Regional PlanPwC/ Nippon Koei 35
Figure3.1.3: India’s Position: GDP Scale, Growth and Share in the world (2012)
Comparison of long term growth rate clearly illustrates the China’s outstanding position. The economic scale ofChina is currently almost 4 times as big as the rest of 11 countries, although they were still at a same level ofgrowth in 1990. China has “taken off” to a country which could produce and trade high value added goods andservices, through structural change of the economy, industry and trade thanks to the strong leadership of theGovernment as well as innovations by the private sector. China has gained premier status of the best globalinvestment destination through realising virtuous cycle between the expansion of global share and the increaseof global investment incubation. While India has been stacking into a vicious cycle often cited as the “middleincome trap,” same as the other countries except China. She still follows traditional track of economicdevelopment.
Figure3.1.4: Long-term GDP Growth (Past 20 Years)
Brazil
China
India
Indonesia
Malaysia
Mexico
Philippines
Russia
South Africa
Thailand
Turkey
Vietnam
0
1
2
3
4
5
6
7
8
9
10
0.0 0.1 0.2 0.3 0.4 0.5 0.6 0.7 0.8 0.9
Source: IMF
India
China

Final Report – Comprehensive Regional PlanPwC/ Nippon Koei 36
Prospect for the future growth of India seems to be bright. According to IMF estimation, India will rapidlyincrease the GDP growth rate and share in the world in 2018, despite the fact that the composition of othercountries does not change significantly. This also implies economic transformation is underway in India. Inaddition, the positive outlook of reliable international institutions, such as IMF, encourages higher expectationof investors and thus enhances the attractiveness of CBIC/India as a global investment destination.
Figure3.1.5: GDP Scale, Growth and Share in the world (2018)
Another key factor that global investors expect future growth of India is the originality of the industrial growthmodel. India’s historical process of industrial development after 1990s is quite different from that China ordeveloped countries has experienced in the past. The industries of those countries has tended to grow in thefollowing 5 orders; 1) agriculture, 2) light industry, 3) heavy industry, 4) service and logistics industry, 5) ITindustry. However, in India, the 5thstage industry, i.e., IT and software, developed at first and the same timewith others. Then it has been encouraging the development of other industries through playing a role of catalystfor upgrading the industry and economy. This shows a new growth model that cannot be explained by the5stage theory of economic development by WW Rostow, which has been told to traditional dogma. In the theory,development occurs from traditional society consisting of agricultural production. After following the steps andreaching take-off stage, a country finally reached at an advanced mass consumption society. The India typegrowth model has been received as innovation in the history of the world economic growth by global investors,and led to their great expectations for the future.
However, it cannot be said that the investment climate in the field of India is as good as the expectation.Enhancement of investment climate is required for CBIC in order to fulfil the gap between the reality and theexpectations. Through the development of the industrial cluster and generation of innovations, intensivedevelopment areas, especially CBIC, is expected to be a detonator of the innovative changes of economicstructure of India through fostering industrial clusters.
(3) India’s Global Competitiveness
India’s major global competitiveness comes from its tremendous market size. At present, India holds over 1.2billion population and is one of the top 2 largest populated counties. In addition, in 2033, the target year of theMaster Plan, the population will increase up to 1.4 billion and become the world’s largest exceeding China.Furthermore, according to OECD estimation, in 2050, Indian will occupy two thirds of middle income
Brazil
China
India
Indonesia
Malaysia
Mexico
Philippines
Russia
South Africa
ThailandTurkey
Vietnam
2
3
4
5
6
7
8
0.0 0.2 0.4 0.6 0.8 1.0 1.2 1.4
Source: IMF

Final Report – Comprehensive Regional PlanPwC/ Nippon Koei 37
population in the world. The share is top in the world, and exceeds that of Chinese taking one fifth and being atthe 2nd position. Given the future estimates, most of global investors consider their presence in Indian marketwill critically affect the core part of their global strategy. That is the key driver for them to invest in CBIC at themoment.
Figure3.1.6: World Population and Share of India
In terms of per capita GDP, India is ranked at the lowest level in the world. This means less than one third ofChina. China is also categorized as a country in lower group, but continues the steady growth exceeding rivalcountries in Asia, such as Thailand, Indonesia, Philippines and Vietnam.
The per capita GDP indicates purchasing power of the market as well as wealth of the people in the country. Amarket consisting of people with low purchasing power tends to be occupied by low quality and costtransactions. Global companies which consider investment in India are forced to take a strategy to lower thequality and technology level of product in order to secure certain competitiveness in the price. In such case,efficiency in industry and commerce is enhanced, but transactions of high value added goods and services arenot increased. As a result, high growth as China has experienced is rarely occur.

Final Report – Comprehensive Regional PlanPwC/ Nippon Koei 38
Figure3.1.7: Current GDP per capita (2012)
According to Global Competitiveness Index (GCI) of World Economic Forum, the targeted 12 countries areevaluated as high level in terms of the overall global competitiveness. However, India is placed at the bottomlevel. Looking into details, India shows comparative advantage in the aspect of market size and degree offinancial market development. On the other hand, it is ranked at low level in the degree of infrastructurereadiness, macroeconomic environment development, availability of health, primary and higher education andtraining, and technological readiness. In addition, the report evaluates India as the lowest stage economy in the5 category of 1) factor driven, 2) efficiency transition, 3) efficiency driven, 4) innovation transition, and 5)innovation driven.
Figure3.1.8: Global Competitiveness Index Ranking (2013-2014)
GCI has the details in each of 12 main indicators shown in the above figure. The contents which received thehigh/low evaluation (higher and lower 30th in all 148 countries) are shown below.
0
2,000
4,000
6,000
8,000
10,000
12,000
14,000
16,000
US
D
Source: WDI

Final Report – Comprehensive Regional PlanPwC/ Nippon Koei 39
Table 3.1.1: Global Competitiveness Index Ranking in Detail (Rank out of 148 countries)
Parameter Pros Cons
1. Institution - -
2. Infrastructure Available airline seat 13
Quality of railroad infrastructure 19
Mobile telephone subscriptions 123
Fixed telephone lines 148
3. MacroeconomicEnvironment
Gross National Savings 28 Government budget balance 141
Inflation 130
4 Health and PrimaryEducation
- Infant mortality 120
5 Higher Educationand Training
Quality of management schools 30 -
6 Goods MarketEfficiency
Intensity of local competition 24
Extent of market dominance 26
Effectiveness of anti-monopoly policy 29
Total tax rate 128
No. of procedures to start business 129
Trade tariffs 128
7 Labour MarketEfficiency
- Women in labour force 137
8 Financial MarketEfficiency
Financing through local equity market 18
Venture capital availability 27
Regulation of securities exchanges 27
Legal rights 28
-
9 TechnologicalReadiness
- Individuals using internet 120
10 Market Size Domestic Market size and GDP 3
Foreign Market size 4
Exports as a percentage of GDP 125
11 BusinessSophistication
Local supplier quantity 2
State of cluster development 16
-
12 Innovation Availability of scientists and engineers 15 -
(4) Business Environment of India
World Bank is publishing “Doing Business” report for the comparative evaluation of investment climate atcountry level in all over the world. According to the report, India is ranked at the lowest position in the 12 targetcountries as well as at 134th in the all 183 countries in the category of “Ease of Doing Business” which showsaccumulation of all evaluation indicators. Especially, India is inferior in the ease of starting business, dealingwith construction permits, paying taxes, trading across borders, and enforcing contract. On the other hand, it isprior in the ease of getting credit and protecting investors.

Final Report – Comprehensive Regional PlanPwC/ Nippon Koei 40
Figure3.1.9: Doing Business Global Ranking (2012)

Final Report – Comprehensive Regional PlanPwC/ Nippon Koei 41
3.1.2 State and City Level Comparison(1) Scale of Market and FDI Inflow
This chapter deals with “state” and “city” level comparative analysis for CBIC’s investment climate. It definesCBIC as the accumulation of Tamil Nadu, Karnataka and Andhra Pradesh States at the state level, and Chennaiand Bangalore at the city level. First of all, it goes through the data of per capita GDP in order to sense a degreeof purchasing power of people in the market. In all states in India, Goa and Delhi States show goodperformance. It tends to be high in the states with major cities, and low in the states with large rural area. The 3states in CBIC are included in the high score group. CBIC can be said as one of the promising markets in India,which consists of people who holds certain purchasing power.
Figure3.1.10: Per Capita Income at Current Prices (2010-11)
As to FDI inflow, Mumbai and Delhi show outstanding performance on the city level comparison. Chennai andBangalore are following the top 2 cities, but Mumbai is collecting 4 times as much FDI as the 2 cities in CBIC.The total of 2 states in DMIC is 3 times as much as that of 2 states in CBIC. As a result, it can be said that CBICcan be evaluated as one of the promising global investment destinations, but currently lagging far behind thedomestic rival, DMIC.
0 20000 40000 60000 80000 100000 120000 140000 160000 180000
BiharUttar Pradesh
ManipurAssam
JharkhandMadhya Pradesh
Jammu & KashmirOrissa
ChattisgarhRajasthan
TripuraMeghalaya
West BengalMizoram
NagalandArunachal Pradesh
KarnatakaAndhra Pradesh
Himachal PradeshPunjabKerala
UttarakhandGujarat
Tamil NaduMaharashtra
HaryanaSikkim
DelhiGoa
Rs.Source: Economic Survey of Karnataka 2012-13

Final Report – Comprehensive Regional PlanPwC/ Nippon Koei 42
Figure3.1.11: Received FDI Equity (April 2000 - November 2013)
(2) Business Environment of CBIC
According to the investment climate survey of World Bank for 17 major cities in India, the 2 cities in CBIC areranked at the lowest level in terms of ease of doing business, which means aggregate evaluation of investmentclimate. Chennai is placed in the 15th position. It is inferior to the other cities in the criteria of registeringproperty and paying taxes. Bangalore is ranked at the 13th position. It has weakness in starting business, payingtaxes, and enforcing contracts. While both cities receive high evaluation in terms of dealing with constructionpermits and trading across borders mainly thanks to the volume of construction works and import/export dueto the rapid growth in infrastructure development and industrial clusters.
Figure3.1.12: Doing Business Ranking in India (Latest-2009)
The dealing with construction permits is pointed out as a comparative advantage of CBIC in domesticcomparison, but is not actually competitive if includes other countries. India, including the 2 cities in CBIC, is
0 50000 100000 150000 200000 250000 300000350000
Panta
Guwahati
Bhubaneshwar
Kanpur
Jaipur
Panaji
Kochi
Bhopal
Chandigarh
Kolkata
Hyderabad
Ahmedabad
Bangalore
Chennai
New Delhi
Mumbai
Rupees in crores Source : GOI - FACT SHEET ON FDI

Final Report – Comprehensive Regional PlanPwC/ Nippon Koei 43
categorised as the expensive group. ASEAN countries, i.e., Indonesia, Malaysia, Thailand, Vietnam andPhilippines, are very competitive due to the historical competition for attracting foreign trade in the region.
Figure3.1.13: Dealing with Construction Permits
As for the cost and time for import, the 2 cities in CBIC are in top class in domestic comparison, andcompetitive in global comparison as well. India is not comparable to the top group of Thailand, Philippines andMalaysia, but almost equal to China, Vietnam and Indonesia. Asian countries are generally advanced in ease oftrade due to the competition in the region.
Figure3.1.14:Trading Across Borders - Import
However, regarding the export, investment climate of CBIC/India saves the cost for investors but requires moretime for the procedures. CBIC is significantly inferior to the ASEAN countries in terms of ease of export.

Final Report – Comprehensive Regional PlanPwC/ Nippon Koei 44
Figure3.1.15:Trading Across Borders – Export
Also, the ease of getting electricity for users could be said as the strength of CBIC. However, it is only true forlarge scale companies in reality.
Figure3.1.16: Getting Electricity
For the next, the analysis takes up the contents evaluated as weaknesses of CBIC, i.e., starting business, payingtaxes and enforcing contract.
India requires high cost for investors when they start a business. The environment in Bangalore isoutstandingly expensive following to the most expensive city of Mumbai. On the other hand, the other countries,e.g., China, South Africa, Thailand, Vietnam and Russia, require much lower cost than India.

Final Report – Comprehensive Regional PlanPwC/ Nippon Koei 45
Figure3.1.17: Starting a Business
The environment of paying tax in CBIC is at the worst level in all over the world. The corporate tax, which isparticularly important for foreign investors, is at very high level, i.e., 30% for domestic and 40% for foreigncompanies. In addition, V.A.T., dividend remittance tax and other taxes are also expensive.
Figure3.1.18: Tax Rates (2013)
Here are other taxes the investors are levied in CBIC.
30 30 30 30
25
0 0 0
25
0 0
34
30 30 30 30 30
35
32
35
26
45
17
28
1315
13 13
0
7
0
5
13
0 0
18
10 10 10 10
0
15
10
5
0
10
0
1315 15 15 15 15
10
15
0 0
10
0 0
10 10 10 10
0
15 15
10
0
10
5
23
-
5
10
15
20
25
30
35
40
45
50
%
Corporate Income Tax Personal Income Tax
V.A.T. Interest Remittance Tax
Dividend Remittance Tax Loyalty Remittance TaxSource: JETRO

Final Report – Comprehensive Regional PlanPwC/ Nippon Koei 46
Table 3.1.2: Direct Taxes
Name Rate Description
Corporate tax 40% Plus applicable surcharge and cess. For Domestic company - 30%.
Dividend distribution tax(DDT)
15% Plus 10% surcharge, 2% education cess, and 1% secondary and higher educationcess. A holding company does not have to pay.
Tax on buyback of shares 20% Plus 10% surcharge, 2% education cess and 1% secondary and higher secondaryeducation cess
Minimum alternate tax(MAT)
18.5%, Plus applicable surcharge and education cess. Companies whose tax payable undernormal income tax provisions is less than 18.5% of adjusted book profits.
Taxation of the know-howfee in the hands of foreigncompanies
25% Royalties or technical fees payable to non-residents with a permanentestablishment in India are taxed on a net basis. In contrast, they are taxed on agross basis in the case of non-residents without a permanent establishment in thecountry.
Taxing dividends receivedfrom overseas groupcompanies
15% Dividends received by Indian companies from specified foreign companies will betaxed
Wealth tax 1% Both on individuals as well as companies of the amount by which the ‘net wealth’exceeds 3 million INR.
Table 3.1.3: Indirect Taxes
Name Rate Description
Basic Customs Duty(BCD)
0-10% The rate of customs duty applicable to a product to be imported or exported depends onits classification under the Customs Tariff Act, 1975.
Education cess at 2% and secondary and higher education cess at 1% are also levied onthe aggregate customs duties. Additional duty of customs at 4% is charged in addition tothe above duties on imports, subject to certain exceptions. ADC is calculated on theaggregate of the assessable value of imported goods, the total customs duties (i.e. BCDand CVD) and the applicable EC and SHEC
Basic customs duty (BCD) is the basic component of customs duty levied at the effectiverate notified under the First Schedule to the CTA and applied to the landed value of thegoods (i.e. the CIF value of the goods plus landing charges at 1%) The peak rate of BCD iscurrently set at 10% for all goods other than agricultural and other specified products.However, the government has the power to exempt specific goods, wholly or in part,from the levy of custom duties. In addition, preferential or concessional rates of duty areavailable under various bilateral and multilateral trade agreements that India hasentered into with other countries.
CountervailingDuty (CVD)
12% It is charged in lieu of, the excise duty applicable on like goods manufactured in India.CVD is calculated on the landed value of goods and the applicable BCD. However, theCVD on specific consumer goods intended for retail sale is calculated on the basis of themaximum retail price (MRP) printed on their packs after allowing specified abatements.
Central ValueAdded Tax(CENVAT or ExciseDuty)
Approx.
12%
CENVAT is a tax levied by the central government on the manufacture or production ofmovable and marketable goods in India. The rate of excise duty levied on the goodsdepends on the classification of the goods under the excise tariff, which is primarilybased on the HSN classification adopted so as to achieve conformity with the customstariff. Education Cess (EC) at 2% and Secondary and higher education at 1% areapplicable on aggregate excise duties.
There are different product, industry and geographical area specific exemptions availableunder CENVAT, which present excellent business opportunities to manufacturers inIndia.
Service Tax 12% All services are taxable but for the services mentioned in the negative list.EC of 2% andSHEC of 1% of the service tax are levied on taxable services.

Final Report – Comprehensive Regional PlanPwC/ Nippon Koei 47
Name Rate Description
Central Sales Tax(CST)
2% The sale of movable goods in India is chargeable to tax at the federal or state level. TheIndian regulatory framework has granted power to state legislatures to levy tax on goodssold within that state. On the other hand, all goods sold in the course of interstate tradeare subject to the federal sales tax i.e. central sales tax (CST).
Value Added Tax(VAT)
1-20% At present, most of state-level sales tax has been replaced by VAT.VAT paid on goodspurchased within the state is eligible for VAT credit. The input VAT credit can be utilizedagainst the VAT or CST payable on the sale of goods. This ensures that the cascadingeffect of taxes is avoided and that only the value addition is taxed. Currently, there is noVAT on goods imported into India. Exports are zero rated.
Entry Tax (OctroiDuty)
n.a. Entry tax is on entry of specified goods into the state from outside the state for use,consumption or sale therein. Entry tax continues to exist under the VAT regime, thoughin certain states it has been made Viable and can be set off against the output VATliability in the state. Entry tax is levied on purchase value, which is defined as theamount of the valuable consideration paid or payable by a person for the purchase of anygoods. The value of the specified goods can be ascertained from the original invoice forpurchase of such goods. Octroi is a municipal tax levied at the time of the entry ofspecified goods into the limits of the municipal corporation. Thus, octroi can be levied ifthere is movement of goods from one city to another in the same state, in the event thecities fall under the jurisdiction of two different municipal corporations.
Stamp Duty n.a. Stamp duty is levied at various rates on documents such as bills of exchange, promissorynotes, insurance policies, contracts effecting transfer of shares, debentures andconveyances for transfer of immovable property.
Research andDevelopment Cess
5% Research and redevelopment cess of 5% is levied on all payments made for the import oftechnology. The term ‘technology’ includes import of designs, drawings, publications andservices of technical personnel.
In addition to the tax rate, procedure of paying tax is troublesome and requires time for investors. For example,the time of paying tax per year in China is 9 times, but it is 68 times in Chennai. This means India has still beentrapped in the short term and micro view on taxation that higher tax rate brings more budgets to theGovernment. This kind of superstition prevents CBIC from growing to truly world top investment destination.
On the other hand, long term and macro view on taxation is taken root in China, ASEAN countries as well asglobally competitive countries for attracting foreign investors. They aim at encouraging economic growththrough setting competitive tax rate in order to attract high valued globally companies.
Figure3.1.19: Paying Taxes

Final Report – Comprehensive Regional PlanPwC/ Nippon Koei 48
In the aspect of enforcing contract, CBIC is inferior to the other countries regarding the time for procedures.Enforcing contract means the readiness of legal framework when investors get into trouble, as well as time andcost for solving it.
Figure3.1.20: Enforcing Contract
(3) Labour Cost Comparison
At last, here is the comparison of labour costs among major cities of CBIC and DMIC, i.e., Chennai, Bangalore,Mumbai and Delhi, and major cities in target 12 countries, i.e., Beijing and Hong Kong (China), Jakarta(Indonesia), Bangkok (Thailand), Kuala Lumpur (Malaysia), Hanoi (Vietnam), Manila (Philippines), Sao Paulo(Brazil), Moscow (Russia), Johannesburg (South Africa), Mexico City (Mexico), Istanbul (Turkey).
As to the minimum wages, the 2 cities in CBIC are the cheapest and most competitive. Following India, the 2cities in DMIC, Mexico City and Hanoi are at the same level. The others could be categorized as the expensivegroup. The minimum wages of Bangkok, Beijing, Jakarta and Manila are 2-3 times, and Johannesburg, HongKong, Istanbul are 5-6 times, as much as that of CBIC.
Figure3.1.21: Minimum Wages (Latest-2011)
641635
550377
370296
242226223217
14111911311210984
0 200 400 600 800
Johannesburg
Hong Kong
Istanbul
Sao Paulo
Moscow
Kuala Lumpur
Manila
Jakarta
Beijing
Bangkok
New Delhi
Munbai
Hanoi
Mexico City
Chennai
Bangalore
USDSource: JETRO

Final Report – Comprehensive Regional PlanPwC/ Nippon Koei 49
As for the average wages, the office workers’ wages in 2 cities in CBIC are placed in the low level group. Giventhe level of education in those cities available for white collared persons, it can be said that high quality humanresources are available at reasonable price in CBIC. In addition, in India, most of white collared persons areEnglish speakers. In terms of the wages for office workers, Hanoi, Manila, Jakarta and New Delhi arecomparable to CBIC.
Figure3.1.22: Average Monthly Wages – Service Sector (2012)
In terms of factory workers, CBIC is included in the lower wage group. It is almost equal to Mumbai and Delhiin India, and Hanoi, Manila, Jakarta, Bangkok, Beijing and Kuala Lumpur.
Figure3.1.23: Average Monthly Wages – Industry Sector (2012)
0 2000 4000
Mexico City (n.a.)Moscow (n.a.)Istanbul (n.a.)
Johannesburg (n.a.)Hong Kong
BeijingKuala Lumpur
Sao PauloMunbai
BangkokNew DelhiBangalore
ManiraHanoi
JakartaChennai
USD
Office Staff
0 5000 10000
Mexico City (n.a.)Moscow (n.a.)Istanbul (n.a.)
Johannesburg (n.a.)Sao Paulo
Hong KongBeijing
MunbaiKuala Lumpur
BangkokNew DelhiBangalore
JakartaManira
ChennaiHanoi
USD
Office Manager
Source: JETRO
0 2000 4000
Johannesburg
Hong Kong
Sao Paulo
Bangalore
Bangkok
Chennai
New Delhi
Munbai
USD
Factory Worker
0 5000 10000
Istanbul
Johannes…
Hong Kong
Moscow
Bangalore
New Delhi
Chennai
Manira
USD
Technical Manager
0 2000 4000 6000 8000
Johannes…
Istanbul
Moscow
Kuala…
Bangalore
New Delhi
Munbai
Manira
USD
Engineer

Final Report – Comprehensive Regional PlanPwC/ Nippon Koei 50
Although the standard of average wages in CBIC is low, the increase rate is very high. CBIC is encounteringmore than 15 % of wage increase recently, which is almost equal to the rate of Jakarta, Beijing and Istanbul.Wage increase rate is also high in entire India and DMIC.
Recently global companies are shifting their production base from those countries with high wage increase tomore cost competitive countries, such as Myanmar, Bangladesh and Lao PDR. In order to make high valueadded and innovative business taken root in CBIC, the Indian/CBIC Government should strategically constructhigh quality goods and services market consisting of highly educated Indian workers who deserves the highlevel of wages.
Figure3.1.24: Wage Increase Ratio in (Latest-2011)
(4) Foreign Direct Investment Policy
Unlike China and other countries, India has permitted FDI up to 100% to the sectors directly related to CBICdevelopment, i.e., Construction Development Projects and Industrial Activities. In both sectors, FDI ispermitted up to 100%.
16.9
16.3
16.3
16.315.8
15.515.4
11.18.9
7.2
6.96.5
5.9
5.54.8
0.0 5.0 10.0 15.0 20.0
Hanoi (n.a.)MoscowChennai
BangaloreNew Delhi
IstanbulBeijingJakartaMunbai
Sao PauloBangkok
JohannesburgKuala Lumpur
Hong KongManila
Mexico City
%Source JETRO

Final Report – Comprehensive Regional PlanPwC/ Nippon Koei 51
Figure3.1.25: Regulations on FDI
3.2 Qualitative Assessment - Investor’s View
During the inception and interim research period, the study team have conducted interview surveys to severalJapanese companies which have already penetrated in the CBIC region. The study team has consolidated theirviews on the region through the interview surveys as well as consultations with Japan External TradeOrganization (JETRO), the member companies of Japan Chamber of Commerce and Industry (JCCI) inChennai and Bengaluru, and the Indo-Japanese Chamber of Commerce & Industry (IJCCI) in Karnataka. Thepurpose of the analysis is to get a sense of the CBIC’s reality and a possible future development scenariothrough the views of its foreign partners.
3.2.1 CBIC’s Comparative Advantages Attracting ForeignCompanies and Investors
According to the interim survey result, major factors currently attracting foreign companies/investors to theCBIC region are as follows.
1. Formulation of Large Scale Industrial Clusters and High Technical Potential
The best advantage of the CBIC development for foreign companies/investors is future possibility of enhancingthe global competitiveness through effective industrial clusters. Due to the presence of Indian nationalmanufacturing as well as inflow of foreign investments, industrial clusters in the CBIC region are rapidly
Co
nst
ruct
ion
Dev
elo
pm
ent
Pro
ject
s •FDI up to 100% is permitted•Construction-development
projects (including but notrestricted to housing,commercial premises, resorts,educational institutions,recreational facilities, city andregional level infrastructure,and townships) subject tocertain conditions, i.e.,minimum area to bedeveloped, minimumcapitalization of 10 millionUSD for a wholly owned,subsidiary and 5 million USDfor a JV with an Indianpartner, original investmentwith a minimum three-yearlock-in from the date ofreceipt of each FDIinstallment or from the dateof completion of minimumcapitalization, whichever islater, and development of atleast 50% of each project mustbe completed within 5 years ofobtaining all statutoryclearances.
Ind
ust
ria
lA
ctiv
itie
s •FDI up to 100% is permitted•“Industrial activity” has been
defined to meanmanufacturing; electricity; gasand water supply; post andtelecommunications; softwarepublishing, consultancy andsupply; data processing,database activities anddistribution of electroniccontent; other computerrelated activities; basic andapplied R&D onbiotechnology, pharmaceuticalsciences and life sciences,natural sciences andengineering; business andmanagement consultancyactivities; and architectural,engineering and othertechnical activities.
Oth
erS
ecto
rsP
erm
itte
d10
0%
FD
I
•Part of Agriculture• Asset
reconstructioncompanies
•Civil aviation andairports
•Coal and lignite•Courier services•Mining•Non-banking
financial services•Hotel and
Tourism•Petroleum Other
than refining•Pharmaceuticals•Telecommunicatio
ns

Final Report – Comprehensive Regional PlanPwC/ Nippon Koei 52
growing in these years. In addition, suppliers of parts and materials as well as skilled labours necessary for theindustries’ production activities have already been available to some extent, thanks to a unique history ofIndia’s manufacturing industry, especially, the automobile sector. In addition, in the future, the diverseindustrial clusters will show synergy effects each other. For example, skilled suppliers and workers inautomobile sector could potentially supply parts and materials for heavy industry or a part of electronicsindustry. Furthermore, CBIC has Bengaluru and Chennai which locates close to key industrial parks, andprovides relatively finer living condition to foreign workers than the other regions in India.
2. Access to Entire Indian Domestic Market
The size of the CBIC’s population, over 50 million, surpasses that of major Asian countries, such as Korea andMalaysia. The total population of 3 States in CBIC, i.e., Tamil Nadu, Karnataka and Andhra Pradesh State, iscomparative to that of Indonesia, the most populated country in South East Asia. This tremendous market sizeand volume of workers are attracting foreign investors. In addition, CBIC locates along with the Golden Quadlateral Highways which enable manufacturers to deliver their products not only within CBIC, but also to all overIndia. The accessibility to entire Indian market makes CBIC a promising production base for foreignmanufacturing companies.
3. Promising Future Economic Growth
Despite the recent economic downturn, India has shown high economic growth trend over the decades as aleading player of world’s emerging economies. Besides, the 3 states of CBIC are showing higher growth trendthan the average of India. The growth rate is often proportionate to production or sales of industries. Accordingto an empirical analysis of automobile industry, the growth of per capita GDP tends to proportionate to thegrowth of automobile sales. Given the experience in China where the sales of vehicles surpassed 20 millionrecently, it is said that the auto sales of India may surpass 10 million within next 10 years. It is crucial forforeign investors whether they have a production base in such a region when the market has grown the size.
4. Location Merit as A Potential Global/Regional Hub - Access to Asian and African Regional Markets
The East end of CBIC faces a coastline stretching over Andhra Pradesh and Tamil Nadu States, where 4 portsare in operation. CBIC’s comparative advantages for foreign investors considerably owes to the location meritwhich offers easy access to both Asian and African best growing economies. Furthermore, CBIC holds 1domestic and 2 international airport in the region. The large evacuation capacity enables foreign companies toconsider CBIC as a hub of their global and/or regional value chains in their long term strategy. Indeed foreignmanufacturers in the CBIC region have already started exporting their products to all over the world, includingAsia, Africa, US and European countries.
5. Low Labour Cost
Middle income countries which used to attract global investments are currently facing severe increase ofaverage wages. For example, the minimum wage in the Jakarta city in Indonesia has increased in 44% from lastyear. The average wages are rapidly increasing also in Viet Nam, Malaysia and Thailand in these years. Theincrease of wages leads to increase of whole production costs and suffers foreign manufacturers operating in theregion. Relatively small wage increase rate in India is unintentionally strengthening CBIC’s globalcompetitiveness.
6. Proactive Investment Promotion by the Government
In 2002, the Indian Government allowed foreign companies/investors to operate their business in India with aratio of 100% Foreign Direct Investment (FDI). The difference between India and China, where the ratio is 50%,is considerably enhancing global competitiveness of CBIC. Moreover, the Indian and the CBIC’s 3 StateGovernments are quite positive to further invite foreign investors and continue dialogues with many foreignpartners.

Final Report – Comprehensive Regional PlanPwC/ Nippon Koei 53
Figure3.2.1: Summary of CBIC’s Key Appeals to Foreign Investors
3.2.2CBIC’s Major Difficulties Alienating Potential ForeignCompanies & Investors
When foreign companies/investors make a decision on an investment destination, they need to pick up one orsome of regions from numbers of other options. Although they carefully check the risks and chances throughvarious methodical ways, the result of decision is often affected by reputations formed by companies whichhave already been operating in the region. As described in the previous chapter, the CBIC region, currentlyknown as a part of Southern India including Chennai and Bengaluru, is regarded as the promising investmentdestination. However, there is another negative reputation as the “risky” and/or “unprofitable” region, due togaps between the global fame and reality on the ground.
For example, while companies in the manufacturing and service industries are expanding their Indian base inthe CBIC region, companies relevant to these industries are not necessarily gathered in the area. Therefore, themanufacturing companies need to import parts and materials, which are essential for their product, fromoverseas remote areas. Thus, penetration into CBIC is not always leading to enhanced competitiveness for thesecompanies. One of the key reasons for this is that domestic Indian companies and foreign companies (inparticular, mid-to-small-sized companies) are forced to engage in tasks and bear costs that would naturally nothave been required, and are thus unable to make a decision on penetrating into the CBIC.
1. Lack of Readiness of Industrial Parks
The quality of the industrial park in the CBIC region is far from an average industrial park in the internationalstandard. Due to the low quality, the foreign manufacturers newly invested in CBIC are facing serious problems,e.g., shortage of water, lack of stable power supply, delay of planned road construction, and deferral of theGovernment permission. In some cases, they even encounter the situation that land allocation and acquisitionis not completed even after starting construction of the facilities on the allotted land. Moreover, in order tosolve the problem, they have to negotiate with each line ministry though highly ambiguous and time consumingprocess. This happens partly because many of the industrial parks in CBIC are still under public operation.While successful industrial parks in the world were operated by private developers.
2. Challenges of Infrastructure Bottlenecks
In addition to the challenges inside the industrial parks, there are challenges of infrastructure bottlenecksoutside. As to the transportation sector, essential improvements needs to be addressed, e.g., mid-long termroad planning, construction of access roads to main roads and major port, establishment of management
Growing IndustrialClusters•Upgrading global
competitiveness throughefficient industrial clustersand their syenergies
•Labours, facilities andparts/materials available incompetitive prices
•Proactive investmentpromotion by theGovernment
•Fine living conditions
Access to World'sBest GrowingMarket•Access to entire Indian
domestic market•Tremendous market size
and volume of workers•Promising future economic
growth
Potential as a Hubof Global/RegionalValue Chain•Long coast line with major
ports open to global market•Dual-access to growing Asia
and Africa•Large evacuation capacity
through both ports andairports

Final Report – Comprehensive Regional PlanPwC/ Nippon Koei 54
system for freight railway and loading points, and enhancement of overall operation of major ports. Similarlyin the power sector, chronic shortage of electricity should be solved through development of comprehensiveelectricity supply and demand plan. (Further details are described in the following chapter.)
3. High Risk and Cost in Policy Environment
Although the Indian and State Governments attempt to develop investor friendly environment in the CBICregion, current policy environment in CBIC forces the foreign investors to take too much additional risks andcosts. For example, problems on logistics and import taxation regularly occur at the ports and airports. Rules ondocumentation and licensing for international trade are highly inconsistent. Permitting process of theGovernment is pretty time consuming. Logistics are often delayed due to the roads jam-packed by vehicleswhich do not follow the traffic regulation. (Further details are described in the following chapter.)
4. Low Comparative Profitability
Most of the Japanese foreign companies describe the character of the Indian market as “exhaustively costcompetitive.” Many of them feel the values of their products, such as the higher quality, life cycle cost and safetyfor users, are underestimated by the Indian consumers. On the other hand, there are a lot of growing economiesand high profitable regions in Asia, such as Malaysia, Thai, Indonesia, and China. They also have advancedcharacters as investment destinations, e.g., industrial cluster, higher skilled labours and facilities, and businessenvironment and living condition preferred by foreign investors. The foreign companies which try to invest inCBIC are mostly aspiring investors which dare to take a risk and invest in new region instead of expanding on-going investments to their familiar regions.
5. Instable Indian Economy and Market
Indian economy is currently losing the growth momentum. The GDP growth rate of India decreased to 3.24% in2012. Given the economic downturn, foreign companies tend to postpone their investment plan as well asdowngrade the growth estimation to India. Observed the China’s high growth period facing earlier slowdown,global investors currently start considering the future growth of emerging economy has been overestimated.Under the situation, small and medium scale foreign companies, mostly essential parts suppliers formanufacturing, are confronting a serious challenge in order to determine investments to CBIC.
Figure3.2.2: Summary of CBIC’s Major Weakness Alienating Potential Foreign Investors
High Risk and Coston Operation•Lack of readiness of
industrial park•Challenge of infrastructure
bottlenecks•Risky and costly policy
environment
Low ComparativeProfitability•Exhaustive cost competition• Underestimated values of
high quality products, e.g.,the higher quality, life cyclecost and safety for users
•Existence of other highprofitable regions near india
Ambiguity in IndianEconomy & Market•Recent downturn of Indian
economy•Earlier slowdown of high
growth in emergingeconomies
•Reaction to past over-expectation to emergingeconomies including India

Final Report – Comprehensive Regional PlanPwC/ Nippon Koei 55
3.2.3Details of Difficulty in Policy EnvironmentHere are further details of difficulty in policy environment which the foreign companies are frequentlyencountering on their daily business in the CBIC region.
1. Logistics in International Trade at Ports and Airports
Logistics problems frequently occur at ports and airports, especially at Chennai Port. Due to lack oforganized and integrated regulation or guidelines, rules of mandatory submitting documents and licencesfor clearance are often changed suddenly by orders of clearance officers at the port or airport. Also, thereare numbers of local rules and regulations in each port/airport which are not officially enforced by theGovernment. Some foreign companies are feeling the human cost and time for port clearance in CBICregion takes 10 times as much as that of Singapore.
2. Taxation System/Process
Despite the fact that the tax system are under control of the Indian Government, the same issue in logisticsoccurs in taxation at the port and airport. Rules of taxation process changes frequently and suddenly bythe orders of tax officers at the port or airport. For example, a rule for determining import tax base, eitherMaximum Retail Price (MRP) or Invoice Value, often changes depending on the sporadic order by theofficers.
Tax system should be considered from viewpoints of not only collecting more tax from private sector butalso encouraging production activities of industries which will produce much higher tax revenue to theGovernment in the long run. In the context, current rate of import tax, i.e., 25 % is felt too high whencomparing to other Asian countries’, 10-15 %. Also, necessity of Special Value Brunch (SVB) is underquestion.
As to VAT refund process, one invoice needs to be provided to the Taxation Bureau per part whenreceiving a refund on VAT. As the invoice is requested in hard copy, more than 10,000 invoices must befiled for 1 car, and the administrative cost is enormous. Furthermore, the documents must be stored for 8years, leading to a large storage cost only for keeping the copies.
3. Permitting Process
A company must submit various applications to the State Government when penetrating the market, butthe process is enormously time consuming. For example, when constructing a plant or an office, adeclaration will be made on the environmental impact of the business and construction works which willrequire assessment by specialist as needed. In many cases, this process takes 3-4 months on average.Companies considering entry will develop a detailed schedule for the start of new production and sales.However, if the permitting process takes a long period of time, the production and sales schedule will bedelayed, and in some worst cases, a company had to abandon market penetration.
4. Regulations
According to the current Indian environmental standard, metal plating and coating industry arecategorized as “Red” industries. The category creates a hurdle for them to construct a factory near Chennaiand Bengaluru. It makes automobile industry difficult to form complete cluster in the CBIC region.
One of the important issues causing traffic jam is the current situation where vehicles are travellingwithout complying with the road traffic rules. The main cause is the moral degeneration regardingcompliance with road traffic rules. Appropriate operation of the examination system for obtaining adriver’s license may contribute to solve the problem. In order to receive a license, both a written and a skilltest are required, but cases can be seen where a license is given without going through a skill test.

Final Report – Comprehensive Regional PlanPwC/ Nippon Koei 56
3.2.4Details of Infrastructure BottlenecksHere are further details of infrastructure bottlenecks which depreciate the foreign companies’ manufacturingactivities in the CBIC region.
1. Industrial Parks
(1) Operation of Industrial Parks
At many of industrial parks in CBIC, the tenant must build and maintain by themselves basicinfrastructures such as water, electricity, draining facilities and surrounding roads. An agreement on theconstruction of infrastructure between the tenant and the Governmental corporations managing theindustrial park was not realized in many cases in the past.
This happens partly because many of the industrial parks in CBIC are still under public operation. Whilesuccessful industrial parks in the world were operated by private developers.
In order to solve those serious problems, the tenant has to report the problems and negotiate with eachline ministry by their own risk and through time consuming process.
(2) Access Roads from Industrial Parks to Main Roads
Main roads and industrial parks are not effectively connected in the CBIC region. Since many of the accessroads are unpaved and damaged, the worsened traffic jam does not allow vehicles to travel in an ordinarymanner. Even if a national highway (NH) is constructed or expanded, the lead time between industrialparks and ports will result longer without the effective access roads which connect the NH and industrialpark.
(3) Roads inside Industrial park
Construction of roads within industrial parks is insufficient. In particular, difficulty is found in carryingheavy loads. The construction of roads within industrial parks is initially responsibility of the state’s publicdevelopment corporation. However, in many cases, the progress is slow.
2. Roads
(1) Mid-Long Term Road Planning
A road plan needs to be developed with an eye to the future of CBIC’s industrial development. There arefrequent project announcements regarding new investment or expansion by automobile or two-wheelermanufacturers in CBIC. Currently not only Japanese but also European and Korean companies are seekingto expand the production. Therefore the volume of logistics in CBIC will escalate along with the increase ofdomestic as well as international transport of the parts and materials for their production. Thus, sporadicconstructions of new roads or increase of lanes will not fundamentally solve the issue of traffic jams.
(2) Access Roads to Main Roads and Major Ports
a. Realization of the peripheral road concept in the Chennai region
This concept was announced in March 2012 by the Chief Minister of Tamil Nadu, and includes theconstruction of an outer ring road connecting Mamallapuram, Singaperumaikoil, Sriperumbudur,Tiruvallur, Thamaraipakkam, Periyapalayam, Puruvayal, and Kattupalli around Chennai. Theannouncement states that this will involve the extension of existing roads.
Currently, vehicles must pass through Chennai City to access Ennore and Chennai Ports, but due to thetraffic jam, it is difficult to set the lead time with accuracy. For example, it takes 8 hours for transport onlybetween the industrial park in Southern Chennai to the port.
The construction of roads connecting industrial parks are yet to be built and the smooth distribution ofparts and materials from the assembler to the supplier is an issue. In particular, the road environment

Final Report – Comprehensive Regional PlanPwC/ Nippon Koei 57
surrounding the Oragadam Industrial Park is severe. Logistics activities between affiliated companies arefacing serious inefficiency.
The construction of the peripheral road will enable the manufacturers to set a more accurate lead time, asvehicles will be able to avoid driving through the city centre for reaching the Ennore Port, and as roadsbetween major industrial parks will be in place.
b. Access road from NH4 to NH7 in the Bengaluru region
Earlier commencement of STRR project is essential issue. Currently, the expansion of NH207 fromDabaspet to Hoskote into a 4-lane road is being planned, but an expansion up to Hosur is more important.The road from Hoskote to Hosur via Malur can deepen industrial cluster around Bengaluru region as wellas be used as an access route from the industrial park near Bengaluru to the main road, NH7.
c. Access roads near Ennore and Chennai Ports
The delay in the construction of an access road in the area surrounding Ennore and Chennai Ports, thegateway to CBIC, is impeding business operations in the entire CBIC region. Large traffic jams caused bythe delay makes cargos arriving late. An accurate lead time cannot be estimated.
Area near Ennore Port:
NCTPS Road - Early construction of the Attipattu ROB and Pullicat Backwater Bridge. In particular, thecompletion of Attipattu ROB is an impending issue for the safe shipment of products to theEnnore Port.
- Expansion of existing roads into 4-lane roads at an early stage
TPP Road - Early construction of the Napallayam Bridge
- Early paving of existing roads
- Expansion of existing roads into 4-lane roads at an early stage
Ennore Port Road - Early construction of the Bridge for Buckingham Bridge
- Expansion of existing roads into 4-lane roads at an early stagy
Northern Port AccessRoad
- Early start of construction
Area near Chennai Port:
Elevated Corridor to Chennai port - Early completion
EMRIP (Ennore-Manali Road Improvement Project - Early completion
d. Chennai Outer Ring Road
The completion of the Outer Ring Road will enable companies located south of Chennai and in Bengaluruto access Ennore Port without passing through the Chennai city. The road will play an essential role inalleviating the current traffic jam. Also, connection with the Northern Port Access Road for securingaccess to Ennore Port will contribute to the smooth logistics in the CBIC region.
e. Bengaluru’s Peripheral Ring Road

Final Report – Comprehensive Regional PlanPwC/ Nippon Koei 58
The traffic jam in Bengaluru City is impacting manufacturing companies’ operations and logistics.Peripheral ring road will be an essential solution in order to alleviate the traffic jam.
(3) Main Roads between Chennai and Bengaluru
Improvement of the current main roads between Chennai and Bengaluru, i.e., NH4, NH7 and NH46, arenecessary. The construction of roads to access the industrial clusters centered on industrial parks fromthese main roads is a priority issue. The traffic jam on NH4 and NH7 is particularly severe in Bengaluru. Itcould be alleviated through the construction of flyovers near crossroads.
Highways exclusively for vehicles are needed to be constructed on the mid-to-long-term as one of the mainroads connecting industrial clusters within CBIC. It is important to simultaneously build access roads thatconnect with the highway and industrial parks.
(4) Road Maintenance
The damaged roads in CBIC are damaging the load during the transportation. Together with theconstruction of new roads and expansion of existing roads, the development and implementation of anorganized road maintenance plan is required. Especially, the TPP Road and SP Koil Road in Chennai, andthe Mysore Road (between BHEL Signal and Muslim Burial Ground), White Field Road and Tumkur Roadin Bengaluru are in need of prompt improvements to road conditions.
3. Ports
(1) Ennore Port
The cost for usage of Ennore Port is more than twice that for other ports in India, and over 5 times theinternational level. Further revision of port charge is necessary.
A facility (crane) for shipping large-sized heavy loads would be required when expanding domesticshipment or overseas export of large-sized plants in future.
Improvement of the port’s safety measures is required. There were cases where cargo could not be handleddue to the waves, and where ships were damaged.
(2) Chennai Port
The clearance system goes down frequently, and operation cannot be handled smoothly.
There is only one gate through which the trucks can enter the Chennai Port for receipt and delivery. Asecurity check is conducted at the gate on the trucks one by one, and the line of trucks waiting to enterreaches several tens of kilometres. A vicious circle where trucks cannot enter the Port, cannot receive theload, and ships are waiting in line to discharge their load.
Clearance hours are only between 9am to 5pm.
Freight vehicles e.g., trailers can only enter the Chennai city between 10 pm to 6 am and are stopping andwaiting in the suburbs of the city until night time, causing a serious traffic jams.
Intensive study to fund solutions to improve port operation system, e.g., 24 hour operation of the port,effective way of gate access, and simplification of security check.
Expansion of car parking yard is required in order to solve the traffic congestion in the area.
(3) Ports in Southern Chennai
As industrial clusters consisting mainly of autos and two-wheelers are located in Southern Chennai andBengaluru, there would be no need to consider traffic in the Chennai city and lead time can easily beestimated, if a port were to be constructed on the southern coast of Chennai. This would also have theimpact avoiding environmental contamination in the city caused by trucks. A comprehensive developmentof a port such as the Marg Port currently being planned, and surrounding roads in Southern Chennai willencourage smooth logistics in the region.

Final Report – Comprehensive Regional PlanPwC/ Nippon Koei 59
(4) Ports in Northern CBIC
There is high possibility to further expand CBIC’s import/export capacity through construction of newports as well as upgrading of existing ports, such as Krishnapatnam Port, in northern part of the CBICregion. However, as far as the above mentioned low operation capacity remains, the construction orexpansion of physical facilities does not necessary lead to the result. Improvement of operation capacity,e.g., allocation of skilled staffs, well organized work team building, establishment of clearclearance/logistics rules, should be addressed in addition to the infrastructure development.
4. Power and Energy
(1) Chronic Shortage of Electricity
The chronic shortage of electricity is causing difficulty in production, e.g., restrictions on the use ofelectricity, planned as well as frequent unexpected outages. For example, in Tamil Nadu, despite theincreasing electricity demand every year due to the accelerated growth in the number of manufacturers inthe state, supply capacity remains at around 10000 MW for the past several years.
The shortage of electricity supply forces companies to make downward adjustments to their productionplan. The frequent unexpected outages will abruptly stop production lines and produce a large number ofdefective products. The companies will have no choice but to introduce privately-owned electrical powerfacilities for avoiding this situation, but the burden would be large considering that this would requirelarge investments and the electricity cost would be around twice the ordinary charge. Stable and highquality electricity supply, i.e., stable power voltage and frequency, as well as no outage, is essential fordevelopment of industrial sector in CBIC.
(2) Comprehensive Electricity Supply and Demand Plan
Since global companies complete their products in the optimum location with receiving parts andmaterials from various bases all around the world, lack in the supply of parts in the global value chain dueto India’s shortage of electricity would impede their worldwide production activities. The lack of aneffective electricity supply and demand plan would indicate the review of their global strategy for India as aglobal base.
(3) Use of Private Sector
It would be required to consider the effective use of IPP (Independent Power Provider) that have their ownpower generation and transmission facilities for securing a stable, high-quality power supply.
5. Railways
(1) Exclusive Freight Railway and Management System
Freight railway can be one of the effective transportation means for industrial clusters along CBIC due toits advantages of safety and mass transport. As demand for cargo vehicles including truck trailers isincreasing, there could be growing needs for freight railway in the future. Nevertheless, accurate operationcannot be expected of the current railway, and mass transport is impossible. For example, freight railwaywaits for passenger trains to depart, and is not operated according to the timetable, taking 48 hours fromChennai to Bengaluru. Thus, the lead time is inaccurate and difficult to apply for business. Furthermore,the goods must currently be unloaded from the freight train and loaded on to a truck. It is better to useland transport from the location where the goods are loaded. The rail can be used if a structure is possiblein which an exclusive line can be built at the plant for direct shipment to the port.
(2) Loading Points

Final Report – Comprehensive Regional PlanPwC/ Nippon Koei 60
Management of loading points is unreliable. There are cases where loads are damaged (stained or failuredue to dust or water) as a result of bad management and operation at the place where goods are unloaded.
3.3 Summary of Key Findings
Given the above analysis, the investment competitiveness of CBIC as a global investment destination, i.e.,strength, weakness, opportunity and thread, is summarized as below table.
In summary, as to the strength, the best comparative advantage of CBIC is the scale and growth potential of theaccessible domestic and foreign markets, e.g., entire regions in India, Asia, Africa and other regions of the world,thanks to the geological location and surrounding infrastructures. For example, the population only withinCBIC is equivalent to medium sized countries in the world, and the estimated GDP growth rate in future ishigher than the most of them. In order to make the most of the advantage, further infrastructure development,such as ports, airports, highways and railroads, for reinforcing the linkage between CBIC and those markets willbe the most important for improving the competitiveness. The location merit and advanced infrastructures willenable CBIC to be a hub of global network for many manufacturing companies in the future.
Thanks to the large FDI inflow due to the high expectation of investors, industrial clusters are developing inCBIC. Current proactive manufacturing development and FDI promotion policies along with actualenhancement of NIMs, SEZs and Industrial Parks are contributing to accelerating the process. Also, advancedfinancial market and availability of qualified and low-cost local suppliers and industrial workers providefoundation of the development. Furthermore, unique pass of previous development of CBIC/India encourageshigher expectation for investors on the possibility of innovative growth in the future.
Meanwhile, as to the weakness, CBIC is surrounded by very competitive investment destinations, e.g., Chinaand growing ASEAN countries internationally, and DMIC domestically. Among them, CBIC is inferior in manyaspects of investment environment due to the following disadvantages; 1) infrastructure bottlenecks, especiallycapacity and quality of port/airport, road, railway and industrial park, 2) ambiguity in procedures for permitsand licences especially regarding import and export, , 3) high tax rates , 4) increase of business cost, especiallyworker’s wage and land value, 5) technological level of suppliers and workers, and 6) lack of market for highquality goods and services.

Final Report – Comprehensive Regional PlanPwC/ Nippon Koei 61
Table 3.3.1: SWOT Analysis
Plus Factor Minus Factor
Inte
rn
al
<Strength>
1. Scale and the growth potential of accessibledomestic and foreign markets, e.g., all statesin India, Asia, Africa and other regions of theworld, thanks to the geological location andsurrounding infrastructure, e.g., ports in longcoast line, airports, road and railroad
2. Quantity of available, qualified and low-costlocal suppliers and industrial workers, such asengineers, technicians, scientists, researchers,and any industrial workers, who are mostlyEnglish speakers
3. Proactive manufacturing development andFDI promotion policies, e.g., target ofmanufacturing GDP share 25%, andpermission of 100% FDI for construction andindustrial activities
4. Glowing industrial clusters due to NIMs, SEZsand Industrial Parks and possibility ofinnovative growth in the future due to theunique pass of development
5. Development of financial market especially inthe aspects of protection of investors,acquisition of cash, financing through localequity market, venture capital availability,and regulation of securities exchanges
6. Others: Competitiveness in imports,Availability of power for industry, High levelof Gross National Saving, Quality of railroadinfrastructure and Quality of managementschools.
<Weakness>
1. Infrastructure bottlenecks, especially capacity
and quality of port/airport, road, railway and
industrial park
2. Ambiguity in procedures for permits and
licences especially regarding import and
export, e.g., fluctuating rules and procedures
and existence of corruption
3. High tax rates, e.g., corporate tax, V.A.T.,dividend remittance tax and import tax
4. Rising business cost, i.e., growing worker’swage and land value
5. Technical gap between the needs of foreignmanufactures and local suppliers/workers
6. Lack of market for high quality goods andservices and too much cost competition
7. Others: High inflation rate, Difficulty instarting business, Low readiness of Macro-economic environment, Low quality of healthcare, high infant mortality, Low quality ofprimary education and higher education, Lowperseverance of subscriptions in mobiletelephone, fixed telephone lines and internet,Unbalanced Government budget, and Smallshare of women in labour force
Ex
ter
na
l
<Opportunity>
1. Higher rising wages and other productioncosts in China and South East Asia than India
2. Shortage of skilled labours and industrialparks in Asia
3. Political instability and lessened economicgrowth of China
4. Expansion of global share of India in GDP andpopulation scale
<Threat>
1. Surrounding competitive and glowingcountries/regions in terms of foreign trade,investment and production of high qualitymaterials in such countries as China,Indonesia, Thailand, Malaysia, Vietnam andPhilippines
2. DMIC’s presence as the prime Indianinvestment destination
3. Recent economic downturn of India4. High political, economic and cultural
ambiguity and risk5. Middle income trap: Shift of foreign investors
from India to emerging production costcompetitive countries.

Final Report – Comprehensive Regional PlanPwC/ Nippon Koei 62
3.4 Key Issues on Overview of Investment Environment1. Administrative Issues – Procedures on Approval and Authorization
In order to develop CBIC to a truly world best investment destination, the Government of India and the relatedState Governments, i.e., Tamil Nadu, Karnataka and Andhra Pradesh, are recommended to decrease,shorten, simplify and clarify the procedures for approval and authorization. The Government’s effortsfor clarification of procedure rules through written documents, setting target periods for the procedures,improving one stop service and utilizing online system will contribute to the improvement.
The comparison analysis in the previous chapter shows that doing business in CBIC is time and cost consuming.The situation is summarised in the following figure and table.
Figure3.4.1: Number of Procedures
The comparison of necessary period of major administrative procedures in CBIC and the rival countries/regionsare shown in the below table.
0
20
40
60
80
100
120
140
160
180
N
u
m
b
e
r
o
f
P
r
o
c
e
d
u
r
e
s
Enforcing contracts
Documents to import
Documents to export
Tax Payments
Registering property
Dealing with construction permits
Starting a business
Source: World Bank

Final Report – Comprehensive Regional PlanPwC/ Nippon Koei 63
Table 3.4.1: Period of Proceduresin CBIC
Name of Procedures Period ofProcedures
in CBIC
Comparison with RivalCountries/Regions
Authority in Charge
Best Practice Average Gov. of India State Gov.
Starting a business 37 days 6 days
(Mexico)
31 days √ √
Dealing with constructionpermits
120 days 77 days
(Philippines)
181 days √ √
Registering property 38 days 2 days
(Thailand)
33 days √ √
Trading across borders Export 25 days 11 days
(Mexico)
17 days √
Trading across borders Import 22 days 11 days
(Mexico)
18 days √
Enforcing contracts 968 days 270 days
(Russia)
533 days √
Paying taxes 292 hours 133 hours
(Malaysia)
292 days √ √
The competitive period shows the best practice which is applied in the 12 compared countries. The moderateperiod shows the averages. It is recommended for CBIC to set the target period at least at the level of theaverage, in order to enhance the global competitiveness.
In addition, the following issues are the critical weaknesses of CBIC which need to be addressed.
Table 3.4.2: Key Bottlenecks in Administrative Issue in CBIC
Key Issues Challenges Solutions
1. LandAcquisition onIndustrialParks
■ When serious problems occur on landacquisition in industrial park, privatecompany has to solve by taking allresponsibilities.
■ Information on industrial park is closedand difficult to know for potentialinvestors unless they have connectionwith the Government officials.
■ All responsibility on land acquisitionfor industrial parks should be taken bythe Government. Negotiation with localresidents should not be responsible forprivate companies.
■ Land allocation and other essentialinformation on industrial parks shouldbe open to public.
■ All procedures should be transparentand preferably done by single window.
2. Import/Exportat Ports andAirports
■ Due to lack of integrated guidelines,rules of mandatory submitting documentsand licenses for clearance are frequentlychanged by orders of officers at the port or
■ Clear, integrated and transparent rulefor the following procedures should beset.
Licences and application documents

Final Report – Comprehensive Regional PlanPwC/ Nippon Koei 64
Key Issues Challenges Solutions
airport.
■Number of local rules and regulationswhich are not officially enforced by theGovernment exist in each port andairport.
■ One invoice needs to be provided toTaxation Bureau per part when receiving arefund on VAT. As the invoice is requestedin hard copy, more than 10,000 invoicesare required.
for custom clearance Payment rules and tax rates on
custom duty
■ Port and airport operation should beimproved.
24 hours operation of major ports Improvement of gate utilization Simplification of security check and
gate check Increase of custom officers
■ V.A.T. Refund process should besimplified.
3. EnvironmentalAssessment andApproval ofNew Projects
■ Environmental assessment takes toomuch time, i.e., 3-4 months on average.
■Approvals for new projects, such asapprovals of State’s high level committeeand issues of official approval letters aretaking too much time.
■Environmental assessment proceduresshould be simplified.
■Industrial waste management facilitiesshould be pre-installed to industrialparks rather than strictly imposingZERO emission and EIA policy
■ Procedures for project approvalsshould be simplified.
2. Financial Issue - Taxation
As analyzed in the previous chapters, the tax burden for foreign investors in CBIC is more than the other rivalcountries and regions. The higher tax rate critically deteriorates the attractiveness of CBIC as an investmentdestination.
Figure3.4.2: Comparison of Tax Rates between CBIC and Hong Kong
Comparison of major tax rates in CBIC and other rival countries are shown below.
0
20
40
60
80
100
120
140
CBIC Hong Kong
Loyalty Remittance Tax
Dividend Remittance Tax
Interest Remittance Tax
V.A.T.
Personal Income Tax
Corporate Income Tax
Source: JETRO%

Final Report – Comprehensive Regional PlanPwC/ Nippon Koei 65
Table 3.4.3: Current and Recommended Tax Rates for CBIC
Name of Tax Current
Rate
Comparison with RivalCountries/Regions
Authority in Charge
Best Rate Average Rate Gov. of India State Gov.
Corporate Income Tax 40% 0% 17% √
Personal Income Tax 30% 17% 31% √
V.A.T. 13-15% 0% 8% √
Interest Remittance Tax 10% 0% 8% √
Dividend Remittance Tax 15% 0% 9% √
Loyalty Remittance Tax 10% 0% 10% √
State Entry Tax Varies 0% 0% √
Import Tax 25% 10% 15% √
The competitive rates show the best rates which are applied in the 12 compared countries. The moderate ratesshow the averages. It is recommended for CBIC to set the tax rates considering the level of the average, in orderto be a globally competitive investment destination which is chosen and preferred by major global investors. Inaddition to the tax rate, cess should also be reconsidered.

Final Report – Comprehensive Regional PlanPwC/ Nippon Koei 66
4Industry Scenario
4.1 India as an industrial hub for the world
4.1.1 India's current manufacturing positionPost liberalisation, Indian manufacturing sector has been able to shift to a steeper trajectory from 5.37% CAGRto 6.73% CAGR4. In the past 10 years, Indian manufacturing has grown at a robust rate of 8.4%, putting itselfon the map of some of the best performing manufacturing economies. Yet, the subject of criticism has beenlower contribution of manufacturing sector to overall GDP when compared to fast developing economies in theregion like Thailand, China, Indonesia and Malaysia and the ease with which business is done in India.
Figure4.1.1: Indian Manufacturing GDP and contribution
Looking back at the trend of these fast growing economies in the past 10 years (refer figure 35), it seems thatthese countries inherently had strong manufacturing presence. There hasn’t been any significant improvement
4Planning Commission Data Tables5World Bank Statistics
0
100
200
300
400
500
600
700
800
900
0%
2%
4%
6%
8%
10%
12%
14%
16%
18%
195
1-5
2
195
3-5
4
195
5-5
6
195
7-5
8
195
9-6
0
196
1-6
2
196
3-6
4
196
5-6
6
196
7-6
8
196
9-7
0
1971
-72
1973
-74
1975
-76
1977
-78
1979
-80
198
1-8
2
198
3-8
4
198
5-8
6
198
7-8
8
198
9-9
0
199
1-9
2
199
3-9
4
199
5-9
6
199
7-9
8
199
9-2
K
20
01-
02
20
03
-04
20
05
-06
20
07
-08
20
09
-10
20
11-1
2
Indian Manufacturing GDP has grown steadily
Manufacturing GDP in '000 Crs Manufacturing GDP contribution
0
5
10
15
20
25
30
35
40
45 Manufacturing GDP change forcomparable developing countries
1965 2010
5
10
15
20
25
30
35
40
2001 2002 2003 2004 2005 2006 2007 2008 2009 2010
Thailand China Indonesia Malaysia
Singapore Philippines Argentina Japan
Vietnam Turkey Mexico Brazil
India Russia Saudi Arabia Australia
World
6.73%
5.37%
Figure 4.1.3: Trend in manufacturing GDPcontribution in past 10 years
Figure 4.1.2: Change in Manufacturing GDP contributionin past 45 years

Final Report – Comprehensive Regional PlanPwC/ Nippon Koei 67
in manufacturing contribution in any of the economies. However, tracing back performances to the past 45years, the change is apparent (refer figure 26). Economies like Thailand, Indonesia and Malaysia have increasedtheir manufacturing GDP contribution by 15-21% in the past 45 years. It may be one thing to say that India canalso shift towards higher manufacturing contribution; but the challenge is achieving that in much shorter timeframe as compared to 45 years. The challenge is much more, when the services sector itself is growing at a veryfast pace. Achieving this would require a completely different strategy moving out of the business as usual.
4.1.2 Manufacturing Sector contribution to Employment, GDP andExports
Figure4.1.4: Manufacturing sector’s contribution to the economy
Manufacturing sector plays a key role in the Indian economy. With a current contribution of only around 15% ofIndia’s GDP, the sector commands 42% share of Indian exports. Additionally, manufacturing contributes to12% share of Indian workforce7. Increase in Manufacturing GDP contribution is certainly going to drive upcreation of fresh jobs.
Figure4.1.5: Key export commodities8
6World Bank Statistics7Planning commission data tables, Crisil research, CARE ratings8UNCTAD, World Trade Organization
18.56%
16.10%
13.71%
12.68%
10.00%
7.59%
6.30%
6.13%
3.99%
3.53%
1.41%
Transport equipment
Electrical machinery, machinery, leather, other…
Fuels
Electronics
Chemicals & Petrochemicals
Auto and auto components
Food processing
Metallurgical industry
Textiles
Pharmaceuticals
Other agricultural products
Current drivers of export volume - Average share of industry in totalexports among top 14 exporters in 2012
13.69
11.63
15.11
59.57 100
0
20
40
60
80
100
120
Manufacturingcontributes 15% of IndiaGDP
9.28
17.40
41.98
31.33 100.00
0
20
40
60
80
100
120
Manufacturingcontributes 42% of Indianexports
52.39.7
11.4
26.6 100.0
0
20
40
60
80
100
120
Manufacturingcontributes 12% share ofworkforce

Final Report – Comprehensive Regional PlanPwC/ Nippon Koei 68
However, when looked at the international map, manufacturing segments still show a lot of potential in tappingexports. Currently, though India features among top exporters, its export share in the top traded manufacturingcommodities is least. Going forward strategic focus in manufacturing product trade can provide further boost toIndian economy.
Figure4.1.6: Country wise trade performance scores for key sectors
4.1.3 Challenges to Manufacturing in IndiaThe ease of doing business index ranks economies (on 10 parameters) from 1 to 189. India was ranked 134th in2013. India has dropped from the 131st spot from 2012. Infrastructure development is critical to theachievement of national manufacturing vision. Driving the manufacturing sector and creating opportunities forfurther investments can be challenging. A recent report says that a majority of the India’s largest manufacturersdon’t return their cost of capital, a factor that dampens investment in the sector.
Figure4.1.7: Relationship between Return on Invested Capital (ROIC) and Weighted Average Cost ofCapital (WACC) across major sectors in India
Improving productivity through greater focus on technology, plugging infrastructure and logistics gaps andmore so in a sustainable manner, creating suitable policies to help companies optimise conversion costs wouldbe some of the key areas where significant efforts will be required.
0
4
8
12
16
Pe
rfo
rm
an
ce
Sc
or
e
India is currently in the bottom quartile on the top exporters list in leveraging overmost traded commodities
China United States Germany Japan Netherlands
France Korea, Republic of Russian Federation Italy United Kingdom
Hong Kong, China Belgium Singapore India Spain
54
79
74
72
59
56
54
54
48
46
41
24
46
21
26
28
41
44
46
46
52
54
59
76
OVERALL
Durables and textile
Utilities
Paper product
Auto
Food and beverage…
Metals and mining
Energy
Chemicals
Pharma
Capital goods
Construction material
Around 54% of the top companies face problems in generating ROIChigher than WACC
ROIC less than WACC ROIC greater than WACC

Final Report – Comprehensive Regional PlanPwC/ Nippon Koei 69
Figure4.1.8: Logistics performance and labour productivity benchmarks – India vs. Other competingnations
Figure4.1.9: Relationship of labour and logistics productivity to production costs
Further, technology and incentives for elementslike water, which is key for most of themanufacturing industry is necessary. Currently,water scarcity may be a key issue in CBIC regionalong many districts. It is currently estimated thatfor every 1 litre of waste-water discharged in India,5-6 litres of usable water gets polluted9. But if, wecan improve our productivity to that of US, we cansupport 35 times the output with the availablewater. Incentives to recycle and reuse industrialwaste water are essential.
Figure4.1.10: Industrial water productivity – India vs. Other competing nations
9 http://www.idfc.com/pdf/report/2011/Chp-18-Industrial-Water-Demand-in-India-Challenges.pdf
10094 97
81
66
0
20
40
60
80
100
Singapore USA Germany China India
%o
fh
igh
es
tp
er
for
ma
nc
e
Logistics performance indicators
8.913.7 14.2
43.3 45.2
68.2
0
20
40
60
80
India Brazil China Germany SouthKorea
USA
GD
Pp
er
pe
rs
on
em
plo
ye
sin
'00
0$
Labour productivity
100
34
23
1714 5
6 1
12 583
0
20
40
60
80
100
120
Improvements in labor and logistics productivity can reduce production cost incement industry by almost 17%
12.0
9.4
4.7
2.5 2.3
1.00.4 0.3
0.0
2.0
4.0
6.0
8.0
10.0
12.0
14.0Industrial water productivity , GDP/Volume
(US$/CuM)

Final Report – Comprehensive Regional PlanPwC/ Nippon Koei 70
5,169
10,799
5,567
3,238
7,576
5,042
India China Vietnam
Cotton - spinning, weaving and finishing
Cotton - Garments
Figure4.1.11: Labour productivity benchmarks – India vs. Other competing nations
Source: Department of Scientific and Industrial Research
Raw material & inputs expenses need to be tightened to make India’s cost structure competitive as compared tocompeting countries. This can be done by rationalising the policies for procurement of technology, rawmaterials, utilities and distribution costs. Further, arrangements need to be made for assured supply of rawmaterials and necessary resources over a long term.
Capital productivity (Cost as a % of total sales) – comparison of India and China
Figure4.1.12: Capital productivity (cost as a % of total sales) – India vs. China
Source: Department of Scientific and Industrial Research
In comparison to competing nations, India scores low on labour productivity across varioussectors. For a few sectors, labour productivity in India is lesser by ten times when comparedto other countries. In order to bridge the gap it would be essential to take steps to improve productivity bytaking steps like promoting skill development programmes, form better institutional arrangements of labourunions, rationalise employment laws etc. Thrust on infrastructure development, creating the right investmentenabling environment and focussing on global competitiveness will hold the key for India to become a majormanufacturing hub.
9,336
109,767
India Singapore
Electronic Component
10,103
126,079
29,710
8,052
India US Brazil Thailand
Food Processing
Labour productivity (in USD/employee) – comparison of India with competing nations
75
59
India China
Food Processing
86 76
India China
Textiles
Raw material Energy Labour Transportation
75
62
India China
Electrical Equipment

Final Report – Comprehensive Regional PlanPwC/ Nippon Koei 71
Chennai accounts for ~60% of India'sautomotive export
About 50% of the world's SEI CMM Level 5certified companies are located in Bengaluru
Chitradurga is the 4th largest producerof wind energy and has one of the highwind sites in the country with over 20,000windturbines.
4.2 India’s manufacturing sector – the accelerated growthplan
4.2.1 Vision, strategy and frameworkThe Government of India’s vision is to ensure India emerges as a preferred manufacturing destination forinvestors, and create employment opportunities for a large set of people within India and thereby proper theeconomy of the country. To achieve this, Government of India came up with the National Manufacturing Policyin 2011 with the following vision:
Figure4.2.1: India’s vision for the manufacturing sector – National Manufacturing Policy
The IMF’s global competitiveness report gives 25% weightage to quality of infrastructure. In order to promotethe growth of manufacturing sector in India and meet the objectives of the National Manufacturing Policyseveral initiatives have been taken by Government of India. Infrastructure development is one of the top agendaitems. Government has put impetus on developing large investments and manufacturing zones, sector specificinvestment regions and industrial corridors across India. Delhi Mumbai Industrial Corridor and ChennaiMumbai Industrial Corridor are amongst the most ambitious projects announced by India under theseinitiatives.
4.2.2CBIC development– integral to growth aspirationChennai Bengaluru Industrial Corridor will be one of the key drivers for economic growth in India and will be astrong contributor to the economic growth of South India as well. Presently the area under the corridor assumesone of the prime positions on development landscape and as one of the key contributors to the economies ofSouth India in specific and India in general.
Geographically, it is strategically planned between two major South Indian cities, Bengaluru andChennai. Chennai is a key financial centre in South India,with strong presence of major Indian financial institutionsand foreign banks. It is also a renowned auto production huband is named “The Detroit of India”. Bengaluru is the 4th
largest technological cluster in the world after SiliconValley, Boston and London. About 50% of MNC R&D centresin India are based in Bengaluru. With two internationalairports (Chennai and Bengaluru) and two major seaports (Chennai and Ennore), CBIC can further capitalize onthe strength of Chennai and Bengaluru.
Increase manufacturing sector growth to 12-14% over the medium term
Create 100 million additional jobs by 2022
Create appropriate skill sets among rural migrant and urban poor
Increase domestic value addition and technological depth
Enhance global competitiveness through policy support
Ensure sustainability of growth
DIPP’s Vision -National
ManufacturingPolicy
Objectives ofthe Policy
Increase share of manufacturing in GDP from 16% to25% by 2022

Final Report – Comprehensive Regional PlanPwC/ Nippon Koei 72
Figure4.2.2: Map of CBIC region
Figure4.2.3: Demographic dividend of the corridor
The area under CBIC covers 3.6% of India’s total territory and is home to 4.1% of country’s total population10. Itis a highly urbanized area with urbanization levels 1.5 times higher than the national average. The districts
10Source: Census 2011
Chennai
Dharmapuri
KancheepuramKrishnagiri
Thiruvallur
Tiruvannamalai
Vellore
BangaloreRural
BangaloreUrban
Chikkaballapur
Chitradurga
Kolar
Ramanagara
Tumkur
Anantapur
Chittoor
Nellore
100% 100%
73.0%
46.1%
31.2%
4.1% 3.6%
78.3%
50.8% 51.2%
0%
20%
40%
60%
80%
100%
120%
Population Area Literacy rate % of workers to totalpopulation
Urbanization ratio
CBIC demographic dividend
India CBIC
Bengaluru
Chennai

Final Report – Comprehensive Regional PlanPwC/ Nippon Koei 73
Kancheepuram is the traditional centre of silkweaving and handloom industries of India
Vellore District has a dominant presence in theleather and leather based industries andaccounts ~ 37% of the country’s export of Leatherproducts.
Around 400 of the Fortune Global 500companies outsource their IT services to firms inBengaluru
7%2% 3% 3% 4% 4%
8% 8% 10%
17%
35%
Oth
ers
Ele
ctri
cal
mac
hin
ery
Fo
od
Pro
cess
ing
Met
all
urg
ica
lin
du
stry
Ph
arm
ace
uti
cals
Tex
tile
s
Ele
ctro
nic
s
Mac
hin
ery
Ch
emic
al
an
dP
etro
chem
ica
l
Info
rma
tio
nT
ech
no
log
y
Au
toa
nd
au
toco
mp
on
ents
Sector-wise investment in the corridor
selected for the corridor are above the national average in terms of literacy rates as well as percentage ofworkers to total population.
Figure4.2.4: Economic performance of the corridor
Districts under CBIC are strong economic performers;their overall contribution to GDP is 6%11. 7.9% of totalinvestments (completed projects) in the country for thepast decade are landed in these districts and another 7.5%of upcoming projects are planned and being implementedin the CBIC region.
CBIC region has the largest MSME base in India and is ahost to 15.4% of country’s total MSME units12.
Automobiles, Information technology, Chemical and Petrochemical, Machinery and Electronics are the top 5sectors that contribute to around three-fourth of total investment in the corridor.
Figure4.2.5: Sector-wise investments in the corridor
Source: CMIE CapEx database
11Source: Socio-Economic Review, GOI12Source:Entrepreneurs Manual (Part - II), DCMSME
100% 100% 100% 100%
6.0% 7.9% 7.5%15.4%
0%
20%
40%
60%
80%
100%
120%
GDP Investments, Completedprojects
Investments, Outstandingprojects
MSME, India
Strong economic performance
India CBIC

Final Report – Comprehensive Regional PlanPwC/ Nippon Koei 74
With 4.1%population and 3.6%of land mass, CBIC region contributes
to 6% to the national GDP and hosts 15.4%of country’s MSMEs.
4.2.3Drivers of industrial growth in CBICAn in depth analysis for identifying potential industries for the corridor was undertaken as a part of InterimReport I. The parameters used for the analysis is as indicated in the figure below.
Figure4.2.6: parameters used for short-listing of potential sector in the corridor
As per the analysis undertaken, the following sectors are the key drivers of industrial growth in the CBIC region:
Figure4.2.7: Sectors shortlisted as potential sectors for the corridor
Global industrialanalysis
Policy levelanalysis
National andstate industrial
analysis
Corridor levelindustrialanalysis
Upcoming industry
sub-segmentsanalysis
• Global tradeanalysis(analysis ofcommodities)
• Cross bordertransactions
• Foreign DirectInvestment
• National levelmanufacturingpolicy
• FDI Policy
• Foreign tradepolicy
• State levelindustrialpolicies
• Investment–completedandupcoming
• Performance ofthe sector(Contributionto GDP andproject growth)
• FDI analysis
• IEM analysis
• Tradeperformance(Export andImport)
• State’scontribution tonational output
• Analysis ofindustries inthe corridor
• MSME’s in thecorridor
• Key companiesin the region
• Projectedgrowth rateglobally till2020
• Projectedgrowth rate inIndia till 2020
• Size of thesector globallyand in India
Food Processing
Automobiles
Chemicals and Petrochemicals
Metallurgical industries
Machinery
Electronics
Textiles
Pharmaceuticals
Electrical Machinery
IT and Financial services
TOP SECTORS
Animation and Gaming Medical Equipment
Technical textiles
TOP SUB - SECTORS

Final Report – Comprehensive Regional PlanPwC/ Nippon Koei 75
4.3 Corridor’s vision, strategy and frameworkThe long term vision of the corridor is to develop itself as “a globally competitive manufacturing hubthat can make sustainable economic and environmental impact locally”. The vision is articulatedacross five principle strategies:
Figure4.3.1: Strategic framework for CBIC
Repositioning manufacturing in the region: While, tertiary sector has given substantial thrust to corridoreconomy in the past; going forward manufacturing will further add to this thrust. The manufacturingcontribution in the corridor will contribute 24-25% of corridor GDP by 2033-34.
Enabling global acceptance: The manufacturing industries in the corridor will be driven by high standardsthat gain preference in international markets. In addition to reducing imports and catering to domesticdemand, the industries will also drive up export from the region.
Activating higher value: The manufacturing industries will integrate further into hi-tech and down-streamproducts that will create higher value add per unit produced and shall drive up GDP. The corridor GDPgrowth will move up from 8-9% as seen during past 9 years to an average of 12-13% during the next 20years.
Suiting, creating and engaging local skills: The economic progression will create a sustainable impact onlocal communities creating and engaging an employable workforce with high skill levels. The corridor willprogressively create 22 million additional jobs in next 20 years.
Prioritising environment: The corridor will take into account environmental responsibility with focus ongreen processes and products aimed at reducing carbon emissions in the region.
National & global
Regional & national
Local and regional
Employmentcreation
Prioritizingsustainable
development
Thrust tomanufacturing
and MSME
Thrust toeconomic
growth
Enablingglobal
acceptance
CBIC
Competitivemanufacturing hub
Boost exportsand value
addition inkey sectors
12-13%corridor GDP
growth fornext 2o years
Skill development & 22million job creation
24-25% contributionfrom manufacturing
sector to GDP
Environmentalsustainability andreduced emissions
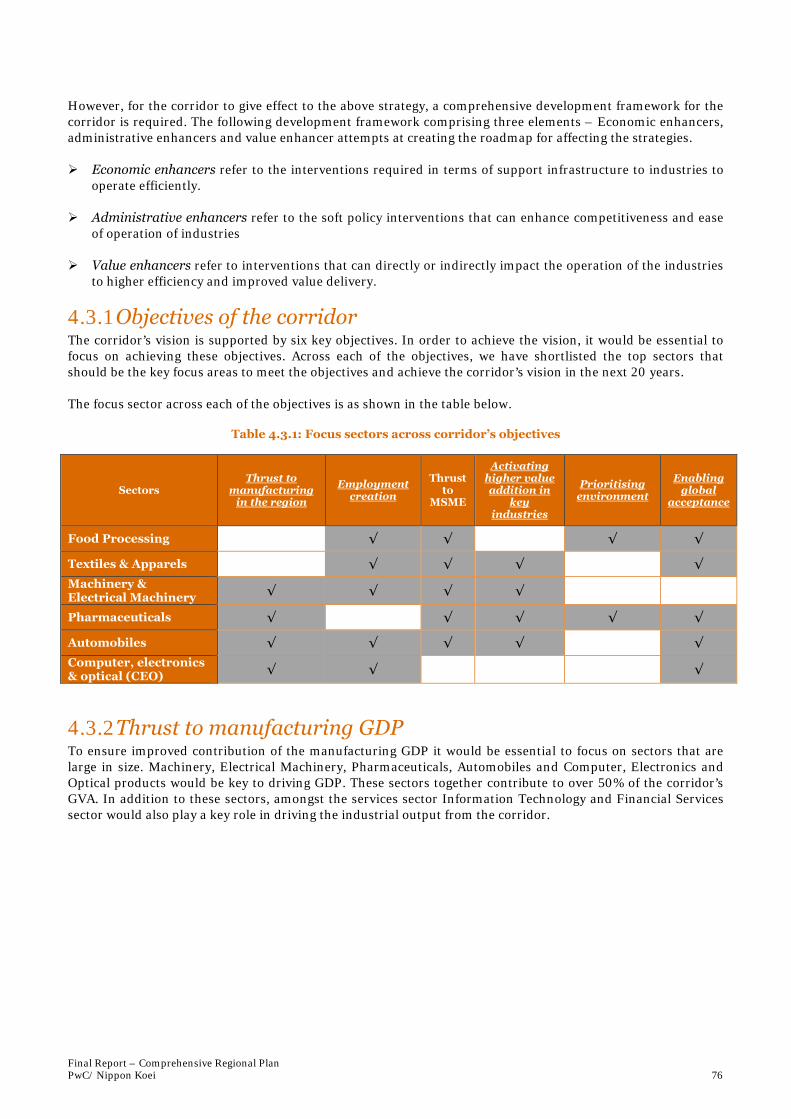
Final Report – Comprehensive Regional PlanPwC/ Nippon Koei 76
However, for the corridor to give effect to the above strategy, a comprehensive development framework for thecorridor is required. The following development framework comprising three elements – Economic enhancers,administrative enhancers and value enhancer attempts at creating the roadmap for affecting the strategies.
Economic enhancers refer to the interventions required in terms of support infrastructure to industries tooperate efficiently.
Administrative enhancers refer to the soft policy interventions that can enhance competitiveness and easeof operation of industries
Value enhancers refer to interventions that can directly or indirectly impact the operation of the industriesto higher efficiency and improved value delivery.
4.3.1 Objectives of the corridorThe corridor’s vision is supported by six key objectives. In order to achieve the vision, it would be essential tofocus on achieving these objectives. Across each of the objectives, we have shortlisted the top sectors thatshould be the key focus areas to meet the objectives and achieve the corridor’s vision in the next 20 years.
The focus sector across each of the objectives is as shown in the table below.
Table 4.3.1: Focus sectors across corridor’s objectives
SectorsThrust to
manufacturingin the region
Employmentcreation
Thrustto
MSME
Activatinghigher valueaddition in
keyindustries
Prioritisingenvironment
Enablingglobal
acceptance
Food Processing √ √ √ √
Textiles & Apparels √ √ √ √
Machinery &Electrical Machinery
√ √ √ √
Pharmaceuticals √ √ √ √ √
Automobiles √ √ √ √ √
Computer, electronics& optical (CEO)
√ √ √
4.3.2Thrust to manufacturing GDPTo ensure improved contribution of the manufacturing GDP it would be essential to focus on sectors that arelarge in size. Machinery, Electrical Machinery, Pharmaceuticals, Automobiles and Computer, Electronics andOptical products would be key to driving GDP. These sectors together contribute to over 50% of the corridor’sGVA. In addition to these sectors, amongst the services sector Information Technology and Financial Servicessector would also play a key role in driving the industrial output from the corridor.

Final Report – Comprehensive Regional PlanPwC/ Nippon Koei 77
Source: ASI, PwC analysis
Figure4.3.2: Contribution of top Sector’s to corridor’s Gross Value Added
4.3.3Employment CreationIn terms of employment, Food processing, Textiles and Apparels, Electrical Machinery, Machinery,Automobiles and CEO sector are expected to generate around 70% of the employment. Proposed interventionsin these sectors will help in increasing job creation from 4 million under business as usual to 22 million underBIS. In addition to this, IT sector is expected to generate an additional employment of around 10 million by2033-34 in the corridor districts.
Figure4.3.3: Expected employment in corridor’s manufacturing sector in 2033-34
13%
26%
8%
10%
11%
1%
31%
13%
26%
8%10% 11%
2%
31%21%
12% 8%
8%
17%
1%
32%
7%
15%10%
13% 12% 12%
31%
FP
T&
A
EM
Mac
hin
ery
Au
to
CE
O
Oth
ers
FP
T&
A
EM
Mac
hin
ery
Au
to
CE
O
Oth
ers
Expected employment in the corridor's manufacturing sector
2014-15 2033-34
Source: NMCC, PwC analysis
Bars in green represent increase in % contribution to corridor's employment - 2013-14 vs. 2033-34
Bars in red represent decrease in % contribution to corridor's employment - 2013-14 vs. 2033-34
2033-34: 9 million 2033-34: 30 million
2014-15: 8 million
BAU BIS
10%9%
7%
30% 3%
42%
9%
11% 5%
16%
25%
34%E
M
Mac
hin
ery
Ph
arm
a
Au
to
CE
O
Oth
ers
EM
Mac
hin
ery
Ph
arm
a
Au
to
CE
O
Oth
ers
Contribution of top sectors to corridor’s GVA in 2033-34
BAU - Rs. 198,524 cr BIS - Rs. 903,565 cr
2014-15 ~ 64,000 cr

Final Report – Comprehensive Regional PlanPwC/ Nippon Koei 78
4.3.4Thrust to MSMEMachinery, Electrical Machinery, Automobiles, Textiles and Apparels, Food Processing, Chemical &Petrochemical and Pharmaceuticals are likely to play a key role in developing the MSME output. These sectorstogether contribute to around 65% of the employment in the corridor in the MSME sector. For MSMEs toflourish in the corridor it would be essential to focus on these sectors and take steps to overcome the challengesfaced by enterprises across all sectors.
Figure4.3.4: Contribution of major sectors to employment in the MSME sector
4.3.5Achieving higher value addition in key industriesAutomobiles, Pharmaceuticals, Machinery, Electrical Machinery, Textiles and Apparels and Medical Equipmentare among the highest value addition sectors. Amongst these, Pharmaceuticals and Electrical Machinery areexpected to be the key drivers of value addition. Technical textiles and apparels are the segments that areexpected to drive value addition in Textiles and Apparels sector. In addition to these sectors, MedicalEquipment which is a sunrise sector in India is expected to be high on value addition and will be majorly drivenby product innovation in India.
21%Employment
16%
12%9%
9%
34%
M & EM, 19%
Output
Auto, 21%
T & A, 6%FP, 8%
C&P*, 10%
Others, 36%
Sector wise MSME statistics at corridor level
*Includes pharmaceuticals
Source: Final Report, Fourth All Inida Census of Micro, Small and Medium Enterprises, Ministry of MSMEs, GoI,PwC analysis

Final Report – Comprehensive Regional PlanPwC/ Nippon Koei 79
Figure4.3.5: Focus sectors to increase corridor’s value addition in the manufacturing sector
4.3.6Prioritising sustainable developmentThe corridor will focus on promoting sustainable industrial development by focussing on efficient use ofresources like Power, Water, and Land. Also,the corridor will promote green mobilitythrough auto sector investments in electricvehicles and green energy throughrenewable energy sector investments. Theprocess of industrial growth plays a vitalrole in economic development, but anyindustrial growth appears to correspondwith environmental deterioration. The costof environmental damage has beenestimated to be to the tune of 5% of GDP inIndia, approximately USD 32 billion. TheCentral Pollution Control Board hasidentified 17 highly polluting industries, themajority of which are manufacturingindustries. The food processing,pharmaceuticals, chemical & petrochemical, metallurgy are identified as highly polluting sectors. These sectorsare also going to drive investmens within the corridor. Secondly, while MSMEs contribute to over 40% toindustrial production, they account for substantial pollution i.e. 70% of the total industrial pollution load ofIndia. Regulatory mechanisms to ensure compliance are ill-suited towards MSMEs, as they are tailored moretowards larger industries, creating a scenario where MSMEs are unable to comply with regulations. Suchapproach will have to be avoided. The key strategies identified to ensure sustainability are:
Incentivising scrap consolidation and recycling to reduce natural resource exploitation Incentivise products that are energy efficient and low on emissions Incentivise use of energy efficient machinery through subsidies Identify ways to prevent pollution at source through setting up of treatment plants. etc Improve efficient utilization of resources through productivity optimization projects, etc
Medical equipmentT & A
EM
Machinery
Pharma
Auto
0%
2%
4%
6%
8%
10%
12%
14%
16%
18%
0.15 0.20 0.25 0.30 0.35%c
on
trib
uti
on
of
se
cto
rto
co
rr
ido
r's
ou
tpu
t
Value add of key sectors (GVA/output)
Sectors expected to drive value addition in corridor 2033-34
Metallury
Cement
Chemicals &petrochemical
s
FoodProcessing -
sugar
Beverages -distillary
Dyes andIntermediates
Pharmaceuticals
Pulp & Paper
Tannery
Power Plant
Oil refineries
Most polluting manufacturing industries inIndia

Final Report – Comprehensive Regional PlanPwC/ Nippon Koei 80
4.3.7ExportsAutomobiles, Textiles & Apparels, Computer, electronic and Optical products (CEO), Pharmaceuticals and Foodprocessing sectors are likely to drive exports in the corridor. Under the BAU scenario we have assumed that thepercentage of exports to output for all sectors would remain the same in 2014-15 and 2033-34. Under BIS case,we have computed the percentage based on historic performance. However, the increase in percentage ofexports to output in 2033-34 has been capped to 25%.
FP
T&A
Pharma
Auto
CEO
0%
10%
20%
30%
40%
50%
60%
70%
0% 5% 10% 15% 20% 25% 30% 35% 40% 45% 50%
Ex
po
rt
as
a%
of
ou
tpu
t-
20
33
-34
Export as a % of output - 2014-15
Exports as a % of output under BIS scenario
Note: Size of thebubble indicates thevalue of exports in2033-34

Final Report – Comprehensive Regional PlanPwC/ Nippon Koei 81
4.3.8 Corridor competitivenessHaving identified the strategy to achieve the desired objectives of the vision, it is now important to understandwhat interventions shall be necessary to enable the sectors to move to a higher trajectory. In this context, adevelopment framework comprising three elements – Economic enhancers, administrative enhancers and valueenhancer has been created that attempts at improving the corridor competitiveness across individual sectors
4.3.8.1 Economic enhancersQuality infrastructure plays a key role in the development of the economy. CBIC region is regarded as apromising investment destination. However, discussion with Japanese companies has highlighted theinfrastructure bottlenecks in the region. Some of them are as listed below.
Ports – The key ports in the region include Chennai, Ennore and Krishnapatnam port. The challengesin these ports include large operational issues, inefficient safety measures and high cost of usage. Itwould be essential for the government and private players to take necessary steps to improve thecompetitiveness of the ports in the region.
Road – At various stretches in the CBIC region there are multiple issues like traffic congestion in areasaround the Chennai and Ennore Port and absence of last mile connectivity for industrial parks. Becauseof this it is difficult for companies to calculate the lead time for their goods. In order to resolve theseissues it would be essential for the government to frame a comprehensive road plan considering theestimated future industrial development in the corridor
Power – The region experiences a chronic shortage of power which impedes the production plans ofindustries operating in the region. Hence, to solve this it would be essential for the government toframe a comprehensive electricity supply and demand plan
Railways – The current management of the railway transport is unreliable. There have been cases ofdamage due to bad management and the lead time cannot be estimated accurately due to frequentdelays. Freight railway would be an effective transportation means provided the management andreliability is improved.
Current linkage of Agri products with the consumption markets needs to be enhanced
Industrial Estates – State of the Art infrastructure needed for key industrial estates
Corridor competitiveness
• Development ofqualityintegratedindustrialinfrastructure
• Promotion oflocal factor costadvantages
• Easy of access toconsumptionmarkets andgateways tomarkets
• Reliableavailability of
• Institutionalreforms
• Regulatory &policy support(economic,trade, financialand tax systems)
• Ease in doingbusiness
• Productivityenhancement
• Efficiency inresource use
• Technologicalreadiness andupgradation
• Skill development• Effective supply
chain• Research and
development• Value addition
Economicenhancers
Administrativeenhancers
Value enhancers

Final Report – Comprehensive Regional PlanPwC/ Nippon Koei 82
4.3.8.2 Administrative enhancersFor the corridor to be a hub for industrial development and economic prosperity, it would be essential to have astrong policy framework. Currently, companies operating in the region are facing several policy level issues(based on stakeholder consultations). Some of them are as listed below:
Due to lack of organised and integrated regulations and guidelines, there is a frequent revision in therules and guidelines at the port and airports.
Frequent change in the rules of taxation at the port and airport Lengthy and time consuming process for companies to set their manufacturing facility
Specific policy instruments have to be conceptualized to achieve the objectives which are aligned with the CBICVision. The instruments should include, but not limited t0, regulations for improving ease of business,mechanisms for development of technology, skill up gradation, initiatives to develop clusters, physical andsocial infrastructure and methods to synchronize trade and investment policies with manufacturing policiespertinent to the Corridor. The policies and programmes for implementation should aim to increase thecompetitiveness of industries in the Corridor.
4.3.8.2.1 Ease of business
Government regulations and practices ease or constrain business activity. Doing Business in India comparesbusiness regulations across 17 Indian cities. A low ranking means that the government has created a regulatoryenvironment conducive to operating a business13. The index takes into account local regulations that affect 7stages in the life of a small or medium-size domestic enterprise: starting a business, dealing with constructionpermits, registering property, paying taxes, trading across borders, enforcing contracts, and closing a business.
Table 4.3.2: Business regulations in India - Ranking of Indian cities
Rank City, State Rank City, State
1 Ludhiana, Punjab (easiest) 10 Mumbai, Maharashtra2 Hyderabad, Andhra Pradesh 11 Indore, Madhya Pradesh
3 Bhubaneshwar, Orissa 12 Noida, Uttar Pradesh
4 Gurgaon, Haryana 13 Bengaluru, Karnataka5 Ahmedabad, Gujarat 14 Patna, Bihar
6 New Delhi, Delhi 15 Chennai, Tamil Nadu7 Jaipur, Rajasthan 16 Kochi, Kerala
8 Guwahati, Assam 17 Kolkata, West Bengal9 Ranchi, Jharkhand
Source: Doing Business database
While all cities in India have a similar legal and institutional framework, local regulations and theimplementation of national laws vary. And these variations across India in the regulatory ease of doing businessshow the potential for regions to learn from one another.
The states in the CBIC region are performing well on parameters such as dealing with construction permits,resolving insolvency trade across borders; however they lag behind on parameters such as ease of starting abusiness, registering property, paying taxes, enforcing contracts etc.
13The Hindu

Final Report – Comprehensive Regional PlanPwC/ Nippon Koei 83
Figure4.3.6: Doing Business in India - Index
Since regulatory reforms can help businesses operate efficiently in the formal sector. “Reforms that cut red tape,clarify property rights, and streamline regulatory compliance can yield big payoffs for firms and workers” (theWorld Bank). There is a need to focus on reforming procedural and regulatory formalities in the CBIC region toreduce compliance burden on industries.
4.3.8.3 Value enhancersTo attract investments in the corridor it would be essential to ensure improved performance of sectorsoperating in the region. This would be possible by addressing the challenges of the key sectors. Productivity ofcompanies across majority of the sectors needs to be improved. For example, the labour productivity of Foodprocessing and electronic components is 10 times lesser than competing nations. Capital productivity of textileand electrical equipment sectors in India is far lower than that of China. The corridor’s development strategyshould focus on improving the productivity across these sectors as they are critical to corridor’s performance. Itis important to have a strong indigenous value chain addition element. Many districts within the corridor havewater availability challenges and hence, industries within the corridor need to focus on efficient use of waterand land by using technology. Necessary steps need to be taken to promote use of latest and efficienttechnologies to enable growth of the manufacturing sector. It would also be essential to ensure that thetechnology used is sustainable and supports value addition across sectors. The corridor is a hub for MSMEs andspecial incentives are required by the MSMEs within the corridor for acquiring technology. A well developedcluster can give a unit located in it a cost advantage of up to ~ 8% on account of:
• Increased supply chain responsiveness,• Consolidation of suppliers,• Decreased time-to-market,• Superior infrastructure and access to talent and• Lower logistics costs.
Hence, there is a need for coordinated effort by governments and private sector to create clusters in the CBICregion and to stimulate cluster synergies to reap above benefits. To increase the effectiveness of supply chain inthe clusters in CBIC, investments need to be made to increase access to raw materials, information andinnovations.
4.4 Analysis of CBIC-Key growth driversThis section represents analysis of key growth drivers for every high potential sector in the CBIC corridor. Theapproach to the sector selection and identification of the sectors with the highest potential within CBIC hasbeen undertaken in the Interim Report I. This section presents analysis of each selected sector, includinggrowth trends and future outlook at global and national levels. It also deals with identification of growth driversfor each sector and its sub-sectors at the district level.
Analysis of each prospective sector includes listing down the key districts for investment in the corridor and keyinterventions required and strategy for development of each sector along the CBIC. Each section on individual
0
5
10
15
20
Ease of DoingBusiness Rank
Starting aBusiness
Dealing withConstruction
Permits
RegisteringProperty
Paying Taxes Trading AcrossBorders
EnforcingContracts
ResolvingInsolvency
Doing Business in India Index
Hyderabad, Andhra Pradesh Bengaluru, Karnataka Chennai, Tamil Nadu

Final Report – Comprehensive Regional PlanPwC/ Nippon Koei 84
sector concludes with identification of the factors to be enabled in the CBIC cluster to ensure success of eachselected sector. Below the consultant summarized the past growth trends and possible investment districts forkey sectors:
Table 4.4: Summary of key sectors – historical growth rates and key districts for investment
SectorOutput
growth India(CAGR)
Key districts for investment in the corridor
Computer,electronics andoptical products
15%(2006-11)
Chennai, Kancheepuram, Bengaluru urban, Bengaluru rural
Metallurgy14%(2004-12)
Chitradurga, Anantapur, Chittoor, Nellore, Tiruvallur,Thiruvannamalai, Kancheepuram, Tumkur, Bengaluru rural
Textiles andApparel
17%(2006-11)
Tiruvallur, Dharmapuri, Kancheepuram, Bengaluru Rural,Bengaluru Urban, Chitradurga
Food processing20%(2009-11)
Nellore, Chittoor, Tiruvannamalai, Dharmapuri
Pharmaceuticals14%(2008-12)
Bengaluru Urban, Bengaluru Rural, Chennai, Kancheepuram,Nellore
Chemical andpetrochemicals
11%(2009-13)
Bengaluru Urban, Bengaluru Rural, Ramnagara, Chennai ,Tiruvallur
Electricalmachinery
23%(2009-11) Kancheepuram, Chittoor, Chennai, Bengaluru urban, Bengaluru
Rural, Krishnagiri, TiruvallurMachinery
14%(2009-11)
IT and financial8%(2008-12)
Bengaluru Urban, Bengaluru Rural, Chennai
The sub-sections below describe each of identified high potential sectors in detail:
4.4.1 Computer, Electronic and Optical products (CEO)The global electronics industry, which is at USD 1,750 billion, is the largest and fastest growing manufacturingindustry in the world14. The production of electronics products has continued to shift from developed countries(US, Japan, Europe) to developing countries especially in Asia Pacific region. Component manufacturers movedin the same direction. Asia’s contribution to electronics components has increased from 42% to 52%15 between2008 and 2011. With 5 out of top 10 countries, Asia dominates the electronics market16. The global electronicsindustry is expected to reach USD 2,400 billion by 2020.
Over the last couple of decades India has been the epicenter of consumer demand fuelled by a phenomenal GDPgrowth. Electronics market in India grew at a rate of 14% between 2007-08 and 2011-12. While demandincreased across all sectors, demand for high technology products, specifically electronic products hasregistered significant growth and going by current estimates, the demand for electronics in the country isprojected to increase from USD 45 billion in 2009 to USD400 billion by 202017.
India exports around 17% of its total electronics hardware production. Indian Electronics Hardware exportshave shown steady growth rates of 15% (CAGR, between FY 2001 to 2008), yet India remains a net importerwith electronics imports. Amongst the segments being exported, Communication and Broadcast Equipment(CBE) is the leading segment having registered a 14% 5-year CAGR. In 2011-12 CBE was predominantlyexported to the Middle East countries (28%), African countries (19%), South Asian countries, includingSingapore and Hong Kong (15%), EU (13%) and North America (11%). Electronic Components (EC) is thesecond largest segment contributing to exports that have grown at CAGR of 26%. In 2011-12 electronicscomponents were shipped to EU (33%), North America (16%); South Asian countries, including Singapore and
14 Source: www.apit.ap.gov.in15Source: World Electronic Industries (www.decision.eu), http://www.custerconsulting.com16Source: Human Resource and Skill Requirements in the Electronics and IT Hardware Industry, NSDC17Source: Task Force Report

Final Report – Comprehensive Regional PlanPwC/ Nippon Koei 85
Hong Kong (16%) and Middle East countries (12%). Asia dominates the electronics market18. Over 40% ofsemiconductor manufacturing is done in China.
Owing to increased wage rates in China, manufacturers are looking for alternate locations within Asia. IndianCEO exports are expected to increase from USD 4 billion to USD 80 billion by 202019. Tamil Nadu leads India’sCEO exports with a share of 46%, followed by Karnataka (17%), Uttar Pradesh (14%), Maharashtra (12%) andKerala (3%).
4.4.1.1 Key growth drivers for the sectorUntil 1984, the CEO sector was primarily government owned. The late 1980s witnessed a rapid growth of theelectronics industry due to sweeping economic changes, resulting in the liberalization and globalization of theeconomy. The economic transformation was motivated by two compelling factors - the determination to boosteconomic growth, and to accelerate the development of export-oriented industries, like the electronics industry.The electronics industry has recorded very high growth in subsequent years. The easing of foreign investmentnorms, allowance of 100 percent foreign equity, reduction in custom tariffs, and delicensing of severalconsumer electronic products attracted remarkable amount of foreign collaboration and investment. Thedomestic industry also responded favorably to the policies of the government. The opening of the electronicsfield to private sector enabled entrepreneurs to establish industries to meet hitherto suppressed demand.
Improvements in the electronics industry have not been limited to a particular segment, but encompass all itssectors. Strides have been made in the areas of commercial electronics, software, telecommunications,instrumentation, positioning and networking systems, and defense. The result has been a significant tradegrowth that began in the late 1990s.
Though all sub-segments grew at a CAGR of over 10%, CBE and EC grew at the highest CAGR – 24% and 22%respectively between 2008 and 2013. The largest sub-segment is CBE whose share has improved from 22% to31% between 2008 and 2013 due to increasing mobile and broadband penetration in the country, and focus ofthe government on telecommunication infrastructure development. EC segment’s contribution to the sector hasincreased to 15% from 11% in 2007-08 on account of growing share of exports in low-end components andintroduction of domestic high-end manufacturing (wafers, photovoltaic, solar cells, etc.)
Some of the key reasons for a spur in demand are -
Growth in population Growth in per capita income and increased consumer spending for electronic products -
Electronics goods have become a necessary utility, hence, affordable. The quick rate of obsolescence intechnology is making products cheaper and affordable for lower income groups as well.
Investment in infrastructure -Average 37% of total annual expenditure by the Government of Indiahas been dedicated to energy, transport and communication
Focus on innovative products at low cost - India is a price-sensitive market; it has a substantialdemand for cost-effective products. Products that meet basic requirements at penetration price pointshave good potential and can create a market
Increased spent on IT products - With public and private sector in India adopting automation, thedemand for IT equipment is increasing. Government of India has announced National e-governancePlan (estimated budget of more than USD 9 bn). There are 31 mission mode projects being undertaken.
The Indian Electronics Industry offers a potential investment opportunity in various segments, which includetelecommunications, consumer electronics, computer hardware and software, and medical electronic systems.
Consumer Electronics would be predominantly driven by digitization, higher disposable income,availability of financing, affordable products, retail chains are the future growth drivers for thesegment. Growth in household spending would have spin off effects in Telecommunications and ITHardware as well.
Communication and Broadcast Equipment (CBE) would be mainly driven by future increasing mobilepenetration, entry-level mobile phones and an increasing rural subscriber base/mobile penetration toB and C circles with mobile connections. Further, increasing number of wire line and wirelessbroadband (Broadband Wireless Access/WiMax as well as demand for Consumer Premises Equipmentand Fibre to the Home are likely to drive demand in the long term.
18Source: Human Resource and Skill Requirements in the Electronics and IT Hardware Industry, NSDC19 Source: DEITY – National Electronics Policy 2012

Final Report – Comprehensive Regional PlanPwC/ Nippon Koei 86
Computer Hardware would be driven by increasing household spend on IT, education, as well asdomestic IT demand by Indian companies especially in the small and medium businesses (SMB)segment, e-governance initiatives under the National e-Governance Programme (NEGP), IT basededucation in schools as well as growth of IT and ITES industry, growth in telecom infrastructure andawareness and affordability of technology will drive the market of computer hardware
Electronics Components (EC) and high-tech manufacturing: Wafer fabs, ATMPs, solar PVmanufacturing, storage devices, displays, display panels and nano-technology products are the ones todrive the segment demand owning to industry’s effort to shift to high-end products. In line with energyconservation measures, LED manufacturing is also likely to be a high-potential area. Increasingsubscriber base, growth in rural mobile telephony, broadband penetration and connectivity are themajor demand drivers
Strategic Electronics would be driven by sustained GDP growth and increasing defence spending.
The above streams would have downstream effect on Industrial Electronics and components. ElectronicsManufacturing Services and R&D based exports will also be a major driver of growth in the industry. Increasedvalue addition in these areas will further drive demand for production, sales and after sales support, which willincrease demand for skilled human resources.
4.4.1.2 Key nodes for CEO investment in the corridorTamil Nadu offers good engineering talent, a sound manufacturing culture and ecosystem, strong base fordesign skills, excellent transport connectivity in terms of sea ports and airport, and a well developed tertiarysector that offers myriad services to support manufacturing. Tamil Nadu has been traditionally dominating theCEO industry by holding 21% (2010-11) of the national sector output. The districts of Tamil Nadu in the CBICregion contribute 93% (2010-11) of the sector’s output from the state. All the developments have been in andaround Chennai which contributes 64% to the state output. Kancheepuram which is adjunct to Chennai hasbeen witnessing steady growth leading to its share to be 34% of the state’s output.
In the case of Karnataka, it account for 9% (2010-11) of the national output. The districts in Karnataka withinthe CBIC region contribute 54% (2010-11) of the state sector output. Amongst the developments in the Corridor,93% of concentration is in Bengaluru Urban (88%) and Bengaluru Rural (5%) districts and 7% in Kolar districts.Though the performance of the CEO sector in AP has been 11% of the national output, the presence of the CEOsector in the districts in the CBIC region in Andhra Pradesh is nominal, resulting in limiting the contribution to0.68% of the corridor output.
Hence, the top districts for promoting investments in the CEO sector within CBIC are envisaged to be Chennai,Kancheepuram, Bengaluru Urban and Bengaluru Rural.
Table 4.4.1: Current Strengths for CEO products sector in the Corridor
District Current Strengths and Challenges
Chennai
Abundant availability of skilled manpower - Chennai ranks 4th in the highestnumber of employees in India’s IT & ITES sector and has one of largestavailable human resource bases
Excellent seaport connectivity, with proximity to Chennai and Ennore sea ports Excellent road & rail connectivity with other cities Poor supply of electricity & high rate of electricity units
Kancheepuram
Availability of skilled labour Excellent seaport connectivity, with proximity to Chennai (~40 km) and Ennore
sea ports (~45 km) Excellent road connectivity through the world class East Coast Road and
upcoming upgraded NH4 & 45 Presence of several industrial parks and industrial estates with land availability Inadequate availability of power & and its fluctuations Water availability a challenge

Final Report – Comprehensive Regional PlanPwC/ Nippon Koei 87
District Current Strengths and Challenges
Bengaluru urban
Availability of skilled resources Presence of large industrial clusters like Bommasandra Industrial Area and
Peenya Industrial Area Houses several R&D institutions owing to the ready availability of quality
manpower Water is scarce and there are frequent power outages Connectivity with Mangalore (~250 km) and Chennai (~320 km) sea
ports for import of raw materials needs to be improved Availability of Industrial land
Bengaluru Rural
Availability of skilled resources Proximity to urban node Well developed industrial estates like Hoskote Proximity to the international airport in Bengaluru. Water is scarce and there are frequent power outages
Source: District profiles, MSME profiles, industry reports and PwC analysis
4.4.1.3 Key interventions required and strategy for developingCEO sector along CBIC
Based on the proposed framework for industrial development strategy for CBIC, we propose certain keyinterventions/recommendations which need to be provided by coordinated effort by government and privatesector to develop the CEO sector along the identified districts in the corridor. These recommendations havebeen segregated as economic enhancers, administrative enhancers and value enhancers.
Based on literature review and comprehension of state policies (Electronic Hardware Policy 2012-2017 ofGovernment of Andhra Pradesh, Karnataka ESDM Policy 2013) for the sector, we have summarized the keyinterventions required for the CEO sector, along with the existing challenges in the sector:
Table 4.4.2: Shortcomings and key interventions required for increasing investments in the corridor - CEOsector – economic enhancers
Enhancers Current shortcomings Key interventions required
Economic
Industrial infrastructure (Wateravailability, power availability, linkage withports) has several limitations that isimpacting performance
Acquiring land to set up manufacturingfacilities is a time consuming process in thethree states.
The poor logistics infrastructure is leadingto inventory pile up.
Poor linkages with suppliers, end productmanufacturers, distributors, retailers
Rail connectivity to sea-ports should beimproved to promote exports from theCorridor.
Road connectivity with demand centres needsto be improved.
CEO industries could be exempted from thepurview of power cuts within the corridor andusage of renewable energy should beincentivised*.
Government to play an active role inacquiring land parcels for industries anddeveloping key
Develop freight corridor between Bengalururural and Chennai seaport, to promoteexports.
Source: Sector policies

Final Report – Comprehensive Regional PlanPwC/ Nippon Koei 88
Table 4.4.3: Shortcomings and key interventions required for increasing investments in the corridor - CEOsector – Administrative enhancers
Enhancers Current shortcomings Key interventions required
Administrative When compared to low cost destinationssuch as China, Taiwan and Singapore,India’s current tax structure makes thefinal product less competitive. There are noduties on finished goods imported,however there are duties/taxes levied onimported components/inputs makingdomestic finished goods less competitive,hence encouraging low cost imports.
Inverted duties due to dual use inputs suchas plastics, copper, aluminium, etccontinue to trouble hardwaremanufacturers. Specific items are coveredunder Customs Notification 25/99,although the procedure for claiming thisbenefit is extremely convoluted and timeconsuming.
The corporate tax rates are amongst thehighest in India and are compounded bymultiple indirect taxes. Central Sales Tax,special additional duty and high valueadded tax (VAT) on raw materials,components and basic inputs, are theadversaries20 to the sector. The anomaly intax system are resulting in slowing downand having a regressive impact on theindustry
The stability of taxation is another issue. As of now, there are no preferential laws or
incentives in place which enforce usage ofdomestic products. This results in excessiveimport of low cost products*.
Under the current labour laws, the abilityof an organization to align employeestrengths with demand cycles is curtailed.Flexibility in labour laws is essential tocater to seasonal variation in demand.Regulations around overtime and contractsalso make it difficult to meet the highs andlows of demand21.
The Goods and Services Tax needs to beimplemented to replace most of indirecttaxes.
Need to formulate a ‘Duty Drawback Scheme’with respect to state taxes that do not getrefunded to the export units in the normalcourse of implementation of state tax laws22.
Introduction of preferential laws or incentivesto encourage or enforce usage of domesticallymanufactured products.
Single Window System for necessarypermissions and clearances. ConcernedIndustry associationinputs/suggestions/approval/recommendation may be obtained fornecessary clearances*.
Source: Sector policies
20 Source: The Economic Times - Electronics industry demands for GST from next fiscal, February 201421 Source: Electronic Hardware Policy 2012-2017 of Government of Andhra Pradesh22 Source: Karnataka ESDM Policy 2013

Final Report – Comprehensive Regional PlanPwC/ Nippon Koei 89
Table 4.4.4: Shortcomings and key interventions required for increasing investments in the corridor - CEOsector – Value enhancers
Enhancers Current shortcomings Key interventions required
Value Reliance on imports of components fromChina, Taiwan and Korea.
There is a severe shortage of trainedmanpower in the industry across levels.
Limited R&D focus - Competitors such asChina and Taiwan are way ahead in thevolumes game. The focus area should beadding more value to the existingproducts and creating new productsthrough investment in R&D.
Slow upgradation to latest available andmost efficient technology and techniques
Small and medium industry is a growingsegment and a key driver of growth forelectronics manufacturing. This segmentneeds proper financing at competitivecost which is currently not available thushindering growth of the industry.
Promote skill development in sync with theemployment potential of the sector
R&D should be the key focus area in CBIC projects.Intellectual Property (IP) creation by local unitsshould be given prime importance.
Common facilitation Centre/IncubationCentre/Cluster should be established with full pledgedtesting facilities to meet the global quality parameterssuch as EMC, Safety Testing, RF, Microwave Testing,Environmental Testing, and Endurance Testing &Other Functional Testing. These should be closer tothe industrial clusters.
Financial incentives such as investment subsidy(MSMEs), interest rebate, Tax reimbursement of VAT/ CST, subsidy on new capital equipment fortechnology upgradation, subsidy on the expensesincurred for quality certification; with a cap could beprovided.
Opportunities should be explored to tie up with majorelectronic companies located globally to giveMarketing and Technology access to local electronicdesign and manufacturing companies based in CBIC*.
A package of incentives should be offered forencouraging electronics exports including measuressuch as dollar loans, export guarantees etc*.
The usage of domestically made electronics should beencouraged especially for developmental initiatives bygovernments.
Source: Sector policies, * - Source: Electronic Hardware Policy 2012-2017 of Government of Andhra Pradesh

Final Report – Comprehensive Regional PlanPwC/ Nippon Koei 90
4.4.1.4 Computer, electronics and optical (CEO) sectorTable 4.4.5: Competitiveness analysis for CEO sector
Competingcountries
Relative
ranking of
India
Key factors for lowercompetitiveness of India
Assessment of factors for lower competitivenessInterventions required to increase
competitiveness of India
USA, Japan,China,SouthKorea,Germany,Malaysia,Taiwan,Singapore,UK
24th
rank1. Dependence on imported
raw materials2. Low quality of human
resources3. Physical infrastructure4. Research and Development
and Technology
1. Raw materiala. The industry is significantly dependent on imports of
raw materials. This has resulted in making the Indianproducts less competitive in the international market.Imported raw material approximately constitutes to 30-40% of the total raw material used in India
2. Human resourcesa. Availability of quality manpower is declining and there is
acute shortage of skilled and trained personnel. Attritionrate is also high in the sector as the salary packages arenot competitive with ITES sector
3. Physical Infrastructurea.Lack of adequate physical infrastructure like transport
system, roads, ports, airports etc. adversely affect thecompetitiveness and productivity of the sector.
b.Uninterrupted power supply is a necessary condition foroperation of IT hardware and electronics units as powerfluctuations lead to breakage of entire system.
4. Research and Development and Technologya. Due to low level of technical research and development,
Indian industry is dependent on technical know-how ofadvanced countries like USA, Germany and Japan.Further in this sector, continuous innovations areleading to rapid changes in design and technology thatgive a competitive advantage in terms of cost, speed andquality. In the absence of economy of scales, Indianorganizations find it unviable to procure andcontinuously upgrade the technology and machinery
1. Raw materiala. Strengthening the global supply chain network as
the industry is highly dependent on the import ofraw materials which would affect thecompetitiveness. The cost of the supply network orlogistic management network also needs to beassessed through value chain analysis
b.Government should ensure hassle free import ofraw material and components by streamlining theimport policy and systems and throughsimplification of import procedures
2. Human resourcesa. Development of technical institutes as per the
requirement of the sector will ensure proper skilldevelopment and would help in solving theproblem of unavailability of technical manpower
b.Industry associations should be involved indeveloping the curriculum of technical institutesto ensure that the course is designed keeping inmind the changing environment
3. Physical infrastructurea. PPP model should be promoted for the
development of necessary infrastructure in thecorridor
4. Research and Development and Technologya. Government should strengthen R & D in the
sector especially the applied research likeproduct development through special grants toleading Research Institutes/ Universities andTechnical Institutes
Source: Productivity and competitiveness of the Indian Manufacturing, IT Hardware and Electronics sector, National Manufacturing Competitiveness Council, GoI

Final Report – Comprehensive Regional PlanPwC/ Nippon Koei 91
4.4.1.5 Recommendations summaryTo promote CEO sector manufacturing within India and to exports from the CBIC region, infrastructurebottlenecks need to be removed. Opportunities should be explored to tie up with major electronic clusterslocated globally to give Marketing and Technology access to local electronic design and manufacturingcompanies based in CBIC. A package of incentives should be offered for encouraging electronics exportsincluding measures such as dollar loans, export guarantees etc
The key districts in the CBIC region are Chennai, Kancheepuram, Bengaluru Urban and Bengaluru rural whichare driving the output in the sector are urbanized. The following factors are to be enabled in the CBIC clustersin these districts to ensure success of the CEO sector –
4.4.2Metallurgy
4.4.2.1 Sector performanceIn 2012, Indian metallurgy sector registeredan output of around US$ 140 Bn 23 andcontributed to around 2% of the nationalGDP24. In terms of sub-sectoral contribution,Iron and Steel industry contributes toaround 80% of the sectoral GDP. Atconstant prices, the sector has registeredgrowth of around 14% CAGR between 2003-04 and 2011-12. The high growth rate hasbeen primarily driven by Iron and steelindustry, which grew at 14.6% during theperiod.
However, between 2011-12 and 2013-14, India registered aslow growth rate in manufacturing sector as a whole, with2.7%, 1% growth rates in successive periods from 2012-13 to2013-14. In line with national GDP and manufacturing GDP,the growth rates during these two years are expected to be
23Exchange rate of 60 Rs = 1 US$24Annual survey of industries data, MOSPI and PwC Analysis
Key factors to be enabled in the CBIC cluster to ensure success of the CEO sector
Semiconductors, ElectronicsComponents and Parts
Computer Hardware Consumer Electronics
• Economies of scale• Establishment of export markets• Established contacts with end
products manufacturers• Access to the latest available and
most efficient technology andtechniques
• Highly skilled workforceavailability
• Economies of scale• Effective cost controls• Having links with
suppliers• Having an extensive
distribution/collectionnetwork
• Development of newproducts – sizeableexpenditures on R&D
• Competitive pricing
• Easy access to distributors andretailers
• Brand strength• Established links with suppliers• Strategic alliances with technology
leaders• High levels of R&D expenditures• Highly skilled workforce availability• Local and efficient manufacturing
to reduce cost.
14%
0
20
40
60
80
100
120
140
160
180
2003-042004-05 2005-06 2006-07 2007-082008-09 2009-10 2010-11 2011-12(p)
Iron and steel contributes around 80%of sectoral GDP
Basic Iron & Steel Other precious & non-ferrous metal Casting of metals
Source: Annual survey of Industries, PwC Analysis
5.00%
5.50%
6.00%
6.50%
7.00%
7.50%
8.00%
20
14
20
16
20
18
20
20
20
22
20
24
20
26
20
28
20
30
20
32
India GDP growth rate Sector growth rate
Source: ASI data, PwC analysis, Rajya
Figure 4.4.1: Contribution of sub-sectors to metallurgysector GDP
Figure 4.4.2: Growth rate of India’s GDP vs.Metallurgy sector

Final Report – Comprehensive Regional PlanPwC/ Nippon Koei 92
around 1%. Going forward, the national demand for the sector is expected to grow between 6-8%25.
Globally, metallurgy sector comprising iron & steel, aluminium, copper, nickel, lead, zinc, tin, silver and otherbasic metals, provides key inputs for a number of industries in the manufacturing sector. In 2012, at aroundUS$ 855 Bn, metallurgical sector constituted around 5% of global trade. The sectoral demand also drives theprimary mining sector, which contributed about US$ 757 Billion (around 4%) to global trade during the sameperiod.
The landscape of metallurgy sector has been changing over the past decades. While during early 70s, theproduction centres were primarily located at industrially advanced locations, recent years have shownsignificant shift of production centres to countries that have the mineral resource (iron ore,bauxite, coking coal, etc) or are near to the mineral resource. In absence of sufficient resources in thevicinity, countering imported raw material price fluctuations by vertical integration (through acquisition ofupstream assets) has been a key feature of the sectoral strategy. The second dominating factor for the structuralshift has been because of energy prices. Being energy intensive industries, increasing energy prices along thewest has also contributed to relocation/emergence of production centres along the less expensive destinations.
Metallurgy sector is expected to be a key sector which may contribute to CBIC’s success in terms of attractinginvestments to the corridor. The corridor states of Karnataka, Tamil Nadu and Andhra Pradesh, togethercontribute to ~17% of the metallurgy sector output of India. Within the states, these districts have traditionallyaccounted for ~12% of the total metallurgy sector investment in these 3 states. CBIC region has presence of end-use industries for metallurgy sector like automobiles, defence, construction, etc which are likely to act asdemand pullers for the Metallurgy industry in the state. Within the corridor however, the presence of keymetallurgy industries is weak currently.
Our industrial assessment of the corridor districts suggest that the metallurgy sector has the potential to create4%-10% of the industrial land demand in the corridor districts (considering BAU &BIS scenarios respectively).
4.4.2.2 Key growth drivers for the sectorThe metallurgy sector output acts as feedstock or intermediate raw material for many of the end use industrieslike defence, aerospace, construction, machinery, electrical, packaging, automobiles, etc. Many of these keyindustries are present in the corridor. The key drivers of demand for the metallurgy sector is as highlightedbelow:
Increased consumption intensity
Given that most of the sectors like defence, aerospace, construction, machinery, electrical, packaging,automobiles, etc contribute to the sectoral demand in one way or the other; volume-wise the trends are likely tobe in line with trade and GDP trends. Increased activity in power, infrastructure, transportation and FMCGsegments are likely to drive up Iron & Steel andaluminium consumption in the country.
Increase in demand for exports
While three decades back, the international trade wouldbe usually skewed around upstream segment with ore asthe major commodity, trends are changing over the pastdecade. Along the value chain, demand for finishedproducts is growing faster than any othersegment along the value chain. For example, in Ironand steel industry- long, flat and tubular products likerod, rail, sheet, plate, hot rolled coil, etc are emerging asfast growing commodities of trade. Similar is the trendfor aluminium as well.
25Based on long term India GDP projections by IMF and Standard chartered, and sectoral elasticity co-eff to GDP asindicated by Working group on Iron and Steel,2012
0
20Yearly trade volume of Iron and steel
commodities expressed as 'x' times of 2003trade volume
Iron Ore Pig Iron
Ingots and semis Long, flat and tubular products
Source: World Steel Organisation, PwC analysis
Figure 4.4.3: Yearly trade volume of Iron andsteel commodities expressed as ‘x’ times of 2003
trade volume

Final Report – Comprehensive Regional PlanPwC/ Nippon Koei 93
4.4.2.3 Key nodes for metallurgy investment in the corridorThe districts in Karnataka within the CBIC influence zone account for ~4% of all the metallurgy sectorinvestments in the state. Large scale units are not present along the CBIC influence area in Karnataka. Some ofthe prominent medium and small scale units are Danish Steel cluster, Jindal Aluminium extrusion, South IndiaIron, Sunvik Steel, Welspun Corp steel pipe unit. Going forward, Chitradurga and Tumkur may emerge as keylocations for investments into large scale industries due to proximity to raw materials, while Bengaluru ruraland Tumkur may emerge as locations for finished product industries.
In Tamil Nadu, the CBIC influence zone districts account for ~22% of all the metallurgy sector investments inthe state. Currently MALCO is the only large scale unit present in the corridor region. Going forward, Tiruvallur,Thiruvannamalai and Kancheepuram may emerge as key locations for import based industries in the sector dueto proximity to ports. Due to proximity to demand centres, these areas are also likely to show some potential fordownstream industries like steel pipes and tube casting units, aluminium castings, etc.
The districts in Andhra Pradesh, within the CBIC influence zone, account for ~20% of total metallurgy sectorinvestments in the state taking place in these districts. Satavahana and Lanco are the key large scale unitspresent here. Nellore is likely to generate more interest for Aluminium industry due to proximity to ports aswell as raw materials relative to other CBIC districts.
4.4.2.4 Key interventions required and strategy for developingmetallurgy sector along CBIC
Based on the proposed framework for industrial development strategy for CBIC, we propose certain keyinterventions/recommendations for the Government to develop the metallurgy sector along the identifieddistricts in the corridor. These recommendations have been segregated as economic enhancers, administrativeenhancers and value enhancers.
4.4.2.4.1 Economic enhancers
For the shortlisted districts along the corridor, we have summarized the key interventions required by GoI,along with the existing status and challenges in these districts:
Table 4.4.6: Existing status, challenges and interventions required to increase investment in corridor –Metallurgy sector
DistrictExisting status
and currentasset profile
Demand factors Key shortcomingsKey interventions
required
Key sub-segments thatmay emerge
Chitradurga,Anantapur,Chittoor
Raw materialavailability(iron-ore)
Availability ofskilledresources inBellary,Shimoga andBengaluru
Proximity togas gridthroughDabhol-Bengalurunatural gaspipeline
Proximity to end-use industrycluster of auto &auto components,Defence,machinery,construction
With the recentiron ore miningban, availability ofhigh-grade lump isdifficult
Compatibility ofexiting units topellet use is low,that reduces use ofiron-ore fines.
Power tariffs arehigh in the region.
Rail connectivity toChennai, Mangalore &Krishnapatnam ports
Infrastructure of roadconnectivity with otherdemand centres
Special attention on fast-tracking land acquisition.Stakeholder consultationsneed to be done early onto avoid issues later
Incentives for creation ofpellet units to enablebetter use of Iron orefines.
Iron orebeneficiationunits
Pellet plantsIron and Steel
units

Final Report – Comprehensive Regional PlanPwC/ Nippon Koei 94
DistrictExisting status
and currentasset profile
Demand factors Key shortcomingsKey interventions
required
Key sub-segments thatmay emerge
Nellore
Proximity toChennai, whichhas access toskilledresources
Proximity toKrishnapatnam,Durgarajapatnam, Katupalli &Ennore ports.
Railwayconnectivity toports
Proximity todemand centresdomestically atChennai,Bengaluru andHyderabad.
Large food-processing andtextile industriesin the corridormay give rise topackagingrequirements inaluminium
Connectivity todomestic bauxiteand aluminasources
High power tariffs
Improve freight capacityfor Nellore-Chennairailway line
Railway connectivity toWest Godavari, EastGodavari mines
Further allocation ofBauxite mines tocompanies setting upalumina and aluminiumindustries in Nelloreregion
Power plants in the region
Aluminium &aluminiumproducts
Tiruvallur,ThiruvannamalaiandKancheepuram,TumkurBengaluru rural
Proximity toChennai,Ennore andKatupalli ports
Proximity todemand centres inChennai andBengaluru canimprove demandfor extrusion unitsand packagingmaterials
Industrialdevelopment alongthe corridor maygive rise toincreased demandfor aluminium andIron & Steel
Iron ore sourcesare not there invicinity. Steelindustries lookingat importing oreand coal may lookat this region.
Railway connectivity toSalem, Nilgiri andMadurai mines
Further allocation ofBauxite mines tocompanies setting upalumina and aluminiumindustries in these region
Improved connectivityfrom Bellary to Chennaicovering these regions toenable transport offeedstock from Iron &steel units
Iron and Steelunits
Long & flatIron & steelproducts
Aluminium &aluminiumproducts
Source: District profiles, Industry reports, PwC analysis
4.4.2.4.2 Administrative enhancers
The corridor states of Karnataka, Tamil Nadu and Andhra Pradesh do not have any specific policy dedicated tothe metallurgy sector. The states are guided by the national level policies, where the draft National Steel Policy2012 is yet to come out in concrete form. While the physical infrastructure shortcomings may get addressedthrough the economic enhancers, Government should consider a robust policy and regulatory framework toensure the sector’s growth in the corridor.
Government should take definitive measures to resolve certain issues pricing and availability of power. Thecurrent pricing of power makes the production cost for the metallurgy expensive compared to other states likeJharkhand. In addition, metallurgy sector players are often faced with delays in land acquisition. The policymeasures should ensure faster process in which relevant stakeholders are taken into consideration and to avoidpublic protests in future. Recent events in other states in Aluminium and Steel sector could be a deterrent forinvestors if not addressed properly.
We recommend that the Government of these states should propose a dedicated policy for the sector, whichmay increase the attractiveness of the sector along the corridor. We propose the following interventions belooked at:
Short term:
Policy implementation - A dedicated committee may be appointed comprising members from all
stakeholder agencies across the three states. Location identification should be done in consultation with
local communities to reduce opposition during implementation. Fast-tracked and transparent approval
processes in setting up industry would improve sectoral performance. Implementation the National Steel
Policy should be fast-tracked. The steps envisaged under the policy are not specific to only steel, and
implementation can benefit entire metallurgy sector.
Technology linkages - Government initiatives to establish technological linkages internationally with
countries like Japan and investing in R&D can help in procuring cost effective technologies for modernising.

Final Report – Comprehensive Regional PlanPwC/ Nippon Koei 95
Pelletization - There are limited reserves of high-grade Iron-ore lumps in the region. However, iron-ore
fines are available and are currently exported in high quantities due to non-availability of pellet units to
treat and use fines. Pelletization can help to an extent in better usage of iron-ores fines and can also help
ramp up export revenue by moving up the value chain.
Pellet compatibility - Pellet use in BF in India is low, whereas in technologically advanced plants, the
preferred burden is a mixture of sinters and pellets with minimum dependence on lumps26. Incentives for
use of pellets by large scale industries in the region can help in reviving as well as expanding the footprint of
the sector in the region. PSU like Bhadravathi Steel Plant which is facing raw material issue, can be
incentivised to modernise towards pellet compatible smelters.
Location strategy - In aluminium subsector, Nellore is closest to bauxite sources and also will have
access to Krishnapatnam and other ports. Further leases to Bauxite mining may be allocated to only those
companies who intend to set up alumina and primary aluminium production units in the corridor.
Businesses with existing bauxite assets abroad or long term contracts for bauxite/alumina procurement
may look at Tiruvallur, Thiruvannamalai and Kancheepuram as key locations.
Thermal coal linkages - Energy prices can be a key deterrent. While in the long run, state power utilities
may need to reduce power tariffs; in the shorter term, industrial units developing captive power plant may
be able to optimise energy prices to an extent. Facilitation to investors in securing coal linkages nationally
and internationally (like long term contracts with Indonesia) will be beneficial.
Medium term strategy:
Power tariff subsidies - In medium term, power tariff subsidies for industries in the corridor (say for
the first 10 years of operation) can be looked at. It may be argued that such initiatives may be detrimental to
public finance. But this argument really needs to be studied from the trade-off perspective i.e. loss to public
finance due to subsidy vs. increase in state tax revenue base due to more industries.
Pellet compatibility - Once pellet units evolve sufficiently and existing industries are revived, smelters
may be encouraged to look at Chitradurga, Tumkur, Anantapur as key locations for installing pellet
compatible plants.
Reducing dependency on coking coal - As coking coal is not available in the region, incentives for
iron and steel industries to adopt Direct Reduction and Smelting Reduction processes may be provided.
Scrap recycling & state owned enterprises - Scrap and waste metal recycling is an untapped area in
India. Stakeholder discussions reveal that while iron and steel scrap consolidation industry is organised to
an extent, the same is to a large extent unorganised in aluminium industry. Scraps can counter raw material
availability for industries with electric arc furnaces. Setting up state owned enterprises in this direction with
appropriate regulations will provide a boost to the industry.
Long term strategy:
Research & development - A world class research institute with focus on mineral exploration may be
set-up by the three states jointly to further look into mineral reserves, and to explore ways for
environmentally sustainable mining.
26Centre for techno-economic mineral policy options –relevance of iron ore pelletization industry in India

Final Report – Comprehensive Regional PlanPwC/ Nippon Koei 96
4.4.2.4.3 Value enhancers
Skill development:
The building and construction hardware sector in Karnataka, which also includes metallurgy sector to an extentis expected to generate an incremental demand of 95,800 people from 2012-2227. At this rate, key districtsidentified as potential metallurgy nodes within the corridor including Bengaluru rural, Chitradurga, Tumkur,Anantapur, Kancheepuram, Chittoor and Nellore may show deficit in the availability of labour by 2022.
With India’s ambition to produce 200 million tonnes of steel, the need of skilled metallurgical, electrical and
mechanical engineers may be substantial leading to a shortfall nationally. Government can take proactive
measures to create employable work-force. Government led initiatives inform of Knowledge Transfer
Partnership, where students get more industry exposure, can play a key role in creating the right institute-
industry linkages.
4.4.2.5 Recommendations summaryDomestic demand: Our research suggests that certain sub-segments like Iron & Steel and Aluminium havetremendous domestic potential and the capacities in most cases are likely to see under-capacity situationbeyond 2022. The State Governments should focus on creating the necessary infrastructure like roadconnectivity to major cities; major end-use industrial cities/estates/industrial parks etc. within the identifiedmetallurgy sector nodes along the corridor, to enable more investments in the region. In terms of skills, moreinstitute-industry interactions should be encouraged to provide the right industry exposure to students andcreate employable work-force.
Strategy: Metallurgy sector in the short to medium term shall be highly driven by domestic demand ratherthan exports. The current issue in the corridor has been primarily raw material scarcity in the region. However,to an extent the issue can be resolved through value chain streamlining. The mismatch in value chain arisesfrom the fact that iron-ore fines are available in the region, but pelletisation is slowly growing in the region andpellet use capabilities in the region are low. Incentives to make use of iron-ore fines through encouraging pelletunits and modernisation of smelters to pellet-compatible plants can play a good role. For aluminium, theindustry will be comparatively better-off if placed around Nellore due to closer proximity to raw material. Thedownstream units are likely to be around the urban demand centres. Once the upstream smelter productionimproves, the downstream units may also develop cost advantages through reduced feed transport cost. Overall,improved connectivity between source-plan-demand centres is likely to improve the value chain throughout.Initiatives focused at optimising power tariffs as well as availability, and providing investors with a productioncost advantage will further increase interests.
To boost the metallurgy sector growth in the country, Government of India came out with the draft National
Steel Policy in 2012. The Draft National Steel Policy is a landmark development for the industry, with
recommendations that is likely to have a positive impact across metallurgy sector, rather than just steel. The
policy accords high importance to aspects of transparent and fast tracked process for obtaining clearance,
permits; inclusive committee on site selection of projects locations; initiatives to cut delays and appropriate
steps to streamline factors of production. The policy has also recognised the fact that the current trend in
investment has been along the regions having mineral resource. As the industries are increasingly becoming
dependent on international resources, the need to redistribute the incoming investments along the coastal
regions has been envisaged. Appropriate steps to improve port capacity and connectivity have been proposed,
which includes creation of a Mineral Development Fund to cater to infrastructure financing of initiatives like
dedicated freight corridor, railways lines connecting mines to plant. Implementation of this policy will certainly
provide a boost to investments in CBIC. However, above all things, coordinated and effective implementation
will be important.
27Source: National Skill Development Corporation publication on skill gap in Karnataka, 2012

Final Report – Comprehensive Regional PlanPwC/ Nippon Koei 97
4.4.3Medical equipments
4.4.3.1 Sector performanceWith the rapid growth in Asia-Pacific population,the demand in the medical equipment market isestimated to register double digit growth. Thedemand scenario is therefore certainly favourablefor companies in the sector. India itself can developinto a key market.
At domestic level, the market is also expected togrow substantially. The market size of medicalequipment in India is expected to grow to USD 2.4Bn by 2017 from its current size of US$ 1.3 Bn.While substantial number of companies like Wipro
GE, Siemens, Philips, L&T medical, Draeger medical,BPL India, Allenger have entered the market, Indiastill imports more than 60% of its medical
equipment requirements primarily from US and EU. Another key aspect to look at is the fact that Indianimports are generally high technology products requiring high R&D. This indicates a need for investment inR&D space domestically. In terms of sub-sector performance, Imaging and Therapeutics constitute almost 83%of the market demand. Portable devices are slowly entering into the market with more focus on glucometersand blood-pressure measuring instruments.
Globally, the medical device industry is one of the most vital and dynamic sectors of the global economy.Revenue from sales of medical devices worldwide was estimated at a little over US$ 210 billion for 2008at CAGR of about 6.2%28. In 2012, the industry is estimated to have grown to US$ 270 Bn insales29. These sales figures are being achieved by an industry that comprises more than 27000 medical devicecompanies worldwide and employs altogether about one million people. However, the revenue figures currentlyindicate an oligopolistic industry. 30 companies account for 89% of the estimated US$ 270 billion inglobal sales revenue. In addition, 68% of the revenue among these companies is generated by companiesheadquartered in United States. Globally, the United States dominates 60% market share of medical devicessale. Sales from manufacturers in middle-income countries account for an estimated 10% of theworld market. The top five countries by projected sales revenue—China, Brazil, Mexico, India, andTurkey account for 60% of the total middle-income country market (and 6% of the worldmarket). In terms of consumer market, four fifths of global medical device sales revenue comes fromsales in the Americas and Europe. Ten countries account for nearly 80% of world consumption, with theUnited States at the top of the list (41%), followed by Japan (10%).
The dynamics of the sector are also changing fast. Traditionally the industry is used to double-digit revenuegrowth, hefty margins and more predictable regulatory pathways. However, with increasing pricing competitionand profit stress firms are becoming more global in scope, moving beyond traditional markets and embracingnew global sales opportunities in areas with growing middle classes and expanding healthcare needs andbudgets. But the evolution of the industry as a whole is also a one of value chain integration. For example,companies like Frenesius which started out manufacturing dialysis machines have vertically integrated intocare segment also with more investments spread across machines, clinics and drugs. Product innovation hasbeen another key area of strategising driven by increased focus on mobile-healthcare system.
The medical instrument segment certainly emerges to be a key sector which may contribute to CBIC’s success interms of attracting investments to the corridor. The corridor states of Karnataka, Tamil Nadu and AndhraPradesh is substantially strong in medical instrument industry in comparison to national scenario. And, CBICregion happens to be the home of most of the sectoral industry including GE Wipro, BPL, Trivitron, B Braun,Mediworld, etc, comprising mostly large scale and medium scale industries. Growing population and presence
28 World Health Organisation - http://whqlibdoc.who.int/publications/2010/9789241564045_eng.pdf29 http://www.mpo-mag.com/issues/2013-07/view_features/the-top-30-global-medical-device-companies-564773/
Figure 4.4.4: Asia Pacific outlook
Source: Frost & Sullivan Healthcare Outlook (2012-2015)

Final Report – Comprehensive Regional PlanPwC/ Nippon Koei 98
or urban demand centres like Chennai and Bengaluru are likely to act as demand pullers for the medicalinstrument industry.
4.4.3.2 Key growth drivers for the sector
Growing working age population is likely to create substantial demand for healthcare sector, which in turncreates demand for medical instruments. In the short to medium term, the sector is likely to be driven bydomestic demand rather than international demand.
There is significant opportunity for both existing players to expand and new players to enter the market. Thecurrent market size is around Rs 8000 crores. However, @16% CAGR, the expected demand in the sector islikely to grow to Rs 157 thousand crores (around US$ 26 billion) by 2034. Without further investment, asubstantial demand domestically will have to be catered through imports. This indicates a significant level ofopportunity that the sectoral players may have in India.
4.4.3.3 Key nodes for medical instrument investment in thecorridor
The districts in Karnataka within the CBIC influence zone account for ~50% of the entire medical instrumentsector investments in the state. Large scale units like GE Wipro, BPL and Ziess are currently based out ofBengaluru Rural and Bengaluru Urban districts. B Braun, Trivitron and Mediworld have their presence inAndhra Pradesh and Tamil Nadu. Going forward, Krishnagiri, Ramnagara, Kancheepuram, Tiruvallur&Thiruvannamalai areas may also emerge as attractive locations due to proximity to demand centres. However,districts having presence of electrical and electronic clusters may be further preferred. Developing medical hubsin cluster approach with electronics and electrical manufacturers may be beneficial.
4.4.3.4 Key interventions required and strategy for developingmedical equipment sector along CBIC
Based on the proposed framework for industrial development strategy for CBIC, we propose certain keyinterventions/recommendations for the Government to develop the medical equipment sector along theidentified districts in the corridor. These recommendations have been segregated as economic enhancers,administrative enhancers and value enhancers.
4.4.3.4.1 Economic enhancers
For the shortlisted districts along the corridor, we have summarized the key interventions required by GoI,along with the existing status and challenges in these districts:
0
20
40
60
80
100
120
140
160
180
20
12
20
13
20
14
20
15
20
16
20
17
20
18
20
19
20
20
20
21
20
22
20
23
20
24
20
25
20
26
20
27
20
28
20
29
20
30
20
31
20
32
20
33
20
34
Damand Capacity gap forecast in Rs '000Crores
Current capacity Demand @ 16% CAGR
Source: WHO report, FICCI, Frost & Sullivan report, PwC analysisFigure 4.4.5: Demand capacity gap forecast – Medical equipment

Final Report – Comprehensive Regional PlanPwC/ Nippon Koei 99
Table 4.4.7: Existing status, challenges and interventions required to increase investment in corridor –Medical equipment sector
DistrictExisting status
and currentasset profile
Demand factors Key shortcomingsKey interventions
required
Key sub-segments thatmay emerge
Bengaluru Rural,Bengaluru Urban,Chennai,Krishnagiri,Ramnagara,Kancheepuram,Tiruvallur&Thiruvannamalai
Availability ofskilledresources
Proximity todemandcentres
Uninterruptedpower supplywhich is requiredfor testing,calibrationpurposes
Power relatedinterventions.
Clusteringapproach withelectronics andelectrical industryin development ofmedical equipmenthubs
Imaging,Therapeutic,Patientmonitoring andportable devices
Source: Industry reports, PwC analysis
4.4.3.4.2 Administrative enhancers
We recommend that the Government of these states should propose a dedicated policy for the sector, whichmay increase the attractiveness of the sector along the corridor. We propose the following interventions belooked at:
Quality standardization agencies have limited role currently. This creates a brand issue for small scale
players. Establishment of sector-specific quality standardization agencies, independent quality testing labs,
etc with focus on internationally comparable standards can also enhance brand image of the sector
internationally.
As has been discussed before, Indian manufacturers are more oriented towards low-tech equipments and
not hi-tech ones that require investment in R&D. A government led R&D lab with pooled investment from
the small scale sector can enhance competitiveness and expansion of small scale industries. Else, incentives
for companies to invest more in R&D for both domestic and international requirement would be beneficial.
A mixed clustered approach with electronics and electrical industry should be adopted for the medium and
small scale industries in the sector. This would lead to appropriate economies of scale and scope, enhancing
production cost advantage.
Currently the demands for quality and high-tech products are generated mainly by the private multi-
speciality hospitals. Public sector procurements are based on lowest price and not on quality/technology
specifications. In addition, the demand from public sector has been also restricted. Focus on cost has led to
increased imports from China. Stringent import norms through quality based scrutiny of imported products
are likely to provide boost to domestic manufacturing in the sector. In addition, focus of public sector
procurement on technology oriented products offering value for money can drive the high-tech industry,
which is currently low in India. Increased demand of hi-tech equipments from district health centres will
help in rationalising the spread of this sector across districts rather than clustering around urban centres.
Uninterrupted power supply is crucial for these industries. Improving the power supply scenario and
optimising power tariffs can help these industries to move towards an optimised production cost.
Telemedicine is evolving as a major medium of penetrating Indian Landscape. This is likely to provide
boost to portable and homecare device segments. Policies oriented towards encouraging telemedicine can
provide indirect boost to the sector.
Promotion of medical technological parks would be a key initiative to attract overseas medical equipment
manufacturers. Trivitron Healthcare has created a first-of-its-kind, world class manufacturing facility in
India, on a sprawling 20-acre land near Chennai. Aloka Co Ltd from Japan is setting up a manufacturing
plant in Chennai.

Final Report – Comprehensive Regional PlanPwC/ Nippon Koei 100
4.4.3.4.3 Value enhancers
Skill development:
Government of India has already taken up various R&D initiatives in the sector through agencies like
SAMEER, CEERI, WML, CMERI, etc. However, enhancing skill levels through increased exposure in R&D
to students and improving employability is a challenge. Skill levels in electronics and electrical are high
around Bengaluru and Chennai. However, government led initiatives like Knowledge Transfer Partnership
can play a key role in creating the right linkages. Knowledge Transfer Partnerships can be implemented in
following way:
o Specific research funds can be created dedicated to the sector (or a pool of related sectors) and can
be allocated to interested Institutes. Interested institutes and companies can register under
knowledge transfer partnership. Registered companies can show interest on the topics of research
and can partner with a registered institute who shows interest. The industry can contribute 50% to
the research fund requirements and 50% can be contributed from the fund that is created. The
industry also provides access to infrastructure to the institute to carry on research. Each partnering
institute can nominate KTP associates from amongst students to work under the supervisor. Such
initiatives can improve skill-industry connect and improve employability.
4.4.3.5 Recommendations summaryWith a rapidly increasing population and middle-class segment, Indian medical equipment industry haspromising opportunities. The growth is more likely to be driven by domestic demand rather than exports at thispoint of time. However, appropriate business environment is a pre-requisite. The medical equipmentinstrument industry is an extension of electronics and electrical sectors and is likely to be dependent on thesame. Developing medical hubs in conjunction with electronics and electrical clusters is likely to create the rightecosystem. Branding is another key aspect. Price pressures are increasing imports without structured qualityconsiderations and exports often face with quality barriers. Quality is essential and appropriate quality relatedguidelines will reduce sub-optimal quality imports and shall drive domestic industry, while also creating scopefor exports. This is likely to create the desired Indian brand. R&D is essential for the industry to grow along hi-tech products which the domestic industry is currently lacking. Enhanced R&D related grants and appropriatemechanisms to create the researcher-manufacturer linkage will be essential. Uninterrupted power supply wouldbe critical for the industry. Arrangement of appropriate power facilities to medical hubs can make the corridorfurther attractive to investors.
4.4.4Textiles and Apparels (T&A)
4.4.4.1 Sector performanceThe Indian textile industry is one the largest and oldest sectors in the country and among the most important inthe economy in terms of output, investment and employment. The sector employs nearly 45 million peopledirectly and 45 million people indirectly and after agriculture, it is the second highest employer in the country.Its importance is underlined by the fact that it accounts for around 4% of Gross Domestic Product, 14% ofindustrial production, 9% of excise collections, 18% of employment in the industrial sector, 11% of the country’stotal exports earnings and 27% of foreign exchange inflows.
Textiles and Apparel sector is traditionally divided into manufacture of textiles (77% of the sector) andmanufacture of wearing apparel (23% of the sector). Manufacture of textiles sub-segment is further divided intospinning, weaving and finishing of textiles, which constitutes 83% of the manufacture of textiles andmanufacture of other textiles. Manufacturing of wearing apparel is constituted by manufacturing of wearingapparel, manufacturing of made-up textile articles and manufacturing of knitted and crocheted apparel.Further segmentation in India is given reproduced on the chart below.

Final Report – Comprehensive Regional PlanPwC/ Nippon Koei 101
Figure 4.4.6: Segment separation of Textiles and Apparel industry in India
Technical textile30 is an important part of the overall textile sector in India. Technical textile segment isemerging, with a huge potential to attract investment, create additional jobs and earn sizeable precious foreignexchange. Indian Technical Textiles segment employs 0.5 million technical people and 0.4 million non-technical people31. Global technical textile industry is estimated at USD135 billion, to which India contributedUSD 15 billion in 2012-13.
The technical textiles can be classified into 12 major segments based on end use –agrotech, buildtech, clothtech,geotech, hometech, indutech, meditech, mobitech, oekotech, packtech, protech and sportech. Packtech is thelargest segment with 33% share. Meditech, sportech, geotech and oekotech are smaller, but fastest growingsegments.
The world textile and apparel industry transformed since the expiry of Multi-Fibre Arrangement in 2004, whichgoverned the extent of textile trade between nations. The global T&A industry is estimated to be worth aboutUSD 4,395 bn. In the global T&A industry, Textiles account for 60% of the market and apparel, the balance 40%of the market32and currently global trade in textiles and clothing stands at around USD 700 bn. The UnitedStates (US) market is the largest, estimated to be growing at 5% per year, and in combination with theEuropean Union (EU) nations, accounts for 64% of clothing consumption. Among other countries, Japan,Australia and New Zealand are significant consumers of textiles33. Consumption in the global apparel industryis highly concentrated in three main regions: the US, the EU, and Japan.
4.4.4.2 Key growth drivers for the sectorThe T&A sector in India is valued at USD 110 billion (2012)34. With the growing demand in the global marketfor textiles, especially technical textiles and apparels, the sector in India is estimated to grow to a size of USD220 billion by 202035. During the twelfth five year plan period, spinning, weaving and finishing of textiles isexpected to grow at a CAGR of 8%; whereas the second component of textiles segment – other textiles – isestimated to grow at a CAGR of 12%. Manufacturing of wearing apparel is anticipated to grow at a CAGR of 10%.
India’s textiles and apparel industry is one of the largest contributing sectors of India’s exports worldwide. Interms of exports, it is among the top 5 global players, constantly expanding its share in world trade. India’sexports of Textiles and Apparels is expected to grow to USD 64 billion by 2017 and USD 80 billion by 202036
from USD 29 billion in 2011. During the year 2012-13, Readymade Garments accounted for almost 39% of thetotal textiles exports. Apparel and cotton textiles products together contribute nearly 74% of the total textilesexports37. The USA and the EU account for about two-thirds of India’s textiles exports. The other major exportdestinations are China, U.A.E., Sri Lanka, Saudi Arabia, Republic of Korea, Bangladesh, Turkey, Pakistan,Brazil, Hong-Kong, Canada and Egypt etc.
30Technical Textiles are high performance textiles which find application in many other areas apart from clothing31Source: Baseline survey of the technical textile industry in India, Office of the Textile Commissioner32 Source: IBEF33Source: Textile Industry Report by D&B Research34 Source: The Confederation of Indian Textile Industry (CITI).35Source: IBEF 201236Source: Technopak37Source: Note on Textiles & Clothing Exports of India. Ministry of Textiles, GoI

Final Report – Comprehensive Regional PlanPwC/ Nippon Koei 102
The two-fold increase in global textile trade is also likely to drive India's exports growth. High growth of Indianexports is possible due to increased sourcing shift from developed countries to Asia and India’s strengths as asuitable alternative to China for global buyers. India, in particular, is likely to benefit from the rising demand inthe home textiles and apparels segment, wherein it has competitive edge against its neighbours like Bangladesh,Sri Lanka.
Some of the key reasons for a spur in demand are -
Availability of raw material Availability of cheaper labour Increasing population and rising per capita income - in general, an increase in the population leads to
greater demand for consumer products, particularly for fundamental necessities such as basic apparel.However, demand is more heavily influenced by per capita disposable income.
Shift in preference to branded products is expected to boost the demand. Growth in global Textiles and Apparels industry - Bangladesh, Vietnam, India, Cambodia, and
Pakistan are especially expected to play key roles in the global textile industry, while exports fromChina have been decreasing due to increased prices of raw materials and labour costs.
Growth of new consumption markets Global expansion of modern retail business Boom of air and sea shipments Favourable trade policies
Based on the past trend of growth and estimated end user segment growth, the market size of Technical Textilesin India is projected to be USD 36 billion38 by 2016-17 with a growth rate of 20% per annum.
Some of the key reasons for a spur in demand for technical textiles are
Growth of Industry Sectors - various technical textile products are consumed by different industrieslike automotive, healthcare, infrastructure, oil & petroleum, etc. With increased investments in theseindustry sectors, higher consumption and growing exports, the industrial sector is poised for aconsiderable growth. This will further increase the consumption of technical textiles.
Increasing Per Capita Income of Consumer – the future growth in income is expected to increaseriding on the back of a healthy growing economy. This rise will enable consumers to make morediscretionary expenditure on technical textile products.
Increasing Adaptability Level/Acceptance of Products - with growing awareness and income,consumers will realize, and be willing to pay for the superior functionality of technical textile productssuch as wipes, diapers, sanitary napkins, disposable sheets, pads, etc.
Clothtech demand is driven by rising consumption of clothing and accessories Rising incomes and growing households to drive demand for hometech Rapid urbanization, rising working population, an increase in disposable income and increasing
affordability of vehicles are drivers of demand for automobiles in the country and this will drive themobitech segment.
4.4.4.3 Key nodes for Textiles and Apparels investment in thecorridor
Tamil Nadu has been traditionally dominating the Textiles and Apparels industry by contributing 22% (2010-11) of the national sector output. Chennai is globally known as an exporter of woven garments with about 2,400registered exporters. However, the districts in the CBIC region in Tamil Nadu account for 5% (2010-11) of thenational sector output. The districts in Tamil Nadu within the CBIC influence zone account for 37% of all theTextiles & Apparels sector investments in the corridor39. Tiruvallur (16%) had the maximum investments in thesector in Tamil Nadu, followed by Dharmapuri (10%), Kancheepuram (8%) and Chennai (3%).
In the case of Karnataka, the districts in the CBIC region contribute 2% (2010-11) of the national sector outputwhich is 65% of Karnataka’s historic share in the national sector output. The districts in Karnataka within theCBIC influence zone account for 61% of all the Textiles & Apparels sector investment in the corridor40.
38Source: The Economic Times39 Source: Capex CMIE database40Capex CMIE database

Final Report – Comprehensive Regional PlanPwC/ Nippon Koei 103
Bengaluru Rural (33%) had the maximum investments in the sector in Karnataka, followed by Bengaluru Urban(17%) and Chitradurga (10%). The presence of the Textiles and Apparels sector in the districts in the CBICregion in Andhra Pradesh is nominal, resulting in limiting the contribution to 2% of the sector’s output in theCorridor. Based on our analysis we anticipate Tiruvallur, Dharmapuri, Kancheepuram, Bengaluru Rural andUrban and Chitradurga to the drive the growth of the sector in the Corridor.
Table 4.4.8: Existing asset profile, challenges and interventions required to increase investment incorridor – Textiles and Apparels sector
District Existing asset profile – strengths and challenges
Tiruvallur Proximity to Chennai for availability of labour Proximity to Chennai and Ennore ports and Chennai airport. Well connected with all major district head quarters by road. Existing presence of industry - has 794 MSMEs into ready-made garments & embroidery
employing 12,166
Dharmapuri Raw material available Traditional industries like silk reeling, silk twisting, manufacturing of readymade garments,
power looms are present in Dharmapuri district. It has an important readymade garment cluster. There are 1573 MSMEs into cotton textiles employing 7865. There are 152 MSMEs into
woollen, silk & artificial thread based clothes employing 760 and 89 MSMEs into ready-made garments & embroidery employing 445.
Kancheepuram It is known for its richest silk. Unskilled labour is available. Excellent seaport connectivity, with proximity to Chennai (~40 km) and Ennore sea ports
(~45 km) Excellent road connectivity through the East Coast Road and upcoming upgraded NH4 & 45 Presence of several industrial parks and industrial estates with land availability. Over 5o thousand people employed in the cluster Inadequate availability of power & and its fluctuations
Bengaluru Rural andUrban
Both districts together have 499 textile units offering 16,631 employment opportunities inthe district.
Bengaluru Urban is well connected to all the districts in cotton producing and silk producingdistricts in Karnataka.
Has accessibility to raw materials from Salem, Erode, Coimbatore and Ahmedabad There is insufficient supply of manpower within both the district; it has the ability to attract
skilled manpower from across the state and the country. Water is scarce and there are frequent power outages The apparel industry is concentrated in Bommanahalli, Bommasandra, Peenya,
Yashwantpur and Rajaji Industrial Estate and Industrial Town. Has excellent market linkages in terms of subcontractors which enables flexible changes in
production schedule and product
Chitradurga Chitradurga is amongst the cotton producing districts in Karnataka and closer to the othercotton producing districts in Northern Karnataka.
Excess skilled manpower available. Based on discussion with industry players it is understood that many youth go out to
Bengaluru to work in garment industry. Thus, there are opportunities to set up garmentfactories in Chitradurga district to leverage on the cheap labour availability.
Proximity to Bengaluru International Airport Molkalmuru sub district which is about 80 kilo meters from Chitradurga town is famous for
its hand woven silk textiles
Source: District profiles, industry reports, PwC analysis
4.4.4.4 Key interventions required and strategy for developingTextiles and Apparels sector along CBIC
Based on the proposed framework for industrial development strategy for CBIC, we propose certain keyinterventions/recommendations which need to be provided by coordinated effort by government and privatesector to develop the Textiles and Apparels sector along the identified districts in the Corridor. Theserecommendations have been segregated as economic enhancers, administrative enhancers and value enhancers.

Final Report – Comprehensive Regional PlanPwC/ Nippon Koei 104
We have summarized the key interventions required for the Textiles and Apparels sector, along with theexisting challenges in sector:
Table 4.4.9: Current shortcomings and key interventions necessary in the corridor – Textiles and Apparelssector
Enhancers
Current shortcomings Key interventions required
Economic
Power costs and availability is a majorchallenge in the corridor
Linkage with ports for exports Continued availability of raw material
through interventions. The core technical textiles are fairly
import intensive with around 26% ofthe domestic demand being met byimports, since imports are cheaper ascompared to indigenous production
Subsidizing unit rates of power or encourage usage of nonconventional energy sources.
Develop dedicated/captive power generating sources specificallyfor the major textile clusters. Bring in other alternate sources ofpower supply systems such as renewable energy etc. Improve roadinfrastructure
Administrative
Higher taxes and duties Stability of taxation is another issue. There are procedural hurdles to
international trade in the Textiles andApparels sector.
The mandatory usage of technicaltextile products is largely driven byrules and regulations or standards ofrespective industries / end usersegments. The developed countrieshave standards and specifications inplace and have ensured enforcement ofthe same.
Regulations need to be focused on controlling raw material exportsto ensure stable prices in the country and to make the sector morecompetitive and productive.
Taxes need to be regulated and stable41
o Reduce excise duty on plant protection products.o Exempt the technical textiles samples for free distribution, from
excise dutyo Reinstate the customs duty on parts of umbrella, including
umbrella panelso Exempt the Mobiltech products that are used in manufacturing of
vehicles for exports, from levy of Sales Tax (CST)o Remove VAT levied on non-woven fabrico Exempt the export oriented technical textile units from Service
Taxo Introduce Anti-Dumping duty on radial truck and bus tyre
imports from China Single Window System for necessary permissions and clearances.
Recommendations for facilitating the growth of technical textiles in Revise the subsidy rates for plant protection products (agrotech)
under NHM
Value
Lack of economies of scale The availability of trained manpower is
a key issue in the apparel sector sinceit is a relatively labour intensiveindustry.
There is a low degree of modernisationin the Indian weaving industry. Indiahas much lower investment in specialpurpose machines, which performspecific functions and add value to theproduct. Very few exportestablishments have invested incutting machines or finishingmachines.
Due to low value addition, lowproductivity and increasing costs ofraw materials and labour, handloomfabrics have traditionally suffered acost handicap in the marke
Automation needs to be induced to resolve the problems ofshortage of labour and increasing and lead to higher productivity.
There is a need for effective implementation of skill developmentinitiatives and co-ordinated efforts are required from allstakeholders
Design is a critical ingredient in the fast changing textile fashiontechnology, the existing textile design centers need to bestrengthened and more such institutes need to be opened,especially for the support of textiles and apparel sector.
Technology is critical; therefore, modern units with upgradedtechnology should be encouraged. Governments will need tocoordinate with banks and term lending institutions to encouragemodernization of spinning mills to improve their productivity andquality42.
R & D Design development should be encouraged. Value addition at every stage should be enhanced Proper information systems to monitor the performance of the
industry
Source: PwC analysis
41 Source: Baseline survey of the technical textile industry in India, Office of the Textile Commissioner42 Source: Tamil Nadu-Textile Policy

Final Report – Comprehensive Regional PlanPwC/ Nippon Koei 105
4.4.4.5 Textiles and ApparelsTable 4.4.10: Competitiveness analysis of Textiles and Apparels sector
SectorCompetingcountries
Relativeranking of
India
Key factors forlower
competitivenessof India
Assessment of factors for lower competitivenessInterventions required to increase
competitiveness of India
Textiles andApparels
TextilesChina, EU-27,the US, RPKorea andHong Kong,China, Taipei,China,Turkey,Pakistan
Apparels -China, EU-27,Hong Kong,China;Bangladesh,Turkey andVietnam,Indonesia
(In the orderof ranking)(Source: WTOdata 2011)
Textiles –3rd largestApparels –5th largest
1. Policy regime2. Quality of
production3. Cost of production
1. Policy regime
a.There is a loss of international competitiveness of theIndian T & A sector due to the exchange ratefluctuations.
b.The T&A industry comprises mostly of small-scale,non-integrated spinning, weaving, finishing andapparel-making enterprises. Such a structure arosedue to the policies on tax, labour and other regulationsthat favoured small-scale, labour-intensive enterprises,while discriminating against large-scale, capital-intensive operations.
c. Lack of an exit policy, and rigid labour laws.
2. Quality of productiona. Technology is critical; T&A sector is weighed down
with low technology & ICT usage.b. Skilled labour - Quality of the present educational and
training system is not catering to the requirements ofthe industry.
3. Cost of productiona. Raw material accounts for about 30% of the fabric cost
and 13% of the garment cost. India has an abundantsupply of locally grown long staple cotton, which lendsit a cost advantage in the home textile and apparelssegments.
b.Labour productivity - Textile industry in India is thesecond largest industry in terms of employment.Considering the employment aspects, the importantdeterminant of competitiveness could be its labourproductivity. Wages and salaries constitute less than10% of total cost. India enjoys a significant lead interms of labour cost per hour overdeveloped countrieslike US and newly industrialized economies like HongKong
c. Quality of infrastructure (both social and physical) in
1. Policy regimea. In order to offset the loss of international
competitiveness of the Indian T&A sectordue to the exchange rate fluctuations,government needs to carry on withreimbursement schemes such as dutydrawback, market developmentassistance etc., on a continuous basis.
b. Concerned Ministries, Departments,State government need to be focus onreducing the transit time and cost at theinternational check points to makeIndian textile products more competitive.
c. Amendment to Labour Laws is needed, topermit longer hours of overtime with duecompensation, and to allow flexi-hiringof labour, especially to support apparelssector.
2. Quality of productiona. Modernization of the units and up
gradation of technology is imperative.Both advanced as well as indigenoustechnology needs to be integrated in thesystem. There is a need to encouragemore of technical innovation (throughR&D efforts) through better design,technology, diversity of production etc. inthe production process. there is need towork out time bound refund mechanismsfrom Technology Up gradation Fund(TUF) provided by Government for themodernization of the units.
b. Vocational training through ITIs, TextileDesign & Management Institutionsspecially in the area of ApparelManufacturing, Quality Control andDesigning needs to be encouraged so that

Final Report – Comprehensive Regional PlanPwC/ Nippon Koei 106
SectorCompetingcountries
Relativeranking of
India
Key factors forlower
competitivenessof India
Assessment of factors for lower competitivenessInterventions required to increase
competitiveness of India
the respective state is short of the requirements. It hasbeen found that one of the major cost components inthe production is the energy consumed during theproduction process that offsets the competitiveness ofthe sector. In the case of physical infrastructure, theorder of priority as given by the units for specialattention for development and maintenance is: Power(40%), Road (30%), Rail (18%), Port (10%) and Airport(2%). In the case of social infrastructure, the order ofpriority as reported by the units for special attentionfor development and maintenance is: Technicalinstitutions (56%), Higher education (26%), Specialmedical centers (12%), General hospital (5%) andSchools (1%).
d.India hasn’t been able to make Optimal capacityutilization due to lack of Knowledge, training, TPM &TQM, Disguised Unemployment and Lack ofprofessional management.
e. The study by Nordas (2005) suggests that the distancefrom the major markets is going to act as a majorconstraint in the form of transaction cost. Hence,Mexico, the Caribbean, Eastern Europe and NorthAfrica are likely to remain important exporters to theUS and the EU respectively, which are the majorimporters and possibly maintain their market shares.
f. Fragmented capacities, low scales of operationg. Textiles imports have risen much faster than the textile
exports implying that the cost of exports in terms ofimports doubled during this period. Thus,globalization seems to affect Indian textile tradethrough increased competition. Major markets for theimport have been People’s Republic of China, USA, andNepal etc.
h.Currently the prevailing interest rates for the loans inIndia are much higher than the interest rates incompeting countries such as China.
skilled work force is available.
3. Cost of productiona. Raw material exports need to be
controlled with a view to ensure stableyarn prices in the country and to makethe sector more competitive andproductive.
b. In the case of physical infrastructure,availability of Power and Road need to beimproved. Moreover the cost of powerneeds to be reduced. The option ofsubsidizing unit rates of power orencouraging the use of other viableoptions such as non conventional energysources should be considered. Sinceincreasing transit time ultimately resultsin avoidable additional costs, roads needto be improved.
c. There is a need for rationalizing theexisting interest rates for makingavailable working capital as well as fixedcapital investments. The existingrequirement of Collateral security forgetting bank loans is also a majorproblem for the small and the mediumsized manufacturing units.
Source: Productivity and competitiveness of Indian Manufacturing Sector, 2010: Textiles and Garments, National Manufacturing Competitiveness Council, GoI and Note
on Textiles & Clothing Exports of India, Ministry of Textiles, Government of India

Final Report – Comprehensive Regional PlanPwC/ Nippon Koei 107
4.4.4.6 Recommendations summaryThe Textiles and Apparels sector market value is estimated to be at USD 220 billion by 2020 (IBEF 2012). Thegrowth could be supported by technology upgradation, especially by fostering research and development; skillup-gradation, design development and value addition endeavours; facilitating development of diversifiedsegments to cater to both export and domestic markets and establishing single window facilities for approvalsand clearances; provision of power, water etc. Promote Textiles and Apparels exports from the CBIC region,physical infrastructure needs to be improved, favourable trade policies (including reduced and stable taxes andduties) need to be formulated, domestic production needs to be made competitive to reduce dependence onimports and superior quality need to be ensured.
4.4.5Food Processing
4.4.5.1 Sector performanceThe global Food Processing industry was estimated to be USD 3,200 billion in the year 201043. The contributionof Food Processing sector to GDP is lowest for Japan at less than 3% and the highest for China at around 25%.In India, the sector contributes to 9% of GDP and around 12% of manufacturing sector contribution.Across all regions, the major sub-sectors on the basis of demand are Meat, Poultry, Fruits and Vegetables andSugar. These sub-sectors contribute to more than 70% of the demand of Food Processing sector. The majorregions that contribute to more than 60% of the global retail sales of processed foods are United States and theEuropean Union. Currently, around 58% of produced food is consumed by developing countries. This isexpected to increase to over 70% by 2050 supported by the fact that over 35% of the world’s populationcurrently lives in China and India.
Food processing industry is one of the largest industries in India and is estimated to be worth USD 121 billion in2012 and accounts for 32% of country’s total food market44. With a huge agriculture sector, abundant livestock,and cost competitiveness, India is fast emerging as a sourcing hub for processed food. Around 90% of theoutput of food processing sector is contributed by four sub-sectors - vegetable oil, grain mill and starch, dairyand other food products. Output of the sector has increased from over USD 62 billion in 2008-09 to over USD90 billion in 2010-1145 and is expected to grow at a CAGR of ~10% till 201546.
One of the major constraints of the food processing industry is the low level of processing in India vis-a-visother countries.
Table 4.4.11: Percentage of food processed in India vis-a-vis in developed countries - 2010
Segment India Developed countries
Fruits and Vegetables 2.2% 65%Marine 27% 60%
Poultry 6% NAMeat 20% 70%
Source: Emerging Markets Insight
The rate at which sub-sectors are expected to grow over the next few years is as shown in the table below.
43Gyan Research and Analytics Pvt. Ltd, 201244D&B Research45Annual Survey of Industries (Conversion 1USD = 60 Rupees)46D&B Research

Final Report – Comprehensive Regional PlanPwC/ Nippon Koei 108
Table 4.4.12: Sub-sector wise projected growth rates – Food processing sector
Segment Growth rate
Marine 4%
Fruits and vegetables 6%
Vegetable oil 5%
Dairy 8%
Grain mill and starch* 10%
* Average growth rate of food processing sector
Source: D&B Research, ASSOCHAM, Feedback consulting
The Ministry of Food Processing Industries (MOFPI) has formulated a Vision 2015 Action Plan thatincludes trebling the size of the food processing industry, raising the level of processing of perishables from 6per cent to 20 per cent, increasing value addition from 20 per cent to 35 per cent, and enhancing India's sharein global food trade from 1.5 per cent to 3 per cent.
Our industrial assessment of the corridor districts suggest that food processing sector has the potential to create8-14% of the industrial land demand in the corridor districts (considering BAU &BIS scenarios respectively).
4.4.5.2 Key growth drivers for the sectorA number of growth drivers are fuelling the processed food sector in India. These include:
Increasing disposable incomes, rapid urbanisation and changing eating habits - Increasingdemand for functional food coupled with awareness about healthy/nutritional foods has increasedspending on health foods. Further, changing lifestyles has resulted in willingness to pay premium pricesfor quality products
Policy drivers
o Government of India has been promoting the concept of Mega Food Parks and is anticipated toset up 50 such parks across the country by the end of 12th Five Year Plan, to attract FDIs
o Low entry barriers
o Various tax incentives and policy initiatives taken by the government to increase the share ofIndia processed food industry in the global market has encouraged entrepreneurs to set up foodprocessing units, specially export oriented units
Availability of resources - India has numerous advantages like availability of abundant rawmaterials, skilled workforce and low labour costs
Increasing investments in support infrastructure – Investments have been increasing indevelopment of infrastructure like cold chain facilities and transportation
India emerging as a procurement hub - India is gradually emerging as a procurement hub for agrirelated produce. There has been a gradual but significant improvement in product and packagingquality over a period of time, which has infused greater confidence in the importing nations for Indianproducts
4.4.5.3 Key nodes for food processing investment in the corridorThe districts in Andhra Pradesh and Tamil Nadu within the CBIC influence zone account for ~30% of eachstate’s investment in food processing sector. Amongst all the districts in the corridor Nellore, Chittoor andTiruvannamalai are the major contributors to investment in food processing sector. The three districts togetheraccount for more than 55% of the investment in the corridor.47
47CMIE CapEx database

Final Report – Comprehensive Regional PlanPwC/ Nippon Koei 109
Districts that fall in Tamil Nadu and Andhra Pradesh in the CBIC influence area account to more than 80% ofthe total investment in food processing sector in the corridor. Karnataka districts contribute to a smaller shareof less than 20% of the investments in the corridor. Key districts are Bengaluru Urban and Bengaluru rural.
The key industrial parks (operational and upcoming) in the corridor include Srini Food Park in Chittoor, IFFCOKisan SEZ Limited in Nellore and SIPCOT -Bargur Industrial Complex in Krishnagiri. The top few investors inthe corridor include Bannari Amman Sugars Ltd, Indu Projects Ltd, Emami Biotech, Lotte India Corporationand Hatsun Agro Products. The key upcoming projects in the corridor include a Dairy plant by IFFCO, sugarplants by Dhanalakshmi Srinivasan Sugars Pvt. Ltd and India Cane Power.
Investments in top 8 districts of the corridor contribute to more than 85% of the total investment in foodprocessing sector in the corridor. The major districts are Nellore and Chittoor from Andhra Pradesh; Chennai,Dharmapuri, Krishnagiri, Tiruvallur and Tiruvannamalai from Tamil Nadu and Bengaluru from Karnataka. Thekey factors of production existing in these districts for food processing sector are as listed in the table below.
Table 4.4.13: Existing asset profile, key success factors and sub-segments district wise for Food processingsector in the corridor
District Existing asset profile Opportunities
Nellore
Proximity to raw materials like rice, paddy,jowar etc which is a key driver for grain basedindustries
Krishnapatnam port is located in the districtwhich is a key driver for exports in foodprocessing sector
The district has a long coastline which hasbeen the major driver for development ofmarine processing industry
Krishnapatnam port, once developedas a full-fledged port would createdemand for industries that are exportoriented including export orientedunits
IFFCO Kisan SEZ that is beingdeveloped as an agro park in thedistrict
Chittoor
The district is rich in horticulture producespecially mangoes which is the key driver fordevelopment of fruit processing industries
Availability of livestock and fodder for theanimals has resulted to Chittoor being the 2nd
largest milk producing district in India The district is home to Srini Mega Food Park
which is one of the pilot projects under theMega Food Park Scheme
Proximity to Chennai Port
NIMZ announced in the district willensure Government support ininfrastructure development and singlewindow clearances;
More than 30% of the total MSMEs inthe district are in Food Processingsector
Tiruvannamalai
Availability of raw materials like Fruits andvegetables
Good connectivity to urban centres likeKancheepuram
Availability of sugarcane and water makingthe district prominent in Sugarmanufacturing. The largest sugar-mill in thecountry is in this district
Availability of cheap skilled and unskilledlabour
SIPCOT industrial complex and SEZcan be developed as a top Sugarindustry cluster
Dharmapuri
District is rich in agricultural raw materialsand horticulture, specially Mangoes resultingto emergence of Fruit processing segment
Also rich in coconut cultivation – key driverfor coir processing units
Availability of livestock, hence achieved selfsufficiency in milk production leading tomanufacturing of dairy products
Proximity to SIPCOT industrialcomplex at Hosur
District economy is mainly agrarian innature. Hence, there is tremendousscope for development of foodprocessing industries
Source: District profiles, Industry reports, PwC analysis

Final Report – Comprehensive Regional PlanPwC/ Nippon Koei 110
4.4.5.4 Key interventions required and strategy for developing foodprocessing sector along CBIC
Based on the proposed framework for industrial development strategy for CBIC, we propose certain keyinterventions/recommendations for the Government to develop the Food Processing sector along the identifieddistricts in the corridor. These recommendations have been segregated as economic, administrative and valueenhancers.
Table 4.4.14: Current shortcomings and key interventions necessary in the corridor – Food processingsector
Enhancers Current shortcomings Key interventions required
Economic
Nellore and Chittoor are keydistricts for Marine and fruitprocessing respectively, they lackcold chain facilities
Strong linkages wit raw materialand agriculture consumptionmarkets. One of the key challengesof Chittoor fruit processing clusteris the weak linkage betweenfarmers and processing units
Linkage with Chennai Port needsto be improved
High post harvest and handlinglosses
There should be efforts to encourage setting upof agro-processing facilities as close to the areaof production as possible to avoid wastage andreduce transportation cost
Area specific agro food park clusters could bedeveloped, dedicated to the processing of thepredominant produce of that area
Strong agriculture market linkages
Incentives for setting up warehousing/cold storageinfrastructure and customized transportationnetwork development
Administrative
Unorganised sector
Lack of specific plan to attractprivate sector investments acrossthe value chain
Complex regulatory system
Absence of adequate andeconomic options of finance,specially for MSMEs
Develop a comprehensive policy for food processingsector
Effort needed to organise the sector bycreating clusters to improve the bargainingpower of enterprises and to enable them to poolresources.
Provide support to clusters in form of credit,inputs, expertise and marketing links.
Marketing campaign for food clusters should belaunched. Household entities could be encouragedif entitled to tax benefit schemes and exportpromotion schemes
Necessary steps to be taken to overcome the longand fragmented supply chain and create direct farmlinkages
Value
Majority of the rice mills in thestate of Tamil Nadu use oldtechnology which leads to highconsumption of electricity andwater and emits high pollution.This leads to increase in cost ofproduction. Majority of the smallscale shrimp farmers lack thefinancial and technology means toimplement modern farmmanagement practices
A technology bank to enable food processingunits at a cluster level to have access to productionsupply units around the world using internet.
The government should consider developing aFutures Market or an equalisation fund forfood grains, pulses, fruits, vegetable, milk, meat andpoultry in the interest of the farmers and theprocessors ensuring minimum price stability to thefarmer and a sustained supply of raw material tothe processor or compensation for shortages
Essential to have sector specific and region specific

Final Report – Comprehensive Regional PlanPwC/ Nippon Koei 111
Enhancers Current shortcomings Key interventions required
The fruit processing and rice millcluster in Chittoor suffers frompoor linkages with developmentinstitutions and limited facilitiesfor facilities and research.
Shortage of skilled labourers
Lack of product diversificationand value added products
courses for development of skill and addressing theskill gap issue of the sector
Specific incentives to be given to encourage productdiversification and increase production of valueadded products
Source: PwC analysis

Final Report – Comprehensive Regional PlanPwC/ Nippon Koei 112
4.4.5.5 Competitiveness of food processing sector
Table 4.4.15: Competitiveness analysis for Food processing sector
SectorCompetingcountries
Relativerankingof India
Key factors for lowercompetitiveness of
India
Assessment of factors for lowercompetitiveness
Interventions required to increasecompetitiveness of India
FoodProcessing
Meat –Brazil, USA,Australia,Netherlands
Marine –Norway,China, USA,Canada
F&V - China,Netherlands,USA,Belgium,Brazil,Thailand andSpain
Dairy - NewZealand,USA,Netherlands,Australia,France
Vegetableoil -Malaysia,Indonesia,Argentina,Netherlands,Brazil, andSpain
Grain mill
22nd rank 1. Lack of supportinfrastructure
2. Inefficient labourlaws and lack of skilldevelopment
3. High cost andavailability of rawmaterial
4. Research anddevelopment &Technology upgradation
5. Low quality standards6. Low value addition
1. Support infrastructurea.Lack of special infrastructure for food
processing sector like warehouses, coldstorages, packaging centres, value addedcentres, modern abattoirs etc
b.Irregular power supply has hampered theproductivity and competitiveness of the sector
2. Labour laws and skill developmenta.Majority of the MSMEs in the Food
processing sector hire skilled and unskilledemploys on contract basis. Their salarystructure is not competitive which leads to ahigh attrition rate
b.Majority of the workers/ supervisors areunaware of various food safety and qualityrequirements and lack competency orknowledge on Food processing/ packagingtechniques
3. Raw materiala. As per a survey conducted by GoI, it was
noted that in the last few years the rawmaterial costs as a percentage of total cost ofproduction has increased in the case of over90% of the processing units
b. In Food processing sector in India, rawmaterial costs range from 50-60% of totalsales whereas in countries like China they arearound 40%.
c. The cost of raw material is high due to variousfactors like high transportation costs andwastage of raw materials duringtransportation. There is multiplicity of taxesat different stages of procurement,
1. Support infrastructurea.Last mile connectivity should be improved in order
to strengthen the linkage between raw materialsupplier and processing units
b.Incentives should be given to processing units to setup captive power plants. Additional incentives couldbe given to players for setting up conventional powerplants which would ensure sustainability
c. The logistics and support infrastructure likewarehouses and cold chain facilities could bedeveloped under PPP and incentives/tax holidayscould be given to private players for setting up ofthese facilities
d.There is an urgent need for technology inductionfacilitating use of Controlled Atmosphere /ModifiedAtmosphere Chambers, IQF facilities etc to be linkedto the farm or collection hubs through reefer vansand ensuring an end to end cold chain
2. Labour laws and skill developmenta.As the sector faces acute shortage of skilled labour,
an apex organization could be formed that would beresponsible for skill development and training in thissector.
b.Specialized Training Centers/cells catering to theneeds of the food processing industry may be createdin the existing Technical as well as ManagementInstitutes.
c. Essential to review and simplify the old labour lawskeeping in mind the needs of the sector
3. Raw materiala. Government should promote reliable and strong
supply chain network between raw materialsuppliers and processing units on PPP basis

Final Report – Comprehensive Regional PlanPwC/ Nippon Koei 113
SectorCompetingcountries
Relativerankingof India
Key factors for lowercompetitiveness of
India
Assessment of factors for lowercompetitiveness
Interventions required to increasecompetitiveness of India
and starch–Germany,Italy, France,Belgium, USA
transportation and processing which furtheradds to the cost of raw materials and products
4. Research and development and technologyup gradation
a. Research and development in the Foodprocessing sector is not carried out on a largescale specially in areas like productdevelopment, packaging and food technology
5. Quality standardsa.Poor quality of food products is one of the
major reasons hampering exports of thesector
b.Use of chemicals/drugs is a major concern formajority of the processing units targeting theexport market
b. There is a need to introduce uniform tax rates in allstates avoiding multiplicity of taxes at differentstages.
c. Systems and procedures may be simplified. The needfor documentation/ paperwork at multiple checksposts and in different states, customs formalities,needs to be reduced.
4. Research and development and technology upgradation
a. Government may grant sponsored research andprovide special research grants to leadingAgricultural research institutes/universities andtechnical universities
b.The linkage between government agencies,universities, industry and other stakeholders likecooperatives, farmer organizations etc needs to bestrengthened.
c. Government need to promote technologyupgradation specially in the unorganized and MSMEsector by providing incentives
d.Priority should be given to develop indigenoustechnology to reduce dependence on imports
5. Quality standardsa.Awareness on quality standards could be created
through seminars, newsletters and trainingprogrammes.
b.Processing units should be encouraged to implementstandards such as ISO, HACCP etc.
c. Special Cells at regional/state level could be createdthat would work as facilitating centers forimplementation of standards and gettingcertification
Source: Productivity and competitiveness of Indian Manufacturing Sector, 2010: Food Processing sector, National Manufacturing Competitiveness Council, GoI

Final Report – Comprehensive Regional PlanPwC/ Nippon Koei 114
4.4.6Recommendations summaryIn addition to the steps mentioned above, the following segment specific steps need to be taken to promoteinvestment in the CBIC region:
Meat: Global analysis indicates it is a top demand driver. United States, EU and Saudi Arabia are the marketsthat have been driving the consumption and will be important to pursue them in future. In spite of having alarge livestock, the processing levels in India are low when compared to developed countries. Further, only 1%of the total meat is converted to value-added products like sausages, ham etc. This has limited India’s valueadded exports globally. Key products with increasing demand are Buffalo and poultry meat. The vision for foodprocessing also attempts at improving processing level in Meat industry by developing fast growing meat breeds,enhancing focus on research and development and organisation of the sector. Similar initiatives should betaken in the region to increase investment. Most of the meat items have been exported from Chennai port andstrong linkages with the port will be critical. The industry is of SME nature and due attention will be requiredaround - supporting them for market access, improving mechanisation in the processes etc will be required forthe development of the sector within the corridor.
Marine: The sub-sector is export oriented. Major markets are China, EU, Japan and US. It would be importantto focus on these markets. Currently, the level of processing is very low (fish processing is around 26%) andhence efforts should be made to improve this. Majority of the processing facilities are concentrated in clusterswith low capacity utilisations and high percentage of small scale industries. It would be essential to providethem with adequate infrastructure like cold chain facilities, credit facilities, promote value addition in the sectorby providing incentives like reducing import duties and giving suitable packaging options and enable marketaccess. Key district of focus in the corridor region is Nellore. Most of the marine products have been exportedfrom Chennai port and strong linkages with the port will be critical.
Fruits and vegetables: Global analysis indicates it is a top demand driver. United States, UAE and SaudiArabia are the markets that have been driving the consumption and will be important to pursue them in future.Focus should be on increasing the current low level of processing of less than 3% by addressing the productionissues like low yield, inefficient farming, high handling losses, low shelf lives, high post harvest losses andproducing varieties that are inappropriate for processing. For this it would be essential to focus onstrengthening the value chain and invest in research and development. Majority of the enterprises are in thesmall sector, hence it would be essential to provide them with marketing support, lower duties and taxes onpackaging material, providing them with cost effective and latest technology and low finance options. Chittoor,Dharmapuri and Krishnagiri are the key districts driving investment in this segment the corridor.
Vegetable oil: The revenue of the sector is driven by domestic sales. The key concern of the sector is the lowcapacity utilisation levels (average capacity utilisation of sector is less than 40%) due to increasing imports. Itwould be essential for the government to calibrate the import duty structure in India to protect the domesticindustry. The sector has a relatively low employee per output ratio which implies that it is fairly mechanised.Hence, use of efficient and latest technologies would be important. Port proximity is a key driver of investmentfor companies operating in this segment as majority of the raw materials are sourced from other countries toincrease cost competitiveness. The vision of food processing aims at increasing the share of branded edible oils.To achieve this it would be essential to encourage private sector participation across the region specially Nellore.
Dairy: The vision of the corridor for increasing investments in the Dairy segment specially in districts that fallin Tamil Nadu should be in line with the national vision for food processing that aims at increasing the level ofprocessing, enhancing commercialisation of Indian ethnic milk products and increasing India’s share in globalexports which is currently less than 1% of milk and milk products produced in the country. To achieve this, thekey steps to be taken include training the unorganised sector, reduce excise duties on dairy products, increaseproductivity, improve hygiene conditions, invest in R&D for development of machinery and develop packagingsolutions for enhancing shelf lives.
Grain mill and starch: The segment is driven by both domestic and export demand. The focus products toincrease the exports of the segment include wheat flour, maize flour and rice flour. Target markets for exportsshould be United States, UAE, Oman and Indonesia. The key challenge of the sector is the prevalence ofunorganised sector and use of old and inefficient technologies by MSMEs leading to low quality of products. Itwould be essential to give incentives to promote new and cost-effective technologies. Key focus districts in thecorridor include Nellore, Chittoor and Tiruvannamalai.

Final Report – Comprehensive Regional PlanPwC/ Nippon Koei 115
4.4.7Pharmaceuticals
4.4.7.1 Sector performanceIndian pharmaceutical sector is estimated at ~USD 18 billion (~INR 990 billion) in FY 201248. The sectorregistered a compounded growth of ~14% during the period FY 2008-12. The Indian pharmaceutical industry isexpected to grow at an optimistic CAGR of ~15% over the period FY 2012-23 to reach USD 133 billion by 202349.In terms of domestic and export market, the export market is expected to grow at much faster rate (CAGR of~18-20%) than the domestic market (CAGR ~12-15%). Exports are increasing due to greater acceptance ofgeneric drugs worldwide combined with a larger number of drugs going off-patent and increasing IndianAbbreviated New Drug Application (ANDA) filings. Therefore, by 2015, the share of exports to total pharmaturnover is expected to exceed the domestic market sale. The developed markets of USA and UK are the majormarkets for exports contributing ~28% of the total exports made. During the fiscal 2012, India exported ~INR633 billion worth of drugs & pharmaceuticals. This shows the ability of Indian pharmaceutical firms to meet thestringent quality norms of the western markets.
A key development in the past five years has been the industry's change in geographic focus, as global playershave sought to offset sluggish growth within their traditional markets. To that end, emerging economies likeChina, India, Russia, Eastern Europe, South America and the Middle East have become major growth marketsfor the industry. Growth in these emerging regions has been underpinned by greater government investment inhealthcare, increasing demand for drugs to treat diseases and strengthening regulatory and intellectualproperty requirements. In addition, many companies have set up research facilities in these countries to lowercosts. This shift signals the end of the industry's traditional dominance by countries like the United States,Europe and Japan. Amongst emerging economies, India is touted as one of the most attractive destination forpharmaceuticals manufacturing.
The Indian pharmaceuticals sector is subdivided into 3 major categories: Active Pharmaceutical Ingredients(API), Formulations and Contract Research and Manufacturing Services (CRAMS).Currently, API accounts for~55% of the total market followed by formulations (32%) and CRAMS (12%)50. With the demand for genericsincreasing in the foreseeable future, the API market is set to increase further. The high number of USFDA andUKMHRA approved plants (200+) in India, availability of talent pool and low R&D and production costs arepushing the CRAMS market, which includes contract manufacturing (CMO) and contract research (CRO).
The pharmaceuticals sector emerges to be a key sector which may contribute to CBIC’s success in terms ofattracting investments to the corridor. The corridor states of Karnataka, Tamil Nadu and Andhra Pradesh,together contribute to ~25% of the pharmaceuticals sector output of India. The CBIC districts are a highcontributor to the overall output of pharmaceuticals at the national level. On an average, the corridor districtsaccounted for more than 50% of the pharmaceuticals sector investment in these states of Karnataka, TamilNadu and Andhra Pradesh51.
Our industrial assessment of the corridor districts suggest that the chemicals & petrochemicals sector has thepotential to create 3%-9% of the industrial land demand in the corridor districts (considering BAU &BISscenarios respectively).
4.4.7.2 Key growth drivers for the sectorIndia’s strong GDP growth, higher life expectancy, growing population, rising disposable income, improvingliteracy, under-penetrated market, cost advantage and higher penetration of health insurance are some of theimportant factors driving the pharmaceutical industry in India.
48Sectoral Risk Outlook: Pharmaceutical sector, D&B, 201249Growth projections as per Department of Pharmaceuticals, Govt. of India; PwC analysis50Sectoral Risk Outlook: Pharmaceutical sector, D&B, 201251Capex CMIE database

Final Report – Comprehensive Regional PlanPwC/ Nippon Koei 116
Figure4.4.7: Demand drivers for India's pharmaceutical industry
India’s large talent pool of trained chemist possesses strong technical capabilities to manufacture products withexceptional quality standards. India has credit of having the largest number of US FDA approved facilitiesoutside the US. Also, increasing number of Indian pharma companies have been getting internationalregulatory approvals for their plants from agencies like MHRA (UK), MCC (South Africa), TGA (Australia),MCC (South Africa).
Japanese Government decision to replace the expensive patented drugs with cheaper generic versions comes asa shot in the arm for the Indian pharma segment. To enable this, Japan has signed a free trade agreement withIndia to ensure smooth supply of API/bulk drugs from various API suppliers. This move is expected to boost theexports of the API to the world’s 2nd largest pharmaceutical market.
According to Pharmexcil, pharmaceutical production costs are almost 50% lower in India when compared withdeveloped countries52. This enables Indian Pharmaceutical Companies to offer low cost drugs that are 5% - 50%lower when compared with the developed nations. As a result of India’s growing compliance withinternationally harmonized standards such as Good Laboratory Practices (GLP), Current Good ManufacturingPractices (CGMP) and Good Clinical Practices (GCP), the country is emerging as the most favoured destinationsfor collaborative Research & Development for bioinformatics and CRAMS.
4.4.7.3 Key nodes for pharmaceuticals investment in the corridorThe districts in Karnataka within the CBIC influence zone account for ~90% of all the pharmaceuticals sectorinvestments in the state53. Bengaluru emerges as the key district for pharmaceuticals investment among thecorridor districts in Karnataka, accounting for more than 75% of the investments in this sector.
The districts in Tamil Nadu within the CBIC influence zone are also the hubs of pharmaceuticals manufacturingin the country, accounting for a hefty ~63% of all the pharma sector investments in the state54. Kancheepuramemerges as the key district for chemicals investment among the corridor districts in Tamil Nadu, accounting formore than 75% of the investments in this sector within the corridor districts in Tamil Nadu. The pharmaindustries are clustered around the Alathur’s SIDCO Industrial Estate and Sriperumbudur Industrial Park inKancheepuram. Chennai emerges as the other popular investment destination for the pharmaceuticalsmanufacturers in the state, accounting for 14% of all pharma sector investments in Tamil Nadu.
52Sectoral Risk Outlook: Pharmaceutical sector, D&B, 201253Capex CMIE database54Capex CMIE database

Final Report – Comprehensive Regional PlanPwC/ Nippon Koei 117
The districts in Andhra Pradesh within the CBIC influence zone account for ~2% of all the pharma sectorinvestments in the state and do not have significant investments in the sector55. Key interventions required andstrategy for developing pharmaceutical sector along CBIC
Based on the proposed framework for industrial development strategy for CBIC, we propose certain keyinterventions/recommendations for the Government to develop the pharmaceutical sector along the identifieddistricts in the corridor. These recommendations have been segregated as economic enhancers, administrativeenhancers and value enhancers.
4.4.7.3.1 Economic enhancers
Table 4.4.16: Existing status, challenges and interventions required to increase investment in corridor –Pharmaceuticals sector
Bengaluru Urban and Rural
Existing status andcurrent asset profile
Strong availability of skilled resources for R&D and manufacturing Seaport connectivity with Mangalore (~250 km) and Chennai (~320 km) sea ports for exports
is constrained Presence of multiple pharma institutes & training centres Access to high quality skilled workforce Access to airport infrastructure
Demand factors The Suvarna Karnataka Development Corridor has proposed a Pharmaceutical & Bio-Techzone covering Bengaluru Urban district.
Proximity to a cosmopolitan domestic market in and around Bengaluru 4th Largest technology cluster in the world
Key shortcomings Vision for future land allocation is biased for services industry, hence availability ofcontiguous land for chemical industry may be a challenge
Key interventionsrequired
Ensure land availability for pharmaceutical manufacturers following best practices formanufacturing
ChennaiExisting status andcurrent asset profile
Excellent seaport connectivity, with proximity to Chennai seaport Abundant availability of skilled manpower Excellent road & rail connectivity with other cities Proximity to existing chemicals cluster for feedstock availability Land availability in close proximity to city infrastructure for easy access to high quality skilled
workforce (especially airport infra)Demand factors Proximity to a cosmopolitan domestic market in and around ChennaiKey shortcomings Non-availability of product display and business promotion centre, etc.
Lack of post manufacturing storage and distribution network Insufficient clinical research facilities. Non-availability of pure water which is an important ingredient in the processing, formulation
and manufacturing of pharmaceutical products. Shortage of skilled manpower as services is attracting most of the talent pool Over dependence on import of raw materials Poor and obsolete technologies amongst the MSME players Poor R & D infrastructure facilities – no dedicated research facility for the Pharmaceuticals
sector Inability to compete with MNC due to lack of marketing support
Key interventionsrequired
Creation of dedicated R&D institute for promoting product innovation Setting up several institutes for creating highly skilled manpower for the pharmaceuticals
sector Product promotion centres for SME players Establishing clinical research facilities, with private partnerships Create backward linkages for raw materials which are largely imported Promote technology transfer between developed national players and local players
KancheepuramExisting status andcurrent asset profile
Excellent seaport connectivity, with proximity to Chennai (~40 km) seaport Proximity to existing chemicals cluster for high quality feedstock Presence of several industrial parks and industrial estates with land availability
55Capex CMIE database

Final Report – Comprehensive Regional PlanPwC/ Nippon Koei 118
Bengaluru Urban and Rural
Excellent road connectivity through the world class East Coast Road and upcoming upgradedNH4 & 45
Proximity to Chennai, which has access to highly skilled resourcesDemand factors Proximity to a cosmopolitan domestic market in and around ChennaiKey shortcomings Inadequate availability of quality power
Mismatch of technologies between existing micro players and MNCs leading to lack of supportby MNCs
Long time gap for processing and sanctioning of CFC proposals Need for more sick unit rehabilitation studies and rehabilitation packages Absence of dedicated research institutes and high quality research organizations
Key interventionsrequired
Ensure adequate power availability Assistance in technology transfer through collaborations with MNCs Reducing time required for clearances and approvals Incentives for revival of sick units
NelloreExisting status andcurrent asset profile
Presence of several industrial parks and industrial estates with land availability Existing chemicals cluster, which is getting stronger eventually
Demand factors Government focus to develop the region into an industrial hubKey shortcomings Absence of dedicated research institutes and high quality research organizations
Lack of highly skilled workforce; services is attracting most of the talent pool Acute shortage of power for MSMEs in the district Lack of pharmaceuticals sector training institutes Lack of infrastructure for waste and water treatment, effluent treatment, water infrastructure,
etc.Key interventionsrequired
Establish quality institutes to address the skill gap Ensure power availability to industry Ensure adequate policy initiatives to develop basic infrastructure for pharmaceuticals
industry like water, waste, effluent, power, etc.Key sub-segments thatmay emerge
Bulk drugs/APIs
Source: District profiles, Industry reports, PwC analysis
4.4.7.3.2 Administrative enhancers
The Government of India understands the potential that the pharmaceuticals sector holds in the country, andhas been supporting the growth of this sector through policy level push, at the same time regulating it through arobust regulatory framework. The National Pricing Policy 2012 announced by the Government, is a keyregulatory framework for pricing of drugs (essential medicines and formulations) so as to ensure availability ofrequired medicines at reasonable prices even while providing sufficient opportunity for innovation andcompetition to support growth of industry. The policy proposes to cap the prices of 348 essential medicines andformulations at an average price of three best-selling brands. The Government has also allowed 100% FDIthrough automatic route for Greenfield investments in drugs and pharmaceuticals including those produced bythe use of recombinant technology. For brown field investments, FIPB approval is required.
Beyond these initiatives, the Government has also introduced zero duty for technology upgrades in thepharmaceutical sector through the Export Promotion Capital Goods Scheme (EPCG) scheme. The GOI hasextended support for speedy approval of manufacturing and exports of formulations by reducing the approvaltime for No Objection Certificate (NOC) manufacturer and NOC export license from 12 weeks to 2 weeks. TheGovernment is also in the process of setting up 7 new National Institutes of Pharmaceutical Education andResearch (NIPER), to cater to the industry requirement of highly skilled resources.
Among corridor level states, Karnataka government has recently announced a policy for the pharma sector,which intends to provide ready-to-use infrastructure for establishing pharmaceutical enterprises on clusterconcept through pharma parks at potential locations of the State. With some incentives and concessions, theKarnataka state pharmaceuticals policy may act as a catalyst for growth and development of the pharmaceuticalsector. The policy focuses on human resource development to make available readily employable manpower atall levels to the pharmaceutical sector, and marketing support to Karnataka-based companies through pricepreference in government tenders. Other features of the policy include enhancing facilitation mechanism,enabling investors to set up projects with ease and less transaction cost, encouraging the sector through variousadditional incentives and concessions.

Final Report – Comprehensive Regional PlanPwC/ Nippon Koei 119
The Government of Tamil Nadu has extended incentives for the sector through the state industrial policy 2007-11 and the policy note 2011-12. Tamil Nadu also has a state level policy for the special economic zones within thestate under the SEZ Act 2009. The incentives under this policy are, therefore, extended to the pharmaceuticalssector players in the SEZ space. The Tamil Nadu Biotechnology Policy and special bio-parks have beenintroduced to support pharmaceutical and biotechnology industries in the state.
The Government of Andhra Pradesh has also extended incentives for the sector through the state industrialpolicy 2010-15 and the state SEZ policy. An exclusive Life Sciences Promotion Policy has also been announcedrecently by the state, to promote and attract investors in the areas of biotechnology, medical devices, bioservices, pharmaceuticals and neutraceuticals segments.
We recommend that the respective state governments facilitate value addition in the pharmaceuticals throughincentivising R&D in product innovation. Special incentives can be earmarked for firms which are setting upplants in adherence to Good Laboratory Practices (GLP). The Government may also incentivise certain specialsegments within pharmaceuticals, where India has developed strength and needs to consolidate. Incentives forbulk drugs development with focus on Drug discovery and development, cleaner technology, Polymorphism,Nanotechnology etc56 can be considered.
Government may look at removing regulatory uncertainty in the pharmaceuticals manufacturing space, such asreduction in delay in approvals for clinical trials. Although India has 15% of the world’s population and 20% ofthe global disease burden, less than 2% of global clinical trials take place in India. Improved regulatoryframework will strengthen the growth of clinical research organisation (CRO) industry (especially thebioavailability and bioequivalence (BA/BE) studies). This would also have strong bearing for the future ofresearch and development (R&D) in India. According to data from the Drug Controller General of India (DCGI),new drug approvals dropped by 56.25% during 2011 to 98 from 224 in 2010.
Government may also introduce reforms in the health insurance sector and launch health missions within thecountry, to boost the confidence of domestic manufacturing to cater to local demands. Future reforms arerequired in the insurance sector to include coverage of outpatient expenses, including drug related expenditureby increasing access to essential drugs at affordable prices57.
At corridor level, Government may chalk out policies for setting up dedicated pharmaceuticals manufacturingparks. Government should take the lead and develop external infrastructure linkages, on similar lines as that ofPCPIR and Industrial Estates. Government may also consider extending special incentives to setting upmanufacturing plants with innovative product line or for firms which are investing in innovative R&D. Thepolicies should be aimed at easing out the procedural delays and ensure swift clearances at all levels, providingthe project is compliant with Good Manufacturing Practices.
56http://pharmaceuticals.gov.in/pharma_niper.pdf57 India Pharma Inc. Gearing up for the next level of growth, PwC publication 2010

Final Report – Comprehensive Regional PlanPwC/ Nippon Koei 120
Sources: India Pharma Inc. Gearing up for the next level of growth, PwC publication 2010
4.4.7.3.3 Value enhancers
4.4.7.3.3.1 Research & Development:
The pharmaceuticals sector in India is one of the major contributors to the R&D spend in the country amongmanufacturing sectors, and the share of pharma R&D in the total manufacturing sector and chemicals sectorR&D spend has been steadily rising. In spite of this trend, comparison at a global scale reveals that Indianpharma R&D is still lagging behind, with a mere 4% R&D-sales ratio as against 10%-15% R&D-sales ratioaverage at global level58.
The key challenge in India with respect to R&D is that most of the firms are focusing on process R&D or thethrust is for minor product improvement, and this is also limited to medium to large scale companies. Typicallyfirms with revenues above Rs 300 crore and earning 50-60% of revenues from international markets of US,Europe and Japan, are the ones who are taking these R&D initiatives, while the large number of smaller pharmafirms is not able to afford the same59. The area of product innovation is largely unexplored in India, as most ofthese process imitative R&D firms have competence for drug manufacturing but lack necessary skill for drugdiscovery. One of the key reasons cited for this by the industry is the lack of highly trained R&D professionals inthe country. This is one area which the Government can focus on for the CBIC region. We recommend that GoIestablishes dedicated research institutes for innovative product R&D and bridges the lacuna of highly skilledR&D professionals. Within product R&D, Government should facilitate research in the niche generic product,which is expected to emerge into a potential large segment across the globe. The government should alsoactively promote collaborative activity in this field by facilitating more JV and Licensing Deals, between Indiancompanies and MNCs. Government may create a R&D fund to be used for establishing and promotinginnovative drug research centre within the corridor.
4.4.7.3.3.2 Skill development:
The chemicals & pharma sector in Karnataka is expected to generate an incremental demand of 9,600 peoplefrom 2012-2260. Pharmaceuticals sector’s skill demand trend is similar to chemicals sector, as it is an end-use
58Performance of Pharmaceutical companies in India, Springer59Performance of Pharmaceutical companies in India, Springer60Source: National Skill Development Corporation publication on skill gap in Karnataka, 2012
Introduce reforms in the health insurance sector and launch health missions within the country
Remove regulatory uncertainties - reduction in time for approvals for clinical trials
Use of technology to change the healthcare delivery mechanisms eg. m- health and telemedicine, leading toincreased awareness of healthcare
Incentivise Good Laboratory Practices Compliance
Introduce alternate funding mechanisms to set up R&D institutes in drug discovery
Incentivise manufacturers within the corridor - Set up funds for creation of external infrastructure for thepharmaceutical parks
Ease out procedures for setting up a new manufacturing plant
Incentives for firms with innovative product line or for firms which are investing in innovative R&D

Final Report – Comprehensive Regional PlanPwC/ Nippon Koei 121
industry for chemicals intermediates. Within the corridor states, Karnataka is likely to face a supply gap of 1.9million people, which also includes around 20-30% of the unemployable workforce joining from educationalinstitutions 61 . Several key districts identified as potential pharma nodes within the corridor, includingBengaluru urban, Bengaluru rural, Ramnagara, and Nellore, have shown deficit in the availability of labour by202262.
We recommend that Government should work in collaboration with industries, to upgrade and design newcourses in the institutes which cater to the industry requirements. Government may look at establishing a newNational Institutes of Pharmaceutical Education and Research (NIPER) in one of the districts of Bengaluru orChennai, which will provide adequate skilled resources for the industry.
4.4.7.4 Recommendations summaryOur research suggests that India has a strong domestic demand for generic generics and for niche generics, withgradual increase in demand for niche generics. Government should focus on promoting product innovationthan product imitation, and establish centres of R&D for drug discovery and research. Government shouldprovide incentives to firms which are investing in R&D facilities for innovative product development.Government should ensure that the logistics and supply chain gaps are bridged in a fashion that the essentialdrugs, whose prices are being controlled, remain affordable to the end users. Government should ensure thatlocal linkages of feedstock are available with the pharmaceutical manufacturers, and may take an approach ofcreating mutually dependent clusters of chemicals manufacturing and pharmaceuticals manufacturing.Although average logistics costs as a % of sales is only 1.5-2%, the logistics efficiencies are important forcompetitiveness and shelf-presence. Hence, Government should ensure excellent connectivity between theseindustrial hot spots within the CBIC and the demand centres within the country. Since power availability iscritical for the sector, Government should ensure that these districts have adequate power availability for theindustry. Further, the domestic market is highly fragmented and largely served by the SMEs, therefore,adequate support should be provided in terms of credit facilities during initial years of operations, marketingsupport, quality power availability and manpower availability. Government should especially focus ondeveloping quality institutes for the pharmaceuticals sector, which may provide the necessary skilled resources.
India is strong on all the sub-segments including formulations and APIs. India is also gaining ground incontract research and clinical trials. Government should ensure that the regulatory and compliance frameworkare fast tracked to provide quick approvals for products which are compliant to the guidelines. Government ofIndia should focus on establishing dedicated port linkages to ease the logistics between the corridor districts tothe sea ports. Government should establish Product Promotion Centres for linking these SMEs with larger firmsoutside India, which are semi-regulated or not very stringent in regulations, in order to boost exports from thesector. Government can help the SMEs in partnering with MNCs in emerging markets. Such alliances benefitfrom the R&D (formulation development) and manufacturing capabilities of the Indian partners and theextensive marketing and distribution footprint of the MNCs in those markets. Hence, going forward, India mayleverage its strengths in the supply of low-cost, quality medicines across the world and partner with foreigncompanies to drive growth and play a larger role in global pharma market.
On an overall level, the basic infrastructure of developed land with effluent treatment, waste treatment, waterand power infrastructure should be ensured by the state Governments along the corridor districts. Poweravailability is a key issue faced by most of the MSMEs and hence, Government may look at ensuring adequatequality power for these industrial districts.
4.4.8 Chemical and petrochemicals
4.4.8.1 Sector performanceThe Indian Chemicals & Petrochemicals sector grew from USD 62 billion in 2009 to ~USD 94 billion in 2013at a CAGR of 11%, and is expected to reach USD 195 billion by 2023, growing at a CAGR of ~10-12%63. Thechemical and petrochemical sector presently constitutes around 14% of the domestic industrial activity. Indianchemicals & petrochemicals sector is expected to increase its share in the global market to ~5% from its current
61Source: National Skill Development Corporation publication on skill gap in Karnataka, 201262Source: National Skill Development Corporation publication on skill gap63 Department of Chemicals and Petro-Chemicals, GoI

Final Report – Comprehensive Regional PlanPwC/ Nippon Koei 122
3% contribution. Globally, the chemicals industry is seeing a marked shift in geographical terms, withmanufacturing moving closer to the end use markets of Asia. With the gradual off-shoring of end-use industriesfor chemicals & petrochemicals like textiles, auto & auto components, electronics etc. to the Middle East andAsia, the manufacturers have shown there keen interests in expanding their presence in these markets. Thisalso gets supported by the lower manufacturing and logistics costs in these regions. Within Asia, China andIndia are emerging as dominant destinations, owing to a large domestic consumer base. The existing plants inEuropean and South Korean markets are expected to become the global pressure points for plant closures,owing to lower competitiveness against peer set-ups in Asian and Middle East economies64. India currently hasa huge opportunity to attract these international majors in chemicals manufacturing.
Hence, the chemicals & petrochemicals sector emerges to be a key sector which may contribute to CBIC’ssuccess in terms of attracting investments to the corridor. The corridor states of Karnataka, Tamil Nadu andAndhra Pradesh, together contribute to ~16% of the chemicals sector output of India. Within the states, thesedistricts have traditionally accounted for ~14% of the total chemicals sector investment in these 3 states.Karnataka has presence of end-use industries for chemicals sector like automobiles and pharmaceuticals(including biotechnology), which are likely to act as demand pullers for the chemical industry in the state.Within the corridor there are two key refineries - 10.5 MMTPA plant in Manali by Chennai Refinery Ltd, and 1MMTPA plant in Nagapattinam by Chennai Refinery Ltd.
Our industrial assessment of the corridor districts suggest that the chemicals & petrochemicals sector has thepotential to create 5%-8% of the industrial land demand in the corridor districts (considering BAU &BISscenarios respectively).
4.4.8.2 Key growth drivers for the sectorThe chemicals & petrochemicals sector output acts as feedstock or intermediate raw material for many of theend use industries like pharmaceuticals, auto & auto components, paints, infrastructure, food processing, glassindustry, urban asset management, etc. The key driver for the chemical industry as a whole is the end useindustry segment, which is a direct outcome of increased consumption and population across the globe.Chemicals & petrochemicals act as an intermediate raw material for most of the end use products, ranging fromfood additives to electronics and automotives. Many of these key industries are present in thecorridor .Therefore, different set of end-use industries act as drivers for the different segments under thechemicals & petrochemicals sector.
The key drivers of demand for the chemicals and petrochemicals sector is as highlighted below:
Increased consumption intensity
Compared to the developed world (the US, Europe) or China, the current penetration of specialty chemicalswithin India's end markets is low. With an increased focus on improving products, usage intensity of specialtychemicals within these end markets will rise in India over the next decade. For example, India's currentexpenditure on admixtures is only USD 1/ m3 of concrete, compared to USD2/ m3 in China and USD 4.5/ m3 inUSA. With increasing demand for higher quality construction and increasing awareness of concrete admixturebenefits, the industry could double the intensity of admixture consumption in India. Similarly, the usage ofpesticides in India is 0.58 kg/ha compared to 2 kg/ha in China, 10.8 kg/ha in Japan, 16.5 kg/ha in South Koreaand global average of 3 kg/ha65.
Increase in demand for exports
India’s chemical sector is well poised for a strong growth in exports in certain value added segments likepetrochemicals, specialty chemicals, pharmaceuticals and agrochemicals. India maintains its position as a netnaphtha exporter. With the development of PCPIRs in the country, the value added segments like specialtychemicals, petrochemicals and knowledge chemicals will experience a very strong surge in exports.
Improved consumption standards
Consumption standards are policies implemented by the government to promote the safe use of products. Mostdeveloped countries (e.g. the US, Germany) have implemented stringent consumption standards across various
64 The Future of European Chemical Industry, KPMG International65Knowledge paper titled “Emerging India: Sustainable Growth of the Chemical Sector” by TSMG, 2012

Final Report – Comprehensive Regional PlanPwC/ Nippon Koei 123
end-use markets. As the economy develops, India will need to regulate products more stringently, andstrengthen consumption standards, which in turn will promote increased usage of specialty chemicals. Thiswould also result in phasing out of obsolete technologies and will pave the way for new technologies in thecountry. This would eventually result in fresh investments and therefore a strong push for the sector.
4.4.8.3 Key nodes for chemicals & petrochemicals investment inthe corridor
The districts in Karnataka within the CBIC influence zone account for ~4% of all the chemicals sectorinvestments in the state66. Bengaluru emerges as the key district for chemicals investment among the corridordistricts in Karnataka, accounting for more than 95% of the investments in this sector. The key industrial parkswithin the district which act as focal points for the chemical investments include the Bidadi Industrial park,Peenya industrial area and Bommasandra industrial area.
In Tamil Nadu, the CBIC influence zone districts account for a hefty ~51.9% of all the chemicals sectorinvestments in the state67. The districts of Chennai, Tiruvallur and Kancheepuram together account for ~98% ofall investments in the chemicals sector across the corridor districts within Tamil Nadu. Kancheepuram emergesas the key district for chemicals investment among the corridor districts in Tamil Nadu, accounting for morethan 75% of the investments in this sector within the corridor districts in Tamil Nadu. The chemicals industriesare clustered around the industrial township of Manali, which houses several upstream refinery projects forCPCL, fertilizer manufacturing project for Madras fertilizers, among others. Chennai emerges as the otherpopular investment destination for the chemicals manufacturers in the state. Key investing companies in thecorridor districts within Tamil Nadu include the likes of Chennai Petroleum Corporation Ltd. (CPCL), IndoRama Synthetics (India) Ltd., Philips Carbon Black Ltd., Madras Fertilizers, EID Parry, Aditya Birla Nuvo,Nilkamal, Nippon Paint, Praxair, etc. The influence zone districts have a number of institutes and trainingcolleges ensuring availability of skilled resources for the industry. However, there is an absence of any dedicatedresearch institute for the sector within the corridor influence in Tamil Nadu.
The districts in Andhra Pradesh, within the CBIC influence zone, do not have a stronghold in the chemicals &petrochemicals sector, with only ~1.7% of total chemical sector investments in the state taking place in thesedistricts. Nellore has generated renewed interest among investors across sectors, as Government is focusing todevelop it into an industrial hub.
4.4.8.4 Key interventions required and strategy for developingchemicals & petrochemicals sector along CBIC
Based on the proposed framework for industrial development strategy for CBIC, we propose certain keyinterventions/recommendations for the Government to develop the chemicals & petrochemicals sector alongthe identified districts in the corridor. These recommendations have been segregated as economic enhancers,administrative enhancers and value enhancers.
4.4.8.4.1 Economic enhancers
For the shortlisted districts along the corridor, we have summarized the key interventions required by GoI,along with the existing status and challenges in these districts:
66Capex CMIE database67Capex CMIE database

Final Report – Comprehensive Regional PlanPwC/ Nippon Koei 124
Table 4.4.17: Existing status, challenges and interventions required to increase investment in corridor – Chemical and petrochemical sector
DistrictExisting status and current
asset profileDemand factors Key shortcomings Key interventions required
Bengaluruurban
Raw material availability fromMangalore refinery, located at~250 km
Availability of skilled resourcesfor specialty chemicals
Seaport connectivity withMangalore (~250 km) andChennai (~320 km) sea portsfor import of raw materials
Connected to gas grid throughDabhol-Bengaluru natural gaspipeline
Presence of industrial clusterslike Bommasandra IndustrialArea and Peenya IndustrialArea
Presence of end-use industrycluster of auto & autocomponents ensures demand forspecialty chemicals & plastics
Strong urbanization creates amarket for specialty chemicalslike construction chemicals &plastics
Presence of bio-tech clustercreates demand for specialtychemicals like industrialenzymes and catalysts – Biotechpark in Bengaluru
10% of the MSME units in thedistrict are in agri & foodprocessing, leading to strongdemand for plastics in packaging
Feedstock availability is achallenge as no refinery existsin close proximity (<50 km);limited natural gas availabilityfor industrial use
Vision for future land allocationis biased for services industry,hence availability of contiguousland for chemical industry maybe a challenge
Absence of dedicated R&Dinstitute for components likeSpecialty Chemicals
Polluting industries can beclose to an urban location.Segments like specialitychemical, plastics can beexplored
Dedicated freight corridor betweenBengaluru urban and Chennai seaportrequired to promote exports of specialtychemicals
Rail connectivity to sea-port should beimproved to promote exports from thecorridor
Improved infrastructure of roadconnectivity with other demand centres tocater to plastics demand
Land to be allotted to chemicalmanufacturers following best practices,especially specialty chemicals units
Government may set-up a plastic processorspark in the district
Set up a dedicated R&D centre and Centreof Excellence for Specialty Chemicals
BengaluruRural
Raw material availability fromMangalore refinery, located at~300 km
Proximity to Bengaluru, whichhas access to skilled resources
Existing industrial assetincludes Hoskote Industrialestate
Proximity to end-use industrycluster of auto & autocomponents to ensure demandfor specialty chemicals andplastics
Horticulture is one of the keyindustries in the district whichensures demand for agro-basedchemicals
Feedstock availability fordownstream chemicalsmanufacturing is a challenge
Existing connectivity to seaport(Chennai) requires tremendousimprovement
Develop freight corridor between Bengalururural and Chennai seaport, to promoteexports of specialty and agro-basedchemicals
Rail connectivity to sea-port should beimproved to promote exports from thecorridor
Improved infrastructure of roadconnectivity with other demand centres
Land to be allotted to chemicalmanufacturers following best practices,especially specialty, agro chemicals units
Government may set-up a plastic processorspark in the district

Final Report – Comprehensive Regional PlanPwC/ Nippon Koei 125
DistrictExisting status and current
asset profileDemand factors Key shortcomings Key interventions required
Ramnagara
Presence of Bidadi IndustrialArea
Proximity to Bengaluru, whichhas access to skilled resources
Connected to Dabhol-Bengaluru natural gas pipelinewhich terminates in Bidadi
Suvarna KarnatakaDevelopment Corridor envisagesthe creation of a AutomobileZone
Feedstock for segments likeplastics is not available inproximity
Ensure natural gas availability forestablishing backward linkages for specialtychemicals manufacturing
Improve connectivity to seaport and rail forpromoting exports of specialty chemical
Land to be allotted to chemicalmanufacturers following best practices,especially specialty, agro chemicals units
Establish backward linkages formanufacturing petrochemical products
Chennai
Excellent seaport connectivity,with proximity to Chennai andEnnore sea ports (both withPOL berths)
Abundant availability of skilledmanpower
Excellent road & railconnectivity with other cities
Proximity to existing chemicals& petrochemicals cluster –feedstock availability fordownstream industries
Presence of end-use industrycluster of auto & autocomponents, leather, paper andelectronics ensures demand forspecialty chemicals & plastics
Strong urbanization creates amarket for specialty chemicalslike construction chemicals &plastics
Absence of dedicated R&Dinstitute
Lack of feedstock availability
Ensure feedstock availability of natural gasand naphtha to manufacture key organicchemicals and fertilizers
Improved infrastructure of roadconnectivity with other domestic demandcentres
Land to be allotted to chemicalmanufacturers following best practices,especially specialty chemicals units
Government may set-up a plastic processorspark in the district
Set up a dedicated R&D centre and Centreof Excellence for Specialty Chemicals
Establish product promotion centres forMSME players
Tiruvallur
Excellent seaport connectivity,with proximity to Chennai (~40km) and Ennore sea ports (~45km) [both with POL berths]
Abundant availability of skilledmanpower
Home to chemicals &petrochemicals cluster atManali– feedstock availabilityfor downstream industries
Proximity to end-use industrycluster of auto & autocomponents in Chennai -ensures demand for specialtychemicals and plastics
Presence of textile clusters atPallipet and R K Pet - ensuresdemand for specialty chemicals
Agriculture is one of the keycontributors to the economy inthe district - ensures demand foragro-based chemicals
Land, water and poweravailability and reliability ofsupply
Ensure land availability for large scaleprojects , especially integratedpetrochemicals manufacturing projectsfollowing best practices
Establish excellent road and railconnectivity to other domestic demandcentres, especially for fertilizers, plasticsand petrochemicals products
Establish product promotion centres forMSME players
Source: District profiles, Industry reports, PwC analysis

Final Report – Comprehensive Regional PlanPwC/ Nippon Koei 126
4.4.8.4.2 Administrative enhancers
The corridor states of Karnataka, Tamil Nadu and Andhra Pradesh do not have any specific policy dedicated tothe chemicals and petrochemicals sector. The states are guided by the national level policies, where the draftNational Chemical Policy 2012 is yet to come out in concrete form. While the physical infrastructureshortcomings may get addressed through the economic enhancers, Government should consider a robust policyand regulatory framework to ensure the sector’s growth in the corridor.
Government should take definitive measures to resolve certain issues pricing of domestic natural gas. Thecurrent pricing of natural gas makes it unviable for the basic chemicals manufacturers (methanol) to competeagainst cheaper imports. Similarly, chemicals & petrochemicals sector players face high cost of compliance toenvironment norms and the compliance procedures are time consuming. The policy measures should ensurethat while quality of chemicals manufacturing is not compromised, the ease of doing business should beensured.
We recommend that the Government of these states should propose a dedicated policy for the sector, whichmay increase the attractiveness of the sector along the corridor. We propose the following aspects to beaddressed through a dedicated policy for this sector:
4.4.8.4.3 Value enhancers
Skill development:
The chemicals & pharma sector in Karnataka is expected to generate an incremental demand of 9,600 peoplefrom 2012-2268. Karnataka is likely to face a supply gap of 1.9 million people, which also includes around 20-30% of the unemployable workforce joining from educational institutions69. Key districts identified as potentialchemicals & petrochemicals nodes within the corridor including Bengaluru urban, Bengaluru rural, Ramnagara,and Nellore have shown deficit in the availability of labour by 202270.
District name Labour availability scenario in 2022
Bengaluru Urban Deficit
68Source: National Skill Development Corporation publication on skill gap in Karnataka, 201269Source: National Skill Development Corporation publication on skill gap in Karnataka, 201270Source: National Skill Development Corporation publication on skill gap
Ensure feedstock pricing issues to be resolved to give a clear veiw to the industry forfuture investments
Ensure support to players in acquiring feedstock and mining rights in resource richcountries like Middle East, Russia, Indonesia, South Africa, Australia, etc.
Consolidate acts into an Integrated Chemical Legislation, simplify regulatory structure andstrengthen regulations
Rationalize taxes and duties to promote domestic manufacturing
Ensure stricter enforcement of regulations and promoting green manufacturing practices
Incentivise the MSME players to increase the sectors' presence in the MSME segmentalong the corridor districts

Final Report – Comprehensive Regional PlanPwC/ Nippon Koei 127
District name Labour availability scenario in 2022
Bengaluru Rural DeficitRamnagara DeficitChennai NATiruvallur NAKancheepuram NANellore Deficit
Source: National Skill Development Corporation publication on skill gap
It is also estimated that India will need over 14,000 highly skilled, chemical engineers within the next decade tojoin the specialty chemical industry alone, and a potential short fall of 8,000 to 10,000 chemical engineers isindicated driven by limited talent from Tier 1 universities and lack of attractiveness of the chemical sector foremployment. Hence, the shortfall of resources will be a national phenomenon and Government can takeproactive measures to create a hub of chemicals sector resource building along the CBIC. We recommend thatGovernment should work in collaboration with industries, to upgrade the current chemical departments in Tier2 universities to become state-of-the-art departments (in terms of infrastructure, faculty qualifications, industryinteraction, and administration). Government should also ensure new ITIs, vocational training institutes anddiploma institutes along the identified districts.
Chemical Sector is one of the largest consumers of Industrial Water and also contributed highly to industrialwastes. Efforts need to be made for improving efficiency of water use and promoting recycle, reuse concepts.India also needs to provide support for developing quality infrastructure for effluent treatment andmanagement.
Promote industry based on efficiency; incentivise industry players to follow best practices ofmanufacturing like higher efficiency, latest technologies
Promote recycle & reuse concepts, especially for water
Promote technologies such as 'zero discharge' of industrial effluents
Extend special incentives to large scale and innovative projects along the corridor, on a case to casebasis
Promote investments in R&D and green technologies, fiscal incentives such as accelerated depreciation,tax benefits, subsidies etc.
Establish a CBIC Chemical Innovation Fund to encourage commercialization efforts for innovationsgenerating inclusive growth
4.4.8.5 Recommendations summaryDomestic demand: Our research suggests that certain sub-segments like petrochemicals, fertilizers andspecialty chemicals have tremendous domestic potential and the capacities in most cases are either facingunder-supply situation or will see under-capacity situation beyond 2020. The Government should focus oncreating the necessary infrastructure like road connectivity to major cities; major end-use industrialcities/estates/industrial parks etc. within the identified chemicals sector nodes along the corridor, to enablemore investments in the region. For products like methanol, Government should ensure rational import dutiesand enhance end-use industry based on this feedstock. For products like PVC and EDC, necessary linkages ofroads should be created and incentives should be accorded to promote domestic manufacturing, within thecorridor. Government should also target the specialty chemicals segment to flourish within the corridor districts.Government should ensure higher number of technical institutes and training centres to bridge the impendinglabour gap for this sub-segment along the corridor districts. Chennai, Kancheepuram, Tiruvallur, Bengaluruurban, Bengaluru rural, Ramnagara and Nellore should have preferential ease of land allotment for chemicalsector players. Government should also ensure that naphtha allocations are sufficient to the fertilizer industrywithin the corridor and may extend special project linked incentives to mega projects for fertilizermanufacturing in the corridor.

Final Report – Comprehensive Regional PlanPwC/ Nippon Koei 128
Strategy for export demand: The key sub-segments that are having strong export oriented demand are thespecialty chemicals and agrochemicals segment. Government of India should focus on establishing dedicatedport linkages to ease the logistics between the corridor districts to the sea ports. Government should also ensurethat the sea ports are capable enough to handle such liquid chemicals. Beyond this, special incentives may beextended to the players for establishing their units within the corridor districts. Government should accord thestatus of innovative projects to key projects which are based on latest technologies in these segments. Greenchemicals should be promoted and special incentives should be extended to companies following greenmanufacturing practices.
On an overall level, the basic infrastructure of developed land with effluent treatment, waste treatment, waterand power infrastructure should be ensured by the state Governments along the corridor districts. Poweravailability is a key issue faced by most of the MSMEs and hence, Government may look at ensuring adequatequality power for these industrial districts. On the MSME front, the Government initiatives should be focusedon establishing product promotion centres along the key corridor districts, which can connect the MSME unitsto both domestic as well as global market. Government should ensure that the MSMEs are extended properproject funding and are given due assistance during the initial years. A dedicated cell for monitoring the MSMEsector progress for the chemical sector players within the corridor districts may also be considered.
To boost the chemical sector growth in the country, the Government of India came out with the draft NationalChemical Policy (NCP) in 2012. The Draft National Chemical Policy, 2012 released by the Ministry of Chemicalsand Fertilizers, Department of Chemicals and Petrochemicals, Government of India in 2012 is a landmarkdevelopment for the industry. The policy accords high importance to aspects of research and development,safety, sustainability and green chemicals. The policy articulates the need for a consolidation of multipleregulations and policies into a single holistic framework. Sustainability is one of the mainstays of the policy. Itencourages companies to seek ‘Responsible Care’ certification. It envisages identification of focus areas andthen supporting educational and research institutes to develop low water intensive, environmentally compliantand safe green processes. Incentives for green products and processes are also discussed in the draft framework.Industry specific guidelines for chemical disaster management are on the anvil, with coordination from theNational Disaster Management Authority.
The Government has also allowed 100% FDI in the chemicals sector. The manufacturing of most chemicalproducts inter-alia covering organic/inorganic, dyestuffs & pesticides is de-licensed. This is also an importantpolicy push from the Government to attract investments in the sector. Apart from this, the Government of Indiahas also announced various incentives for specific sub-sectors like the scheme for setting up of plastic parks andthe petrochemical policy in 2007. The Government of India has also come up with a policy for promotion ofPetroleum Chemicals and Petrochemicals Investment Regions (PCPIR) in May, 2007, with the objective ofaccelerating promotion of investment in the chemical / petrochemical sectors so as to make India a hub forboth domestic and international markets taking advantage of global shift in demand and production forpetrochemicals. These factors have a strong impact on the investment scenario in the chemical sector in Indiaand the upcoming National Policy is set to further strengthen the scenario of the sector.
4.4.9Electrical machinery and machinery sectors
4.4.9.1 Sector performanceGlobally robust economic growth in developing countries, such as China and India, along with rapidurbanization trends and growth in fixed investment spending (especially in infrastructure such as roads andelectricity generation) boosted demand for electric machinery and machinery in the region. Demand in thesesectors is fuelled by end-use sectors, like construction, power, infrastructure development, and supported bylarge size of Asia Pacific economies which are also home for 55% of the world’s population.
Global trade in electrical equipment products accounts for about 4% of the total global trade. Globalexports reached USD 688 billion in 2012, with China being the leading exporter of electrical equipment – 18%share, followed by Germany, USA and Japan. Global machinery trade accounts for about 11% of the totalglobal trade. Global exports reached USD 2,049 billion in 2012 with China emerging as the leading exporter(18% in total global exports) followed by traditionally countries with traditionally strong machinerymanufacturing capacities – Germany, USA and Japan.

Final Report – Comprehensive Regional PlanPwC/ Nippon Koei 129
The Indian electrical machinery sector output grew at 23% CAGR between 2008-09 and 2010-11 and reachedUSD 33 billion (Rs. 198,395 crore) by 2010-1171. Its share in total national manufacturing output amounted to4%. Exports of electrical machinery for the corresponding period were USD 3.5 billion (Rs. 20,742 crore) andcontributed around 2% to the total exports of goods from India.72There are four major sub-sectors thatcontribute 88% of the sector’s output in India. They include electric motors, generators and transformers,batteries and accumulators, wiring and wiring devices and domestic appliances. According to the Departmentof Heavy Industries projections, overall growth of the sector is forecast around 13-14% till 2022.
The India machinery sector output grew at 14% CAGR between 2008-09 and 2010-11; its output amounted toUSD 37 billion (Rs. 2,22,185 crore).73 Exports of machinery for the corresponding period were USD 6.8 billion(Rs. 40,805 crore) and contributed around 4% to the total exports of goods from India.74This sector includestwo major sub-sectors – general and special purpose machinery. Share of general purpose and special purposemachinery is 55% and 45% respectively. Further analysis suggests that engines and turbines, machinery formining, quarrying and construction and agricultural machinery are the leading segments of the sector. Apartfrom these segments, healthy demand is projected for other types of special purpose machinery, like machineryfor metallurgy, plastic processing machinery and machine tools. Overall demand forecast for general purposemachinery is 16%75 and for special purpose machinery is around 9-10%76.
The corridor states of Tamil Nadu, Karnataka and Andhra Pradesh together contribute to 26% of electricalmachinery output and 25% of machinery output in India. The districts of these states that fall under influence ofCBIC, have traditionally accounted for 90% of the total electrical machinery investments and 76% of machineryinvestments in these three states.
Given the high growth trajectory of the sectors and huge domestic market potential and strong performance ofthe sectors in the districts under corridor’s influence, electrical machinery and machinery sector are poised toemerge as key sectors which may contribute to CBIC’s success in terms of attracting investments to the corridor.The area under the CBIC also includes large-scale engineering development zones such as Hosur in Krishnagiri,Integrated Business Cities– Mahindra World City in New Chennai, Sri City along the border of Andhra Pradeshand Tamil Nadu, Jinani Industrial area near Bengaluru, Mannavaram manufacturing facility in Chittoor, etc.
Our industrial assessment of the corridor districts suggests that the electrical machinery sector has the potentialto create 11%-12% of the industrial land demand in the corridor districts (considering BAU &BIS scenariosrespectively). Machinery sector has the potential to create 8%-16% of the industrial land demand in the corridordistricts (considering BAU &BIS scenarios respectively).
4.4.9.2 Key growth drivers for the sectorThe key drivers of demand for the electrical machinery and machinery sectors are as highlighted below:
Growing power sector in India, including shift towards setting up higher efficiencysupercritical power plants in India
Capacity addition plans of Government for Indian power sector is the key growth driver for the sector. Totalinstalled capacity as on June 2013, including renewable energy sources of the country is 226 GW. By the end of12th and 13th Five Year Plans it is envisaged to add 89 GW and 94 GW of installed capacities respectively.
Mandatory standards were recently stipulated by BEE for Distribution Transformers unto 200 kVA, whichfuelled the growth of the sub segment along with massive capacity additions in power transmission anddistribution sector.
71Annual Survey of Industries72International Trade Center73Annual Survey of Industries74International Trade Center75 DHI, Average of DHI projections for separate segments76 Dun& Bradstreet, Crisil research - for separate sub-segments

Final Report – Comprehensive Regional PlanPwC/ Nippon Koei 130
Massive capacity additions along with necessary replacement of ageing (20-25 years) equipment and shifttowards setting up higher efficiency supercritical power plants have facilitated growth of the electricalmachinery and machinery sectors.
Accelerated infrastructure expansion and growing urbanization in India
The Indian Government's investment in infrastructure projects is a major factor driving the growth of theelectrical machinery market in India. During the 11th Five Year Plan (2007-2012) investment on infrastructureprojects amounted to US$436 billion. The Indian Planning Commission has estimated a total investment ofmore than US$1 trillion for infrastructure projects during the 12th Five Year Plan (2012-2017). The variousinfrastructure projects undertaken by the government such as road and railway construction, mining, irrigation,urban infrastructure, and real estate development require extensive use of electrical machinery.
Machinery sector growth is driven by massive construction activities and infrastructure development (roadsand urban infra, housing and office space sector) as well as expansion of operations of such major end-consumers of material handling equipment as ports, wholesale and retail sectors, warehousing, and industrieslike heavy engineering, construction equipment, cement etc.
Planned investment in infrastructure (more than US$1 trillion) and growing urbanization will drive theconstruction industry to grow at 16–17% CAGR over the next 10 years; hence development of mining,construction and quarrying machinery segment is on high trajectory.
Growing Telecom Industry
The growing telecom industry in India is the second largest telecommunications market in the world, closelyfollowing China, which is the largest in the world. In 2013, around 500,000 telecom towers were installed in thecountry. Internet traffic is expected to touch around 2.8 Exabyte's per month in 2018. The increasingpenetration of telecommunications technology in the rural areas and the advent of 3G and 4G facility, hasspurred the growth of the Telecom industry in India. This steady growth rate has increased the demand forelectrical equipment such as cables and generators. For instance, generators are installed in towers to run theradio frequency transceivers. Electrical equipment is also used in the generation and transmission of signals.Thus, the increasing growth of the Telecom industry increases the market potential for the ElectricalEquipment market in India.
Farm mechanization
Drivers in increased farm mechanization include availability of credit (direct institutional credit for agriculturehas grown from USD 32 billion in 2006 to USD 80 billion in 2012); Labour shortage due to migration of agrilabour to urban areas for industrial jobs; Government support in the form of subsidies to promote farmmechanization; Decline in availability of animal power (commercial banks reluctant to extend loans forbullocks) have driven increase in farm mechanization. This trend facilitated has driven demand for agriculturemachinery segment, one of the largest segments of special machinery sector.
Increasing FDI in electrical machinery and machinery sectors
The Government of India has allowed a 100% FDI in the electrical machinery and machinery sectors. The FDIin the electrical machinery sector has grown at a CAGR of 14% from 2010 to 2013. In 2013, the FDI in ElectricalEquipment industry amounted to USD 3.20 billion compared to USD 3.08 billion in 2012. Thus, the increasinginvestment from foreign players has led to the growth of the electrical machinery market in India.
Machinery sector has registered 33% CAGR in FDI between 2010 and 2013. FDI of USD 4.6 billion (or 2.3% oftotal FDI in the country) was attracted into machinery sector in 2013, which led to the growth of machinerymarket in India as well.

Final Report – Comprehensive Regional PlanPwC/ Nippon Koei 131
4.4.9.3 Key nodes for electrical machinery and machineryinvestment in the corridor
ELECTRICAL MACHINERY
The districts in Tamil Nadu within the CBIC influence zone account for 97% of all the investmentsin the state in the electrical machinery sector. Key investing companies in the corridor districts withinTamil Nadu include Base Corporation Ltd., Exide Industries Ltd., Easun Reyrolle Ltd., Alstom T & D India Ltd.,BSH Household Appliances Mfg. Pvt. Ltd., OBO Bettermann India Pvt. Ltd., Venture Lighting India Ltd., AmcoBatteries Ltd., SMC Pneumatics (India) Pvt. Ltd., Matsushita Electric Indl. Co. Ltd., etc.
The districts of Karnataka within the CBIC influence zone account for 90% of all the investment inthe state. Key investing companies in the corridor districts within Karnataka include Alstom T & D India Ltd.,TE Connectivity India Pvt. Ltd., Stove Kraft Pvt. Ltd., Easun Reyrolle Ltd., ABB India Ltd., BPL Ltd., AEGPower Solutions (India) Pvt. Ltd., AO Smith India Water Heating Pvt. Ltd., BS Refrigerators Ltd.
The districts of Andhra Pradesh within the CBIC influence zone account for 79% of all theinvestment in the state. Key investing companies in the corridor districts within Andhra Pradesh includeAmara Raja Batteries Ltd., Regen Powertech Pvt. Ltd., WS Industries (India) Ltd., G R Cables Ltd.,Bhagyanagar India Ltd., Bhagyanagar India Ltd., Vijai Electricals Ltd.
Bengaluru urban is an established center of electrical machinery with investment present acrossmultiple sub-sectors of the sector, predominantly in domestic appliances and generators,transformers and switchgears. Its share in the total investments in the corridor at variousstages is 21%.
Kancheepuram emerges as a leading district in electrical machinery among corridor districts in Tamil Nadu.Its share in the total investments among corridor’s districts is 20%.
Chittoor has emerged as a center of batteries and accumulators manufacturing with indigenous manufacturer– Amara Raja. On account of reinvestment activities the district commands 16% share in the investments in thesector among districts in the influence zone of the corridor.
Krishnagiri is another prominent center of electrical machinery manufacturing with 14-16%% of totalinvestments in the CBIC districts. Hosur is the largest hub of electrical machinery manufacturing activities thedistrict.
MACHINERY
The districts in Tamil Nadu within the CBIC influence zone account for 76% of all the investmentsin the state. Key investing companies in the corridor districts within Tamil Nadu include BGR Turbines Co.Pvt. Ltd., BGR Boilers Pvt. Ltd., Caterpillar India Pvt. Ltd., Bharat Heavy Electricals Ltd., Toshiba JSW PowerSystems Private Ltd., Winwind Power Energy Pvt. Ltd., Ashok Leyland John Deere Construction Equipment Co.Pvt. Ltd., Mitsubishi Heavy Industries India Precision Tools Ltd., etc.
The districts of Karnataka within the CBIC influence zone account for 62% of all the investment inthe state. Key investors include Suzlon Energy Ltd., YG Cutting Tools Corpn. Pvt. Ltd., Triveni Turbine Ltd.,Tata Hitachi Construction Machinery Co. Ltd., Leeboy India Construction Equipment Pvt. Ltd., KirloskarToyota Textile Machinery Pvt. Ltd. etc.
The districts of Andhra Pradesh within the CBIC influence zone account for 76% of all theinvestment in the state. 97% of investments are in Chittoor district on account of Mannavaram GreenfieldPower Equipment Manufacturing Facility by NTPC BHEL Power Projects Pvt. Ltd. which is currently underimplementation. Other key investors include Mahindra & Mahindra Ltd., Ramky Enviro Engineers Ltd., MMD(India) Pvt. Ltd., Paschal Formwork (India) Pvt. Ltd., Sujana Universal Inds. Ltd., Kobelco ConstructionEquipment India Pvt. Ltd., Kobelco Cranes Co. Ltd., Sujana Universal Inds. Ltd. etc.

Final Report – Comprehensive Regional PlanPwC/ Nippon Koei 132
Kancheepuram is an established hub in machinery manufacturing among corridor districts in Tamil Naduwith 29% share in total investments in machinery sector among corridor districts. Chittoor is another hubwith 28% share mostly on account of Mannavaram project. Other important centers of machinery investmentsinclude Chennai (17%), Tiruvallur (9%) and Bangalore rural (7%).
4.4.9.4 Key interventions required and strategy for developingelectrical machinery and machinery sectors along CBIC
Based on the proposed framework for industrial development strategy for CBIC, we propose certain keyinterventions/recommendations for the Government to develop the machinery and electrical machinery sectorsalong the identified districts in the corridor. These recommendations have been segregated as economicenhancers, administrative enhancers and value enhancers.
4.4.9.4.1 Economic enhancers
For the shortlisted districts along the corridor, we have summarized the existing status and challenges in thesedistricts:

Final Report – Comprehensive Regional PlanPwC/ Nippon Koei 133
Table 4.4.18 Existing status, challenges and interventions required to increase investment in corridor – Machinery and Electrical Machinery
District Existing status and current asset profile Demand factors Key shortcomings
Kancheepuram Excellent road (NH-4 via Sriperumbudur andKancheepuram and NH-32 through the entire district)
Very good rail connectivity within district andhinterland
Excellent seaport connectivity, with proximity toChennai and Ennore sea ports
Availability of educational institutions at Chennai andsuburbs with IIT Madras and the Anna University
Kancheepuram is one of the largestindustrial areas of Tamil Nadu withnumber of manufacturing industries
Diversified manufacturing makes it agood market for electrical machineryand machinery sectors
Inadequate quality of power(power cuts and fluctuation)
Mismatch of technologybetween the existing microplayers and MNCs which arecoming in the district; thisleads to lack of marketsupport from big players
Chittoor Excellent road connectivity (NH-40 (to Chennai), NH-42, NH-69, NH-71, NH-716 (to Chennai)
Excellent rail connectivity in parallel with NH network(except NH-69)
Some availability of educational institutions (18engineering colleges) and proximity to Bengaluru,which has access to skilled resources
Established dealership network withinthe state and around the country
Proximity to end-use industry cluster ofauto & auto components to ensuredemand for batteries and accumulators
Narrow market base
Chennai Excellent road and rail connectivity within district andhinterland
Excellent seaport connectivity, with proximity toChennai and Ennore sea ports
Good availability of educational institutions - Around240 engineering colleges, 19 universities, IIT Madras
Presence of ancillary units and largeunits that helps leveraging this synergyboth by large companies and MSMEs
Construction activities create demandfor products of multiple sub-sectors ofelectrical machinery and machinerysectors
Poor supply of electricity andhigh rate of electricity charges
Congested ports
Bengaluruurban
NH-4, NH-7 & NH-209 goes through district andconnect to other parts of Karnataka and other States
Chennai Port is situated at a distance of 315 Km Good availability of skilled manpower
Presence of ancillary units and largeunits that helps leveraging this synergyboth by large companies and MSMEs
Construction activities create demandfor products of multiple sub-sectors ofelectrical machinery and machinerysectors
Presence of large number of engineeringunits creates demand for machineryequipment
Issues related to quality of theraw material specifically withthe consistency or rather thelack of it (More than one thirdof MSME units work withmaterial supplied by the buyeror directly by a supplierpicked by the buyer)
Need to establish feedback forthe supplied products fromend-users to MSMEs throughdealers network
BengaluruRural
NH-4 and NH-48 goes through district and connect toother parts of Karnataka and other States.
Availability of well developed rail network – a totalrailway route of 204.39 km
Mangalore Port is situated at a distance of 320 km
Krishnagiri Excellent road connectivity (NH-7, NH-42, NH-48, Krishnagiri hosts one of the largest Inconsistency in availability of

Final Report – Comprehensive Regional PlanPwC/ Nippon Koei 134
District Existing status and current asset profile Demand factors Key shortcomings
NH-66) in central, northern and eastern parts of thestate
Good rail connectivity (eastern and central areas ofthe state)
industrial complexes in the country –Hosur – with a very diversifiedmanufacturing base
Large number of small engineeringcompanies is present – bases for goodsymbiosis between large plants andancillary units
quality raw material and itshigh price fluctuation
Lack of testing centres High dependence on traders
by majority of MSME units
Tiruvallur Excellent road (NH-5 via Gummidipoondi and NH-205 via Ambattur and Tiruvallur)
Rail connectivity within district and hinterland isavailable predominantly in southern and coastal partsof the district
Excellent seaport connectivity, with proximity toChennai and Ennore sea ports
Presence of electrical and otherengineering units in Kakkalur nearTiruvallur town and in Gummidipoondiand Villivakkam Block in AmbatturIndustrial Estate
Power crisis (power cuts andhigh electricity charges)
Transportation bottlenecks
Lack of proper infrastructureand other physicalcommunication facilities
Source: District profiles, Industry reports, PwC analysis
Some shortcomings are universal for the sector at national as well as district level. They are summarised along withrecommendations to the GoI for addressing these issues:
Table 4.4.19: Current status, shortcomings and recommendations – Machinery and Electrical Machinery
IssueSub-sectors for which issue is
criticalStatus in India/Corridor Recommendations
Availability ofCritical RawMaterials
Electric motors, generators,transformers and electricitydistribution and control apparatus
Engines and turbines
Constrained availability of certain critical raw materials suchas Cold Rolled Grain Oriented (CRGO)/ Cold Rolled Non-Grain Oriented (CRNGO) Steel, Amorphous Steel etc. andvolatility in raw material prices is hurting domestic industry
Electrical industry is largely dependent on imported CRGO/CRNGO electrical grade steel due to very limitedmanufacturing capacities within India. CRGO and Boilerquality plates are presently imported by domesticmanufactures from very few suppliers worldwide (only 14mills are operating worldwide). Out of 14 only 3 mills are BIScertified; currently it is mandatory to obtain BIS certificationfor all the suppliers. Any delay in the registration of foreignsuppliers with BIS leads to supply constraints to domesticindustry
Short term measures: Ensure secure supplies
of critical raw materialin the short run
BIS certificationsguidelines to bemodified to avoiddelays in registration offoreign suppliers
Long term measures: In the long run
promote and ensuresetting up unitsmanufacturing CRGOand CRNGO electricalsteel in the country to

Final Report – Comprehensive Regional PlanPwC/ Nippon Koei 135
IssueSub-sectors for which issue is
criticalStatus in India/Corridor Recommendations
remove dependency onraw material imports
Rail and roadconnectivity
All sub-sectors manufacturing heavymachinery: Electric motors, generators,
transformers Engines and turbines, Fluid power equipment Ovens, furnaces and furnace burners Lifting and handling equipment Agricultural and forestry machinery Metal-forming machinery Machinery for metallurgy Machinery for mining, quarrying
and construction
Rail connectivity is stated as necessary by heavy machinerymanufacturers in order to transport over dimensionalconsignments (ODC) and over dimensional components toassembly units. Availability of rail sidings as a last mileconnectivity to the main rail network is also essential
Problems in transporting heavy and ODC >98 MT on NHAIbridges. As per procedure, various zonal railways involved giveclearance for the movement of such ODCs.77
Increase rail networkconnectivity asnecessary requirementto transport ODCcargoes
Address issues ofmoving the ODC byNHAI
Proximity toport
Sub-sectors dependent on supplies ofraw material (electrical steel)
All three states are having access to the sea and havedeveloped ports infrastructureManufacturing clusters of Kancheepuram, Chennai andTiruvallur are in advanced position in terms of portconnectivity, whereas Bangalore urban/rural, Chittoor andKrishnagiri are landlocked districts The long term vision of theGovernment of India is to increase exports of electricalmachinery and other machinery segments. Hence availabilityof port infrastructure is essential FoP for the sector
The segments dependent on electrical steel require proximityto ports as their raw material is imported
Create dedicatedcorridors connectingland-locked districtswith existing ports toenhance theirattractiveness for theunits dependent onimported raw material
It is also important topromote the vision ofthe GoI to boostcountry’s share inelectrical machineryexports
Uninterruptedpower supply
All sub-sectors Power shortages are prevalent in many of the Indian states,including states within the corridor. Electricity rates areanother point of concern of various stakeholders.
Resolving powershortages issuerequires immediateintervention givenunanimity of thestakeholders onprevailing issues withpower supply
77 Report of the Working Group on Capital Goods & Engineering Sector for the 12thFive Year Plan (2012-2017), DHI

Final Report – Comprehensive Regional PlanPwC/ Nippon Koei 136
IssueSub-sectors for which issue is
criticalStatus in India/Corridor Recommendations
Availability ofindigenoustestingfacilities
Electric motors, generators,transformers and electricitydistribution and control apparatusEngines, turbines and relatedequipment
The electrical equipment testing facilities available in India arequite inadequate. Vendors have to send their equipment toforeign countries for testing which is time-consuming andexpensive.
The process results in increased prices and directly affects theend-users. Moreover, the local players do not have enoughcapital to set up testing facilities as the investment required ishuge.
Facilitate setting up ofindigenous testing andcalibrating facility forequipment testing

Final Report – Comprehensive Regional PlanPwC/ Nippon Koei 137
4.4.9.4.2 Administrative enhancers
We recommend that the Governments of these states should propose dedicated policy interventions for thesectors, which may increase the attractiveness of the sectors along the corridor. The policy measures shouldascertain that while quality of raw material and end-user product is not compromised, the ease of doingbusiness is ensured.
We propose the following aspects to be addressed through appropriate administrative enhancers:
Table 4.4.20: Current shortcomings and key interventions at administrative level – Machinery andElectrical Machinery
Current shortcomings Key interventions required
Duty structure: Inverted duty structure inFTAs and other economic parametersfavours imports as preferred source ofsupply and leaves domestic players inunfavourable position
Unregulated imports of second handequipment (heavy machinery segment):though it helps reducing project cost inthe short run, it negatively impacts endusers and discourages indigenousequipment manufacturers
Substitute Imports:− Calibration of duties and taxes on imported
equipment is required to remove disadvantagefor domestic players
− Address adverse tax structure for localmanufacturers in India
− Imports of second hand machinery should beregulated
Impediment to new technologies: Issueswith absorption of new technology bydomestic manufacturers and end-userindustries:− Need for improvement in design of
procurement process and policies ofcentral and state utilities (bundling ofprojects by utilities leads to sub-optimal capacity utilization)
Develop standard procurement policies andproduct specifications
− Initiate adoption of new procurementmechanisms by utilities that do not discouragetechnology development (currently selectionbased on L1 criterion
− Propose creation of dedicated funds for R&D inthe sector.
Quality issues: Absence of standardprocurement policies and not clearlydefined product specifications, lack ofstandardization of product specifications,design parameters and ratings leads toapproval of goods of inadequate quality
Introduction quality control mechanisms andcertification systems in the sector
− Facilitate setting up a quality control system andallied mechanisms to ensure product qualitycontrol (supplies from vendors and end-products)
− Certification facilities for imported raw materialare to be improved
Government delays in project approvals− The Government of India often takes
time in approving infrastructureprojects which results in a delay ofproducts and services reaching theconsumers. The delays are in termsof forest clearance, land acquisitionapproval, process approval, andfinancing.
Rationalize government approval to reduceproject delays
− Forest clearance, land acquisition approval,process approval, and financing are to berationalized to remove delays in execution ofprojects that provide large orders for electricalmachinery and machinery manufacturers
Accessibility of technology to the sectorplayers (predominantly MSMEs)
Facilitate support infrastructure development, likecommon facility centers, product developmentcenters
Popularize national level programmes formodernization of end-user industries (textiles, autoand public transport, power sector)
Availability of loan facilities (to MSMEs) Address issue of financing availability for MSMEs

Final Report – Comprehensive Regional PlanPwC/ Nippon Koei 138
Current shortcomings Key interventions required
MSMEs are often face reluctance frombankers to finance their projects as wellas usually constrained by high cost ofcapital
Exports of electrical machinery andmachinery require special attention:
− India‘s share in global export ofelectrical equipment is around 0.7%and machinery – 0.5%.
− The export promotion schemes of thegovernment are not easily availablefor project exports
− Lack of competitive long term exportfinancing options
Export promotion policies related to− export financing− taxation− marketing etc
would immensely help the Indian exporters competebetter in global trade
Source: Industry reports, PwC analysis
4.4.9.4.3 Value enhancers
The electrical machinery and machinery sector is highly diversified. Though the country highly depends onimports of electrical machinery and machinery, the past decade witnessed entrance of large internationalplayers that set up facilities in India in a form of JVs with domestic manufacturers. At present, sufficientindigenous capacities got created to produce the required equipment domestically (barring supercriticaltechnologies and several highly specialised equipments).
In spite of high diversity, the sectors still focuses on being equipment or component suppliers and have notgraduated to offering complete solutions. This may become a sector evolutionary step to provide integratedsolutions and integrate value chain. Having recognized that the sector is lagging behind in terms of valueaddition, Twelfth Five Year Plan recommends to national and state governments mandating minimum 30%local value addition for capital goods78.
Availability of skilled workforce and operational capacity building is another set of issues faced by both largeplayers and MSMEs in these sectors. Electrical machinery sector alone is forecast to require more than 5 millionof direct manpower and another 10 million of indirect manpower by 2022.79
Table 4.4.21: Current shortcomings & key interventions – Value enhancers – Machinery & ElectricalMachinery
Current shortcomings Key interventions required
No significant investment in technologydevelopment through R&D on accountof:− Lack of academic / R&D support
institutions to undertake R&D− High cost of R&D especially in
modern technology machine tools.
Support/incentives to be provided to themanufacturing units in setting of R&D facilities
Skills erosion across electricalmachinery and machinery sectors onaccount of IT development and otheremployment avenues.
Specialised courses are to be introduced acrossvarious streams of electrical machinery andmachinery sub-sectors to create employablepersonnel
Facilitate setting up sector specific ITIs/Vocationaltraining centres, capacity building centers andcommon training facilities
Roll out programs for formal education andoperational capacity building in MSME
78
79 Indian Electrical Equipment Industry Mission Plan 2012-22, MHI
Final Report – Comprehensive Regional PlanPwC/ Nippon Koei 139
Current shortcomings Key interventions required
Automation equipment to improveproductivity, reduce wastage andimprove quality levels is not available inthe country
In the short run – for the time bound periodfacilitate reduction of import duty on automationequipment
Develop a roadmap for setting up facilities formanufacturing of required equipment indigenously
Low value addition - Technology profileof domestic products is from basic tointermediate.
Incentivize/mandate foreign players to increasevalue addition in India under technology transferagreements
Amend FDI policy to facilitate technology transferby giving preference to joint ventures with Indianfirms, not 100% foreign owned companies
Source: Industry reports, PwC analysis
4.4.9.5 Recommendations summary
The electrical machinery and machinery sectors are primarily driven by domestic demand. The economy sizeand high growth trajectory, focus on power sector development, rapid industrialization and infrastructuredevelopments have facilitated creation of indigenous capacities to cater to domestic demand. At present,manufacturing facilities for almost all important sub-sectors have been established in the country. Thefollowing measures should be undertaken to support the development of electrical machinery and machinerysectors to primarily cater to domestic market and in the long run to develop significant export capacities:
In the short run:
Secure raw material availability for the sector by establishing seamless certification procedures forimported electrical steel to avoid interruptions on account of non-certified products.
Certain protectionist measures may have to be adopted to support indigenous manufacturers, likeputting restrictions on second hand equipment, mandating foreign partners to foster technologytransfers along with setting up manufacturing facilities, etc.
Promote technologies upgradation, new technology introduction and accordingly modify the existingprocurement policies by PSUs/utilities to facilitate technology absorption by electrical machinery andmachinery manufacturers.
Develop testing facilities, quality control systems and certification mechanisms to help enhancing valueof the manufacturing output in these sectors.
In the long run:
Facilitate establishment of indigenous raw material production capacities (electrical steel) Bridge skill gap and provide skill development support:
− Establishment of linkages between industry and academia – active involvement of public and
private participation
Introduce measures to ensure that all sub-sectors of electrical machinery and machinery move up thevalue chain and evolution from component or equipment manufacturing to provide complete industrysolutions.
Focus on gradual transition from import dependent to export oriented electrical machinery andmachinery sectors:
− Promote exports by facilitating dedicated line of credit
− Introduce programs to promote indigenous brands to the global market by identifying target
markets and developing country-specific export strategies.

Final Report – Comprehensive Regional PlanPwC/ Nippon Koei 140
4.4.10 IT and financial
4.4.10.1 Definition of the sectorUnder the condition of volatile economic environment in 2012, global IT sector has recorded a steady turnoverof USD 1.9 trillion and registered 4.8% growth against 2011. BPO/BPM services grew at the rate of 4.9%(slightly above industry average) and contributed majorly to the sector performance. This segment was followedby IT services and packaged software segments each with 3.3%growth.
IT services, BPO/BPM services and software products continued to lead, accounting for over USD 1 trillion –58%of the total IT spend.
A.T. Kearney’s ‘Global Services Location Index’ positions India as the leading destination of service industry inthe world. As this index shows, India takes an outstanding position in among global peers competition. Themajor success drivers include financial (c0st) competitiveness and highly skilled English-speaking workforce.
Table 4.4.22: Top 10 countries of Service industry index
Source: A.T. Kearney Global Services Location Index
India’s IT sector (including hardware) is estimated to have generated USD 108 billion in revenue during 2013compared to USD 101 billion in 2012, implying a growth rate of 7.4 per cent80 The IT sector (excludinghardware) generated USD 95.1 billion in revenues in 2013.As the exhibit below shows, market size of IT sectorin India has been steadily growing. Compared to the domestic market, share of export market has sizeablyincreased. The contribution of the IT sector to India’s GDP rose to approximately 8% in 2013.
Figure4.4.8: Market size of IT industry in India (USD billion)
Source: IBEF
80 IBEF
Rank CountryFinancial
PerformancePeople Skills and
availabilityBusiness
EnvironmentTotal Score
1 India 3.11 2.76 1.14 7.012 China 2.62 2.55 1.31 6.483 Malaysia 2.78 1.38 1.83 5.994 Egypt 3.10 1.36 1.35 5.815 Indonesia 3.24 1.53 1.01 5.786 Mexico 2.68 1.60 1.44 5.727 Thailand 3.05 1.38 1.29 5.728 Vietnam 3.27 1.19 1.24 5.709 Philippines 3.18 1.31 1.16 5.65
10 Chile 2.44 1.27 1.82 5.53
0
20
40
60
80
100
120
FY2008 FY2009 FY2010 FY2011 FY2012 FY2013e
Export Domestic

Final Report – Comprehensive Regional PlanPwC/ Nippon Koei 141
During 2013 total exports from the IT sector (excluding hardware) have been estimated at USD 76 billion; theindustry have grown at a CAGR of 13.1% between 2008 and 2013 despite downward trend in global economicgrowth scenario. Export of IT services has been the major contributor, accounting for 57.9% of total IT exports(excluding hardware). BPM, the second largest segment, accounted for 23.5% of total IT exports during 2013.
Figure4.4.9: Export revenue of Indian IT sector - (USD billion)
Source: IBEF
IT services and Business process management (IT-BPM) is the largest segment of the IT sector in India and isthe leader both in domestic and export markets. It accounted to 81% of the total market size in 2013 and over80% of exports from the sector in the same year.
Around 85% of total IT-BPM exports from India are across four sectors: BFSI, telecom, manufacturing andretail. BFSI is a key business vertical for the IT-BPM industry. It generated export revenue of around USD 31billion during 2013, accounting for 41% of total IT-BPM exports from India.
Figure4.4.10: Export revenue across IT-BPM segments. %, 2013
Source: IBEF
0
10
20
30
40
50
60
70
80
FY2008 FY2009 FY2010 FY2011 FY2012 FY2013e
Software products and engg. services
BPM/BPO
IT Services
41%
18%
16%
10%
5%
3% 3%
4%
BFSI Travel and tourism Manufacturing Retail
Healthcare Telecom and media Construction and utilites Others
CAGR - 13.1%

Final Report – Comprehensive Regional PlanPwC/ Nippon Koei 142
Disruptive technologies, such as cloud computing, social media and data analytics, are offering new avenues ofgrowth across verticals for IT companies. Gaming and animation is among the fastest growing segments, drivenby raise in disposal income of population and rapid technological changes.
4.4.10.2 Key growth drivers for the sectorThe key drivers of demand for the IT sector are as highlighted below:
Growing global demand
Globally offshore expenditures for IT sector have grown at CAGR of 8% between 2011 and 2013. Global BPMspending was estimated to expand at a CAGR of around 7% during 2011–13.81
Domestic growth
Computer penetration in India is steadily growing and is expected to continue to increase. Government ITexpenditures are also growing and it is expected to be a major contributor to domestic demand by 2013–14.
Talent pool
Frequently referred as one of the youngest nations in the world, India undoubtedly holds the leading position inavailability of young, highly qualified workforce with required technical skills and the English languageproficiency. About 4.7 million graduates are estimated to have been added to India’s talent pool in 2013.
Infrastructure
Robust IT infrastructure across various cities in India such as Bengaluru (Karnataka is termed as the‘Knowledge Capital of India’. The state houses 550,000 IT professionals which is about 1/3rd of the total ITprofessionals in the country. Delivery centres of Indian IT companies are spread across various countries.
Policy support
Tax holidays have been extended for IT sector (Software Technology Parks of India (STPI) and SEZs)
Government ensured procedural ease and single window clearance for setting up facilities (for example, SEZscheme since 2005 benefits IT companies with single window approval mechanism, tax benefits, etc.)
4.4.10.3 Key nodes for IT sector investment in the corridorHaving accessed the sector presence in the districts of the corridor, it is evident that there are two majorclusters where IT sector is concentrated – Bengaluru and Chennai. 74% of investments (completed and ongoingprojects) in IT sector in the corridor’s districts are in Karnataka and concentrated in Bengaluru urban andBengaluru rural districts.82
Tamil Nadu is another important destination for investments in IT services sector with 26% share in IT sectorprojects (completed and at various implementation stages). The city of Chennai, Chennai district andKancheepuram are the places that host the largest number of IT sector project among the districts under CBICcorridor in Tamil Nadu.
Chennai ranks 4thin the highest number of employees in India’s IT & ITES sector. It is the 4th in highest numberof higher education institutes. Chennai has the largest resource pool in the form of graduating students suitablefor this sector. Since 2000, old Mahapalipuram road (OMR) is also known as the IT corridor of Chennai. Till2006, IT development in this micro market was mainly driven by government nodal agencies – TIDCO, ELCOTand SIPCOT. However, post 2006 major private players including RMZ, Shapoorji & Pallonji, Tata Realty andothers have developed IT parks along this road.
81 IBEF82 Capex database

Final Report – Comprehensive Regional PlanPwC/ Nippon Koei 143
Examples of key industrial parks include Electronics city, ITPL (International Technology Park), STPIs(Software Technology Parks established under STPI scheme). . These parks are located in suburban areas withdistance of around 20 km away from the city center. These industrial parks are equipped with high qualityinfrastructure and secure better accessibility from airport /city center, thereby attracting both domestic andforeign investments.
As these examples show, basically IT/financial industry is located and clustered in the suburban area of Tier Icities. However, STPI scheme promotes Tier II and III cities as well. In this region, two cities – Bengaluru andChennai has large scale of IT/financial industry.
Focus can be given to the Bengaluru city area, but Bengaluru urban area might be recommended as well sinceBengaluru urban area is suffering from lack of available land. Considering Karnataka governments emphasis oncreation of ICT center beyond Bengaluru urban areas, we can see the area of Bengaluru rural area as a potentialarea for sector expansion.
Another prominent focus center can be Chennai district as it has all necessary infrastructure established in thisarea as well as it is one of the prominent centers of IT sector in the country.
Other than the scenario above, we can also consider scenario to grow up industry in rural areas. IT/financialsector is strongly absorbing employment in this region. Although currently IT/financial sector city is centeredin major Tier-I cities, it is also possible that the cluster will spread to tier-II/III cities and further to rural areas.Spreading the industrial cluster beyond the outreach of tier-I city has benefits in terms of economics andcompetitiveness – as described already, rising wages is key issue of IT/financial sector in India. Thereforethrough the spread of cluster to rural area, cost could be reduced and the industry can get competitivenesscompared to other countries.
4.4.10.4 Key interventions required and strategy for developingIT/Financial sector along CBIC
Based on the proposed framework for industrial development strategy for CBIC, we propose certain keyinterventions/recommendations for the Government to develop the IT/Financial sector along the identifieddistricts in the corridor. These recommendations have been segregated as economic enhancers, administrativeenhancers and value enhancers.
4.4.10.4.1 Economic enhancers
IT sector requires good quality electricity and telecommunication infrastructure. Focused approach to creationof these infrastructure components will help improving investment climate for IT service companies.
The sector is highly sensitive to the availability of high quality social infrastructure and residential facilities as itprimarily employs highly qualified workforce.
For the shortlisted districts along the corridor, we have summarized the key interventions required by GoIalong with the existing status and challenges in these districts:
Table 4.4.23: Existing status, challenges and interventions required to increase investment in corridor –IT and Financial services
DistrictExisting status
and current assetprofile
Demand factorsKey
shortcomings
Keyinterventions
required
Key sub-segments thatmay emerge
Bengaluruurban andBengalururural
Existing IT/BPOparks aroundBengaluru, locatedat ~20 km for thecity
Availability of
Increase of globalexpenditure for ITand allied sectorsGrowing domesticdemand,increased
Lack of land fornew industrialpark
Lack of qualityinfrastructureInsufficient R&D
Improvementofinfrastructureof existingIT/BPO parks
Provisioning
IT servicesBPM (BFSI,telecom andmanufacturing)Emergingverticals in

Final Report – Comprehensive Regional PlanPwC/ Nippon Koei 144
DistrictExisting status
and current assetprofile
Demand factorsKey
shortcomings
Keyinterventions
required
Key sub-segments thatmay emerge
existing power andtelecommunicationinfrastructure
Availability ofskilled resources
governmentexpenditure forIT-enabledsolutions
Digitalisation ofmanufacturingsectors and endproducts
Growth of ITorientedindustries – e.g.gaming andanimation
facilities Availability of
skilled workforcein future
Future shortfallof skilledworkforce
foruninterruptedpower supplyandimprovementoftelecommunicationinfrastructure
BPM (such aseducation,healthcare andretail)
Chennai
High concentrationof IT parks aroundChennai city (ITcorridor ofChennai)
Availability ofexisting power andtelecommunicationinfrastructure
Availability ofhighly skilledresources
Source: District profiles, Industry reports, PwC analysis
4.4.10.4.2 Administrative enhancers
The corridor states of Karnataka, Tamil Nadu have specific policies dedicated to the IT and financial sector.
The state of Karnataka has a clear vision of IT/financial sector. On the other hand, Tamil Nadu state ceased toupdate its IT policy after 2008 and there is no updated version of dedicated vision for IT sector. The IT policy ofAndhra Pradesh for the period from 2010-2015 was issued in 2010.
We recommend that Tamil Nadu and Andhra Pradesh will create a dedicated policy for the sector, which mayincrease the attractiveness of the sector along the corridor. We propose the following aspects to be addressedthrough a dedicated policy for this sector:
4.4.10.4.3 Value enhancers
Skill development:
The IT and Financial sector in Karnataka is expected to generate an incremental demand of 2,000,000 peoplein 202083. Karnataka is likely to face a supply gap of 1.9 million people, which also includes around 20-30% ofthe unemployable workforce joining from educational institutions84. Key districts identified as potential IT and
83Source: National Skill Development Corporation publication on skill gap in Karnataka, 201284Source: National Skill Development Corporation publication on skill gap in Karnataka, 2012
Continued emphasis on IT/BPO (BFSI) segment
Build up capability for job creation
Promote innovation and R&D and create fund for innovation
Enhance telecommunication network with other countries
Promote focused marketing
Brand IT/financial business of this region so that this region can be an investment destination

Final Report – Comprehensive Regional PlanPwC/ Nippon Koei 145
Financial services nodes within the corridor including Bengaluru urban, Bengaluru rural have shown deficit inthe availability of labour by 202085.
District name Labour availability scenario in 2022
Bengaluru Urban DeficitBengaluru Rural Deficit
Source: National Skill Development Corporation publication on skill gap
The IT landscape will be completely transformed by 2020 on the demand side. This will call for transformationof business models, infrastructure and talent on the supply side. New opportunities will appear, calling fortalent development.
According to estimates, the IT sector will create employment opportunities for 28 million (30 million accordingto another estimate by NASSCOM) by 2020. In order to fill this gap, government of Karnataka is proposingfollowing measure to fill the gaps.
Create sustainable talent pool to cater to the demand of 150,000 direct, high quality jobs in this sector.
Create a pipeline of 1,000 master trainers for faculty development
Develop a common assessment program for IT/ ESDM Academies
Setup infrastructure for biometric profiling of IT professionals
4.4.10.5 Recommendations summaryThe following components are essential for maintaining the competitive edge of the sector:
Focused approach to the existing IT infrastructure facilities that required improvement and expansion. It isimportant to strengthen the existing telecommunication infrastructure and concentrate on improvement ofR&D base for the sector along with creation/augmentation of R&D infrastructure in the field of IT.
From infrastructure aspect, the basic infrastructure of developed facilities with stable electricity andinfrastructure should be ensured by the state Governments along the corridor districts. This will work asprimary infrastructure which improves investment climate for IT/financial sector in this region. On top of basicinfrastructure, core hubs for industrial development are required. Industrial parks which can be a centralisedhub for IT/ financial industry should be developed in the corridor. With such accumulation of industries,synergies among related industries and enhancement of incubation function will be facilitated. Governmentmay focus on improvement of basic infrastructure whereas IT related parks may be promoted for developmenton PPP basis.
It would be essential to further ensure flexibility in policy to support and adopt new and emerging technologyparadigms in IT sector.
Estimated future skill gap should be bridged by concentrated effort of creation a sustainable pool of skilledworkforce. We also propose to concentrate efforts on promotion of indigenous R&D and product developmentcapabilities.
4.4.11 Auto and auto components
4.4.11.1 Sector PerformanceAuto sector’s basic value chain is simple and quite similar to other sectors - R&D, Procurement and Productionand Sales. Currently R&D is not shifted to India and usually each OEM locates this function to mother countryor R&D center in the global value chain. For sales, of course the function is completed in India.
When we see production value chain, it is a bit complicated. Auto mobile is composed of greater amount ofcomponents and it has characteristics with its layer structure. Usually it is defined with 4 layers – OEM
85Source: National Skill Development Corporation publication on skill gap

Final Report – Comprehensive Regional PlanPwC/ Nippon Koei 146
(assembler)/ Tier 1 /Tier 2/Tier3. OEM assembles main components and Tier 1 supplies main components toOEM including engine/power train/ steering/ transmission/ suspension. Following downstream suppliers (tier2/tier3) provide components to upstream suppliers and their role is usually defined based on each function(pressing/moulding/cutting/founding/forging/plating etc)
Indian OEMs (e.g. Tata/Mahindra/Ashok Leyland/Hindustan motors), all of the functions starting from Tier 3to assembly is basically competed in India (of course there are cases when they import components fromoutside India, but their basic attitude is to use domestic components). On the other hand, foreign OEMs (e.g.Toyota/Nissan/Hyundai/Ford) which are seeing Indian domestic market and export from in India locate partof its function in India.
Figure 4.4.11: Past Trends in production of passenger vehicle production (in million units)
For example, Japanese OEMs locate its tier-1 supplier in India and tier-1 suppliers are supplying componentsfrom the factories adjacent to OEM’s assembly base. On the other hand, tier-2 and tier-3 supplier still have notset up base in India. Most of the cases they are producing components outside India – for example Japan orThailand. The components produced outside India are shipped to tier-1 supplier in India. (Some OEMs arethinking of requesting tier-2 and tier-3 suppliers to set up bases in India)
When we see Indian suppliers, there are various types of suppliers. Types of supplies are different by type ofOEMs since requirement standards are different between Indian local OEM and foreign OEM.
No.1 Foreign Supplier- As the shown below show, currently foreign OEMs are supplied mainly fromforeign OEMs. These supplies are mainly looking at local market, but they are also looking at export ofcomponents from India. (e.g. Yorozu/Kokusan denki)
No.2 Indian Global Supplier-There are well skilled local OEMs existing in the market and they aresupplying components to global OEMs as well as local OEMs. They are also looking at export of componentsfrom India. (e.g. Amtek/Bharat)
No.3 and No.4 Indian local large supplier/ Indian local small supplier – They are not looking atexport market and basically they are supplying components to Indian local OEMs. They are well localised andsometimes quality is not acceptable for global OEMs. Their capacity needs to be enhanced in order to beincluded in the value chain of global OEMs.
Tier 3 Tier 2 Tier 1 OEM
Product basis supplyengine/power train/steering/ transmission/suspension
Function basis supplypressing/molding/cutting/founding/forging/platingetc
Function basis supplypressing/molding/cutting/founding/forging/platingetc
IndianOEM
ForeignOEM
India India India India
India IndiaOutside
IndiaOutside
India
India
OutsideIndia
Productdesign/
R&D
Procurement and Production
India
India
Sales/Aftersales

Final Report – Comprehensive Regional PlanPwC/ Nippon Koei 147
Figure 4.4.12: Past Trends in production of passenger vehicle production (in million units)
As a performance of Indian auto sector, production of Indian Auto mobile industry was growing rapidly in theseseveral years. Number of passenger vehicles grew up rapidly a CAGR 19.5% between FY 09 and FY12, as shownin the graph below. In contrast with the rapid growth up to FY12, growth of production has damped in thesetwo years due to economic down trend. Between FY12 and FY14, CAGR of this period was only 0.5%, whichmeans production growth was stagnant.
Figure 4.4.13 : Past Trends in production of passenger vehicle production (in million units)
Although currently auto industry is experiencing down trend and stagnation, the number of vehicle productionis expected to grow up until 2020. There are various scenarios and growth forecasts, but we can see a stablegrowth CAGR number from 11.5 to 15% in various sources. By following the scenario of ACMA where we see agrowth rate of 13.7% up to 2020, total production volume will reach 6.9 million units, more than double thecurrent number.
Foreignsupplier
Indian globalsupplier
Indian localsmall supplier
Indian locallarge supplier
TargetOEM
F
F&I
I
TargetMarket
F&I
I
-foreign suppliers which supplycomponents to foreign OEM factories inIndia-Components might be exported to outsideIndia
-Indian suppliers which supply componentsboth foreign OEM / domestic OEM in India-Components might be exported to outsideIndia
-Indian suppliers which supply componentsmainly to Indian OEMs-Technology level needs to be improved to
-Indian suppliers which supply componentsmainly to Indian OEMs-Technology level needs to be improved tosupply to foreign OEMs
Technologylevel
H
L
1
2
3
4
1.83
2.35
2.983.14 3.23 3.17
FY 09 FY10 FY 11 FY 12 FY 13 FY 14E
Source: SIAM, PwC Analysis
CAGR 19.5%
CAGR o.5%
CAGR11.6%

Final Report – Comprehensive Regional PlanPwC/ Nippon Koei 148
Figure 4.4.14: Past Trends in production of passenger vehicle production (in million units)
The source of production increase can be expected both from expansion of existing factory and investment tonew green field factory. The graph below shows the source of incremental production capacity and we can seethat most of incremental production increase is coming from green field investment. It is expected that newinvestment into factories will support production of automobiles in India
In parallel with completed vehicle industry growth, growth of component industry is also expected. In 2020, ofthe total auto component industry production value, around 40% is expected come from passenger vehicle, 20%from commercial vehicle, and 20% from two wheeler vehicles.
3.614.10
4.67
5.31
6.03
6.86
3.17
3.65
4.20
4.83
5.55
6.39
7.34
3.54
3.95
4.40
4.91
5.47
6.10
FY 14 E FY 15 FY 16 FY 17 FY 18 FY 19 FY 20
ACMA Planning Commision Historic Growth(FY09-FY14)
Planned Capacity6.9 mn units
Source: ACMA, Planning commission, PwC Analysis
Growth Scenario Growth rateConsidered
A- FY09-14(Actual)
11.5%
B- PlanningCommission
15%
C- ACMA 13.7%

Final Report – Comprehensive Regional PlanPwC/ Nippon Koei 149
Figure 4.4.15: Past Trends in production of passenger vehicle production (unit: million units forcompleted vehicles, billion USD for auto components)
India’s auto sector is looking at both domestic market and export market. The figure below shows the trend ofdomestic sales and vehicle export. Domestic sales grew up until FY 12 constantly. However, the number hassuddenly dropped in FY 13 due to down trend of Indian domestic economy.
Export market is moving in a different manner from domestic sales – it is growing up rapidly but the numberand trend is not subject to economic down trend in India. When we compare domestic sales and export sales,export market is experiencing greater growth rate though domestic sales has larger volume compared exportmarket. When we compare the number of domestic sales CAGR (8.5% between FY09 and 14) and export marketCAGR (11% between FY09 and 14) obviously export market is experiencing rapid growth in average. Also, whenthe CAGR of Exhibit 3 (entire market growth – CAGR 11.6% between FY 09 and 14) is compared with exportmarket CAGR the number is almost the same and we can say that the export market has grown up in parallelwith entire market. Although export market volume is subject to demand of entire the world, we can expect thatthe volume will experience continuous growth reflecting continuous growth of demands especially in emergingcounties of Middle East, Africa and Asia.
Figure 4.4.16: Past Trends of domestic vehicle sales and exports (in million units)
When we look at sub segments of auto industry, two sub segments can be identified for growth areas:
4.8
6.9
0.5-
-
1.7
-
Existingcapacity
Brown fieldexpansion
Greenfieldexpansion
Expectedcapacity by FY
19
Source: Annual Reports of automobile manufacturers, PwC Analysis
All vehicles(26)
Aftermarket(4)
Aftermarket(47)
CommercialVehicles
(21)
Two wheelVehicles
(21)
Tractors(4)
Construction(6)
PassengerVehicles(13)
2011 2020
+16%
Unit : 10billion USDSource: AT Kerney
1.55
1.95
2.52.61 2.68
2.33
FY 09 FY10 FY 11 FY 12 FY 13 FY 14E
CAGR 8.5%
0.33
0.45 0.440.51
0.550.60
FY 09 FY10 FY 11 FY 12 FY 13 FY 14E
CAGR 11%
Production estimation of
Completed vehicles up to FY 19Production estimation of
Auto components up to FY 20

Final Report – Comprehensive Regional PlanPwC/ Nippon Koei 150
One area is auto component area. As indicated in exhibit 5, this segment is expected to grow up with CAGR 16%up to 2020 and this rate is above the rate of entire auto sector shown in exhibit 3. If India can experiencegrowth throughout the value chain from parts to OEM that will definitely boost the growth of entire the autoindustry.
Another dimension is type of cars – the exhibit below show share by vehicles and share by companies. One ofthe characteristics of Indian market is that relatively smaller size cars have bigger share in the market. India haspotential to become a global hub for vehicle export of smaller size vehicles. This segment is also expected togrow up rapidly in the future.
Figure 4.4.17 : Type of vehicle and share by manufacturers
Key growth drivers for the sector
CBIC region is expected to grow up as a cluster of auto industry. However, there are competitors across Asia aswell as in India. In order to attract more investment in a longer term, the region needs to achieve future growthand expected to remain its unique position as investment destination
As a whole nation of India, it is expected to achieve continuous growth of auto industry. India’s economicgrowth is believed to continue and industry growth will be sustained with strong backbone of powerful domesticpurchase power. One of characteristics of Indian auto industry is concentration on smaller size (compact)vehicles and through concentration on this segment it is also expected that India can also be a global hub forcompact vehicle production.
In order to survive in the competition and to achieve sustainable growth, CBIC region needs to attractinvestment in auto industry. Following drivers are especially important to achieve growth in this region:
Key driver of growth: Shorter Term
Infrastructure improvement for OEMs
CBIC region has strong potential in India since this region harnesses sea port and there is a characteristic ofproximity to market abroad- considering the competition with other investment clusters in India, key successfactor for this region is to keep attracting export-oriented OEMs. From OEM perspective, this region hascompetitiveness not only because of geological location but also because of cost competitiveness whencompared with ASEAN region. Keep attracting export-oriented OEMs to this region with improved investmentclimate will lead to continuous growth of this region as a hub of vehicle export.
Already several OEMs are investing in this region including Nissan, Hyundai and they are building up factorieswith their own investment with the support of state government in terms of land provision, electricity supply
Multi-Suzuki800
(56%)
Hyundai320
(22%)
Tata97
(6.8%)
Tata 70(73%)
Multi-SuzukiA1 (100)
A2 (1450)
A3 (360)Multi-Suzuki
130(36%)
Tata 87(24%)
Honda46
(13%)
Hyundai35
(9.6%)
A4 – A6 (70) GM16.4%Toyota15.8%
Sloda15.1%
Honda10%
MPVs, UVs (530)
Mahindra &Mahindra
170(32%)
Multi-Suzuki160
(31%)
Tata 96(18%)
ToyotaKirloska
64(12%)
Indian Company
JV
Foreign Company

Final Report – Comprehensive Regional PlanPwC/ Nippon Koei 151
etc. Basically their operation is stable due to this well managed infrastructure within industrial park. Meanwhile,infrastructure for vehicle export is not necessarily well managed. Especially infrastructure connecting to port inChennai region is weak and leading to unstable operation of export activities.
Since most of the OEMs are focusing on export from this region, improvement of export oriented infrastructureincluding connecting road construction, port evacuation capacity increase will surely ensure future increase ofOEM’s investment into this region. Otherwise export oriented OEMs might look for another location andinvestment to this region might decrease.
Tax/permit process improvement for export
Indian’s tax system is complicated and most of foreign players are suffering from the complicated system whichis lack of consistency. Sometimes they are imposed of tax which they did not expect and this is working as abarrier to promote export business in this region. In addition, CST (Central State Tax) which is imposed whencrossing the state borders is also working as obstacle to develop their business across state borders.
Infrastructure improvement for tier-2/tier-3 suppliers
For foreign suppliers, currently investment scope is limited and value chain is not completed within India/CBICregion – only tier 1 suppliers are investing in the region and investment of downstream layers have not almosthappened yet. Most of tier-2 and tier-3 foreign suppliers are delivering their work from home country orASEAN countries (e.g. Thailand). If this investment happens by foreign tier-2 and/or tier-3 players, we canexpect technology transfer from foreign players to Indian local downstream players as well as pure increase ininvestment in this region.
In order to increase the investment of suppliers, bottlenecks which they are facing needs to be removed. One ofthe bottlenecks they are facing now is lack of reliable utility (especially electricity). Therefore, supply of reliableutility infrastructure could be one of the ways to improve the situation. Development of industrial park could beone of the easiest ways to supply reliable utility infrastructure.
Longer Term
Capacity development of suppliers and achievement of industrial growth as export oriented industry
As described in previous section, currently there are suppliers which are lack of technologies/skills (these areincluded in the categories of “India local large supplier” and “India local small supplier”). These companiescannot supply components to foreign OEMs since they cannot meet requirements of foreign OEMs. It isimportant to fulfil the gaps of skills and technologies and bottom up entire level of supplier industry in thisregion. If these suppliers can be grew up enough to export components from this region, this could also beadvantageous for this cluster since they harness inherent cost competitiveness and there is a possibility thisregion grows up as regional hub of auto suppliers.
In order to further push forward growth of supplier’s industry, there are ways which government can take –including MSME protection policy, infrastructure improvement for suppliers (for production and export) etc.
Enhancement of R&D function and growth us R&D hub (“going to digital”) –
One of key characteristics auto industry is experiencing these days is that industry is going to more digital side.Consumers are shifting to combine mobility with communication. Therefore, automobiles tend to be combinescommunication devices. Also, gasoline engine vehicle is gradually shifting to EVs – there is an advantage of lessemission – and new technology is expected to be applied to more number of vehicles. Considering this situation,enhancement of R&D function could be one of key driver for continuous growth. CBIC includes IT/electricitycluster and there might be synergies expected between auto sector and these sectors for R&D functionenhancement. In order to promote and enhance R&D capability, government’s investment into such functionand development of R&D oriented industrial hubs could be effective.

Final Report – Comprehensive Regional PlanPwC/ Nippon Koei 152
Key nodes for auto sector investment in the corridor
Based on the proposed framework for industrial development strategy for CBIC, we propose certain keyinterventions/recommendations for the Government to develop the chemicals & petrochemicals sector alongthe identified districts in the corridor. These recommendations have been segregated as economic enhancers,administrative enhancers and value enhancers.
For the shortlisted districts along the corridor, we have summarized the key interventions required by GoI,along with the existing status and challenges in these districts:
District Existing status and current asset profile
Chennai
Excellent road and rail connectivity within district and hinterland Excellent seaport connectivity, with proximity to Chennai and Ennore sea ports Good availability of educational institutions - Around 240 engineering colleges,
19 universities, IIT Madras Existing OEM plant of Ashok Leyland Land availability
Tiruvallur
Excellent road (NH-5 via Gummidipoondi and NH-205 via Ambattur andTiruvallur)
Rail connectivity within district and hinterland is available predominantly insouthern and coastal parts of the district
Excellent seaport connectivity, with proximity to Chennai and Ennore sea ports Existing OEM plant of Hindustan Motors
Kancheepuram
Excellent road (NH-4 via Sriperumbudur and Kancheepuram and NH-32through the entire district )
Very good rail connectivity within district and hinterland Excellent seaport connectivity, with proximity to Chennai and Ennore sea ports
Availability of educational institutions at Chennai and suburbs with IIT Madrasand the Anna University
Existing OEMs including Renault-(Oragadam) Ford(Chengalpattu) andHyundai (Sriperumbudur
Connecting road to port needs to be improved
Chittoor
Excellent road connectivity (NH-40 (to Chennai), NH-42, NH-69, NH-71, NH-716 (to Chennai)
Excellent rail connectivity in parallel with NH network (except NH-69)Some availability of educational institutions (18 engineering colleges) andproximity to Bengaluru, which has access to skilled resources
Inadequate supply of electricity and water (utilities)Insufficient number of industrial parks for smaller scale suppliers
Bangalore Urban
NH-4, NH-7 & NH-209 goes through district and connect to other parts ofKarnataka and other States
Chennai Port is situated at a distance of 315 Km Good availability of skilled manpower
BangaloreRural
NH-4 and NH-48 goes through district and connect to other parts of Karnatakaand other States.
Availability of well developed rail network – a total railway route of 204.39 km Mangalore Port is situated at a distance of 320 km Existing OEMs including Toyota
In order to identify node location, following points need to be considered:
Land availability
Existing auto industry in order to develop auto cluster
Accessibility to connecting infrastructure
Availability of utilities
Of these points, especially land availability and existence of auto industry is important – without landavailability nodes cannot be built up and without existence of current industry auto cluster cannot be grown up.

Final Report – Comprehensive Regional PlanPwC/ Nippon Koei 153
From these aspects, there are two districts recommended in this corridor. One is Kancheepuram in TN sincealready there are multiple OEM factories and it is easily to expect that this district will grow up as core hub ofauto sector. Accessibility to port infrastructure and availability of utilities are not enough secured, thereforethese points need to be improved in order to grow up this region as a node for auto sector.
Another district recommended is Bangalore Rural, since this region is adjacent to Bengaluru city and haspresence of foreign OEMs. This region is advantageous in terms of accessibility to human resources and R&Dresources in Bengaluru city and it can be expected that this region will grow up in a context different from TN.Similar to the case of Kancheepuram land availability, utility and access to port infrastructure needs to beimproved.
Key Interventions required and strategy for developing auto industry sector along CBIC
Intervention Challenges Recommendations
Economic
Inadequate transportinfrastructure is one of thebottlenecks to attract investmentof foreign OEMs
Inadequate infrastructure forsupplier is one of the bottlenecksto attract investment of suppliers
Development of export orientedtransportation infrastructure. Especiallyconnectivity Chennai suburban area and costal areais weak. Therefore construction of road connectingChennai suburban area and costal area of Chennaiis recommended.
Improvement of port capacity. The ports inChennai region is always using up its capacity andinvestment into new port might be required. Also,operational improvement of port might be requiredsince it is taking a lot of time to evacuate cargo atcurrent status.
Development of industrial park for stablesupply of utilities. Most of suppliers are sufferingfrom lack of stable supply of utilities. Thereforesupply of utilities through development ofindustrial park could help improvement of theiroperation.
Administrative
Complicated tax system/doubleimposition of taxes
Lack of specific plan to attract FDIinvestments across the value chain
Improvement of tax regime: Develop acomprehensive and structured tax regime
Development of industrial growth policy:specific plan and specific policy to attract FDI forTier-2/Tier-3 industry.
Value
Inadequate facilities available forresearch and development
Future shortage of skilledlabourers
Future challenges for productdiversification and value addedproducts
Education of skilled labour: As automobileindustry grows up in this region, it is expected thatneeds for skilled labours will rise up. In order toprovide sufficient amount of labours, establishmentof facilities to educate enough amount of skilledlabours will be required
R&D center development and R&D functionenhancement: Most of the R&D function isoutsourced from this region. However, in order toachieve sustainable growth, development of R&Dhub in this region is necessary.

Final Report – Comprehensive Regional PlanPwC/ Nippon Koei 154
4.4.11.2 AutomobilesTable 4.4.24: Competitiveness analysis of Automobile sector
SectorCompetingcountries
Relativeranking of
India
Key factors forlower
competitivenessof India
Assessment of factors for lower competitivenessInterventions required to increase
competitiveness of India
Automobiles China,Germany,USA, Japan,France, Korea
19th rank 1.Low level ofResearch andDevelopment
2. Labour issues3. Issues across the
value chain
1. Research and Developmenta. R&D expenditure as a percentage of turnover is low in
the Indian Auto-component sector ranging between 0to 1.5% while it is slightly higher at 0.5-3% in theAutomobile sector
b.The industry does not possess good design facilitiesc. In India, the share of R&D cost is less than 2% whereas
in companies based in Europe the costs range between2-4%
2. Labour issuesa. . However, wages paid to temporary workers, on an
average, are one fourth to half of those paid topermanent workers. However, since contract workersare temporary, it is difficult to train and retain them asskilled employees.
b.Some of the key issues in the sector include cap on thenumber of contract labourers, limits on over-time andmagnitude of extra-compensation, shortage of skilledmanpower. These issues have led to a lower labourproductivity of India in comparison to competingnations
3. Value chaina. A lot of foreign OEMs bring along with them a part of
the supplier network. This has affected the Indian autosupply chain. The major reason for this is non-availability of required quality/technology in India andavailability of low cost products in other countries
b.Foreign OEMs in India import 10-100% of theirrequirement whereas Indian OEMs import less than2% of their requirement
c. The supply chain has also been affected by regulatorynorms related to emission
1. Research and Developmenta. Policy interventions are essential to
improve R&D facilities in the countryb.A scheme for special credit for R&D could
be startedc. The Government needs to significantly
strengthen non-proprietary R&D anddesign capacity that has strong connectionswith research institutes like IITs
2. Labour issuesa. Labour reforms, especially on flexibility in
the regulations related to hire and firepolicies, would encourage recruitment ofmore permanent workers, which wouldhave overall positive effect
3. Value chaina. Necessary steps need to be taken by the
government to promote Indian products,improve cost competitiveness and promotequality in the automobile sector
Source: Determinants of Competitiveness of the Indian Auto Industry, National Manufacturing Competitiveness Council, GoI

Final Report – Comprehensive Regional PlanPwC/ Nippon Koei 155
4.4.11.3 Recommendations summaryCBIC region has already started to grow up as a concentrated cluster of auto sector. Proximity to overseasmarket as well as domestic market is inherent attractiveness of this region for auto industry. Auto sector’scharacteristics are its complex value chain and structure - at least there are OEM layer and supplier layer. Inorder to address continuous growth, it is important to attract investment to both two layers. Investment toOEM layer would addresses investment to supplier layer through enhancement of growth as an auto industryhub in this region. Similar to this flow, if we can attract investment to suppliers, it will lead to future investmentby OEMs since one of key criteria for OEMs when they make a decision for investment is maturity of supplierindustry. Therefore, we can expect investment by more OEMs when the region has enough maturity of supplierindustry.
One of key factors that influences investment decision both for OEMs and suppliers are investment climate. Ifthe region can develop an investment climate which is preferable to both OEMs and suppliers, this “virtuouscycle” can be enhanced and it is expected that rapid growth of auto region can be realised. Investment climateimprovement includes infrastructure improvement – connectivity improvement and development of industrialhub as well as institutional improvement including tax regime change. It is desired that auto sector orientednode will be developed somewhere in the corridor at a location where current OEMs and suppliers are locatedand where connectivity/ utility infrastructure is available.
As a destination of investment, there is a competition with industrial clusters of adjacent countries as well asdomestic industrial clusters. For example, obviously CBIC is always competing with domestic industrial clusters– NCR region and west region as an investment destination of auto industry. At the same time, CBIC region iscompeting with export oriented auto industry clusters across Asia – including Thailand and Indonesia.Investors (OEMs and suppliers) are always comparing these regions as a destination and in order to attractmore OEMs and suppliers. Hence, it is quite important to harness investment environment which is superior tothese competitors.

Final Report – Comprehensive Regional PlanPwC/ Nippon Koei 156
Chemicals and petrochemicals
Electrical machinery
Machinery
Pharmaceuticals
Food processing
Computers and electronics
Textiles
IT
Automobiles
Metallurgy
Corridor competitiveness
• Development ofquality integratedindustrialinfrastructure
• Promotionof localfactor costadvantages
• Easy of access toconsumptionmarkets andgateways tomarkets
• Reliable availabilityof FoPs
• Institutionalreforms
• Regulatory &policy support(economic, trade,financial and taxsystems)
• Ease in doingbusiness
• Productivityenhancement
• Efficiency in resourceuse
• Technologicalreadiness andupgradation
• Skill development
• Effective supplychain
• Research anddevelopment
• Value addition
Economicenhancers
Administrativeenhancers
Value enhancers
4.5 CBIC – Key interventionsA summary of key interventions to enhance the competitiveness of the corridor is represented below:

Final Report – Comprehensive Regional PlanPwC/ Nippon Koei 157
Table 4.5.1: Key Interventions
Sector Economic enhancers Administrative enhancers Value enhancers
Auto
Government needs to focus on developingthe entire value chain by focusing on costcompetitiveness, promote quality in theautomobile sector and dissuade OEMs frombringing supplier network
Connectivity infrastructure for industrialparks with key ports within the corridor
Port capacity addition required Ensure stable supply of water and power
One of the key issues faced by foreign investorsin India is the complicated and inconsistent taxsystem. There is a frequent change in the taxlaws. Additionally, CST also acts as a hindrancefor inter-state transactions.
Currently, majority of the investments in thesector are in the OEM and Tier I sector. Majorityof the foreign players are importing Tier I andTier II parts from their base location. Hence,Specific plans need to be made to promoteinvestment of Tier-2/Tier-3 industry members inIndia.
10-30% of the total production workers areemployed on contract basis. Reducing thenumber of contract labourers by givingflexibility in regulations to hire employees.
The Government needs to significantlystrengthen non-proprietary R&D and designcapacity that has strong connections withresearch institutes like IITs
Facilitate additional courses to cater toupcoming demand for skilled workforce in thecorridor
CEO
Availability of industrial land and improvedavailability of power
Improved logistics infrastructure andintegration with global supply chain network
Tax structure needs to be improved. India’scurrent tax structure makes the final product lesscompetitive and encourages low cost imports
Preferential market access for local companiesneeds to be improved.
Flexibility in labour laws is essential to cater torapid seasonal variation in demand.
Reliance on imports for raw materials needs tobe reduced
China and Taiwan are key competitors thathave invested heavily in research anddevelopment. Economies of scale create globalcompetitiveness. The focus area should beadding more value to the existing productsand creating new products through investmentin R&D.
Availability of quality manpower
Pharmaceuticals
High quality of utility infrastructurerequired – water availability and treatment,power availability and quality
Establishing clinical research facilities withprivate partnerships
Incentivize R&D in product innovation and GoodLaboratory Practices (GLP)
Improve regulatory mechanism for approval ofclinical trials
Introduce reforms in health care insurance sector
Facilitate assistance in technology transferthrough collaborations with MNCs
Upgrade and design new courses in theinstitutes which cater to the industryrequirements
Create dedicated R&D institute for promotingproduct innovation and facilitate creation ofproduct promotion centers for SME players
FoodProcessing
Development of support infrastructure inthe form of warehousing/ cold storageinfrastructure and customizedtransportation network required
Reduction in raw material costs and lossesby bringing in efficient logistics network.Last mile connectivity should be improvedin order to strengthen the linkage betweenraw material supplier and processingunits
Government should promote reliable and strongsupply chain network between raw materialsuppliers and processing units on PPP basis
There is a need to introduce uniform tax rates inall states avoiding multiplicity of taxes atdifferent stages.
Systems and procedures may be simplified. Theneed for documentation/ paperwork at multiplechecks posts and in different states, customsformalities, needs to be reduced.
Awareness on quality standards could becreated through seminars, newsletters andtraining programmes
The linkage between government agencies,universities, industry and other stakeholderslike cooperatives, farmer organisations etcneeds to be strengthened
Government should provide support to clustersin form of credit, inputs, expertise andmarketing links
Focus on improving the quality of products

Final Report – Comprehensive Regional PlanPwC/ Nippon Koei 158
Sector Economic enhancers Administrative enhancers Value enhancers
Specific incentives to be given to encourageproduct diversification and increase productionof value added products
Machinery andElectricalMachinery
Ensure availability of raw material(CGRO/CNGRO* electrical steel) – clearcertification mechanism for importers in theshort run and setting up indigenous facilitiesfor electrical steel production in the long run
Strengthening rail network (speciallyBengaluru rural, Krishnagiri, Thiruvallur) asnecessary requirement to transport overdimensional consignments
Set up indigenous testing and calibratingfacilities for equipment testing
Promote technologies upgradation, newtechnology introduction and accordingly modifythe existing procurement policies byPSUs/utilities to facilitate technology absorptionby electrical machinery and machinerymanufacturers.
Quality control mechanisms and certificationsystems in the sector to ensure product qualitycontrol (supplies from vendors and end-products)
Transition from import dependent to exportoriented sectors: in the short run - supportindigenous manufacturers, by puttingrestrictions on second hand equipment,mandating foreign partners to foster technologytransfers along with setting up manufacturingfacilities; in the long run – export promotionpolities; preference to joint ventures, not 100%foreign owned companies
Establishment of linkages between industry andacademia – active involvement of public andprivate participation to bridge growing skillerosion
Support/incentives to the manufacturing unitsin setting of R&D facilities (especially MSMEs)
Enhancement of value addition – incentives tothe foreign players to increase value addition inIndia under technology transfer, roadmap forsetting up facilities for manufacturing ofautomation equipment indigenously
Metallurgy
Rail connectivity from mines and industrialunits of Bellary to Chitradurga, Anantapurand Chittoor districts to Krishnapatnam,Managlore and Chennai Ports
Railway connectivity from Nellore to WestGodavari, East Godavari mines
Expanded power generation andtransmission initiatives adding sufficientcapacity and covering identified nodes
Policies to provide power tariff subsidies for first5-10 years of operation
Further allocation of mines to companiesplanning to set up smelter units in the corridor
Creation of state owned enterprises focused onscrap consolidation and recycling. This wouldaddress raw material bottlenecks as well as makethe industry greener.
Technological linkages with countries likeJapan who have been top exporters in spite ofscarcity of raw materials
Knowledge Transfer Partnerships to createlarger institute-industry interface and focus onemployable workforce
Improved R&D on mineral exploration andenvironmental friendly linkages
Medicalinstruments
Infrastructure for uninterrupted powersupply
Mixed cluster approach with electronics andelectrical industry to enable synergies
Quality standard norms to discourage low qualityimports and give boost to domestic industry
State level healthcare initiatives in segments liketelemedicine/portable clinics that can provideboost to portable device segment
Enhance branding of the industry in the corridorthrough initiatives like medical technology parks
Incentives for R&D in hi-tech medicalequipment segment e.g. pooled fund to supportR&D within SMEs
Better grants in biomedical instrument or likesubjects to attract brighter research talent
Focus on creating employable workforce
Textiles andApparels
Subsidizing unit rates of power or encourageusage of non conventional energy sources.Develop dedicated/captive power generatingsources specifically for the major textileclusters.
Concerned Ministries, Departments, Stategovernment need to be focus on reducing
Regulations need to be focused on controllingraw material exports to ensure stable prices inthe country and to make the sector morecompetitive and productive
Reimbursement schemes such as duty drawback,market development assistance etc to reduce theimpact of exchange rate fluctuations
Technological upgradation, modernization ofunits and Automation needs to resolve theproblems of shortage of labour, poor quality ofproduct and will lead to higher productivity
Vocational training through ITIs, Textile Design& Management Institutions specially in the areaof Apparel Manufacturing, Quality Control and

Final Report – Comprehensive Regional PlanPwC/ Nippon Koei 159
Sector Economic enhancers Administrative enhancers Value enhancers
the transit time and cost at the internationalcheck points to make Indian textile productsmore competitive.
Labour laws need to be made more flexible topermit longer hours of overtime with duecompensation, and to allow flexi-hiring of labour
Designing needs to be encouraged so thatskilled work force is available
Amendment to Labour Laws is needed, topermit longer hours of overtime with duecompensation, and to allow flexi-hiring oflabour, especially to support apparels sector
Chemical andPetrochemical
Develop freight corridor between Bengalururural and Chennai seaport, to promoteexports of chemicals and petrochemicals
Improve rail connectivity betweenBengaluru rural and Chennai seaport
Ensure feedstock availability of natural gasand naphtha
Consolidate acts into an Integrated ChemicalLegislation, simplify regulatory structure andstrengthen regulations and ensure stricterenforcement of regulations and promoting greenmanufacturing practices
Rationalize taxes and duties to promote domesticmanufacturing
Incentivize the MSME players to increase thesectors' presence in the MSME segment alongthe corridor districts
Set up a dedicated R&D centre and Centre ofExcellence for Specialty Chemicals
Incentivize industry players to follow bestpractices of manufacturing like higherefficiency, latest technologies; promote “zerodischarge” technologies
Establish a CBIC Chemical Innovation Fund toencourage commercialization efforts forinnovations generating inclusive growth

Final Report – Comprehensive Regional PlanPwC/ Nippon Koei 160
4.6 Competitiveness of the corridor – key interventionsThe Global Competitiveness Report 2013-14 by the World Economic Forum accesses quality of infrastructure(including roads, railroads, ports and air transport infrastructure) as one of many different componentsmeasuring different aspects of competitiveness. We have analysed the criticality of infrastructure componentsfor each sector and mapped this assessment against major competitors of India in the global trade market forsector to highlight the importance of strengthening of the relevant infrastructure components that lag behindthe global export leaders.
On a scale of 1-7, following is India’s score against competing countries for manufacturing sector investment
Quality of roads India – 3.6, China 4.5, Thailand – 5.0, Korea – 5.8,
Quality of railroadinfrastructure
Thailand 2.6, China 4.4, India 4.8, Korea -5.6,
Quality of portinfrastructure
India 4.2, China 4.5, Thailand – 4.6, Korea – 5.5
Quality of airtransportinfrastructure
China 4.5, India 4.8, Korea 5.2 and Thailand – 5.7

Final Report – Comprehensive Regional PlanPwC/ Nippon Koei 161
Quality infrastructure will play a key role in the development of CBIC region for CBIC region to be regarded as apromising investment destination the following key interventions will be needed:
Ports – The key ports in the region include Chennai, Ennore and Krishnapatnam port. The challengesin these ports include large operational issues, inefficient safety measures and high cost of usage. Itwould be essential for the government and private players to take necessary steps to improve thecompetitiveness of the ports in the region. The connectivity of industrial areas and raw material sourceswith key ports needs to be improved, along with focus on capacity addition of cargo handling capacityat key ports.
Road – At various stretches in the CBIC region there are multiple issues like traffic congestion in areasaround the Chennai and Ennore Port and absence of last mile connectivity for industrial parks. Becauseof this it is difficult for companies to calculate the lead time for their goods. In order to resolve theseissues it would be essential for the government to frame a comprehensive road plan considering theestimated future industrial development in the corridor
Power – The region experiences a chronic shortage of power which impedes the production plans ofindustries operating in the region. Cost of power is another barrier for many industries within thecorridor. Sectors like Textiles, Metallurgy, Food Processing have large power requirement and hence, tosolve this it would be essential for the government to frame a comprehensive electricity supply anddemand plan
Railways – Sectors like Electrical Machinery, Machinery, Chemical and Petrochemicals have a strongrequirement for railways infrastructure. The current management of the railway transport is unreliable.There have been cases of damage due to bad management and the lead time cannot be estimatedaccurately due to frequent delays. Absence of sufficient rail sidings, rakes for containerised cargo haveimpacted the performance of these key sectors. A dedicated freight corridor between Bangalore andChennai will positively impact the performance of many key industry sectors.
Industrial Clusters: Globally competitive industrial parks with strong connectivity infrastructurecorridor need to be developed to enhance the competitiveness of industry sectors
Beyond the availability of quality industrial infrastructure, Government will have to focus on various otherparameters that would be essential to improve the competitiveness of the corridor. Some of them are detailedbelow.
As per the last World Bank survey on ease of doing business, the states in the CBIC region are performing wellon parameters such as dealing with construction permits, resolving insolvency trade across borders; howeverthey lag behind on parameters such as ease of starting a business, registering property, paying taxes, enforcingcontracts etc. Availability of land for industries, quality manpower, and support for project clearances are theother set of key interventions for industries within the corridor. There is a need to focus on reformingprocedural and regulatory formalities in the CBIC region to reduce compliance burden on industries. Focusingon the competitiveness of the sectors to attract investments in the corridor it would be essential to ensureimproved performance of sectors operating in the region. Productivity of companies across majority of thesectors needs to be improved. For example, the labour productivity in electronic components is 10 times lesserthan competing nations. Capital productivity of textile and electrical equipment sectors in India is far lowerthan that of China. The corridor’s development strategy should focus on improving the productivity across thesesectors as they are critical to corridor’s performance. Investments in research and development, modernizationand technological upgradation, skill development of human resources will be critical to achieve competitivenessat global level.

Final Report – Comprehensive Regional PlanPwC/ Nippon Koei 162
5 Node Selection5.1 IntroductionThe CBIC is poised to play a pivotal role as one of the key contributors to the economic development of the
southern part of India as well as the whole country. One of the objectives for the JICA CBIC study is to identify
suitable nodes to be taken up for industrial development within the CBIC area. In this regard, JICA study team
carried out the following work: (i) analysis of node development potential including the potential zones at a
broad level, ii) assessment of the potential area at a sub-district level for development of the industrial nodes,
iii) confirmation of the situation and potentials of shortlisted nodes including prospects of investment from
Japanese Companies, and iv) proposing the industrial nodes for master plan and development plan to be
formulated under Part B. Those results were described in the chapter.
5.2 Identification of broad locations for zones
5.2.1 Discussions with state governmentsAs per the discussions undertaken with the respective state governments to understand their broad views onland availability and suitability of potential zones, the following locations have been suggested as the proposeddestinations for industrial nodes. The below locations have been proposed by the state governments based onfactors such as presence of existing ecosystems, demand from industries and the intended development plans ofthe states.
Table 5.2.1: Potential zones proposed by the State governments
State District Area / Region
Tamil Nadu Krishnagiri i. Hosur
Kanchipuram ii. Madurantakam
Vellore iii. Serkadu
Tiruvallur iv. Ponneri
Karnataka Kolar v. Kolar Industrial Area
vi. Vemgal Industrial Area
Tumkur vii. NIMZ Vasanthnarsapura
viii. Sira
Chitradurga ix. Chitradurga – Challakere
Ramnagara x. Bidadi Industrial Area
Andhra Pradesh Nellore xi. Krishnapatnam SEZ
Nellore xii. Naidupeta & Attivaram
Anantapur xiii. Lepakshi SEZ
Chittoor xiv. NIMZ Pileru
Source: Interactions with state governments

Final Report – Comprehensive Regional PlanPwC/ Nippon Koei 163
5.2.2Methodology and Assessment Framework for identification ofbroad locations for zones
The above potential zones (including othersurrounding / neighbouring areas in the states) havebeen further analyzed using a set of important factorsreflecting key attributes such as:
Presence of existing city development plans /
urban master plans
Distribution of existing industrial
development
Accessibility to regional trunk road
infrastructure
Proposed land acquisition plans for future
industrial development
Based on the above analysis, the potential broad
zones were classified into two categories:
Category A: High priority regions with the
potential to provide faster return on
investments
Category B: Regions with low potential to
provide faster return on investments
For the Category A area, further analyses at Sub-District level were conducted with a set of eight assessment
criteria that includes the following:
1. Accessibility to regional trunk roads
2. Existence of protected/restricted areas
3. Government land availability and availability of proposed industrial development areas
4. Water availability
5. Assessment of urban planning strategy
6. Existing and planned industrial areas
7. Accessibility to major transport facilities (port and airport)
8. Accessibility to electricity network
5.2.3Target Sub DistrictsTotal 49 sub districts (12 Talkus from Karnataka, 25 Mandals from AndraPradesh, and 12 Taluks from TamilNadu) are assessed under the identified potential zones. The locations are shown below.
Presence of citydevelopment plans /urban master plans
Distribution of existingindustrial development
Accessibility to regionaltrunk road
infrastructure
List of potential broad zones
for industrial nodes
Land acquisition plansfor future industrial
development
Identification of a list of potential zones for
industrial node development based on views of
State Governments
Figure 5.2.1: Methodology and assessmentframework for the broad selection of industrial nodes

Final Report – Comprehensive Regional PlanPwC/ Nippon Koei 164
Figure 5.2.2: Location of Potential Sub Districts
Table 5.2.2: List of Potential Sub Districts
Zone State District Taluks (TN, KR) / Mandals(AP)
1-KR Karnataka Ramanagara Magadi, Ramanagaram, Channapatna, KanakapuraBangaloreUrban
Anekal
2 Karnataka BangaloreRural
Devanhalli, Hoskote
Kolar Kolar3 Karnataka Tumkur Sira, Tumkur
BangaloreRural
Nelamangala
4 Karnataka Chitradurga Chitradurga5 Andhra
PradeshAnantapur 1.Parigi, 2.Somandepalle, 3.Hindupur, 4.Lepakshi
6 AndhraPradesh
Chittoor 5.Tirupati (Urban), 6.Tirupati (Rural), 7.Renigunta, 8.Yerpedu, 9.Srikalahasti
7 AndhraPradesh
Nellore 10.Indukurpet, 11.Nellore, 12.Thotapalligudur, 13.Sydapuram, 14.Gudur,15.Manubolu, 16.Venkatachalam, 17.Muthukur, 18.Chillakur, 19.Kota, 20.Ojili,21.Naidupet, 22.Chittamur, 23.Vakadu
8 AndhraPradesh
Chittoor 24. Madanapalle, 25.Ramasamudram, 26.Punganur, 27. Gurramkonda,28.Vayalpad, 29.Kalikiri
9 Tamil Nadu Vellore Ambur, Katpadi, Vellore, Walajapet10 Tamil Nadu Kanchipuram Kanchipuram, Sriperumbudur, Chengalpattu, Madurantakam
11 Tamil Nadu Tiruvallur Ponneri, Gummidipundi1-TN Tamil Nadu Krishnagiri Hosur, Krishnagiri
Zone 4
Zone 5
Zone 8Zone 6
Zone 7
Zone 3 Zone 2
Zone 1-KR
Zone 1-TN
Zone 9
Zone 10
Zone 11

Final Report – Comprehensive Regional PlanPwC/ Nippon Koei 165
5.2.4Overview of Current Industrial DevelopmentCurrent industrial sectors of potential zones were analyzed and the result is shown in the next page. The sectorsthat have an investment of more than Rs. 250 crores have been plotted as current key sectors in the zones.Further, the key strengths of the zones have been highlighted in the attachment.
The analysis indicates that Zone 1, 10 and 11 are some of the strongest industrial areas within the CBIC area.These zones have some of the highest committed projects (CMIE data indicates these regions have over 20% ofState’s committed investments) that will create robust industrial spaces in the future. Another notable feature isthe presence of strong MSME clusters (over 10 % of State’s MSMEs) in these areas will provide inputs neededby large industries.

Final Report – Comprehensive Regional PlanPwC/ Nippon Koei 166
Table 5.2.3: Summary of key sectors by zone
Zone 1 Zone 2 Zone 3 Zone 4 Zone 5 Zone 6 Zone 7 Zone 8 Zone 9 Zone 10 Zone 11
Presence of Key
sectors
Automobiles √ √ √ √ √
Chemical &Petrochemical √ √
ElectricalMachinery √ √ √ √
Electronics √ √
FoodProcessing √ √ √ √ √
Machinery √ √ √ √ √
Metallurgicalindustries √ √ √ √ √ √
Pharmaceutical √ √
Textiles √ √ √ √
IT & FinancialServices √ √ √ √
>10% of state’s
MSMEs
Districts in KN - √
District in TN - X √
>20% of state’s
investment
Districts in KN - √
District in TN - X √
>10% of state’s
GSDP
Districts in KN - √
District in TN - X √ √
<100 km to
international
airport –
B’lore/Chennai √ √ √ √ √
<100 km to port √ √ √ √

Final Report – Comprehensive Regional PlanPwC/ Nippon Koei 167
5.3 Identification of potential area at a sub-district level
5.3.1 Accessibility to Regional Trunk RoadsSeamless connectivity and accessibility to the regional trunk road network (National highway and Statehighway) is a major infrastructure parameter for the success of manufacturing industries as it supportsmovement of raw materials and finished goods. It is widely accepted that accessibility to regional trunk roads isone of the key factors to operate of industrial city/node smoothly as it enables transportation of rawmaterials/products and movement of workers. For this purpose, the areas include dense trunk road networkcan be considered as high-potential areas.
Table 5.3.1: Assessment Criteria 1 – Linear Density of Trunk Road Network
Potential Assessment Description
Very High Area with and over 0.20 km/sq.km trunk road density
High Area with and over o.10 under 0.20 km/sq.km trunk road density
Medium Area with under 0.1 km/sq.km trunk road density
Low Area without any national highway and state highway
Source : JICA Study Team AnalysisFigure 5.3.1: Assessment of Road Network Accessibility
Areas including multiple interchanges (e.g. Tumkur, Sriperumbudur and Renigunta) show high density of trunkroad network.
Tumkur
Sriperumbudur
Renigunta

Final Report – Comprehensive Regional PlanPwC/ Nippon Koei 168
5.3.2Existence of Protected/Restriction AreaReserved forest, water bodies and protected area like wildlife sanctuary and national park are restricted areasfor the new development. For this reason, the area covered by widely protected/restricted area should not beconsidered in selection of industrial nodes.
Table 5.3.2: Assessment Criteria 2 – Distribution of Protected/Restriction Area
Potential Assessment Description
Very High Area with under 10 % of protected/restriction area
High Area with and over 10 under 20 % of protected/restriction area
Medium Area with and over 20 under 30 %of protected/restriction area
Low Area with and over 30 % of protected/restriction area
Source : JICA Study Team Analysis
Figure 5.3.2: Assessment of Protected/Restriction Area
Areas which include wide reserved forests (esp. Vellore, Ambur and Katpadi) are assessed as low potential ascovered in the analysis above.
Vellore
Ambur
Katpadi

Final Report – Comprehensive Regional PlanPwC/ Nippon Koei 169
5.3.3Government Land Availability and proposed plansAlthough some sub districts have government land, some of them are unsuitable for the urban development dueto current land use (e.g. built-up area, agricultural use, etc.) or land disposition (e.g. forest, water bodies, rockyarea, etc.). However, the governments have initiated several development plans for particular areas and thoseareas have been assessed. The areas containing suitable government land or planned industrial developmentcan be considered as high potential areas.
Table 5.3.3: Assessment Criteria 3 – Government Land Availability and Proposed Plans
Potential Assessment Description
Very High Area with over 3,000 ha of government land bank or planned area
HighArea with over 1,000 ha under 3,000 ha of government land bank orplanned area
Medium Area with under 1,000 ha of government land bank or planned area
Low Only small plots (under 20 ha) are available
Source : JICA Study Team AnalysisFigure 5.3.3: Assessment of Government Land Availability and Proposed Industrial Development
According to discussion with government and other related organizations, the following development sites wereevaluated as promising: Ponneri and Hosur Taluk in Tamil Nadu State, Kanakaapura, Tumkur and KolarDistrict, Kalikiri and Chillakur Taluk area.
Kanakapura
Kanchipuram
Tumkur
Kolar
Kalikiri
Chillakur
Ponneri
Hosur

Final Report – Comprehensive Regional PlanPwC/ Nippon Koei 170
5.3.4Water AvailabilityThe areas selected as industrial nodes would undergo urban expansion owing to development of industries andsupporting social infrastructure needs. Adequacy of water availability is a one of the key issues to sustain suchnew developments. The analysis presented below shows the gap between water supply and demand. The areasthat either have supply in excess of demand or negligible gap in water supply compared to the demand can beconsidered as high potential areas.
Table 5.3.4: Assessment Criteria 4 – Gap between Water Supply and Demand
Potential Assessment Description
Very High Area with water supply in excess of demand
HighArea with over 80 % and under 100 % of water supply against waterdemand
Medium Area with over 70 % and under 80 % of water supply against water demand
Low Area with under 70 % of water supply against water demand
Source : JICA Study Team AnalysisFigure 5.3.4: Assessment of Water Availability
The areas of Ramanaga, Gummidipoondi, Ponneri, Parigi, Somandepalle, Ramasamudram, Yeripedu and othercoastal Mandals in Andhra Pradesh area have enough water availability against current population.
Parigi,Somandepalle
Ramasamudram
Yerupedu
Ponneri
Gummidipoondi
Ramanagara

Final Report – Comprehensive Regional PlanPwC/ Nippon Koei 171
5.3.5Power AvailabilityThe transmission line network is shown in the following figure. Majority of areas fall under the zones havinghigh voltage transmission lines; however Ramanagara, Channapatna, Devenahalli and some of Mandals inChittoor district and Nellore district of Andhra Pradesh State are far from transmission lines. These areas needto install connection lines for development.
Table 5.3.5: Assessment Criteria 5 – Accessibility to Electricity Network
Potential Assessment Description
High Area with high voltage transmission line
Low Area without high voltage transmission line
Source : JICA Study Team Analysis
Figure 5.3.5: Assessment of Accessibility of Electricity Network
RamanagaraChannapatna
Devenahalli

Final Report – Comprehensive Regional PlanPwC/ Nippon Koei 172
5.3.6Assessment of Urban Planning StrategyBased on the City Development Plan (CDP) or Urban Master Plan (UMP) developed for highly populated cities,the potential and direction for future expansion of urban areas and future land use were assessed.
Table 5.3.6: Assessment Criteria 6 – Urban Planning Strategy
Potential Assessment Description
Very HighArea containing large industrial area and urban expansion by existing CDPor UMP
HighArea containing large industrial area or urban expansion by existing CDP orUMP
MediumOnly limited area is planned as expansion of urban area, but alreadydeveloped
Low Area without CDP and UMP
Source : JICA Study Team Analysis
Figure 5.3.6: Assessment of Urban Planning Strategy

Final Report – Comprehensive Regional PlanPwC/ Nippon Koei 173
5.3.7 Existing and Planned Industrial AreaAreas with large area of existing/proposed industrial parks or accumulation of industrial parks are recognizedas high potential area for industrial development. The categorization according to this evaluation criterion isdescribed in the table below.
Table 5.3.7: Assessment Criteria 7 – Existing / Planned Industrial Parks
Potential Assessment Description
Very HighArea with over 3,000 ha of total area of existing/proposed industrial parksand more than 2 industrial parks
HighArea with over 3,000 ha of total area of existing/proposed industrial parksor more than 2 industrial parks
Medium And over 1 medium size industrial park (and over 200 ha)
Low Only small industrial area (under 200 ha) is available
Source : JICA Study Team Analysis
Figure 5.3.7: Assessment of Existing and Proposed Industrial Parks
Kanakapura
Tumkur
Chengalpattu
Sriperumbudur

Final Report – Comprehensive Regional PlanPwC/ Nippon Koei 174
5.3.8Accessibility to GatewaysTo ensure smooth transportation of raw materials and products, accessibility of major transportation (port andairport) should be a factor for site selection. On this point, coastal areas and the areas located close to thesefacilities have big advantages.
Table 5.3.8: Assessment Criteria8 – Accessibility to Major Transport Facilities
Potential Assessment Description
Very High Area with port within 50 km radius
High Area with port within 100 km radius or airport within 50 km
Medium Area with airport within 100 km radius
Low Area without port and airport within 100km radius
Source : JICA Study Team Analysis
Figure 5.3.8: Assessment of Accessibility to Major Transport Facilities
Chennai
Port
Ennore
Port
KrishtpatnamPort
Chennai
Airport
Thirupati
AirportBengaluruAirport

Final Report – Comprehensive Regional PlanPwC/ Nippon Koei 175
5.3.9Potential assessment result at sub district levelAs a result of potential sub districts assessment, 9 sub districts are selected as Very High potential sub districts(red) and 9 sub districts are selected as High potential sub districts (orange). The assessment results are shownon the map below.
Source : JICA Study Team Analysis
Figure 5.3.9: Potential Assessment Result at Sub District Level

Final Report – Comprehensive Regional PlanPwC/ Nippon Koei 176
5.4 Shortlist of Industrial Nodes
5.4.1 Locations of Potential Sub Districts and Candidates ofIndustrial Nodes
Based on the potential assessment at sub-district level, the industrial nodes were discussed with the stategovernments. In case of Tamil Nadu State, Ponneri Taluk (4,200 ha) and Hosur Taluk (2,700 ha) wereproposed as industrial nodes. In Karnataka State, Kolar NMIZ (7,000 ha), Kanchugaranahallikaval industrialarea (4,200 ha), Vasanthanarasapura industrial area (600 ha) and Tumkur NMIZ (4,800 ha) were proposed. InAndhra Pradesh State, Hindur industrial park (3,200 ha), Pileru NMIZ (5,200 ha) and Krishnapatnam (3,100ha) were proposed as industrial nodes. It is emphasized that these proposed industrial nodes are located in thevery high/high potential sub districts.
Source : JICA Study Team Analysis
Figure 5.4.1: Location of candidate industrial nodes
5.4.2Shortlist of Industrial NodesThe advantages, the development requirement, and the possibility of industrial node development for sub-districts with very high/high potential were analyzed. As a result, these are the candidate nodes that areshortlisted in CBIC area.
HindupurIndustrial Area
(3,200ha)
Chittoor NMIZ(5,200ha)
Krishnapatnam PortIndustrial Area
(3,100ha)
VasanthanarasapuraIndustrial Area
(600ha)Tumkur NMIZ
(4,800 ha)
Mulbagal NMIZ(7,000ha)
Bidadi IntegratedTownship(4,200ha)
Hosur Industrial Area(2,700ha)
Ponneri Industrial Area(4,200ha)

Final Report – Comprehensive Regional PlanPwC/ Nippon Koei 177
Table 5.4.1: Summary of Potential Sub District and Candidate Industrial Nodes (Karnataka State)
Zone No. ZONE-1 (Karnataka State) ZONE-2 ZONE-3
DistrictBangalore
UrbanRamanagara Kolar Bangalore Rural Tumkur Bangalore Rural
Sub-District Anekal Kanakapura Magadi Ramanagaram Kolar Devanhalli Hoskote Tumkur Nelamangala
Potential
AssessmentA B B A A B B A A
Advantage Bangalore Metropolitan Development Authority plans 4township development and setting-up of new urban planningarea. It is expected that these areas would emerge as satellitecities around Bengaluru.
The total population of Zone-1 is around 1.34 million (population
census 2011).
Satellite ring road has been planned as priority project and will
contribute to reduction of the traffic congestion in Bangalore
Urban District.
It is possible to access both ports of Mangalore and Chennai
ports in future.
The location is preferable for foreign managers, engineers and
researchers, since majority of foreigners stay in Bangalore
Urban District
The gap of water balance between supply and demand is very
small.
Bangalore MetropolitanDevelopment Authority plansone township development andsetting-up of new urbanplanning area near airport.
The total population of Zone-2 is
around 0.56 million (population
census 2011).
The area of forest and water
body is limited to less than 10%
of zone.
Good accessibility to airport.
The accessibility to both
Bengaluru and Chennai will be
improved through development
of the Chennai – Bengaluru
expressway.
Both sub-districts have set-upurban planning area.
Nelamangala sub-district plans
expansion of urban area in their
city plan.
The total population of Zone-3
is around 0.80 million
(population census 2011).
The area of forest and water
body is limited to less than 5%
of zone.
The zones are located along of
NH-4 as major corridor in South
India. In addition, they have
good accessibility to Mangalore.
Requirement Satellite ring road is required for linkage of satellite towns andtherefore it should be realized as early as possible.
The establishment of industrial node along with development of
Alignment of expressway shouldbe reflected to node developmentplan
Satellite ring road is required forlinkage with satellite towns.
New or expansion of water supply

Final Report – Comprehensive Regional PlanPwC/ Nippon Koei 178
Zone No. ZONE-1 (Karnataka State) ZONE-2 ZONE-3
DistrictBangalore
UrbanRamanagara Kolar Bangalore Rural Tumkur Bangalore Rural
Sub-District Anekal Kanakapura Magadi Ramanagaram Kolar Devanhalli Hoskote Tumkur Nelamangala
Potential
AssessmentA B B A A B B A A
Satellite ring road will be effective way.
Existing land use as Agricultural area should be transferred as
urban area in order to receive the migration from Bangalore
Urban District.
New or expansion of water
supply scheme is required due to
the large gap of water supply and
demand.
Existing land use as Agricultural
area should be transferred as
urban area in order to receive the
migration from Bangalore Urban
District.
scheme is required due to the
large gap of water supply and
demand
Existing land use as Agricultural
area should be converted as
urban area in order to
accommodate potential
migration from Bangalore
Urban District.
IndustrialNodeDevelopmentPossibility
Area*3 0 ha 300 ha 686 ha 4,507 ha 7,761 ha 1,132 ha 405 ha 3,387 ha 805 ha
Proposed Plan
Kanchugaranahallikaval industrial area (4,200 ha) in
Ramanagaram sub-district was planned and it will be potential
industrial node for short term development.
Kolar NMIZ (7,000ha) in Kolar
sub-district was planned and it
will be potential industrial node
for short term development.
Vasanthanarasapura industrial
area (600ha) and Tumkur NMIZ
(4,800ha) were planned and it
will be potential industrial node
for short term development.

Final Report – Comprehensive Regional PlanPwC/ Nippon Koei 179
Table 5.4.2: Summary of Potential Sub District and Candidate Industrial Nodes (Tamil Nadu State)
No. ZONE-1 ZONE-10 ZONE-11
Tamil Nadu
District Krishnagiri Kanchipuram Tiruvallur
Sub District Hosur Sriperumbudur Chengalpattu Ponneri
Potential
AssessmentA B B A
Advantage The total population of Zone-12 is around 0.54
million (population census 2011)
The area of forest and water body is limited to less
than 9% of zone.
The total population of Zone-6 is around
1.08 million (population census 2011)
The area of forest and water body is
limited to less than 15% of zone.
Peripheral ring road was planned as
priority project and will contribute to
reduction of the traffic congestion.
It is easy to access both exiting port and
airport of Chennai in future.
The total population of Zone-11 is
around 0.39 million (population
census 2011)
It is possible to formulate an integral
plan with power plant and port
development.
Peripheral ring road has been planned
as a priority project and will
contribute to reduction of the traffic
congestion.
The gap of water balance between
supply and demand is very small.
The area of forest and water body is
limited to less than 10% of zone.
Requirement The area is closely linked to Bengaluru and the
development should be harmonized with
development plan of Karnataka Government.
New or expansion of water supply scheme is
required due to the large gap of water supply and
demand.
The development plan should be harmonized with
existing urban plan.
New or expansion of water supply
scheme is required due to the large gap
of water supply and demand
The development plan should be
harmonized with existing urban plan.
There is some area along coast with a
risk of tsunami.
Existing land use as Agricultural area
should be transferred as urban area to
There is some area along coast with a
risk of tsunami.
The node plan should be harmonized
with existing urban plan of CMA.
Existing land use as Agricultural area
should be transferred as urban area in
order to receive the migration from
Chennai Metropolitan Area.
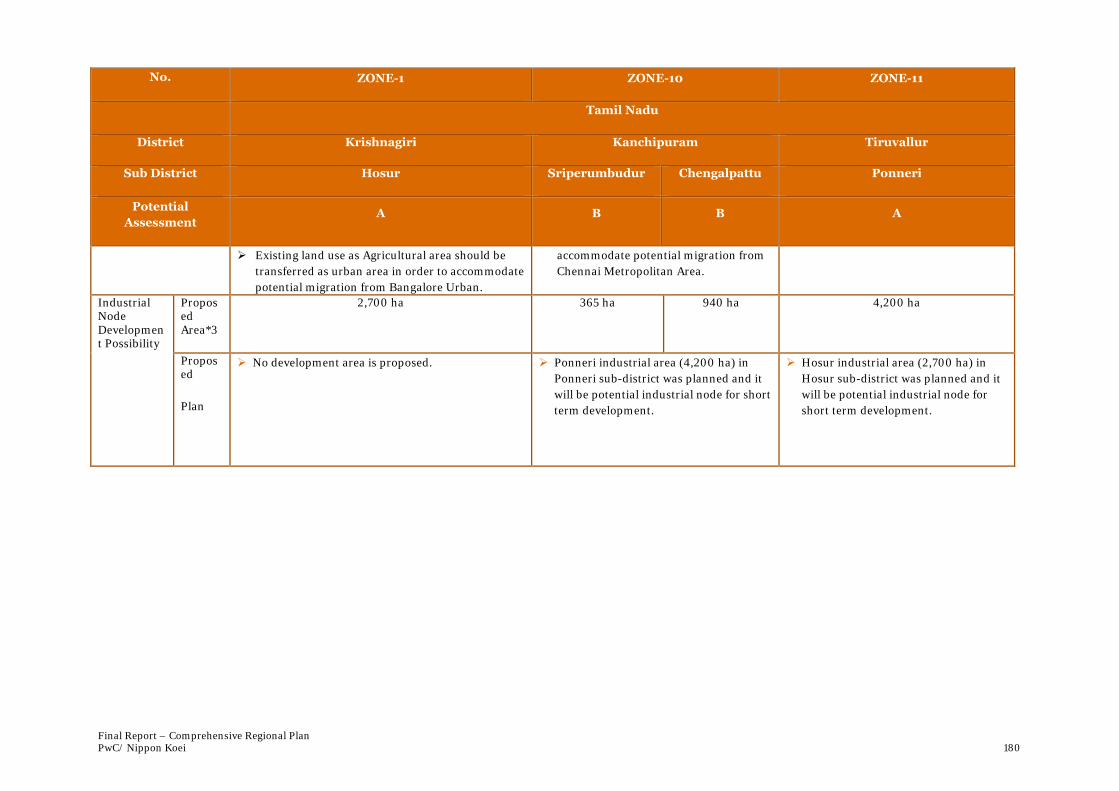
Final Report – Comprehensive Regional PlanPwC/ Nippon Koei 180
No. ZONE-1 ZONE-10 ZONE-11
Tamil Nadu
District Krishnagiri Kanchipuram Tiruvallur
Sub District Hosur Sriperumbudur Chengalpattu Ponneri
Potential
AssessmentA B B A
Existing land use as Agricultural area should be
transferred as urban area in order to accommodate
potential migration from Bangalore Urban.
accommodate potential migration from
Chennai Metropolitan Area.
IndustrialNodeDevelopment Possibility
ProposedArea*3
2,700 ha 365 ha 940 ha 4,200 ha
Proposed
Plan
No development area is proposed. Ponneri industrial area (4,200 ha) in
Ponneri sub-district was planned and it
will be potential industrial node for short
term development.
Hosur industrial area (2,700 ha) in
Hosur sub-district was planned and it
will be potential industrial node for
short term development.

Final Report – Comprehensive Regional PlanPwC/ Nippon Koei 181
Table 5.4.3: Summary of Potential Sub District and Candidate Industrial Nodes (Andhra Pradesh State)
No. ZONE-5 ZONE-7 ZONE-8
State Andhra Pradesh
District Anantapur Nellore Chittoor
Sub District Hindupur Nellore Chillakur Naidupet Kalikiri
Potential
AssessmentA B A B A
Advantage The total population of Zone-9 is around
0.20 million (population census 2011)
The total population of Zone-7 is around
0.76 million (population census 2011)
It is expected to be urban core along coast
in future
There is the traffic flow from Andhra
Pradesh State to Bangalore.
There is priority project for improvement
of NH-5 from Andhra Pradesh State to
Chittoor
The total population of Zone-8 is around 0.05
million (population census 2011)
The area of forest and water body is limited to less
than 5.2% of zone.
The gap of water balance between supply and
demand is very small.
Requirement New or expansion of water supply scheme
is required due to the large gap of water
supply and demand.
It is very far from Bangalore to the
proposed area. Therefore, it is difficult to
commute every day from Bangalore.
The development plan should be
harmonized with existing urban plan.
Existing land use as Agricultural area
should be transferred as urban area in
order to accommodate potential
migration from Bangalore Urban District.
The area of forest and water body is more
than 20 %. Therefore, the development
should avoid such area.
It is very far from Chennai to this site,
and as a result, it is difficult to commute
every day from Chennai.
Tirupati Airport is domestic purpose only.
Existing land use as Agricultural area
should be transferred as urban area in
order to accommodate potential
migration from Chennai District.
The location is not preferable as residential area
for foreign managers, engineers and researchers.
The development plan should be harmonized with
existing urban plan.
Existing land use as Agricultural area should be
transferred as urban area in order to accommodate
potential migration from Chennai District.
IndustrialNode
Proposed
3,756 ha 35 ha 4,047 ha 1,698 ha 5,200 ha

Final Report – Comprehensive Regional PlanPwC/ Nippon Koei 182
No. ZONE-5 ZONE-7 ZONE-8
State Andhra Pradesh
District Anantapur Nellore Chittoor
Sub District Hindupur Nellore Chillakur Naidupet Kalikiri
Potential
AssessmentA B A B A
Development Possibility
Area*3
Proposed
Plan
Hindupur industrial park (3,200 ha) in
Hindupur sub-district was planned and it
will be potential industrial node for short
term development.
Krishnapatnam Port Area Development
(3,100 ha) in Chillakur sub-district was
planned and it will be potential industrial
node for short term development.
Pileru NMIZ (5,200 ha) in Kalikiri sub-district was
planned and it will be potential industrial node for
short term development.
*1: 17 Potential sub districts are selected from 53 sub districts by JICA Study Team’s analysis*2: BMRDA stands for Bangalore Metropolitan Development Authority*3: Total area of government land bank and proposed industrial development area by government or related organization

Final Report – Comprehensive Regional PlanPwC/ Nippon Koei 183
5.5 Regional Structural PlanBased on the priority road projects identified in the CBIC area as well as proposed location ofshortlisted industrial nodes, the regional structure plan was formulated. The following connectivityand linkage were considered and, as a result, the regional structure plan shown in the map below.
i) Existing NH-4, NH-44, NH-7 and NH-4 from Chennai to Chitradurga form the primary corridorin the CBIC Region. The corridor passes through Sira, Tumkur (proposed industrial node),Bengaluru Metropolitan Area, Hosur (proposed industrial node), Walajapet, and Kanchipuramas major cities from Chitradurga to Chennai Metropolitan Area. Accordingly, the connectivityamongst cities and urban cores has been strengthened through the principal corridor.
ii) The urban function of Bengaluru Metropolitan Area should be decentralized due to the rapidurbanization, and accordingly, a part of industrial and settlement area should be reorganizedaround the satellite township ring road to be developed. The satellite township ring road willalso contribute to enhancement of the connectivity and linkage between Tumkur (proposedindustrial node), Ramangara, Kanakapura (proposed industrial node), and Hosur (proposedindustrial node).
iii) In Chennai Metropolitan Area, Peripheral Ring Road should be set-up urgently, since thepopulation and urbanization have been increased rapidly. Satellite townships along the ringroad should also be planned. Ponneri (proposed industrial node) near Ennore port could be oneof the satellite townships.
iv) Four lanes for NH–18A and SH-61 are proposed as the priority road projects. This willcontribute to strengthening the connectivity and linkage between Chittoor, Tirupati, andNaidupet (proposed industrial node). In addition, improvement of SN-99 and NH-205 shouldbe considered in order to enhance the connectivity between Kolar (proposed industrial node),Kalikiri (proposed industrial node) and Tirupati.
v) Improvement of a linkage between Chennai and Bengaluru by highway or high speed railwaycould be considered as one of the priority projects. If so, the connectivity between Kolar(proposed industrial node), Palamaner, and Chittoor could be improved. In addition, thelinkage between Chennai Metropolitan Area and Bengaluru Metropolitan Area will bestrengthened.
It is emphasized that above linkages should be strengthened in parallel with new industrial nodedevelopment to maximise the growth of the economy.
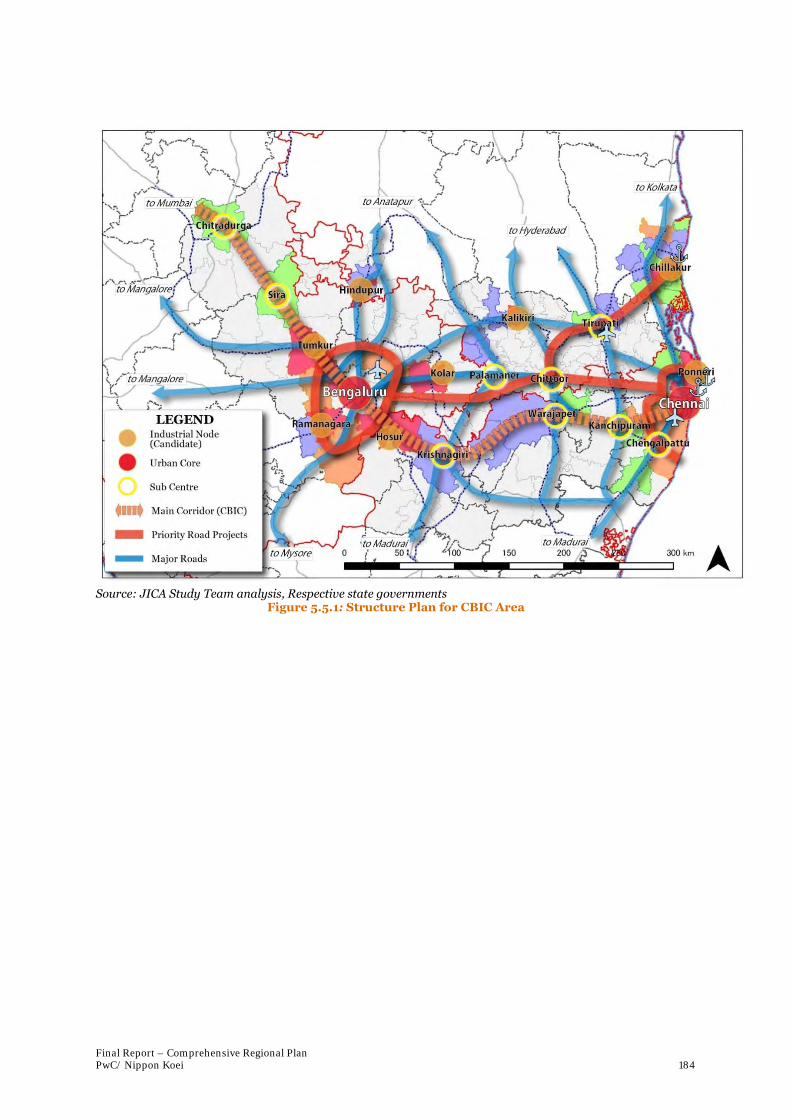
Final Report – Comprehensive Regional PlanPwC/ Nippon Koei 184
Source: JICA Study Team analysis, Respective state governmentsFigure 5.5.1: Structure Plan for CBIC Area

Final Report – Comprehensive Regional PlanPwC/ Nippon Koei 185
5.6 Priority of Shortlisted Industrial Nodes
5.6.1 Status on Land Details of Shortlisted Industrial NodeIn addition to the above analyses, further review on land details, potentials for the linkage withindustries, especially Japanese companies, and the existence of a master plan were conducted in orderto deal with detrimental factors for implementation stage and provide information on the applicabilityto further Japanese support under the next phase.
5.6.1.1 Summary of Land DetailsTo confirm the land condition in shortlisted industrial node, land details were surveyed. Majority ofproposed areas are still in the process of land acquisition, and only land area of Ponneri industrialnode have been procured completely by the government or governmental organization.
If the current land use belongs to the category of greenfield, the land acquisition or land useconversion will be easier than the land under brownfield. In addition, the necessity of resettlement ofexisting habitants was confirmed. From this perspective, it is considered Bidadi integrated townshiphas some difficulty, since this area belongs to brownfield.
In terms of presence of core Japanese companies near the planned areas, only Toyota is located nextto planned area (Bidadi integrated township). Toyota is operating its factory with some Japanese sub-contractors. Accordingly, the development of this area can contribute to existing Japanese companies.
Table 5.6.1: Comparison of Land Details
State Planned AreaArea
(ha)
Status Core
Japanese
Company
Nearby
LandAcquisition
AcquisitionPrice
(USD/sq.m)
LandPrice
Current
Land UseHabitation
TN
PonneriIndustrial Area
4,200100%
acquired-
Fixed byGovt.
GreenfieldNo
habitation
17km fromTOSHIBA
JSW
HosurIndustrial Area
2,700 30% acquired N/A Yet to fix GreenfieldLimited
habitation10km from
NISSAN
KA
BidadiIntegratedTownship
3,700 24% acquired N/A Yet to fixPartially
brownfieldPresence ofsettlement
TOYOTA
Tumkur NIMZ 5,400 27% acquired 27 Yet to fix GreenfieldNo
habitation-
Mulbagal NIMZ 6,900Yet to
acquired2 Yet to fix Greenfield
Nohabitation
50km fromHONDA
AP
HindupurIndustrial Area
3,200Yet to
acquiredN/A Yet to fix N/A N/A -
Chittoor NIMZ 5,200 30% acquired 4 Yet to fix GreenfieldLimited
habitation-
KrishnapatnamIndustrial Area
4,900 42% acquired N/AFixed by
KPCTGreenfield
Nohabitation
60km fromSri City
Note : TN (Tamil Nadu State), KA (Karnataka State), AP (Andhra Pradesh State)
Source : TIDCO, SIPCOT, KIADB, APIIC and JICA Study Team
5.6.1.2 Current ConditionsTamil Nadu State
1. Ponneri Industrial Area
The land of this proposed area is acquired completely by TIDCO and Salt department of Ponneri sub-district office. However, this area is facing the coastal line and it is covered by “Flood Plain” area

Final Report – Comprehensive Regional PlanPwC/ Nippon Koei 186
according to the geomorphology map published by Tiruvallur district office. For this reason, landdevelopment to fill up the site, development of dyke and other equipment investment (e.g. reservoir tocontrol flooding, pumping system) are necessary from viewpoints of foreign investors. Approximate50% of land is identified as disaster risk area from the results of field survey and satellite imageanalysis of rainy season. The ground conditions and the location map are shown as below.
High disaster risk area: the area which is identified flooding/water surface on satelliteimage in the rainy season
Medium disaster risk area: the area neighbouring “High disaster risk area” or the area withwater used land use (paddy field, fish ponds etc.)
Table 5.6.2: Breakdown of Ground Condition
Type of AreaNecessity of
Filling UpArea (ha) Ratio (%)
High Disaster Risk Area Necessary 1700 40
Medium Disaster Risk Area Necessary 300 7
Access Road Not Necessary 300 7
Port Development Area Not Necessary 1,100 26
Other (water bodies andchannel)
Not Necessary 800 19
Total 4,200 100
Source :Google earth Pro and JICA Study TeamFigure 5.6.1: Location of Proposed Area in Ponneri
2. Hosur Industrial Area
This area is separated to 2 areas. The first area which is already acquired completely by SIPCOT is900ha (Phase-3 of Hosur Industrial Area) and it is located 10km from centre of Hosur to East. The
Bay of Bengal
Proposed Area(4,200 ha)
Ennore Port

Final Report – Comprehensive Regional PlanPwC/ Nippon Koei 187
area faces NH-7; good road accessibility is one of the advantages of this area. On the other hand, theother proposed area (1,800 ha) is located in gently hill area in south of Hosur. Distance from Hosurcentre is almost same as Phase-3 of Hosur Industrial Area, the land acquisition hasn’t been started yet.In addition, local corporation of NISSAN (Ashok Leyland Nissan Vehicles Pvt. Ltd.) has a factory inHosur.
Figure 5.6.2: Proposed Area in Hosur
Karnataka State
1. Bidadi Integrated Township
The Bangalore Metropolitan Regional Development Authority (BMRDA) had proposed the project todevelop five integrated satellite townships in 2006 as part of its plan to decongest Bangalore. And“Bidadi Integrated Township” is one of the satellite townships. Regarding to development of this area,although a consortium of DLF Limited (Indian real estate company) and Dubai developer awarded thetender with an investment of Rs. 600 billion in a five-year period in 2007, DLF was later shelved afterthe private firm withdrew from the project amid opposition from farmers to part with their lands. In2011, BMRDA retender and 4 builders (GVK Group, Reliance Infrastructure, Hindustan ConstructionCorporation and Rajesh Exports) bid to do what DLF couldn’t. However, BMRDA is still in the processof Land Acquisition and Rehabilitation and Resettlement Bill (LARB) for this area, the result of tenderhasn’t showed as well. The following conceptual plan was proposed in first tender of DLF.
Proposed Area 1Hosur Industrial Area (phase-3)
(900 ha)
Proposed Area 2(1,800 ha)
City Centre of Hosur
NH-7
to Krishnagiri
toBengaluru

Final Report – Comprehensive Regional PlanPwC/ Nippon Koei 188
Note : Designed by urban design consultant based on CaliforniaSource :Calthorpe Associates HP (http://www.calthorpe.com/bidadi)
Figure 5.6.3: Conceptual Plan of “Bidadi Knowledge City”
One of the big advantages of this area is existence of Japanese companies. TOYOTA Kirloskar MotorPvt. Ltd., TOYOTA Tsusho India Pvt. Ltd. and other related Japanese suppliers are operating theirfactories next to the this proposed area.
2. Tumkur NIMZ
Tumkur National Investment and Manufacturing Zone (NIMZ) is planned for the expansion project ofthe existing industrial park (Vasanthanarasapura Industrial Area). Majority of factories which areoperating in the existing industrial park are Indian companies. In addition, the master plan of thisarea is already planned as shown below.
Source :KIADBFigure 5.6.4: Master Plan of Tumkur NIMZ
Existing industrial parkdeveloped by TOYOTA
NH-7
toSri
toTumkur
Residential Use
Commercial Use
Industrial Use

Final Report – Comprehensive Regional PlanPwC/ Nippon Koei 189
3. Mulbagal NIMZ
Mulbagal NIMZ is located in 10km from Mulbagal centre (Mulbagal is 90km east from Bengaluru).The area is wider (7,000 ha) compared with other proposed areas, but it is considered that there aresome difficulties for the land development of this area. As represented by local stone industry, rocklayer is spread widely in Mulbagal. Therefore, some parts of land in Mulbgal NIMZ are very rocky andneed big initial investment in the phase of land development. The master plan has been planned forthis area.
Source: JICA Study TeamFigure 5.6.5: Current Condition of Mulbagal NIMZ (left : rocky ground, right : access road)
Note : Dark pink highlighted area is the proposed area of Mulbagal NIMZSource :KIADB
Figure 5.6.6: Master Plan of Tumkur NIMZ
Andhra Pradesh
4. Hindupur Industrial Area
Hindupur Industrial Area is scattered to some parcels of land (One of the major industrial area“Gollapuram Industrial Area” is approx. 400 ha), and it is not continuous land.
NH-4
toKolar
toChittoor
City Centre of Mulbagal
Proposed Area(6,900 ha)

Final Report – Comprehensive Regional PlanPwC/ Nippon Koei 190
Source: KIADBFigure 5.6.7: Layout Plan of Gollapuram Industrial Area
5. Chittoor NIMZ
Majority of this area is greenfield currently. As of February in 2014, approx. 30% of land has beenacquired by government and local government. On the other hand, some parts of remaining area isstill utilized as agricultural field in rainy season (ownership belongs to government and only land leaserights are held by local farmers). Although the distance to the nearest airport (Tirupati airport) isabout 60 km, but this area is far from ports. For this reason, it is considered the potential of transportis lower compared with other planned areas.
Note : Pink hatched area is proposed as “Chittoor NIMZ”.Source :Chittoor District Office
Figure 5.6.8: Boundary of Chittoor NIMZ
6. Krishnapatnam Industrial Area
This planned area is located in south of Krishnapatnam port as industrial development of 4,900 ha,and KPCT (Krishnapatnam Port Company Ltd.) already planned the layout plan for this area.Additionally, KPCT has plans to develop plant facilities (power plant, water treatment plant and wastewater plant) near this area, and it is expected to provide stable operational environment for thefactories in the future.
A Part of Proposed Area(400 ha)
NH-4
toTirupati
toMadanapalle
Proposed Area(5,200 ha)
Existing settlements

Final Report – Comprehensive Regional PlanPwC/ Nippon Koei 191
Source :KPCL (Krishnapatnam Port Company Ltd.)Figure 5.6.9: Layout Plan of Krisnapatnam Industrial Area
5.6.1.3 Conformity of the Possibility of Development MasterPlan
As mentioned previously, Tumkur NIMZ and Krishnapatnam have already designed developmentmaster plans by KIADB and KPCT. The status of study of shortlisted node is summarized below:
Table 5.6.3: Conformity to the possibility of developing Master Plan by the Government
State Planned Area Presence of ongoing Master Plan
TNPonneri Industrial Area -
Hosur Industrial Area -
KABidadi Integrated Township -
Tumkur NIMZ Master plan developed by KIADB
Mulbagal NIMZ -
AP
Hindupur Industrial Area -
Chittoor NIMZ -
Krishnapatnam Industrial Area Master plan developed by KPCL
Note : TN (Tamil Nadu State), KA (Karnataka State), AP (Andhra Pradesh State)
5.6.1.4 Location of the Core Japanese CompaniesIn CBIC area, the factories which are operated by major Japanese companies are located in 30 to50km radius from centre of 2 metropolitan areas (Chennai and Bengaluru) so far. According to theinterview / survey held with the Japanese companies, development conditions of plant facilities,accessibility to the metropolitans and gateways are key factors of site selection. The following figureshows locations of major Japanese factories in CBIC.
Proposed Area(4,900 ha)

Final Report – Comprehensive Regional PlanPwC/ Nippon Koei 192
Note : Numbers on the red circles (Industrial park with Japanese companies) are linking to “No.” in Table asbelow.Source :JETRO and JICA Study Team
Figure 5.6.10: Location of the Core Japanese Companies in CBIC
Table 5.6.4: List of the Core Japanese Companies in CBIC
No. State Name of Industrial
Park
Name of Japanese Major Companies
1 TN Gummidipoondi MITSUBA SICAL India Ltd.
2 TN IrungattukottaiThe Indo Asahi Glass Co.,Ltd. / Aloka Trivitron Medical TechnologiesPvt. Ltd.
3 TN SriperumbudurNICHIAS Industrial Products Pvt. Ltd. / JTEKT SONA AutomotiveIndia Ltd.
4 TN OragadamNissan Motor India Pvt. Ltd. /Komatsu India Pvt. Ltd. / NSK-ABC Bearings Ltd. etc
5 TN Mahindra World City Fujitec India Pvt. Ltd / JSP Foam India Pvt. Ltd. etc
6 TN Vallam Vadagal India Yamaha Motor Pvt. Ltd. etc
7 TN Hosur Ashok Leyland Nissan Vehicles Pvt. Ltd.
8 KA BidadiToyota Kirloskar Motor Pvt. Ltd. / TOYOTA Tsusho India Pvt.Ltd. etc
11
8 97
10
2-6
113
12

Final Report – Comprehensive Regional PlanPwC/ Nippon Koei 193
9 KA Electronics CityAisin Automotive Karnataka Pvt. Ltd. / FANUC India Pvt. Ltd. /Yokogawa India Ltd. etc
10 KA Narsapur Honda Cars India Ltd. / Bando India Pvt. Ltd.
11 KA Doddaballapura Musashi Auto Parts India Pvt. Ltd.
12 KA Harohalli TOKAI Rubber Auto-parts India Pvt. Ltd.
13 AP Sri cityIsuzu Motors India Pvt. Ltd. / Kobelco ConstructionEquipment India Pvt. Ltd. / NHK Spring India Limited, etc
Note : TN (Tamil Nadu State), KA (Karnataka State), AP (Andhra Pradesh State)
Major Automobile Companies and heavy machinery companies are highlighted
Source : JETRO, Sri city and JICA Study Team
5.6.1.5 Prospects of Investment from Japanese CompaniesIndustry accumulation which formulates an industry cluster will promote technical progress andinnovation, the essential inputs for economic development. It is expected that the potential ofindustry accumulation will be one of the important factors which affect investments from privatecompanies. An industry cluster could be categorized in several types based on the nature of its origin,such as an industrial cluster formulated: (i) by a core company with related companies in its valuechain; (ii) due to the availability of skilled laborers/technologies at the region, which results inindustry accumulation including small and medium sized enterprises; and (iii) by the presence ofparticular material/products critical to the industry.
For the analyses of industry potential under (ii) above, top four manufacturing industries for whichJapan has provided FDI most for the past 9 years were selected and the presence of these industries atthe target location were analysed by a district level. The top four industries are: (a)chemical/pharmaceutical; (b) auto/transport machinery; (c) electrical machinery; and (d) food. Thestandard deviation was calculated among potential zones to see above the average or below theaverage for each State.
5.6.1.6 Priority of Shortlisted Industrial Nodes for FurtherStudy
According to the information as previously mentioned, additional information of eight shortlistednodes were provided to JICA and three nodes are recommended for the master plan and developmentplan study to be implemented under Part B.
Based on the information, Ponneri industrial area from Tamil Nadu state, Tumkur NIMZ fromKarnataka state and Krishnapatnam industrial area from Andhra Pradesh state will have high priorityfor the further study. The reasons for the recommendations aresummarized below.
Tamil Nadu state: Ponneri industrial areaAlthough Ponneri industrial area has superiority as an industrial node 1) in direct accessibility toKattupalli port to ensure smooth transportation, and 2) the area is located close to the Bay of Bengaland the development projects for two desalination plants(total capacily is 160 MLD) are planed. Onthe other hand, land filling to protect this area from probable flood is necessary to attract foreigninvestors. 3) Commutable from Chennai, which suggesting high potential to attract foreign factoriessince urban life can make it easier for foreign people to work and live. The area of 4,200 ha, further, isowned by Government, suggesting development procedure will be smoother when it comes to landacquisition, which is possibly one of the biggest obstacles to develop areas.
Karnataka state: Tumkur NIMZTumkur NIMZ has the highest advantage in accessibility to regional trunk road as well as access toNH-7, which stretches between Bangalore and Chitradurga through Tumkur NIMZ. This area hasmore government land than Bidadi, another potential area. In addition, the area has an existing

Final Report – Comprehensive Regional PlanPwC/ Nippon Koei 194
industrial park (Vasantha Narasapura Phase1-3), and one Japanese consortium is planning to developthe factory in the area. The surrounding area is planned to expand with the Tumkur NIMZ masterplan, it is in the phase of notification for the land acquisition as of May 2014. In the view of short termdevelopment, this is the highest potential industrial node in Karnataka state.
Andhra Pradesh state: Krishnapatnam industrial areaKrishnapatnam Industrial Area has higher potential than the two other candidate nodes in the state interms of railway accessibility, future power plant and water treatment plant development, cheaperland prices and large scale port development. In addition, companies in Sri City are also are alsoexpected to benefit from the development of Krishnapatnam Industrial Area as a node.

Final Report – Comprehensive Regional PlanPwC/ Nippon Koei 195
6 Strategies for InfrastructureDevelopment
Infrastructure plays a critical role to achieve the objectives of the corridor detailed in the previoussection,. Availability and affordability of adequate infrastructure is a necessary element to enabledevelopment of industrial sector.
The infrastructure needs and criticality differ from sector to sector. For some sectors, power plays akey role, for some road and port connectivity play and key role and for others availability of water iscritical. A snapshot of relative importance of infrastructure components for key sectors is as shown inthe figure below.
In order to ensure achieve the industrial vision of the corridor, it would be essential to have a wellthought and planned infrastructure strategy. A multi pronged approach would be needed to addressthe infrastructure needs of the corridor.
Infrastructure strategy of the corridor has been framed to address the needs of the sectors.Infrastructure elements included in the strategy are transport, town planning and industrialdevelopment and water and solid waste management.
Industries Water PowerRoad and railconnectivity
Ports Airports
Food processing 5 6 5 6 1Textiles and Apparels 4 5 5 4 5Machinery and Electrical Machinery 6 5 5 5 1Pharmaceuticals 4 4 5 5 5Automobiles 5 4 4 5 1Computer, electronics and optical products
(CEO) 1 4 5 6 6
1 Low 6 Medium 5 High 4 Critical
Infrastructurestrategy
Transport
Roads RailwayUrban
transportPorts Airpors Logistics
Townplanning and
industrialdevelopment
PowerWater andsolid waste
management

Final Report – Comprehensive Regional PlanPwC/ Nippon Koei 196
6.1 Transport InfrastructureThe Global Competitiveness Report 2013-14 by the World Economic Forum assesses quality ofinfrastructure (including roads, railroads, ports and air transport infrastructure) as one of manydifferent components measuring different aspects of competitiveness.
On a scale of 1-7, following is India’s score against competing countries for manufacturing sectorinvestment.
India China Thailand Korea
Quality of roads 3.6 4.5 5.0 5.8
Quality of railroad infrastructure 4.8 4.4 2.6 5.6
Quality of port infrastructure 4.2 4.5 4.6 5.5
Quality of air transport infrastructure 4.8 4.5 5.7 5.2
India’s score against competing countries is relatively low for road and port infrastructure and thecountry’s railroad and air transport infrastructure are relatively close to competing countriesstandards. The corridor also experiences limitations and transport issues similar to those faced by thenation. The issues faced by the corridor are multi fold ranging from insufficient infrastructure, poorlast mile connectivity and cumbersome procedures.
Figure 6.1.1: Time taken in movement of Export and Import containers between Chennai Port andBidadi Industrial Area
*The time of 2-3 days outside the port gate at Chennai Port is the average time spent by trailers waiting outsidethe port gate. This is due to several reasons including incomplete documentation on part of the truck drivers,possible evacuation issues out of the port etc. (Source: Stakeholder interactions at Chennai and Bangalore)
Good connectivity is one of the biggest contributors for efficient port operations since limitations inland-side evacuation for a port can severely handicap the port performance. During our interactionswith key stakeholders in the Corridor region, many of the stakeholders cited challenges in portconnectivity as one of the major bottlenecks with transportation of import containers from Chennaiport to Bidadi industrial area taking an average time of around four and half days and transportation

Final Report – Comprehensive Regional PlanPwC/ Nippon Koei 197
of export containers from Bidadi industrial area to the vessel at Chennai Port taking an average of alittle over four days. The tables below and the transport chain shown on the previous page depict theaverage time taken for movement of import and export containers from and to the Chennai port:
FOR IMPORT CONTAINERS
Table 6.1.1: Activity - Time chart for transportation of Import Containers from Chennai Port toBidadi
Sr.No.
Activity Average timetaken
Status ofcontainer aftercompletion ofactivity
1.Unloading of container from vessel 0.5 - 1 day At Berth
2.Customs & documentation and exitfrom Port gate
1 – 1.5 days At exit gate ofChennai Port
3.Exit from port gate and arrival atCFS
4 – 6 hrs CFS at Thiruvottiyur
4.Completion of CFS processes,customs procedures (if required)and assignment to destination
1.5– 2 days Container ready toexit CFS
5.Exit from CFS and travel to Chennaicity outskirts
6 – 8 hrs At Chennai cityoutskirts
6.Transit on Highway (NH-4) fromChennai city outskirts to arrival atoutskirts of Bengaluru
8 – 10 hrs At Bengaluru cityoutskirts
7.Transit from Bengaluru outskirts toBidadi
4 - 6 hrs Destination at Bidadi
TOTAL TIME TAKEN Around 4 days – 6 days
Source: Primary research
FOR EXPORT CONTAINERS:
Table 6.1.2: Activity - Time chart for transportation of Export Containers from Bidadi to ChennaiPort
Sr.No.
Activity Average timetaken
Status ofcontainer aftercompletion ofactivity
1.Transit from Bidadi to Bengaluruoutskirts
4 – 6 hrs Bengaluru outskirts
2.Transit on Highway (NH-4) fromBengaluru city outskirts to arrivalat Chennai outskirts
8 – 10 hrs Chennai Outskirts
3.From Chennai outskirts toContainer Freight Station (CFS)at Thiruvottiyur
6 – 8 hrs CFS atThiruvottiyur
4.Completion of customsprocedures and other activities atCFS
1.5 – 2 days Exit from CFS
5.From CFS to reaching theChennai Port Entry gate
2 - 3 days Port Entry gate
6.Time taken for entry at Port gateup to loading on to the vessel
6 - 12 hours Export containerloaded on the vessel
TOTAL TIME TAKEN 4 days 12 hours – more than 6 days12 hours
Source: Primary research
An importcontainerspends morethan 3.5 daysreaching theoutskirts ofChennai afterunloadingfrom vessel atChennai Port
An exportcontainer spendsmore than 3.5days reachingfrom the Chennaicity outskirts tothe vessel ofwhich 2 – 3 daysare spent waitingin the queueoutside entry gateat Chennai Port.

Final Report – Comprehensive Regional PlanPwC/ Nippon Koei 198
The key issues of the corridor are:
Lack of sufficient ring roads to divert freight traffic away from the cities
Poor last mile connectivity resulting in severe evacuation challenges at ports
Lengthy & cumbersome customs procedures
High volume capacity ratio in certain important road sections across the corridor
Heavy road based transport (~80-85%) compared to rail
The proposed road and rail connectivity projects which are planned to enhance capacity evacuation atthe ports in the CBIC region shall also contribute to further improvement in the port performanceparameters. The transport strategy of the corridor aims at addressing the issues and challenges acrossall transport sectors including port, roads, rail, urban transport, airport and logistics. Strategy acrossall the segments has been the detailed out in section 6.2 to 6.8.

Final Report – Comprehensive Regional PlanPwC/ Nippon Koei 199
6.2 Ports
6.2.1 Sector overviewPorts function as the gateways for movement of raw material and finished goods through the corridorregion. The six ports (four existing ports and the two proposed ports) are likely to be these maingateways for the proposed Chennai Bengaluru Industrial Corridor. These ports include the majorports of Chennai and Ennore in Tamil Nadu as well as the non-major ports of Kattupalli Port in TamilNadu and Krishnapatnam Port in Andhra Pradesh. Additionally, a green-field major port atDurgarajapatnam in Andhra Pradesh and a captive non-major port at Cheyyur in Tamil Nadu havealso been planned.
Chennai Port is one of the largest ports in India and handles cargo such as containers, crude, POL,fertilizer, fertilizer raw material, edible oil, general cargo etc. in large volumes. During 2012-13,Chennai Port handled a total cargo of around 53.40 MTPA vis-a-vis 55.70 MTPA in 2011-12. The mainreason for the decrease in traffic at Chennai port can be attributed to the reduction in the importtraffic which mainly used to comprise of coal, iron ore and containers. Till recently, large quantities ofdry bulk cargo (i.e. coal and iron ore) were being handled at Chennai Port. However, handling of suchcargo was stopped due to the ban imposed in October 2011 by the Madras High Court on handlingdusty cargo at the port. This resulted in traffic of commodities such as coal and iron ore to shift toEnnore Port. Ennore Port Limited, which is the only corporatized major port in India, was originallydeveloped as a satellite port to the port of Chennai is expected to benefit due to the ban imposed onhandling dirty cargo at Chennai Port. The total traffic at Ennore Port increased from around 14.96MTPA in 2011-12 to around 17.89 MTPA in 2012-13. The major contribution to the increased porttraffic at Ennore was the increase in imports of dirty cargo at the port.
The other existing port located within the CBIC region in the state of Tamil Nadu is the Kattupalli Portat the Kattupalli Shipyard which was built as a joint venture between L&T and TIDCO. Kattupalli portcurrently has two berths for container traffic and started operations in 2012-13. The other existingnon-major port in the CBIC region is located at Krishnapatnam in the state of Andhra Pradesh andthis port handles a large variety of cargo including coal, containers, edible oil, fertilizers and projectcargo. The following table provides information on the existing commodity-wise capacities at each ofthe four ports discussed above.
(Capacity in MTPA)
Table 6.2.1: Commodity-wise capacity at the four existing ports in the CBIC region
COMMODITY ->
PORT
IronOre
Coal(Thermal)
POL Fertilizers Gen /BreakBulk
Cargo
Containers TOTALCAPACITY
CHENNAI PORT 8.0 - 17.67 - 17.92 42.00 85.59ENNORE PORT 6.0 21.0 3.0 - 1.0 - 31.0
KATTUPALLI PORT - - - - - 22.92 22.92KRISHNAPATNAMPORT
52.08 22.92 75.00
Total cargo handling capacity at existing four ports in the CBIC region 214.51
Source: IPA 2012-13 data; websites of respective ports
The following table provides an overview of the major commodity types handled at each port forexport and import:
Table 6.2.2: Major import & export commodities handled at the four existing ports in CBIC region
Port Export ImportCHENNAI PORT Containers, Food grains
(Whear & Others), POL(Product), Other ores, Sugar,Cement, Other Dry Bulk andBreak Bulk
Containers, POL (Crude &Product), Edible Oil, OtherLiquid, Iron Ore (Pellets),Fertilizers & Fertilizer RawMaterials, Sugar, Other Break

Final Report – Comprehensive Regional PlanPwC/ Nippon Koei 200
Port Export ImportBulk & Dry Bulk Cargo
ENNORE PORT Break Bulk Cargo, Cars Thermal Coal, Coking Coal,POL (Product & LPG), OtherLiquid Cargo, Break Bulk cargo
KATTUPALLI PORT Containers Containers
KRISHNAPATNAM PORT Containers, Barytes, Granite,Food grains (Rice, Wheat,Maize etc.), Other break bulkcargo
Containers, Thermal Coal,Coking Coal, Edible Oil,Gypsum, Project Cargo, Sugar,Other Break Bulk cargo
These ports serve the primary hinterland of northern Tamil Nadu, south and central Andhra Pradeshand south-east and central Karnataka. The diagram shown below depicts the combined primaryhinterland of these four existing ports. Among the four ports in the CBIC region, Chennai accountsfor more than 66% of all container traffic in the 1500 km coastline between Turicorin andVishakhapatnam. In addition to this, among the four existing ports in the CBIC region, Chennai Portaccounts for more than 95% of all traffic among the operational ports (others being Kattupalli andKrishnapatnam). A container terminal at Ennore has been proposed and expected to be built over thenext 5-6 years. Also, Krishnapatnam & Kattupalli are also expected to significantly enhance theircontainer handling capacity in the next 10 years.
Figure 6.2.1: Combined primary hinterland for containertraffic of the Chennai, Ennore, Kattupalli and KrishnapatnamPorts

Final Report – Comprehensive Regional PlanPwC/ Nippon Koei 201
Figure 6.2.2: Primary hinterland for Coal traffic handled at Ennore& Krishnapatnam ports
Figure 6.2.3: Primary hinterland for Break Bulk Traffic atthe existing ports in the CBIC region

Final Report – Comprehensive Regional PlanPwC/ Nippon Koei 202
While the non-major ports of Krishnapatnam and Kattupalli have become recently operational, thecargo handling capabilities at the older ports of Chennai and Ennore are severely handicapped due tothe challenges in land-side evacuation facilities at these two ports. As discussed in detail in theInterim Report 1 for this Study, the high vessel turnaround times and the pre-berthing detention timeat the two major ports are mainly a result of the bottlenecks and inefficiencies in the port operationsand landside evacuation facilities. A comparison of the key performance indicators: pre-berthingdetention time and the turnaround time are depicted in the graph below:
The average pre-berthing time per vessel for Chennai Port was around 27 hours during 2011-12 whilethe average pre-berthing detention time on port account at Chennai port was 0.9 hours for the sameperiod. Similarly, the total pre-berthing detention time per vessel for Ennore Port was around 18hours with around 0.02 hours due to port account. The average turnaround time at Chennai andEnnore Ports was around 93 hours and 52 hours while the turnaround time on port account at thetwo ports was 52 hours and 1.9 hours respectively as per the IPA data for 2011-12.
As per IPA 2012-13 data, the Chennai Port witnessed an improvement in pre-berthing detention timewith the average pre-berthing detention time at Chennai Port being around 19.1 hours while on portaccount the pre-berthing detention time was 0.8 hours. However, for Kamarajar Port during 2012-13,the average pre-berthing detention time increased to a total of 31.9 hours while on port account thepre-berthing detention time increased to 0.05 hours. As per the IPA 2012-13 data, the average pre-berthing time at the Chennai Port also witnessed an improvement over 2011-12. The total averageturn-around time at Chennai port was around 77.7 hours while on port account it was 46.3 hours.Similarly, in 2012-13 the average turnaround time at Kamarajar Port was 70.8 hours while on portaccount the average turn-around time was around 2.2 hours only. The Ministry of Shipping hasissued instructions to the major ports in India to consider upgradation of the equipment at the portsas per their business and operational requirements. The Chennai Port Trust has initiated relevantsteps in this direction and the port performance parameters are expected to further improve after thecompletion of the equipment modernization process.
151
136
125.
118
93
87
59
52.
43
36
29
18
11
10
6
88
68.
41
16
27
61
31
18.
25
0*
0*
0*
0*
0*
0*
Paradip
Vishakhapatnam
Mumbai
Kolkata
Chennai
Haldia
JNPT
Ennore
Cochin
Rotterdam
Port of Los Angeles
Krishnapatnam
Colombo
Singapore
Port of Hong Kong
Port Performance Indicators (2012)
Pre-berthing Detention time (hours) Turnaround Time (hours)
Port performance efficiency parameters - Turn Around Time & Pre-berthing Detention time
* Almost negligible pre-berthing detention time(Source: Indian Ports Association data 2011-12, websites of respective ports, secondary research)
Figure 6.2.4: Port performance efficiency parameters - Turn Around Time & Pre-berthingDetention time

Final Report – Comprehensive Regional PlanPwC/ Nippon Koei 203
Commodities handled at the ports in CBIC region:
The major commodities handled at the ports in the CBIC region include coal (thermal & coking coal),iron ore and other ores, crude and POL products, containers, fertilizers/ FRM, food grains, otherbreak bulk and cars.
Iron ore
India contributes to more than 7% production and stands fourth in terms of quantity producedfollowing China, Brazil and Australia. Orissa, Chhattisgarh, Karnataka and Goa are the major iron oreproducing states in India with around 22.7% of total production coming from captive mines and restfrom merchant mines. Iron ore production in the form of lumps, fines and concentrates was at 167million tonnes in the year 2011-12 showing a decrease of about 19% compared to that preceding year.This was mainly because of the suspension of mining operations in Karnataka due to the order of theSupreme Court of India.
While the fines are converted into sinters for use by steel plants and the concentrates and fines arealso converted into pellets. These are exported and are also utilized by sponge iron units. Exports aremainly to China (93%), Japan (4%) and Korea (2%). The pellets are used as feed in blast furnace.Pelletisation is being seen as an increasing trend as it is advantageous in production activities since itprovides a uniform size, known composition and strength to the ore.
However, the recent ban on mining has resulted in a stoppage of iron ore exports from India. This banwas mainly enacted to stop the illegal mining and also to protect the environment. Additionally, theincrease in the export duty from 5% (2009) to 30% further affected the exports of iron ore. The ban onexports of iron ore started in 2011 and this ban in Karnataka, Goa and Orissa led to huge shortage ofiron ore in the country. India also recently started importing pellets and lumps. Recently, some gradeA mines (around 16 out of 115 mines ) have resumed operations in Karnatakata however, in view of thecontinuing ban on iron ore exports and the heavy export duty, the export of iron ore from ports inIndia is expected to be nil for the next 5 years.
The ports which export iron ore from India are Calcutta, Paradip, Kakinada, Ennore, Chennai, NewMangalore and Goa. Due to the recent ban on iron ore exports, the Marmagoa port is the mostaffected followed by Chennai, Ennore and Paradip ports. Moreover, India exported iron ore in the spotmarket and thus was impacted by the volatility in the international spot markets. Ennore Port hadrecently entered into a BOT agreement for an iron ore terminal of 6MT with SICAL. AlsoKrishnapatnam port which was basically built to handle iron ore and coal has now startedconcentrating on coal handling only.
Coal
India produces various grades of coal, which are used for different applications but the coal in India islow in sulphur content, low on calorific value and high in fly ash content. Most of the power plantswhich are planned to use domestic coal are recommended to blend with imported coal to compensateindigenous coal supply shortage. (CEA 2012). The primary sources of imported thermal coal areIndonesia, Australia and South Africa and Coal is shipped through Panamax or capesize vessels whichneed deep drafts. Procurement of imported coal is done through long term agreements which aresettled annually by the Empowered Joint Committee (EJC). Ennore Port is taken as a satellite port toChennai Port handling thermal coal requirement of TNEB. Also coal traffic forms around 70% of thetotal cargo handled at Krisnapatnam port, which is one of the deepest ports in India.
Containers
The container cargo in India witnessed around 13% CAGR growth since 2001 with the highest growthbeing witnessed in the ports on the western shore of India. The graph depicts the region-wise growthin container traffic. The percentage share of containers has remained almost the same since 2001 forthe ports in the eastern shore, western shore and the southern ports in India. The percentage share ofcontainers in 2012 was around 8%, 68% and 24% respectively for the east coast ports, north west

Final Report – Comprehensive Regional PlanPwC/ Nippon Koei 204
ports and the ports in south India. Historically, the west coast ports have witnessed the highest shareof container cargo followed by the ports in south India.
Crude and POL products
India remains a net importer of crude to meet its domestic requirements with around 80% of thecrude requirements being imported while the POL products are both imported and exported. Eventhough refinery capacity in India has grown at a CAGR of over 8%, the demand off-take has resulted inhigh utilization rates of these refineries. The domestic crude oil production only accounts for about20% of crude oil requirement of existing 213 mtpa refining capacity while rest has to be met throughimports. Ports in the CBIC region as well as ports at other locations in India handle imported crudeand POL movement as well as the coastal movement within the country.
Break bulk
The break bulk traffic at the ports includes commodities such as food grains, fertilizers/ FRM, cement,newsprint, and also cars. While certain commodities such as fertilizers / FRM are mainly importedinto the country, certain commodities such as cars are exported. India’s fertilizer consumption isexpected to increase from 57 million tons to about 68 million tons and the domestic capacity additionsin the sector are expected to supply only about 39 million tons of these requirements by 2018. In thelong run, the recent urea policy may attract investments and thus reduce potential of urea imports;however these capacity additions are expected to take at least 4-5 years to come on stream.
Chennai port recently had an interaction with few of the importers and logistics players for theimprovement in the fertilizers import numbers. The stakeholders in the interaction pointed fewdrawbacks which are showing downward trend in imports such as restricted movement of fertilizerproducts from port premises via road transport, non-availability of more rakes from railways frommoving out, crane utilization and slow discharge rates.
Historical traffic scenario summary
The port traffic volume data from 2008-2013 has been utilized for the purpose of future
traffic projections. The table below shows the total traffic volume data for the Major Ports in
India as well as for Chennai Port, Ennore Port, Kattupalli Port and Krishnapatnam Port.
Figure 6.2.5: Growth in container traffic acrossports in India

Final Report – Comprehensive Regional PlanPwC/ Nippon Koei 205
Table: Traffic Volume data for All India Major Ports and Ports at Chennai, Ennore, Katupalli andKrishnapatnam
Total traffic (in '000Tonnes)
FinancialYears
AllIndiaMajorPorts
Year-on-YearChange(%)
Chennai
Year-on-YearChange(%)
Ennore
Year-on-YearChange(%)
Kattupalli
Year-on-YearChange(%)
Krishnapatnam
Year-on-YearChange(%)
2004 344799 36710 9277 - - - -
2005 383625 11.3% 43806
19.3% 9480 2.2% - - - -
2006 423407 10.4% 47248 7.9% 9168 -3.3% - - - -
2007 463782 9.5% 53414 13.1% 10714 16.9% - - - -
2008 519314 12.0% 57154 7.0% 11563 7.9% - - - -
2009 530533 2.2% 57491 0.6% 11500 -0.5% - - 8211 -
2010 561090 5.8% 61057 6.2% 10703 -6.9% - - 16107 96.2%
2011 570032 1.6% 61460 0.7% 11009 2.9% - - 15919 -1.2%
2012 560137 -1.7% 55707 -9.4% 14956 35.9% 10 - 15418 -3.1%
2013 545790 -2.6% 53404 -4.1% 17885 19.6% 12 20.0% 21236 37.7%
(Krishnapatnam Port initiated its commercial operations in 2009 and Kattupalli Port started
commercial operations in 2012)
CAGR of trafficvolume
All India MajorPorts
Chennai Port EnnorePort
From 2004 to 2013 5.2% 4.3% 7.6%
From 2004 to 2008 10.8% 11.7% 5.7%
From 2008 to 2013 1.3% -1.7% 11.5%
The pre-Lehman collapse period (i.e. pre-2008) witnessed a strong year-on-year percentage
increase in the port traffic volumes for the all India major ports as well as the ports at
Chennai and Ennore. The post-Lehman period (i.e. 2008 and after) presents a more realistic
scenario of the traffic volumes at the ports considering the latest status. Also the CAGR
growth rate for all India ports from 2004 – 2008 was around 10.8% while post 2008 the
CAGR has been only around 1.3%. Ennore Port traffic has witnessed a sudden surge in the
recent years mainly due to the ban on handling of dirty cargo at the Chennai Port and the
movement of this dirty cargo traffic from Chennai Port to Ennore Port.
During the course of our traffic projections for the major commodity categories, while we
have considered the historical commodity-wise port traffic in the region, we have also
considered the specific economic factors impacting each commodity type. Thus, the traffic
projections have been derived after considering various factors impacting the commodity-
specific traffic at the ports in the region.

Final Report – Comprehensive Regional PlanPwC/ Nippon Koei 206
6.2.2Demand forecastIn order to forecast the traffic potential at the ports in the CBIC region over the next 20 years, analysis has beenconducted for the historic cargo trends and its relationship with various factors that may influence the demandfor the particular commodity. The future traffic projections have been done for the following broad category ofcommodities:
Containers Dry Bulk
o Coal (Thermal coal, coking coal and other coal)o Iron Ore and other ores
Break bulko Break Bulk including food-grains, fertilizers, fertilizer raw materials and other miscellaneous
break bulk (excluding cars)o Cars
POL (Crude and POL products)
These commodity-wise traffic projections have been computed for the Business-As-Usual (BAU) scenario aswell as for the Business-Induced-Scenario (BIS) including the impact of the CBIC development. The sectionsbelow briefly discuss the methodology followed for projecting commodity-wise traffic:
Methodology for projecting commodity-wise port traffic for the Business-As-Usual (BAU)Scenario
Traffic projections for Containers:
Container traffic in India has a very high degree of correlation with the manufacturing component of GDP of thecountry. Thus, for the purpose of projecting container traffic at ports in the CBIC region, a regression has beendone for the container traffic at the ports in the CBIC region and the manufacturing component of the GrossDistrict Domestic Product of the districts located in the influence zone of the corridor region to arrive at thefuture growth rates. Thereafter, these growth rates are applied to the container traffic witnessed at the ports inthe corridor region to forecast the future traffic projections for container traffic in the region.
Traffic projections for Dry Bulk:
For the purpose of projecting future traffic, dry bulk is classified into two broad categories i.e. Coal (Thermalcoal, Coking coal and other coal) and Iron ore and other ores.
Thermal Coal:
Estimation of coal required for power generation in the future, in the states of Andhra Pradesh, Karnataka andTamil Nadu, has been done by segregating the requirement into three parts.
1. Coal requirement for existing power plants
The power generation from the existing capacity has been estimated, keeping in mind the life of each existingplant. Some of the existing plants have been retired post expiry of their economic life (typically 40 years). Thetotal coal requirement has been calculated for the total generation, out of which it has been assumed that only15% of the coal would be imported and 50% of the domestic coal would be transported through the coastalshipping route. These plants have then been mapped district wise to arrive at the port wise coal demand.

Final Report – Comprehensive Regional PlanPwC/ Nippon Koei 207
2. Coal requirement for new power plants
a. Already planned and to be implemented by FY 2021
The generation for future capacity additions has been estimated considering a 90% Plant Load Factor (PLF).The coal required for generating these units has then been calculated based on the average GHR and GCV.Since it is expected that most of the new capacity additions would be based on imported coal, the ratio ofimported coal has been taken as 60% in the short term and gradually increased to 100% in the long term.Further, 50% of the domestic coal required has been assumed to be shipped along the coast. This requirementhas then been mapped as per the source district of the power plant.
b. Unplanned but expected after FY 2021
Addition to generation capacity post FY 2021 has been done on a normative basis, taking a historical growth incapacity. Apart from this, coal based power plants have also been suggested to meet any supply shortfalls. Thetotal coal requirement for these power plants has been estimated in the same way as in the previous case.However, as these projects have still not been planned, the district wise break-up of coal requirement is notavailable and only their total requirement at the port can be estimated. Having said that, it is pertinent to notethat most of these plants would be coastal power plants and therefore located in close proximity to the ports.
From the above coal requirement estimated for the states of Tamil Nadu, Andhra Pradesh and Karnataka, thecoal requirement for the existing power plants serviced and the proposed power plants planned to be servicedby the ports in the CBIC region was calculated.
Iron Ore and other ores
In the past, iron ore traffic at the ports used to form a considerable part of the total port traffic in the region.However, the recent ban by the Government of India on the export of iron ore as well as the stoppage ofhandling iron ore traffic at Chennai port has dealt a double blow to the iron ore traffic at the ports in the region.Some ports like Ennore port had recently developed iron ore handling terminals (of 6 MTPA capacity) in 2012with the aim of catering to the increasing iron ore traffic at the ports. As discussed in detail in the previoussection and due to the recent developments, historical CAGR of iron ore traffic at the ports in the region isaround -56.56% while the projected growth rates as per the Maritime Agenda 2010-2020 is around 11.56%.However, for the traffic projections for the BAU scenario, we assume that the ban on export of iron-ore is likelyto continue up to 2018 and the iron ore exports are likely to resume from FY 2019 only. The iron ore traffic atthe ports is likely to grow at 2% p.a. for the first three years and thereafter increase by 1% after every three yearsand attain a maximum of 4% p.a. up to 2034. The table below depicts the growth rates assumed for iron oretraffic at the ports in CBIC region.
Table 6.2.3: Growth rates for forecasting iron ore traffic at ports in CBIC region
Up to 2018 2019-2021 2022-2024 2025-2034Yearly growth ratesassumption for Iron Oretraffic at ports in CBICregion
0%(Ban on iron ore
export to continue)
2% 3% 4%
However, the other ores and other dry bulk traffic which includes commodities like limestone etc. are likely tocontinue. Thus, the historical growth rate of 4.41% has been adopted to project the future traffic for other oresand other dry bulk at the ports.
Traffic projections for Break Bulk
The break bulk traffic has been classified into two broad categories (i) Break Bulk including Food-grains,Fertilizers, FRM and other break bulk excluding Cars and (ii) Cars. The historical CAGR over the last 5 yearswas computed for each of the commodities and comparison was made with the growth rates as per theMaritime Agenda. The following table provides information on the past CAGR as well as the proposed growthrates for each of these commodities:

Final Report – Comprehensive Regional PlanPwC/ Nippon Koei 208
Table 6.2.4: Comparison of historical CAGR witnessed and projected growth rates as per Maritime Agenda
Commodity Historical Growth Rates (%)(Last 5 yrs) (from IPA trafficdata)
Maritime Agenda 2010-2020Projected Growth Rates (%)
Fertilizers & FRM -11.8% 5.1%
Food-grains 69.6% 4.4%
Misc. Break Bulk (excld. Cars) 11.8% 10.5%
Cars 13.8% 10.5%
Source: Maritime Agenda 2020-21 and IPA data
For projection of the future traffic for the commodities including fertilizers, FRM, food grains andmiscellaneous break-bulk (excluding cars), the growth rates as per the Maritime Agenda were found reasonableand hence used for computing traffic projections up to 2034. However, the future growth rate of cars isexpected to be in line with the historical CAGR and thus, the growth rate of cars is assumed at 13.8% up to 2034.
Traffic projections for Liquid Bulk:
The traffic projections for liquid bulk have been broadly done considering the two main classifications: (i)Crude and (ii) POL, edible oil and other liquid cargo. The crude oil imports at the Chennai Port are mainly forthe Manali Oil refinery situated at Chennai. The other existing refineries in South India meet their crude oilimport requirements through other ports located in the region while the proposed Nagarjuna Oil refinery atCuddalore district is developing a captive jetty and Single Point Mooring mechanism for meeting its cruderequirements. The Manali Oil refinery is proposed to add an additional 0.6 MTPA of refining capacity in 2017(Source: Ministry of Oil and Natural Gas website) thereby taking the total refining capacity of the ManaliRefinery to 11.1 MTPA. The crude oil requirement in the region is likely to grow with the growth ofindustrialization as well as growth in population. Thus, for projecting crude oil traffic post 2018, a step-functionapproach has been adopted assuming that additional refining capacities are added every 8 years. The porttraffic due to other POL products, edible oil and other liquid cargo at the ports is increased at CAGR of 4.92%which is the growth rate witnessed in the POL traffic over the last 5 years.
Methodology for projecting commodity-wise port traffic for the Business-Induced-Scenario(BIS) (Accelerated scenario with the influence of the Chennai-Bengaluru Industrial Corridor):
For computing the accelerated scenario commodity-wise traffic projections, the growth rates have been taken inline with the industry growth rate projections. The BAU growth rates are assumed up to 2018 since it isassumed that the accelerated impact of the CBIC shall start from FY 2019 onwards. Thus the acceleratedscenario is assessed based on the following computed rates:
Table 6.2.5: Growth rates for forecasting BIS scenario traffic at ports in CBIC region
Commodity Growth rates for traffic projections inBAU scenario
Accelerated (BIS)scenario- growthrates upto FY2018(Same asBAU)
Accelerated (BIS)scenario- growthrates -FY 2019andbeyond
Correspondingindustriesfor BISgrowthrates
Iron Ore 2.7% 2.7% 4.7%
Other Dry Bulk (Other Ore) 4.4% 4.4% 7.4%
Coking & other coal 3.6% 3.6% 8.1% Metallurgyindustry
Crude 4.2% 4.2% 11.6% Chemical &Petrochemical industry
POL, Edible Oils, LPG &Other Liquids
4.9% 4.9% 11.6% Chemical &Petrochemica

Final Report – Comprehensive Regional PlanPwC/ Nippon Koei 209
Commodity Growth rates for traffic projections inBAU scenario
Accelerated (BIS)scenario- growthrates upto FY2018(Same asBAU)
Accelerated (BIS)scenario- growthrates -FY 2019andbeyond
Correspondingindustriesfor BISgrowthrates
l industry
Misc. Break Bulk (excld. Cars) 10.5% 10.5% 13.9% Machineryindustry
Cars 10.5% 10.5% 13.8% Automobileindustry
Fertilizers & FRM 5.1% 5.1% 9.1% Foodprocessingindustry
Food grains 4.4% 4.4% 9.1% Foodprocessingindustry
Containers 8.8% 8.8% 13.01% Electricalmachinery,pharmaceutical, textilesandapparelsindustry
The following table provides the annual commodity-wise traffic projections for the BIS case for the ports in theCBIC region.
Table 6.2.6: BAU and BIS traffic numbers for ports in corridor region
Year AGGREGATE PROJECTIONS –Cargo Traffic – BAU Scenario(MTPA)
AGGREGATE PROJECTIONS –Cargo Traffic – BIS Scenario(MTPA)
ACTUAL 2008 68.7 68.7
2009 76.8 76.8
2010 87.9 87.9
2011 88.3 88.3
2012 86.1 86.1
2013 92.4 92.4
PROJECTIONS 2014 106.5 106.52015 120.3 120.32016 129.5 129.52017 141.5 141.52018 152.1 152.12019 169.1 172.72020 179.4 187.82021 195.0 209.72022 207.3 229.62023 224.4 255.42024 238.6 279.92025 255.3 308.62026 276.1 338.92027 293.1 372.0

Final Report – Comprehensive Regional PlanPwC/ Nippon Koei 210
Year AGGREGATE PROJECTIONS –Cargo Traffic – BAU Scenario(MTPA)
AGGREGATE PROJECTIONS –Cargo Traffic – BIS Scenario(MTPA)
2028 313.4 411.02029 333.5 452.72030 355.2 500.92031 374.6 550.72032 399.2 613.72033 423.5 685.1
While this section discusses the demand-side scenario with the commodity-wise traffic projections as well asthe overall port traffic projections in the CBIC region for BAU and BIS case, the following section details thesupply side factors (sea-side cargo handling capacity at ports as well as ports’ yard storage capacity and thecargo handling capacity provided by the port connectivity – both road and rail) and further discusses thecommodity-wise demand-supply gaps at ports in the CBIC region.
6.2.3Demand - Supply analysisFuture Supply-side analysis
As discussed in the previous section, a port’s cargo handling capacity is a function of its (a) sea-side capacity,(b) yard storage capacity and (c) evacuation capacity provided through land-side connectivity via road and rail.This road based evacuation capacity is further dependent upon the capacity of road connectivity and thecapacity of the port’s access gates. While the sea-side cargo handling capacity and the storage area can beenhanced by various means like reclamation of land from the sea, the enhancement of land-side evacuationposes a challenge. In this section, for analysing the port’s cargo handling capacity, the projects which arecurrently under implementation as well as confirmed / committed projects have been considered to evaluatethe berth-side capacity as well as the land-side connectivity capacity at the ports.
The following sections discuss the committed port capacity expansion projects as well as land-side connectivityenhancement projects.
Committed / Confirmed projects86 for port capacity expansion
The list of committed / confirmed projects for capacity expansion in ports are captured as under:
Table 6.2.7: List of committed / confirmed projects for Chennai & Ennore ports
Name / Description of the Committed /Confirmed Projects
Port Present Status ofthe Project
Likely year ofcommissionin
g / capacityaddition
Capacity
addition
CAPACITY EXPANSION / UPGRADATION / CONVERSION
OF EXISTING FACILITIES
Development of Container Terminal 3 byConversion of Jawahar Dock (JD) East berths2,4& 6
Chennai Port Feasibility study inprogress
2020* 0.8 MnTEU
Conversion of Bharathi Dock - 2 (BD-2) berthto a Ro-Ro terminal
Chennai Port Feasibility study inprogress
2016 Around7,000cars
Upgradation of existing coal handling facilityat Ennore Port (due to mechanization of CoalBerth – 2) for TNEB
Ennore Port Under construction 2015 4 MTPA
86 Committed / confirmed projects are defined as those projects which are either in the construction stage at present orprojects for which the preparation of DPR / Feasibility study is in progress or the project is in the bidding stage.

Final Report – Comprehensive Regional PlanPwC/ Nippon Koei 211
Name / Description of the Committed /Confirmed Projects
Port Present Status ofthe Project
Likely year ofcommissionin
g / capacityaddition
Capacity
addition
NEW CAPACITY ADDITION
New Container Terminal – 1 at Ennore Port EnnorePort
Awarded Phase I : 2017;Phase II: 2019
16.8MTPA
Development of LNG import terminal at EnnorePort
EnnorePort
Under construction 2018 5 MTPA
Development of Coal Berth III for TNEB atEnnore Port
EnnorePort
To be developed by EPL^.Approval for Rail sidingsreceived.
2017 9.5MTPA
Multi-purpose cargo terminal at Ennore Port EnnorePort
Concession Agreementsigned with SPV of M/sChettinad InternationalBulk Terminal Pvt. Ltd.
2016 2 MTPA
Development of SBM facility for Crude Oilhandling
EnnorePort
Preliminary DFR hasbeen prepared by CPCL
2020 15 MTPA
Liquid Berth as part of Project Outer Harbour atChennai Port
ChennaiPort
Chennai Port Trust is inprocess of restructuringthe erstwhile MEGAContainer TerminalProject and has appointeda Financial &Transactional Advisor.The consultant hassubmitted traffic studyreport and costs for theproject will be finalisedafter tariff assessment.
2018 2.31MTPA
Two Multi-purpose berths as part of ProjectOuter Harbour at Chennai Port
ChennaiPort
2021 4.62MTPA
Container Terminal 1 as part of Project OuterHarbour at Chennai Port
ChennaiPort
2019 14.13MTPA
Container Terminal 2 as part of Project OuterHarbour at Chennai Port
ChennaiPort
2026 14.13MTPA
Ro-Ro Berth as part of the Project OuterHarbour at Chennai Port
ChennaiPort
2020 0.25 mncars
OTHERS
Development of Barge handling facilities forbunkering at Chennai Port under PPP mode
ChennaiPort
Project Awarded.Financial closure awaited.Environmental clearanceyet to be received
--
Dredging (18 m CD) Phase-II at iron oreterminal in Ennore Port
EnnorePort
Project in progress atpresent. To be completedin 2014-15
2015
Dredging (15 m CD) Phase-III at containerterminal in Ennore Port
EnnorePort To start aftercompletion of Phase IIdredging
-
^EPL – Ennore Port Limited* Port’s estimate is 2017. But 2020 is the likely date of commissioning considering current legal issues surrounding the
project
Source: Stakeholder interactions
In addition to the above projects in the confirmed / committed stage, additional planned projects which arecurrently in the conceptual / ideation stage at the Chennai & Ennore ports include:
Table 6.2.8: List of proposed projects at ideation stage for Chennai, Ennore ports
Name / Description of the Project atIdeation/ Conceptual Stage
Port Present Statusof the Project
Likely year ofcommissioning
/ capacityaddition
Capacityaddition
Capacity addition to the Common User IronOre Terminal at Ennore Port
Ennore Port Ideation -- 6 MTPA
Creation of Dry dock facilities OR Extensionof West Quay to south at Chennai Port
Chennai Port Ideation -- --
Development of new Container Terminal at Chennai Port Currently at -- Approx.

Final Report – Comprehensive Regional PlanPwC/ Nippon Koei 212
Name / Description of the Project atIdeation/ Conceptual Stage
Port Present Statusof the Project
Likely year ofcommissioning
/ capacityaddition
Capacityaddition
West Quay at Chennai Port Ideation stage.Project to be takenup after completionof ContainerTerminal 3 projectdepending upontraffic demand
0.52MnTEUs
Development of new Ro-Ro Terminal atChennai Port
Chennai Port Currently atIdeation stage.Chennai Port todecide on theproject dependingupon demandscenario aftercompletion ofconversion of BD-2to Ro-Ro terminal
-- --
Container Terminal – 2 at Ennore Port Ennore Port Ideation 2022 35 MTPA
Container Terminal – 3 at Ennore Port Ennore Port Ideation 2027 35 MTPA
Additional Coal Berth (Coal Berth IV) forTNEB
Ennore Port Ideation 2019 9.5 MTPA
Additional Common user Coal Terminal onBOT Basis
Ennore Port Ideation 2018 10 MTPA
Additional Common user Multi-LiquidTerminal on BOT basis
Ennore Port Ideation 2018 3 MTPA
Additional Car Export Terminal – 1 Ennore Port Ideation 2018 Approx. 3lac carunits
Additional Car Export Terminal – 2 Ennore Port Ideation 2022 Approx. 3lac carunits
The following are the capacity expansion projects at other ports in the CBIC region as well as green-fieldprojects proposed for development in the CBIC region:
Table 6.2.9: Proposed capacity expansion projects planned at other ports in CBIC region
Proposed facility development Port / Location PresentStage of theProject
Capacityadditionexpected
Capacity addition at existing facilities
Capacity addition at Krishnapatnam port Krishnapatnam Port Ideation CapacityUpgradationfromexisting 75MTPA to200 MTPAin 2021
Container Berths 3 & 4 at Kattupalli Port Kattupalli Port Ideation 25 MTPAexpected in

Final Report – Comprehensive Regional PlanPwC/ Nippon Koei 213
Proposed facility development Port / Location PresentStage of theProject
CapacityadditionexpectedFY 2018
Berth 5 – Ro-Ro Terminal Kattupalli Port Ideation 8 MTPAexpected inFY 2018
Mutli-purpose Berth at Kattupalli Port Kattupalli Port Ideation 8 MTPAexpected inFY 2019
Liquid / POL Terminal at Kattupalli Port Kattupalli Port Ideation 8 MTPAexpected inFY 2022
LNG Terminal at Kattupalli Port Kattupalli Port Ideation 8 MTPAexpected inFY 2022
Proposed green-field developments
Coal handling facilities at Cheyyur for the proposed UMPP –Captive port for the proposed UMPP
Cheyyur Ideation Approx. 14 -1 5 MTPA
Durgarajapatnam Port (green-field major port proposed by theGovernment of India)
Durgarajpatnam Ideation Approx. 34MTPA (inPhase 1)with totalcapacityaround 150MTPA
Creation of Dry Port at Sriperumbudur on PPP mode Sriperumbudur Ideation --
Source: Stakeholder interactions
As visible from the above tables, the existing ports in the CBIC region have planned significant capacityadditions on the berth side to cater to the increased future traffic scenarios.
Port connectivity improvement projects:
The National Highways Authority of India (NHAI), the State government, the Indian Railways and various stateagencies are in process of implementing a significant number of projects to enhance the road and railconnectivity to ports thereby improving the land-side evacuation facilities at the ports of Chennai, Ennore andKattupalli. The map on the following page depicts the various existing and proposed road connectivity routes tothree ports – Chennai, Ennore and Kattupalli in the state of Tamil Nadu.
As depicted in the map, the vehicles travelling to and from the Chennai and Ennore Ports, at present, follow theNH-4, NH-45 or the NH-205 and travel up to the Maduravoyal junction or the Ambathur junction and thenfollow the Chennai Bypass road up to Madhavaram. These vehicles further follow the Chennai Inner Ring Roadand the Ennore Expressway to reach the Chennai Port or the Chennai Inner Ring Road and the TPP road toreach the Ennore & Kattupalli ports.
With a view to improve the connectivity of the ports in the region and thereby to improve the land-sideevacuation facilities at these ports, the following projects have been planned:
Table 6.2.10: Proposed land-side evacuation projects for ports in CBIC region
Name / Description of the Committed /Confirmed Projects
Port PresentStatus of
theproject
Likely year ofcommissioning
/ capacityaddition
ROAD CONNECTIVITY IMPROVEMENT PROJECTS
Development of an elevated expressway to Chennai Port from Chennai Port Confirmed Started in 2012,

Final Report – Comprehensive Regional PlanPwC/ Nippon Koei 214
Name / Description of the Committed /Confirmed Projects
Port PresentStatus of
theproject
Likely year ofcommissioning
/ capacityaddition
Maduravoyal this project is likelyto be completed byend of FY 2018.
Development of Coastal Road to the east of containerTerminal II
Chennai Port Confirmed Internal roadconnectivityimprovementproject of ChennaiPort
Expansion of the North Chennai Thermal Power Station(NCTPS) Road
Ennore Port Confirmed 2018
Development of the Northern Port Access Road Ennore Port Confirmed 2017
The Ennore Manali Road Improvement (EMRIP) project Ennore Port &Chennai Port
Confirmed 2015
Development / expansion of road connectivity projects toKrishnapatnam Port
KrishnapatnamPort
Confirmed FY 2014 / 2015
RAIL CONNECTIVITY IMPROVEMENT PROJECTS87
Development of a rail link to Ennore Port from the north ofMinjur Railway station on the Chennai – Gudur line (SingleLine)
Ennore Port Preparation and submission of DPRand final land survey by EPL is inprogress. Issue of NIT & LOAexpected by October and December,2014 respectively.Likely to be operational by 2018.
Doubling and electrification of the existing rail connectivity toKrishnapatnam Port
KrishnapatnamPort
2015
Source: Stakeholder interactions
The road connectivity improvement projects are shown on the map in the following page:

Final Report – Comprehensive Regional PlanPwC/ Nippon Koei 215
Figure 6.2.6: Map depicting proposed port connectivity road projects for Chennai, Ennore & Kattupalli ports

Final Report – Comprehensive Regional PlanPwC/ Nippon Koei 216
While the port capacity augmentation plans shall enhance the overall cargo handling facilities at the ports in theCBIC region, the land-side evacuation of cargo as well as the port access gate limitations is likely to remain amatter of concern. The following section evaluates the impact of the proposed land-side evacuation relatedprojects as well as analyses the ultimate possible evacuation capacity that such land-side port connectivity roadand rail projects shall provide to the ports at Chennai, Ennore & Kattupalli.
Limitation of port capacity due to constrained land-side connectivity:
A. Chennai Port:
Constraints due to road based evacuation:
The Chennai port handled around 53 MT of cargo during 2012-13. However, the congestion on the access routesto and from the Ports remains a matter of concern to the port users. The table below depicts the maximumevacuation (in tonnage) of cargo possible considering the present and the proposed connectivity projectdevelopments for the Chennai port:
Table 6.2.11: Proposed Road connectivity projects for enhancing land-side road based evacuation capacityat Chennai port
PORT PORTACCESS/ EXITGATE
ROUTEDESCRIPTION
Yearof
operation
No. ofLanes
Capacity(PCU per
day)
Total % ofTrucks &Lorries asper TrafficSurvey
TotalTonnagecapacitypossibleto betransported byTrucks,Lorries &MAVs(MPTA)88
CHENNAIPORT
Gate No.1, 2, 2A
Ennore Expressway viaManali Oil RefineryRoad up to IRRjunction
Operational
4Lane
with 1.6km
stretchof 2-lane
45,000 (forthe 4-lanesection) &
11,000 for 2-lane section
74.6% 8.9(capacity ofthe 2-lanesection)
Gate No.1, 2, 2A
EMRIP (share ofChennai Port traffic)
2015 4 45,000 80.8% 31.8
Gate No.10
Elevated MaduravoyalCorridor (Tolled)
2018 4 45,000 47% 23.1
Gate No.10, 2, 2A
Poonaamallee HighRoad
Operational
4 Port traffic not permitted on this route atpresent
Maximum traffic handling capability for Chennai port based on the above road-based routes:Up to 2014 : 8.9 MTPA
2015 – 2017 : 31.8 MTPA2018 and beyond: 55.0 MTPA
Source: Traffic Survey data as per Highways Department, GoTN – Origin & Destination Survey Report and Traffic
Census Report for Port Connectivity Roads for decongestion study results – July 2012 shared with the Study Team and
Traffic Survey results for Maduravoyal Elevated road project and EMRIP road project shared by NHAI with the Study
Team.
88 Assuming an average PCU – vehicle conversion factor = 4 for trucks, lorries and MAVs and average weight of 12 tonnesper vehicle and port operations for 365 days a year.

Final Report – Comprehensive Regional PlanPwC/ Nippon Koei 217
Limitations due to port gates:
The road evacuation capacity is further limited by the capacity of the port’s access gates. At present 4 gates(Gate No. 1, 2, 2A and 10) out of the total 10 gates at Chennai Port are operational (as per our interactions withChennai Port officials). The average time taken by a truck to pass through a lane at the gate at Chennai port isaround 3 minutes89. However, at international ports the cargo vehicles take an average of only 1 minute pervehicle to pass through the port gates90. According to the OCDI Study and assuming that the recommendationsof the Study are implemented which enable the ports to allow ingress of trucks at a faster rate (assuming 1minute is the average time taken by a truck to pass through the port gate) the table below shows the maximumpossible number of trucks and cargo tonnage which can pass through the gates of the Chennai Port:
Table 6.2.12: Limitation imposed on cargo movement due to access gates at Chennai port and maximumtonnage handling possible at Chennai Port with improved truck gate movement
PORT AFTERPROPOSED
DEVELOPMENT
No. ofOperational Hours^
No. of Trucks perday with best TAT
of 1 minute
Estimatedno. of trucks
(annual)
MaximumTonnage handlingpossible (MTPA)91
GATENo.
ENTRY
LANES
EXITLANE
S
CHENNAI –Existing
1 2 2 24^ 5,760 21,02,400 25.2
10 2 2 8^ 1,920 7,00,800 8.4
2 2 0 24^ 2,880 10,51,200 12.6
2A 0 2 24^ 2,880 10,51,200 12.6
TOTAL FOR CHENNIAI PORT (EXISTING) 58.8
CHENNAI –Proposed(after 2018)
1 2 2 24^ 5,760 21,02,400 25.2
10 – Elevated corridor from Maduravoyal to Chennai Port 23.1*
2 2 0 24^ 2,880 10,51,200 12.6
2A 0 2 24^ 2,880 10,51,200 12.6
TOTAL FOR CHENNIAI PORT (After development ofMaduravoyal Elevated corridor project in FY 2018)
73.6
*from table 4-14
^As per information provided by the Chennai Port officials.
As visible from the above table, the development of the proposed Maduravoyal Elevated Road Corridor projectis expected to enhance the overall access gate capacity of the Chennai Port.
89 As per OCDI Study on “Data Collection Survey on the Improvement of Port Operations” Final Report, February 201490 As per OCDI Study on “Data Collection Survey on the Improvement of Port Operations” Final Report, February 2014. Atinternational ports like Singapore, Hong Kong, Port of Los Angeles the time taken by container trucks to pass trhough portgates is less than a minute.91 Assuming average weight of 12 tonnes per truck and port operations of 365 days / year.

Final Report – Comprehensive Regional PlanPwC/ Nippon Koei 218
Constraints due to rail based evacuation:
Table 6.2.13: Constraints due to rail based evacuation at Chennai port
PORT Railway link Max. trainspossible per
day
Max tonnagepossible per
train
Total tonnage possible fortransportation by rail
(MTPA)CHENNAI
Existing Rail Link(Single Line)
1292 3,200* 14.02
Existing Rail Line toNorthern Yard – (SingleLine)
12 3,200* 14.02 (Currently unused)
Maximum traffic handling capability for Chennai port based on theoperational rail routes =
14.02
*Assuming total tonnage possible per train for break bulk = 3200 tonnes, dry bulk = 3400 tonnes and containers = 90 TEUs
/ train (i.e. around 1700 tonnes / train). Average of 3200 tonnes / train
The currently available rail based evacuation capacity in use at Chennai port is around 14.02 MTPA only. Therail based maximum evacuation possible for the Chennai port is around 28 MTPA including the currentlyunused railway line from Royapuram to the Northern Yard. The total possible cargo evacuation possible basedon the existing and proposed (committed projects) road and operational rail connectivity to the ports is shownin the table below:
Table 6.2.14: Total land based evacuation possible for Chennai Port
Year Road basedevacuationcapacity(MTPA) (1)
Port accessgate capacity(MTPA) (2)
Total road-based cargohandlingcapacity(MTPA) =Min(Road& Accessgatecapacity)(3)
Rail basedevacuationcapacity in use(4)
Total Land-sideevacuationcapacity atChennai Port= (3) + (4)
2014 8.9 58.8 8.9 14.0 23.02015 31.8 58.8 31.8 14.0 45.82016 31.8 58.8 31.8 14.0 45.82017 31.8 58.8 31.8 14.0 45.82018 55.0 73.6 55.0 14.0 69.02019 55.0 73.6 55.0 14.0 69.02020 andbeyond
55.0 73.6 55.0 14.0 69.0
The total berth side capacity for commodities transferrable via road and rail (i.e. for non-liquid commodities)for Chennai Port and corresponding land-side based evacuation capacity for the respective years is:
92 Computed from Chennai port website data for 2010

Final Report – Comprehensive Regional PlanPwC/ Nippon Koei 219
Table 6.2.15: Comparison of Berth Side capacity and total land-side evacuation capacity at Chennai Port
Year Total berth-side capacity forDry Bulk (excluding Coal),Break Bulk and Containers(MTPA)
Total Land-sideevacuationcapacity atChennai Port(MTPA)
Effective traffichandling capacity atChennai Port (MTPA)
2014 67.9 23.0 23.02015 67.9 45.8 45.82016 67.9 45.8 45.82017 67.9 45.8 45.82018 67.9 69.0 69.02019 67.9 69.0 69.02020 and beyond 82.9 69.0 69.0
The above table depicts that while additional berth side facilities for capacity addition at Chennai port areplanned, the total cargo handling capability of Chennai port shall be handicapped by the limited land-sideevacuation capacity at the Chennai Port reaching a maximum of around 69 MTPA in 2020. As per the abovetwo tables, the Chennai Port’s access gate capacity is more than the road capacity for the port thereby signifyingthat the proposed road connectivity capacity addition through the committed road connectivity projects shallremain insufficient to handle cargo at the Chennai Port.
The increasing urbanization in the Chennai city in general and specifically around the Chennai port are likely todisallow any further road and rail based connectivity projects to Chennai Port thereby limiting the cargohandling capacity at the port. One of the possible options to enhance land-side based evacuation capacity at theport can be utilization of the currently unused railway line from the Royapuram railway station to the Northernyard at Chennai port. Usage of this railway line is likely to provide an additional 14.02 MTPA cargo handlingcapacity to Chennai port thereby increasing the total cargo handling capacity for dry bulk (i.e. other ores andother dry bulk except coal and iron ore), break bulk and container cargo from 69.04 MTPA in 2020 to 83.06MTPA. The following table depicts the total land side capacity addition possible for Chennai port afterutilization of the currently unused railway line.
Table 6.2.16: Excess / Deficit in land-side evacuation capacity at Chennai port
Year Effective traffichandlingcapacity atChennai Port(MTPA) (usingexistingoperationalrailway line andexisting andcommitted roadconnectivityprojects)
Additional Land-side evacuationcapacity possiblethrough use ofcurrently unusedRoyapuram –Northern YardChennai Portconnectivity(MTPA)
Effective traffichandlingcapacity atChennai Port(MTPA)
Totalberth-sidecapacityfor DryBulk(excludingCoal),Break BulkandContainers(excludingPOLTraffic)(MTPA)
GapbetweenBerth-sideand land-sideevacuationcargohandlingcapacity(MTPA) (-ve denotesshortfallon land-sidecapacity)
2014 23.0 14.0 37.0 67.9 -30.82015 45.8 14.0 59.9 67.9 -7.92016 45.8 14.0 59.9 67.9 -7.9
2017 45.8 14.0 59.9 67.9 -7.92018 69.0 14.0 83.0 67.9 15.12019 69.0 14.0 83.0 67.9 15.12020 andbeyond
69.0 14.0 83.0 82.9 0.1

Final Report – Comprehensive Regional PlanPwC/ Nippon Koei 220
Thus, the potential use of the currently unused railway facility (single line) from Royapuram to the Northernyard of Chennai port is likely to provide a balance between the increased berth side capacity (due to thecommitted capacity expansion projects) and the land-side based evacuation capacity for the port of Chennai.
B. Ennore & Kattupalli Ports:
Constraints due to road based evacuation:
The table below depicts the maximum evacuation (in tonnage) of cargo possible considering the present and theproposed connectivity project developments for the Ennore & Kattupalli ports. At present most of the cargotraffic at Ennore Port is transported via rail movement and conveyor systems (to the TNEB power plantslocated near the port).
Table 6.2.17: Constraints due to land-side road based cargo handling capacity for Ennore & Kattupalliports
PORT PORT
ACCESS
/ EXIT
GATE
ROUTE DESCRIPTION No.
of
La
nes
Capaci
ty
(PCU
per
day)
Total % of
Trucks &
Lorries as per
Traffic Survey
Total
Tonnage
capacity
possible
(MPTA)93
ENNNO
RE &
KATTU
PALLI
Port gate
exit
Via Port Access Road, NCTPS
Road up to IRR (existing)
2 11,000 59.1% 7.1
Via Port Access Road, NCTPS
Road up to IRR (after proposed
expansion of EMRIP and NCTPS
Roads - 2017)
4 45,000 59.1% 29.1
Northern Port Access Road
(proposed - 2018)
4 45,000 93% 45.8
Maximum traffic handling capability for Ennore & Kattupalli ports based on the above road-based routes:
Up to 2016 : 7.1 MTPA
2017 : 52.9 MTPA
2018 and beyond: 74.9 MTPA
Source: Traffic Survey data as per Highways Department, GoTN – Origin & Destination Survey Report and Traffic Census Report for
Port Connectivity Roads for decongestion study results – July 2012 shared with the Study Team and Traffic Survey results for
Maduravoyal Elevated road project and EMRIP road project shared by NHAI with the Study Team.
Thus, from the table above the total cargo evacuation possibility for the Ennore and Kattupalli ports isapproximately around 75 MT per annum via the existing and proposed road connectivity projects in the regionfrom 2018 and beyond.
Limitation of port capacity due to constraints on port access gates:
Assuming that the trucks at Ennore & Kattupalli ports take an average of 1 minute to pass through the truckgates, the table below shows the maximum possible number of trucks and cargo tonnage which can passthrough the gates of the Ennore and Kattupalli ports:
93 Assuming an average PCU – vehicle conversion factor = 4 for trucks, lorries and MAVs and average weight of 12 tonnesper vehicle and port operations for 365 days a year.

Final Report – Comprehensive Regional PlanPwC/ Nippon Koei 221
Table 6.2.18: Limitation imposed on cargo movement due to access gates at Ennore & Kattupalli ports
PORT
AFTERPROPOSED
DEVELOPMENT
No. ofOperational Hours
No. of Trucks perday with best TAT of
2 minutes
Estimated no.of trucks(annual)
Maximum Tonnagehandling possible
(MTPA)94
GATENo.
ENTRY
LANES
EXITLANES
ENNORE
ExitGates
2 2 24 5,760 21,02,400 25.2
KATTUPALLI
ExitGate
1 1 24 2,880 10,51,200 12.6
TOTAL FOR ENNORE & KATTUPALLI PORTS 37.8
Constraints due to rail based evacuation:
Table 6.2.19: Constraints due to rail based evacuation at Ennore port
PORT Railway link Max. trainspossibleper day
Max tonnagepossible per
train
Total tonnage possiblefor transportation by
rail (MTPA)
ENNOREPORT
Existing Rail Link (Single Line) 24 3,200* 28.0
Proposed Rail link connectingMinjur to Ennore Port– (ProposedSingle Line – 2018 )
24 3,200* 28.0
Maximum traffic handling capability for Ennore port based on the operationalrail routes =
56.0
*Assuming total tonnage possible per train for break bulk = 3200 tonnes, dry bulk = 3400 tonnes and containers = 90 TEUs
/ train (i.e. around 1700 tonnes / train). Average of 3200 tonnes / train.
The currently available rail based evacuation capacity in use at Ennore port is around 28.0 MTPA only while thetotal rail based maximum evacuation capacity shall increase to 56.0 MTPA by 2018. The total possible cargoevacuation based on the existing and proposed road and rail connectivity (committed projects) to the ports isshown in the table below:
Table 6.2.20: Total Land-side evacuation capacity at both Ennore & Kattupalli ports combined
Year Road basedevacuationcapacity(MTPA) (1)
Port accessgate capacity(MTPA) (2)
Total road-based cargohandlingcapacity(MTPA) =Min(Road &Access gatecapacity) (3)
Rail basedevacuationcapacity (4)
Total Land-sideevacuationcapacity atPorts = (3) +(4)
2014 7.1 37.8 7.1 28.0 35.12015 7.1 37.8 7.1 28.0 35.12016 7.1 37.8 7.1 28.0 35.12017 52.9 37.8 37.8 28.0 65.82018 74.9 37.8 37.8 56.0 93.92019 74.9 37.8 37.8 56.0 93.92020 andbeyond
74.9 37.8 37.8 56.0 93.9
94 Assuming average weight of 12 tonnes per truck and port operations of 365 days / year

Final Report – Comprehensive Regional PlanPwC/ Nippon Koei 222
Thus, the total land-side based cargo handling capacity for Ennore & Kattupalli ports combined is around 94MTPA. Also, while the total road-based evacuation capacity is likely to increase to 75 MTPA in 2018, the accessgate capacity at the two ports shall limit this capacity to only 37.84 MTPA. Thus, additional / new port accessgates to accommodate an additional ~40 MT of traffic should be made operational for the two ports to matchthe road side capacity by 2017.
Assuming that the additional / new gates become operational at the two ports, the total road-based and rail-based evacuation capacity shall increase to around 131 MTPA for the two ports combined. On the other hand,the total berth side cargo handling capacity (for Bulk, Break Bulk and Containers) at the two ports combined in2020 is likely to be around 94 MTPA (considering committed projects). The evacuation capacity is expected tobe sufficient to handle the land side cargo handling capacity of 94 MT.
With the development of additional terminals (like the proposed Container Terminal – 1 at Ennore Port) andwith the expected increase in port traffic at Kattupalli port, the road based evacuation is expected to increasesignificantly in the years ahead. The table below depicts the excess / deficit of the land-side evacuation capacityat the two ports combined.
Table 6.2.21: Excess / Deficit in land-side evacuation capacity at Chennai port
Year Effective traffic handlingcapacity at Ennore &Kattupalli Ports (MTPA)
Total berth-sidecapacity for DryBulk, Break Bulkand Containers(excluding POLtraffic) (MTPA)
Gap between Berth-side and land-sideevacuation cargohandling capacity(MTPA) (-vedenotes shortfall onland-side capacity)
2014 35.1 33.9 1.2
2015 35.1 55.9 -20.7
2016 35.1 55.9 -20.7
2017 65.8 77.0 -11.1
2018 93.9 120.3 -26.4
2019 93.9 151.0 -57.1
2020 and beyond 93.9 151.0 -57.1
Based on the above, the total combined cargo handling potential at the Chennai, Ennore &Kattupalli ports is as below:
Table 6.2.22: Total cargo handling potential at Chennai, Ennore & Kattupalli ports
Year Total cargo handling potentialcombined at Ennore, Chennai
& Kattupalli ports (MTPA)(excluding POL)(MTPA) – after
consideration evacuation relatedconstraints
Total POLtraffic handling
potential for theEnnore,
Chennai &Kattupalli Ports
(MTPA)
Total cargo handlingpotential combined at
Ennore, Chennai &Kattupalli ports (MTPA)
(including POL) – after
consideration evacuation relatedconstraints
2014 71.4 20.6 92
2015 100.4 20.6 121
2016 105.4 20.6 126

Final Report – Comprehensive Regional PlanPwC/ Nippon Koei 223
Year Total cargo handling potentialcombined at Ennore, Chennai
& Kattupalli ports (MTPA)(excluding POL)(MTPA) – after
consideration evacuation relatedconstraints
Total POLtraffic handling
potential for theEnnore,
Chennai &Kattupalli Ports
(MTPA)
Total cargo handlingpotential combined at
Ennore, Chennai &Kattupalli ports (MTPA)
(including POL) – after
consideration evacuation relatedconstraints
2017 141.4 20.6 162
2018 & beyond 189.1 30.9 220
C. Krishnapatnam Port:
The total cargo handling possible for the port at Krishnapatnam is depicted in the table below. The port’s cargohandling capacity is proposed to be enhanced from the existing 75MTPA to around 200 MTPA in 2021. As perthe table below, the gate capacity at Krishnapatnam shall be required to be enhanced to meet the road cargohandling capacity.
Table 6.2.23: Road-based evacuation capacity at Krishnapatnam Port
Year ROAD capacity(MTPA)
Gate capacity(MTPA)
Rail capacity(MTPA)
Total land-side capacitypotential (with gate
capacity expansion tomeet road capacity)
(MTPA)2014 31.8 25.2 37.3 69.2
2015 & beyond 31.8 25.2 100.4 132.3
This total land-side capacity (both road and rail) shall be sufficient to cater to around 132 MTPA cargo handling.In 2021, the Krishnapatnam port plans to enhance the total berth side capacity up to 200 MTPA. It isanticipated that the capacity addition would be guided by changes in market demand adequately. Toaccommodate the expected increase in berth capacity, an additional land-side evacuation capacity ofapproximately 70 MTPA shall be required, primarily through road as rail based evacuation increase is expectedminimally beyond 2028. Besides, the gate capacity at the port would also need to be expanded to handle thetotal road based evacuation at the port. These developments could be handled by the port based on the patternof changes in demand over the medium term and the resultant strategies of the port.
Demand supply gaps
Based on the demand and capacity analysis presented above, the aggregate broad commodity wise gaps for thecorridor ports are as below. The shortfall in capacity compared to demand arises for certain commodities suchas bulk, driven by coal requirements for energy, and POL from 2025 onwards.
Table 6.2.24: Commodity-wise Demand-Supply gaps at 100% capacity utilization
YearBulk [Surplus /
(Gap)]Break bulk [Surplus
/ (Gap)]POL [Surplus /
(Gap)]Containers [Surplus /
(Gap)]BAU BIS BAU BIS BAU BIS BAU BIS
201423.1 23.1 6.7 6.7 5.6 5.6 25.2 25.2
201517.6 17.6 12.1 12.1 5.2 5.2 34.8 34.8
201613.4 13.4 11.4 11.4 4.8 4.8 31.0 31.0
201727.8 27.8 13.5 13.5 4.4 4.4 44.8 44.8
201836.5 36.5 27.1 27.1 13.6 13.6 79.4 79.4

Final Report – Comprehensive Regional PlanPwC/ Nippon Koei 224
YearBulk [Surplus /
(Gap)]Break bulk [Surplus
/ (Gap)]POL [Surplus /
(Gap)]Containers [Surplus /
(Gap)]BAU BIS BAU BIS BAU BIS BAU BIS
201940.5 40.1 30.4 30.1 12.7 11.3 86.7 85.2
2020 36.2 35.5 26.9 26.1 27.2 23.7 84.8 81.4
2021 37.9 36.7 34.7 33.4 39.7 33.9 162.1 155.7
2022 24.0 22.3 28.9 27.0 55.1 46.6 164.2 154.1
2023 15.5 13.3 27.6 25.0 54.6 43.0 157.5 143.0
2024 10.5 7.6 26.2 22.7 54.0 38.9 150.2 130.4
2025 8.5 4.9 24.6 20.1 53.3 34.4 142.4 116.2
2026 2.2 (2.0) 20.7 14.9 48.3 29.3 136.9 103.2
2027 (13.7) (18.9) 15.0 7.8 47.6 23.7 142.0 99.3
2028 (21.2) (27.3) 12.9 4.0 46.8 17.4 132.0 78.8
2029 (22.6) (29.7) 10.6 (0.2) 46.0 10.3 121.1 55.6
2030 (30.7) (38.9) 8.1 (5.1) 45.2 2.5 110.8 29.3
2031 (35.4) (44.8) 5.4 (10.6) 44.4 (6.2) 99.8 (0.2)
2032 (44.1) (58.2) 2.3 (16.8) 43.5 (15.9) 87.9 (33.8)
2033 (51.4) (73.7) (1.0) (23.9) 42.5 (26.8) 75.1 (71.7)
Source: JIC Study Team analysis and projectionsNote: Positive figures indicate surpluses; negative figures in brackets indicate gaps
Globally, the optimal capacity utilization of ports is approximately 70%. Operating beyond 70%utilization levels normally pose restrictions on achieving quicker turnaround time of vessels, movement &storage of cargo and faster evacuation. The supply demand gaps shown above are based on the assumption that

Final Report – Comprehensive Regional PlanPwC/ Nippon Koei 225
the ports would be able to handle cargo up to 100% of their capacity. Assuming a 70% efficiency level, thedemand supply gaps in various segments are captured as under:
Table 6.2.25: Commodity-wise Demand-Supply Gaps (Assuming 70% capacity utilization)
YearBulk [Surplus /
(Gap)]Break bulk [Surplus
/ (Gap)]POL [Surplus /
(Gap)]Containers [Surplus
/ (Gap)]BAU BIS BAU BIS BAU BIS BAU BIS
20142.4 2.4 2.8 2.8 (1.4) (1.4) 6.9 6.9
2015(4.3) (4.3) 6.3 6.3 (1.8) (1.8) 12.6 12.6
2016(8.5) (8.5) 5.7 5.7 (2.2) (2.2) 8.8 8.8
2017(0.4) (0.4) 6.9 6.9 (2.7) (2.7) 17.2 17.2
20184.5 4.5 16.1 16.1 3.5 3.5 40.0 40.0
20194.3 4.0 18.2 17.9 2.5 1.2 43.5 42.0
20200.4 (0.3) 15.4 14.7 12.5 9.1 40.4 37.0
2021(0.9) (2.1) 20.6 19.3 21.2 15.3 92.8 86.4
2022(10.6) (12.3) 16.2 14.3 31.8 23.2 92.4 82.4
2023(19.1) (21.3) 14.9 12.3 31.2 19.6 85.7 71.2
2024(24.0) (26.9) 13.5 10.0 30.6 15.6 78.5 58.7
2025(26.1) (29.7) 12.0 7.4 30.0 11.0 70.7 44.5
2026(32.1) (36.5) 8.7 2.9 24.9 6.0 64.3 30.5
2027(44.9) (50.1) 4.1 (3.1) 24.2 0.3 65.1 22.4
2028(52.4) (58.5) 2.1 (6.9) 23.5 (6.0) 55.0 1.9
2029(53.8) (60.9) (0.2) (11.2) 22.7 (13.0) 44.2 (21.4)
2030(61.9) (70.1) (2.7) (16.0) 21.9 (20.8) 33.9 (47.6)
2031(66.6) (76.0) (5.5) (21.5) 21.0 (29.6) 22.8 (77.3)
2032(75.3) (89.4) (8.6) (27.8) 20.1 (39.4) 10.9 (110.8)
2033(82.6) (104.9) (11.9) (34.9) 19.2 (50.3) (1.8) (148.7)
Source: JIC Study Team analysis and projectionsNote: Positive figures indicate surpluses; negative figures in brackets indicate gapsThe above figures are based on a 70% efficiency level of berth capacities of ports
While at a 100% capacity utilization level, the gaps in demand and supply occur over the long term from theyear 2025 onwards. However, at a 70% utilization level, which is a pragmatic reflection of the likely scenario onground, the capacities of the region’s ports are expected to fall short of demand for bulk and POL productsearlier during the short and medium term itself as indicated in the table above. While the design capacityappears adequate to meet the demand up to 2025, operation of the berths at the port at 100% utilization levelswould not be pragmatic and would require efficiency improvement measures to ensure that the utilization levelsare brought up closer to 85%-90% to effectively minimize the demand supply gaps. The infrastructure

Final Report – Comprehensive Regional PlanPwC/ Nippon Koei 226
development strategy, explained below, takes into account the demand supply gaps observedabove assuming an optimal berth utilization level of 70%.
Container Traffic
Short Term Scenario:
At present, the movement of container traffic to and from the ports of Chennai, Kattupalli and Krishnapatnamoccurs mainly via road. Ennore port does not have container terminal facility at present however the port hassigned the Concession Agreement with M/s Adani Ports & SEZ Ltd. for development of the Container Terminal– 1 at Ennore Port.
Over the short term, the major bottleneck in thetransportation of containers is expected to be thelimited road capacity available at the roads connectingthe ports. The graph alongside depicts the short termscenario wherein the road based evacuation capacity atthe ports is likely to act as the bottleneck in themovement of containers to and from the ports. Theexpansion of port gate to meet the berth capacity ishowever relatively easier to address.
However, there is significant capacity addition plannedin enhancing road connectivity to the ports in the CBICregion. Some of these proposed projects are the ongoingelevated road corridor from Maduravoyal to ChennaiPort, the Ennore – Manali Road Improvement Project,the proposed Northern Port Access Road etc. Thus theenhancement in the road-based evacuation capacityover the short term is expected to resolve the currentcongestion issue at the ports for the movement of road-based cargo including container cargo. The ports in theregion shall also need to undertake port-gate capacityenhancement projects to meet the traffic flowrequirements. Thus, successful implementation of thegate-side and road-evacuation based debottleneckinginitiatives is likely to result in sufficient containerhandling capacity generation at the existing ports in thecorridor region in 2018. Thus, as the figure alongside depicts, the total road-based evacuation capacity in 2018is expected to reach around 162 MTPA while the container capacity required to cater to enhanced traffic at theports is expected to be around 74 MTPA - thereby signifying that the road based capacity expansion programsare likely to be sufficient to cater to the increased capacity over the short term at the existing ports in the CBICregion.
Medium Term Scenario:
Over the medium term, the major capacity additions expected for containers in the region include the proposedContainer Terminal – 2 project at Ennore Port and the conversion of the JD Dock into the Container Terminalat Chennai Port. The restructured MEGA Container Terminal Project in the form of the Project Outer Harbouris also expected to add around 0.74 MnTEUs container capacity in 2019 and a total container capacity of 1.48Mn TEUs up to 2026 to the ports in the CBIC region.
Figure 6.2.7: Container Capacity landscape forexisting ports in the CBIC region

Final Report – Comprehensive Regional PlanPwC/ Nippon Koei 227
Figure 6.2.8: Medium Term Container capacity and demand landscape at existing ports in the region
As the graph above suggests, the planned additions in container capacity at the ports (Chennai, Ennore &Kattupalli) in the CBIC region are likely to be sufficient to meet the capacity requirements in the BAU and BISscenario. However, the container berth capacity expansion projects planned over medium term also face somerisks and overcoming / mitigating these risks is essential to ensure sufficient capacity at the ports in the region.
In addition to the project risks some additional key risks which need to be anticipated and hedged in themedium term scenario are:
i. Investments in proposed infrastructure development may not materialize as assumed:
This is a key risk pertaining to the proposed capacity additions planned over the medium term. Theconversion of the JD Dock into Container Terminal has a legal stay on the opening of the bids for theproject and thus there is a timeline risk for the project’s start and completion dates.
For the proposed Container Terminal -2 project at the Ennore Port, the overall cost estimates for theproject and the feasibility are not known. The land indicated (around 125 acres) is typically sufficient tohandle around 1.1 to 1.3 MnTEUs (i.e. 16 to 20 MTPA) of container traffic and handling 35 MTPA ofcontainer traffic at Container Terminal – 2 shall require significant amount of additional land area.Also, in order to achieve the commissioning for the project as per the expected time of 2022, theprocess for the development of project DPR would need to be initiated immediately.
42
48
23
10
122
29
42
194
117
138
0 50 100 150 200 250
Chennai (2018) (No additional capacity planned up to 2018)
Katttuppalli (2018) (Additional Capacity addition planned for 25MTPA)
Krishnapatnam (2018) (No additional container capacity till 2018)
Ennore (2018) (Container Terimal - 1 Phase - 1 planned for around 10MTPA)
Total 2018 Container Capacity at existing ports in CBIC region
With Planned Increase in Chennai (2020) (addition of Project OuterHarbour Container Terminal 1 and Conversion of JD Dock into
Container Terminal)
Ennore Port (2022) (addition of Phase 2 of Container Terminal 1 andoperations of Container Terminal - 2)
Base Case Supply
BAU Capacity required for Container traffic in 2023
BIS Capacity required for Container traffic in 2023

Final Report – Comprehensive Regional PlanPwC/ Nippon Koei 228
Table 6.2.26: Key projects planned for container capacity addition at the Chennai, Ennore & Kattupalliports over the short & medium term
Project description Key Risks foreseen
Conversion of JD Dock into ContainerTerminal at Chennai Port
Time-line risks are foreseen with respect to achievement ofthe commissioning timelines for the project since the issuespertaining to the bid opening are pending with the Courts.
Container Terminal – 2 at Ennore Port As the Container Terminal -2 at Ennore port is proposed tobe commissioned by FY 2021-22, the preparation of theProject DPR shall be required to be initiated at the earliestto achieve the commissioning timeline. A potential delay inthe initiation of preparatory and detailed studies may leadto a delay in the project commissioning.
Project Outer Harbour at Chennai Port The erstwhile planned MEGA Container Terminal projecthad to be shelved due to the unattractive bids received bythe Chennai Port Trust. The restructuring of the erstwhileMEGA container terminal project is underway and thetraffic study for the Project Outer Harbour has beenrecently submitted to the Port Trust. The preparation of thefeasibility reports and the DPR shall be required to bestarted at the earliest in order to meet the commissioningtimelines for the proposed Project Outer Harbour.
Container Terminals 3 & 4 at KattupalliPort
Kattupalli Port plans to develop the container terminals 3& 4 with additional capacity of around 25 MTPA by 2018.Timelines risks for the projects are present and detailedstudies for the project as well as the start of constructionshall be required to be initiated at the earliest to meet thecommissioning timelines.
ii. The capital investments are not being targeted to handle changing shipping trends across the globe:
The recent trend in the shipping industry has witnessedworld-wide liners witnessing increasing realizations bydeploying larger vessel sizes. Liners save around 20%-25% per slot when the vessel size increases from 4,000TEU to 7,000 TEU. The order book of container shipsalso indicates a growing trend of Very Large Containervessels across the world. As these larger vessels getdeployed on the main lines, the comparatively smallervessels of around 6,000-8,000 TEUs are expected tomove to the feeder network. Thus, for the ports to be ableto serve the main line larger vessels, such ports requiredeeper drafts to be able to serve vessels of more than10,000 TEUs capacity over the future decades. TheKrishnapatnam port with a much deeper draft comparedto the ports at Chennai, Ennore and Kattupalli may be ina better position to serve the larger sized container vessels in the future.
Figure 6.2.9: Orderbook of containerships till 2016

Final Report – Comprehensive Regional PlanPwC/ Nippon Koei 229
Table 6.2.27: Comparison of slot costs with change in vessel size
VesselSizes(in TEUs)
Slot Costs (USD per slot)
Asia-ME
Asia-Mediterranean
Asia-NorthEurope
4000-4500
500 950 1050
7000-8500
350 700 800
10,000-12,500
300 600 680
iii. Availability of deeper drafts at berth and absence of land-based evacuation issues at neighbouringports: The steam distance from Western and Eastern port to Krishnapatnam is only around 100-140NM more than Chennai, which is an additional 3-4 hours time difference or only around 1-4% of thetotal transit time taken. However, the availability of deeper draft at Krishnapatnam as well as theproposed availability of deeper draft at Ennore port (after the proposed dredging activity is completed)is likely to attract the larger vessels which require deeper drafts. The figure below depicts a comparativeanalysis of the drafts availability at the ports in the region and the corresponding vessel sizes which canbe accommodated at the respective drafts.
Thus,
going forward, the ports located in or close to urban agglomerations may be disadvantaged to handle increasedtraffic. As has been witnessed in other ports along the Indian coastline, the ports located in or close to urbanagglomerations are likely face challenges in terms of ease of cargo evacuation from the ports. This is likely toresult in a natural movement of cargo away from the cities to ports located away from the urban agglomerations.Thus, considering the growth of greater Chennai agglomeration area development of evacuation infrastructureat both Chennai and Ennore ports may become more expensive and difficult to implement.
Thus, based on the development plans, land availability details as well as the project implementation andcommissioning schedule provided to the JICA Study Team by the Chennai Port Trust, Ennore Port and
Figure 6.2.10: Comparative analysis of berth drafts and container vessels at ports in the CBIC regoinand international ports

Final Report – Comprehensive Regional PlanPwC/ Nippon Koei 230
Kattupalli Port, in the medium term the proposed container capacity addition projects are likely to meet theBAU demand as well as the BIS case demand. There are some key risks present which have been discussedabove and preparatory measures shall be required to be initiated at the earliest to materialise the proposedcapacity addition. There may be possibility of delays in the planned projects and thus, we would suggest that theconcerned authorities may undertake a comprehensive regional study to re-evaluate the development status ofthe proposed projects and likelihood of materialization of the proposed capacities and a suitable portdevelopment strategy may be developed depending upon the findings of such a study.
Long Term Scenario:
In the long run, while the ports at Chennai, Ennore, Kattupalli and Krishnapatnam shall be able to cater to thecontainer traffic in the BAU scenario, the requirement for 1-2 additional deep sea ports for handling thecontainer traffic in the BIS case shall arise. The graph alongside depicts the long term scenario in both the BAUand BIS case along with the proposed capacities at the existing ports in the CBIC region.
Coal Traffic
Coal is the second major commodity which is expected to form a substantial portion of the port traffic in theCBIC region. The Chennai Port has recently stopped handling thermal, coking and other coal as well as otherdusty cargo due to its emphasis on handling clean cargo. Due to this, the coal traffic is likely to shift to EnnorePort which also caters to a substantial coal requirement of TNEB power plants in the region. Krishnapatnam isalso likely to emerge as the port of choice for coal traffic in the CBIC region and is expected to cater to theUMPP as well as other thermal power stations in the vicinity. Cheyyur, which is planned to be developed as acaptive coal handling port, is likely to cater to the requirement of the Cheyyur UMPP.
Figure 6.2.11: Container Traffic and Capacity in CBIC - Long Term scenario

Final Report – Comprehensive Regional PlanPwC/ Nippon Koei 231
Figure 6.2.12: Berth capacity addition, evacuation capacity and capacity requirements in the Short,Medium & Long Term for CBIC region
As the figure above suggests, while the short term requirements can be met by the proposed capacity additionsplanned in the short term at the ports in the CBIC region, a medium-to-long term coal strategy shall beimportant to meet the coal handling capacity requirements in the region.
Overall scenario:
To summarise, the anticipated capacity additions over the short to medium term are likely to be sufficient tocater to the demand over the similar timelines. The graph below depicts the capacity requirement and capacitycreation over the short, medium and long terms.
However, the demand-supply gap over the long term necessitates the need for creating additional port capacityin the region in addition to the four existing ports at Chennai, Ennore, Kattupalli and Krishnapatnam and theproposed captive port at Cheyyur. At the same time, these capacity additions at the ports are likely to be
Figure 6.2.13: Overall commodity-wise demand-supply gap scenario in the Short, Medium & Long Term inCBIC region - BIS case

Final Report – Comprehensive Regional PlanPwC/ Nippon Koei 232
influenced by the future market forces and the emergence of connectivity enablers around the Chennai, Ennoreand Kattupalli ports is likely to be critical in sustaining the demand over the short and medium terms. At thesame time, over the short and medium term, efficiency improvement at the existing ports should be targetedand Techno-Economic feasibility studies for future development projects should be initiated.
6.2.4Infrastructure development strategyThe strategy for development of port infrastructure in the CBIC region is dependent on various inter-dependentvariables. These include the infrastructure within the ports, the operations in the ports, connectivity to the portsvia road and rail, and presence of efficient logistics infrastructure that enable efficient management and modalshift of cargo from various modes, primary from road to rail and vice versa that ultimately enables fasterevacuation.
The primary goal in the development strategy of port infrastructure would be to facilitate faster and efficientmovement of cargo at the ports. This is dependent on various factors such as presence of world class portinfrastructure, connectivity by road & rail and logistics infrastructure to ensure smooth modal shifts in theregion. These parameters are discussed below:
Port side infrastructure: Port side infrastructure in the region would require significant development overthe medium to long term. It would be important to not only create the capacity in ports, but also ensure that
Sustainable portinfrastructuredevelopment
strategy
Efficient portinfrstructure &
operations
Efficiency roadconnectivity
Efficient railwayconnectivity
Efficient logisticsinfrastructure
Enhance competitiveness of the region through worldclass port infrastructure & facilities
Objective
Port sector efficiency influenced by variousinterdependent components
Components

Final Report – Comprehensive Regional PlanPwC/ Nippon Koei 233
the ports are operated on par with world class standards. It would be important to ensure that the CBIC regioncreates adequate port side infrastructure to accommodate larger vessels and target improving the turnaroundtime. These are dependent on factors such as the length of the berths, availability of sufficient draft andapproach channels.
Road connectivity: The CBIC region currently poses significant challenges in access to ports through roads.It would be necessary to ensure that connectivity to the ports through roads is improved so as to improve theevacuation capacity at the ports. As noted earlier, the low evacuation capacity at Chennai port poses limitationson the port’s ability to fully utilize its capacity. Therefore, over the short term, it would be important to improveroad connectivity to ports such as Chennai. Challenges due to rapid urbanization and stiff land use patternspose limitations on improvement of road connectivity infrastructure beyond a particular level. In suchcircumstances efficient traffic management in urban ports & gradual movement of cargo to newer ports inlesser urbanized regions would be required over the longer term.
Rail connectivity: Movement of cargo through rail over relatively longer distances, say from the Bangaloreand surrounding regions, would be economical compared to transportation through roads. There is insufficientrail connectivity to ports in the CBIC region at present. Further, there is limited railway access into the portterminal area especially in Chennai port which necessitates last mile movement of cargo by road which reducesthe efficiency and time taken for movement of goods. The CBIC region would require more rail friendlyterminals for efficient movement of cargo in the future.
Logistics infrastructure: Development of efficient logistics infrastructure to promote swifter & efficientmodal shift is necessary for movement cargo from the production centres to the gateways and vice versa. Suchlogistics infrastructure is critical for improving operating efficiency at the ports. For instance, customsprocedures forming part of such facilities could result in minimal traffic at the port entry points, resulting infaster turnaround of vessels and improving the throughput in ports which is necessary for improvingcompetitiveness in the region.
The various development goals and targets are provided in the following section.
6.2.5Development goals & target performance indicatorsThe various development goals for creation of world class sustainable port infrastructure and improvement ofits interdependent components are captured as under. The successful operation of ports is not only dependenton the presence of port infrastructure but also presence of efficient connectivity through road and rail. To thisextent, the various goals pertaining to improvement of port & connectivity infrastructure is included in the tablebelow.
Category ofinfrastructure
Short term Medium term Long term
Port infrastructure &operations
Improve internal operationsat the ports of Chennai andEnnore (recommendationsof OCDI)
Commissioning ofcommitted berthimprovement projects atChennai & Ennore
Commissioning of committed berthimprovement project at Krishnapatnam
Create world class port capacity toaccommodate larger vessels to handleincreased trade through larger berth sizes,deeper draft and channels
Creation of fully automated processes atnew terminals / ports
Modernization of existing ports throughautomation of critical processes of cargohandling & storage
Road connectivity Improve road connectivity toports (planned projects ofphase 1)
Creation of enhanced internal roadconnectivity within ports & theirterminals; integration of internal roadinfrastructure with planned portautomation initiatives
Creation of enhanced externalconnectivity to new ports (discussed in

Final Report – Comprehensive Regional PlanPwC/ Nippon Koei 234
Category ofinfrastructure
Short term Medium term Long term
the roads strategy)Rail connectivity Improve rail connectivity to
terminals at existing ports(planned projects of phase 1)
Creation of enhanced internalconnectivity within ports & theirterminals; integration of internal roadinfrastructure with planned portautomation initiatives
Creation of enhanced external railconnectivity to new ports (discussed inthe rail strategy)
Logisticsinfrastructure
Strategic options studies toimprove connectivity,operations of existing CFSs
Creation of multi-modal logistics parks(with customs facilities where necessary)to facilitate faster & efficient customsclearance and modal shift of cargo fromroad to rail & vice versa (discussed in thelogistics strategy)
Establishment of direct connectivity (road/ rail) from inter-modal logistics parks toports (discussed in logistics strategy)
The various development goals integral to the ports sector pertaining to improvement of efficiency, capacity andconnectivity over the short & longer terms are captured as under.
Development goal # 1: Improvement of port operations at the ports of Chennai & Ennore
One of the main causes of congestion in Chennai port is due to inadequate documentation, lack of adequatemanagement of traffic, inspection methods and presence of idling trailers within the port. As measure toaddress these issues, a separate study has been commissioned by JICA to OCDI. OCDI have recommendedshort to medium term measures for improvement of operations at Chennai port. These recommendations(discussed in the following section under the development plan) are central to improving the throughput andefficiency at Chennai port. As Ennore port prepares to handle containers in future, it will also be important forthe port to adhere to effective management of its traffic and operations as suggested for Chennai port.
Development goal # 2: Implementation of committed berth capacity improvement projects
Chennai, Ennore and Krishnapatnam ports have committed to improving their respective berth capacities overthe short to medium term. Timely commissioning of these projects is critical for sustaining demand over theshort to medium term. The specific projects are discussed in the next section.
Development goal # 3: Improve road connectivity to ports
It would be important to ensure that the planned projects for improving connectivity to the ports of Chennai &Ennore identified as part of the preliminary study on CBIC by JICA be implemented on time. Theimplementation of these projects is currently being tracked by the Prime Ministers’ Office on a regular basis.These projects, identified in the development plan below, are critical for improvement of connectivity to theports of Chennai & Ennore. Additional details of these projects are discussed in the road sector strategy.
Development goal # 4: Improve rail connectivity to existing ports
One of the goals would be to ensure that the railway connectivity projects pertaining to access to ports(identified as part of the preliminary study on CBIC by JICA) also be implemented on time. These projectswould be critical for improving railway access to the existing ports in the CBIC region. Similar to the roadsector projects cited above, these railway projects are also being tracked on a regular basis by the PrimeMinisters’ Office. Additional details of these projects are discussed in the rail sector strategy.

Final Report – Comprehensive Regional PlanPwC/ Nippon Koei 235
Development goal # 5: Conduct strategic options study to maximise efficiency andconnectivity at existing CFSs
The existing CFSs would need significant improvement in terms of its processes and connectivity fromhinterland and to ports. There has been rapid urbanization around the CFSs leading to changing land usepatterns thus resulting in challenges in creation of additional connectivity infrastructure. A strategic optionsstudy is required to be conducted for improvement of the existing facilities to the maximum extent possible inorder to help improve their efficiency and connectivity to the ports. Additional details of these projects arediscussed in the logistics sector strategy.
Development goal # 6: Create world class port capacity and modernization of existing ports
Timely commissioning of the berth capacity improvement projects at Krishnapatnam, Chennai and Ennoreports would be critical to meeting the growing demand over the short to medium term. In order to ensurecompetitiveness of the region, it would be important to ensure that the additional port capacity that is requiredto be created are developed to world class standards over the long term. It would be essential to achieve fullautomation of port infrastructure and processes to improve turnaround and cargo throughput to world classstandards. It would be important to achieve the following specific objectives:
Development of adequate rail & road linkages within ports Fully automated cargo handling & movement from road & rail sidings to vessels Fully automated cargo storage facilities
The development plan outlined in the following section captures additional details on the nature ofinfrastructure required. Besides, to improve the efficiency of existing ports over the medium to longer term, itwould be essential to take up port modernization projects in batches. Facilitation of automated and wellcontrolled systems could form part of the modernization plan. This would enable in not only providing efficientservices, but also increasing the throughput of the ports and the turnaround time with marginal alternations tothe port’s physical features.
6.2.6Development goals & target performance indicatorsThe various development goals for creation of world class sustainable port infrastructure and improvement ofits interdependent components are captured as under. The successful operation of ports is not only dependenton the presence of port infrastructure but also presence of efficient connectivity through road and rail. To thisextent, the various goals pertaining to improvement of port & connectivity infrastructure is included in the tablebelow.
Category ofinfrastructure
Short term Medium term Long term
Port infrastructure &operations
Improve internal operationsat the ports of Chennai andEnnore (recommendationsof OCDI)
Commissioning ofcommitted berthimprovement projects atChennai & Ennore
Commissioning of committed berthimprovement project at Krishnapatnam
Create world class port capacity toaccommodate larger vessels to handleincreased trade through larger berth sizes,deeper draft and channels
Creation of fully automated processes atnew terminals / ports
Modernization of existing ports throughautomation of critical processes of cargohandling & storage
Road connectivity Improve road connectivity toports (planned projects ofphase 1)
Creation of enhanced internal roadconnectivity within ports & theirterminals; integration of internal roadinfrastructure with planned portautomation initiatives

Final Report – Comprehensive Regional PlanPwC/ Nippon Koei 236
Category ofinfrastructure
Short term Medium term Long term
Creation of enhanced externalconnectivity to new ports (discussed inthe roads strategy)
Rail connectivity Improve rail connectivity toterminals at existing ports(planned projects of phase 1)
Creation of enhanced internalconnectivity within ports & theirterminals; integration of internal roadinfrastructure with planned portautomation initiatives
Creation of enhanced external railconnectivity to new ports (discussed inthe rail strategy)
Logisticsinfrastructure
Strategic options studies toimprove connectivity,operations of existing CFSs
Creation of multi-modal logistics parks(with customs facilities where necessary)to facilitate faster & efficient customsclearance and modal shift of cargo fromroad to rail & vice versa (discussed in thelogistics strategy)
Establishment of direct connectivity (road/ rail) from inter-modal logistics parks toports (discussed in logistics strategy)
The various development goals integral to the ports sector pertaining to improvement of efficiency, capacity andconnectivity over the short & longer terms are captured as under.
Development goal # 1: Improvement of port operations at the ports of Chennai & Ennore
One of the main causes of congestion in Chennai port is due to inadequate documentation, lack of adequatemanagement of traffic, inspection methods and presence of idling trailers within the port. As measure toaddress these issues, a separate study has been commissioned by JICA to OCDI. OCDI have recommendedshort to medium term measures for improvement of operations at Chennai port. These recommendations(discussed in the following section under the development plan) are central to improving the throughput andefficiency at Chennai port. As Ennore port prepares to handle containers in future, it will also be important forthe port to adhere to effective management of its traffic and operations as suggested for Chennai port.
Development goal # 2: Implementation of committed berth capacity improvement projects
Chennai, Ennore and Krishnapatnam ports have committed to improving their respective berth capacities overthe short to medium term. Timely commissioning of these projects is critical for sustaining demand over theshort to medium term. The specific projects are discussed in the next section.
Development goal # 3: Improve road connectivity to ports
It would be important to ensure that the planned projects for improving connectivity to the ports of Chennai &Ennore identified as part of the preliminary study on CBIC by JICA be implemented on time. Theimplementation of these projects is currently being tracked by the Prime Ministers’ Office on a regular basis.These projects, identified in the development plan below, are critical for improvement of connectivity to theports of Chennai & Ennore. Additional details of these projects are discussed in the road sector strategy.
Development goal # 4: Improve rail connectivity to existing ports
One of the goals would be to ensure that the railway connectivity projects pertaining to access to ports(identified as part of the preliminary study on CBIC by JICA) also be implemented on time. These projectswould be critical for improving railway access to the existing ports in the CBIC region. Similar to the road

Final Report – Comprehensive Regional PlanPwC/ Nippon Koei 237
sector projects cited above, these railway projects are also being tracked on a regular basis by the PrimeMinisters’ Office. Additional details of these projects are discussed in the rail sector strategy.
Development goal # 5: Conduct strategic options study to maximise efficiency andconnectivity at existing CFSs
The existing CFSs would need significant improvement in terms of its processes and connectivity fromhinterland and to ports. There has been rapid urbanization around the CFSs leading to changing land usepatterns thus resulting in challenges in creation of additional connectivity infrastructure. A strategic optionsstudy is required to be conducted for improvement of the existing facilities to the maximum extent possible inorder to help improve their efficiency and connectivity to the ports. Additional details of these projects arediscussed in the logistics sector strategy.
Development goal # 6: Create world class port capacity and modernization of existing ports
Timely commissioning of the berth capacity improvement projects at Krishnapatnam, Chennai and Ennoreports would be critical to meeting the growing demand over the short to medium term. In order to ensurecompetitiveness of the region, it would be important to ensure that the additional port capacity that is requiredto be created are developed to world class standards over the long term. It would be essential to achieve fullautomation of port infrastructure and processes to improve turnaround and cargo throughput to world classstandards. It would be important to achieve the following specific objectives:
Development of adequate rail & road linkages within ports Fully automated cargo handling & movement from road & rail sidings to vessels Fully automated cargo storage facilities
The development plan outlined in the following section captures additional details on the nature ofinfrastructure required. Besides, to improve the efficiency of existing ports over the medium to longer term, itwould be essential to take up port modernization projects in batches. Facilitation of automated and wellcontrolled systems could form part of the modernization plan. This would enable in not only providing efficientservices, but also increasing the throughput of the ports and the turnaround time with marginal alternations tothe port’s physical features.
6.2.7Development plan & suggested projectsThe development plan & suggested projects for improvement of the port infrastructure in CBIC are presentedbelow which are closely aligned to the development goals enumerated in the previous section.
Improvement of port operations at the ports of Chennai & Ennore
The interventions proposed by OCDI as part of the study commissioned by JICA are presented below. Theseinterventions include judicious use of the existing CFSs and CWCs in order to minimize traffic at the portsespecially caused due to trucks that have inappropriate documentation. Other solutions including shifting of thetrailer inspections to the off-dock parking area and improvements to strengthen the parking lot have beensuggested. Besides, relocation of the customs gate to the port gate has been suggested to reduce congestion inthe terminal gate where the customs procedures are currently undertaken. A host of information technologylinked solutions have also been suggested so as to improve operations of the port.
Interventions at Chennai Port HorizonTermination of export containers having insufficient documentation at CFSs and CWC Short term
Shift trailer inspections to the off-dock parking area instead of at the port gate Short termRelocation of customs gate from the terminal gate to the port gate Short term
Regulation of idling trailers in the port Short term
Establishment of a common portal web system Medium termAuthentication of trailer’s port pass by introducing information technology systems Medium term
Doubling of port gate capacity from 4 to 8 lane Medium term

Final Report – Comprehensive Regional PlanPwC/ Nippon Koei 238
The above measures and additional studies have been proposed for Chennai port. In contrary, the OCDI studyteam is of the opinion that the land around Ennore is relatively less urbanized than Chennai thereby providingmore flexibility for improving connectivity and port operations. However, it may be noted that the area aroundEnnore port is also fast urbanizing given expansion of Chennai city limits under the CMDA. It is suggestedfurther suggested that a detailed assessment be undertaken for improvement of efficiency ofEnnore Port to proactively create the systems and procedures to ensure effective managementof the port to cater to future needs.
Commissioning of committed berth capacity improvement projects at existing ports
In order to successfully meet the demand over the short to medium term, timely implementation of the belowberth capacity improvement projects are critical. Implementation of these projects should be monitored on aperiodic basis to ensure timely commissioning.
Committed berth capacity improvementprojects
Anticipated capacity addition Expected date ofcommissioning
Phase 2 of Krishnapatnam 125 MT 2021
LNG Terminal at Ennore 5 MT 2018Container Terminal – 1 at Ennore 16.8 MT Phase – 1: 2017;
Phase – 2: 2019Multi-purpose cargo terminal at Ennore 2 MT 2016
Upgradation of existing coal handing facility atEnnorePort (due to mechanization of CoalBerth for TNEB)
4 MT 2015
Coal Berth III for TNEB at Ennore 9.5 MT 2017Container Terminal 3-Conversion of JD East -2,4& 6 at Chennai Port
0.8 Mn TEU 2020*
Conversion of Bharathi Dock - 2 (BD-2) berthto a Ro-Ro terminal
Around 7,000 cars 2016
Liquid Berth as part of Project Outer Harbourat Chennai Port
2.31 MTPA 2018
Two Multi-purpose berths as part of ProjectOuter Harbour at Chennai Port
4.62 MTPA 2021
Container Terminal 1 as part of Project OuterHarbour at Chennai Port
14.13 MTPA 2019
Container Terminal 2 as part of Project OuterHarbour at Chennai Port
14.13 MTPA 2026
Ro-Ro Berth as part of the Project OuterHarbour at Chennai Port
0.25 mn cars 2020
Development of SBM facility for Crude Oilhandling
15 MTPA 2020
* Port’s estimate is 2017. But 2020 is the likely date of commissioning considering current legal issues surrounding the
project
Improve road connectivity to ports
The following road connectivity projects aimed at improving connectivity to ports (identified as part of phase 1of the CBIC study) should be tracked and implemented on priority. It is to be noted that the below projects arecritical to improving the efficiency of Chennai and Ennore ports. The timeliness of these projects could result inbetter evacuation from the ports, especially from Chennai, leading to faster movement of cargo and achieving abetter turnaround time. It is to be noted that increasingly investors in the CBIC region are keen to relocatetheir shipments to alternative competitive ports in the region as the time taken at Chennai port at presentresults in severe transaction costs leading to loss of competitiveness. It is therefore utmost important to

Final Report – Comprehensive Regional PlanPwC/ Nippon Koei 239
improve connectivity to Chennai and Ennore ports. Besides, it would also be important to fast track theproposed road improvement project from the Bangalore region to Krishnapatnam.
Critical road connectivity projects Port HorizonElevated Expressway to Chennai Port Chennai Port Short termDevelopment of Coastal Road to the east of container Terminal II Chennai Port Short term
North Chennai Thermal Power Station (NCTPS) Road Ennore Port Short termNorthern Port Access Road Ennore Port Short term
EMRIP project Ennore Port Short termRoad connectivity projects to Krishnapatnam Port from Bangalore region Krishnapatnam Port Short term
In addition to the committed projects above, the below new projects are envisaged. It would be important toexpand the gate capacity at Ennore to meet the expected evacuation capacity by road over the short term.Further, given the anticipated increase of capacity at Krishnapatnam to 200 MT by 2021, the road and gatecapacities would also require expansion.
Critical road connectivity projects Port HorizonExpansion of the gate capacity by 40 MT by 2018 Ennore Port Short term
Expansion of the gate and road capacity to meet design capacity of 200 MT(exact quantum to be determined by Krishnapatnam Port officials)
Krishnapatnam Port Medium term
Improve rail connectivity to existing ports (planned projects of phase 1)
The below proposed rail connectivity projects are important for faster traffic movement of cargo at Ennore andChennai port. Currently, there are limited rail links to the port which would be required to be strengthened tofacilitate faster movement of goods through rail. The below projects (identified during phase 1) of the studyshould be implemented on priority over the short term.
Critical rail connectivity projects Port HorizonRail link to Ennore Port from the North of Minjur Railway station on theChennai – Gudur line
Ennore Port Short term
Rail link from Avadi to Guduvancherry via Sriperumbudur and Oragadam Chennai & EnnorePorts
Short term
Ennore Port-Avadi/Tiruvallur Rail link Ennore Port Short term
While rail connectivity at Krishnapatnam port is expected to be sufficient over the short to medium term, it mayrequire expansion over the longer term depending on changing cargo flows and modal shifts in traffic. Thebelow project could be taken up by Krishnapatnam port officials:
Critical rail connectivity projects Port HorizonExpansion of the rail capacity to meet design capacity of 200 MT (exactquantum to be determined by Krishnapatnam Port officials)
Krishnapatnam Port Long term
Conduct strategic options study to maximise efficiency and connectivity at existing CFSs
Rapid urbanization has been witnessed in the peripheral regions of Chennai often leading to challenges inexpanding infrastructure, especially that of connectivity, to cater to growing traffic demand over the recentyears. Most of the CFSs are located in the urban limits of CMDA and have very poor connectivity from theindustrial centres / highways to the CFSs and from the CFSs to the ports. One of the recommendations of OCDIis to mandatorily route traffic through the CFSs with the objective of terminating trailers with inappropriate

Final Report – Comprehensive Regional PlanPwC/ Nippon Koei 240
documentation at the CFSs itself. This when implemented is expected to result in heavy congestion at the CFSswhich are already plagued with congestion at entry and exit points and thereby could witness issues inevacuation to ports. It is henceforth suggested that a strategic options study be commissioned to evaluate indetail the scope for improvement of the CFSs attached to Chennai and Ennore ports in order to help them attainthe maximum possible efficiency to handle increased traffic in future.
Creation of additional port capacity
It is anticipated that additional port capacity would be required in the medium to long term in the CBIC regionto cater go the anticipated rise in demand. The segment specific strategies are discussed a under:
Bulk
Bulk cargo in the region mainly comprises of thermal coal driven by the power demand. The demand supplygaps in the bulk segment in 2018, 2023 and 2033 are captured as under:
Demand supply gap in the Bulk segment (MT) 2018 2023 2033
BAU - (15) (107)BIS - (18) (140)Source: JICA Study Team AnalysisNote: The demand supply gap is based on the assumption of optimal berth capacity utilization of 70%
As opposed to creation of inland power plants away from the coast that were located closer to the coal mines,the dependence on coal imports (which is expected to rise over the years in India) has led to a shift in locatingmost of the new power plants closer or attached to ports in order to minimize lead times in availability andtransportation costs of coal. The TNEB power plant attached to Ennore and the proposed Ultra Mega PowerProject (UMPP) in Cheyyur attached to the port in Cheyyur are examples of such initiatives. The existing portsin the region may not be able to efficiently serve future power plants as the power plants may be located at adistance from the ports increasing the dependency on rail infrastructure for transportation of coal therebyimpacting lead times. It is anticipated that the capacity for serving the thermal coal demand for the region beundertaken in line with planning process of the power plants to meet future energy demand.
POL, edible oils, LPG and other liquids
The demand supply gaps in the POL segment in 2018, 2023 and 2033 are captured as under. The gaps arelikely to arise over the long term starting from the year 2025 and 2028 onwards in the BIS and BAU casesrespectively.
Demand supply gap in the POL segment (MT) 2018 2023 2033BAU - - -BIS - - (72)Source: JICA Study Team AnalysisNote: The demand supply gap is based on the assumption of optimal berth capacity utilization of 70%
The evacuation for POL is normally undertaken off shore and through pipelines, which is not expected to posesignificant challenges. Further, the POL cargo would have a tendency to shift to new port locations plannedwith refining capacity. It is anticipated that the POL demand can be adequately handled by existing ports in theshort to medium term (except for a minimal shortage in the short term) and long term demand can be met byports developed with refining capacity. The planning for such ports can be taken up involving the Ministry ofPetroleum & Natural Gas and Ministry of Shipping over the long term, the planning for which could begin inthe short term.

Final Report – Comprehensive Regional PlanPwC/ Nippon Koei 241
10%
27%
50%
0%
10%
20%
30%
40%
50%
60%
70%
80%
90%
100%
2013 2018 2023 & beyond
Saturation in Chennai & Ennorewill require change in cargo flows
Krishnapatnam Other CBIC ports
Source: JICA Study Team analysis
Break bulk
The demand supply gaps in the break bulk segment in 2018, 2023 and 2033 are captured as under. The gapsare likely to arise over the long term starting from the year 2025 and 2028 onwards in the BIS and BAU casesrespectively.
Demand supply gap in the Break Bulk segment (MT) 2018 2023 2033
BAU - - (0.6)BIS - - (33)Source: JICA Study Team AnalysisNote: The demand supply gap is based on the assumption of optimal berth capacity utilization of 70%
Owing to the possibility of containerizing break bulk cargo, it is anticipated that much of the break bulk gap beaddressed through the capacities of existing and ports and through containerization.
Containers
The demand for containers is expected to fall short over the long term in both the BAU and BIS cases. Thedemand supply gaps during the years 2018, 2023 and 2033 are as under:
Demand supply gap in the Containers segment (MT) 2018 2023 2033BAU - - -BIS - - (134)Source: JICA Study Team AnalysisNote: The demand supply gap is based on the assumption of optimal berth capacity utilization of 70%
While in the BAU case, the capacities at existing ports is expected to be nearly sufficient, there is a strong needfor additional container handing capacity in the BIS case. It is presently not known whether Krishnapatnamwould have the ability to expand beyond its planned overall capacity of 200 MT. In case further expansion isnot possible, a new port with container handling capacity would be required. The alternative port location ofDurgarajapatnam could be considered for development to fill this gap. Planning for the port could be taken upduring the period 2018-23 so as to commence operations during the years 2028-30.
The ports of Chennai & Ennore are expected to have a joint container handling capacity of ~172 MTPA in thelong term. It is anticipated that no further expansion is possible in these ports due to berth side limitations andevacuation issues due to growing urbanization and changing land use patterns. As such, it is expected thatKrishnapatnam would begin to account for a greater share of traffic in the CBIC region over the medium (27%)to long term (50%).
10
11
12
13
14
15
16
17
18
19
Benchmark of draft at ports (inmeters)
Source: Research by JICA Study Team

Final Report – Comprehensive Regional PlanPwC/ Nippon Koei 242
Further, the draft in the ports of Chennai & Ennore are around 13.5 meters limiting their abilities to handlelarge sized vessels (DWT 250,000 & above).
Ports in India such as Mundra are designed to handle ships of the size of ~250,000 DWT, owing to presence ofa draft of over 18 meters that considerably reduce the costs of shipping by around 30%-40% thus making seatransportation costs competitive.
The CBIC region exhibits critical competitive advantages for creation of large “next generation” ports having theability to attract large vessels contributing to significant reduction in costs of transportation of cargo. Some ofthe key factors that are critical for creation of world class ports are presence of a deeper draft, presence ofGreenfield locations to exercise freedom of planning of port infrastructure and associated storage &connectivity infrastructure, and presence of a strong economic hinterland capable of generating large volumesof cargo.
Krishnapatnam port (phase II) and the planned Durgarajapatnam port have a draft of 18 meters, which couldbe one the deepest in the world and higher compared to Qingdao in China which has the deepest operating draftof 17.6 meters.
Large volumes of containers are required to attract large sized vessels. Large sized vessels (18,000 TEU andabove) reduce the costs of transportation by almost 30-40%. The port of Yangshan off the coast of Shanghai,which attracts large sized vessels, is preparing for a capacity expansion to 13 million TEUs by 2020. KhalifaPort in UAE, which also attracts large sized vessels, has planned a capacity expansion to 12 million TEUs by2030. The container traffic in the CBIC region is expected to reach 10 million TEUs and 19 million TEUs in theBAU and BIS cases respectively in 2033. Almost 50% of these volumes are expected to be handed in theKrishnapatnam belt. Though the CBIC region accounts for significant volumes, the abilities of the ports ofKrishnapatnam and Durgarajapatnam to adequately expand their capacities to global levels would need to beexamined. Further, the ports would need to have a turning radius of 1.7 to 2 times the lengths of ships arerequired for accommodating large sized vessels, which also needs to be examined.
The areas around Krishnapatnam port and proposed Durgarajapatnam port are relatively less urbanized andGreenfield thereby providing the advantage to develop world class port infrastructure in a phased manner withenhanced scope for evacuation at the ports. It is necessary that the development plan for these ports considerregulating the development around these ports in a manner that the efficiency of these ports is retained over alonger time horizon of 30-50 years.
Considering the above factors, Krishnapatnam and Durgarajapatnam have the potential to emerge as nextgeneration ports potentially emulating the standards of ports such as Mundra that have the capacities to handlelarge sized vessels. This requires further examination from technical perspectives and it is suggested that the
Presence of deeper draft to accommodate larger vessels
Presence of a large economic hinterland for generaing large cargovolumes
Greenfield locations for creating rapid evacuation infrastructure

Final Report – Comprehensive Regional PlanPwC/ Nippon Koei 243
above competitive advantages be sufficiently considered in the expansion of Krishnapatnam port 95 anddevelopment of Durgarajapatnam port.
Mangalore port is another important port on the western coast of the State of Karnataka and has potentialfor handling exports and imports to and from countries locatied to the west of India. The Government ofKarnataka plans to develop the ports on the western coast of the state with an eye on the strategic and economicbenefits of these ports. However, additional detailed studies are required to determine the issues related toseamless & ecologically sustainable road and rail connectivity of the port at Mangalore to the proposed CBICregion. It is important for Government of Karnataka to fast track development of road connectivity from theBangalore region to Mangalore that includes a proposal for tunnelling in the Western Ghats region.Development of connectivity to Mangalore port could enable strategic utilization of the port for trade withcountries to the west of India.
Some best case examples of automated solutions for ports are discussed and recommended forconsideration in development of phase 2 of Krishnapatnam port and the proposedDurgarajapatnam port.
Automated stacking cranes: Automated stacking cranes allow fully automated management of container stackyards. These cranes are normally 80 feet high and 110 feet wide and have been developed to handle up to 10rows of containers. Innovative crane engineering would allow the cranes to perform the loading and unloadingfunction without operators. This has been possible owing to sophisticated optical systems on the cranes thatrecognize containers using RFID technology by receiving signals from the port management computer. Suchautomation provides significant improvement in terminal productivity and also enhances the reliability ofcontainer handling in ports (Courtesy: TMEIC).
Automated stacking crane (Courtesy: www.maritimejournal.com)
95 It is anticipated that the expansion plans of Krishnapatnam port shall be guided through a formal regulatory & approval processinvolving the State Government of Andhra Pradesh

Final Report – Comprehensive Regional PlanPwC/ Nippon Koei 244
Automated stacking crane (Courtesy: www.terex.com)
Automated guided vehicles: Most modern container ports such as Rotterdam have automated guided vehiclesfor movement of cargo within the ports. These vehicles help in movement of cargo from the storage yard to thestacking area. These vehicles are programmed with automated sensors and geographical positioning devicesthat automatically guide the vehicles to their destination. These vehicles are fully automated without anyhuman interface and controlled through the port central computer processing system.
Automated Guided Vehicles (Courtesy: www.terex.com)
Automated storage in ports: Currently, the storage in ports per ‘000 square meter at Chennai and phase 1 ofKrishnapatnam port are around 55 and 51 TEUs respectively. The average container storage capacity per ‘000square meter in Qingdao port is roughly 128 TEUs. There is significant scope for improvement of the storagefacilities in the CBIC ports to reach to global standards. Further, the possibility of creating world classcontainer storage facilities should be explored in development of new ports in the region.

Final Report – Comprehensive Regional PlanPwC/ Nippon Koei 245
One of the solutions that could be considered for betterment ofstorage facilities in ports is through automated storage yards. Theseautomated storage solutions include automated shore-side craneswith reach capacity to handle over 20 containers fitted with opticalcharacter recognition facilities; the automated guided vehiclesshuttle containers between the ship and storage yard. The storageyard would typically feature electric semi-automatic container-stacking cranes with remote control loading of boxes to on-dock railsor truck chassis.
Automated cargo storage yard (Courtesy: www.cargobusinessnews.com)
Fully automated unloading facilities for handling bulk cargo: Currently, the port of Ennore has semi-automatedfacilities for handing of bulk cargo. Fully automated (driverless) unloading of bulk-cargo, would significantlyenhance the efficiency of ports. Considering the demand for bulk cargo like that of coal (for power production),it would be essential to create fully automated cargo handling facilities to increase the turn-around time andcompetitiveness of ports. Some the specific examples of fully automated unloading equipments are providedbelow (Courtesy: iSAM AG, Port of Hamburg).
Fully automatic bulk cargo unloaders typically are equipped with 3D laser scanners, internal navigation systemsand sophisticated industrial computer systems that intelligently gauge physical situations (size & position of thevessel etc.) and provide instructions to the unloaders.
Central port computer system: Automated ports with automated guided vehicles and automated cranes receivetheir instructions from a central port computer system. These computer systems are highly sophisticatedmachines with sound logic and ability to provide instructions to various automated machines with a greaterdegree of accuracy.
0
20
40
60
80
100
120
140
Chennai KPT Qingdao TanjungPelep
Shenzhen Hong Kong
Storage capacity - TEUs per '000 sqm
Source: Research by JICA Study Team

Final Report – Comprehensive Regional PlanPwC/ Nippon Koei 246
Internal connectivity infrastructure at ports: It would be essential to create adequate road & rail connectivity tothe terminal areas in future ports, integrated into the port’s automated cargo handling systems to ensure fasterturnaround time at ports.
The above port automation options are illustrative in nature and it is recommended that thetechnological advancements prevalent at the time of undertaking the development plans for theports be adequately considered.
Integrated plan for modernization of existing ports in the CBIC region
Besides creation of state-of the art facilities at new ports, it would also be essential to develop an integrated planto improve and modernize the facilities at the existing ports of Chennai, Ennore and Kattupally to attain ahigher degree of performance and competitiveness. Such modernization could be taken up in a phased mannerover the medium term. A strategic options study for determination of the contours of the integrated strategy formodernization is recommended to be initiated by the respective port authorities over the short term. Themodernization projects could typically include storage area automation, automation of container & bulk cargohandling and creation of additional multi-modal facilities at ports for faster evacuation. It is recommended thatthe integrated strategy be developed in line with the external connectivity enhancement projects planned forimproving access to the ports and changing development landscape around these ports.
6.2.8 Phasing planA summary of the suggested projects as part of the port sector strategy is provided as under with the indicativehorizon period for phasing:
Sr. Category Projects Cost(USDmillion)
2018 2023 2033
A. Port efficiencyimprovement
Termination of export containers havinginsufficient documentation at CFSs andCWC
NA ◊
Shift trailer inspections to the off-dockparking area instead of at the port gate
NA ◊
Relocation of customs gate from theterminal gate to the port gate
NA ◊
Regulation of idling trailers in the port NA ◊Establishment of a common portal websystem
NA ◊
Authentication of trailer’s port pass byintroducing information technologysystems
NA ◊
B. Roadconnectivityimprovement
Elevated Expressway to Chennai Port Includedin roadstrategy
◊Development of Coastal Road to the eastof container Terminal II
◊
North Chennai Thermal Power Station(NCTPS) Road
◊
Northern Port Access Road ◊EMRIP project ◊Road connectivity projects toKrishnapatnam Port
◊
Expansion of the gate capacity by 40 MTat Ennore Port
NA ◊
Expansion of the gate and road capacityto meet design capacity of 200 MT (exactquantum to be determined byKrishnapatnam Port officials)
NA ◊
C. Rail connectivityimprovement
Rail link to Ennore Port from the Northof Minjur Railway station on the Chennai
Includedin the
◊

Final Report – Comprehensive Regional PlanPwC/ Nippon Koei 247
Sr. Category Projects Cost(USDmillion)
2018 2023 2033
projects – Gudur line railstrategyRail link from Avadi to Guduvancherry
via Sriperumbudur and Oragadam◊
Ennore Port-Avadi/Tiruvallur Rail link ◊Expansion of the rail capacity to meetdesign capacity of 200 MT (exactquantum to be determined byKrishnapatnam Port officials)
NA ◊
D. Improvement ofexisting CFSs
Strategic options study to maximiseefficiency & connectivity at existing CFSs
NA ◊
E. Existing berthcapacityimprovementprojects & Newberth capacitycreation projects
Phase 2 of Krishnapatnam 2,250 ◊LNG Terminal at Ennore 700 ◊Container Terminal – 1 at Ennore 240 ◊Multi-purpose cargo terminal at Ennore 33 ◊Upgradation of coal handing facility atEnnore for TNEB Terminal
12 ◊
Additional Coal Berth III at Ennore 45 ◊Container Terminal 3-Conversion of JDEast -2,4& 6 at Chennai Port
80 ◊
Additional Coal Berth IV for TNEB atEnnore
45 ◊
Conversion of BD-2 berth to a Ro-Roterminal at Chennai Port
0.70 ◊
Additional Common User Coal Terminalon BOT basis
NA ◊
Additional Common User Multi-LiquidTerminal on BOT basis
NA ◊
Additional Car Export Terminal - 1 NA ◊Additional Car Export Terminal - 2 NA ◊SBM facility for Crude oil handling NA ◊Container Berths 3 & 4 at Kattupalli Port NA ◊Berth 5 - RoRO Terminal at KattupalliPort
NA ◊
Multi-purpose berth at Kattupalli Port NA ◊Liquid / POL terminal at Kattupalli Port NA ◊LNG Terminal at Kattupalli Port NA ◊Liquid Berth - Project Outer HarbourTerminal
NA ◊
Multi-purpose berth - 1 : Project OuterHarbour Terminal
NA ◊
Multi-purpose berth - 2 : Project OuterHarbour Terminal
NA ◊
Container Berth 1 : Project OuterHarbour Terminal
NA ◊
Container Berth 2 : Project OuterHarbour Terminal
NA ◊
RoRo Berth : Project Outer HarbourTerminal
NA ◊
Container Terminal II at Ennore NA ◊Container Terminal III at Ennore NA ◊

Final Report – Comprehensive Regional PlanPwC/ Nippon Koei 248
Sr. Category Projects Cost(USDmillion)
2018 2023 2033
F. Creation ofadditional portinfrastructure(containers)
Detailed study and implementation planfor creation of additional containerhandling capacity in the CBIC region(indicative project cost provided)
3,600 ◊
G. Integrated planformodernization ofChennai, Ennore& Kattupallyports
Detailed study and integratedimplementation strategy / plan formodernization of Chennai, Ennore &Kattupally ports; the modernizationimprovements could focus onimprovement of capacity and storage areimprovements through additional landreclamation, in consideration of theplanned connectivity improvementprojects and changing landscape.
NA ◊

Final Report – Comprehensive Regional PlanPwC/ Nippon Koei 249
6.3 Road
6.3.1 Sector Overview
6.3.1.1 Road Infrastructure6.3.1.1.1 Intercity Road Network
The Chennai – Bengaluru Industrial Corridor consists of two major urban centers viz, Chennai and Bengaluru.They are linked by national highways, which also pass through many of the major towns within the CBIC area.There are 16 Natioanl Highways which pass through the CBIC area for at least a portion of their lengths.
Chennai and Bengaluru are connected by NH 4 (Chennai to Mumbai) which passes through via Chittoor inAndhra Pradesh. NH 46 branches out from NH4 at Ranipet and runs to Krishnagiri where it meets NH 7(Varanasi to Kanyakumari) which passes through Bengaluru. Krishnagiri is a major node for the NH network inthe CBIC area as NH 66 and NH 219 also terminate there. NH 66 runs along the southern portion of the CBICboundary, connecting Krishnagiri with Pondicherry. NH 219 links Krishnagiri to Madanapalle in the Chittoordistrict of Andhra Pradesh, with connections to NH 4, NH 205 and NH 234.
NH 5 begins at Chennai and traverses the eastern portion of the CBIC area along its alignment to Jharpokariain Orissa (where it connects to Kolkata). NH 205 begins from Chennai urban area and connects the city toAnantapur in Andhra Pradesh, passing through Renigunta in Chittoor district. NH 45, knows as the GrandSouthern Trunk Road, originates from Chennai and connect to Theni in southern Tamil Nadu passing throughChennai and Kanchipuram districts of the CBIC area.
NH 209 begins from Bengaluru and passes through the periphery of the CBIC area to go to Dindigul insouthernTamil Nadu. NH 207 is a short highway that connects Hosur in Tamilnadu and Nelamangala on theperiphery of Bengaluru. NH 48 begins at Nelamangala and connects the Bengaluru periphery with the port ofMangalore on India’s west coast.
Other major National Highways within the CBIC area include NH 13 between Sholapur and Mangalore whichpasses through Chitradurga, NH 18 between Chittoor and Kurnool and NH 18A which connects Tirupati to NH18. NH 206 begins at Tumkur (where it connects to NH 4) and runs to Honnavar.The other major NationalHighway in the CBIC area is NH 234, which begins at Mangalore on the west coast and terminates atThiruvannamalai in Tamil Nadu, passing through SIra, Chikaballapur, Chintamani, Katpadi and Polur.
Table 6.3.1: Intercity Road Network in CBIC Area
RoadCategory
Length (km)
TotalTamil Nadu Karnataka
AndhraPradesh
NationalHighway
961 1,195 786 2,942
State Highway 2,414 2,403 526 5,343
Total 3,375 3,598 1,312 8,285
Source: JICA Study Team

Final Report – Comprehensive Regional PlanPwC/ Nippon Koei 250
Source: JICA Study Team
Figure 6.3.1: Intercity Road Network in CBIC Area
6.3.1.1.2 Urban road network
Chennai Metropolitan Area
Chennai has 4 major National Highways that originate within the city. These include:
NH4 (Chennai to Mumbai, known within the city as Poonamallee High Road)
NH 5 (Chennai to Kolkata, known within the city as Grand Northern Trunk Road)
NH 45 (Chennai to Theni, known within the city as Anna Salai)
NH 205 (Chennai to Anantapur, known within the city as Chennai – Tiruvallur Road)
The details of urban road network in Chennai Metropolitan Area are explained in Chapter 6.5.
Bengaluru Metropolitan Area
There are two National Highways which pass through Bengaluru city itself. These are :
NH 4 (Chennai to Mumba, known within the city as Old Madras Road)
NH 7 (Varanasi to Kanyakumari known within the city as Bellary Road)
Additionally a number of National Highways begin at locations close to Bengaluru. These include:
NH 48 begins at Nelamangala, near Bengaluru and terminates at the port city of Mangalore.
NH 207 begins near Nelamangala and connects to Hosur, which is in Krishnagiri district and on NH 7.
The details of urban road network in Bengaluru Metropolitan Area are explained in Chapter 6.5.

Final Report – Comprehensive Regional PlanPwC/ Nippon Koei 251
6.3.1.2 Current Government Initiatives6.3.1.2.1 National Highway Development Project
The National Highways Development Project is a project, executed in several phases to improve the roadnetwork in India. The project is overseen by the National Highways Authority of India. It has involved thewidening of roads and building of new links between all of India’s major cities.
The first phase established the Golden Quadrilateral network, which linked India’s 4 major cities of Delhi,Mumbai, Kolkata and Chennai by 4-lane Highways. The second phase focused on the North-South and East-West corridors while subsequent phases have seen the widening of 4-lane roads to 6-lane.
A number of these projects have been carried out by Public Private Partnership (PPP) models such as the BOT(Build, Operate, Transfer), BOOT (Build, Operate, Own and Transfer) and DBFOT (Design, Build, Finance,Operate and Transfer). The policy of the NHDP is for 60% of the planned infrastructure development(approximately 50,000 km) to be implemented through PPP (BOT/Toll).
The latest phase of the project, the Ministry of Road Transport and Highways drew up the ExpresswaysDevelopment Project, whose policy is to build 18,637 km new expressways by 2022 through PPP scheme.
Table 6.3.2: NHDP and Other NHAI Projects (Status: 31st October 2011)
Classifications Length (km)
NHDP Phase I & II (GQ) 4-laning of the Golden Quadrilateral 5,846
Phase I & II (NS-EW) 4-laning of East – West Corridors 7,300
Phase III 4-laning of high density national highway 12,109
Phase IV 2-laning with paved shoulders 14,799
Phase V 6-laning 6,500
Phase VI Development of expressways 1,000
Phase VII Development of ring roads, bypasses andso on
700
Total 48,254
Port Connectivity projects 380
Other projects 1,390
Total by NHAI 50,024
Source: NHAI Web Site
6.3.1.2.2 Major Projects in CBIC Area
Major projects in Tamil Nadu State, Karnataka State, and Andhra PradeshStatus collected by data collectionsurvey are summarized by status and category as shown in Table 6.3.3. Detail information of the projects andcorresponding maps are attached in Annex- Major Project in CBIC Area
Table 6.3.3: NHDP and Other NHAI Projects(Status: 31st October 2011)
Status Category Tamil Nadu Karnataka AndhraPradesh
Ongoing Intercity 4 5 1
Urban Arterial 4
Announced Plan Intercity 3 6 2
Urban Arterial 2 1
Under Study Intercity 3 1 5
Urban Arterial 3 2
Source: JICA Study Team

Final Report – Comprehensive Regional PlanPwC/ Nippon Koei 252
6.3.1.3 Sector Issues on Industrial DevelopmentFreight transport volume in CBIC area has been increased recently as shown in the below figure. Averagegrowth rate of container handling volume of Chennai port is 13% and major cargo destinations are in andaround of Chennai (45%) and neighbouring cities of Bengaluru, Hyderabad, and Selam (55%).Share of roadtransport in container transport is about 95% against about 5% by rail. It is foreseen that further growth ofcontainer transport by road and pertaining road development.
Source: Chennai Port AuthorityFigure 6.3.2: Container Movement by Road Transport & Railways: 2004 to 2012of Chennai Port
Shortening of delivery time and reduction of delivery cost on logistics are essential for industrial promotion andmajor issues on road infrastructure development are selected in consideration of following priority area on roadinfrastructure development. The selection of the major issue is made from the aspect of urban logistics, regionallogistics, road infrastructure, and operation and maintenance of road infrastructure in consideration of thosedifferent road traffic characteristics. Major issues are selected as shown in Table 5.1.4 and underlined issueswhich are related to logistic road network formulation and road capacity enhancement are subjected toexamination of road infrastructure development strategy.
Priority Road Infrastructure Development Area:
Mutual connection among road, port, airport, and logistic facilities (CFS・ICD・Industrial Park)
Debottlenecking on road traffic
Table 6.3.4 Major Issues on Road Infrastructure Development for Logistic
Aspect Priority Road Infrastructure Development AreaMutual connection among road,port, airport, and logistic facilities(CFS・ICD・Industrial Park)
Debottlenecking on road traffic
Problem Issue Problem Issuea.UrbanLogistics
OperationandMaintenance
- - a-2.Parking cargovehicle on portaccess road causetraffic congestion
a-3.Traffic ban oncity centre areafor heavy freightvehicle causeinefficientlogistic
a-2.Reduction ofParking CargoVehicle by PortCargo HandlingSystemImprovementa-3.Developmentof ElevatedFreight Highway
0
200,000
400,000
600,000
800,000
1,000,000
1,200,000
1,400,000
1,600,000
1,800,000
2004 2005 2006 2007 2008 2009 2010 2011 2012
TEU Railways
Road Transport

Final Report – Comprehensive Regional PlanPwC/ Nippon Koei 253
Aspect Priority Road Infrastructure Development AreaInfrastructure a-1.Inadequate
port accessroadsdevelopment inChennai fromarterial roadnetwork
a-1.Developmentof Port AccessRoads(UrbanRing Roads,
etc)
a-4.Throughtraffic in urbanroad network
a-5.Insufficientbridge loadbearing on portaccess roads
a-6.Narrow roadsto be bottleneckfor large scalecontainer trailer
a-4.Segregation ofThrough Trafficby Urban RingRoad and Bypass
a-5.ReinforcementandReconstruction ofDamaged Bridgea-6.Widening forLarge ScaleContainer Trailer
b.RegionalLogistics
OperationandMaintenance
- - b-4.Deterioratedpavementcondition mainlyon access roads tologistic facilities
(CFS・ICD・
Industrial Park)cause loss oflogistic speed andcargo quality
b-4.Improvementof PavementMaintenancesystem
Infrastructure b-1.Delay ofexpresswaydevelopment byNHDP
b-2.Lack offunctionalclassification oflogistic roadsbased onconnectivity
b-3.Insufficientdevelopment ofaccess roadsconnectingbetweenarterial roadsand logisticfacilities (CFS・
ICD・Industrial
Park)
b-1.Developmentof Expressway
b-2.RoadDevelopmentbased onFunctionalClassificationof LogisticRoad Network
b-3.Developmentof AccessRoads betweenArterial Roadsand LogisticFacilities basedon BenefitPrinciple
b-5. Narrow roadsto be bottleneckfor large scalecontainer trailerb-6. Insufficientbridge loadbearing on portaccess roads
b-5. Widening forLarge ScaleContainer Trailer
b-6.ReinforcementandReconstruction ofDamaged Bridge
Source: JICA Study Team
a-1. Development of Port Access Roads(Urban Ring Roads, etc)
Development of access roads to Chennai Port and Ennor Port from various place in CBIC area is importantbecause that those ports are important gates for logistics of CBIC area. Port access roads from arterial roadssuch as NH5, NH205, NH4, NH45, Inner Ring Road, and Outer Ring Road are under construction. Chapter6.5.6.1 mentioned about function and development status of those port access roads.

Final Report – Comprehensive Regional PlanPwC/ Nippon Koei 254
a-2.Reduction of Parking Cargo Vehicle by Port Cargo Handling System Improvement
Parking of cargo vehicle for delivering port cargo on port access road is parmanent and this cause trafficcongestion on the port access road. Expantion of container terminal and port cargo handling systemimprovement are important issue to reduce parking cargo vehicle.
Source: JICA Study Team
Figure 6.3.3 Traffic Congestion on TPP Road due to Parking of Waiting Cargo Vehicle
a-3.Development of Elevated Freight Highway
Development of full time freight highway connecting to port is important to shorten delivery time. Earlydevelopment of Chennai Port to Maduravoyal elevated freight highway is essential to operate freight vehicle inday time. Chapter 6.5.6.1 mentioned about function and development status of Chennai Port to Maduravoyalelevated freight highway.
a-4.Segregation of Through Traffic by Urban Ring Road and Bypass
There are some kinds of bottlenecks on road network to be an obstacle of reliability of transit time. Segregationbetween intercity traffic and intra urban traffic is major issue on both intercity roads and intraurban roads.Urban ring road and urban bypass are effective infrastructural measures to segregate above traffics. Therefore,timely development of urban ring road is essential to formulate efficient urban arterial road network. Forexample, traffic congestion permanently occurs on sections which are outside of outer ring road on major radialroad of NH4 and NH7 at Bengaluru Metropolitan Area. And, network development is essential to mitigatetraffic congestion. On the other hand, ring road development might have difficulty on land acquisition, in caseurbanization expands expecting ring road position.
Table 6.3.5 is shown comparison of development ratio and year of urban ring road amongst major metropolitanarea in east and south-east asia. Each ring road has introduced stage construction on the development, andmost critical issue is land acquisition and subsequent revision of structural type. This is generally causes highincrement of project cost and delay of development schedule, such as southern part of Bangkok Outer RingRoad.
Therefore, prompt ring road development in Metropolitan Area should be considered.
Table 6.3.5 Comparison of Development Ratio of Urban Ring Road
Beijing Soul Bangkok Jakarta Chennai Bengaluru
Plan (km) 433 168 165 120 279 363
Completion(km)
433 168 165 108 84 94
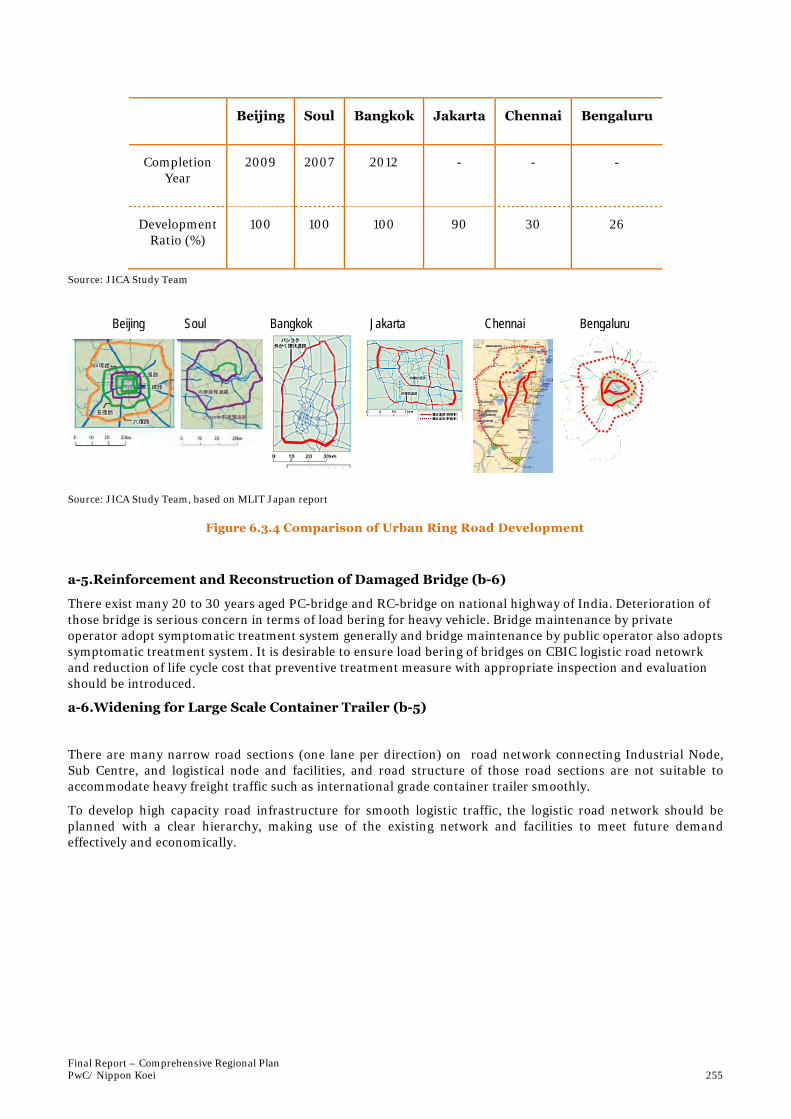
Final Report – Comprehensive Regional PlanPwC/ Nippon Koei 255
Beijing Soul Bangkok Jakarta Chennai Bengaluru
CompletionYear
2009 2007 2012 - - -
DevelopmentRatio (%)
100 100 100 90 30 26
Source: JICA Study Team
Source: JICA Study Team, based on MLIT Japan report
Figure 6.3.4 Comparison of Urban Ring Road Development
a-5.Reinforcement and Reconstruction of Damaged Bridge (b-6)
There exist many 20 to 30 years aged PC-bridge and RC-bridge on national highway of India. Deterioration ofthose bridge is serious concern in terms of load bering for heavy vehicle. Bridge maintenance by privateoperator adopt symptomatic treatment system generally and bridge maintenance by public operator also adoptssymptomatic treatment system. It is desirable to ensure load bering of bridges on CBIC logistic road netowrkand reduction of life cycle cost that preventive treatment measure with appropriate inspection and evaluationshould be introduced.
a-6.Widening for Large Scale Container Trailer (b-5)
There are many narrow road sections (one lane per direction) on road network connecting Industrial Node,Sub Centre, and logistical node and facilities, and road structure of those road sections are not suitable toaccommodate heavy freight traffic such as international grade container trailer smoothly.
To develop high capacity road infrastructure for smooth logistic traffic, the logistic road network should beplanned with a clear hierarchy, making use of the existing network and facilities to meet future demandeffectively and economically.
BMRDA
BDA
BBMP
NH-48(to Hassan)
SH-85 (to Magadi)
Beijing Soul Bangkok Jakarta Chennai Bengaluru

Final Report – Comprehensive Regional PlanPwC/ Nippon Koei 256
Source: JICA Study Team
Figure 6.3.5: Number of Lanes of Connecting Road for Industrial Nodes and Sub Centres
b-1. Development of Expressway
Development of Bengaluru – Chennai Expressway is planned in NHDP and Bengaluru – Chennai Expressway isimportant road link to formulate important primary road network of CBIC logistic road network with NH4,NH7, NH46, and NH5. There are two existing corridors between Chennai and Bengarulu. One is north corridorconsisted with NH4 and another is south corridor consisted with NH7, NH46, and NH4. Timely development ofBengarulu – Chennai Expressway is important issue to play important role as third corridor between Chennaiand Bengarulu with mass and high-speed logistic service.
b-2.Road Development based on Functional Classification of Logistic Road Network
Logistic road network should be classified into functional classification based on connectivity of road link andstandard geometry by functional classification should be provided properly to ensure traffic and accessfunctions of logistic road network. Functions of logistic road network are classified into Primary road,Secondary road, Tertiary road, and Urban Primary road and relation between functional classification andconnectivity is shown in Table 6.3.6.
Table 6.3.6 Road Network Functions and Connectivity
Function
International LogisticNetwork
International Gate
Connection
Regional Logistic Network
ArterialNationalHighway
(GQ/NSEW)
Expressway
Chennai,Bengaluru -
Ports, AirPort
National Highway / StateHighway
Urban RingRoad, Urban
Bypass
District Road / OtherRoad
a. Inter-Metropolitan,
Urban Core, SubCenter, District
Center
b. ①-a、④-Port, Air
Port
a. Inter-Metropolitan, Urban
Core, Sub Center,District Center
① ② ③ ④ ⑤ ⑥ ⑦
Primary Secondary UrbanPrimary
Tertiary
Source: JICA Study Team
b-3.Development of Access Roads between Arterial Roads and Logistic Facilities based onBenefit Principle
As for development of tertiary roads which is access road to CFS, ICD, and industrial park, public sector shouldimplement timely and appropriate operation and maintenance for public roads and private sector roads shouldbasically be maintained by beneficiary liability.

Final Report – Comprehensive Regional PlanPwC/ Nippon Koei 257
b-4.Improvement of Pavement Maintenance System
Pavement condition on some parts of arterial roads in CBIC area were investigated by Study Team as shown inFigure 5.1.6 and 5.1.7 and the pavement condition of those roads are generally fair. However, maintenance ofpavement has been carried out by symptomatic treatment system for private and public operated roads.Introduction of preventive treatment system for reduction of life cycle cost of pavement should be encouragedto alleviate the financial burden of governments.
Source: JICA Study Team
Figure 6.3.6 Road Conditions in Chennai – Bengaluru Area

Final Report – Comprehensive Regional PlanPwC/ Nippon Koei 258
Source: JICA Study TeamFigure 6.3.7:Road Conditions in Chennai Metropolitan Area

Final Report – Comprehensive Regional PlanPwC/ Nippon Koei 259
6.3.2Demand Forecast
6.3.2.1 GeneralAccurate traffic demand forecast is a major issue on road traffic planning and there is no specific method tocheck the accuracy. However, traffic forecast is closely related to socio-economic development of the study area.And, the Indian Roads Congress has suggested Econometric Method to consider economic growth of concernedarea for traffic forecasting. Therefore, predicted future growth of socio-economic parameter of concerneddistricts in Andhra Pradesh, Karnataka, and Tamil Nadu in foregoing chapter was examined and growth ofGross District Domestic Project (GDDP) adopts to the traffic forecast. And, JICA study team applied Link-wisesimple traffic demand forecast method with using GDDP instead of traditional four-step transportation modelmethod due to limited study resources in this study.
6.3.2.2 MethodologyEconometric method suggested widely in India relates traffic with GDP. The suggested model can beexpressedby the following equation.
Tg = e x Eg
Where Tg = Traffic Growth Rate
e = Elasticity of Traffic Demand
Eg = Economic Growth Rate
Growth rate of the GDDP at district level indicated in foregoing section has been considered for assessing thetraffic growth rates of all vehicles.
In the link-wise traffic demand forecast, segmentation of zones along the link relates to accuracy of the forecast.Thus it is essential to assess theeconomic growth rates at the district level for assessing the traffic growth rateson a link.
The elasticity values suggested by earlier studies of the study area and neighbour area in India has beenexamined and adopted elasticity values by vehicle type are presented in Table 6.3.7.
Table 6.3.7: Elasticity of Traffic Demand
VehicleType
2014-2019
2019-2029
2029-2039
MC 1.25 1.00 0.88
Buses 0.90 0.80 0.70
Cars 1.00 0.80 0.70
Trucks 1.40 1.20 1.00
LCVs 1.50 1.30 1.10
Source: JICA study team, based on Time Series Data on Road Transport Passenger and Freight Movement – 1951-91 IRC:SP:45
Traffic growth rate by district by vehicle type for Business As Usual (hereinafter referred to as BAU) andBusiness in Induced Scenario (hereinafter referred to as BIS) has been determined as shown in Table 6.3.8.
Vehicle Capacity Ratio is assessed on road links and following link capacity (DSV – LOS-B) of 1, 2, and 4 (Dual-2 - 2x2), 6 (Dual-3 - 2x3), and 8 (Dual-4 - 2x4) lanes road facilities are considered for assessing the traffic on alink/section:
T1 – 1,800 PCUs
T2 – 17,500 PCUs
T4 – 45,000 PCUs

Final Report – Comprehensive Regional PlanPwC/ Nippon Koei 260
T6 – 60,000 PCUs
T8 – 85,000 PCUs
Table 6.3.8: District-wise Traffic Growth by Vehicle Type (Year-on-Year2013, BAU, BIS)
District 2013/2018
Car &Jeep /Vans &Tempos
MiniBus
Bus LCV Trucks &2 Axle
Rigid & 3AxleRigid
MAV M/Cycles AutoRickshaw
Chennai BAU 1.15 1.04 1.04 1.73 1.61 1.61 1.44 1.44
BIS 1.71 1.54 1.54 2.56 2.39 2.39 2.13 2.13
Tiruvallur BAU 1.15 1.04 1.04 1.73 1.61 1.61 1.44 1.44
BIS 1.71 1.54 1.54 2.56 2.39 2.39 2.13 2.13
Kancheepuram BAU 1.15 1.04 1.04 1.73 1.61 1.61 1.44 1.44
BIS 1.71 1.54 1.54 2.56 2.39 2.39 2.13 2.13
Tiruvannamalai BAU 1.59 1.43 1.43 2.38 2.22 2.22 1.98 1.98
BIS 1.84 1.66 1.66 2.76 2.58 2.58 2.30 2.30
Vellore BAU 1.70 1.53 1.53 2.55 2.38 2.38 2.12 2.12
BIS 1.93 1.73 1.73 2.89 2.70 2.70 2.41 2.41
Dharmapuri BAU 1.17 1.06 1.06 1.76 1.64 1.64 1.47 1.47
BIS 1.68 1.51 1.51 2.51 2.35 2.35 2.09 2.09
Krishnagiri BAU 1.17 1.06 1.06 1.76 1.64 1.64 1.47 1.47
BIS 1.68 1.51 1.51 2.51 2.35 2.35 2.09 2.09
Bangaloreurban
BAU 1.65 1.48 1.48 2.47 2.31 2.31 2.06 2.06
BIS 1.76 1.59 1.59 2.64 2.47 2.47 2.20 2.20
Bangalore rural BAU 1.77 1.59 1.59 2.65 2.47 2.47 2.21 2.21
BIS 2.10 1.89 1.89 3.15 2.94 2.94 2.63 2.63
Ramnagara BAU 1.77 1.59 1.59 2.65 2.47 2.47 2.21 2.21
BIS 2.10 1.89 1.89 3.15 2.94 2.94 2.63 2.63
Kolar BAU 1.47 1.32 1.32 2.20 2.06 2.06 1.84 1.84
BIS 1.47 1.32 1.32 2.20 2.06 2.06 1.84 1.84
Chikkaballapura BAU 1.47 1.32 1.32 2.20 2.06 2.06 1.84 1.84
BIS 1.47 1.32 1.32 2.20 2.06 2.06 1.84 1.84
Tumkur BAU 1.61 1.45 1.45 2.42 2.25 2.25 2.01 2.01
BIS 1.84 1.66 1.66 2.76 2.58 2.58 2.30 2.30
Chitradurga BAU 1.45 1.31 1.31 2.18 2.03 2.03 1.82 1.82
BIS 1.61 1.45 1.45 2.42 2.25 2.25 2.01 2.01
Chittoor BAU 1.12 1.00 1.00 1.67 1.56 1.56 1.40 1.40
BIS 1.48 1.33 1.33 2.22 2.08 2.08 1.85 1.85
Anantapur BAU 1.12 1.00 1.00 1.67 1.56 1.56 1.40 1.40
BIS 1.48 1.33 1.33 2.22 2.08 2.08 1.85 1.85
Nellore BAU 1.44 1.29 1.29 2.15 2.01 2.01 1.79 1.79
BIS 1.69 1.52 1.52 2.53 2.36 2.36 2.11 2.11
District 2013/2023
Car &Jeep /Vans &Tempos
MiniBus
Bus LCV Trucks & 2Axle Rigid& 3 Axle
Rigid
MAV M/Cycles AutoRickshaw
Chennai BAU 1.19 1.07 1.07 2.27 2.04 2.04 1.66 1.66
BIS 2.61 2.35 2.35 4.98 4.47 4.47 3.64 3.64
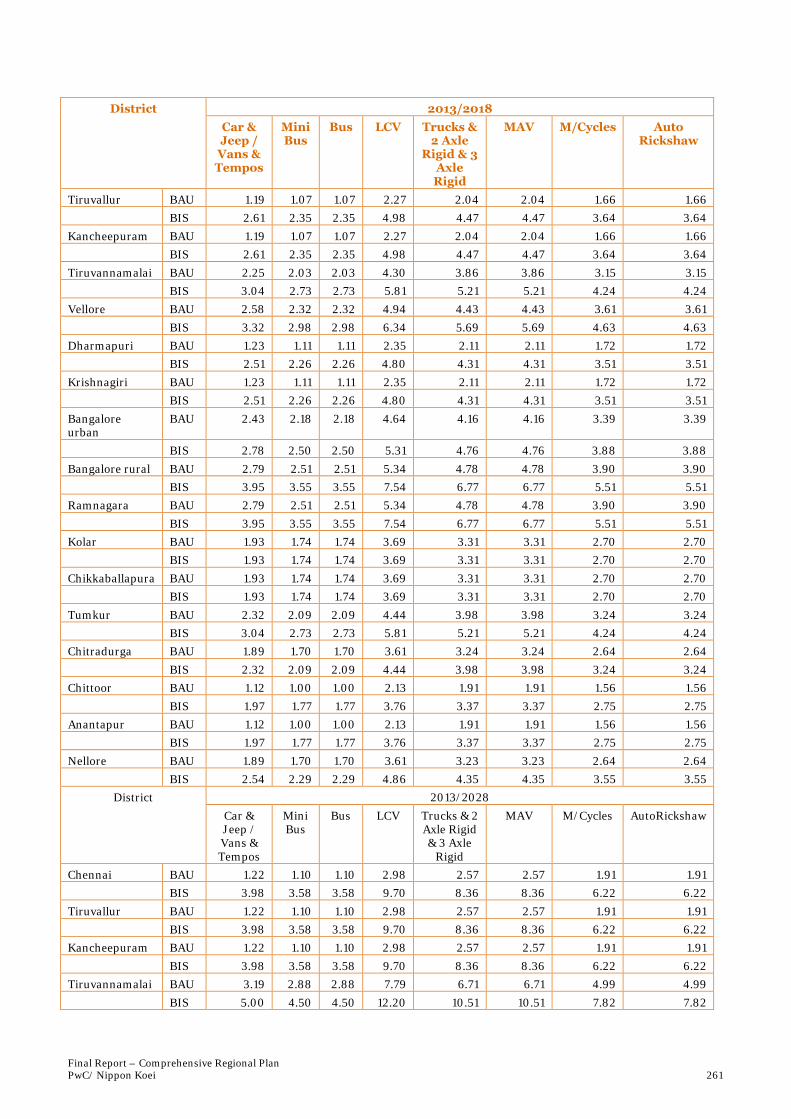
Final Report – Comprehensive Regional PlanPwC/ Nippon Koei 261
District 2013/2018
Car &Jeep /Vans &Tempos
MiniBus
Bus LCV Trucks &2 Axle
Rigid & 3AxleRigid
MAV M/Cycles AutoRickshaw
Tiruvallur BAU 1.19 1.07 1.07 2.27 2.04 2.04 1.66 1.66
BIS 2.61 2.35 2.35 4.98 4.47 4.47 3.64 3.64
Kancheepuram BAU 1.19 1.07 1.07 2.27 2.04 2.04 1.66 1.66
BIS 2.61 2.35 2.35 4.98 4.47 4.47 3.64 3.64
Tiruvannamalai BAU 2.25 2.03 2.03 4.30 3.86 3.86 3.15 3.15
BIS 3.04 2.73 2.73 5.81 5.21 5.21 4.24 4.24
Vellore BAU 2.58 2.32 2.32 4.94 4.43 4.43 3.61 3.61
BIS 3.32 2.98 2.98 6.34 5.69 5.69 4.63 4.63
Dharmapuri BAU 1.23 1.11 1.11 2.35 2.11 2.11 1.72 1.72
BIS 2.51 2.26 2.26 4.80 4.31 4.31 3.51 3.51
Krishnagiri BAU 1.23 1.11 1.11 2.35 2.11 2.11 1.72 1.72
BIS 2.51 2.26 2.26 4.80 4.31 4.31 3.51 3.51
Bangaloreurban
BAU 2.43 2.18 2.18 4.64 4.16 4.16 3.39 3.39
BIS 2.78 2.50 2.50 5.31 4.76 4.76 3.88 3.88
Bangalore rural BAU 2.79 2.51 2.51 5.34 4.78 4.78 3.90 3.90
BIS 3.95 3.55 3.55 7.54 6.77 6.77 5.51 5.51
Ramnagara BAU 2.79 2.51 2.51 5.34 4.78 4.78 3.90 3.90
BIS 3.95 3.55 3.55 7.54 6.77 6.77 5.51 5.51
Kolar BAU 1.93 1.74 1.74 3.69 3.31 3.31 2.70 2.70
BIS 1.93 1.74 1.74 3.69 3.31 3.31 2.70 2.70
Chikkaballapura BAU 1.93 1.74 1.74 3.69 3.31 3.31 2.70 2.70
BIS 1.93 1.74 1.74 3.69 3.31 3.31 2.70 2.70
Tumkur BAU 2.32 2.09 2.09 4.44 3.98 3.98 3.24 3.24
BIS 3.04 2.73 2.73 5.81 5.21 5.21 4.24 4.24
Chitradurga BAU 1.89 1.70 1.70 3.61 3.24 3.24 2.64 2.64
BIS 2.32 2.09 2.09 4.44 3.98 3.98 3.24 3.24
Chittoor BAU 1.12 1.00 1.00 2.13 1.91 1.91 1.56 1.56
BIS 1.97 1.77 1.77 3.76 3.37 3.37 2.75 2.75
Anantapur BAU 1.12 1.00 1.00 2.13 1.91 1.91 1.56 1.56
BIS 1.97 1.77 1.77 3.76 3.37 3.37 2.75 2.75
Nellore BAU 1.89 1.70 1.70 3.61 3.23 3.23 2.64 2.64
BIS 2.54 2.29 2.29 4.86 4.35 4.35 3.55 3.55
District 2013/2028
Car &Jeep /Vans &Tempos
MiniBus
Bus LCV Trucks & 2Axle Rigid& 3 Axle
Rigid
MAV M/Cycles AutoRickshaw
Chennai BAU 1.22 1.10 1.10 2.98 2.57 2.57 1.91 1.91
BIS 3.98 3.58 3.58 9.70 8.36 8.36 6.22 6.22
Tiruvallur BAU 1.22 1.10 1.10 2.98 2.57 2.57 1.91 1.91
BIS 3.98 3.58 3.58 9.70 8.36 8.36 6.22 6.22
Kancheepuram BAU 1.22 1.10 1.10 2.98 2.57 2.57 1.91 1.91
BIS 3.98 3.58 3.58 9.70 8.36 8.36 6.22 6.22
Tiruvannamalai BAU 3.19 2.88 2.88 7.79 6.71 6.71 4.99 4.99
BIS 5.00 4.50 4.50 12.20 10.51 10.51 7.82 7.82

Final Report – Comprehensive Regional PlanPwC/ Nippon Koei 262
District 2013/2018
Car &Jeep /Vans &Tempos
MiniBus
Bus LCV Trucks &2 Axle
Rigid & 3AxleRigid
MAV M/Cycles AutoRickshaw
Vellore BAU 3.92 3.53 3.53 9.56 8.24 8.24 6.13 6.13
BIS 5.71 5.14 5.14 13.92 11.99 11.99 8.92 8.92
Dharmapuri BAU 1.29 1.16 1.16 3.15 2.71 2.71 2.02 2.02
BIS 3.77 3.39 3.39 9.18 7.91 7.91 5.88 5.88
Krishnagiri BAU 1.29 1.16 1.16 3.15 2.71 2.71 2.02 2.02
BIS 3.77 3.39 3.39 9.18 7.91 7.91 5.88 5.88
Bangaloreurban
BAU 3.58 3.22 3.22 8.72 7.51 7.51 5.59 5.59
BIS 4.38 3.94 3.94 10.67 9.20 9.20 6.84 6.84
Bangalore rural BAU 4.41 3.97 3.97 10.75 9.26 9.26 6.89 6.89
BIS 7.41 6.67 6.67 18.07 15.57 15.57 11.58 11.58
Ramnagara BAU 4.41 3.97 3.97 10.75 9.26 9.26 6.89 6.89
BIS 7.41 6.67 6.67 18.07 15.57 15.57 11.58 11.58
Kolar BAU 2.54 2.28 2.28 6.19 5.33 5.33 3.97 3.97
BIS 2.54 2.28 2.28 6.19 5.33 5.33 3.97 3.97
Chikkaballapura BAU 2.54 2.28 2.28 6.19 5.33 5.33 3.97 3.97
BIS 2.54 2.28 2.28 6.19 5.33 5.33 3.97 3.97
Tumkur BAU 3.34 3.01 3.01 8.15 7.02 7.02 5.22 5.22
BIS 5.00 4.50 4.50 12.20 10.51 10.51 7.82 7.82
Chitradurga BAU 2.45 2.21 2.21 5.98 5.15 5.15 3.84 3.84
BIS 3.34 3.01 3.01 8.15 7.02 7.02 5.22 5.22
Chittoor BAU 1.11 1.00 1.00 2.71 2.34 2.34 1.74 1.74
BIS 2.61 2.34 2.34 6.35 5.47 5.47 4.07 4.07
Anantapur BAU 1.11 1.00 1.00 2.71 2.34 2.34 1.74 1.74
BIS 2.61 2.34 2.34 6.35 5.47 5.47 4.07 4.07
Nellore BAU 2.51 2.26 2.26 6.12 5.27 5.27 3.92 3.92
BIS 3.83 3.44 3.44 9.33 8.04 8.04 5.98 5.98
District 2013/2033
Car &Jeep /Vans &Tempos
MiniBus
Bus LCV Trucks & 2Axle Rigid& 3 Axle
Rigid
MAV M/Cycles AutoRickshaw
Chennai BAU 0.99 0.89 0.89 3.78 2.96 2.96 1.93 1.93
BIS 4.76 4.28 4.28 18.22 14.27 14.27 9.29 9.29
Tiruvallur BAU 0.99 0.89 0.89 3.78 2.96 2.96 1.93 1.93
BIS 4.76 4.28 4.28 18.22 14.27 14.27 9.29 9.29
Kancheepuram BAU 0.99 0.89 0.89 3.78 2.96 2.96 1.93 1.93
BIS 4.76 4.28 4.28 18.22 14.27 14.27 9.29 9.29
Tiruvannamalai BAU 3.55 3.19 3.19 13.59 10.64 10.64 6.93 6.93
BIS 6.45 5.81 5.81 24.72 19.36 19.36 12.60 12.60
Vellore BAU 4.66 4.20 4.20 17.86 13.99 13.99 9.11 9.11
BIS 7.70 6.93 6.93 29.48 23.09 23.09 15.03 15.03
Dharmapuri BAU 1.06 0.95 0.95 4.06 3.18 3.18 2.07 2.07
BIS 4.42 3.98 3.98 16.92 13.25 13.25 8.63 8.63
Krishnagiri BAU 1.06 0.95 0.95 4.06 3.18 3.18 2.07 2.07
BIS 4.42 3.98 3.98 16.92 13.25 13.25 8.63 8.63

Final Report – Comprehensive Regional PlanPwC/ Nippon Koei 263
District 2013/2018
Car &Jeep /Vans &Tempos
MiniBus
Bus LCV Trucks &2 Axle
Rigid & 3AxleRigid
MAV M/Cycles AutoRickshaw
Bangaloreurban
BAU 4.13 3.71 3.71 15.80 12.38 12.38 8.06 8.06
BIS 5.40 4.86 4.86 20.69 16.21 16.21 10.55 10.55
Bangalore rural BAU 5.45 4.91 4.91 20.88 16.35 16.35 10.65 10.65
BIS 10.90 9.81 9.81 41.74 32.69 32.69 21.29 21.29
Ramnagara BAU 5.45 4.91 4.91 20.88 16.35 16.35 10.65 10.65
BIS 10.90 9.81 9.81 41.74 32.69 32.69 21.29 21.29
Kolar BAU 2.61 2.35 2.35 10.00 7.83 7.83 5.10 5.10
BIS 2.61 2.35 2.35 10.00 7.83 7.83 5.10 5.10
Chikkaballapura BAU 2.61 2.35 2.35 10.00 7.83 7.83 5.10 5.10
BIS 2.61 2.35 2.35 10.00 7.83 7.83 5.10 5.10
Tumkur BAU 3.77 3.39 3.39 14.43 11.30 11.30 7.36 7.36
BIS 6.45 5.81 5.81 24.72 19.36 19.36 12.60 12.60
Chitradurga BAU 2.50 2.25 2.25 9.56 7.49 7.49 4.88 4.88
BIS 3.77 3.39 3.39 14.43 11.30 11.30 7.36 7.36
Chittoor BAU 0.87 0.78 0.78 3.33 2.61 2.61 1.70 1.70
BIS 2.70 2.43 2.43 10.36 8.11 8.11 5.28 5.28
Anantapur BAU 0.87 0.78 0.78 3.33 2.61 2.61 1.70 1.70
BIS 2.70 2.43 2.43 10.36 8.11 8.11 5.28 5.28
Nellore BAU 2.62 2.35 2.35 10.02 7.85 7.85 5.11 5.11
BIS 4.51 4.06 4.06 17.29 13.54 13.54 8.82 8.82
Source: JICA Study Team

Final Report – Comprehensive Regional PlanPwC/ Nippon Koei 264
6.3.3Demand-Supply Gaps
6.3.3.1 Present CaseVehicle congestion ratio in present case is calculated based on collected road inventory data and traffic data.Distribution of vehicle congestion ratio of national highway and state highway in each state are shown inAlmost 90% of roads are lower than vehicle congestion ratio of 1.0 in Tamil Nadu State and Andhra PradeshState, and it is about 80% in Karnataka. Major reason of the lower value in Karnataka is lower capacity of somesmall roads (0.5 lane per direction) against actual operational capacity for calculation purpose.
Table 6.3.9 and Table 6.3.10, respectively. Almost 90% of roads are lower than vehicle congestion ratio of 1.0 inTamil Nadu State and Andhra Pradesh State, and it is about 80% in Karnataka. Major reason of the lower valuein Karnataka is lower capacity of some small roads (0.5 lane per direction) against actual operational capacityfor calculation purpose.
Table 6.3.9: Distribution of Present Vehicle Congestion Ratio of National Highways
V/C Share of Congestion Ratio by State (%)
Tamil Nadu Karnataka Andhra Pradesh
> 1.5 0 9 0
1.0 - 1.5 13 14 0
0.5 – 1.0 29 20 35
0.0 – 0.5 58 57 65
Total 100 100 100
Source: JICA Study Team
Table 6.3.10: Distribution of Present Vehicle Congestion Ratio of State Highways
V/C Share of Congestion Ratio by State (%)
Tamil Nadu Karnataka Andhra Pradesh
> 1.5 2 17 Under Investigation
1.0 - 1.5 4 6 Under Investigation
0.5 – 1.0 22 13 Under Investigation
0.0 – 0.5 71 64 Under Investigation
Total 100 100
Source: JICA Study Team
According to vehicle congestion ratio shown inFigure 6.3.9, vehicle congestion ratio is generally proportionalwith scale of urbanization. High congestion ratio (V/C>1.0) is found at Bengaluru section on NH4, NH7,NH207, at Chennai section on NH4, and at Chitradurga section on NH13. Very high congestion ratio(V/C>1.75) are found in Karnataka state and most of those sections are some small roads (0.5 lane perdirection) against actual operational capacity.
Vehicle number in above urbanization area has rapidly increased, while road network development to segregateintercity and intra urban traffic by urban ring road and urban bypass has not adequately developed.

Final Report – Comprehensive Regional PlanPwC/ Nippon Koei 265
Source: JICA Study TeamFigure 6.3.8: Number of Lanes in CBIC Area (Present)
Source: JICA Study TeamFigure 6.3.9: Volume Capacity Ratio in CBIC Area (Present)

Final Report – Comprehensive Regional PlanPwC/ Nippon Koei 266
6.3.3.2 Future CaseVehicle congestion ratio in 2018, 2023, 2028, and 2033 without road development is calculated based onpresent road condition and future traffic volume forecasted based on the methodology mentioned in 6.3.2.2tosee demand supply gap in BAU and BIS cases.
6.3.3.2.1 BAU Case
As a result the calculation of BAU case, share of over 1.0 vehicle congestion ratio of national highway networkreach almost 50% in year 2018 in Karnataka state. Meanwhile, the share in Tamil Nadu state reach almost 50%in year 2023 and the share in Andhra Pradesh state do not reach 50% even in year 2033. The share rapidlygrows in Karnataka state and the share exceeds 90% in year 2033 as shown in Table 6.3.11 to Table 6.3.13. Theshare of state highway network in Tamil Nadu state and Karnataka state consecutively increase with thenational highway network. The share in Tamil Nadu state and Karnataka state reach almost 50% in year 2028and year 2023, respectively as shown in Table 6.3.14to Table 6.3.15. State highway congestion ratio in AndhraPradesh is not shown because traffic data has not identified for Andhra Pradesh.
Table 6.3.11: Distribution of Vehicle Congestion Ratio of National Highways in Tamil Nadu (BAU)
V/C Share of Congestion Ratio of Tamil Nadu State (%)
2018 2023 2028 2033
> 1.5 7 17 48 48
1.0 - 1.5 16 30 17 25
0.5 – 1.0 64 44 27 19
0.0 – 0.5 13 9 8 8
Total 100 100 100 100
Source: JICA Study Team
Table 6.3.12: Distribution of Vehicle Congestion Ratio of National Highways in Karnataka (BAU)
V/C Share of Congestion Ratio of Karnataka State (%)
2018 2023 2028 2033
> 1.5 30 49 71 84
1.0 - 1.5 13 22 12 11
0.5 – 1.0 34 24 16 5
0.0 – 0.5 23 5 0 0
Total 100 100 100 100
Source: JICA Study Team
Table 6.3.13: Distribution of Vehicle Congestion Ratio of National Highways in Andhra Pradesh (BAU)
V/C Share of Congestion Ratio of Andhra Pradesh State (%)
2018 2023 2028 2033
> 1.5 0 0 0 0
1.0 - 1.5 0 0 20 20
0.5 – 1.0 57 57 37 37
0.0 – 0.5 43 43 43 43
Total 100 100 100 100
Source: JICA Study Team
Table 6.3.14: Distribution of Vehicle Congestion Ratio of State Highways in Tamil Nadu (BAU)
V/C Share of Congestion Ratio of Tamil Nadu State (%)
2018 2023 2028 2033
> 1.5 5 8 19 35
1.0 - 1.5 7 15 30 21

Final Report – Comprehensive Regional PlanPwC/ Nippon Koei 267
V/C Share of Congestion Ratio of Tamil Nadu State (%)
0.5 – 1.0 30 38 31 23
0.0 – 0.5 59 39 20 21
Total 100 100 100 100
Source: JICA Study Team
Table 6.3.15: Distribution of Vehicle Congestion Ratio of State Highways in Karnataka (BAU)
V/C Share of Congestion Ratio of Karnataka State (%)
2018 2023 2028 2033
> 1.5 22 38 49 56
1.0 - 1.5 12 10 8 20
0.5 – 1.0 18 25 26 16
0.0 – 0.5 48 28 16 7
Total 100 100 100 100
Source: JICA Study Team
Although accuracy of the traffic demand forecast method applied in this study is lower than traditional four-stage transportation model method, it is obvious that prompt supply of road capacity in efficient manner isessential for sustainable industrial development in CBIC area as well as for comprehensive regionaldevelopment.
According to transitional vehicle congestion ratio shown in Figure 6.3.10, vehicle congestion is spread fromUrban Core of Chennai and Bengaluru and Chitradurga. Transition of vehicle congestion direction in Bengaluruarea starts from westbound, south-east bound, and eastbound. Meanwhile, transition of vehicle congestiondirection in Chennai area starts from westbound and southbound. Above vehicle congestion directions showsabout economical connectivity amongst major city, centre, and node in and around CBIC area. Above directionshould be taken into account this master plan study.
6.3.3.2.2 BIS Case
As a result the calculation of BIS case, share of over 1.0 vehicle congestion ratio of national highway networkreach almost 50% in year 2018 in Tamil Nadu state and Karnataka state. The share in Andhra Pradesh statereaches 50% in year 2023. The share rapidly grow in three states and the share exceeds 90% in year 2028 inTamil Nadu state and Karnataka state, and in year 2033 in Andhra Pradesh state as shown in Table 6.3.16 toTable 6.3.18. Meanwhile, the share of state highway network in Tamil Nadu state and Karnataka stateconsecutively increase with the national highway network. The share in Tamil Nadu state and Karnataka stateexceeds 50% in year 2023 as shown in Table 6.3.19 to Table 6.3.20. State highway congestion ratio in AndhraPradesh is not shown because traffic data has not identified for Andhra Pradesh. However, direction of statehighway congestion ratio in Andhra Pradesh is also similar with other two states.
Table 6.3.16: Distribution of Vehicle Congestion Ratio of National Highways in Tamil Nadu (BIS)
V/C Share of Congestion Ratio of Tamil Nadu State (%)
2018 2023 2028 2033
> 1.5 18 64 88 94
1.0 - 1.5 30 23 7 5
0.5 – 1.0 39 7 5 1
0.0 – 0.5 12 6 1 0
Total 100 100 100 100
Source: JICA Study Team
Table 6.3.17: Distribution of Vehicle Congestion Ratio of National Highways in Karnataka (BIS)
V/C Share of Congestion Ratio of Karnataka State (%)
2018 2023 2028 2033
> 1.5 34 67 84 90

Final Report – Comprehensive Regional PlanPwC/ Nippon Koei 268
1.0 - 1.5 15 10 7 5
0.5 – 1.0 35 18 10 5
0.0 – 0.5 16 5 0 0
Total 100 100 100 100
Source: JICA Study Team
Table 6.3.18: Distribution of Vehicle Congestion Ratio of National Highways in Andhra Pradesh (BIS)
V/C Share of Congestion Ratio of Andhra Pradesh State (%)
2018 2023 2028 2033
> 1.5 0 20 57 66
1.0 - 1.5 20 37 9 34
0.5 – 1.0 37 38 34 0
0.0 – 0.5 43 4 0 0
Total 100 100 100 100
Source: JICA Study Team
Table 6.3.19: Distribution of Vehicle Congestion Ratio of State Highways in Tamil Nadu (BIS)
V/C Share of Congestion Ratio of Tamil Nadu State (%)
2018 2023 2028 2033
> 1.5 12 30 64 84
1.0 - 1.5 15 21 15 14
0.5 – 1.0 33 34 18 2
0.0 – 0.5 41 15 2 0
Total 100 100 100 100
Source: JICA Study Team
Table 6.3.20: Distribution of Vehicle Congestion Ratio of State Highways in Karnataka (BIS)
V/C Share of Congestion Ratio of Karnataka State (%)
2018 2023 2028 2033
> 1.5 24 43 54 70
1.0 - 1.5 15 8 17 17
0.5 – 1.0 15 27 25 10
0.0 – 0.5 47 23 5 3
Total 100 100 100 100
Source: JICA Study Team
6.3.3.2.3 Application for Master Plan
Application of economic growth rate for traffic demand forecast is examined with comparison of investmentscale between BAU case and BIS case. As a result of the examination, about 900 km roads exceed 1.25 volumecapacity ratio in year 2033 in BAU case. Meanwhile, about triple road length of the BAU exceed 1.25 volumecapacity ratio in year 2033 in BIS case and this will require huge investment cost and unrealistic road wideningsuch as 10 lanes to 20 lanes.
Considering above examination result and expected congestion mitigation by traffic dispersion in road networkwhich is not able to simulate by applied link-wise simple traffic demand forecast method in this study, BAUbase economic growth rate is applied for traffic demand forecast.

Final Report – Comprehensive Regional PlanPwC/ Nippon Koei 269
Source: JICA Study Team
Figure 6.3.10: Volume Capacity Ratio (BAU, 2018, 2023, 2028, 2033, without project)

Final Report – Comprehensive Regional PlanPwC/ Nippon Koei 270
Source: JICA Study TeamFigure 6.3.11: Volume Capacity Ratio (BIS, 2018, 2023, 2028, 2033, without project)

Final Report – Comprehensive Regional PlanPwC/ Nippon Koei 271
6.3.4Infrastructure Development Strategy
6.3.4.1 Planning PrinciplesCBIC area consists of Tamil Nadu state, Karnataka State, and Andhra Pradesh state, and vehicle production,vehicle parts production, leather manufacture, and IT software production are major industries in those activeindustrial area. This area is also expected to contribute GDP expansion from 16% to 25% by manufacturingsector promotion by National Manufacturing Policy (NMP). Sustainable growth by development of newindustrial node and attraction of investment is essential to achieve above target. Moreover, improvement ofindustrial connectivity and expansion of infrastructure for industrial activity are needed to induce promisingindustry contributing to gross capital formation in CBIC area.
To realize world standard industrial activity in CBIC area, efficient connection among industrial node, logisticnode and facilities, arterial roads, and ports is important to contribute productivity of concerned private sector.Moreover, aspects of reliability of transit time, shortening of lead time, and reduction of goods damage bytransport should be taken into account.
Accordingly, road sector development plan should support to encourage speedy, seamless, and low cost logisticsystem in CBIC area, and following aspects should be taken into account.
①Strengthening of logistic Road Network
②Enhancement of logistic Road Network Capacity and Level of Service
Networking among port, railway, airport, logistic node, and industrial node and elimination of traffic bottlenecksection and point are emphasized in road infrastructure development plan. Accordingly, road traffic congestionmitigation at urban area, facilitation of national primary highway network usage such as Golden Quadrilateraland North South East West Corridor, national highway and state highway formulating trunk road network withnational primary highways, and access road connecting logistic node and facilities are most priority measures.
6.3.4.2 Development StrategiesThe infrastructure development strategy for road sector is set considering demand supply gap analysis and theplanning principle mentioned in foregoing sections as shown in Table 6.3.21.
Table 6.3.21: Road Development Strategies
Category Objective &Strategy
Description
InfrastructureObjective To support encouraging speedy, seamless, and low cost
logistic system in CBIC areaStrategy a) Strengthening of logistic Road Network
Formulation of major logistic network (PrimaryLogistic Road Network)
Formulation of network between major logisticnetwork and major logistic nodes andfacilities(Secondary Logistic Road Network)
Development of access-controlled expressway network Congestion mitigation in metropolitan areas and major
citiesb) Enhancement of logistic Road Network Capacity and
Level of Service a Widening of existing roads to respond future traffic
demand
Source: JICA Study Team
6.3.4.2.1 Strengthening of logistic Road Network
A long-term logistic road network strategy provides a useful basis to guide road infrastructure investments. Theoverall road network is prepared based on the estimated traffic demand and with consideration of thefollowing:

Final Report – Comprehensive Regional PlanPwC/ Nippon Koei 272
Metropolitan Areas, Industrial Nodes, Sub Centres, and District Centres should be provided with highgrade road infrastructure and logistic services.
International linkages with global markets should be strengthened.
To maximize infrastructure capacity, the logistic road network should be planned with a clear hierarchy,making use of the existing network and facilities to meet future demand effectively and economically.
Accordingly, following strategic measures are proposed as Strengthening of Logistic Road Network:
a) Formulation of major logistic network (Primary Logistic Road Network)
b) Formulation of network between major logistic network and major logistic node and facility (SecondaryLogistic Road Network)
c) Development of access-controlled expressway network
d) Congestion mitigation at Metropolitan Areas and major cities
Formulation of Major Logistic Network/ Development of access-controlled expressway network
International Gateways:
Airports and ports will function as major international gateways for goods movement. Chennai port,Ennore port, Krishnapatnam port, Chennai international airport, and Bengaluru international airportswill function as international gateways.
Primary Network:
Trunk National Highway : Golden Quadrilateral (NH4, NH5, NH7, NH46), North South East WestCorridor (NH7)
Expressway (Bengaluru – Chennai Expressway)

Final Report – Comprehensive Regional PlanPwC/ Nippon Koei 273
Source: JICA Study Team
Figure 6.3.12: Proposed Primary Logistic Road Network
Formulation of network between major logistic network and major logistic node and facility
Secondary Network:
The above primary network should be further supplemented and strengthened with strategicallyconfigured secondary network. A general guideline at this level of transport network is to link asfollows:
a. Urban Core - Sub Centre - District Centre
b. Primary Network –a
c. a - Port, Air Port.
Tertiary Network:
Although this level of road is not fully considered in this study, the needed function are connecting asfollows:
a. Primary Network, Secondary Network, Urban Primary Network - Logistic base (ICD, CFS, Industrial Park)
b. Logistic base (ICD, CFS, Industrial Park) –Logistic base (ICD, CFS, Industrial Park)

Final Report – Comprehensive Regional PlanPwC/ Nippon Koei 274
Source: JICA Study Team
Figure 6.3.13: Proposed Secondary Logistic Road Network
Congestion mitigation at Metropolitan Areas and major cities
Urban Primary Network:
Expanding and growing metropolitan areas, particularly in Chennai and Bengaluru require an effectiveand integrated interface between intercity roads and intra-urban roads

Final Report – Comprehensive Regional PlanPwC/ Nippon Koei 275
Source: JICA Study Team
Figure 6.3.14: Proposed Urban Primary Road Network
On the basis of the foregoing discussion, a conceptual long-term logistic road network plan has been formulatedand the network is divided into corridors as shown in Figure 6.3.15. Corridor function on the logistic roadnetwork is summarised inTable 6.3.22.

Final Report – Comprehensive Regional PlanPwC/ Nippon Koei 276
Source: JICA Study Team
Figure 6.3.15:CBIC Logistic Road Network

Final Report – Comprehensive Regional PlanPwC/ Nippon Koei 277
Table 6.3.22: Corridor Function on CBIC Logistic Road Network
Classification
CorridorID
RoadName
Section
Function
InternationalLogistic Network
InternationalGate
Connection
Regional Logistic Network
ArterialNationalHighway(GQ/NS
EW)
Expressway
Chennai,Bengaluru - Ports,Air Port
National Highway /State Highway
Urban
RingRoad,
Urban
Bypass
DistrictRoad /OtherRoad
a. Inter-Metropolitan
, UrbanCore, Sub
Center,DistrictCenter
b. ①-
a、④-Port,Air
Port
①②③④
⑤⑥-Logistic
base, InterLogistic
base
① ② ③ ④ ⑤ ⑥ ⑦
Pri
ma
ry
P1 NH4 ChitradurgaBangalore
North○
P2 NH4Bangalore
EastChittoor ○ ○
P3 NH4 Fallujah Chennai ○ ○
P4 NH5 Mathavaram Nellore ○ ○
P5 NH7 PenukondaBangalore
North○
P6 NH7Bangalore
SouthDharmapuri ○ ○
P7 NH46 Krishnagiri Fallujah ○ ○
P8
NH18-NH18A-NH205-
SH61
Chittoor Chittamur ○
P9
Bangalore-Chennai
Expressway
BangaloreEast
Chennai ○ ○
Sec
on
da
ry
S1 NH206 Tumkur Tiptur ○
S2 NH48Nelamangal
aKnigal ○
S3 SH9-SH96 GorantlaBangalore
North○
S4 NH209Bangalore
SouthKanakapura ○
S5SH82-SH99-NH205
HoskoteRenigunta
(Urban)○ ○
S6NH205-NH219
Mulakalacheruvu
Palamaner ○
S7 NH18 KalakadaPuthalapatt
u○ ○
S8NH205-
SH58Renigunta
Kancheepuram
○ ○
S9 NH205 Tiruttani Chennai ○ ○
S10 New Nellore Muthukur ○
S11 NH219 Palamaner Krishnagiri ○
S12 SH83-SH9 ChittoorTiruvannam
ala○ ○
S13 NH4 Gudipala Fallujah ○
S14SH116-
SH5Kancheepur
amTindivanam ○
S15NH66-NH45
KrishnagiriChengalpatt
u○ ○
Urb
anP
rim
ary
U-1PeripheralRing Road
BangaloreNorth
BangaloreEast
○
U-2Satellite
Ring RoadNelamangal
aNelamangal
a○
U-3Outer Ring
RoadPonneri Chennai ○
U-4PeripheralRing Road
PonneriChengalpatt
u○
Source: JICA Study Team

Final Report – Comprehensive Regional PlanPwC/ Nippon Koei 278
6.3.4.2.2 Enhancement of logistic Road Network Capacity and Level of Service
Forecasted growth in traffic demand necessitates an increase in the capacity of certain arterial road sections.Road capacity provision for excessive traffic demand is basically implemented by widening of existing roadssince corresponding road network of the CBIC logistic road network has been developed.
Accordingly, following strategic measures are proposed as Enhancement of logistic Road Network Capacity andLevel of Service:
a. Widening of existing roads to respond future traffic demand
Widening of existing roads to respond future traffic demand
Necessity of road capacity provision by widening of existing roads is examined for the future traffic demand in2018, 2023, 2028, and 2033 (BAU) calculated in section Future Case6.3.3.2. . The examination is made basedon following conditions:
New road link is not considered because applied traffic demand forecast method is not able to simulatetraffic distribution amongst road links
Committed road projects shown in Table 6.3.24are considered (Widening projects only)
Widening is provided when volume capacity ratio exceeds 1.25 in consideration of traffic condition byclassification of V/C shown in
Widening is proposed up to 8 lanes regardless of common practice in India (6 lanes on National Highway) dueto large number of forecasted traffic volume
Table 6.3.23
Widening is proposed up to 8 lanes regardless of common practice in India (6 lanes on National Highway) dueto large number of forecasted traffic volume
Table 6.3.23: Description of Traffic Condition by Classification of V/C
V/C Traffic Condition<1.0 No saturated traffic condition
Smooth traffic1.0 – 1.25 Less than 1-2 hours/day saturated traffic condition
Possible 1-2 hours/day traffic congestion1.25 – 1.75 Saturated traffic condition at peak hours
Possible 3-4 hour at morning & evening/day traffic congestion1.75< Generally saturated traffic condition in all day
Chronic traffic congestion
Source: “Road Capacity Manual” Japan Road Association, 1984
Table 6.3.24: Committed Projects on CBIC Logistic Corridors
CBIC Logistic Corridors Committed Projects
Classification
Corridor ID
Road Name SectionProjectID
SectionProposed
Number ofLanes
Term
S: - 2018M: 2018-
2023
Pri
ma
ry
P1 NH4Chitradurg
aBangalore
North
P2 NH4Bangalore
EastChittoor
KO3Bangalore
EastMulbagal 4 (Widening) S
AA2 Gangavaram Chittoor 4 (Widening) SP3 NH4 Fallujah ChennaiP4 NH5 Mathavara Nellore TO1 Mathavaram Sullurpeta 6 (Widening) S

Final Report – Comprehensive Regional PlanPwC/ Nippon Koei 279
CBIC Logistic Corridors Committed Projects
Classification
Corridor ID
Road Name SectionProjectID
SectionProposed
Number ofLanes
Term
S: - 2018M: 2018-
2023
m
P5 NH7Penukond
aBangalore
North
P6 NH7Bangalore
SouthDharmapu
ri
P7 NH46Krishnagir
iFallujah TO3 Krishnagiri Fallujah 6 (Widening) S
P8NH18-NH18A-NH205-SH61
Chittoor Chittamur AA1 Puthalapattu Renigunta 4 (Widening) S
P9Bangalore-
ChennaiExpressway
BangaloreEast
Chennai TA1Bangalore
EastChennai 6 (New) M
Sec
on
da
ry
S1 NH206 Tumkur Tiptur KU1 Tumkur Tiptur 4 (Widening) S
S2 NH48Nelamang
alaKnigal
S3 SH9-SH96 GorantlaBangalore
North
S4 NH209Bangalore
SouthKanakapur
a
S5SH82-SH99-
NH205Hoskote
Renigunta(Urban)
S6 NH205-NH219Mulakalac
heruvuPalamaner
S7 NH18 KalakadaPuthalapat
tu
S8 NH205-SH58 ReniguntaKancheepu
ramTO5 Renigunta Tiruttani 4 (Widening) S
S9 NH205 Tiruttani Chennai TO5 Tiruttani Chennai 4 (Widening) SS10 New Nellore Muthukur
S11 NH219 PalamanerKrishnagir
i
S12 SH83-SH9 ChittoorTiruvanna
malaS13 NH4 Gudipala Fallujah
S14 SH116-SH5Kancheepu
ramTindivana
m
S15 NH66-NH45Krishnagir
iChengalpa
ttuTA2
Chengalpattu
Cheyyur 6 (Widening) S
Urb
anP
rim
ary
U1Peripheral Ring
RoadBangalore
NorthBangalore
EastKA7
BangaloreNorth
Bangalore East 8 (New) S
U2Satellite Ring
RoadNelamang
alaNelamang
alaKO1 Nelamangala Hoskote 4 (Widening) S
U3Outer Ring
RoadPonneri Chennai
TO9 Ponneri Poonamalloe 6 (New) STA5 Poonamalloe Chennai 6 (New) S
U4Peripheral Ring
RoadPonneri
Chengalpattu
Source: JICA Study Team
Examination result of volume capacity ratio and necessary road capacity provision by widening of existingroads in 2018, 2023, 2028, and 2033 is shown inTable 6.3.25, Figure 6.3.16, and Figure 6.3.17.
Demand supply gap is still obvious even after 8 lanes provision on Chennai to Bengaluru section through NH7,NH46, and NH7, and ring and radial roads at Chennai and Bengaluru Metropolitan Areas after year 2033 asshown in Figure 6.3.15. To provide further road capacity to above critical corridors, expressway betweenChennai and Bengaluru and urban ring roads at Chennai and Bengaluru Metropolitan Areas should bedeveloped timely to disperse excessive corridor traffic demand.

Final Report – Comprehensive Regional PlanPwC/ Nippon Koei 280
Table 6.3.25: Volume Capacity Ratio and Necessary Road Widening
Classification
CorridorID
RoadName
SectionLength(km)
V/C w committed projects &projects
Number of Lanes
Present
2018
2023
2028
2033
Present
Committed
Project
Proposed
2018
2023
2028
2033
Pri
ma
ry
P1
a NH4 Chitradurga Hiriyur 75 A A A B C 6 - 6 6 8 8b Hiriyur Tumkur 87 A A A B B 6 - 6 6 6 8
c TumkurBangalore
North60 A B C E E 6 - 6 8 8 8
P2a NH4
BangaloreEast
Kolar 40 A A A B B 6 - 6 6 6 6
b Kolar Palamaner 72 A A A B B 4 4 4 4 4 4c Palamaner Chittoor 44 A A A A A 2 4 4 4 4 4
P3a NH4 Wallujah
Kancheepuram
37 B B D E E 4 6 8 8 8 8
bKancheepur
amChennai 47 A B B A A 4 6 6 6 8 8
P4a NH5 Nellore Chilakur 47 A A A A A 4 - 4 4 4 4b Chilakur Pnneri 89 A A A A A 6 6 6 6 6 6c Pnneri Mathavaram 22 A B A B B 6 - 6 6 6 6
P5
a NH7 Penukonda Gorantla 33 A A A A A 4 - 4 4 4 4
b GorantlaChikkaballa
pura58 A A A A A 4 - 4 4 4 4
cChikkaballa
puraBangalore
North51 A B B C D 6 - 6 6 8 8
P6
a NH7Bangalore
SouthAnekal 23 A B E E E 6 6 8 8 8
b Anekal Krishnagiri 58 A B A A A 6 6 6 6 6c Krishnagiri Dharmapuri 42 A A A A A 6 - 6 6 6 6d Dharmapuri Dharmapuri 26 A A A A A 6 - 6 6 6 6
P7a NH46 Krishnagiri Vellore 112 A A B C E 6 6 6 6 8 8b Vellore Fallujah 36 A B B D E 6 6 6 8 8 8
P8
a NH18 ChittoorPuthalapatt
u18 A B A B B 2 - 2 2 2 2
b NH18APuthalapatt
uRenigunta
(Urban)66 A A A A A 2 4 4 4 4 4
cNH205-
SH61Renigunta
(Urban)Chittamur 52
A A A A A 2 - 2 4 4 4
P9 a
Bangalore-
ChennaiExpress
way
BangaloreEast
Chennai 270
- - - - - - 6 - 6 6 6
Sec
on
da
ry
S1a NH206 Tumkur
Chiknayakanhalli
58 A C B A C 2 4 4 4 8 8
bChiknayaka
nhalliTiptur 35 A C A B B 2 4 4 4 6 8
S2 a NH48Nelamangal
aKnigal 70 A B B C E 4 - 4 6 8 8
S3a SH96 Gorantla
DodBallapur
86 A B A A B 2 - 2 4 4 4
b SH96Dod
BallapurBangalore
North27 C B A A C 2 - 4 4 8 8
S4 a NH209Bangalore
SouthKanakapura 60 A B A A B 2 - 2 4 6 8
S5
a SH82 Hoskote Kolar 21 A B A B B 2 - 2 4 6 8b SH82 Kolar Srinivaspur 40 A A A A A 2 - 2 2 4 4
c SH99 SrinivaspurMadanapall
e42 A A A A B 2 - 2 2 2 2
d NH205Madanapall
ePileru 55 A A A A A 2 - 2 2 2 2
e NH205 PileruRenigunta
(Urban)73 A A A A A 2 - 2 2 2 2
S6a NH205
Mulakalacheruvu
Madanapalle
40 A A A A A 2 - 2 2 2 2
b NH219Madanapall
ePalamaner 58 A A A A A 2 - 2 2 2 2
S7a NH18 Kalakada Pileru 32 A A A A A 2 - 2 2 2 2
b PileruPuthalapatt
u35 A B A B B 2 - 2 2 2 2
S8a NH205
Renigunta(Urban)
Tiruttani 57 A A A A A 4 4 4 4 4 4
b SH58 TiruttaniKancheepur
am39 A A A A A 2 - 4 4 4 4
S9a NH205 Tiruttani Thiruvallur 40 A A A A A 2 4 4 4 4 4b Thiruvallur Chennai 15 A A A A A 4 4 4 4 4 4

Final Report – Comprehensive Regional PlanPwC/ Nippon Koei 281
Classification
CorridorID
RoadName
SectionLength(km)
V/C w committed projects &projects
Number of Lanes
Present
2018
2023
2028
2033
Present
Committed
Project
Proposed
2018
2023
2028
2033
S10
a New Nellore Muthukur 33- - - - - 2 - 4 4 4 4
S11a NH219 Palamaner
Venkatagirikota
38 A A A A A 2 - 2 2 2 2
bVenkatagirik
otaKrishnagiri 64 A A A A A 2 - 2 2 2 4
S12
aNH4-New
Chittoor Katpadi 32A A A A A 2 4 4 4 4 4
b NH234 Katpadi Vellore 20 A A A A A 2 - 2 2 2 2c Vellore Polur 25 B C B A C 2 - 2 4 8 8
d PolurTiruvannam
ala41 A A A A A 2 - 2 2 2 2
S13
a NH4 Gudipala Fallujah 35A A A B B 2 - 4 4 6 8
S14
aSH116-
SH5Kancheepur
amTindivanam 84
A A A A B 2 - 2 2 2 4
S15
a NH66 Krishnagiri Uthangarai 48 A A A A A 2 - 2 2 2 2
b UthangaraiTiruvannam
ala55 A B A B B 2 - 2 4 4 6
cMadurantha
kamChengalpatt
u46 A A A A A 4 6 6 6 6 6
dChengalpatt
uChengalpatt
u15 A A A A A 4 6 6 6 6 6
Urb
anP
rim
ary
U1a
Peripheral RingRoad
BangaloreNorth
BangaloreSouth
65- - - - - - 8 - 8 8 8
bBangalore
SouthBangalore
North45 A A A A A 4 - 4 4 4 4
U2
a SatelliteRingRoad
NH207
Nelamangala
Hoskote 99 A B A A B 2 4 4 4 6 8
b Hoskote Hosur 45
B B C C E 2 - 4 6 8 8
c New Hosur Kanakapura 52 - - - - - - - - 4 6 8
d SH3 KanakapuraNelamangal
a98 A A A C E 2 - 4 4 4 4
U3a
OuterRingRoad
PonneriPoonamalle
e30
- - - - - - 6 6 6 6 6
bPoonamalle
eChennai 31 - - - - - - 6 6 6 6 6
U4
aPeripheral RingRoad
Ponneri Uthukkottai 41- - - - - - - - 4 4 4
b UthukkottaiChengalpatt
u70 A B B A A 2 - 2 4 4 4
cChengalpatt
uChengalpatt
u28 - - - - - - - - 4 4 4
3488Note: V/C (A; 0-1.0, B; 1.0-1.25, C; 1.25-1.75, D; 1.75-2.0, E; 2.0-)
Source: JICA Study Team

Final Report – Comprehensive Regional PlanPwC/ Nippon Koei 282
Source: JICA Study TeamFigure 6.3.16: Volume Capacity Ratio (2018, 2023, 2028, 2033, with widening projects)

Final Report – Comprehensive Regional PlanPwC/ Nippon Koei 283
Source: JICA Study TeamFigure 6.3.17: Necessary Widening for Future Traffic Demand (2018, 2023, 2028, 2033)

Final Report – Comprehensive Regional PlanPwC/ Nippon Koei 284
6.3.5Development Goals and Target Performance IndicatorsRoad development plan basically focus on network formulation and capacity provision in consideration ofsector issues. Road networking should also be considered redundancy to ensure regular logistic transportservice and network substitutability in emergency case. Therefore, proposed road network should basicallyprovide dual connection to important logistic nodes.
As for the capacity provision, vehicle capacity ratio is index to judge necessity of capacity increment forindividual road section. Table 6.3.26shows traffic condition under particular volume capacity ratio and 1.25 isset as border line of capacity increment in this study.
Table 6.3.26: Description of Traffic Condition by Classification of V/C
V/C Traffic Condition>1.0 No saturated traffic condition
Smooth traffic1.0 – 1.25 Less than 1-2 hours/day saturated traffic condition
Possible 1-2 hours/day traffic congestion1.25 – 1.75 Saturated traffic condition at peak hours
Possible 3-4 hour at morning & evening/day traffic congestion1.75 < Generally saturated traffic condition in all day
Chronic traffic congestion
Source: “Road Capacity Manual” Japan Road Association, 1984
Above target performance indicators are fairly considered in road networking and capacity provision of roaddevelopment strategy as mentioned in section 6.3.4.2.

Final Report – Comprehensive Regional PlanPwC/ Nippon Koei 285
6.3.6Development Plan and Suggested ProjectBased on proposed logistic road network and examination result of necessary widening for future trafficdemand in the road development strategy, master plan candidate projects are identified as shown Table6.3.27and Figure 6.3.18. This project list includes ongoing projects as well as projects proposed in the variousdevelopment plans. Project cost is also estimated in accordance with the proposed master plan candidateprojects as shown in Table 6.3.27.
Table 6.3.27: Current and Proposed Road Projects on identified Logistic Corridors within the CBIC area
Classificati
on
Corridor ID
Road Name SectionLength(km)
Number of LanesProject Cost(mil. USD)
Present
Committed
Project
Proposed
2018 2023 2028 20332018 2023 2028 2033
Pri
ma
ry
P1
a NH4 Chitradurga Hiriyur 75 6 - 6 6 8 8 0 0 90 0
b Hiriyur Tumkur 87 6 - 6 6 6 8 0 0 0 104.4
c Tumkur Bangalore North 60 6 - 6 8 8 8 0 72 0 0
P2
a NH4 Bangalore East Kolar 40 6 - 6 6 6 6 0 0 0 0
b Kolar Palamaner 72 4 4 4 4 4 4 0 0 0 0c Palamaner Chittoor 44 2 4 4 4 4 4 52.8 0 0 0
P3a NH4 Wallajah Kancheepuram 37 4 6 8 8 8 8 81.4 0 0 0
b Kancheepuram Chennai 47 4 6 6 6 8 8 56.4 0 56.4 0
P4a NH5 Nellore Chilakur 47 6 - 4 4 4 4 0 0 0 0b Chilakur Ponneri 89 6 6 6 6 6 6 0 0 0 0c Pnneri Mathavaram 22 6 - 6 6 6 6 0 0 0 0
P5
a NH7 Penukonda Gorantla 33 4 - 4 4 4 4 0 0 0 0
b Gorantla Chikkaballapura 58 4 - 4 4 4 4 0 0 0 0
cChikkaballapur
aBangalore North 51 6 - 6 6 8 8 0 0 61.2 0
P6
a NH7Bangalore
SouthAnekal 23 6 - 6 8 8 8 0 27.6 0 0
b Anekal Krishnagiri 58 6 - 6 6 6 6 0 0 0 0c Krishnagiri Dharmapuri 42 6 - 6 6 6 6 0 0 0 0d Dharmapuri Dharmapuri 26 6 - 6 6 6 6 0 0 0 0
P7a NH46 Krishnagiri Vellore 112 6 6 6 6 8 8 0 0 134.4 0
b Vellore Wallajah 36 6 6 6 8 8 8 0 43.2 0 0
P8
a NH18 Chittoor Puthalapattu 18 2 - 2 2 2 2 0 0 0 0
b NH18A PuthalapattuRenigunta
(Urban)66 2 4 4 4 4 4 79.2 0 0 0
cNH205-
SH61Renigunta
(Urban)Chittamur 52
2 - 2 4 4 4 0 62.4 0 0
P9 aBangalore-
ChennaiExpressway
Bangalore East Chennai 270- 6 - 6 6 6 1100
Sec
on
da
ry
S1a NH206 Tumkur Chiknayakanhalli 58 2 4 4 4 8 8 0 69.6 127.6 0
bChiknayakanha
lliTiptur 35 2 4 4 4 6 8 0 42 42 42
S2 a NH48 Nelamangala Knigal 70 4 - 4 6 8 8 0 84 84 0
S3a SH96 Gorantla Dod Ballapur 86 2 - 2 4 4 4 0 103.2 0 0
b SH96 Dod Ballapur Bangalore North 27 2 - 4 4 8 8 32.4 0 59.4 0
S4 a NH209Bangalore
SouthKanakapura 60 2 - 2 4 6 8 0 72 72 72
S5
a SH82 Hoskote Kolar 21 2 - 2 4 6 8 0 25.2 25.2 25.2
b SH82 Kolar Srinivaspur 40 2 - 2 2 4 4 0 0 48 0c SH99 Srinivaspur Madanapalle 42 2 - 2 2 2 2 0 0 0 0
d NH205 Madanapalle Pileru 55 2 - 2 2 2 2 0 0 0 0
e NH205 PileruRenigunta
(Urban)73 2 - 2 2 2 2 0 0 0 0
S6a NH205
Mulakalacheruvu
Madanapalle 40 2 - 2 2 2 2 0 0 0 0
b NH219 Madanapalle Palamaner 58 2 - 2 2 2 2 0 0 0 0
S7a NH18 Kalakada Pileru 32 2 - 2 2 2 2 0 0 0 0
b Pileru Puthalapattu 35 2 - 2 2 2 2 0 0 0 0
S8a NH205
Renigunta(Urban)
Tiruttani 57 4 4 4 4 4 4 0 0 0 0
b SH58 Tiruttani Kancheepuram 39 2 - 4 4 4 4 46.8 0 0 0
S9a NH205 Tiruttani Thiruvallur 40 2 4 4 4 4 4 48 0 0 0
b Thiruvallur Chennai 15 4 4 4 4 4 4 0 0 0 0

Final Report – Comprehensive Regional PlanPwC/ Nippon Koei 286
Classificati
on
Corridor ID
Road Name SectionLength(km)
Number of LanesProject Cost(mil. USD)
Present
Committed
Project
Proposed
2018 2023 2028 20332018 2023 2028 2033
S10
a New Nellore Muthukur 332 - 4 4 4 4 39.6 0 0 0
S11a NH219 Palamaner Venkatagirikota 38 2 - 2 2 2 2 0 0 0 0
bVenkatagirikot
aKrishnagiri 64 2 - 2 2 2 4 0 0 0 76.8
S12
a NH4-New Chittoor Katpadi 32 2 - 4 4 4 4 38.4 0 0 0
b NH234 Katpadi Vellore 20 2 - 2 2 2 2 0 0 0 0c Vellore Polur 25 2 - 2 4 8 8 0 30 55 0d Polur Tiruvannamala 41 2 - 2 2 2 2 0 0 0 0
S13 a NH4 Gudipala Wallajah 35 2 4 4 4 6 8 42 0 42 42S14 a SH116-SH5 Kancheepuram Tindivanam 84 2 - 2 2 2 4 0 0 0 100.8
S15
a NH66 Krishnagiri Uthangarai 48 2 - 2 2 2 2 0 0 0 0
b NH66 Uthangarai Tiruvannamalai 55 2 - 2 4 4 6 0 66 0 66
c NH45Maduranthaka
mChengalpattu 46 4 6 6 6 6 6 55.2 0 0 0
d NH45 Chengalpattu Chengalpattu 15 4 6 6 6 6 6 18 0 0 0
Urb
anP
rim
ary
U1a
PeripheralRing Road
BangaloreNorth
Bangalore South 65- 8 - 8 8 8 900
bBangalore
SouthBangalore North 45 4 - 4 4 4 4 0 0 0 0
U2
aSatellite RingRoad NH207
Nelamangala Hoskote 992 4 4 4 6 8 118.8 0 118.8 118.8
b New Hoskote Hosur 45 2 - 4 6 8 8 54 54 54 0c New Hosur Kanakapura 52 - - - 4 6 8 0 0 62.4 62.4d SH3 Kanakapura Nelamangala 98 2 - 4 4 4 4 117.6 0 0 0
U3a
Outer RingRoad
Ponneri Poonamallee 30- 6 6 6 6 6 161
b Poonamallee Chennai 31 - 6 6 6 6 6
U4
aPeripheralRing Road
Ponneri Uthukkottai 41- - - 4 4 4 0 90.2 0 0
b Uthukkottai Chengalpattu 70 2 - 2 4 4 4 0 84.0 0 0
c Chengalpattu Chengalpattu 28 - - - 4 4 4 0 61.6 0 0
3,488 1942 2,087 1,132 710
5,871
Source: JICA Study Team

Final Report – Comprehensive Regional PlanPwC/ Nippon Koei 287
Source: JICA Study Team
Figure 6.3.18: Current and Proposed Road Projects on identified Logistic Corridors within the CBIC area

Final Report – Comprehensive Regional PlanPwC/ Nippon Koei 288
6.3.7Phasing Plan
6.3.7.1 Criteria for Phasing PlanProject implementation should basically follow the examination result of necessary widening for future trafficdemand. However, project implementation of proposed new project such as Bengaluru – Chennai Expresswayand urban ring roads in Chennai and Bengaluru Metropolitan Area should be considered other factors such astiming of land acquisition and development coordination with connecting facilities.
Phasing criteria is examined based on above consideration. The selection criteria for project phasing areproposed as follows:
(1) Phasing should be given in line with schedule of ongoing project
(2) Widening should not be prior investment against traffic demand to minimize investment cost
(3) Ring roads at metropolitan area should be implemented timely in consideration of urbanization trend andland acquisition
(4) Proper implementation sequence amongst neighbouring projects should be consider network rationality
6.3.7.2 Phasing PlanBased on the identified project and the criteria for phasing plan, phasing plan of the logistic road network isformulated as shown inTable 6.3.29and Figure 6.3.19 to Figure 6.3.21.
6.3.7.3 Conclusion In total, Fifty four projects (including committed projects) for a length2, 975km have been proposed as
strategic road infrastructure project.
Seven projects are new project and forty seven projects are widening projects.
Total project cost of the logistic road network project is 5,871million USD. Project costs of each term are1,942 million USD in short-term, 2,087 million USD in medium-term, and 1,842 million USD in long-term.
Table 6.3.28: Summary of Identified Projects on CBIC Logistic Road Network Plan
ClassificationNumber of
Project
TotalLength(km)
Project Cost (million USD)
2013-2018 2019-2023 2023-2028 2029-2033
Primary 14 1007 271 1,305 342 104Secondary 28 1251 320 492 555 425
Urban Primary 12 717 1,351 290 235 18154 2975 1,942 2,087 1,842
5,871Source: JICA Study Team

Final Report – Comprehensive Regional PlanPwC/ Nippon Koei 289
Table 6.3.29: Phasing Plan of CBIC Logistic Road Network Plan
Classificati
on
CorridorID
RoadName
SectionLength(km)
Project Cost(mil. USD)
Implementation Schedule
2018 2023 2028 2033 -2018 -2023 -2028 -2033
Pri
ma
ry
P1
a NH4 Chitradurga Hiriyur 75 0 0 90 0 30
30
30
b Hiriyur Tumkur 87 0 0 0 104.4 35
35
35
c TumkurBangalore
North60 0 72 0 0 3
636
P2
a NH4Bangalore
EastKolar 40 0 0 0 0
b Kolar Palamaner 72 0 0 0 0
c Palamaner Chittoor 44 52.8 0 0 0 26
26
P3a NH4 Fallujah
Kancheepuram
37 81.4 0 0 0 41
41
bKancheepura
mChennai 47 56.4 0 56.4 0 2
828
28
28
P4
a NH5 Nellore Chilakur 47 0 0 0 0b Chilakur Pnneri 89 0 0 0 0
c PnneriMathavara
m22 0 0 0 0
P5
a NH7 Penukonda Gorantla 33 0 0 0 0
b GorantlaChikkaballa
pura58 0 0 0 0
cChikkaballap
uraBangalore
North51 0 0 61.2 0 3
131
P6
a NH7Bangalore
SouthAnekal 23 0 27.6 0 0 1
414
b Anekal Krishnagiri 58 0 0 0 0
c KrishnagiriDharmapur
i42 0 0 0 0
d DharmapuriDharmapur
i26 0 0 0 0
P7a NH46 Krishnagiri Vellore 112 0 0 134.4 0 3
434
34
34
b Vellore Fallujah 36 0 43.2 0 0 22
22
P8
a NH18 ChittoorPuthalapatt
u18 0 0 0 0
b NH18A PuthalapattuRenigunta
(Urban)66 79.2 0 0 0 2
626
26
cNH205-
SH61Renigunta
(Urban)Chittamur 52 0 62.4 0 0 3
131
P9 a
Bangalore-
ChennaiExpress
BangaloreEast
Chennai 270 1100220
220
220
220
220

Final Report – Comprehensive Regional PlanPwC/ Nippon Koei 290
Classificati
on
CorridorID
RoadName
SectionLength(km)
Project Cost(mil. USD)
Implementation Schedule
2018 2023 2028 2033 -2018 -2023 -2028 -2033
way
Sec
on
da
ry
S1a NH206 Tumkur
Chiknayakanhalli
58 0 69.6 127.6 0 35
35
43
43
43
bChiknayakan
halliTiptur 35 0 42 42 42 2
121
21
21
21 21
S2 a NH48 Nelamangala Knigal 70 0 84 84 0 28
28
28
28
28
28
S3a SH96 Gorantla
DodBallapur
86 0 103.2 0 0 34
34
34
b SH96 Dod BallapurBangalore
North27 32.4 0 59.4 0 1
616
30
30
S4 a NH209Bangalore
SouthKanakapur
a60 0 72 72 72 3
636
36
36
36
36
S5
a SH82 Hoskote Kolar 21 0 25.2 25.2 25.2 13
13
13
13
13 13
b SH82 Kolar Srinivaspur 40 0 0 48 0 24
24
c SH99 SrinivaspurMadanapall
e42 0 0 0 0
d NH205 Madanapalle Pileru 55 0 0 0 0
e NH205 PileruRenigunta
(Urban)73 0 0 0 0
S6a NH205
Mulakalacheruvu
Madanapalle
40 0 0 0 0
b NH219 Madanapalle Palamaner 58 0 0 0 0
S7a NH18 Kalakada Pileru 32 0 0 0 0
b PileruPuthalapatt
u35 0 0 0 0
S8a NH205
Renigunta(Urban)
Tiruttani 57 0 0 0 0
b SH58 TiruttaniKancheepur
am39 46.8 0 0 0 2
323
S9a NH205 Tiruttani Thiruvallur 40 48 0 0 0 2
424
b Thiruvallur Chennai 15 0 0 0 0
S10 a New Nellore Muthukur 33 39.6 0 0 0 20
20
S11a NH219 Palamaner
Venkatagirikota
38 0 0 0 0
bVenkatagiriko
taKrishnagiri 64 0 0 0 76.8 2
626 26
S12
aNH4-New
Chittoor Katpadi 32 38.4 0 0 0 19
19
b NH234 Katpadi Vellore 20 0 0 0 0
c Vellore Polur 25 0 30 55 0 15
15
28
28
d PolurTiruvanna
mala41 0 0 0 0
S13 a NH4 Gudipala Fallujah 35 42 0 42 42 21
21
21
21
21 21
S14 a SH116- Kancheepura Tindivanam 84 0 0 0 100.8 34
34 34

Final Report – Comprehensive Regional PlanPwC/ Nippon Koei 291
Classificati
on
CorridorID
RoadName
SectionLength(km)
Project Cost(mil. USD)
Implementation Schedule
2018 2023 2028 2033 -2018 -2023 -2028 -2033
SH5 m
S15
a NH66 Krishnagiri Uthangarai 48 0 0 0 0
b UthangaraiTiruvanna
mala55 0 66 0 66 3
333
33 33
cMaduranthak
amChengalpatt
u46 55.2 0 0 0 2
828
d ChengalpattuChengalpatt
u15 18 0 0 0 9 9
Urb
anP
rim
ary
U-1a
Peripheral RingRoad
BangaloreNorth
BangaloreSouth
65 900225
225
225
225
bBangalore
SouthBangalore
North45 0 0 0 0
U-2
a
SatelliteRingRoad
NH207
Nelamangala Hoskote 99 118.8 0 118.8 118.8 30
30
30
30
30
30
30
30
30
30
30 30
b New Hoskote Hosur 45 54 54 54 0 27
27
27
27
27
27
c New HosurKanakapur
a52 0 0 62.4 62.4 3
131
31 31
d SH3 KanakapuraNelamangal
a98 117.6 0 0 0 2
929
29
29
U-3a
OuterRingRoad
PonneriPoonamalle
e30 161 3
232
32
32
32
b Poonamallee Chennai 31
U-4
aPeripheral RingRoad
Ponneri Uthukkottai 41 0 90.2 0 0 30
30
30
b UthukkottaiChengalpatt
u70 0 84.0 0 0 4
242
c ChengalpattuChengalpatt
u28 0 61.6 0 0 3
131
3,488 1,942 2,087 1,132 710 1,942 2,087 1,132 710Note: V/C (A; 0-1.0, B; 1.0-1.25, C; 1.25-1.75, D; 1.75-2.0, E; 2.0-) 5,871
Source: JICA Study Team

Final Report – Comprehensive Regional PlanPwC/ Nippon Koei 292
Source: JICA Study Team
Figure 6.3.19: Phasing Plan of CBIC Logistic Road Network Plan (~2018)

Final Report – Comprehensive Regional PlanPwC/ Nippon Koei 293
Source: JICA Study Team
Figure 6.3.20: Phasing Plan of CBIC Logistic Road Network Plan (2019~2023)

Final Report – Comprehensive Regional PlanPwC/ Nippon Koei 294
Source: JICA Study Team
Figure 6.3.21: Phasing Plan of CBIC Logistic Road Network Plan (2024~2033)