comprehensive grid integration of solar power for sdg&e · comprehensive grid integration of...
TRANSCRIPT

Comprehensive Grid Integration of Solar Power
for SDG&EJan Kleissl, Carlos Coimbra, Bill Torre (PIs)
Professor, Mechanical & Environmental Engineering
UC San Diego
Co‐Director, UCSD Center for Energy Research, Center for Renewable Resources and Integration
http://solar.ucsd.edu
CSI Solar RD&D Programwww.calsolarresearch.ca.gov
CSI RD&D Program Manager
Project Sponsors and Partners
CPUC CSI Solar RD&D Programwww.calsolarresearch.ca.gov
Costshare:
Partners:

COIMBRA ENERGY GROUPUNIVERSITY OF CALIFORNIA SAN DIEGO
Motivation
Backdrop:• Continued growth in solar energy installations.• Increased interest in energy storage deployments.Demonstration:• Foresight improves system management.• Feeders have a larger solar hosting capacity then previously assumed.• Distribution feeder voltage quality can be improved by proper energy storage siting and operation.

Task Overview
• Task 2: Operational Solar Forecasting• Task 3: Operational Feeder Net Load Forecasting• Task 4.1: Distribution Feeder Hotspots• Task 4.2: Energy Storage Siting and Sizing on Distribution Feeders• Task 4.3: Mitigate Grid Fluctuations
Q&A
Q&A

Task 2: Operational Solar Forecasting
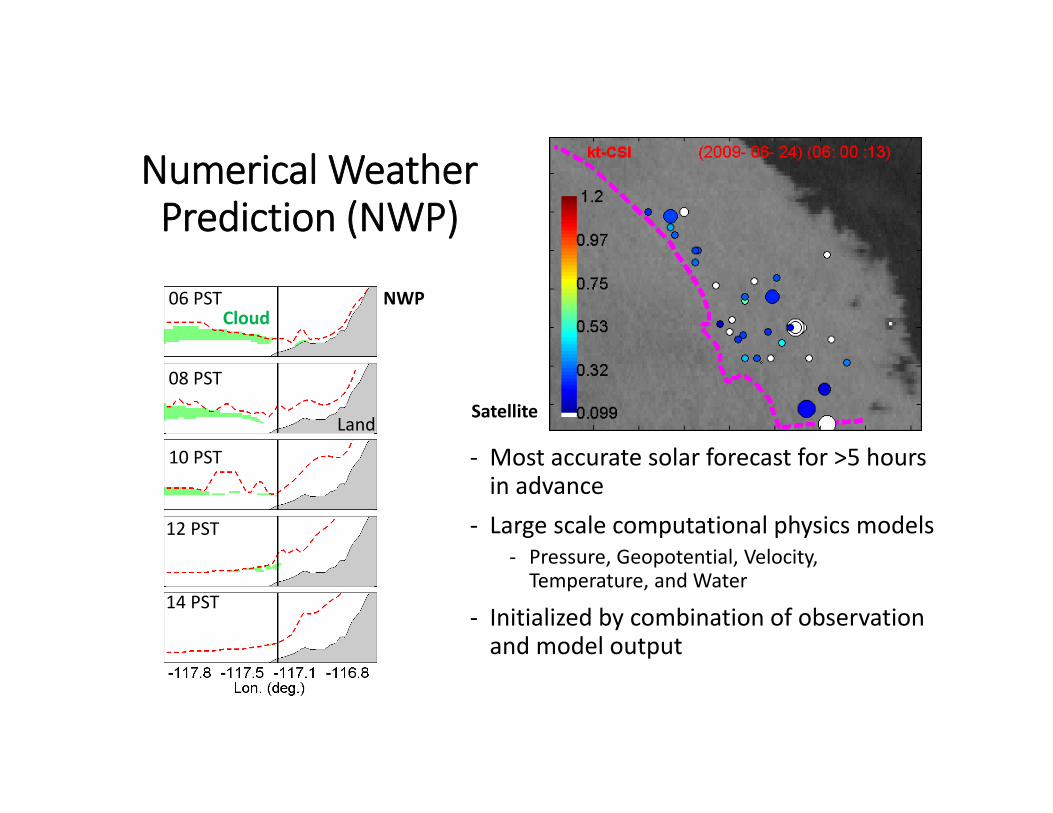
Numerical Weather Prediction (NWP)
‐ Most accurate solar forecast for >5 hours in advance
‐ Large scale computational physics models‐ Pressure, Geopotential, Velocity, Temperature, and Water
‐ Initialized by combination of observation and model output
Satellite
NWP06 PST
08 PST
10 PST
12 PST
14 PST
Land
Cloud

WRF (Weather Research and Forecasting) Model‐ Physics chosen to promote cloud cover‐ High‐Density Vertical Levels‐ Multi‐physics ensemble prediction system
Analog Ensemble Correction• Training period: May 2014 – Apr 2015• Validation period: May 2014 – Apr 2015 (excluding current day and current day + 5 days)
Domain/TimeOptions
Δx(km) 2.5VerticalPts. 75CFL 0.3
OutputInterval(m.) 15
Spin‐UpInterval(hr.) 24+(Cycling)
InitialandBoundary 12UTCNAM
Ensemble Prediction System

SDG&E Distributed Energy Resource Management System (DERMS)
• Systemwide load flow analysis • Switching• Emergency Operations• Forecasts used operationally
• Solar forecast input as Solar Potential Index by Climate Zone
• 0600 PT Delivery Time• Hourly for intra‐day and day‐ahead

Validation
SolarAnywhereWRFWRF + Analog Ensemble
June 20 June 24Global H
orizo
ntal Irradiance [W
m‐2]
• Against SolarAnywhere satellite data and SDG&E ground stations• By climate zone
• Original WRF and Analog Ensemble correction

Monthly mean hourly MAE
Final product (AnEn) improves 20% over smart persistence.

COIMBRA ENERGY GROUPUNIVERSITY OF CALIFORNIA SAN DIEGO
Task 3: Granular Operational Net Load Forecasting
Carlos F. M. Coimbra and Hugo T. C. PedroCenter for Energy Research
University of California San Diego

COIMBRA ENERGY GROUPUNIVERSITY OF CALIFORNIA SAN DIEGO
Task description
• Develop accurate net load forecast models for 68 SDG&E substations and feeders.
• Deploy multi‐layer stochastic learning forecast engines to predict the substations and feeders net load.
• Produce intra‐hour (5 to 60 min) and multiple days‐ahead net load forecasts.
• Use co‐located UCSD sky imagers and SDG&E solar irradiance sensors as proxy indicators of cloud cover.

COIMBRA ENERGY GROUPUNIVERSITY OF CALIFORNIA SAN DIEGO
Tools and data processingCoimbra Energy Group

COIMBRA ENERGY GROUPUNIVERSITY OF CALIFORNIA SAN DIEGO
Data De‐trending• Attempts to remove daily trend.
Load = [De‐trended Load] x [Daily Trend]
• Daily trends are computed as the mean load in 5 min bins.
• Benefits the performance of the stochasticforecasting models by removing consistent trends in the data.

COIMBRA ENERGY GROUPUNIVERSITY OF CALIFORNIA SAN DIEGO
Solar Forecast Data• Sky images are used as input to the intra‐hour forecast models• Normalized Red/Blue ratio (NRBR) image features are extracted .• These features are used asinput to the intra‐hourforecast models
• North American Model (NAM)for day‐ahead forecasts.
Top: Clear‐sky, overcast and partly cloudy images.Bottom: the resulting NRBR images.

COIMBRA ENERGY GROUPUNIVERSITY OF CALIFORNIA SAN DIEGO
Forecast models
• Three models are used in this work• Persistence model• Support Vector Regression (SVR)• Artificial Neural Networks (ANN)
• Supervised models (ANN, SVR) are trained with historical data and validated against an independent testing set.
• Validation metrics: MBE, RMSE, MAPE, etc.
SVR orANN
Measured data
Sky‐images(if available)
Forecast
SVR orANN
Measured data
NAM Data
Forecast
Intra‐hour
Day‐ahead

COIMBRA ENERGY GROUPUNIVERSITY OF CALIFORNIA SAN DIEGO
Forecast ResultsCoimbra Energy Group

COIMBRA ENERGY GROUPUNIVERSITY OF CALIFORNIA SAN DIEGO
Intra‐hour forecast: Time Series
Sample time series of net load forecasts and absolute forecast errors (ε) for the Feeder B for a period of 48h using (a) ANN and (b) SVR. The timestamps indicate midnight (00:00) PDT.

COIMBRA ENERGY GROUPUNIVERSITY OF CALIFORNIA SAN DIEGO
Intra‐hour forecast: Error metrics
Daytime errors for reference persistence forecasts, endogenous forecasts (just measured data used as input), and forecasts with image data for 10-, 20-, and 30- minute horizons. The red boxes identify the best model as a function of the relative RMSE.

COIMBRA ENERGY GROUPUNIVERSITY OF CALIFORNIA SAN DIEGO
Day‐ahead forecast: Time Series
Sample time series of 2‐day ahead net load forecasts (top row) and absolute forecast errors (bottom row) for the Feeder B for a period of 1‐week using ANN (left column) and SVR (right column). Persistence forecast errors are shown for reference in grey. Timestamps are in UTC.

COIMBRA ENERGY GROUPUNIVERSITY OF CALIFORNIA SAN DIEGO
Day‐ahead forecast: Error metrics
1 day ahead 2 days ahead
Net load forecasting results for 1 and 2 days forecast horizon for four feeders. The red boxes identify the best model as a function of the relative RMSE and MAPE.

COIMBRA ENERGY GROUPUNIVERSITY OF CALIFORNIA SAN DIEGO
Conclusions – Net Load Forecasting
• Intra‐hour and multiple day‐ahead forecasts were successfully developed for the 68 SDG&E substations.
• The models were assembled into forecasting engines that are ready to be deployed in real time.
• Very small latency allows for operational forecasts if real‐time telemetry data is made available.
• Data de‐trending and image processing algorithms were implemented to improve the performance of all forecasts

COIMBRA ENERGY GROUPUNIVERSITY OF CALIFORNIA SAN DIEGO
Q&A #1

Task 4.1: Distribution Feeder Hotspots

Max. Load
[1]: IEA, Report IEA‐PVPS T5‐10, 2002
with PVwith PVbase casebase case
Min. Load
Simplified power system
Tap down due to solar
On‐Load Tap Changer
Voltage Rise due to PV

14 SDG&E Distribution FeedersCircuit ID 1 2 3 4 5 6 7 8 9 10 11 12 13 14Feeder Type urban urban urban Urban urban urban urban urban urban urban urban rural rural ruralTotal Feeder length (km)
53 58 41 45 52 55 49 56 45 51 40 35 52 115
# Supply Transformers
298 312 285 243 416 324 212 139 260 376 322 281 276 649
Peak Load (MVA) 8.0 9.7 9.5 5.9 10.8 13.2 9.8 8.8 8.0 13.6 8.4 4.9 3.9 6.3# Capacitors / Rated Reactive Power (MVar)
1/1.2
1/1.2
3/1.2, 0.8,1.2
1/1.2
1/1.2
1/1.2
(3)*/1.2, 1.2, 1.2
2/1.2,1.2
1/1.2
4/1.2,1.2,1.2,1.2
(2)*/1.2,1.2
(2)*/1.2,1.2
(1)*/1.2
(1)*/1.2
# Substation Transformers and Voltage Regulators
1 1 1 1 1 1 1 1 1 1 1 2 2 2
# PV systems 180 105 106 83 95 62 69 147 66 71 340 364 104 387Peak PV output (MWAC)
1.9 1.1 0.7 0.8 0.9 0.8 0.8 1.9 1.1 1.3 5.1 1.3 2.7 2.4
2015 PV Penetration Level (%)
24 12 7 13 8 6 8 22 14 9 60 51 71 38
Substation set‐point voltage (pu)
1.02 1.02 1.02 1.02 1.02 1.02 1.02 1.02 1.02 1.02 1.01 0.98 0.99 1.01

Hotspot Criteria
PV penetration (installed PV capacity / load peak) from 0 to 300%. Hotspots consist of:• Over‐ or under‐voltage at a node that exceeds ±5% of a nominal 12 kV • Steady‐state power flow that exceeds the thermal rating of the conductor
Also quantified:• On‐Load Tap Changer (OLTC) operations• Capacitor switches• Voltage variability (step changes in voltage)

Sample Results for Feeder 3
PV Distribution: Feeder 3
PV
Siz
e [k
W]
5
10
15
20
25
Over Voltage Based Hotspot Map: Feeder 3
PV
Pen
etra
tion
[%]
125
150
175
200
225
250
275
300
0 50 100 150 200 250 3000
1
2
3
4
5
6
PV Penetration [%]
Dai
ly A
vera
ge
Tap Operation: Feeder 3
0 50 100 150 200 250 3000
20
40
60
80
100
120
PV Penetration [%]
Dai
ly A
vera
ge
Capacitor Switching Events: Feeder 3

All feeders
Feeder ID
Existing PV Pene‐tration
Lowest PV Penetration Coinciding with a Hotspot
Max Voltage Variability at Lowest PV Penetration Coinciding with a Hotspot
Transformer Tap Changes at 0% PV [/day]
Tap Changes at 300% PV Penetration [/day]
Rating of conductor/s creating a feeder hotspot at lowest PV penetration
Trunk Section Rating
1 24% 280% 2.0% 3.7 3.7 130 A 700 A2 12% 250% 4.2% 4.5 4.5 500 A 580 A3 7% 125% 3.0% 4.0 5.6 180 A 700 A4 13% 200% 2.2% 1.6 2.8 180 A 770 A5 8% 150% 2.4% 4.7 4.2 130 A 770 A6 6% 125% 3.2% 6.0 8.0 115 A 700 A7 8% 125% 2.4% 1.0 11 180 A 580 A8 22% 150% 3.2% 11 9.0 130 A 700 A9 14% 100% 1.7% 2.7 2.2 130 A 770 A10 9% 100% 4.7% 9.2 9.7 180 A 580 A11 60% 100% 2.6% 2.0 9.5 15 A 520 A12 51% 260% 1.5% 3.5 10 180 A 520 A13 71% 250% 3.0% 18 44 130 A 520 A14 38% 100% 5.2% 31 78 180 A 770 A

Conclusions – Feeder Hotspots
• Most feeders have a hosting capacity far exceeding 15%• Many feeder sections show no issues even at 300% penetration
• Most hotpots arise on feeder branches.• Some short‐term voltage variability issues.• Tap operations:
• On 6 feeders no change from 0 to 300%• Large increase on some other feeders

Task 4.2: Energy Storage Siting and Sizing

How to cope with solar PV adoption?
[1]: Alam et al., “Distributed energy storage of mitigation of voltage‐rise impact caused by rooftop solar PV”
Battery charging
Battery discharging
BESS PV Load
BESS: Battery Energy Storage Systems

But how to allocate batteries in the grid?
Some of many questions:Where do we need them?What size? How should we operate them?How will we pay for them?
BESS
?
BESS: Battery Energy Storage Systems

The goal: What: To optimally site and size BESS(s) Where: Anywhere in a distribution networkWhy: To mitigate voltage fluctuations caused by solar PV
where ns: system locations of a setks: system capacities of a setm: # of systemsNall : permissible maximum locationsKall : permissible system locations
voltage deviation reduction
cost penalty parameter
Problem Formulation

Solar Data: 15‐minute solar PV output data from UC San Diego campus systems during the year 2014
Load Data: 15-minute synthetic data generated for San Diego region by Open Energy Information during the year 2014
IEEE8500 test feeder one‐line diagram
Test Network:Radial distribution feeder with multiple feeder regulators and capacitors with balanced 120V secondary loads on the service transformers.
Data and Test Network
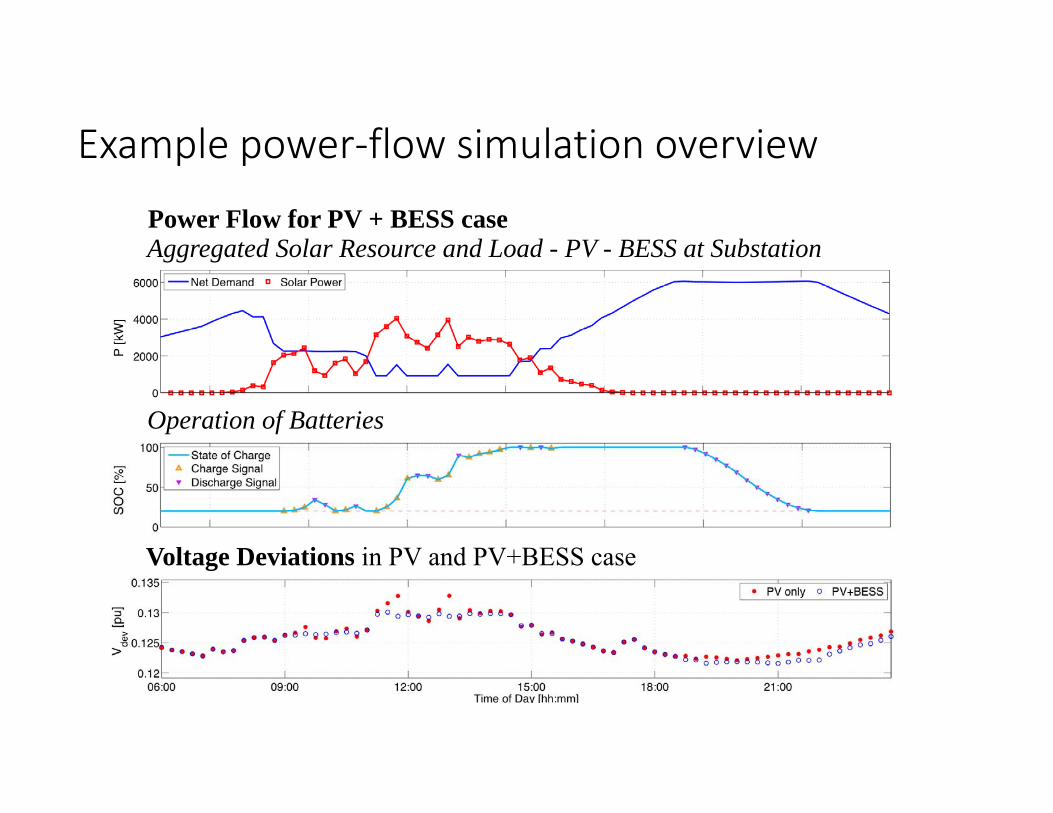
Example power‐flow simulation overview
Operation of Batteries
Aggregated Solar Resource and Load - PV - BESS at Substation
Voltage Deviations in PV and PV+BESS case
Power Flow for PV + BESS case
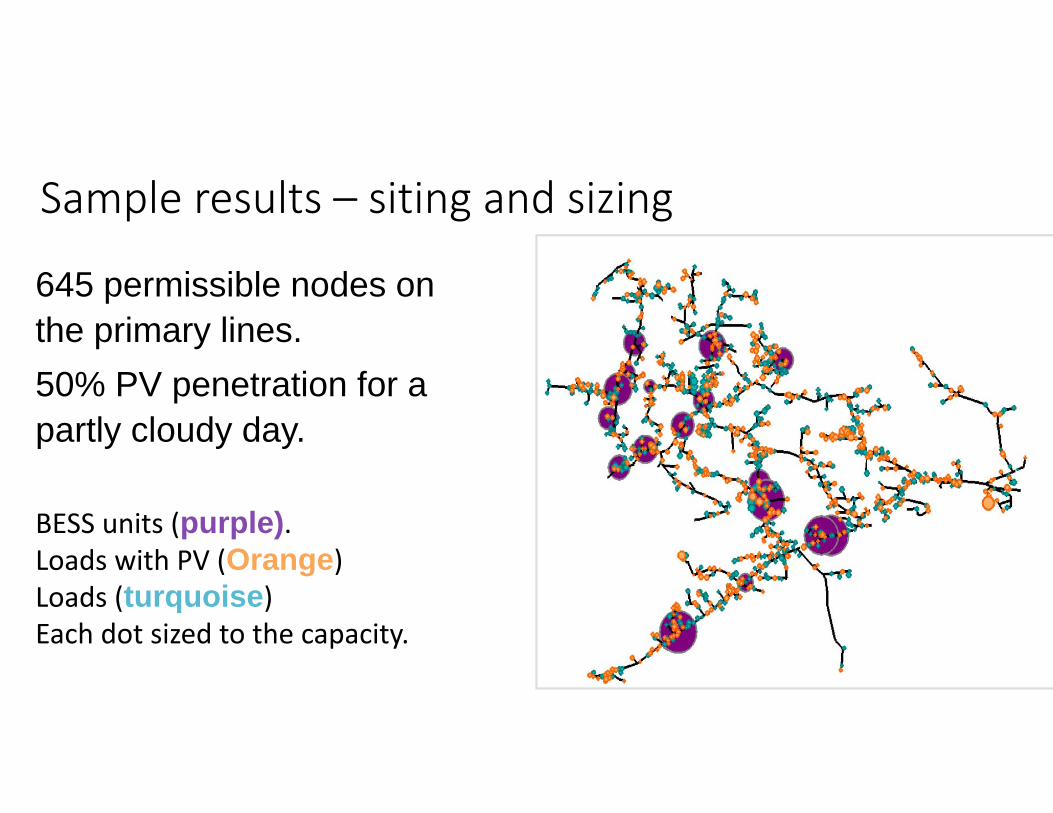
BESS units (purple).Loads with PV (Orange)Loads (turquoise)Each dot sized to the capacity.
645 permissible nodes on the primary lines.50% PV penetration for a partly cloudy day.
Sample results – siting and sizing

IEEE8500 test feeder with 50% PV penetration for a partly cloudy day.
• 3 different model runs with the same settings• 6 frequently chosen node clusters shown with red circles.• Consistent clusters emerge
Siting Convergence
39
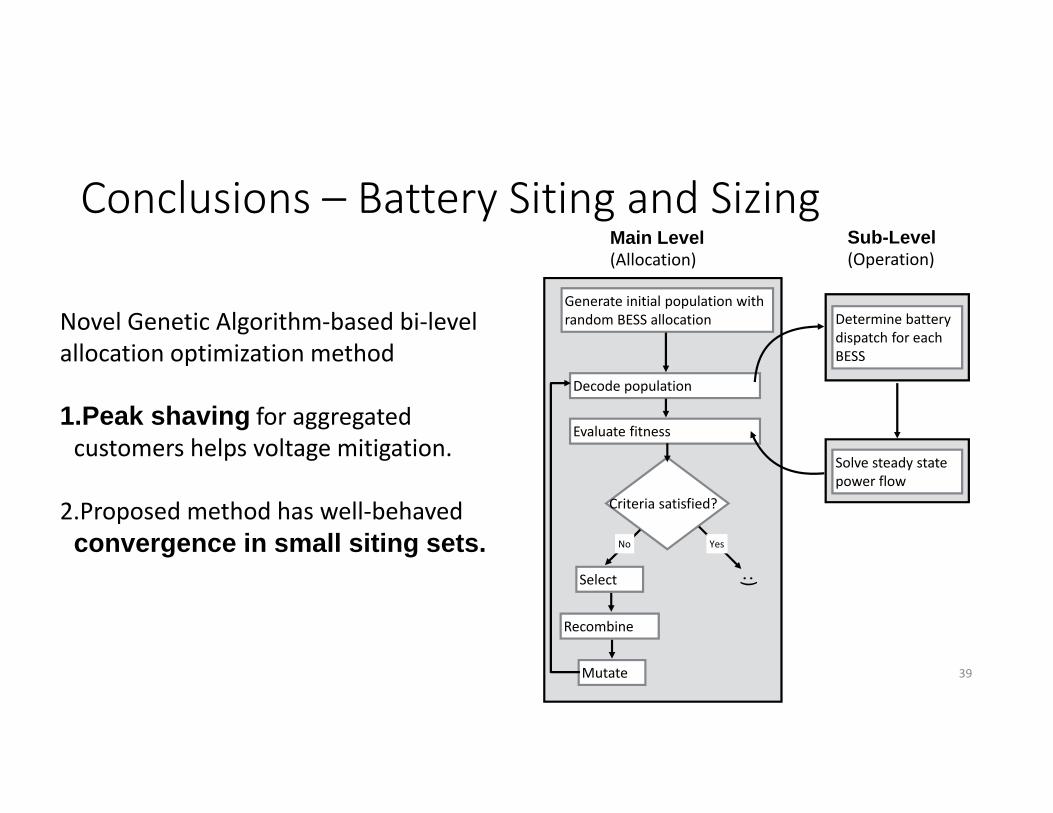
Novel Genetic Algorithm‐based bi‐level allocation optimization method
1.Peak shaving for aggregated customers helps voltage mitigation.
2.Proposed method has well‐behaved convergence in small siting sets.
Generate initial population with random BESS allocation
Decode population
Determine battery dispatch for each BESS
Solve steady state power flow
Evaluate fitness
Select
Criteria satisfied?
Recombine
Mutate
:)
No Yes
Main Level (Allocation)
Sub-Level (Operation)
Conclusions – Battery Siting and Sizing

COIMBRA ENERGY GROUPUNIVERSITY OF CALIFORNIA SAN DIEGO
Q&A #2

Task 4.3: Understanding and Counteracting Real Power
OscillationsXin Zhao and Raymond de Callafon
Department of Mechanical and Aerospace EngineeringUniversity of California San Diego

PMU measurements and real power oscillations on micro-grid
42
Motivation

Testbed for control of AC power flow – system diagram
PVSystem
Grid-TiedInverter
EMIFilter
L1
L2
L3
A
Controller
A
V
AuxiliaryRelay
OverloadProtectionContactor
Circuit Breaker
GRID
Sensors
Switch
A
V
V
R-L-C Load Circuit
43
Experimental Setup
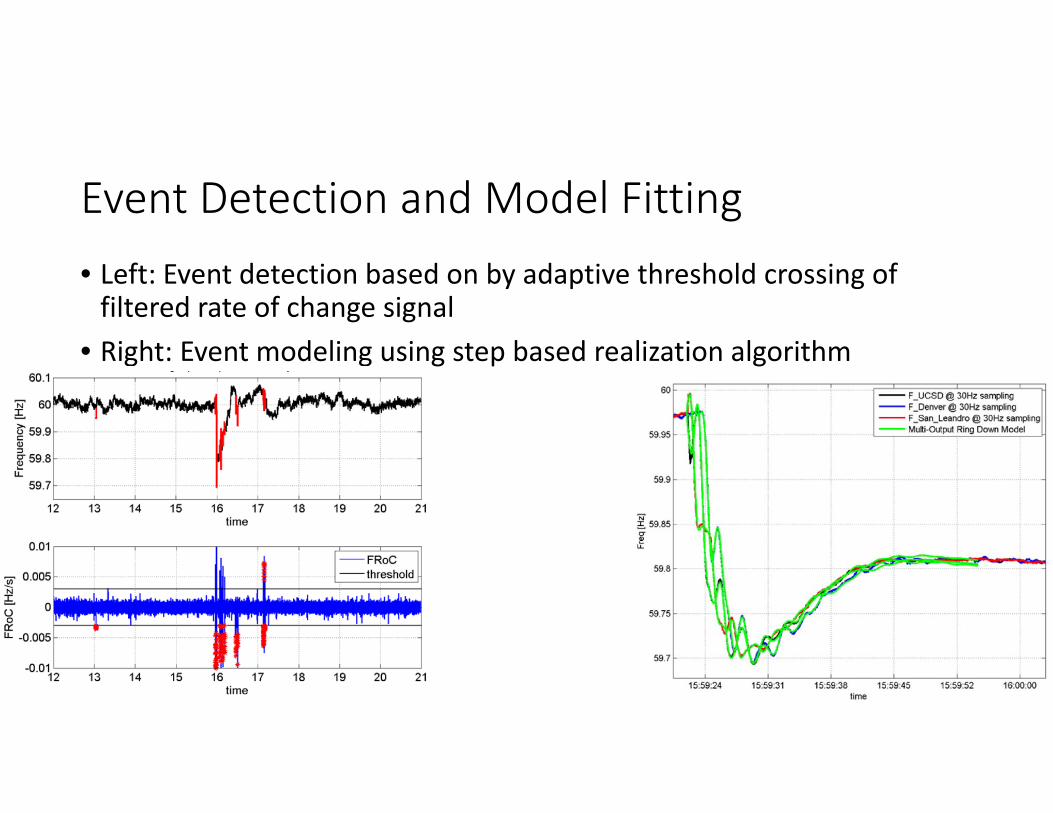
Event Detection and Model Fitting• Left: Event detection based on by adaptive threshold crossing of filtered rate of change signal
• Right: Event modeling using step based realization algorithm

Conclusions – Counteracting Power Oscillations• Real‐time detection of power oscillations• Characterized actuator and disturbance dynamics
• Model grid events
• Actuate inverter to counteract grid oscillations

COIMBRA ENERGY GROUPUNIVERSITY OF CALIFORNIA SAN DIEGO
Overall Conclusions
• All distribution feeders have large solar hosting capacity• Voltage issues often confined to small areas of the feeder.• Improved coordinated voltage regulator action will further increase hosting capacity.
• Smart inverters will further increase hosting capacity.
• Battery storage can be sited systematically • Optimize benefits for grid operation.• Prevent outages by counteracting oscillations.
• Lower integration costs for solar photovoltaic.