comprehensive annual financial report for the fiscal …
TRANSCRIPT

City of Weslaco,
Texa s
COMPREHENSIVE ANNUAL
FINANCIAL REPORT
For the Fiscal Year Ended
2019-2020
WWW.WESLACOTX.GOV

CITY OF WESLACO, TEXAS
COMPREHENSIVE ANNUAL FINANCIAL REPORT
For the Fiscal Year Ended September 30, 2020
Issued by:
Mike Perez, City Manager
Vidal Roman, Finance Director

- 1 -
Table of Contents
Page No. INTRODUCTORY SECTION City Officials 1 Letter of Transmittal 3 GFOA Certificate of Achievement 7 Organizational Chart 8
FINANCIAL SECTION
INDEPENDENT AUDITORS' REPORT 9 MANAGEMENT’S DISCUSSION AND ANALYSIS 15
BASIC FINANCIAL STATEMENTS
Government‐wide Financial Statements Statement of Net Position 25 Statement of Activities 26 Fund Financial Statements Governmental Fund Financial Statements Balance Sheet 28 Reconciliation of the Balance Sheet of Governmental Funds to the Statement of Net Position 29 Statement of Revenues, Expenditures and Changes in Fund Balances 30 Reconciliation of the Statement of Revenues, Expenditures and Changes in Fund Balances of Governmental Funds to the Statement of Activities 31
Proprietary Fund Financial Statements Statement of Net Position 32 Statement of Revenues, Expenses and Changes in Net Position 34
Statement of Cash Flows 35 Fiduciary Fund Financial Statements Statement of Fiduciary Net Position 36 Statement of Changes in Fiduciary Net Position 37 Notes to Financial Statements 39
REQUIRED SUPPLEMENTARY INFORMATION
Schedule of Revenues, Expenditures and Changes in Fund Balance – Budget and Actual ‐ General Fund 92

- 2 -
Table of Contents
Page
REQUIRED SUPPLEMENTARY INFORMATION‐ Continued
Schedule of Changes in Net Pension Liability and Related Ratios‐ Texas Municipal Retirement System 94 Schedule of Changes in Net Pension Liability and Related Ratios‐ Firemen’s Pension 95 Schedule of Contributions For Texas Municipal Retirement System Pension Plan and Firemen’s Pension Plan 96 Schedule of Changes in Total OPEB Liability and Related Ratios‐ Texas Municipal Retirement System‐ Supplemental Death Benefits Fund 97 Schedule of Changes in Total OPEB Liability and Related Ratios‐ Firefighter Retiree Health Care Plan 98 Notes to Schedule of Contributions For Texas Municipal Retirement System Pension Plan and Firemen’s Pension Plan 99 Notes to Required Supplementary Information 100
OTHER SUPPLEMENTARY INFORMATION Nonmajor Governmental Funds Combining Balance Sheet 102 Combining Statement of Revenues, Expenditures and Changes in Fund Balances 104 Comparative Individual Fund Statements General Fund Comparative Balance Sheets 106 Comparative Statements of Revenues, Expenditures and Changes in Fund Balances 107 Special Revenue Funds Hotel/Motel Tax Comparative Balance Sheets 108 Comparative Statements of Revenues, Expenditures and Changes in Fund Balances 109 Schedule of Revenues, Expenditures and Changes in Fund Balance – Budget and Actual‐ Hotel/Motel Tax Fund 110 Library Fund Comparative Balance Sheets 111 Comparative Statements of Revenues, Expenditures and Changes in Fund Balances 112 Building Depreciation Fund Comparative Balance Sheets 113 Comparative Statements of Revenues, Expenditures and Changes in Fund Balances 114 Capital Projects Funds 2013 Certificate of Obligation Construction Fund Comparative Balance Sheets 115 Comparative Statements of Revenues, Expenditures and Changes in Fund Balances 116

- 3 -
Table of Contents
Page
OTHER SUPPLEMENTARY INFORMATION ‐ Continued Capital Projects Funds Capital Improvement Program Fund Comparative Balance Sheets 117 Comparative Statements of Revenues, Expenditures and Changes in Fund Balances 118 Schedule of Revenues, Expenditures and Changes in Fund Balance – Budget and Actual‐ Capital Improvement Program Fund 119 Fire Department Equipment Replacement Fund Comparative Balance Sheets 120 Comparative Statements of Revenues, Expenditures and Changes in Fund Balances 121 Schedule of Revenues, Expenditures and Changes in Fund Balance – Budget and Actual‐ Fire Department Equipment Replacement Fund 122 Storm Water Improvement Fund Comparative Balance Sheets 123 Comparative Statements of Revenues, Expenditures and Changes in Fund Balances 124 Schedule of Revenues, Expenditures and Changes in Fund Balance – Budget and Actual‐ Storm Water Improvement Fund 125 2019 Bond Construction Fund Comparative Balance Sheets 126 Comparative Statements of Revenues, Expenditures and Changes in Fund Balances 127 Debt Service Funds Debt Service Fund Comparative Balance Sheets 128 Comparative Statements of Revenues, Expenditures and Changes in Fund Balances 129 Schedule of Revenues, Expenditures and Changes in Fund Balance – Budget and Actual‐ Debt Service Fund 131 Series 2019 Debt Service Fund Comparative Balance Sheets 132 Comparative Statements of Revenues, Expenditures and Changes in Fund Balances 133 Enterprise Funds Water and Wastewater Fund Comparative Statements of Net Position 134 Comparative Statements of Revenues, Expenses and Changes in Net Position 136 Comparative Statements of Cash Flows 137 Schedule of Revenues, Expenses and Changes in Net Position – Budget and Actual‐ Water and Wastewater Fund 138
- 4 -
Table of Contents
Page
OTHER SUPPLEMENTARY INFORMATION – Continued Solid Waste Fund Comparative Statements of Net Position 140 Comparative Statements of Revenues, Expenses and Changes in Net Position 141 Comparative Statements of Cash Flows 142 Schedule of Revenues, Expenses and Changes in Net Position – Budget and Actual‐ Solid Waste Fund 143 Airport Fund Comparative Statements of Net Position 144 Comparative Statements of Revenues, Expenses and Changes in Net Position 145 Comparative Statements of Cash Flows 146 Schedule of Revenues, Expenses and Changes in Net Position – Budget and Actual‐ Airport Fund 147 Internal Service Fund Equipment Replacement Fund Comparative Statements of Net Position 148 Comparative Statements of Revenues, Expenses, and Changes in Net Position 149 Comparative Statements of Cash Flows 150 Fiduciary Funds Firemen’s Relief and Retirement Pension Trust fund Comparative Statements of Fiduciary Net Position 151 Comparative Statements of Changes in Fiduciary Net Position 152 Marion Booth Endowment Fund Private Purpose Trust Fund Comparative Statements of Fiduciary Net Position 153 Comparative Statements of Changes in Fiduciary Net Position 154
Component Unit Economic Development Corporation of Weslaco
Comparative Balance Sheets 155 Comparative Statements of Revenues, Expenditures and Changes in Fund Balances 156 Reconciliation of the Balance Sheet of Governmental Funds to the Statement of Net Position 157 Reconciliation of the Statement of Revenues, Expenditures and Changes in Fund Balance of Governmental Funds to the
Statement of Activities 158 Supplemental Statements and Schedules Schedule of Taxes Receivable – By Fund 159 Analysis of Tax Collections, Adjustments and Allocation to Funds 160

- 5 -
Table of Contents
Page
OTHER SUPPLEMENTARY INFORMATION – Continued Bonded Debt Requirements Limited Tax Refunding Bonds, Series 2012 161 Tax and Revenue, Certificates of Obligation, Series 2013 162 Limited Tax Refunding Bonds, Series 2016 163 Certificates of Obligation, Series 2018 164 General Obligation Bonds, Series 2019 165 Tax and Revenue, Certificates of Obligation, Series 2012 166 Tax and Revenue, Certificates of Obligation, Series 2014 167 Limited Tax Refunding Bonds, Series 2016 168 Limited Tax Refunding Bonds, Series 2017 169 Economic Development Sales Tax Revenue Refunding Bonds, Series 2012 170 STATISTICAL SECTION Net Position by Component – Last Ten Fiscal Years 173 Changes in Net Position – Last Ten Fiscal Years 174 Fund Balances of Governmental Funds – Last Ten Fiscal Years 176 Changes in Fund Balances, Governmental Funds – Last Ten Fiscal Years 177 Property Tax Levies and Collections – Last Ten Fiscal Years 178 Assessed Value of Taxable Property – Last Ten Fiscal Years 179 Principal Property Taxpayers – Current Calendar Year and Nine Years Ago 180 Property Tax Rates and Tax Levies – All Overlapping Governments Last Ten Fiscal Years 181 Computation of Direct and Overlapping Debt 183 Legal Debt Margin Information – Last Ten Fiscal Years 184 Pledged – Revenue Coverage – Last Ten Fiscal Years 186 Ratios of Outstanding Debt by Type – Last Ten Fiscal Years 187 Ratios of General Bonded Debt Outstanding by Type – Last Ten Fiscal Years 189 Taxable Sales by Industry – Last Ten Calendar Years 190 Sales Tax Revenue Payers by Industry – Calendar Years 2019 and 2010 192 Direct and Overlapping Sales Tax Rates – Last Ten Fiscal Years 193 Miscellaneous Statistical Facts 194 Demographic and Economic Statistics – Last Ten Calendar Years 195 Operating Indicators and Capital Asset Statistics by Function/Program 196 Top Ten Principal Employers – 2019 and 2010 197 Full‐Time Equivalent Employees by Function – Last Ten Fiscal Years 198 COMPLIANCE SECTION Independent Auditors’ Report on Internal Control Over Financial Reporting and on Compliance and Other Matters Based on an Audit of Financial Statements Performed In Accordance with Government Auditing Standards 199 Independent Auditors’ Report on Compliance For the Major Program And on Internal Control Over Compliance Required by The Uniform Guidance 203 Schedule of Findings and Questioned Costs 207 Corrective Action Plan 211 Summary Schedule of Prior Audit Findings 212 Schedule of Expenditures of Federal Awards 213 Notes on Accounting Policies for Federal Awards 214

- 1 -
City of Weslaco, Texas City Officials
Mayor David Suarez Mayor Pro‐tem Leo Munoz Commissioners Letty Lopez Jose JP Rodriguez Greg Kerr Josh Pedraza Adrian Farias City Manager Mike Perez Assistant City Manager/ Aviation Director Andrew Munoz Finance Director Vidal Roman City Secretary Norma A. Cantu City Attorney Juan E. Gonzalez Chief Appraiser Rolando Garza Hidalgo County Appraisal District Collector of Taxes Paul Villarreal County of Hidalgo Chief of Police Joel Rivera Fire Chief Antonio Lopez Municipal Court Administrator Rosa Huerta Planning and Code Enforcement Director Rebekah De La Fuente Human Resources Director Veronica Ramirez Information Technology J. Martin Vela Parks and Recreation Director Omar Rodriguez Public Facilities Director Pete Garcia, Jr. Library Director Arnold Becho

- 2 -
(This page intentionally left blank)

- 3 -
City of Weslaco “The City on the Grow”
March 26, 2021 The Honorable Mayor David Suarez, City Commission and Citizens of the City of Weslaco The Comprehensive Annual Financial Report (the “Annual Report”) of the City of Weslaco, Texas (the City) for the fiscal year ended September 30, 2020, is submitted in accordance with Section 28 of the City Charter. Management assumes full responsibility for the completeness and reliability of the information contained in this report. To provide a reasonable basis for making these representations, management has established a comprehensive internal control framework that is designed both to protect the government’s assets from loss, theft, or misuse, and to compile sufficient reliable information for the preparation of the City’s financial statements in conformity with Generally Accepted Accounting Principles (GAAP). Because the cost of internal controls should not outweigh their benefits, the City’s comprehensive framework of internal controls has been designed to provide reasonable rather than absolute assurance that the financial statements will be free from material misstatement. As management, we assert that, to the best of our knowledge and belief, this financial report is complete and reliable in all material respects. Carr, Riggs, & Ingram, LLC, has issued an unmodified (“clean”) opinion of the City of Weslaco’s financial statements for the year ended September 30, 2020. The independent auditors’ report is located at the front of the financial section of this report. Management’s discussion and analysis (MD&A) immediately follows the independent auditors’ report and provides a narrative introduction, overview, and analysis of the basic financial statements. MD&A complements this letter of transmittal and should be read in conjunction with it.
255 S. KANSAS AVE. ■ WESLACO, TEXAS 78596-6285 ■ 956-968-3181 ■ WWW.WESLACOTX.GOV
David Suarez, Mayor Leo Muñoz, Mayor Pro-Tem, District 1
Greg Kerr, Commissioner, District 2 Jose “J.P.” Rodriguez, Commissioner, District 3
Adrian Farias, Commissioner, District 4 Letty Lopez, Commissioner, District 5
Josh Pedraza, Commissioner, District 6
Mike R. Perez, City Manager

- 4 -
Profile of the City of Weslaco The City of Weslaco, Texas, established in 1919, is located in the southern tip of Texas in the heart of the Rio Grande Valley, which is considered to be one of the top growth areas in the state, and in the country. The City currently occupies a land area of 15 square miles and serves an estimated population of 41,629. The City is authorized to levy a property tax on both real and personal properties located within its boundaries. The City of Weslaco has operated under the Council-Manager form of government since incorporation in 1928. Policy-making and legislative authority are vested in a City Commission consisting of a Mayor and six Commissioners. The City Commission is responsible, among other things, for enacting ordinances, adopting the budget, appointing committees, and hiring both the City Manager and City Attorney. The City Manager is responsible for implementing the policies and ordinances of the City Commission, for managing the day-to-day operations of the City, and for appointing the directors of the various departments. The Commission is elected on non-partisan basis. The Mayor and Commissioners serve three-year staggered terms, with two commissioners elected every year except for every third year when the Mayor is elected. The City provides a full range of services, including police and fire protection; emergency medical services; the construction and maintenance of highways, streets, and other infrastructure; and recreational activities and cultural events. Water and wastewater services are also provided by the City. The City is also financially accountable for a legally separate economic development corporation, which is reported separately within the City of Weslaco’s financial statements as a component unit. Additional information on this legally separate entity can be found in Note 1 in the notes to the financial statements. The annual budget serves as the foundation for the City’s financial planning and control. All departments of the City are required to submit requests for appropriation to the City Manager during the budget process. The City Manager uses these requests to initiate a proposed budget. The City Manager then presents this proposed budget to the Commission for review. The City Commission is required to hold public hearings on the proposed budget and to adopt a final budget no later than September 30th, the end of the City’s fiscal year. The appropriated budget is prepared by fund, function (e.g., public safety), and department (e.g. police). Department directors may, with City Manager’s approval, make transfers of appropriations within their departments. Transfers of appropriations between departments, however, require the approval of the City Commission. Budget-to-Actual comparisons are provided in this report for each individual governmental fund for which an appropriated annual budget has been adopted. For the general fund, this comparison is presented on page 92 as part of the required supplementary information. For governmental and proprietary funds, other than the general fund, with appropriated annual budgets, this comparison is presented within the other supplementary section of this report beginning on page 110.

- 5 -
Factors Affecting Financial Condition The information presented in the financial statements is perhaps best understood when it is considered from the broader perspective of the specific environment within which the City operates. Local Economy. Located in the center of the Rio Grande Valley, the City of Weslaco continues to experience steady growth. Both property values and sales tax revenues reflect an increase in comparison to prior year and are expected to continue growing in the next few years. According to the Texas Workforce Commission data link (TRACER), the unemployment rate had remained between 7 and 9 percent over the last few years. In 2019, the rate increased to 9.9 percent. The largest employer is the Weslaco Independent School District with 2,358 employees. Due to its strong and healthy economy, the City of Weslaco has maintained a credit rating of AA- from Standard and Poor’s, and Moody’s continues to maintain the City’s rating at “A2”. Long-term Financial Planning. Unrestricted fund balance (the total of the committed, assigned, and unassigned components of fund balance) in the general fund at year end was 37.8% of total General Fund Revenues. The goal is always to maintain at least 25%. The unrestricted fund balance at September 30, 2020, exceeded the goal, and some excess funds were transferred to the Capital Improvement Project Fund, as planned. This fund, now going into its fifth year, allows the City to self-fund improvements such as sidewalks, traffic signals, park improvements, and street paving to avoid and/or decrease dependence on debt financing for such infrastructure. The City Commission in the past five years had focused on evaluating the City’s property tax rate. This focus was driven by the desire to give taxpayers the best value for their money as well as making Weslaco more attractive to business and residents looking to relocate. The City Commission reduced the tax rate by a penny in 2014, when it stood at $0.6667 per $100 value. This evaluation of the tax rate has continued each year since and now stands at our current $0.6967 per $100.00 valuation for the 2020 tax year. Further decreases are not planned at this time to allow for the goal of self-funding infrastructure improvements through the CIP Fund. Cash Management Policies and Practices. Cash temporarily idle during the year was invested in TEXPOOL, during periods when their rates were higher than the depository banks’ rates. All funds kept with the depository bank are collateralized at a minimum rate of 102% of the market value. The City continues to evaluate ways in which further earnings could be realized. Pension and Other Post-Employment Benefits. The City of Weslaco contributes to a single employer defined benefit pension plan for its fire fighters. Every two years, an independent actuary engaged by the pension plan calculates the amount of benefits that can be paid to beneficiaries of the plan in light of the number of participants, contribution rates, and projected investment earnings, in order to ensure that the plan will be able to fully meet its obligations to retired employees on a timely basis. As a matter of policy, the City of Weslaco fully funds each year’s annual required contribution to the pension plan as determined by the actuary. The City also provides post medical insurance for fire fighter retirees paying for half of the premium up to the time the retiree is eligible for Medicare.


- 7 -

- 8 -

‐ 7 ‐
REPORT

‐ 9 ‐
INDEPENDENT AUDITORS’ REPORT The Honorable Mayor and Members
of the City Commission City of Weslaco, Texas
Report on the Financial Statements
We have audited the accompanying financial statements of the governmental activities, the business‐type activities, each major fund, and the aggregate remaining fund information of the City of Weslaco, Texas, as of and for the year ended September 30, 2020, and the related notes to the financial statements, which collectively comprise the City of Weslaco, Texas’ basic financial statements as listed in the table of contents. We did not audit the financial statements of the Weslaco Economic Development Corporation, which is the only aggregate discretely presented component unit and represents 100 percent of the assets, net position and revenues of the aggregate discretely presented component unit. Management’s Responsibility for the Financial Statements Management is responsible for the preparation and fair presentation of these financial statements in accordance with accounting principles generally accepted in the United States of America; this includes the design, implementation, and maintenance of internal control relevant to the preparation and fair presentation of financial statements that are free from material misstatement, whether due to fraud or error. Auditors’ Responsibility Our responsibility is to express opinions on these financial statements based on our audit. We did not audit the financial statements of the Weslaco Economic Development Corporation, which represent 100 percent of the assets, net position, and revenues of the aggregate discretely presented component unit. Those statements were audited by other auditors whose report has been furnished to us, and our opinion, insofar as it relates to the amounts included for the Weslaco Economic Development Corporation, is based solely on the report of the other auditors. We conducted our audit in accordance with auditing standards generally accepted in the United States of America and the standards applicable to financial audits contained in Government Auditing Standards, issued by the Comptroller General of the United States. Those standards require that we plan and perform the audit to obtain reasonable assurance about whether the financial statements are free from material misstatement. An audit involves performing procedures to obtain audit evidence about the amounts and disclosures in the financial statements. The procedures selected depend on the auditors’ judgment, including the assessment of the risks of material misstatement of the financial statements, whether due to fraud or error. In making those risk assessments, the auditors consider internal control relevant to the entity’s preparation and fair presentation of the financial statements in order to design audit procedures that are appropriate in the circumstances, but not for the purpose of expressing an opinion on the effectiveness of the entity’s internal control. Accordingly, we express no such opinion. An audit also includes evaluating the appropriateness of accounting policies used and the reasonableness of significant accounting estimates made by management, as well as evaluating the overall presentation of the financial statements.
`

‐ 10 ‐
(This page intentionally left blank)

‐ 11 ‐
We believe that the audit evidence we have obtained is sufficient and appropriate to provide a basis for our audit opinions. Opinions In our opinion, based on our audit and the report of other auditors, the financial statements referred to above present fairly, in all material respects, the respective financial position of the governmental activities, the business‐type activities, the aggregate discretely presented component unit, each major fund, and the aggregate remaining fund information of the City of Weslaco, Texas as of September 30, 2020, and the respective changes in financial position and, where applicable, cash flows thereof for the year then ended in accordance with accounting principles generally accepted in the United States of America.
Emphasis of Matter The previously issued financial statements have been restated to account for the correction of a misstatement related to the prior period. As further discussed in Note 2, the City’s financial statements were restated and the effect of the adjustment was a decrease to beginning fund balance. Our opinions are not modified with respect to this matter. Other Matters Required Supplementary Information Accounting principles generally accepted in the United States of America require that the management’s discussion and analysis and required supplementary information on pages 15 through 23 and 92 through 100 be presented to supplement the basic financial statements. Such information, although not a part of the basic financial statements, is required by the Governmental Accounting Standards Board, who considers it to be an essential part of financial reporting for placing the basic financial statements in an appropriate operational, economic, or historical context. We have applied certain limited procedures to the required supplementary information in accordance with auditing standards generally accepted in the United States of America, which consisted of inquiries of management about the methods of preparing the information and comparing the information for consistency with management’s responses to our inquiries, the basic financial statements, and other knowledge we obtained during our audit of the basic financial statements. We do not express an opinion or provide any assurance on the information because the limited procedures do not provide us with sufficient evidence to express an opinion or provide any assurance. Other Information Our audit was conducted for the purpose of forming opinions on the financial statements that collectively comprise the City Weslaco, Texas’ basic financial statements. The introductory section, other supplementary information, supplemental statements and schedules, bonded debt requirements, and statistical section, are presented for purposes of additional analysis and are not a required part of the basic financial statements. The schedule of expenditures of federal awards is presented for purposes of additional analysis as required by Title 2 U.S. Code of Federal Regulations Part 200, Uniform Administrative Requirements, Cost Principles, and Audit Requirements for Federal Awards, and is also not a required part of the basic financial statements.

‐ 12 ‐
(This page intentionally left blank)

‐ 13 ‐
The other supplementary information, supplemental statements and schedules, bonded debt requirements, and the schedule of expenditures of federal awards are the responsibility of management and were derived from and relate directly to the underlying accounting and other records used to prepare the basic financial statements. Such information has been subjected to the auditing procedures applied in the audit of the basic financial statements and certain additional procedures, including comparing and reconciling such information directly to the underlying accounting and other records used to prepare the basic financial statements or to the basic financial statements themselves, and other additional procedures in accordance with auditing standards generally accepted in the United States of America. In our opinion, the other supplementary information, supplemental statements and schedules, bonded debt requirements, and the schedule of expenditures of federal awards are fairly stated in all material respects in relation to the basic financial statements as a whole. The introductory and statistical sections have not been subjected to the auditing procedures applied in the audit of the basic financial statements and, accordingly, we do not express an opinion or provide any assurance on them. Other Reporting Required by Government Auditing Standards
In accordance with Government Auditing Standards, we have also issued our report dated March 26, 2021 on our consideration of the City of Weslaco, Texas’ internal control over financial reporting and on our tests of its compliance with certain provisions of laws, regulations, contracts, and grant agreements and other matters. The purpose of that report is solely to describe the scope of our testing of internal control over financial reporting and compliance and the results of that testing, and not to provide an opinion on the effectiveness of the City of Weslaco, Texas’ internal control over financial reporting or on compliance. That report is an integral part of an audit performed in accordance with Government Auditing Standards in considering the City of Weslaco, Texas’ internal control over financial reporting and compliance.
Harlingen, Texas March 26, 2021

‐ 14 ‐
(This page intentionally left blank)

‐ 15 ‐
City of Weslaco, Texas Management’s Discussion and Analysis
MANAGEMENT’S DISCUSSION AND ANALYSIS
As management of the City of Weslaco, we offer readers of the City’s financial statements this narrative overview and analysis of the financial activities of the City of Weslaco for the fiscal year ended September 30, 2020. We encourage readers to consider the information presented here in conjunction with additional information that we have furnished in our letter of transmittal, which can be found on pages 3‐6 of this report. FINANCIAL HIGHLIGHTS The City’s total net position increased $5,725,118 as a result of this year’s operations. Net position from governmental activities increased $5,439,636, while net position from business‐type activities increased $285,482. This reflects a 8.5% increase to total net position.
Governmental Activities – Revenues and Expenses Compared to Last Year – Total revenues increased about $5.3M from last year, with the majority increase in operating grants due to COVID‐19 operations. Sales tax showed a moderate increase of $339,300 or 3.4%, property tax revenues increased by $980,111 while franchise tax revenues decreased by $66,844. Expenses increased $26,342 from last year.
Business‐Type Activities – Revenues and Expenses Compared to Last Year‐ Total revenues saw an increase of $1,285,424 from last year. Charges for all services increased by $822,753. Expenses increased about 10.4% or $1,101,747 in water and wastewater services. Solid waste expenses saw an increase of about 2.4% or $107,387 due to an increase of fees assessed by the company that provides collection of brush services. Expenses from airport services also increased by $137,260, or 13.3%.
OVERVIEW OF THE FINANCIAL STATEMENTS This discussion and analysis are intended to serve as an introduction to the City’s basic financial statements. The City’s basic financial statements are comprised of three components: 1) government‐wide financial statements, 2) fund financial statements, and 3) notes to the financial statements. This report also contains required supplementary information and other supplementary information in addition to the basic financial statements themselves. Government‐Wide Financial Statements The Statement of Net Position and the Statement of Activities are government‐wide financial statements. The government‐wide financial statements provide information about the activities of the City as a whole and present a longer‐term view of the City’s finances. These statements include all assets and deferred outflows of resources and liabilities and deferred inflows of resources of the City, and the statements are presented on the accrual basis of accounting, which is similar to the accounting used by most private‐sector companies. The Statement of Activities presents information showing how the government’s net position changed during the most recent fiscal year. All changes in net position are reported as soon as the underlying event giving rise to the change occurs, regardless of the timing of related cash flows. Thus, revenues and expenses are reported in this statement for some items that will only result in cash flows in future fiscal periods (e.g., uncollected taxes and earned but unused vacation leave). Activities of the City as a whole include governmental activities, and business‐type activities. Governmental activities are those activities which are financed primarily through taxes and grants.

‐ 16 ‐
City of Weslaco, Texas Management’s Discussion and Analysis
Most of the City’s basic services are reported as governmental activities. Business‐type activities are those activities that are intended to recover all or a significant portion of their costs through user fees and charges. Utility system operations are a common example of business‐type activities. The government‐wide financial statements include not only the City itself (known as the primary government), but also the Weslaco Economic Development Corporation (EDC), which is a legally separate entity, and reported as a discretely presented component unit. The City Commission appoints the EDC board members and sets expenditure caps over which the City of Weslaco Commissioners’ approval is required. Financial information for this discretely presented component unit is reported separately from the financial information presented for the primary government itself. The government‐wide financial statements can be found on pages 25‐27 of this report. Fund Financial Statements A fund is a grouping of related accounts that is used to maintain control over resources that have been segregated for specific activities or objectives. The City, like other state and local governments, uses fund accounting to ensure and demonstrate compliance with finance‐related legal requirements. All of the funds of the City can be divided into three categories: governmental funds, proprietary funds and fiduciary funds. Governmental Funds Governmental funds are used to account for essentially the same functions reported as governmental activities in the government‐wide financial statements. However, unlike the government‐wide financial statements, governmental fund financial statements focus on near‐term inflows and outflows of spendable resources, as well as on balances of spendable resources available at the end of the fiscal year. Such information may be useful in evaluating a government’s near‐term financing requirements. Because the focus of governmental funds is narrower than that of the government‐wide financial statements, it is useful to compare the information presented for governmental funds with similar information presented for governmental activities in the government‐wide financial statements. By doing so, readers may better understand the long‐term impact of the government’s near‐term financing decisions. Both the governmental fund balance sheet and the governmental fund statement of revenues, expenditures, and changes in fund balances provide a reconciliation to facilitate this comparison between governmental funds and governmental activities. The City maintains eleven individual governmental funds. Information is presented separately in the governmental fund balance sheet and in the governmental fund statement of revenues, expenditures, and changes in fund balances for the General Fund and the 2019 Bond Construction Fund, which are the only reported major funds. Data from the other nine governmental funds are combined into a single, aggregated presentation. Individual fund data for each of these nonmajor governmental funds is provided in the form of combining statements elsewhere in this report. The City adopts an annual appropriated budget for its General Fund, Debt Service Fund, Hotel Occupancy Tax Fund, Capital Improvement Program Fund, and Fire Department Equipment Replacement Fund. In addition, the City also adopts an annual appropriated budget for its Water and Wastewater, Solid Waste, and Airport Proprietary Funds. A budgetary comparison schedule has been provided for the General Fund to demonstrate compliance with this budget in the required supplementary information of this report. All other budgetary comparison schedules have been provided for in the other supplementary information of this report. The basic governmental fund financial statements can be found on pages 28‐31 of this report.

‐ 17 ‐
City of Weslaco, Texas Management’s Discussion and Analysis
Proprietary Funds The City maintains two different types of proprietary funds. Enterprise funds are used to report the same functions presented as business‐type activities in the government‐wide financial statements. The City uses enterprise funds to account for its Water and Wastewater Fund, for its Solid Waste Fund and for its Airport Fund. Internal service funds are an accounting device used to accumulate and allocate costs internally among the City’s various functions. Because these services predominantly benefit governmental rather than business‐type functions, they have been included within governmental activities in the government‐wide financial statements. Proprietary funds provide the same type of information as the business‐type activities section of the government‐wide financial statements, only in more detail. The proprietary fund financial statements provide separate information for the Water and Wastewater Fund, the Solid Waste Fund, and the Airport Fund, all of which are considered to be major enterprise funds of the City of Weslaco. The basic proprietary fund financial statements can be found on pages 32‐35 of this report. Fiduciary Funds Fiduciary funds are used to account for resources held for the benefit of parties outside the government. Fiduciary funds are not reflected in the government‐wide financial statement because the resources of those funds are not available to support the City of Weslaco’s own programs. The accounting used for fiduciary funds is much like that used for proprietary funds. The City recognizes two fiduciary funds: the Firemen’s Relief and Retirement Fund, which is a pension trust fund, and the Marion Booth Endowment Fund, which is a private purpose trust fund. The basic fiduciary fund financial statements can be found on pages 36‐37 of this report. Notes to the Financial Statements The notes provide additional information that is essential to a full understanding of the data provided in the government‐wide and fund financial statements. The notes to the financial statements begin on page 39 of this report. In fiscal year 2020, the City adopted a new statement of financial accounting standards issued by the Governmental Accounting Standards Board. These newly adopted accounting standards, and other recently issued accounting pronouncements, can be found in Note 1.
GOVERNMENT‐WIDE FINANCIAL ANALYSIS As noted earlier, net position may serve over time as a useful indicator of a government’s financial position. In the case of the City, assets and deferred outflows of resources exceeded liabilities and deferred inflows of resources by $78,080,793 at the close of the most recent fiscal year. On September 30, 2020, the City had an outstanding bonds balance of $68,315,000, excluding $880,000 in the component unit. The City has unspent bond proceeds on its recently issued 2018 and 2019 bonds to be used for its drainage projects and purchase of equipment for the maintenance of its drainage ditches. At the end of the current fiscal year, the City of Weslaco reported negative balance of unrestricted net position, both for the government as a whole, as well as for its separate governmental and business‐type activities. The negative unrestricted net position is mainly due to the City’s recognition of pension and OPEB liabilities in accordance with GASB Statement No. 68 and 75.

‐ 18 ‐
City of Weslaco, Texas Management’s Discussion and Analysis
Table 1, below illustrates a comparative summary of the City’s statement of net position at September 30, 2020 and 2019.
Total Total
2020 2019 2020 2019 2020 2019
Current assets 33,551,128$ 33,235,738$ 4,485,122$ 5,063,485$ 38,036,250$ 38,299,223$
Capital assets, net 53,904,990 51,643,691 100,224,704 101,101,950 154,129,694 152,745,641
Total assets 87,456,118 84,879,429 104,709,826 106,165,435 192,165,944 191,044,864
Deferred outflows of resources‐ deferred charge 178,082 203,831 1,778,044 1,955,361 1,956,126 2,159,192
Deferred outflows of resources‐ pensions 2,060,259 3,223,576 100,318 256,750 2,160,577 3,480,326
Deferred outflows of resources‐ OPEB 529,533 296,155 13,185 4,308 542,718 300,463
Total deferred outflows of resources 2,767,874 3,723,562 1,891,547 2,216,419 4,659,421 5,939,981
Total assets and deferred outflows
of resources 90,223,992$ 88,602,991$ 106,601,373$ 108,381,854$ 196,825,365$ 196,984,845$
Current liabilities 4,244,423$ 4,220,309$ 1,816,646$ 1,813,214$ 6,061,069$ 6,033,523$
Non‐current liabilities
Due within one year 3,344,683 3,147,132 3,575,236 3,247,473 6,919,919 6,394,605
Due in more than one year 34,264,513 37,735,125 53,803,190 56,095,389 88,067,703 93,830,514
Municipal net pension liability 6,341,943 8,791,058 839,320 1,052,286 7,181,263 9,843,344
Firemen's net pension liability 5,668,100 4,806,025 ‐ ‐ 5,668,100 4,806,025
OPEB liability‐ TMRS Supplemental death 800,860 639,791 71,293 57,287 872,153 697,078
OPEB liability‐ reitree health care 2,021,161 2,454,914 ‐ ‐ 2,021,161 2,454,914
Total liabilities 56,685,683 61,794,354 60,105,685 62,265,649 116,791,368 124,060,003
Deferred inflows of resources‐ pensions 1,704,229 409,146 132,018 38,017 1,836,247 447,163
Deferred inflows of resources‐ OPEB 112,250 117,297 4,707 4,707 116,957 122,004
Total deferred inflows of resources 1,816,479 526,443 136,725 42,724 1,953,204 569,167
Net position
Net investment in capital assets 34,782,635 32,298,614 47,636,213 47,630,121 82,418,848 79,928,735
Restricted 1,411,010 1,134,772 1,012,923 1,010,581 2,423,933 2,145,353
Unrestricted (deficit) (4,471,815) (7,151,192) (2,290,173) (2,567,221) (6,761,988) (9,718,413)
Total net position 31,721,830 26,282,194 46,358,963 46,073,481 78,080,793 72,355,675$
Total liabilities, deferred inflows
of resources and net position 90,223,992$ 88,602,991$ 106,601,373$ 108,381,854$ 196,825,365$ 196,984,845$
Governmental Activities Business‐type Activities
Primary Government
Table 1
City of Weslaco, Texas‐ Net Position
Governmental Activities
The property tax levy increased by $191,124 (0.2%) from the prior year due mostly to recent bond election approved by the citizens for drainage improvements and increases in valuation or new improvements added to the rolls. The tax rate increased to $0.6967 per $100 for the 2019 tax year levy. A concerted effort on the part of the City Commission will continue to maintain or reduce the tax rate, while continuing to provide the same level of services. It is believed that this approach to making the City more attractive to business provides the stimulus to invest in further improvements that result in increased values. Total sales taxes of the City amounted to $13,870,029 for the year which is an increase of $452,400 or 3.4% over the last fiscal year. 25% of the total amount collected goes to the Weslaco Economic Development Corporation. The remainder stays in the General Fund where it makes up about 38.7% of General Fund revenues in support of governmental functions, such as public safety, library services and recreation.

‐ 19 ‐
City of Weslaco, Texas Management’s Discussion and Analysis
Operating grants for governmental activities amounted to $6,120,352 in the General Fund, mostly due to federal funding received from CARES Act to aid in mitigating the COVID‐19 pandemic. It is the practice of the City of Weslaco to seek opportunities for grants whenever possible to improve City services and quality of life in our community. Table 2, below presents the cost of each of the City’s programs, as well as the revenues generated to support those programs. The difference between the two is the change in net position.
Total Total Percent
2020 2019 2020 2019 2020 2019 2020
Program Revenues:
Charges for services 3,426,349$ 4,292,614$ 18,544,020$ 17,721,267$ 21,970,369$ 22,013,881$ 39.07%
Operating grants and contributions 6,120,352 889,479 ‐ ‐ 6,120,352 889,479 10.88%
Capital grants and contributions 435,057 625,616 1,381,244 911,329 1,816,301 1,536,945 3.23%
General Revenues:
Property taxes 13,107,912 12,127,801 ‐ ‐ 13,107,912 12,127,801 23.31%
Non‐property taxes 12,690,487 12,405,340 ‐ ‐ 12,690,487 12,405,340 22.57%
Unrestricted investment earnings 200,243 272,670 5,880 13,124 206,123 285,794 0.37%
Other income 320,215 409,575 ‐ ‐ 320,215 409,575 0.57%
Total revenue 36,300,615 31,023,095 19,931,144 18,645,720 56,231,759 49,668,815 100.00%
Expenses
General government 7,411,268 7,758,658 ‐ ‐ 7,411,268 7,758,658 14.67%
Public safety 17,299,968 16,513,542 ‐ ‐ 17,299,968 16,513,542 34.25%
Emergency medical services 200,937 185,668 ‐ ‐ 200,937 185,668 0.40%
Public works 4,652,366 4,498,314 ‐ ‐ 4,652,366 4,498,314 9.21%
Culture and recreation 2,282,570 2,319,476 ‐ ‐ 2,282,570 2,319,476 4.52%
Interest on long term debt 1,195,174 1,299,788 ‐ ‐ 1,195,174 1,299,788 2.37%
Water and sewer services ‐ ‐ 11,700,765 10,599,018 11,700,765 10,599,018 23.17%
Solid waste services ‐ ‐ 4,590,974 4,483,587 4,590,974 4,483,587 9.09%
Airport ‐ ‐ 1,172,619 1,035,359 1,172,619 1,035,359 2.32%
Total expenses 33,042,283 32,575,446 17,464,358 16,117,964 50,506,641 48,693,410 100.00%
Increase in net position before
Transfers and special items 3,258,332 (1,552,351) 2,466,786 2,527,756 5,725,118 975,405
Transfers 2,181,304 2,440,561 (2,181,304) (2,440,561) ‐ ‐
Change in net position 5,439,636 888,210 285,482 87,195 5,725,118 975,405
Net position‐ beginning 26,282,194 25,393,984 46,073,481 45,986,286 72,355,675 71,380,270
Net postion‐ ending 31,721,830$ 26,282,194$ 46,358,963$ 46,073,481$ 78,080,793$ 72,355,675$
Table 2
City of Weslaco, Texas‐ Changes in Net Position
Primary Government
Governmental Activities Business‐type Activities
Business‐Type Activities Business‐type activities continue to account for about 59 % of the City of Weslaco’s net position. Water and sewer rates remained the same as prior years. There was also a slight change in solid waste collection fees.

‐ 20 ‐
City of Weslaco, Texas Management’s Discussion and Analysis
The net position of the Water and Wastewater Fund increased by $1,027,743 from current year operations which increased from the prior year change in net position of $807,122. This was the result of increase in charges for services and capital grants offset by an increase of operating expenses. Operating revenues increased by $588,697 and operating expenses increased by $1,196,632. Transfers to other funds also decreased by $535,131 to make the current payments on long‐term debt. The net position of the Solid Waste Fund decreased ($339,989) due to continued transfers to the capital improvement fund. Operating revenues increased by $253,240 and operating expenses increased by $107,387. Transfers to other funds (to the Capital Improvements Program Fund) remained consistent with prior year. The net position of the Airport Fund increased to ($402,272), due mostly to an increase in other services and charges. The Airport Fund receives revenues from fuel sales, hangar rentals, and grants. Any shortfalls are subsidized by the General Fund. Short of grant and subsidies from the General Fund, the Airport would have experienced an operating loss of ($869,894). Improvements continue to have minimal effect at the Airport, yet the City will continue striving with a new business plan. FINANCIAL ANALYSIS OF THE GOVERNMENT’S FUNDS
As noted earlier, the City of Weslaco uses fund accounting to ensure and demonstrate compliance with finance‐related legal requirements. Governmental Funds The focus of the City’s governmental funds is to provide information on near‐term inflows outflows, and balances of spendable resources. Such information is useful in assessing the City’s financing requirements. In particular, unassigned fund balance may serve as a useful measure of a government’s net resources available for spending at the end of the fiscal year. As the end of the current fiscal year, the City of Weslaco’s governmental funds reported combined ending fund balances of $26,934,087. Approximately 34% of this total amount, or $9,151,461 constitutes unassigned fund balance, which is available for spending at the government’s discretion. This represents 23.6% of operating expenditures. The remainder of fund balance is non‐spendable, restricted, or assigned to indicate that it is not available for new spending because it has already been assigned for a specific purpose or restricted for debt or future capital projects. The General Fund is the chief operating fund of the City of Weslaco. At the end of the current fiscal year, the general fund’s unassigned fund balance was $9,151,461 which increased by $1,186,270 from the prior unassigned fund balance of $7,965,191 which was mainly attributed to increases in taxes, non‐property taxes and fees and COVID grant funding received in the current year. As a measure of the General Fund’s liquidity, it may be useful to compare both unassigned fund balance and total fund balance to total fund expenditures. Unassigned fund balance represents 31% of the total General Fund expenditures, while total fund balance represents 40.8% of that same amount. While it is recommended that the General Fund should have an unassigned fund balance of no less than 5% to 15% of operating expenditures, the City has placed the target unassigned fund balance in the General Fund at 25%. The City Commission increased the tax rate to $0.6967 for the 2019 tax year levy with the passage of the 2019 Drainage Bond issue. In addition, sales tax revenues increased by 3.4% from prior year.

‐ 21 ‐
City of Weslaco, Texas Management’s Discussion and Analysis
The debt service fund and the 2019 Series debt service fund have a total combined fund balance of $526,173, all of which is restricted for the repayment of debt service. The scheduled tax supported debt service payments for fiscal year 2020 was $3,377,955, including interest paid of $1,027,955. Proprietary Funds The City of Weslaco’s proprietary funds provide the same type of information found in the government‐wide financial statements, but in more detail. Unrestricted net position of the Water and Wastewater Fund at the end of the year amounted to ($2,763,217), which was a decrease of ($534,250) from last year. Operating revenues increased by $588,697 and operating expenses increased by $1,196,632. The result was operating income decreased by $607,935 compared to last year. The unrestricted net position of the Solid Waste Fund amounted to $1,124,837 at the end of the year, a decrease of $277,339 from the prior year. Operating revenue increased by $253,240 from last year, while operating expenses increased by $107,387. It should be noted that the decrease in net position of $339,989 was affected by transfers of $1,125,000 to other funds. The unrestricted net position for the Airport Fund amounted to $(651,793). The airport will continue making improvements, yet operations are back to normal. The Airport commenced in the construction of additional hangers to accommodate demands. General Fund Budgetary Highlights The original budgeted revenue of $27,379,484 represented a 7.8% increase over the previous year’s budgeted amount. The 2020 budget was amended to recognize additional projected revenue, for a final revenue budget of $28,522,004. Taxes represent about 76.6% of total General Fund budgeted revenue. The original adopted General Fund expenditures were $27,758,828. However, circumstances arose which required the expenditure of additional funds that were not foreseen prior to the commencement of the fiscal year. Each year the City performs a mid‐year review of the budget. If it is determined that funds are available, certain amendments are proposed to the City Commission for their review and approval. These amendments increased the General Fund’s appropriations by $1,428,269, to $29,187,097 of expenditures. The increase was attributed to overtime in the police and fire departments and capital outlay for the police department as well as additional transfer to the Economic 380 agreements. The City continued on Phase II on the installation of a new system in the Police department, this cost was offset by a grant. CAPITAL ASSET AND DEBT ADMINISTRATION Capital Assets The City of Weslaco’s investment in capital assets for its governmental and business type activities as of September 30, 2020, amounts to $154,129,694 (net of accumulated depreciation). This investment in capital assets includes land, buildings and improvements, machinery and equipment, park facilities, roads and highways, and construction in progress. The City of Weslaco’s investment in capital assets for the current fiscal year increased by 1.0%

‐ 22 ‐
City of Weslaco, Texas Management’s Discussion and Analysis
2020 2019 2020 2019 2020 2019
Land, 6,227,175$ 4,900,165$ 3,952,884$ 2,551,870$ 10,180,059$ 7,452,035$
Infrastucture 7,629,307 7,629,307 ‐ ‐ 7,629,307 7,629,307
Buildings 20,411,626 18,494,359 1,679,646 1,679,646 22,091,272 20,174,005
Equipment 15,168,595 13,558,222 8,199,721 7,926,322 23,368,316 21,484,544
Improvements 45,667,355 45,448,801 129,540,911 80,930,572 175,208,266 126,379,373
Capital leases 6,911,937 6,911,937 7,474,943 6,934,391 14,386,880 13,846,328
Construction in progress 3,213,163 2,401,877 550,534 47,850,254 3,763,697 50,252,131
Totals at historical cost 105,229,158 99,344,668 151,398,639 147,873,055 256,627,797 247,217,723
Accumulated depreciation (51,324,168) (47,700,977) (51,173,935) (46,771,105) (102,498,103) (94,472,082)
Total capital assets, net 53,904,990$ 51,643,691$ 100,224,704$ 101,101,950$ 154,129,694$ 152,745,641$
Table 3
TotalGovernmental Activities Business‐type Activities
Primary Government
City of Weslaco‐ Capital Assets
Additional information on the City of Weslaco’s capital assets can be found in Note 5 starting on page 57 of this report. Long‐Term Debt At year end of the current fiscal year, the City of Weslaco had total bonded debt outstanding of $68,315,000, excluding $880,000 in the component unit. Total bonded debt is comprised of debt backed by the full faith and credit of the government. The City of Weslaco maintains an “AA‐“rating from Standard and Poor’s, which is the City’s highest rating to date. Moody’s rates the City at an “A2” for general obligation debt. Additional information on the City of Weslaco’s long‐term debt can be found in Note 6 on page 59 of this report. ECONOMIC FACTORS AND NEXT YEAR’S BUDGETS AND RATES The employment rate for the City of Weslaco increased by decreased by 5.2% to 88.6% from 93.8% a year ago. This is attributed to the COVID‐19 Pandemic. This rate compares to the state’s average employment rate of 92.3%.

‐ 23 ‐
City of Weslaco, Texas
Management’s Discussion and Analysis
The property tax rate remained the same for the 2020 tax year, or fiscal year ending September 30, 2021. Sales tax is projected to increase by 1%. The 2020‐2021 adopted budget is a fiscally responsible balanced budget.
REQUESTS FOR INFORMATION This financial report is designed to provide a general overview of the City of Weslaco’s finances for all those with an interest in the government’s finances. Questions concerning any of the information provided in this report or requests for additional financial information should be addressed to the Office of the Finance Director, 255 S Kansas Avenue, Weslaco, Texas 78596.

‐ 24 ‐
(This page intentionally left blank)

‐ 14 ‐
FINANCIAL STATEMENTS
‐ 25 ‐
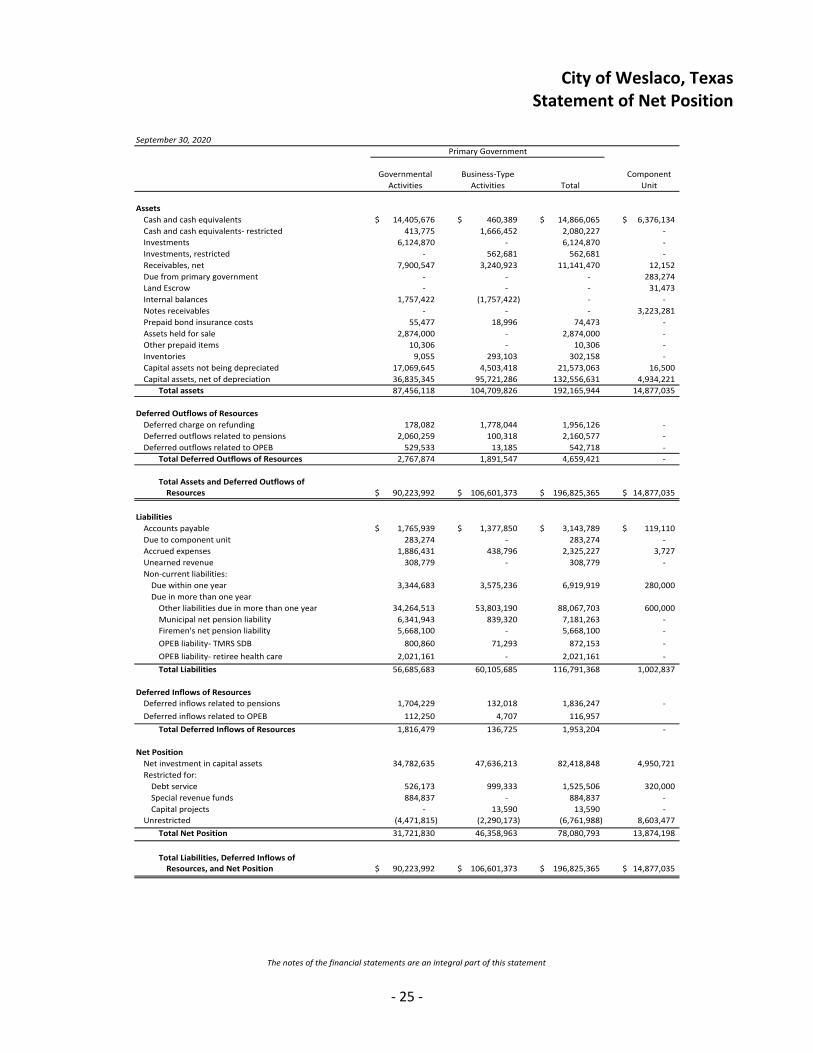
City of Weslaco, Texas Statement of Net Position
Governmental Business‐Type Component
Activities Activities Total Unit
Assets
Cash and cash equivalents 14,405,676$ 460,389$ 14,866,065$ 6,376,134$
Cash and cash equivalents‐ restricted 413,775 1,666,452 2,080,227 ‐
Investments 6,124,870 ‐ 6,124,870 ‐
Investments, restricted ‐ 562,681 562,681 ‐
Receivables, net 7,900,547 3,240,923 11,141,470 12,152
Due from primary government ‐ ‐ ‐ 283,274
Land Escrow ‐ ‐ ‐ 31,473
Internal balances 1,757,422 (1,757,422) ‐ ‐
Notes receivables ‐ ‐ ‐ 3,223,281
Prepaid bond insurance costs 55,477 18,996 74,473 ‐
Assets held for sale 2,874,000 ‐ 2,874,000 ‐
Other prepaid items 10,306 ‐ 10,306 ‐
Inventories 9,055 293,103 302,158 ‐
Capital assets not being depreciated 17,069,645 4,503,418 21,573,063 16,500
Capital assets, net of depreciation 36,835,345 95,721,286 132,556,631 4,934,221
Total assets 87,456,118 104,709,826 192,165,944 14,877,035
Deferred Outflows of Resources
Deferred charge on refunding 178,082 1,778,044 1,956,126 ‐
Deferred outflows related to pensions 2,060,259 100,318 2,160,577 ‐
Deferred outflows related to OPEB 529,533 13,185 542,718 ‐
Total Deferred Outflows of Resources 2,767,874 1,891,547 4,659,421 ‐
Total Assets and Deferred Outflows of
Resources 90,223,992$ 106,601,373$ 196,825,365$ 14,877,035$
Liabilities
Accounts payable 1,765,939$ 1,377,850$ 3,143,789$ 119,110$
Due to component unit 283,274 ‐ 283,274 ‐
Accrued expenses 1,886,431 438,796 2,325,227 3,727
Unearned revenue 308,779 ‐ 308,779 ‐
Non‐current liabilities:
Due within one year 3,344,683 3,575,236 6,919,919 280,000
Due in more than one year
Other liabilities due in more than one year 34,264,513 53,803,190 88,067,703 600,000
Municipal net pension liability 6,341,943 839,320 7,181,263 ‐
Firemen's net pension liability 5,668,100 ‐ 5,668,100 ‐
OPEB liability‐ TMRS SDB 800,860 71,293 872,153 ‐
OPEB liability‐ retiree health care 2,021,161 ‐ 2,021,161 ‐
Total Liabilities 56,685,683 60,105,685 116,791,368 1,002,837
Deferred Inflows of Resources
Deferred inflows related to pensions 1,704,229 132,018 1,836,247 ‐
Deferred inflows related to OPEB 112,250 4,707 116,957
Total Deferred Inflows of Resources 1,816,479 136,725 1,953,204 ‐
Net Position
Net investment in capital assets 34,782,635 47,636,213 82,418,848 4,950,721
Restricted for:
Debt service 526,173 999,333 1,525,506 320,000
Special revenue funds 884,837 ‐ 884,837 ‐
Capital projects ‐ 13,590 13,590 ‐
Unrestricted (4,471,815) (2,290,173) (6,761,988) 8,603,477
Total Net Position 31,721,830 46,358,963 78,080,793 13,874,198
Total Liabilities, Deferred Inflows of Resources, and Net Position 90,223,992$ 106,601,373$ 196,825,365$ 14,877,035$
Primary Government
The notes of the financial statements are an integral part of this statement
September 30, 2020

‐ 26 ‐
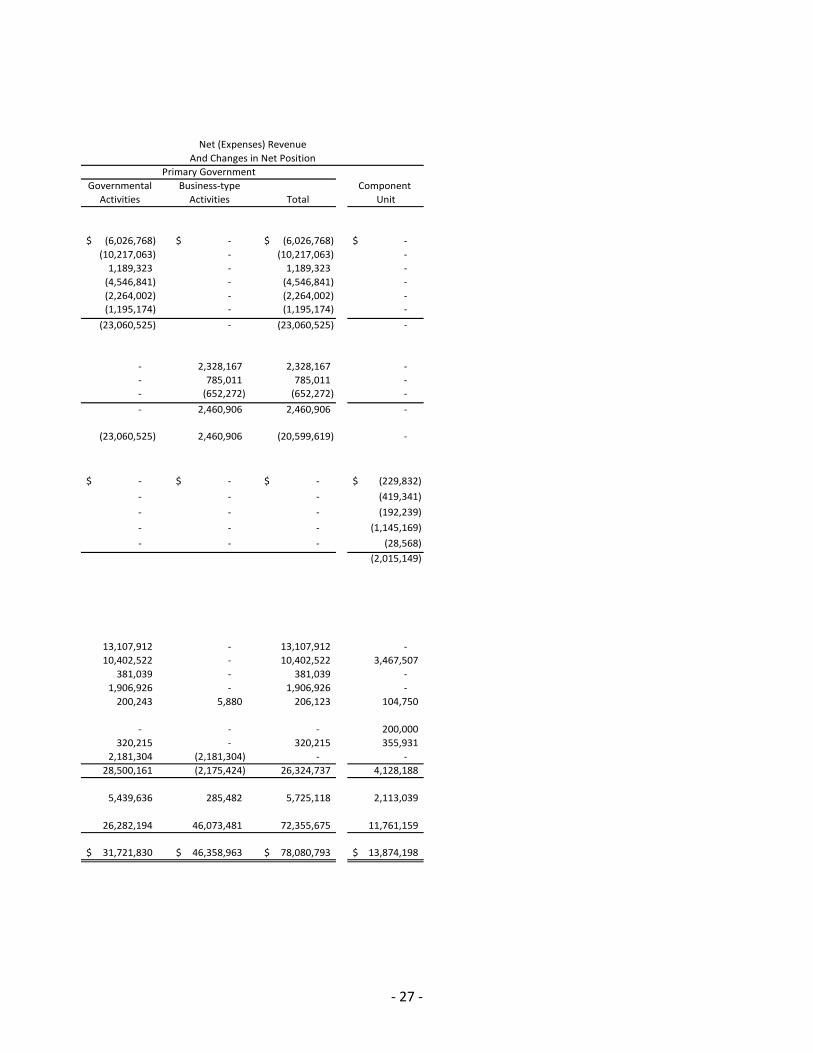
City of Weslaco, Texas Statement of Activities
Operating Capital Grants
Charge for Grants and and
Functions/programs Expenses Services Contributions Contributions
Primary Government
Governmental activities:
General government 7,411,268$ 1,384,500$ ‐$ ‐$
Public safety 17,299,968 633,021 6,120,352 329,532
Emergency medical services 200,937 1,390,260 ‐ ‐
Public works 4,652,366 ‐ ‐ 105,525
Culture and recreation 2,282,570 18,568 ‐ ‐
Interest on long‐term debt 1,195,174 ‐ ‐ ‐
Total governmental activities 33,042,283 3,426,349 6,120,352 435,057
Business‐type activities:
Water and Wastewater services 11,700,765 12,865,310 ‐ 1,163,622
Solid waste services 4,590,974 5,375,985 ‐ ‐
Airport 1,172,619 302,725 ‐ 217,622
Total business‐type activities 17,464,358 18,544,020 ‐ 1,381,244
Total primary government 50,506,641$ 21,970,369$ 6,120,352$ 1,816,301$
Component Unit:
General government and administration 229,832$ ‐$ ‐$ ‐$
Property management 653,575 234,234 ‐ ‐
Promotion and development 209,324 ‐ 17,085 ‐
Development services 1,145,169 ‐ ‐ ‐
Interest on long‐term debt 28,568 ‐ ‐ ‐
Total componen unit 2,266,468$ 234,234$ 17,085$ ‐$
General Revenues:
Taxes:
Ad valorem
Sales
Occupancy
Franchise and other
Investment earnings
Gain (loss) on sale/retirement
of capital assets
Miscellaneous
Transfers
Total general revenues and transfers
Change in net position
Net position at beginning of year
Net position at end of year
The notes to the financial statements are an integral part of this statement
Program Revenues
For the Fiscal Year Ended September 30, 2020
‐ 27 ‐
Governmental Business‐type Component
Activities Activities Total Unit
(6,026,768)$ ‐$ (6,026,768)$ ‐$
(10,217,063) ‐ (10,217,063) ‐
1,189,323 ‐ 1,189,323 ‐
(4,546,841) ‐ (4,546,841) ‐
(2,264,002) ‐ (2,264,002) ‐
(1,195,174) ‐ (1,195,174) ‐
(23,060,525) ‐ (23,060,525) ‐
‐ 2,328,167 2,328,167 ‐
‐ 785,011 785,011 ‐
‐ (652,272) (652,272) ‐
‐ 2,460,906 2,460,906 ‐
(23,060,525) 2,460,906 (20,599,619) ‐
‐$ ‐$ ‐$ (229,832)$
‐ ‐ ‐ (419,341)
‐ ‐ ‐ (192,239)
‐ ‐ ‐ (1,145,169)
‐ ‐ ‐ (28,568)
(2,015,149)
13,107,912 ‐ 13,107,912 ‐
10,402,522 ‐ 10,402,522 3,467,507
381,039 ‐ 381,039 ‐
1,906,926 ‐ 1,906,926 ‐
200,243 5,880 206,123 104,750
‐ ‐ ‐ 200,000
320,215 ‐ 320,215 355,931
2,181,304 (2,181,304) ‐ ‐
28,500,161 (2,175,424) 26,324,737 4,128,188
5,439,636 285,482 5,725,118 2,113,039
26,282,194 46,073,481 72,355,675 11,761,159
31,721,830$ 46,358,963$ 78,080,793$ 13,874,198$
Primary Government
Net (Expenses) Revenue
And Changes in Net Position

‐ 28 ‐
City of Weslaco, Texas Governmental Funds
Balance Sheet
2019 Bond Other Total
General Construction Governmental Governmental
Fund Fund Funds Funds
Assets
Cash and cash equivalents 1,213,862$ 8,399,895$ 4,791,919$ 14,405,676$
Cash and cash equivalents‐ restricted 413,775 ‐ ‐ 413,775
Investments 4,665,642 472,409 986,819 6,124,870
Receivables (net of allowance for uncollectibles):
Ad valorem taxes 738,406 ‐ 287,032 1,025,438
Sales taxes 1,133,096 ‐ ‐ 1,133,096
Ambulance fees 1,525,330 ‐ ‐ 1,525,330
Other 3,989,829 ‐ 226,854 4,216,683
Due from other funds 2,021,913 ‐ 82,739 2,104,652
Assets held for sale 2,874,000 ‐ ‐ 2,874,000
Prepaid items 10,306 ‐ ‐ 10,306
Inventories 9,055 ‐ ‐ 9,055
Total Assets 18,595,214$ 8,872,304$ 6,375,363$ 33,842,881$
Liabilities
Accounts payable 1,937,882$ 16,250$ 95,081$ 2,049,213$
Accrued salaries and payroll taxes 727,918 ‐ ‐ 727,918
Other liabilities 617,265 ‐ ‐ 617,265
Due to other funds 86,529 ‐ 10,432 96,961
Payable from restricted assets 413,775 ‐ ‐ 413,775
Unearned revenue 308,779 ‐ ‐ 308,779
Total Liabilities 4,092,148 16,250 105,513 4,213,911
Deferred Inflows of Resources
Unavailable revenue‐ ad valorem taxes 603,382 ‐ 236,639 840,021
Unavailable revenue‐ grants 329,532 ‐ ‐ 329,532
Unavailable revenue‐ EMS fees 1,525,330 ‐ ‐ 1,525,330
Total Deferred Inflows of Resources 2,458,244 ‐ 236,639 2,694,883
Fund Balances
Nonspendable 19,361 ‐ ‐ 19,361
Restricted ‐ 8,856,054 4,577,778 13,433,832
Assigned 2,874,000 ‐ 1,455,433 4,329,433
Unassigned 9,151,461 ‐ ‐ 9,151,461
Total Fund Balances 12,044,822 8,856,054 6,033,211 26,934,087
Total Liabilities, Deferred Inflows of Resources and Fund Balances 18,595,214$ 8,872,304$ 6,375,363$ 33,842,881$
The notes to the financial statements are an integral part of this statement
September 30, 2020

‐ 29 ‐
City of Weslaco, Texas Reconciliation of the Balance Sheet of Governmental Funds
To the Statement of Net Position
Governmental
Activities
Total fund balance‐governmental funds 26,934,087$
Amounts reported for governmental activities in the statement of net
position are different because:
Other long‐term assets are not available to pay for current period
expenditures and, therefore, are deferred in the governmental funds. 2,694,883
Capital assets used in governmental activities are not current financial
resources and therefore, are not reported in the governmental fund
balance sheet. This is the amount of governmental assets $100,160,636
net of accumulated depreciation totaling $(46,266,178). Not included in
this amount are internal service fund assets of $10,532. 53,894,458
Interest payable on long‐term debt does not require current financial
resources. Therefore, interest payable is not reported as a liability in
governmental funds balance sheet. (127,473)
Bond insurance is the only bond issuance cost allowed after implementation
of GASB Statement No 65. This is the unamortized cost of bond insurance cost paid
by the City on prior bond issuances 55,477
Deferred outflows of resources related to amounts deferred on refundings of long‐
term debt are not reported in the governmental funds. 178,082
Internal service funds are used by management to charge the cost of
certain activities. The assets and liabilities of certain internal service
funds are included in the governmental activities statement of net position. (239,737)
Long‐term liabilities are not due and payable in the current period
and, therefore, they are not reported in the governmental
funds balance sheet. (37,609,196)
Included in the noncurrent assets/(liabilities) is the recognition of the City's
net pension (liability) required by GASB Statement No 68 in the amount of
($6,341,943), a deferred resource outflows in the amount of $831,830, and a deferred
resource inflow in the amount of ($1,272,748). This resulted in a (decrease)
in net position. (6,782,861)
Included in the noncurrent (liabilities) is the recognition of the City Firemen's
net pension (liability) required by GASB 68 in the amount of ($5,668,100), a
deferred resource outflows in the amount of $1,228,429 and a deferred resource
inflow in the amount of ($431,481). This resulted in a (decrease)
in net position. (4,871,152)
Included in the noncurrent (liabilities) is the recognition of the City's total
OPEB liability required by GASB 75 in the amount of ($2,822,021), a deferred resource
outflow in the amount of $529,533, and a deferred resource inflow in the amount of
($112,250). This resulted in a (decrease) in net position. (2,404,738)
Net position of governmental activities 31,721,830$
The notes to the financial statements are an integral part of this statement
September 30, 2020

‐ 30 ‐
City of Weslaco, Texas Governmental Funds
Statement of Revenues, Expenditures and Changes in Fund Balances
2019 Bond Other Total
General Construction Governmental Governmental
Fund Fund Funds Funds
Revenues
Property taxes 9,619,717$ ‐$ 3,484,198$ 13,103,915$
Nonproperty taxes 12,309,448 ‐ 381,039 12,690,487
Fees and charges 2,271,717 ‐ 113,322 2,385,039
Fines and forfeitures 356,116 ‐ ‐ 356,116
Licenses and permits 653,513 ‐ ‐ 653,513
Intergovernmental 6,120,352 ‐ 105,525 6,225,877
Investment income 162,416 ‐ 37,827 200,243
Miscellaneous 320,215 ‐ ‐ 320,215
Total Revenues 31,813,494 ‐ 4,121,911 35,935,405
Expenditures
General government 6,430,299 ‐ 295,087 6,725,386
Public safety 17,260,498 ‐ 1,794,183 19,054,681
Public works 2,829,452 1,143,946 1,570,445 5,543,843
Culture and recreation 1,459,934 ‐ 566,930 2,026,864
Economic development 591,644 ‐ ‐ 591,644
Debt service:
Principal 879,965 ‐ 2,839,244 3,719,209
Interest and fees 36,291 ‐ 1,117,579 1,153,870
Total Expenditures 29,488,083 1,143,946 8,183,468 38,815,497
Excess (deficiency) of revenues
over expenditures 2,325,411 (1,143,946) (4,061,557) (2,880,092)
Other financing sources (uses):
Issuance of debt ‐ ‐ 440,000 440,000
Sale of capital assets ‐ ‐ 194,261 194,261
Transfers in 2,683,817 ‐ 1,812,573 4,496,390
Transfers out (2,315,086) ‐ ‐ (2,315,086)
Total other financing sources (uses) 368,731 ‐ 2,446,834 2,815,565
Net change in fund balances 2,694,142 (1,143,946) (1,614,723) (64,527)
Fund balances at beginning of year 10,844,329 10,000,000 7,647,934 28,492,263
Prior period adjustment (1,493,649) ‐ ‐ (1,493,649)
Fund balances at beginning of year, adjusted 9,350,680 10,000,000 7,647,934 26,998,614
Fund balances at end of year 12,044,822$ 8,856,054$ 6,033,211$ 26,934,087$
The notes to the financial statements are an integral part of this statement
For the Fiscal Year Ended September 30, 2020

‐ 31 ‐
City of Weslaco, Texas Reconciliation of the Statement of Revenues, Expenditures, and
Changes in Fund Balances of Governmental Funds to the Statement of Activities
Governmental
Activities
Net change in fund balances‐total governmental funds (64,527)$
Amounts reported for governmental activities in the statement of activities are different because:
Governmental funds report capital outlay as expenditures. However, in the government‐wide
statement of activities, the cost of those assets is allocated over their estimated useful lives
and reported as depreciation expense. This is the amount by which depreciation ($3,546,007)
exceeded capital outlay $6,122,591 in the current period. Not included in this amount is depreciation
in the internal service fund of ($103,366). 2,576,584
In the statement of activities, only the gain (loss) on the sale of assets is reported, whereas in the
funds, the proceeds from the sale increase financial resources. (211,919)
The change in compensated absences and accrued interest on long‐term debt of $244,372 and ($468)
are reported as a increase to expenditures in the statement of activities but not in the governmental funds. (244,840)
Issuance of debt related to notes payable are recorded as other financing sources in the governmental
funds while they are recorded as long term debt in the statement of net position. (440,000)
Bond premiums, discounts, insurance, and deferred charges are recognized in the funds in the year
the bonds are sold, but they are recorded as an asset, deferred resource outflow or liability and
amortized over the life of the bonds in the statement of activities. 203,536
Some revenues, such as property taxes, EMS fees, and grants will not be collected for several months after
the City's fiscal year end, therefor, they are not considered "available" revenues in the governmental funds. 365,210
Repayment of bond, capital lease and note payable principal, and liabilities under chapter 380
agreements are reported as expenditures in the governmental funds, but the repayment reduces
long‐term liabilities in the statement of net position. 3,719,209
Internal Service funds are used by management to charge the costs of certain activities. The net revenue
(loss) of the internal service funds is reported with governmental activities. (103,366)
GASB Statement No 68 requires that certain expenditures be de‐expended and recorded as deferred
resource outflows. These contributions made after the measurement date of 12/31/2019 caused the change in ending net position to increase in the amount of $683,818. Contributions made before the
measurement date but after the previous measurement date were reversed from deferred resource
outflows and recorded as a current year expense. This caused a decrease in the change in net position
totaling ($611,527). The City's reported TMRS net pension expense had to be recorded. The net pension
expense (decreased) the change in net position by ($503,156). The result of these changes
is to (decrease) the change in net position. (430,865)
Firemen pension contributions reported in the funds were greater than the calculated pension expense
on the statement of activities and therefore increase net position. (440,495)
The implementation of GASB 75 required that certain expenditures be de‐expended and recorded as
deferred resource outflows. These contributions made after the measurement date of 12/31/19 caused
the change in the ending net position to increase in the amount of $14,447. Contributions made before
the measurement date but after the previous measurement date were reversed from deferred resource
outflows and recorded as a current year expense. This caused a decrease in the change in net position
totaling ($12,230). The City's reported TMRS OPEB expense had to be recorded. The net OPEB expense
(decreased) the change in net position by ($61,202). In addition to this the City's reported Firemen
Retiree Health Care OPEB expense had to be recorded. The net OPEB expense increased the change in
net position by $570,094. The result of these changes is to (decrease) the change in net position. 511,109
Change in net position of governmental activities 5,439,636$
The notes to the financial statements are an integral part of this statement
For the Fiscal Year Ended September 30, 2020

‐ 32 ‐
City of Weslaco, Texas Proprietary Funds
Statement of Net Position
Governmental
Activities
Water
and Solid Internal
Wastewater Waste Airport Service
Fund Fund Fund Totals Fund
Assets
Current Assets
Cash and cash equivalents 432,813$ ‐$ 27,576$ 460,389$ ‐$
Cash and cash equivalents‐ restricted 1,652,862 ‐ 13,590 1,666,452 ‐
Investments‐ restricted 562,681 ‐ ‐ 562,681 ‐
Receivables,
net of allowances for uncollectibles 2,285,042 820,550 135,331 3,240,923 ‐
Due from other funds ‐ 2,000,000 ‐ 2,000,000 ‐
Inventories 254,530 ‐ 38,573 293,103 ‐
Prepaid items 18,996 ‐ ‐ 18,996 ‐
Total current assets 5,206,924 2,820,550 215,070 8,242,544 ‐
Non‐current assets
Land 665,175 421,247 2,866,462 3,952,884 ‐
Buildings 362,324 668,781 648,541 1,679,646 ‐
Equipment 5,824,096 1,734,678 640,947 8,199,721 4,997,658
Improvements ‐ ‐ ‐ ‐ 70,864
Infrastructure 115,771,542 64,461 13,704,908 129,540,911 ‐
Capital leases 6,934,391 540,552 ‐ 7,474,943 ‐
Construction‐in‐progress 453,476 ‐ 97,058 550,534 ‐
Total non‐current assets 130,011,004 3,429,719 17,957,916 151,398,639 5,068,522
Accumulated depreciation (43,169,530) (2,353,018) (5,651,387) (51,173,935) (5,057,990)
Total non‐current assets, net 86,841,474 1,076,701 12,306,529 100,224,704 10,532
Total assets 92,048,398 3,897,251 12,521,599 108,467,248 10,532
Deferred outflows of resources
Deferred outflows related to pensions 83,503 2,158 14,657 100,318 ‐
Deferred outflows related to OPEB 9,980 470 2,735 13,185 ‐
Deferred charge on refunding 1,778,044 ‐ ‐ 1,778,044 ‐
Total deferred outflows of resources 1,871,527 2,628 17,392 1,891,547 ‐
Total assets and deferred outflows
of resources 93,919,925$ 3,899,879$ 12,538,991$ 110,358,795$ 10,532$
The notes to the financial statements are an integral part of this statement
Business‐Type Activities
September 30, 2020

‐ 33 ‐
City of Weslaco, Texas Proprietary Funds
Statement of Net Position‐ Continued
Governmental
Activities
Water
and Solid Internal
Wastewater Waste Airport Service
Fund Fund Fund Totals Fund
Liabilities
Current Liabilities:
Accounts payable 947,439$ 391,694$ 38,717$ 1,377,850$ ‐$
Accrued salaries and other liabilities 153,415 ‐ 32,768 186,183 ‐
Due to other funds 2,259,258 890,709 607,455 3,757,422 250,269
Current portion of long term debt 3,407,201 110,581 57,454 3,575,236 ‐
Accrued interest on bonds 252,613 ‐ ‐ 252,613 ‐
Total current liabilities 7,019,926 1,392,984 736,394 9,149,304 250,269
Noncurrent liabilities:
Compensated absences 78,807 18,725 33,203 130,735 ‐
Customer deposits 1,274,450 ‐ 3,594 1,278,044 ‐
Revenue bonds payable,
net of unamortized premiums 44,464,654 ‐ ‐ 44,464,654 ‐
Capital lease payable 5,698,351 461,985 ‐ 6,160,336 ‐
Note payable ‐ ‐ 1,397,045 1,397,045 ‐
Landfill closure ‐ 372,376 ‐ 372,376 ‐
Net pension liability 709,455 16,629 113,236 839,320 ‐
OPEB liability 54,505 2,399 14,389 71,293 ‐
Total noncurrent liabilities 52,280,222 872,114 1,561,467 54,713,803 ‐
Total liabilities 59,300,148 2,265,098 2,297,861 63,863,107 250,269
Deferred inflows of resources
Deferred inflows related to pensions 105,853 3,551 22,614 132,018 ‐
Deferred inflows related to OPEB 3,530 177 1,000 4,707 ‐
Total deferred inflows of resources 109,383 3,728 23,614 136,725 ‐
Net Position
Net investment in capital assets 36,274,278 506,216 10,855,719 47,636,213 10,532
Restricted for:
Revenue bond retirement 999,333 ‐ ‐ 999,333 ‐
Construction ‐ ‐ 13,590 13,590 ‐
Unrestricted (2,763,217) 1,124,837 (651,793) (2,290,173) (250,269)
Total net position 34,510,394 1,631,053 10,217,516 46,358,963 (239,737)
Total liabilities, deferred inflows of resources, and net position 93,919,925$ 3,899,879$ 12,538,991$ 110,358,795$ 10,532$
Business‐Type Activities
September 30, 2020

‐ 34 ‐
City of Weslaco, Texas Proprietary Funds
Statement of Revenues, Expenses and Changes in Net Position
Governmental
Activities
Water
and Solid
Wastewater Waste Airport Internal Service
Fund Fund Fund Total Fund
Operating Revenues:
Water services 7,483,073$ ‐$ ‐$ 7,483,073$ ‐$
Sewer services 5,318,493 ‐ ‐ 5,318,493 ‐
Charges for services ‐ 5,375,985 302,600 5,678,585 ‐
Miscellaneous 63,744 ‐ 125 63,869 ‐
Total operating revenues 12,865,310 5,375,985 302,725 18,544,020 ‐
Operating Expenses:
Personal services 845,022 106,773 270,744 1,222,539 ‐
Other services and charges 2,035,775 186,927 212,734 2,435,436 ‐
Supplies 209,394 8,032 232,826 450,252 ‐
Contractual services 3,037,989 4,256,525 ‐ 7,294,514 ‐
Depreciation 3,939,191 32,717 430,922 4,402,830 103,366
Total operating expenses 10,067,371 4,590,974 1,147,226 15,805,571 103,366
Operating income (loss) 2,797,939 785,011 (844,501) 2,738,449 (103,366)
Non‐operating revenues (expenses)
Investment income 5,880 ‐ ‐ 5,880 ‐
Interest expense (1,633,394) ‐ (25,393) (1,658,787) ‐
Total non‐operating (expenses) (1,627,514) ‐ (25,393) (1,652,907) ‐
Income (loss) before transfers and capital contributions 1,170,425 785,011 (869,894) 1,085,542 (103,366)
Transfers in (out) and capital contributions
Capital Improvement fees 696,141 ‐ ‐ 696,141 ‐
Capital grants 467,481 ‐ 217,622 685,103 ‐
Transfers in 5,429,883 ‐ 250,000 5,679,883 ‐
Transfers out (6,736,187) (1,125,000) ‐ (7,861,187) ‐
Total transfers and capital contributions (142,682) (1,125,000) 467,622 (800,060) ‐
Change in net position 1,027,743 (339,989) (402,272) 285,482 (103,366)
Net position‐ beginning 33,482,651 1,971,042 10,619,788 46,073,481 (136,371)
Net position‐ ending 34,510,394$ 1,631,053$ 10,217,516$ 46,358,963$ (239,737)$
The notes to the financial statements are an integral part of this statement
Business Type Activities
For the Fiscal Year Ended September 30, 2020

‐ 35 ‐
City of Weslaco, Texas Proprietary Funds
Statement of Cash Flows
Governmental
Activities
Water
and Solid
Wastewater Waste Airport Internal Service
Fund Fund Fund Total Fund
Cash flows from operating activities
Cash received from customers 12,662,443$ 5,231,011$ 266,593$ 18,160,047$ ‐$
Payments to suppliers (5,075,884) (4,023,828) (424,101) (9,523,813) ‐
Payments to employees (614,132) (96,728) (248,732) (959,592) ‐
Net cash provided by (used in) operating activities 6,972,427 1,110,455 (406,240) 7,676,642 ‐
Cash flows from noncapital financing activities
Transfers from other funds 5,429,883 ‐ 250,000 5,679,883 ‐
Transfers to other funds (6,736,187) (1,125,000) ‐ (7,861,187) ‐
Net cash provided by (used in)
noncapital financing activities (1,306,304) (1,125,000) 250,000 (2,181,304) ‐
Cash flows from capital and related financing activities
Purchase of capital assets (1,521,318) (540,552) (1,439,014) (3,500,884) ‐
Interest paid on bonds (2,456,712) ‐ ‐ (2,456,712) ‐
Interest paid on notes payable ‐ ‐ (25,393) (25,393) ‐
Capital lease proceeds ‐ 570,485 ‐ 570,485 ‐
Notes payable proceeds ‐ ‐ 1,450,810 1,450,810 ‐
Retirement of bonds (2,811,750) ‐ ‐ (2,811,750) ‐
Landfill closure costs ‐ (15,388) ‐ (15,388) ‐
Capital grants ‐ ‐ 196,809 196,809 ‐
Capital improvement fees 696,141 ‐ ‐ 696,141 ‐
Net cash provided by (used in) capital
and related financing activites (6,093,639) 14,545 183,212 (5,895,882) ‐
Cash flow from investing activities:
Interest on cash and investments 5,880 ‐ ‐ 5,880 ‐
Purchase of capital assets 226,974 ‐ ‐ 226,974 ‐
Net cash provided by investing activities 232,854 ‐ ‐ 232,854 ‐
Net (decrease) in cash and cash equivalents (194,662) ‐ 26,972 (167,690) ‐
Cash and cash equivalents, beginning of year 2,280,337 ‐ 14,194 2,294,531 ‐
Cash and cash equivalents, end of year 2,085,675$ ‐$ 41,166$ 2,126,841$ ‐$
Reconciliation of operating income (loss)
to net cash provided by used in operating activities
Operating income (loss) 2,797,939$ 785,011$ (844,501)$ 2,738,449$ (103,366)$
Adjustments to reconcile income (loss)
from operations to net cash from operating activities:
Depreciation 3,939,191 32,717 430,922 4,402,830 103,366
(Increase) decrease in accounts receivables (295,126) (144,974) (36,132) (476,232) ‐
(Increase) decrease in inventories (93,630) ‐ (7,219) (100,849) ‐
(Increase) decrease in prepaid items 18,940 ‐ ‐ 18,940 ‐
(Increase) decrease in deferred outflows 287,983 5,533 31,356 324,872 ‐
Decrease (increase) in accounts payable 22,706 1,646 (33,427) (9,075) ‐
Decrease (increase) in accrued salaries and other liabilities 21,064 ‐ 6,111 27,175 ‐
Decrease (increase) in due to other funds 259,258 420,477 62,105 741,840 ‐
Decrease (increase) in customer deposits 92,259 ‐ ‐ 92,259 ‐
Decrease (increase) in compensated absences 562 13,981 6,849 21,392 ‐
Decrease (increase) in net pension liability (159,725) (7,986) (45,255) (212,966) ‐
Decrease (increase) in OPEB liability 10,505 525 2,976 14,006 ‐
Decrease (increase) in deferred inflows 70,501 3,525 19,975 94,001 ‐
Total adjustments 4,174,488 325,444 438,261 4,938,193 103,366
Net cash provided (used) by operations 6,972,427$ 1,110,455$ (406,240)$ 7,676,642$ ‐$
Supplemental disclosure of noncash activities
Contributed capital assets from Urban County 467,481$ ‐$ ‐$ 467,481$ ‐$
Business Type Activities
The notes to the financial statements are an integral part of this statement
For the Fiscal Year Ended September 30, 2020

‐ 36 ‐
City of Weslaco, Texas Fiduciary Funds
Statement of Fiduciary Net Position
Pension Private‐purpose
Trust fund Trust fund
Firemen's
Relief and Marion Booth
Retirement Fund Endowment Fund
Assets
Cash 7,573$ 16,711$
Investments, at fair value:
Certificates of deposit ‐ 494,114
Equities 9,405,149 ‐
Mutual funds 117,985 ‐
Corporate bonds 782,304 ‐
Money market mutual funds 737,809 ‐
Municipal bonds 1,781,537 ‐
Total Assets 12,832,357$ 510,825$
Liabilities
Accounts payable ‐$ 501$
Total Liabilities ‐ 501
Net Position
Net position restricted for pensions
and other purposes 12,832,357 510,324
Total Net Position 12,832,357 510,324
Total Liabilities and Net Position 12,832,357$ 510,825$
The notes to the financial statements are an integral part of this statement
September 30, 2020

‐ 37 ‐
City of Weslaco, Texas Fiduciary Funds
Statement of Changes in Fiduciary Net Position
Pension Private‐purpose
Trust fund Trust fund
Firemen's
Relief and Marion Booth
Retirement Fund Endowment Fund
Additions
Contributions
Employer contributions 599,436$ ‐$
Plan member contributions 599,436 ‐
Total contributions 1,198,872 ‐
Investment income
Net appreciation in fair value of investments 87,988 ‐
Interest and dividends 310,148 10,228
Total investment income 398,136 10,228
Less investment expense (66,104) ‐
Net investment income 332,032 10,228
Total additions 1,530,904 10,228
Deductions
Benefits paid 595,725 ‐
Refunds of contributions ‐ ‐
Administrative expenses 32,661 2,519
Total deductions 628,386 2,519
Net change in fiduciary net position 902,518 7,709
Net position, beginning of year 11,929,839 502,615
Net position, end of year 12,832,357$ 510,324$
The notes to the financial statements are an integral part of this statement
For the Fiscal Year Ended September 30, 2020

‐ 38 ‐
(This page intentionally left blank)

‐ 39 ‐
NOTES TO FINANCIAL STATEMENTS

‐ 39 ‐
City of Weslaco, Texas Notes to Financial Statements
NOTE 1: SUMMARY OF SIGNIFICANT ACCOUNTING POLICIES The City of Weslaco, Texas (the “City”) was incorporated September 18, 1919, under the provisions of Act 279, P.A. 1909, as amended (Home Rule City Act). The City operates under a Commission‐Manager form of government and provides the following services as authorized by its charter: public safety (police and fire), highways and streets, solid waste, health and social services, culture and recreation, education, public improvements, planning and zoning, and general administrative services. The accounting and reporting policies of the City relating to the funds included in the accompanying basic financial statements conform to accounting principles generally accepted in the United States of America applicable to state and local governments. Generally accepted accounting principles for local governments includes those principles prescribed by the Governmental Accounting Standards Board (GASB), the American Institute of Certified Public Accountants in the publication entitled Audits of State and Local Governmental Units. Financial Reporting Entity The City is a municipal corporation governed by an elected mayor and six‐member governing commission (the “Commission”). The accompanying financial statements present the City and its component unit, the entity for which the City is considered to be financially accountable. The discretely presented component unit is reported in a separate column in the government‐wide financial statements to emphasize that it is legally separate from the City. The accounting policies of the City conform to generally accepted accounting principles (GAAP) as applied to governmental units. The more significant accounting policies used by the City are described below. In evaluating the City as a reporting entity, management has considered all potential component units in accordance with Section 2100: Defining the Financial Reporting Entity of the Governmental Accounting Standards Board (GASB) Codification. Discretely Presented Component Unit The Economic Development Corporation of Weslaco (the “EDC”) was merged and incorporated under the provisions of the Development Corporation Act of 1979, as amended, for the purpose of promoting economic development within the City. The EDC has separate corporate powers that distinguish it as being a legally separate entity from the City. The City has the ability to impose its will, and has a financial benefit and financial accountability over the EDC. The EDC is governed by seven members who are appointed by and serve at the pleasure of the Mayor. A copy of the EDC’s financial statements can be obtained by contacting the Weslaco Economic Development Corporation at 275 S. Kansas, Weslaco, Texas 78596. Government‐Wide and Fund Financial Statements The government‐wide financial statements (i.e., the statement of net position and the statement of activities) report information on all of the nonfiduciary activities of the primary government and its component units. Governmental activities, which normally are supported by taxes, intergovernmental revenues, and other nonexchange transactions, are reported separately from business‐type activities, which rely to a significant extent on fees and charges to external customers for support. Likewise, the primary government is reported separately from certain legally separate component units for which the primary government is financially accountable.

‐ 40 ‐
City of Weslaco, Texas Notes to Financial Statements
NOTE 1: SUMMARY OF SIGNIFICANT ACCOUNTING POLICIES (Continued)
Government‐Wide and Fund Financial Statements (Continued)
The statement of activities demonstrates the degree to which the direct expenses of a given function are offset by program revenues. Direct expenses are those that are clearly identifiable with a specific function. Program revenues include 1) charges to customers or applicants who purchase, use, or directly benefit from goods, services or privileges provided by a given function or segment, and 2) grants and contributions that are restricted to meeting the operational or capital requirements of a particular function. Taxes and other items not properly included among program revenues are reported instead as general revenues. Separate financial statements are provided for governmental funds, proprietary fund and fiduciary funds, even though the latter are excluded from the government‐wide financial statements. Major individual governmental funds are reported as separate columns in the fund financial statements. Measurement Focus, Basis of Accounting and Financial Statement Presentation The accounting and financial reporting treatment is determined by the applicable measurement focus and basis of accounting. Measurement focus indicates the type of resources being measured such as current financial resources or economic resources. The basis of accounting indicates the timing of transactions or events for recognition in the financial statements. The government‐wide financial statements are reported using the economic resources measurement focus and the accrual basis of accounting. Revenues are recorded when earned and expenses are recorded when a liability is incurred, regardless of the timing of related cash flows. Property taxes are recognized as revenues in the year for which they are levied. Grants and similar items are recognized as revenue as soon as all eligibility requirements imposed by the provider have been met. The governmental fund financial statements are reported using the current financial resources measurement focus and the modified accrual basis of accounting. Revenues are recognized as soon as they are both measurable and available. Revenues are considered to be available when they are collectible within the current period or soon enough thereafter to pay liabilities of the current period. For this purpose, the government considers revenues to be available if they are collected within 60 days of the end of the current fiscal period. Expenditures generally are recorded when a liability is incurred, as under accrual accounting. However, debt service expenditures, as well as expenditures related to compensated absences, and claims and judgments, are recorded only when payment is due. General capital asset acquisitions are reported as expenditures in governmental funds. Issuance of long‐term debt and acquisitions under capital leases are reported as other financing sources. Property taxes, sales taxes, franchise taxes, licenses, and interest associated with the current fiscal period are all considered to be susceptible to accrual and so have been recognized as revenues of the current fiscal period. Entitlements are recorded as revenues when all eligibility requirements are met, including any time requirements, and the amount is received during the period or within the availability period for this revenue source (within 60 days of year end). Expenditure‐driven grants are recognized as revenue when the qualifying expenditures have been incurred and all other eligibility requirements have been met, and the amount is received during the period or within the availability period for this revenue source (within 90 days of year end). All other revenue items are considered to be measurable and available only when cash is received by the City.

‐ 41 ‐
City of Weslaco, Texas Notes to Financial Statements
NOTE 1: SUMMARY OF SIGNIFICANT ACCOUNTING POLICIES (Continued) Measurement Focus, Basis of Accounting and Financial Statement Presentation (Continued) The proprietary, pension trust fund, and private‐purpose trust funds are reported using the economic resources measurement focus and the accrual basis of accounting. Government‐Wide Financial Statements While separate government‐wide and fund financial statements are presented, they are interrelated. The governmental activities column incorporates data from governmental funds and internal service funds, while business‐type activities incorporate data from the City’s enterprise funds. Separate financial statements are provided for governmental funds, proprietary funds, and fiduciary funds, even though the latter are excluded from the government‐wide financial statements. As discussed earlier, the City has one discretely presented component unit. While the Development Corporation of Weslaco is considered to be a major component unit, it is nevertheless shown in separate column in the government‐wide financial statements. As a general rule, the effect of interfund activity has been eliminated from the government‐wide financial statements. Exceptions to this general rule are payments in lieu of taxes where the amounts are reasonably equivalent in value to the interfund services provided and other charges between the City’s wastewater and sanitation services functions and various other functions of the City. Elimination of these charges would distort the direct costs and program revenues reported for the various functions concerned. Fund Financial Statements The fund financial statements provide information about the City’s funds, including its fiduciary funds and blended component units. Separate statements for each fund category—governmental, proprietary, and fiduciary—are presented. The emphasis of fund financial statements is on major governmental and enterprise funds, each displayed in a separate column. All remaining governmental and enterprise funds are aggregated and reported as nonmajor funds. Major individual governmental and enterprise funds are reported as separate columns in the fund financial statements.
The City reports the following major governmental funds: The General Fund is the City’s primary operating fund. It accounts for all financial resources of the general government, except those accounted for in another fund. The 2019 Bond Construction fund is used to account for bond proceeds used to fund for acquisition and construction of capital activities related to City drainage projects.

‐ 42 ‐
City of Weslaco, Texas Notes to Financial Statements
Note 1: SUMMARY OF SIGNIFICANT ACCOUNTING POLICIES (Continued) Fund Financial Statements (Continued)
The City reports the following major enterprise funds: The Water and Wastewater Fund is used to account for the provision of water and wastewater services to the residents of the City. Activities of the fund include administration, operations and maintenance of the water and wastewater system and billing and collection activities. The fund also accounts for the accumulation of resources for, and the payment of, long‐term debt principal and interest for water and wastewater debt. All costs are financed through charges to utility customers with rates reviewed regularly and adjusted if necessary to ensure integrity of the funds. The Solid Waste Fund is used to account for operations of solid waste collection and disposal services. All costs are financed through charges to solid waste customers. The Airport Fund accounts for the provision of airport facilities to area residents. All activities necessary to provide such services are accounted for in this fund. The fund is financed primarily by the City of Weslaco operating grants, hangar rentals and tie‐down fees. Additionally, the City reports the following fund types: Special revenue funds are used to account for the proceeds of specific revenue sources that are restricted to expenditures for specified purposes other than capital projects. The debt service fund is used to account for the accumulation of resources that are restricted for the payment of principal and interest on long‐term obligations of governmental funds. Capital projects funds account for the acquisition and construction of the City’s major capital facilities, other than those financed by proprietary funds. Internal Service Fund which is used to account for the capital acquisitions and leasing services provided to departments of the City. The pension trust funds account for the activities of the Weslaco Firemen’s Relief and Retirement Fund, which accumulate resources for pension benefit payments to qualified public safety employees.
The private‐purpose trust fund accounts for contributions made on behalf of outside parties. During the course of operations, the City has activity between funds for various purposes. Any residual balances outstanding at year end are reported as due from/to other funds and advances to/from other funds. While these balances are reported in fund financial statements, certain eliminations are made in the preparation of the government‐wide financial statements. Balances between the funds included in governmental activities (i.e., the governmental and internal service funds) are eliminated so that only the net amount is included as internal balances in the governmental activities column.

‐ 43 ‐
City of Weslaco, Texas Notes to Financial Statements
Note 1: SUMMARY OF SIGNIFICANT ACCOUNTING POLICIES (Continued) Fund Financial Statements (Continued) Similarly, balances between the funds included in business‐type activities (i.e., the enterprise funds) are eliminated so that only the net amount is included as internal balances in the business‐type activities column. Further, certain activity occurs during the year involving transfers of resources between funds. In fund financial statements these amounts are reported at gross amounts as transfers in/out. While reported in fund financial statements, certain eliminations are made in the preparation of the government‐wide financial statements. Transfers between the funds included in governmental activities are eliminated so that only the net amount is included as transfers in the governmental activities column. Similarly, balances between the funds included in business‐type activities are eliminated so that only the net amount is included as transfers in the business‐type activities column. Budgetary Information Budgetary basis of accounting Annual budgets are adopted on a basis consistent with generally accepted accounting principles for the General, Hotel/Motel Tax‐ Special Revenue, Debt Service Fund, Capital Improvement Program, Storm Water Improvement Fund, and Fire Department Equipment Replacement‐ Capital Project Funds. Other capital projects funds are appropriated on a project‐length basis. Certain special revenue funds do not have appropriated budgets since other means control the use of these resources (e.g., grant awards and endowment requirements) and sometimes span a period of more than one fiscal year. In addition, the Water and Wastewater, Solid Waste, and Airport Proprietary Funds also employ formal budgetary integration as a management control device during the year. Budgets for these funds are adopted on a basis consistent with Generally Accepted Accounting Principles (GAAP). The appropriated budget is prepared by fund, function, and department. The City’s department heads may make transfers of appropriations within a department. Transfers of appropriations between departments require the approval of the commission. The legal level of budgetary control (i.e., the level at which expenditures may not legally exceed appropriations) is the department level. Appropriations in all budgeted funds lapse at the end of the fiscal year even if they have related encumbrances. Encumbrances are commitments related to unperformed (executory) contracts for goods or services (i.e., purchase orders, contracts, and commitments). Encumbrance accounting is utilized to the extent necessary to assure effective budgetary control and accountability and to facilitate effective cash planning and control. While all appropriations and encumbrances lapse at year end, valid outstanding encumbrances (those for which performance under the executory contract is expected in the next year) are re‐appropriated and become part of the subsequent year’s budget or are canceled pursuant to state regulations.

‐ 44 ‐
City of Weslaco, Texas Notes to Financial Statements
Note 1: SUMMARY OF SIGNIFICANT ACCOUNTING POLICIES (Continued) Budgetary Information (Continued) Excess of expenditures over appropriations At September 30, 2020, expenditures exceeded appropriations in eight departments in the General Fund. These amounts were attributed to underestimation of actual expenditures and unforeseen cost in overtime, supplies, utilities, and maintenance of city vehicles. Revenue was available to cover the excess this year. The departments and the excess expenditures over appropriations are as follows:
City Manager 4,665$
Finance 25,739
Human resources 28,509
Law 41,205
Fire Department 723,611
Emergency Management Department 900,962
Drain Ditch Department 231,308
Other Economic Development 6,859
Debt Service‐ principal retirement 214,875 Assets, Liabilities, Deferred Outflows/Inflows of Resources and Net Position/Fund Balance Cash and Cash Equivalents The City’s cash and cash equivalents are considered to be cash on hand, demand deposits, and short‐term investments with original maturities of three months or less from the date of acquisition. Cash of all funds, including restricted cash is pooled into common pooled accounts in order to maximize investment opportunities. Each fund whose monies are deposited in the pooled cash accounts has equity therein, and interest earned on the investment of these monies is allocated based upon relative equity at month end. An individual fund’s pooled cash are available upon demand and are considered to be “cash equivalents” when preparing these financial statements. In addition, any marketable securities not included in the common pooled accounts that are purchased with a maturity of ninety days or less are also considered to be “cash equivalents”. Negative balances incurred in pooled cash at year‐end are treated as inter‐fund receivables of the General Fund and inter‐fund payables of the deficit fund. Investments Investments for the City are reported at fair value (generally based on quoted market prices) except for the position in the TexPool public fund investment pool (Pool). The pool meets all of the specified criteria in Section I50: Investments to qualify to elect to measure their investments at amortized cost. Accordingly, the fair value of the City’s position in the pool is equal to the value of the pooled shares. Other investments are carried at fair value as defined in GASB Statement No 72 “Fair Value Measurement and Application”. Consistent with GASB Statement No 72, the City categorizes its fair value measurements within the fair value hierarchy. The hierarchy is based on the valuation inputs used to measure the fair value of the asset. Level 1 inputs are quoted prices in active markets for identical assets; Level 2 inputs are significant other observable inputs; Level 3 inputs are significant unobservable inputs. For the City’s Firemen’s Relief and Retirement Fund Investments a detail of the fair value hierarchy of investments held by the City are disclosed in Note 3 to the financial statements.

‐ 45 ‐
City of Weslaco, Texas Notes to Financial Statements
Note 1: SUMMARY OF SIGNIFICANT ACCOUNTING POLICIES (Continued) Receivables and payables
Unbilled receivables – An amount for unbilled revenue is recorded in the Water and Wastewater Fund and Solid Waste Fund for services rendered, but not yet billed as of the end of the fiscal year. The receivable is derived from the cycle billings generated subsequent to fiscal year end and prorated for usage in September. Allowance for doubtful accounts – Accounts receivable have been reported net of the allowance for doubtful accounts. Accounts receivable in excess of 120 days are subject to being considered as uncollectible. Unearned revenue – Unearned revenue recorded on the governmental fund balance sheet represents amounts received before eligibility requirements are met. Interfund Activities and Transactions During the course of operations, numerous transactions occur between individual funds for goods provided or services rendered. These receivables and payables are classified as “due from other funds” or “due to other funds” within the fund financial statements. Long‐term borrowings between funds are classified as “advances to other funds” or “advances from other funds” in the fund financial statements. These amounts are eliminated in the governmental and business‐type activities columns of the statement of net position, except for any residual balance outstanding between the governmental and business‐type activities at the end of the fiscal year, which are reported in the government‐wide financial statements as internal balances. Interfund transactions are reflected as services provided, reimbursements, or transfers. Services provided, deemed to be at or near market rates, are treated as revenues and expenditures/expenses. Reimbursements are when on fund incurs a cost, charges the appropriate benefitting fund, and reduces its related cost as a reimbursement. All other interfund transactions are treated as transfers. Transfers between governmental or business‐type funds are funds are netted as part of the reconciliation to the government‐wide presentation. Restricted Assets Certain assets of the City are classified as restricted assets on the statement of net position because their use is limited by law through constitutional provisions or enabling legislation; or by restrictions imposed externally by creditors, grantors, contributors or laws or regulations of other governments. Special restricted asset accounts have been established to account for the sources and uses of these limited use assets as follows: Customer deposit accounts – Deposited in non‐interest bearing accounts and refunded upon termination of service with the City and satisfaction of all obligations due. Bond and capital activities– Includes certain proceeds from issuance of revenue bonds, as well as certain resources set aside for the repayment of bonds or future capital activities.

‐ 46 ‐
City of Weslaco, Texas Notes to Financial Statements
Note 1: SUMMARY OF SIGNIFICANT ACCOUNTING POLICIES (Continued) Capital Assets Capital assets, which include property, plant, equipment, and infrastructure assets, are reported in the applicable governmental or business‐type activities columns in the government‐wide financial statements and in the fund financial statements for proprietary funds. All capital assets are valued at historical cost or estimated historical cost if actual historical cost is not available. Donated assets, donated works of art and similar items, and capital assets received in a service concession arrangement are reflected at acquisition value. Repairs and maintenance are recorded as expenses. Renewals and betterments are capitalized. Interest has not been capitalized during the construction period on property, plant and equipment.
Assets capitalized, not including infrastructure assets, have an original cost of $1,000 or more and over one year of useful life. Infrastructure assets capitalized have an original cost of $5,000 or more. Depreciation has been calculated on each class of depreciable property using the straight‐line method. Estimated useful lives are as follows: Buildings 20 ‐ 50 years Water and Wastewater System 30 ‐ 50 years Infrastructure 20 ‐ 35 years Machinery and Equipment 5 ‐ 10 years Improvements 20 years Deferred Outflows/Inflows of Resources In addition to assets, the statement of financial position will sometimes report a separate section for deferred outflows of resources. This separate financial statement element, deferred outflows of resources, represents a consumption of net position that applies to a future period(s) and so will not be recognized as an outflow of resources (expense/ expenditure) until then. The City has three (3) items that qualify for reporting as deferred outflows of resources, the deferred amount on refunding, the deferred outflows related to pensions, and the deferred outflows related to OPEB, each reported in the government‐wide and proprietary funds statements of net position. The deferred amount on refunding results from debt refinancing, whereby the reacquisition price of the funding debt instruments exceed their net carrying amount. The deferred amount on refunding is amortized over the shorter of the life of the refunded or refunding debt. The deferred outflows related to pensions and OPEB are an aggregate of items related to pensions and other post‐employment benefits as calculated in accordance with GASB Codification Section P20: Pension Activities – Reporting for Benefits Provided through Trusts That Meet Specified Criteria. The deferred outflows related to pensions and OPEB will be recognized as either pension or OPEB expense or a reduction in the net pension liability or OPEB liability in future reporting years. In addition to liabilities, the statement of financial position will sometimes report a separate section for deferred inflows of resources. This separate financial statement element, deferred inflows of resources, represents an acquisition of net position that applies to a future period(s) and so will not be recognized as an inflow of resources (revenue) until that time. The City has two (2) items that qualify for reporting as deferred inflows of resources. The deferred inflows related to pensions and OPEB are an aggregate of items related to pensions and other post‐employment benefits as calculated in accordance with GASB Codification Section P20: Pension Activities – Reporting for Benefits Provided through Trusts That Meet Specified Criteria. The deferred inflows related to pensions and OPEB will be recognized as a reduction to pension or OPEB expense in future reporting years.

‐ 47 ‐
City of Weslaco, Texas Notes to Financial Statements
Note 1: SUMMARY OF SIGNIFICANT ACCOUNTING POLICIES (Continued) Deferred Outflows/Inflows of Resources (Continued) Unavailable revenue, which arises only under a modified accrual basis of accounting, is reported only in the governmental funds balance sheet. The governmental funds report unavailable revenues from property taxes. These amounts are deferred and recognized as an inflow of resources in the period that the amounts become available. Compensated Absences The City’s policy allows employees to accumulate unused sick leave on an unlimited basis and vacation leave up to 30 days except vacation leave accrued prior to December 1990, which shall be refunded in full. Non‐civil service employees who were hired before October 1, 2008 and who have completed ten years of employment are entitled to be paid up to 30 days of accumulated sick leave, 60 days for those employees with 11 to 20 years and 90 days for 21 years or more and any accumulated vacation up to 30 days, upon termination. Employees who were hired after October 1, 2008 shall be refunded in full one hundred and twenty (120) hours upon separation of employment, from accumulated vacation leave. Civil service employees hired are entitled to be paid any accumulated vacation, but must complete five years of employment with the City to be entitled to be paid up to 90 days of accumulated sick leave upon termination. Sick leave in excess of maximum limits is not paid upon termination, but will be paid only upon illness while employed by the City. Long‐Term Obligations In the government‐wide financial statements and proprietary fund types in the fund financial statements, long‐term debt and other long‐term obligations are reported as liabilities in the applicable governmental activities, business‐type activities, or proprietary fund type statement of net position. Bond premiums and discounts are deferred and amortized over the life of the bonds and is recorded as an adjustment to interest expense. Bonds payable are reported net of the applicable bond premium or discount. In accordance with GASB Codification Section I30: Interest Costs – Imputation, bond issuance costs are expensed in the period incurred except for prepaid insurance costs. Pensions For purposes of measuring the net pension liability, pension related deferred outflows and inflows of resources, and pension expense, City specific information about its Fiduciary Net Position in the Texas Municipal Retirement System (TMRS) and additions to/deductions from the City’s Fiduciary Net Position have been determined on the same basis as they are reported by TMRS. For this purpose, plan contributions are recognized in the period that compensation is reported for the employee, which is when contributions are legally due. Benefit payments and refunds are recognized when due and payable in accordance with the benefit terms. Investments are reported at fair value. Information regarding the City’s Total Pension Liability is obtained from TMRS through a report prepared for the City by TMRS consulting actuary, Gabriel Roeder Smith & Company, in compliance with Governmental Accounting Standards Board (GASB) Statement No. 68, Accounting and Financial Reporting for Pensions.

‐ 48 ‐
City of Weslaco, Texas Notes to Financial Statements
Note 1: SUMMARY OF SIGNIFICANT ACCOUNTING POLICIES (Continued) Other Post‐Employment Benefits (OPEB) The fiduciary net position of the Texas Municipal Retirement System (TMRS) Supplemental Death Benefit and the Firefighter Retiree Healthcare benefit has been determined using the flow of economic resources measurement focus and full accrual basis of accounting. This includes for purposes of measuring the total OPEB liability, deferred outflows of resources related to other post‐employment benefits, OPEB expense, and information about assets, liabilities, and additions to/deductions from the applicable OPEB’s fiduciary net position. Benefit payments are recognized when due and payable in accordance with the benefit terms. Information regarding the City’s total OPEB liability related to the TMRS Supplemental Death Benefit is obtained from TMRS through a report prepared by TMRS consulting actuary, Gabriel Roeder Smith & Company, in compliance with Governmental Accounting Standards Board (GASB) Statement No. 75, Accounting and Financial Reporting for Postemployment Benefits Other Than Pensions. Information regarding the City’s total OPEB liability related to the Firefighter Retiree Healthcare is obtained from a report prepared by the City’s consulting actuary, Retirement Horizons, in compliance with Governmental Accounting Standards Board (GASB) Statement No. 75, Accounting and Financial Reporting for Postemployment Benefits Other Than Pensions.
Categories and Classification of Fund Equity Net position flow assumption – Sometimes the City will fund outlays for a particular purpose from both restricted (e.g., restricted bond or grant proceeds) and unrestricted resources. In order to calculate the amounts to report as restricted – net position and unrestricted – net position in the government‐wide and proprietary fund financial statements, a flow assumption must be made about the order in which the resources are considered to be applied. It is the City’s policy to consider restricted – net position to have been depleted before unrestricted – net position is applied. The City reported deficit net position in the Internal Service Fund in the amount of ($239,737). Fund balance flow assumptions – Sometimes the City will fund outlays for a particular purpose from both restricted and unrestricted resources (the total of committed, assigned, and unassigned fund balance). In order to calculate the amounts to report as restricted, committed, assigned, and unassigned fund balance in the governmental fund financial statements a flow assumption must be made about the order in which the resources are considered to be applied. It is the City’s policy to consider restricted fund balance to have been depleted before using any of the components of unrestricted fund balance. Further, when the components of unrestricted fund balance can be used for the same purpose, committed fund balance is depleted first, followed by assigned fund balance. Unassigned fund balance is applied last.
Fund balance policies – Fund balance of governmental funds is reported in various categories based on the nature of any limitations requiring the use of resources for specific purposes. The City itself can establish limitations on the use of resources through either a commitment (committed fund balance) or an assignment (assigned fund balance). The provisions of GASB Statement No. 54, Fund Balance Reporting and Governmental Fund Type Definitions, specifies the following classifications: Nonspendable fund balance – Nonspendable fund balances are amounts that cannot be spent because they are either (a) not in spendable form or (b) legally or contractually required to be maintained intact.

‐ 49 ‐
City of Weslaco, Texas Notes to Financial Statements
Note 1: SUMMARY OF SIGNIFICANT ACCOUNTING POLICIES (Continued) Categories and Classification of Fund Equity (Continued) Restricted fund balance – Restricted fund balances are restricted when constraints placed on the use of resources are either: (a) externally imposed by creditors, grantors, contributors, or laws or regulations of other governments; or (b) imposed by law through constitutional provisions or enabling legislation. Committed fund balance – The committed fund balance classification includes amounts that can be used only for the specific purposes determined by a formal action of the City’s highest level of decision‐making authority. The governing council is the highest level of decision‐making authority for the City that can, by adoption of an ordinance prior to the end of the fiscal year, commit fund balance. Once adopted, the limitation imposed by the ordinance remains in place until a similar action is taken (the adoption of another ordinance) to remove or revise the limitation. Assigned fund balance – Amounts in the assigned fund balance classification are intended to be used by the City for specific purposes but do not meet the criteria to be classified as committed. The governing commission has by resolution authorized the City Manager to assign fund balance. The commission may also assign fund balance as it does when appropriating fund balance to cover a gap between estimated revenue and appropriations in the subsequent year’s appropriated budget. Unlike commitments, assignments generally only exist temporarily. In other words, an additional action does not normally have to be taken for the removal of an assignment. Conversely, as discussed above, an additional action is essential to either remove or revise a commitment. Unassigned fund balance – Unassigned fund balance is the residual classification for the General Fund. Revenues and Expenditures/Expenses Program revenues – Amounts reported as program revenues include 1) charges to customers or applicants who purchase, use, or directly benefit from goods, services, or privileges provided by a given function or segment and 2) grants and contributions (including special assessments) that are restricted to meeting the operational or capital requirements of a particular function or segment. All taxes, including those dedicated for specific purposes, and other internally dedicated resources are reported as general revenues rather than as program revenues. Property taxes – Property taxes attach as an enforceable lien on property as of January 1. Property taxes are levied as of October 1. The county appraisal district certifies the tax roll by July 25th. This tax roll is used by the City to adopt a tax rate by September 1st or soon thereafter. The tax bills are mailed on October 1 or soon thereafter and are due and payable upon receipt. The billings become delinquent as of February 1 of the following calendar year and penalties and interest may be assessed by the City.
Proprietary funds operating and nonoperating revenues and expenses – Proprietary funds distinguish operating revenues and expenses from nonoperating items. Operating revenues and expenses generally result from providing services and producing and delivering goods in connection with a proprietary fund’s principal ongoing operations. The principal operating revenues of the Water and Wastewater Fund, Solid Waste Fund, Airport Fund and internal service funds are charges to customers for sales and services. The Water and Wastewater Fund also recognizes as operating revenue the portion of tap fees intended to recover the cost of connecting new customers to the system. Operating expenses for enterprise funds and internal service funds include the cost of sales and services, administrative expenses, and depreciation on capital assets. All revenues and expenses not meeting this definition are reported as nonoperating revenues and expenses.

‐ 50 ‐
City of Weslaco, Texas Notes to Financial Statements
Note 1: SUMMARY OF SIGNIFICANT ACCOUNTING POLICIES (Continued) Use of Estimates The preparation of financial statements in conformity with generally accepted accounting principles requires
management to make various estimates. Actual results could differ from those estimates. Subsequent Events Management has evaluated subsequent events through the date that the financial statements were available to be issued, March 26, 2021 and determined there were no events that occurred that required disclosure. No subsequent events occurring after this date have been evaluated for inclusion in these financial statements. Recently Issued and Implemented Accounting Pronouncements In fiscal year 2020, the City implemented GASB Statement No. 95, Postponement of the Effective Dates of Certain Authoritative Guidance. The primary objective of this statement was to provide temporary relief to governments and other stakeholders in light of the COVID‐19 pandemic. The Statement extended the effective dates of certain accounting and financial reporting provisions in statements that were first effective for reporting periods beginning after June 15, 2018. The Governmental Accounting Standards Board has issued statements that will become effective in future years. These statements are as follows: In January 2017, the GASB issued Statement No. 84, Fiduciary Activities. This Statement seeks to improve guidance regarding the identification of fiduciary activities for accounting and financial reporting purposes and how those activities should be reported. GASB 84 will be effective for the fiscal years beginning after December 15, 2019. In June 2017, the GASB issued Statement No. 87, Leases. The objective of this Statement is to better meet the information needs of financial statement users by improving accounting and financial reporting for leases by governments. This Statement increases the usefulness of governments' financial statements by requiring recognition of certain lease assets and liabilities for leases that previously were classified as operating leases and recognized as inflows of resources or outflows of resources based on payment provisions of the contract. It establishes a single model for lease accounting based on the foundational principle that leases are financings of the right to use an underlying asset. Under this Statement, a lessee is required to recognize a lease liability and an intangible right‐to‐use lease asset, and a lessor is required to recognize a lease receivable and a deferred inflow of resources, thereby enhancing the relevance and consistency of information about governments' leasing activities. The requirements of this Statement are effective for fiscal years beginning after June 15, 2021. In June 2018, the GASB issued Statement No. 89, Accounting for Interest Cost Incurred Before the End of a Construction Period. The objectives of this Statement are (1) to enhance the relevance and comparability of information about capital assets and the cost of borrowing for a reporting period and (2) to simplify accounting for interest cost incurred before the end of a construction period. This Statement requires that interest cost incurred before the end of a construction period be recognized as an expense in the period in which the cost is incurred for financial statements prepared using the economic resources measurement focus. The requirements of this Statement are effective for reporting periods beginning after December 15, 2020.

‐ 51 ‐
City of Weslaco, Texas Notes to Financial Statements
Note 1: SUMMARY OF SIGNIFICANT ACCOUNTING POLICIES (Continued)
Recently Issued and Implemented Accounting Pronouncements (continued) In August 2018, the GASB issued Statement No. 90, Majority Equity Interests – An Amendment of GASB Statements No. 14 and No. 61. The primary objectives of this Statement are to improve the consistency and comparability of reporting a government’s majority equity interest in a legally separate organization and to improve the relevance of financial statement information for certain component units. It defines a majority equity interest and specifies that a majority equity interest in a legally separate organization should be reported as an investment if a government’s holding of the equity interest meets the definition of an investment. A majority equity interest that meets the definition of an investment should be measured using the equity method, unless it is held by a special‐purpose government engaged only in fiduciary activities, a fiduciary fund, or an endowment (including permanent and term endowments) or permanent fund. Those governments and funds should measure the majority equity interest at fair value. The requirements of this Statement are effective for reporting periods beginning after December 15, 2019. The requirements should be applied retroactively, except for the provisions related to (1) reporting a majority equity interest in a component unit and (2) reporting a component unit if the government acquires a 100 percent equity interest. Those provisions should be applied on a prospective basis. In May 2019, the GASB issued Statement No. 91, Conduit Debt Obligations. The primary objectives of this statement are to provide a single method of reporting conduit debt obligations by issuers and eliminate diversity in practice associated with (1) commitments extended by issuers, (2) arrangements associated with conduit debt obligations, and (3) related note disclosures. This Statement achieves those objectives by clarifying the existing definition of a conduit debt obligation; establishing that a conduit debt obligation is not a liability of the issuer; establishing standards for accounting and financial reporting of additional commitments and voluntary commitments extended by issuers and arrangements associated with conduit debt obligations; and improving required note disclosures. The requirements of this Statement are effective for reporting periods beginning after December 15, 2021. The City is evaluating the requirements of the above statements and the impact on reporting. NOTE 2: PRIOR PERIOD ADJUSTMENT Prior year accounts receivable and allowance for doubtful accounts related to Emergency Medical Services (EMS) were adjusted to defer fund level revenue in accordance with the current financial resources measurement focus. The prior year has been restated to account for the prior period adjustment for these changes. The effect of the adjustment was a decrease to beginning General Fund balance in the amount of $1,493,649.

‐ 52 ‐
City of Weslaco, Texas Notes to Financial Statements
NOTE 3: DEPOSITS AND INVESTMENTS It is the City’s policy, as well as a requirement in its depository agreement, for deposits plus accrued interest thereon to be 102% secured by collateral valued at fair value, less the amount of the Federal Deposit Insurance Corporation insurance. The City’s deposits, including certificates of deposit, were fully insured or collateralized as required by the state statutes at September 30, 2020. At year‐end, the respective bank balance totaled $17,060,031. Of the total bank balance, $500,000 was covered by Federal Depository Insurance Corporation (FDIC). The remainder was covered by collateral with a value of $28,000,000. The collateral was held at third party banks (safekeeping banks) in the City’s name under a joint safekeeping agreement between various banks and the City. Investments State statutes, city bond ordinances, city resolutions, and an investment policy adopted by the City Commission authorize the City’s investments. The City is authorized to invest in obligations of the United States of America, its agencies and instrumentalities, direct obligations of the State of Texas and agencies thereof, obligations of the states (agencies thereof, counties, cities, and other political subdivisions of any state having been rated as investment quality by a nationally recognized investment rating equivalent), certificates of deposit of state and national banks domiciled in Texas, fully collateralized direct repurchase agreements with a defined termination date secured by obligations of the United States or its agencies and instrumentalities pledged with a third party, joint pools of political subdivisions in the State of Texas which invest in instruments and follow practices allowed by law, and commercial paper with a 270 day limit and an A1P1 rating by two rating agencies. Investment with investment maturities, including accrued interest, as of September 30, 2020 are as follows:
Greater
Value 1 or less than 1 year
Primary Government
TexPool 6,687,551$ 6,687,551$ ‐$
Investment Maturities (in years)
A reconcilement of cash and investments follows:
Governmental Business‐type Component
Activities Activities Total Unit
Cash and cash equivalents 14,405,676$ 460,389$ 14,866,065 6,376,134$
Restricted cash 413,775 1,666,452 2,080,227 ‐
Total cash and cash equivalents 14,819,451 2,126,841 16,946,292 6,376,134
Investments:
TexPool 6,124,870 ‐ 6,124,870 ‐
TexPool ‐ Restricted ‐ 562,681 562,681 ‐
Total investments 6,124,870 562,681 6,687,551 ‐
Total cash and investments 20,944,321$ 2,689,522$ 23,633,843$ 6,376,134$
Primary Government
See Note 6 for components of cash and investment restrictions.
‐ 53 ‐
City of Weslaco, Texas Notes to Financial Statements
NOTE 3: DEPOSITS AND INVESTMENTS (Continued) Interest Rate Risk Interest rate risk is the risk that changes in market interest rates will adversely affect the fair value of an investment.
Generally, the longer the maturity of an investment, the greater the sensitivity of its fair value to changes in market interest rates. One of the ways that the City manages its exposure to interest rate risk is by purchasing a combination of shorter term and longer term investments and by timing cash flows from maturities so that a portion of the portfolio is maturing or coming close to maturity evenly over time as necessary to provide the cash flows and liquidity needed for operations. The investment policy states that the dollar weighted average maturity of 12 months or less will be calculated using the stated final maturity date of each security. Credit Risk As of September 30, 2020, the investments in TexPool investment pools were rated AAAm by Standard and Poor’s. The City’s investment policy limits authorized investments to certain Texas government investments pools, obligations of or guaranteed by the U. S. and State of Texas and their agencies thereof, certificates of deposit of Texas banks and fully collateralized repurchase agreements. Public Funds Investment Pools TexPool is a public funds investment pool created by the Texas Treasury Safekeeping Trust Company (Trust Company) to provide a safe environment for the placement of local government funds in authorized short‐term, fully‐collateralized investments, including direct obligations of, or obligations guaranteed by, the United States or State of Texas or their agencies; federally insured certificates of deposit issued by Texas banks or savings and loans; and fully collateralized direct repurchase agreements secured by United States Government agency securities and placed through a primary government securities dealer. The Trust Company was incorporated by the State Treasurer by authority of the Texas Legislature as a special purpose trust company with direct access to the services of the Federal Reserve Bank to manage, disburse, transfer, safekeep, and invest public funds and securities more efficiently and economically. The State Comptroller of Public Accounts exercises oversight responsibility over TexPool. Oversight includes the ability to significantly influence operations, designation of management, and accountability for fiscal matters. The City reports its local government investment pools at amortized cost as permitted by Section I50: Investments of the GASB Codification. In addition, the pools do not have any limitations and restrictions on withdrawals such as notice periods or maximum transaction amounts. The pools do not impose any liquidity fees or redemption gates.

‐ 54 ‐
City of Weslaco, Texas Notes to Financial Statements
NOTE 3: DEPOSITS AND INVESTMENTS (Continued) Firemen’s Relief and Retirement Fund Investments The Firemen’s Relief and Retirement Fund Investments are recorded at fair value as of September 30, 2020. The composition of these investments is as follows:
Fair Value
Equities 9,405,149$
Mutual funds 117,985
Fixed income
Money market mutual funds 737,809
Municipal bonds 1,781,537
Corporate bonds 782,304
Total fixed income 3,301,650
Total investments 12,824,784$
The Firemen’s fund has adopted the provisions of GASB Statement 72 and fully disclosed in the notes to the financial statements the fair value hierarchy and the methods of valuing the related investments as required under generally accepted accounting principles. A summary of the hierarchy is as follows:
Level 1 inputs are quoted prices in active markets for identical assets 10,922,183$
Level 2 inputs are signficant other observable inputs 1,902,601
Total investments 12,824,784$
Debt and equity securities, and money market mutual funds classified in Level 1 of the fair value hierarchy are valued using prices quoted in active markets for those securities. Debt securities classified in Level 2 of the fair value hierarchy are valued using a matrix pricing techniques. Matrix pricing is used to value securities based on the securities’ relationship to benchmark quoted prices. Because of the complexity of the portfolio, the Firemen’s Board of Trustees relies on its consultant to provide the necessary guidance to accomplish the Plan’s objective. The Board also understands that return objectives can be achieved while assuming market volatility. The Board is willing to forgo potential return in strong markets in return for protection against a severe decline during weak periods. Custodial Credit Risk
For an investment, custodial credit risk is the risk that, in the event of the failure of the counterparty, the Plan will not be able to recover the value of its investment or collateral securities that are in the possession of an outside party. Investment securities are exposed to custodial credit risk if the securities are uninsured, are not registered in the name of the Plan, and are held by either the counterparty or the counterparty’s trust department or agent but not in the Plan’s name. All investment securities are held in the Plan’s name. Concentration of Credit Risk The allocation of assets among various asset classes is set by the Board with the objective of optimizing the investment return of the Plan within a framework of acceptable risk and diversification. For major asset classes (e.g., domestic equities, international equities, fixed income, alternative investments, private equity and real estate, and specialty), the investment policy establishes a minimum and maximum percentage allocation for each classification of investments.

‐ 55 ‐
City of Weslaco, Texas Notes to Financial Statements
NOTE 3: DEPOSITS AND INVESTMENTS (Continued)
Firemen’s Relief and Retirement Fund Investments ‐ Continued Interest Rate Risk The Plan invests in fixed income securities including, but not limited to, investments representing instruments with an obligated fixed rate of interest. Instruments may have an investment grade or noninvestment grade rating. Purchases and sales, investment selection and implementation of investment strategies are delegated to the discretion of the investment manager, subject to compliance with its management agreement and the Plan’s Investment Policy. Interest rate risk is the risk that changes in interest rates will adversely affect the fair value of the investment. Interest rate risk is the greatest risk faced by an investor in the fixed income market. The price of a fixed income security typically moves in the opposite direction of the change in interest rates. The Plan does not have a formal investment policy that limits investment maturities as a means of managing its exposure to potential fair value losses arising from future changes in interest rates, but rather mandates such limits within the Investment Management Services Contract. Credit Risk Credit risk is the risk that an issuer or other counterparty to an investment will not fulfill its obligations. The Plan does not have a formal policy limiting investment credit risk, but rather mandates such limits within the Investment Management Services Contract. Foreign Currency Risk Foreign currency risk is the risk that changes in exchange rates will adversely affect the fair value of an investment or a deposit. Realized and unrealized gains and losses on investments which result from changes in foreign currency exchange rates have been included in the net appreciation (depreciation) in fair value of investments. NOTE 4: RECEIVABLES
Receivables at September 30, 2020, consist of the following:
Other Total
General Governmental Water and Solid Airport Primary Component
Fund Funds Total Wastewater Waste Fund Total Government Unit
Ad valorem taxes 1,205,217$ 438,531$ 1,643,748$ ‐$ ‐$ ‐$ ‐$ 1,643,748$ ‐$
Sales taxes 1,133,096 ‐ 1,133,096 ‐ ‐ ‐ ‐ 1,133,096 283,274
Customer charges 136,208 ‐ 136,208 3,850,743 1,507,809 135,331 5,493,883 5,630,091 ‐
Hotel/Motel taxes ‐ 193,106 193,106 ‐ ‐ ‐ ‐ 193,106 ‐
Ambulance fees 8,111,437 ‐ 8,111,437 ‐ ‐ ‐ ‐ 8,111,437 ‐
Grants receivable 3,451,731 ‐ 3,451,731 ‐ ‐ ‐ ‐ 3,451,731 ‐
Other 484,443 33,748 518,191 ‐ ‐ ‐ ‐ 518,191 12,152
Gross receivables 14,522,132 665,385 15,187,517 3,850,743 1,507,809 135,331 5,493,883 20,681,400 295,426
Less allowance for uncollectibles (7,135,471) (151,499) (7,286,970) (1,565,701) (687,259) ‐ (2,252,960) (9,539,930) ‐
Net total receivables 7,386,661$ 513,886$ 7,900,547$ 2,285,042$ 820,550$ 135,331$ 3,240,923$ 11,141,470$ 295,426$
Governmental Business‐type
Primary Government

‐ 56 ‐
City of Weslaco, Texas Notes to Financial Statements
NOTE 4: RECEIVABLES (Continued) Property tax revenues are recognized when they become available in the fund statements. Available includes those property tax receivables expected to be collected within sixty days after year end. Property taxes attach as an enforceable lien on property as of January 1. Property taxes are levied as of October 1. The county appraisal district certifies the tax roll by July 25th. This tax roll is used by the City to adopt a tax rate by September 1st or soon thereafter. The tax bills are mailed on October 1 or soon thereafter and are due and payable upon receipt. The billings become delinquent as of February 1 of the following calendar year and penalties and interest may be assessed by the City. As an inducement to expand their business operations to the City’s Industrial Park, the Economic Development Corporation of Weslaco, accepted notes from various businesses. These notes are for cash loans, and sale of industrial park lots. The loans carry various credit incentives up to the amounts of the loans and sometimes beyond the initial loans. The credits vary by individual entities. The credits involve construction of buildings, leasing of existing properties at the industrial park, employing local residents and the purchase of goods and services from merchants in the local area. All notes receivable carry incentives to the extent of the note receivable balance. The following is a summary of notes receivable payable to the EDC at September 30, 2020:
Loan to CIL Properties 85,469$
Loan to CIL Hangars, LLC 155,853
Loan to Valley Striping 94,593
Loan to Trinity Development 40,224
Promissory note from LRGVDC (Building Sale) 1,195,364
Promissory note from SDI Weslaco Holdings, Inc. 200,968
Promissory note from City of Weslaco 1,450,810
Total notes receivable 3,223,281$
Total note receivable from SDI Weslaco Holdings, LLC (SDI) was $2,213,255 at 8% interest rate. This note is secured by a Chapter 380 Economic Development Agreement between the City of Weslaco, Texas and SDI. SDI has assigned the annual payments due from the City to the Economic Development Corporation, of Weslaco, Texas until the note is paid in full. The note is payable in annual payments, until March 1, 2030. The 380 Agreement was to facilitate the construction of infrastructure improvements for a commercial development. The EDC spurred the development by advancing $2,213,255 of the $3,300,000 project. In the current year, the City of Weslaco paid $224,451 under the 380 Agreement. Notes with Economic Incentives The economic incentive portion of the notes receivable balances have been recognized as expenditures in current year operations, as well as the long‐term note receivable advance. As the entities earn their incentives, the note balances will be reduced accordingly, with an equal offset to unavailable revenue. That is to control compliance with the agreements. The long‐term note receivable principal payments are recognized as revenues, with equal off‐set to unavailable revenue. Note balances had equal unavailable revenue at September 30, 2020.

‐ 57 ‐
City of Weslaco, Texas Notes to Financial Statements
NOTE 5: CAPITAL ASSETS Capital asset activity for the year ended September 30, 2020 is as follows:
Beginning
Balance Additions Transfers Retirements
Ending
Balance
Governmental Activities
Capital assets not being depreciated
Land 4,900,165$ 1,521,271$ ‐$ (194,261)$ 6,227,175$
380 Agreements Infrastructure 7,629,307 ‐ ‐ ‐ 7,629,307
Construction‐in‐progress 2,401,877 2,746,907 (1,935,621) ‐ 3,213,163
Total capital assets, not being depreciated 14,931,349 4,268,178 (1,935,621) (194,261) 17,069,645
Capital assets being depreciated
Buildings 18,494,359 ‐ 1,917,267 ‐ 20,411,626
Equipment 13,558,222 1,654,213 ‐ (43,840) 15,168,595
Improvements 45,448,801 200,200 18,354 ‐ 45,667,355
Capital Leases 6,911,937 ‐ ‐ ‐ 6,911,937
84,413,319 1,854,413 1,935,621 (43,840) 88,159,513
Less accumulated depreciation for:
Buildings 8,303,110 462,359 ‐ ‐ 8,765,469
Equipment 9,543,853 1,131,300 ‐ (26,182) 10,648,971
Improvements 26,849,526 1,496,515 ‐ ‐ 28,346,041
Capital Leases 3,004,488 559,199 ‐ ‐ 3,563,687
Total accumulated depreciation 47,700,977 3,649,373 ‐ (26,182) 51,324,168
Total capital assets being depreciated, net 36,712,342 (1,794,960) 1,935,621 (17,658) 36,835,345
Governmental activities, capital assets, net 51,643,691$ 2,473,218$ ‐$ (211,919)$ 53,904,990$
Depreciation expense was charged as a direct expense to governmental functions of the primary government as follows:
Governmental activities
General government 704,321$
Public safety 676,129
Emergency medical services 184,284
Public works 1,548,538
Culture and recreation 536,101
3,649,373$

‐ 58 ‐
City of Weslaco, Texas Notes to Financial Statements
NOTE 5: CAPITAL ASSETS (Continued)
Beginning Transfers/ Ending
Balance Additions Reclassification Retirements Balance
Business‐type Activities:
Capital assets not being depreciated
Land 2,551,870$ 1,401,014$ ‐$ ‐$ 3,952,884$
Construction in progress 47,850,254 556,310 (47,856,030) ‐ 550,534
Total capital assets not being depreciated 50,402,124 1,957,324 (47,856,030) ‐ 4,503,418
Capital assets being depreciated
Buildings 1,679,646 ‐ ‐ ‐ 1,679,646
Equipment 7,926,322 273,399 ‐ ‐ 8,199,721
Improvements 80,930,572 754,309 47,856,030 ‐ 129,540,911
Capital leases 6,934,391 540,552 ‐ ‐ 7,474,943
Total capital assets being depreciated 97,470,931 1,568,260 47,856,030 ‐ 146,895,221
Less accumulated depreciation for:
Building 1,370,405 20,359 ‐ ‐ 1,390,764
Equipment 6,910,849 651,335 ‐ ‐ 7,562,184
Improvements 38,489,851 3,731,136 ‐ ‐ 42,220,987
Total accumulated depreciation 46,771,105 4,402,830 ‐ ‐ 51,173,935
Total capital assets being depreciated, net 50,699,826 (2,834,570) 47,856,030 ‐ 95,721,286
Business‐type activities capital assets, net 101,101,950$ (877,246)$ ‐$ ‐$ 100,224,704$
Depreciation expense was charged as direct expense to business‐type functions of the primary government as follows:
Business‐type activities:
Water and wastewater 3,939,191$
Solid waste 32,717
Airport 430,922
Total depreciation expense‐ Business‐type activities 4,402,830$
Beginning Transfers/ Ending
Balance Additions Reclassification Retirements Balance
Component Unit:
Capital assets not being depreciated
Construction in progress ‐$ 16,500$ ‐$ ‐$ 16,500$
Total capital assets not being depreciated ‐ 16,500 ‐ ‐ 16,500
Capital assets being depreciated
Buildings 5,469,816 ‐ ‐ ‐ 5,469,816
Machinery and equipment 137,528 42,140 ‐ ‐ 179,668
Total capital assets being depreciated 5,607,344 42,140 ‐ ‐ 5,649,484
Less accumulated depreciation 607,225 108,038 ‐ ‐ 715,263
Total capital assets being depreciated, net 5,000,119 (65,898) ‐ ‐ 4,934,221
Component Unit capital assets, net 5,000,119$ (49,398)$ ‐$ ‐$ 4,950,721$
Depreciation of $65,898 was charged to general government functions.

‐ 59 ‐
City of Weslaco, Texas Notes to Financial Statements
NOTE 6: LONG‐TERM DEBT
Business‐Type Activities Bonded Debt Business‐type activities bonded debt as of September 30, 2019 is as follows: $24,335,000 Tax and Revenue Certificate of Obligation, Series 2012, dated January 15, 2012, due in annual installments varying from $1,345,000 to $2,305,000 through February 15, 2032, bearing interest rates of 4.00% ‐ 5.00%. $1,200,000 $9,075,000 Tax and Revenue Certificate of Obligation, Series 2014, dated March 1, 2014, due in annual installments varying from $75,000 to $1,355,000 through February 15, 2034, bearing interest rates of 4.50%. 8,920,000 $15,750,000 Limited Tax Refunding Bonds, Series 2016, dated June 7, 2016, due in annual installments varying from $290,000 to $2,285,000 through August 15, 2032, bearing interest rates of 4.00%‐5.00%. 13,850,000 $19,545,000 Limited Tax Refunding Bonds, Series 2017, dated August 16, 2017, due in annual installments varying from $500,000 to $2,285,000 through February 15, 2027, bearing interest rates of 4.00%‐5.00%. 19,045,000 Total Business‐Type Activities Bonded Debt $43,015,000 Business‐Type Activities Capital Leases Business‐type activities capital lease debt as of September 30, 2020 is as follows: $434,278 Kansas State Bank lease agreement dated January 18, 2019. The terms of the capital lease include annual payments of $70,552 beginning March 2019. The lease was used to fund purchase of equipment. $ 336,553 $7,446,877 Frost Municipal lease agreement dated December 1, 2017. The terms of the capital lease include annual payments of $606,289 beginning January 2019. The lease was used to fund building lighting, HVAC upgrades, and replacing traffic light signals. A portion of this lease and annual payments are recorded in the City’s Governmental Activities. 5,785,243 $570,485 Government Capital Corporation lease agreement dated June 16, 2020. The terms of the capital lease include 5 annual payments of $122,848 beginning July 2, 2021. The lease was used to fund the purchase of a vehicle, tractor, and grapple truck. 570,485 Total Business‐Type Activities Capital Lease Debt $ 6,692,281 Business‐type Activities Note Payable Business‐type activities Note Payable from direct borrowing as of September 30, 2020 is as follows: A note dated November 20, 2019 and payable to the Economic Development Corporation of Weslaco for $1,450,810. Interest on the note is payable on June 20 and December 20 of each year commencing on June 20, 2020 and annual principal payments of $53,765 beginning December 20, 2020, continuing annually thereafter until December 20, 2024. The interest rate is a fixed 3.00%. The note is secured by a vendor’s lien and superior title. $ 1,450,810

‐ 60 ‐
City of Weslaco, Texas Notes to Financial Statements
NOTE 6: LONG‐TERM DEBT (Continued) Governmental Activities Bonded Debt Governmental activities bonded debt as of September 30, 2020 is as follows:
$3,940,000 Certificates of Obligation, Series 2018, dated October 1, 2018 due in annual installments of $279,756 to $288,471 through February 19, 2038, bearing interest at 3.0% to 5.0%. $3,660,000 $11,915,000 Limited Tax Refunding Bonds, Series 2012, Dated August 15, 2013, due in annual installments varying from $980,000 to $1,470,000 through February 15, 2023, bearing interest rates of 2.00% ‐ 3.00%. 4,300,000 $6,750,000 Tax and Revenue Certificate of Obligation, Series 2013, dated September 19, 2013, due in annual installments varying from $90,000 to $570,000 through August 15, 2033, bearing interest rates of 2.00% ‐ 5.00%. 5,795,000 $3,735,000 Limited Tax Refunding Bonds, Series 2016, dated June 7, 2016, due in annual installments varying from $265,000 to $530,000 through February 15, 2027, bearing interest rates of 4.00%‐5.00%. 2,915,000 $8,850,000 General Obligation Bonds, Series 2019, dated September 15, 2019, due in annual installments varying from $190,000 to $670,000 through February 15, 2039, bearing interest rates of 1.00%‐3.00%. 8,630,000 Total Governmental Activities Bonded Debt $25,300,000
Governmental Activities Capital Leases Governmental activities capital lease debt as of September 30, 2020 is as follows: $525,000 Frost Municipal lease agreement dated January 28, 2016. The terms of the capital lease include annual payments of $60,288 beginning October 2016. The lease was used to purchase a fire truck. 327,731 $779,159 Frost Municipal lease agreement dated September 21, 2016. The terms of the capital lease include annual payments of $162,593 beginning November 2016. The lease was used to purchase police radios, base stations, and dispatch consoles. 159,207 $670,000 Frost Municipal lease agreement dated December 12, 2016. The terms of the capital lease include annual payments of $76,883 beginning September 2017. The lease was used to purchase a fire truck. 419,919 $218,544 Frost Municipal lease agreement dated January 17, 2017. The terms of the capital lease include annual payments of $47,041 beginning February 2018. The lease was used to purchase an ambulance and other vehicle. 90,579 $60,564 Frost Municipal lease agreement dated July 12, 2017. The terms of the capital lease include annual payments of $13,153 beginning February 2016. The lease was used to purchase a brush truck. 25,216

‐ 61 ‐
City of Weslaco, Texas Notes to Financial Statements
NOTE 6: LONG‐TERM DEBT (Continued)
$7,446,877 Frost Municipal lease agreement dated December 1, 2017. The terms of the capital lease include annual payments of $606,289 beginning January 2019. The lease was used to fund building lighting, HVAC upgrades, and replacing traffic light signals. A portion of this lease and annual payments are recorded in the City’s Water and Wastewater fund. 840,619 $225,000 City National Capital Finance lease agreement dated December 8, 2017. The terms of the capital lease include annual payments of $25,602 beginning December 2018. The lease was used to purchase public safety equipment. 184,198 $87,728 City National Capital Finance lease agreement dated February 28, 2018. The terms of the capital lease include annual payments of $19,074 beginning February 2019. The lease was used to purchase a vehicle. 54,109 $450,000 City National Capital Finance lease agreement dated April 7, 2018. The terms of the capital lease include annual payments of $98,035 beginning April 2019. The lease was used to purchase police vehicles. 277,730 $150,000 City National Capital Finance lease agreement dated June 8, 2018. The terms of the capital lease include annual payments of $31,847 beginning June 2018. The lease was used to purchase an ambulance. 60,538 $74,562 City National Capital Finance lease agreement dated January 18, 2019. The terms of the capital lease include annual payments of $16,374 beginning January 2020. The lease was used to purchase vehicles. 54,771 Total Governmental Activities Capital Lease Debt $2,494,617 Governmental Activities Note Payable Governmental activities Note Payable debt as of September 30, 2020 is as follows:
A note dated December 9, 2016 and payable to Carlos J. Garza, Christiaan Van Der Graaff and Ysabella Van Der Graaff for $456,707. The terms of the note include principal and interest payments of $5,421 beginning January 9, 2017, continuing monthly thereafter until December 9, 2021, when the entire balance, including principal and interest will be due and payable. The interest rate is a fixed 7.00%. The note is secured by a vendor’s lien and superior title. $ 316,053 A note dated October 18, 2019 and payable to Valley Growers Gin and Supply Company for $440,000. Terms of payment include 36 monthly installments of interest only of $2,200 beginning on November 18, 2019, continuing thereafter until October 18, 2022 when the entire principal balance shall be due and payable. The note is secured by a vendor’s lien and superior title. 440,000 Total Governmental Activities Note Payable from Direct Borrowing $ 756,053

‐ 62 ‐
City of Weslaco, Texas Notes to Financial Statements
NOTE 6: LONG‐TERM DEBT (Continued) Component Unit Bonded Debt Component Unit bonded debt as of September 30, 2020 is as follows: $2,870,000 Economic Development Sales Tax Revenue Refunding Bond Series 2012, due in annual installments not exceeding $305,000 beginning February 15, 2013 through February 15, 2023, with interest of 3.40%. $880,000
Total Revenue Bonds $880,000 Transactions for the year ended September 30, 2020 are summarized as follows:
Due
Balance Balance Within
October 1 Additions Deletions September 30 One Year
Governmental Activities:
Notes Payable 357,091$ 440,000$ 41,038$ 756,053$ 40,129$
Total notes from direct
borrowings 357,091 440,000 41,038 756,053 40,129
General Obligation Bonds 8,850,000 ‐ 220,000 8,630,000 190,000
Certificates of Obligation 18,800,000 ‐ 2,130,000 16,670,000 2,190,000
Capital Leases 3,199,442 ‐ 704,825 2,494,617 560,822
Bond Premium 2,071,103 ‐ 238,224 1,832,879 ‐
380 Agreement Infrastructure 4,211,673 ‐ 623,346 3,588,327 ‐
Compensated Absences 3,392,948 244,372 ‐ 3,637,320 363,732
Municipal net pension liability 8,791,058 ‐ 2,449,115 6,341,943 ‐
Firemen's net pension liability 4,806,025 862,075 ‐ 5,668,100 ‐
OPEB liability‐ SDB 639,791 161,069 ‐ 800,860 ‐
OPEB liability‐ Retiree health care 2,454,914 ‐ 433,753 2,021,161 ‐
Total Governmental Activities 57,574,045 1,707,516 6,840,301 52,441,260 3,344,683
Business‐Type Activities:
Notes Payable ‐$ 1,450,810$ ‐$ 1,450,810$ 53,765$
Total notes from direct
borrowings ‐ 1,450,810 ‐ 1,450,810 53,765
Certificate of Obligation and
Refunding Bonds 45,880,000 ‐ 2,865,000 43,015,000 2,975,000
Bond Premium 5,233,304 ‐ 808,651 4,424,653 ‐
Capital Leases 6,532,513 570,485 410,717 6,692,281 531,945
Compensated Absences 123,496 68,504 46,738 145,262 14,526
Customer deposits 1,185,785 92,259 ‐ 1,278,044 ‐
Landfil Closure 387,764 35,581 50,969 372,376 ‐
Municipal net pension liability 1,052,286 ‐ 212,966 839,320 ‐
OPEB liability‐ SDB 57,287 14,006 ‐ 71,293 ‐
Total Business‐Type Activities 60,452,435 2,231,645 4,395,041 58,289,039 3,575,236
Total Primary Government 118,026,480$ 3,939,161$ 11,235,342$ 110,730,299$ 6,919,919$
Component Unit:
Revenue Bonds 1,155,000$ ‐$ 275,000$ 880,000$ 280,000$ Total Component Unit 1,155,000$ ‐$ 275,000$ 880,000$ 280,000$

‐ 63 ‐
City of Weslaco, Texas Notes to Financial Statements
NOTE 6: LONG‐TERM DEBT (Continued) General Obligation Bonds and Certificates of Obligation General Obligation Bonds are direct obligations issued on a pledge of the general taxing power for the payment of the debt obligations of the City. General Obligation Bonds and Certificates of Obligation require the City to compute, at the time that taxes are levied, the rate of tax required to provide (in each year that bonds are outstanding) the funds to pay for interest and principal at maturity. The City is in compliance with this requirement. No General Obligation bonds were issued for the fiscal year ended September 30, 2020. Revenue Bonds
Water and Wastewater Revenue Bonds constitute special obligations of the City solely secured by a lien on and pledge of the net revenues of the Water and Sewer system. The Revenue Bonds are collateralized by the revenue of the water and wastewater system and the various special funds established by the bond ordinances. The ordinances provide that the revenue of the system is to be used first to pay operating and maintenance expenses of the system and second to establish and maintain the Revenue Bond funds remaining revenue may then be used for any lawful purpose. The ordinances also contain provisions which, among other items, restrict the issuance of additional Revenue Bonds unless the special fund noted above contain the required amounts and certain financial ratios are met. The City is in compliance with all significant financial requirements as of September 30, 2020. Sales Tax Revenue Bonds are direct obligations issued on a pledge of the City's sales tax revenues allocated to the Economic Development Corporation, in accordance with state statutes. No Revenue Bonds were issued for the fiscal year ended September 30, 2020. Tax Notes On March 1, 2014, the City issued the Tax and Revenue Certificate of Obligation Note, Series 2014 for $9,075,000. The proceeds of the certificate will be used for financing, the design construction, equipping, renovation, and/or rehabilitation of the City’s Waterworks and Wastewater Systems. Defeased Bonds Outstanding The City issued refunding bonds to defease certain outstanding bonds for the purpose of consolidation and to achieve debt service savings. The City has placed the proceeds from the refunding issues in irrevocable escrow accounts with a trust agent to ensure payment of debt service on the refunded bonds. Accordingly, the trust account assets and liabilities for the defeased bonds are not included in the City’s financial statements. The balance of defeased debt outstanding as of September 30, 2020 amounted to $39,325,000. Bonds Authorized and Unissued At September 30, 2020, the City had no General Obligations Bonds and Revenue Bonds which were authorized and unissued.
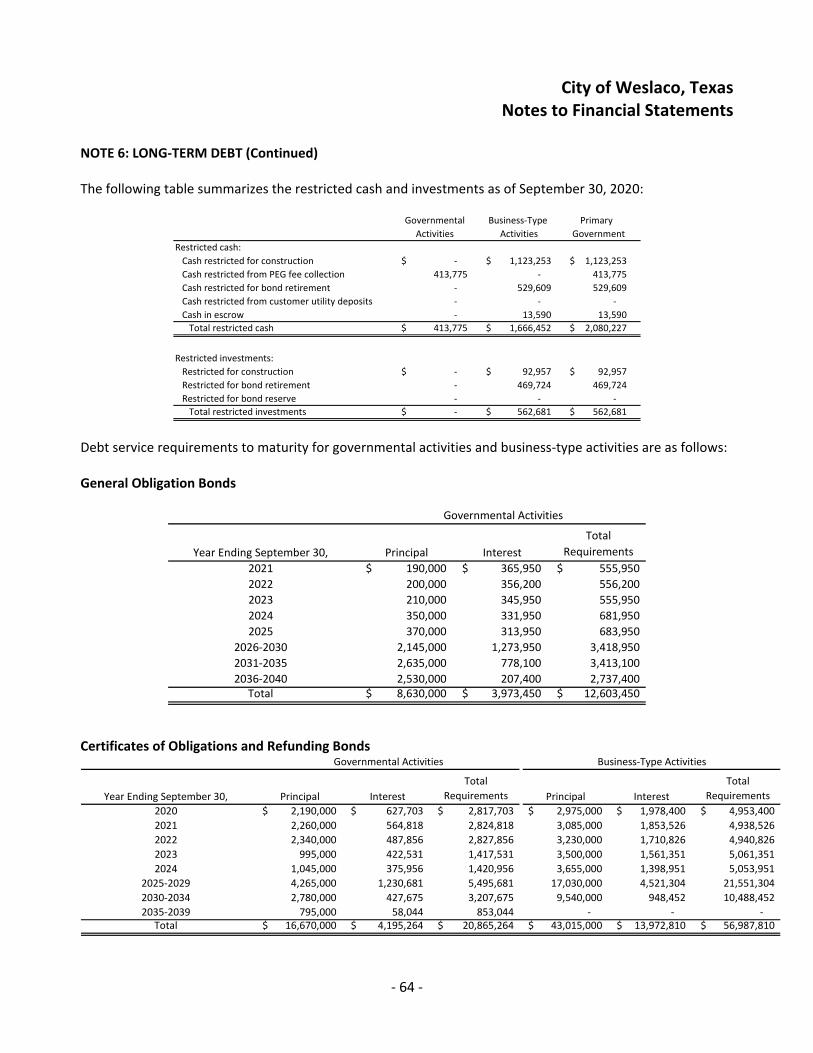
‐ 64 ‐
City of Weslaco, Texas Notes to Financial Statements
NOTE 6: LONG‐TERM DEBT (Continued) The following table summarizes the restricted cash and investments as of September 30, 2020:
Governmental Business‐Type Primary
Activities Activities Government
Restricted cash:
Cash restricted for construction ‐$ 1,123,253$ 1,123,253$
Cash restricted from PEG fee collection 413,775 ‐ 413,775
Cash restricted for bond retirement ‐ 529,609 529,609
Cash restricted from customer utility deposits ‐ ‐ ‐
Cash in escrow ‐ 13,590 13,590
Total restricted cash 413,775$ 1,666,452$ 2,080,227$
Restricted investments:
Restricted for construction ‐$ 92,957$ 92,957$
Restricted for bond retirement ‐ 469,724 469,724
Restricted for bond reserve ‐ ‐ ‐
Total restricted investments ‐$ 562,681$ 562,681$
Debt service requirements to maturity for governmental activities and business‐type activities are as follows: General Obligation Bonds
Year Ending September 30, Principal Interest
Total
Requirements
2021 190,000$ 365,950$ 555,950$
2022 200,000 356,200 556,200
2023 210,000 345,950 555,950
2024 350,000 331,950 681,950
2025 370,000 313,950 683,950
2026‐2030 2,145,000 1,273,950 3,418,950
2031‐2035 2,635,000 778,100 3,413,100
2036‐2040 2,530,000 207,400 2,737,400 Total 8,630,000$ 3,973,450$ 12,603,450$
Governmental Activities
Certificates of Obligations and Refunding Bonds
Year Ending September 30, Principal Interest
Total
Requirements Principal Interest
Total
Requirements
2020 2,190,000$ 627,703$ 2,817,703$ 2,975,000$ 1,978,400$ 4,953,400$
2021 2,260,000 564,818 2,824,818 3,085,000 1,853,526 4,938,526
2022 2,340,000 487,856 2,827,856 3,230,000 1,710,826 4,940,826
2023 995,000 422,531 1,417,531 3,500,000 1,561,351 5,061,351
2024 1,045,000 375,956 1,420,956 3,655,000 1,398,951 5,053,951
2025‐2029 4,265,000 1,230,681 5,495,681 17,030,000 4,521,304 21,551,304
2030‐2034 2,780,000 427,675 3,207,675 9,540,000 948,452 10,488,452
2035‐2039 795,000 58,044 853,044 ‐ ‐ ‐ Total 16,670,000$ 4,195,264$ 20,865,264$ 43,015,000$ 13,972,810$ 56,987,810$
Governmental Activities Business‐Type Activities

‐ 65 ‐
City of Weslaco, Texas Notes to Financial Statements
NOTE 6: LONG‐TERM DEBT (Continued)
Notes Payable
Notes Payable
Year Ending September 30, Principal Interest
Total
Requirements Principal Interest
Total
Requirements
2021 43,902$ 47,550$ 91,452$ 53,765$ 42,718$ 96,483$
2022 46,973 44,479 91,452 53,765 41,105 94,870
2023 490,266 16,986 507,252 53,765 39,492 93,257
2024 53,797 11,255 65,052 53,765 37,879 91,644
2025 57,583 7,469 65,052 1,235,750 18,536 1,254,286
2026‐2030 63,532 3,500 67,032 ‐ ‐ ‐ Total 756,053$ 131,239$ 887,292$ 1,450,810$ 179,730$ 1,630,540$
Governmental Activities Business‐Type Activities
Debt service requirements to maturity for the component unit are as follows:
Year Ending September 30, Principal Interest Total
2021 280,000$ 25,160$ 305,160$
2022 295,000 15,385 310,385
2023 305,000 5,185 310,185 Total 880,000$ 45,730$ 925,730$
Revenue Bonds
The following is a schedule of the future minimum lease payments under capital leases as of September 30, 2020: Capital Leases
Year Ending September 30,
City National
Capital Finance
Lease
Frost Muncipal
Lease
Frost Municipal
Lease
Frost Municipal
Lease
Frost Municipal
Lease
2021 16,374$ 60,288$ 162,593$ 13,153$ 47,041$
2022 16,374 60,288 ‐ 13,153 47,041
2023 16,374 60,288 ‐ ‐ ‐
2024 16,374 60,288 ‐ ‐ ‐
2025 ‐ 60,288 ‐ ‐ ‐
2026‐2030 ‐ 60,288 ‐ ‐ ‐
2031‐2035 ‐ ‐ ‐ ‐ ‐
Total minimum lease payments 65,496 361,728 162,593 26,306 94,082
Less the amount representing
Interest (10,725) (33,997) (3,386) (1,090) (3,503)
Present value of net minimum lease payments 54,771$ 327,731$ 159,207$ 25,216$ 90,579$
Governmental Activities

‐ 66 ‐
City of Weslaco, Texas Notes to Financial Statements
NOTE 6: LONG‐TERM DEBT (Continued)
Year Ending September 30,
Frost Municipal
Lease
Frost Municipal
Lease
City National
Capital Finance
Lease
City National
Capital Finance
Lease
City National
Capital Finance
Lease
2021 76,883$ 76,935$ 25,602$ 19,074$ 98,035$
2022 76,883 76,935 25,602 19,074 98,035
2023 76,883 76,935 25,602 19,074 98,035
2024 76,883 76,935 25,602 ‐ ‐
2025 76,883 76,935 25,602 ‐ ‐
2026‐2030 76,883 384,675 76,806 ‐ ‐
2031‐2035 ‐ 230,806 ‐ ‐ ‐
Total minimum lease payments 461,298 1,000,156 204,816 57,222 294,105
Less the amount representing
Interest (41,379) (159,537) (20,618) (3,113) (16,375)
Present value of net minimum lease payments 419,919$ 840,619$ 184,198$ 54,109$ 277,730$
Governmental Activities
Year Ending September 30,
City National
Capital Finance
Lease
Total
Requirements
2021 31,847$ 627,825$
2022 31,847 465,232
2023 ‐ 373,191
2024 ‐ 256,082
2025 ‐ 239,708
2026‐2030 ‐ 598,652
2031‐2035 ‐ 230,806
Total minimum lease payments 63,694 2,791,496
Less the amount representing
Interest (3,156) (296,879)
Present value of net minimum lease payments 60,538$ 2,494,617$
Governmental Activities
Year Ending September 30,
City National
Capital Finance
Lease
Kansas State
Bank Lease
Government
Capital
Corporation
Total
Requirements
2021 529,354$ 70,552$ 122,848$ 722,754$
2022 529,354 70,552 122,848 722,754
2023 529,354 70,552 122,848 722,754
2024 529,354 209,639 122,848 861,841
2025 529,354 122,848 652,202
2026‐2030 2,646,770 ‐ ‐ 2,646,770
2031‐2035 1,588,062 ‐ ‐ 1,588,062
Total minimum lease payments 6,881,602 421,295 614,240 7,917,137
Less the amount representing
Interest (1,096,359) (84,742) (43,755) (1,224,856)
Present value of net minimum lease payments 5,785,243$ 336,553$ 570,485$ 6,692,281$
Business‐Type Activities

‐ 67 ‐
City of Weslaco, Texas Notes to Financial Statements
NOTE 7: PROPERTY TAX The State of Texas Constitution limits the City’s ad valorem tax rate for all purposes to $2.50 per one hundred dollars of assessed valuation. Ad valorem tax revenue during the year ended September 30, 2020 was levied using a rate of $.6967 per one hundred dollars of assessed valuation based on 100 percent of estimated market value.
Legislation has been passed by the Texas Legislature which affects the methods of property appraisal in the City. This legislation, with certain exceptions, exempts intangible personal property, household goods, and family‐owned automobiles (unless specifically authorized by resolution of the governing body) from taxation. In addition, this legislation creates a “Property Tax Code” and provides, among other things, for the establishment of county appraisal districts and for a state property board. The appraisal of property within the city is the responsibility of the Hidalgo County Tax Appraisal District. The Appraisal District is required under the Property Tax Code to appraise all property within the county on the basis of 100 percent of its market value. The value of real property within the Appraisal District must be reviewed every five years; however, the City may, at its own expense, require annual reviews of appraised values. The City may challenge appraised values established by the Appraisal District through various appeals and, if necessary, legal action. Under this legislation, the City continues to set tax rates on city property. However, if the effective tax rate, excluding tax rates for bonds and other contractual obligations, adjusted for new improvements, exceeds the rate of the previous year by more than 8 percent, qualified voters of the city may petition for an election to determine whether to limit the tax rate to no more than 8 percent above the effective tax rate. The City bills and collects its own property taxes through a contractual agreement with the County of Hidalgo. Collections of the city taxes and remittance of them are accounted for in the County of Hidalgo Tax Collection Agency Fund. City property tax revenues are recognized when levied to the extent that they result in current receivables. January 1 is the assessment date. March 31 is the end of the rendition period for the Appraisal District. By September 30, the City adopts the tax rate. Taxes are due on October 1, the levy date, and are delinquent after the following January 31. Tax liens are automatic on January 1 each year. The tax lien is part of a lawsuit for property that can be filed any time after taxes become delinquent (February 1). The City usually waits until after July 1 to file suits on real estate property. As of July 1, 15% collection costs may be added to all delinquent accounts. Current tax collections for the year ended September 30, 2020, were 96.3% of the tax levy. Property taxes at the fund level are recorded as receivables and deferred inflows at the time the taxes are assessed. Revenues are recognized as the related ad valorem taxes are collected. Additional amounts estimated to be collectible in time to be a resource for payment of obligations incurred during the fiscal year and therefore susceptible to accrual in accordance with Generally Accepted Accounting Principles have been recognized as revenue.

‐ 68 ‐
City of Weslaco, Texas Notes to Financial Statements
NOTE 8: INTERFUND RECEIVABLES AND PAYABLES Inter‐fund balances at September 30, 2020 consisted of the following individual fund receivables and payables:
Receivable Fund
General Fund
Water and
Wastewater
Fund
Solid Waste
Fund
Airport
Fund
Other
Governmental
Funds
Internal Service
Fund Total
General Fund $ 3,790 $ 259,258 $ 890,709 607,455$ 10,432$ 250,269$ 2,021,913$
Solid Waste Fund ‐ 2,000,000 ‐ ‐ ‐ ‐ 2,000,000
Other Governmental Funds 82,739 ‐ ‐ ‐ ‐ ‐ 82,739
86,529$ 2,259,258$ 890,709$ 607,455$ 10,432$ 250,269$ 4,104,652$
Payable Fund
Interfund balances are due to timing on cash transfers and to cover deficits at year end. These are expected to be funded once reimbursement is received in the respective funds. There is a long‐term advance from the Solid Waste Fund to the Water and Wastewater fund adopted by resolution in September of 2015 to be repaid within a five year period.
NOTE 9: TRANSFERS Transfers at September 30, 2020 consisted of the following:
Transfer Out Funds General Fund
Other
Governmental
Funds
Water and
Wastewater
Fund Airport Fund Total
General Fund 993,255$ 812,573$ 259,258$ 250,000$ 2,315,086$
Water and Wastewater Fund 1,565,562 ‐ 5,170,625 ‐ 6,736,187
Solid Waste Fund 125,000 1,000,000 ‐ ‐ 1,125,000
2,683,817$ 1,812,573$ 5,429,883$ 250,000$ 10,176,273$
Transfer in Funds
Transfers to the capital improvement fund and firemen’s equipment replacement fund were made in accordance with ordinances to fund City projects and replace old equipment. In addition, there was a transfer out of the general fund to supplement the airport fund for expenditures in excess of revenues. There was a transfer from the general fund to water and wastewater fund for the payment certain capital improvements. There were transfers from water and wastewater and solid waste funds to the general fund in accordance with City policy to fund future projects.

‐ 69 ‐
City of Weslaco, Texas Notes to Financial Statements
NOTE 10: DEFINED BENEFIT ‐ PENSION PLANS
A. Texas Municipal Retirement System (TMRS) Plan Description The City of Weslaco participates as one of 887 plans in the nontraditional, joint contributory, hybrid defined benefit pension plan administered by the Texas Municipal Retirement System (TMRS). TMRS is an agency created by the State of Texas and administered in accordance with TMRS act, Subtitle G, Title 8, Texas Government Code (the TMRS Act) as an agent multiple‐employer retirement system for municipal employees in the State of Texas. The TMRS Act places the general administration and management of the System with a six‐member Board of Trustees. Although the Governor, with the advice and consent of the Senate, appoints the Board, TMRS is not fiscally dependent on the State of Texas. TMRS’s defined benefit pension plan is a tax‐qualified plan under Section 401(a) of the Internal Revenue Code. TMRS issues a publicly available comprehensive annual financial report (CAFR) that can be obtained at www.tmrs.com. All eligible employees of the City are required to participate in TMRS.
Benefits Provided
TMRS provides retirement, disability, and death benefits. Benefit provisions are adopted by the governing body of the City, within the options available in the state statutes governing TMRS. At retirement, the benefits are calculated as if the sum of the employee’s contributions, with interest, and the city‐financing monetary credits with interest were used to purchase an annuity. Members may choose to receive their retirement benefit in one of seven payment options. Members may also choose to receive a portion of their benefit as a Partial Lump Sum Distribution in an amount equal to 12, 24, or 36 monthly payments, which cannot exceed 75% of the member’s deposits and interest. Employees covered by benefit terms At the December 31, 2019 valuation and measurement date, the following employees were covered by the benefit terms: Inactive employees or beneficiaries currently receiving benefits 167 Inactive employees entitled to but not yet receiving benefits 161 Active employees 240 568 Contributions The contribution rates for employees in TMRS are either 5%, 6%, or 7% of employee gross earnings, and the City matching percentages are either 100%, 150%, or 200%, both as adopted by the governing body of the City. Under the state law governing TMRS, the contribution rate for each city is determined annually by the actuary, using the Entry Age Normal (EAN) actuarial cost method. The actuarially determined rate is the estimated amount necessary to finance the cost of benefits earned by employees during the year, with an additional amount to finance any unfunded accrued liability.

‐ 70 ‐
City of Weslaco, Texas Notes to Financial Statements
NOTE 10: DEFINED BENEFIT ‐ PENSION PLANS (Continued)
Employees for the City of Weslaco, Texas were required to contribute 7.00% of their annual gross earnings during the fiscal year. The contribution rates for the City were 8.00% and 8.52% in calendar 2019 and 2020, respectively. The City’s contributions to TMRS for the year ended September 30, 2020 were $946,759 and were equal to the required contributions. Net Pension Liability The City’s Net Pension Liability (NPL) was measured as of December 31, 2019, and the Total Pension Liability (TPL) used to calculate the Net Pension Liability was determined by an actuarial valuation as of that date. Actuarial assumptions: The Total Pension Liability in the December 31, 2019 actuarial valuation was determined using the following actuarial assumptions:
Inflation 2.5% per year Overall payroll growth 2.0% per year Investment Rate of Return 6.75%, net of pension plan investment expense, including inflation
Salary increases were based on a service‐related table. Mortality rates for active members are based on the PUB(10) mortality tables with the Public Safety table used for males and he General Employee table used for females. Mortality rates for healthy retirees and beneficiaries are based on the Gender‐distinct 2019 Municipal Retirees of Texas mortality tables. The rates for actives, healthy retirees and beneficiaries are projected on a fully generational basis by Scale UMP to account for future mortality improvements. For disabled annuitants, the same mortality tables for healthy retirees is used with a 4‐year set‐forward for males and a 3‐year set‐forward for females. In addition, a 3.5% and 3.0% minimum mortality rate is applied, for males and females respectively, to reflect the impairment for younger members who become disabled. The rates are projected on a fully generational basis by Scale UMP to account for future mortality improvements subject to the floor. The actuarial assumptions used in the December 31, 2019 valuation were developed primarily from the actuarial investigation of the experience of TMRS over the four year period from December 31, 2014 to December 31, 2018. They were adopted in 2019 and first used in the December 31, 2019 actuarial valuation. The post‐retirement mortality assumption for Annuity Purchase Rates (APRs) is based on the Mortality Experience Investigation Study covering 2009 through 2011 and dated December 31, 2013. Plan assets are managed on a total return basis with an emphasis on both capital appreciation as well as the production of income in order to satisfy the short‐term and long‐term funding needs of TMRS.

‐ 71 ‐
City of Weslaco, Texas Notes to Financial Statements
NOTE 10: DEFINED BENEFIT ‐ PENSION PLANS (Continued)
The long‐term expected rate of return on pension plan investments was determined using a building‐block method in which best estimate ranges of expected future real rates of return (expected returns, net of pension plan investment expense and inflation) are developed for each major asset class. These ranges are combined to produce the long‐term expected rate of return by weighting the expected future real rates of return by the target asset allocation percentage and by adding expected inflation. In determining their best estimate of a recommended investment return assumption under the various alternative asset allocation portfolios, GRS focused on the area between (1) arithmetic mean (aggressive) without an adjustment for time (conservative) and (2) the geometric mean (conservative) with an adjustment for time (aggressive). The target allocation and best estimates of real rates of return for each major asset class are summarized in the following table:
Long‐term Expected Real Rate of Return Asset Class Target Allocation (Arithmetic) Global Equity 30.0% 5.30% Core Fixed Income 10.0% 1.25% Non‐Core Fixed Income 20.0% 4.14% Real Return 10.0% 3.85% Real Estate 10.0% 4.00% Absolute Return 10.0% 3.48% Private Equity 10.0% 7.75% Total 100.0%
Discount Rate The discount rate used to measure the Total Pension Liability was 6.75%. The projection of cash flows used to determine the discount rate assumed that employee and employer contributions will be made at the rates specified in statute. Based on that assumption, the pension plan’s Fiduciary Net Position was projected to be available to make all projected future benefit payments of current active and inactive employees. Therefore, the long‐term expected rate of return on pension plan investments was applied to all periods of projected benefit payments to determine the Total Pension Liability.

‐ 72 ‐
City of Weslaco, Texas Notes to Financial Statements
NOTE 10: DEFINED BENEFIT ‐ PENSION PLANS (Continued)
Schedule of Changes in Net Pension Liability The change in the City’s net pension liability for TMRS pension for the fiscal year ended September 30, 2020 is as follows:
(a) (b) (a)‐(b)
Total Pension Plan Fiduciary Net Pension
Liability Net Position Liability (Asset)
Balance at December 31, 2018 46,803,406$ 36,960,062$ 9,843,344$
Changes for the year
Service cost 1,548,576 ‐ 1,548,576
Interest 3,140,037 ‐ 3,140,037
Difference Between expected/actual experience (156,422) ‐ (156,422)
Changes of assumptions 112,715 ‐ 112,715
Contributions‐ employer ‐ 871,252 (871,252)
Contributions‐ employee ‐ 761,861 (761,861)
Net investment income ‐ 5,707,131 (5,707,131)
Benefit payments, including refunds of
employee contributions (2,117,240) (2,117,240) ‐
Administrative expenses ‐ (32,286) 32,286
Other charges ‐ (971) 971
Net changes 2,527,666 5,189,747 (2,662,081)
Balance at December 31, 2019 49,331,072$ 42,149,809$ 7,181,263$
Increase (Decrease)
Net pension liability amounts are allocated between the governmental activities and business‐type activities in the statement of net position by $6,341,943 and $839,320, respectively. Sensitivity of the Net Pension Liability to Changes in the Discount Rate The following presents the net pension liability of the City, calculated using the discount rate of 6.75%, as well as what the City’s net pension liability would have been if it were calculated using a discount rate that is 1 percentage point lower (5.75%) or 1 percentage point higher (7.75%) than the current rate.
1% Decrease
in Discount
Rate (5.75%)
Discount Rate
(6.75%)
1% Increase in
Discount Rate
(7.75%)
City's net pension liability 14,263,197$ 7,181,263$ 1,377,990$

‐ 73 ‐
City of Weslaco, Texas Notes to Financial Statements
NOTE 10: DEFINED BENEFIT ‐ PENSION PLANS (Continued)
Pension Expense and Deferred Outflows of Resources and Deferred Inflows of Resources Related to Pensions For the year ended September 30, 2020 the City recognized pension expense in the amount of $1,418,161. At September 30, 2020 the City reported deferred outflows of resources and deferred inflows of resources related to pensions from the following sources:
Deferred
Outflows of
Resources
Deferred Inflows
of Resources
Differences between expected and actual economic experience
(net of current year amortization) 104,124$ 117,608$
Changes in actuarial assumptions 84,746 ‐
Differences between expected and actual investment earnings
(net of current year amortization) ‐ 1,287,158
Contributions subsequent to measurement date 743,278 ‐
Total 932,148$ 1,404,766$
Deferred outflows/inflows of resources related to pensions are allocated between the governmental activities and business‐type activities in the statement of net position. Please see Note 13 for the aggregate amount of deferred outflows/inflows of resources, pension and OPEB liabilities, and pension and OPEB expenses. $743,278 reported as deferred outflows of resources related to pensions resulting from contributions subsequent to the measurement date will be recognized as a reduction of the net pension liability for the year ending September 30, 2021. Other amounts reported as deferred outflows and inflows of resources related to pensions will be recognized in pension expense as follows:
Fiscal Year Ending September 30,
2021 (327,783)$
2022 (350,904)
2023 105,584
2024 (642,793)

‐ 74 ‐
City of Weslaco, Texas Notes to Financial Statements
NOTE 10: DEFINED BENEFIT ‐ PENSION PLANS (Continued)
B. Firemen’s Pension Plan
Plan Description The Board of Trustees of the Weslaco Firemen’s Relief and Retirement Fund is the administrator of a single‐employer defined benefit pension plan. The Firemen’s Relief and Retirement Fund is considered part of the City of Weslaco’s financial reporting entity and is included in the City’s financial reports as a pension trust fund. A stand‐alone report for the Firemen’s Relief and Retirement fund is publicly available at City Hall located at 255 S. Kansas Avenue, Weslaco, Texas 78596, and complies with GASB Statement No. 67 Financial Reporting for Pension Plans, an amendment of GASB Statement No. 25.
Retirees and beneficiaries currently receiving benefits and terminated employees entitled to benefits but not yet receiving them 28 Current employees 69 Total 97
The Firemen’s Relief and Retirement Fund provides service retirement, death, disability and withdrawal benefits. These benefits vest after twenty years of credited service. Employees may retire at age 55 with twenty years of service. The monthly benefit at retirement is equal to a base benefit of 2.65% of the highest 60‐month average salary multiplied by his years of service, with a maximum of 20 years, but not less than $1,000; plus a longevity benefit equal to $132 for each year of service in excess of 20 years. Under this plan, Weslaco firefighters are required to contribute 12% of their pay to the fund. The City of Weslaco is required to make contributions which will equal 12% of pay.
The City of Weslaco Firemen’s Relief and Retirement Plan was organized under the Texas Local Fire Fighters Retirement Act (TLFFRA). TLFFRA allows for paid and part‐paid fire departments and volunteer fire departments in participating cities to administer their own local retirement systems. The Act provides a general framework for the establishment of TLFFRA systems, including some investment restrictions, but leaves administration, plan design, contributions, and specific investments to each system’s local board. Systems operating under TLFFRA are entirely locally funded. In 2013 the Office of the Fire Fighter’s Pension Commissioner was abolished under the Senate Bill 220 by the Texas Sunset Commission. Accordingly, the duties and responsibilities assigned to the Commissioner were transferred to the Texas Pension Review Board (PRB).
The Texas Pension Review Board (PRB) is mandated to oversee all Texas public retirement systems, both state and local, in regard to their actuarial soundness and compliance with state law. The PRB monitors the financial and actuarial soundness of 93 actuarially funded defined benefit public retirement systems in Texas, as well as their compliance with state law.

‐ 75 ‐
City of Weslaco, Texas Notes to Financial Statements
NOTE 10: DEFINED BENEFIT ‐ PENSION PLANS (Continued) Summary of Significant Accounting Policies and Plan Asset Matters Basis of Accounting The Weslaco Firemen’s Relief and Retirement Fund’s financial statements are prepared using the accrual basis of accounting. The fund operates on a fiscal year and employee and employer contributions are recognized as revenue in the period in which they are received by the fund. Method Used to Value Investments The Weslaco Firemen’s Relief and Retirement Fund’s investments are reported at fair market value. There is no provision for the amortization of premium or discount in the purchase price of these assets. Investment income is recognized as it is received. Gains and losses on the sale of assets are recognized as of the transaction date. Net Pension Liability The City’s Net Pension Liability (NPL) for the Firemen’s Fund was measured as of September 30, 2020, and the Total Pension Liability (TPL) used to calculate the Net Pension Liability was determined by an actuarial valuation as of September 30, 2020. Actuarial Assumptions
Valuation date September 30, 2020 Actuarial cost method Entry age ‐ normal Remaining amortization period 16.3 years, closed Asset valuation method market value Actuarial assumptions:
Investment rate of return 7.25% Projected salary increases 3.25% per annum Inflation 2.5%
There were no changes in actuarial assumptions or benefits from the prior valuation. The base benefit was increased from 2.5% to 2.65% per year of service, with a maximum of 20 years since the previous actuarial valuation. The long‐term expected rate of return on pension plan investments was determined using a building block method in which best‐estimates ranges of expected future real rates of return (expected returns, net of pension plan investment expense and inflation) are developed for each major asset class. These ranges are combined to produce the long‐term expected rate of return by weighting the expected future real rates of return by the target asset allocation percentage and by adding expected inflation (assumed 2.5%). Best estimates of arithmetic real rates of return for each major asset class included in the pension plan's target asset allocations as of September 30, 2020 are summarized in the following table:
Long‐term Expected Real Rate of Return Asset Class (Arithmetic) Equity 6.0% Fixed Income 4.0% Cash 0.0%

‐ 76 ‐
City of Weslaco, Texas Notes to Financial Statements
NOTE 10: DEFINED BENEFIT ‐ PENSION PLANS (Continued) Discount rate: The discount rate used to measure the total pension liability was 7.25% net of investment expense. The projection of cash flows used to determine the discount rate assumed that the City contribution would equal 12% of payroll and that member contributions would equal 12% of compensation. Based on those assumptions, the pension plan's fiduciary net position was projected to be available to make all projected future benefit payments of current plan members. Therefore, the long‐term expected rate of return on pension investments was applied to all periods of benefit payments to determine the total pension liability. Schedule of Changes in Net Pension Liability‐ The change in net pension liability for the Firemen’s Fund for the fiscal year ended September 30, 2020 is as follows:
(a) (b) (a)‐(b)
Total Pension Plan Fiduciary Net Pension
Liability Net Position Liability (Asset)
Balance at September 30, 2019 16,735,864$ 11,929,839$ 4,806,025$
Changes for the year
Service cost 594,954 ‐ 594,954
Interest 1,235,267 ‐ 1,235,267
Difference Between expected/actual experience (270,772) ‐ (270,772)
Changes of assumptions 286,156 ‐ 286,156
Contributions‐ employer ‐ 599,436 (599,436)
Contributions‐ employee ‐ 599,436 (599,436)
Net investment income ‐ 328,295 (328,295)
Benefit payments, including refunds of
employee contributions (595,725) (595,725) ‐
Administrative expenses ‐ (28,930) 28,930
Changes in benefit terms 514,707 ‐ 514,707
Net changes 1,764,587 902,512 862,075
Balance at September 30, 2020 18,500,451$ 12,832,351$ 5,668,100$
Increase (Decrease)
Sensitivity of the Net Pension Liability to Changes in the Discount rate The following presents the net pension liability of the City, calculated using the discount rate of 7.25% as well as what the City's net pension liability would be if it were to be calculated using the discount rate that is 1‐percentage‐point lower (6.25%) or 1‐percentage‐point higher (8.25%) than the current rate:
1% Decrease
in Discount
Rate (6.25%)
Discount Rate
(7.25%)
1% Increase in
Discount Rate
(8.25%)
City's net pension liability 8,642,153$ 5,668,100$ 3,260,529$

‐ 77 ‐
City of Weslaco, Texas Notes to Financial Statements
NOTE 10: DEFINED BENEFIT ‐ PENSION PLANS (Continued) Pension Expense and Deferred Outflows of Resources and Deferred Inflows of Resources Related to Pensions For the year ended September 30, 2020 the City recognized pension expense in the amount of $1,039,931. At September 30, 2020, the City reported deferred outflows of resources and deferred inflows of resources related to pensions from the following sources:
Deferred
Outflows of
Resources
Deferred Inflows
of Resources
Differences between expected and actual economic experience
(net of current year amortization) 246,891$ 315,163$
Changes in actuarial assumptions 260,140 116,318
Differences between expected and actual investment earnings
(net of current year amortization) 721,398 ‐
Total 1,228,429$ 431,481$
Please see Note 13 for total deferred outflows/inflows of resources from other pension and OPEB liabilities. Amounts reported as deferred outflows and inflows of resources related to pensions will be recognized in pension expense as follows:
Fiscal Year Ending September 30,
2021 181,079$
2022 221,862
2023 254,705
2024 127,302
2025 15,888
Thereafter (3,888)
C. Other Plans The City offers its employees a deferred compensation plan created in accordance with Internal Revenue Code Section 457. The plan, available to all City employees, permits them to defer a portion of their salary until future years. Participation in the plan is optional. The deferred compensation is not available to employees until termination, retirement, death, or unforeseeable emergency.

‐ 78 ‐
City of Weslaco, Texas Notes to Financial Statements
NOTE 10: DEFINED BENEFIT ‐ PENSION PLANS (Continued)
C. Other Plans (continued)
In prior years the Internal Revenue code specified that the plan’s assets were the property of the City until paid or made available to participants, subject only on an equal basis to the claims of the City’s general creditors. A 1996 federal law now requires all assets and income of the Internal Revenue Code 457 deferred compensation plans to be held in trust, custodial accounts, or annuity contracts for the exclusive benefit of the participants and their beneficiaries. Assets of the City’s plan are administered by private corporations under contract with the City. The private administrators have amended the plans to comply with the federal law. Consequently, the plan’s assets and liabilities have been removed from the City’s financial statements.
D. Summary of Pension Plans
Total City‐
TMRS and
Firemen's Pension Firemen's
City‐ TMRS Plan Pension Plan
Total pension liability 49,331,072$ 18,500,451$ 67,831,523$
Plan fiduciary net position 42,149,809 12,832,351 54,982,160
Net pension liability 7,181,263 5,668,100 12,849,363
Deferred outflows of resources 932,148$ 1,228,429$ 2,160,577$
Deferred inflows of resources 1,404,766$ 431,481$ 1,836,247$
Pension expense 1,418,161$ 1,039,931$ 2,458,092$ NOTE 11: OTHER POST‐EMPLOYMENT BENEFITS A. TMRS Supplemental Death Benefit Fund (SBDF) The City also participates in a single‐employer, defined benefit group‐term life insurance known as the Supplemental Death Benefits Fund (SDBF) administered by the Texas Municipal Retirement System (TMRS). This is a voluntary program in which the City elected, by ordinance, to provide group‐term life insurance coverage to both current and retired employees. The City may terminate coverage under and discontinue participation in the SDBF by adopting an ordinance before November 1 of any year to be effective the following January 1. The death benefit for active employees provides a lump‐sum payment approximately equal to the employee’s annual salary (calculated based on the employee’s actual earnings, for the 12‐month period preceding the month of death). The death benefit for retirees is considered an other postemployment benefit (“OPEB”) and is a fixed amount of $7,500. As the SDBF covers both active and retiree participants, with no segregation of assets, the SDBF is considered to be an unfunded OPEB plan (i.e. no assets are accumulated).

‐ 79 ‐
City of Weslaco, Texas Notes to Financial Statements
NOTE 11: OTHER POST‐EMPLOYMENT BENEFITS (Continued) Employees covered by benefit terms At the December 31, 2019 valuation and measurement date, the following employees were covered by the benefit terms:
Inactive employees or beneficiaries currently receiving benefits 132 Inactive employees entitled to but not yet receiving benefits 33 Active employees 240 405
Contributions The City contributes to the SDBF at a contractually required rate as determined by an annual actuarial valuation. The rate is equal to the cost of providing one‐year term life insurance. The funding policy for the SDBF program is to assure that adequate resources are available to meet all death benefit payments for the upcoming year; the intent is not to pre‐fund retiree term life insurance during employees’ entire careers. Employees for the City of Weslaco were required to contribute 0.06% of their annual gross earnings during the fiscal year. The contribution rates for the City of Weslaco were 0.16% and 0.18% in calendar year 2019 and 2020, respectively. The City’s contributions to the SDBF for the year ended September 30, 2020 were $19,772, and were equal to the required contributions. Actuarial assumptions: The Total OPEB Liability in the December 31, 2019 actuarial valuation was determined using the following actuarial assumptions: Valuation date: 12/31/2019 Inflation 2.50% Salary Increases 3.50% to 11.50%, including inflation Discount rate* 2.75% Administrative expenses All administrative expenses are paid through the Pension
Trust and accounted for under reporting requirements under GASB Statement No. 68.
Mortality rates‐ service retirees 2019 Municipal Retirees of Texas Mortality Tables. The rates are projected on a fully generational basis with scale UMP.
Mortality rates‐ disabled retirees 2019 Municipal Retirees of Texas Mortality Tables with a 4 year set‐forward for males and a 3‐year set‐forward for females. In addition, a 3.5% and 3% minimum mortality rate will be applied to reflect the impairment for younger members who become disabled for males and females, respectively. The rates are projected on a fully generational basis by Scale UMP to account for future mortality improvements subject to the floor.
*the discount rate was based on the Fidelity Index’s “20‐year Municipal GO AA Index” rate as of December 31, 2019. The actuarial assumptions used in the December 31, 2019 valuation were based on the results of an actuarial experience study for the period of December 31, 2014 to December 31, 2018.

‐ 80 ‐
City of Weslaco, Texas Notes to Financial Statements
NOTE 11: OTHER POST‐EMPLOYMENT BENEFITS (Continued) Total OPEB Liability The City’s Total OPEB Liability was measured as of December 31, 2019, and was determined by an actuarial valuation as of that date. The following presents a summary of the changes in Total OPEB liability:
Increase
(Decrease)
Total OPEB
Liability
Balance at December 31, 2018 697,078$
Changes for the year:
Service cost 24,960
Interest 26,224
Difference between
expected/actual experience (15,235)
Changes of assumptions 144,552
Benefit payments, including refunds of
employee contributions (5,426)
Net changes 175,075
Balance at December 31, 2019 872,153$
Total OPEB liability amounts are allocated between the governmental activities and business‐type activities in the statement of net position by $800,860 and $71,293, respectively. Sensitivity of the Total OPEB Liability to Changes in the Discount Rate The following presents the total OPEB liability of the City, calculated using the discount rate of 2.75%, as well as what the City’s total OPEB liability would have been if it were calculated using a discount rate that is 1 percentage point lower (1.75%) or 1 percentage point higher (3.75%) than the current rate.
1% Decrease
in Discount
Rate (1.75%)
Discount Rate
(2.75%)
1% Increase in
Discount Rate
(3.75%)
City's total OPEB liability 1,056,800$ 872,153$ 728,668$
OPEB Expense and Deferred Outflows of Resources Related to OPEBs For the year ended September 30, 2020 the City recognized combined OPEB expense in the amount of $71,949. At September 30, 2020 the City reported deferred outflows of resources related to OPEB from the following sources:
Deferred
Outflows of
Resources
Deferred Inflows
of Resources
Differences between expected and actual economic experience
(net of current year amortization) $ ‐ $ 25,067
Changes in actuarial assumptions 147,471 33,788
Contributions subsequent to the measurement date 15,703 ‐
Total $ 163,174 $ 58,855
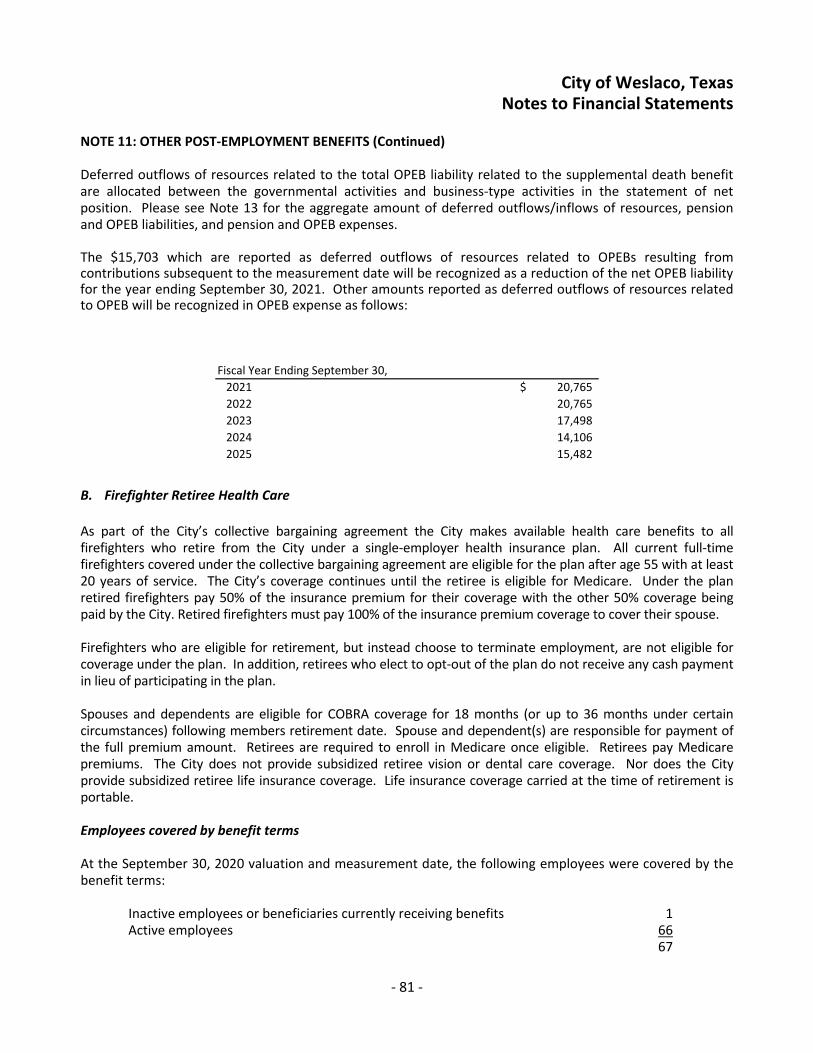
‐ 81 ‐
City of Weslaco, Texas Notes to Financial Statements
NOTE 11: OTHER POST‐EMPLOYMENT BENEFITS (Continued) Deferred outflows of resources related to the total OPEB liability related to the supplemental death benefit are allocated between the governmental activities and business‐type activities in the statement of net position. Please see Note 13 for the aggregate amount of deferred outflows/inflows of resources, pension and OPEB liabilities, and pension and OPEB expenses. The $15,703 which are reported as deferred outflows of resources related to OPEBs resulting from contributions subsequent to the measurement date will be recognized as a reduction of the net OPEB liability for the year ending September 30, 2021. Other amounts reported as deferred outflows of resources related to OPEB will be recognized in OPEB expense as follows:
Fiscal Year Ending September 30,
2021 20,765$
2022 20,765
2023 17,498
2024 14,106
2025 15,482 B. Firefighter Retiree Health Care
As part of the City’s collective bargaining agreement the City makes available health care benefits to all firefighters who retire from the City under a single‐employer health insurance plan. All current full‐time firefighters covered under the collective bargaining agreement are eligible for the plan after age 55 with at least 20 years of service. The City’s coverage continues until the retiree is eligible for Medicare. Under the plan retired firefighters pay 50% of the insurance premium for their coverage with the other 50% coverage being paid by the City. Retired firefighters must pay 100% of the insurance premium coverage to cover their spouse. Firefighters who are eligible for retirement, but instead choose to terminate employment, are not eligible for coverage under the plan. In addition, retirees who elect to opt‐out of the plan do not receive any cash payment in lieu of participating in the plan. Spouses and dependents are eligible for COBRA coverage for 18 months (or up to 36 months under certain circumstances) following members retirement date. Spouse and dependent(s) are responsible for payment of the full premium amount. Retirees are required to enroll in Medicare once eligible. Retirees pay Medicare premiums. The City does not provide subsidized retiree vision or dental care coverage. Nor does the City provide subsidized retiree life insurance coverage. Life insurance coverage carried at the time of retirement is portable. Employees covered by benefit terms At the September 30, 2020 valuation and measurement date, the following employees were covered by the benefit terms:
Inactive employees or beneficiaries currently receiving benefits 1 Active employees 66 67

‐ 82 ‐
City of Weslaco, Texas Notes to Financial Statements
NOTE 11: OTHER POST‐EMPLOYMENT BENEFITS (Continued) Funding Policy and Annual Firefighter Retiree Health Care Plan Cost The City’s annual firefighter retiree health care plan cost is based upon the annual actuarially determined contribution of the employer (“ADC”), an amount actuarially determined in accordance with the parameters of GASB Statement No. 75. The ADC represents an accrual that, if expensed annually, will recognize the normal cost each year and an amount to amortize any unfunded actuarial liabilities (or funding excess) over thirty years. The City has not established a trust to fund the Firefighter Retiree Health Care Plan liability and intend to continue the pay‐as‐you‐go funding method. The plan does not issue a separate financial report. Actuarial assumptions: The total OPEB liability in the September 30, 2020 actuarial valuation was determined using the following actuarial assumptions and other inputs, applied to all periods included in the measurement, unless otherwise specified: Valuation date: September 30, 2020 Methods and Assumptions Actuarial Cost Method Individual Entry‐Age Normal Discount Rate 2.40% as of September 30, 2020 Inflation 2.50% Salary Increases 3.25% per annum for wage inflation. 5.16% grading down to 0.00% per
annum for longevity and promotion based on years of service Mortality Rates SOA Public Safety Mortality tables with generational mortality
projection using Scale MP‐20193 Separate rates for employees and retirees. Separate rates for males and females.
Health Care Trend Rates 7.75% for 2020 decreasing by 0.25% per year until the ultimate rate of 4.50% is reached in 2033.
Retirement Rates 50% for those retiring between age 55‐59; 100% for those retiring at age 60. No participation after retiree reaches eligibility age for Medicare.
Other Information: Notes: The discount rate changed from 2.75% as of October 1, 2019 to 2.40%
as of September 30, 2020. Discount Rate: For plans that do not have formal assets, the discount rate should equal the tax‐exempt municipal bond rate based on an index of 20‐year general obligation bonds with an average AA credit rating as of the measurement date. For the purpose of this valuation, the municipal bond rate is 2.40% (based on the daily rate closest to but not later than the measurement date of the Fidelity “20‐Year Municipal GO AA Index”). The discount rate was 3.75% as of the prior measurement date. Plan Assets: There are no plan assets accumulated in a trust that meets the criteria in paragraph 4 of GASB Statement No. 75.

‐ 83 ‐
City of Weslaco, Texas Notes to Financial Statements
NOTE 11: OTHER POST‐EMPLOYMENT BENEFITS (Continued) Total OPEB Liability The City’s Total OPEB Liability related to the Firefighter Retiree Health Care OPEB was measured as of September 30, 2020, and was determined by an actuarial valuation as of that date. The following presents a summary of the changes in Total OPEB liability:
Total OPEB
Liability
Balance at September 30, 2019 2,454,914$
Changes for the year:
Service cost 194,173
Interest 72,446
Difference between
expected/actual experience 15,219
Changes of assumptions 147,060
Contributions ‐ employer (14,704)
Changes in benefit terms (847,947)
Net changes (433,753)
Balance at September 30, 2020 2,021,161$
Sensitivity of the Total OPEB Liability to Changes in the Discount Rate Sensitivity of Total OPEB Liability to the Discount Rate Assumption: Regarding the sensitivity of the total OPEB liability to changes in the discount rate, the following presents the plan’s total OPEB liability, calculated using a discount rate of 2.40%, as well as what the plan’s total OPEB liability would be if it were calculated using a discount rate that is one percent lower or one percent higher:
1% Decrease
in Discount
Rate (1.40%)
Discount Rate
(2.40%)
1% Increase in
Discount Rate
(3.40%)
City's total OPEB liability 2,247,800$ 2,021,161$ 1,812,859$

‐ 84 ‐
City of Weslaco, Texas Notes to Financial Statements
NOTE 11: OTHER POST‐EMPLOYMENT BENEFITS (Continued)
Sensitivity of the Total OPEB Liability to Changes in the Healthcare Cost Trend Rates Sensitivity of Total OPEB Liability to the Healthcare Cost Trend Rate Assumption: Regarding the sensitivity of the total OPEB liability to changes in the healthcare cost trend rates, the following presents the plan’s total OPEB liability, calculated using the assumed trend rates as well as what the plan’s total OPEB liability would be if it were calculated using a trend rate that is one percent lower or one percent higher:
1% Decrease
in trend Current trend
1% Increase in
trend
City's total OPEB liability 1,712,571$ 2,021,161$ 2,395,431$
OPEB Expense and Deferred Inflows of Resources Related to Firefighter Retiree Health Care OPEB. For the year ended September 30, 2020, the City recognized a pension expense of ($555,390). At September 30, 2020, the City reported deferred inflows of resources related to Firefighter Retiree Health Care OPEB from the following sources:
Deferred
Outflows of
Resources
Deferred Inflows
of Resources
Differences bettwteen expected and actual experience $ 14,131 $ ‐
Changes in assumptions 365,413 58,102 Total 379,544$ 58,102$
Amounts reported as deferred inflows of resources related to Firefighter Retiree Health Care OPEB will be recognized in OPEB expense as follows:
Fiscal Year Ending September 30,
2021 25,933$
2022 25,933
2023 25,933
2024 25,933
2025 25,933
Thereafter 191,777

‐ 85 ‐
City of Weslaco, Texas Notes to Financial Statements
NOTE 11: OTHER POST‐EMPLOYMENT BENEFITS (Continued)
C. Summary of Other Post‐Employment Benefits
Total City‐
Firefighter TMRS SDB and
City TMRS Retiree Health Firefighter Retiree
SDBF Plan Care Plan Health Care Plan
Total OPEB liability 872,153$ 2,021,161$ 2,893,314$
Plan fiduciary net position ‐ ‐ ‐
Net pension liability 872,153 2,021,161 2,893,314
Deferred outflows of resources 163,174$ 379,544$ 542,718$
Deferred inflows of resources 58,855$ 58,102$ 116,957$
OPEB expense 71,949$ (555,390)$ (483,441)$ NOTE 12: DEFERRED OUTFLOWS/INFLOWS OF RESOURCES The statement of net position reports deferred outflows of resources in connection with the consumption of net position that applies to a future period. The components of deferred outflows of resources are as follows:
Governmental Business‐type Total Primary
Activities Activities Government
Deferred outflows of resources:
Pensions:
Deferred outflows related to TMRS pension 831,830$ 100,318$ 932,148$
Deferred outflows related to Firemen's pension 1,228,429 ‐ 1,228,429
Total deferred outflows related to pensions 2,060,259 100,318 2,160,577
OPEB:
Deferred outflows related to TMRS Supplemental
Death Benefit OPEB 149,989 13,185 163,174
Deferred outflows related to Firefighter Retiree Health
Care OPEB 379,544 ‐ 379,544
Total deferred outflows related to OPEB 529,533 13,185 542,718
Other:
Deferred outflows related to deferred charge on refunding 178,082 1,778,044 1,956,126
Total deferred outflows of resources 2,767,874$ 1,891,547$ 4,659,421$
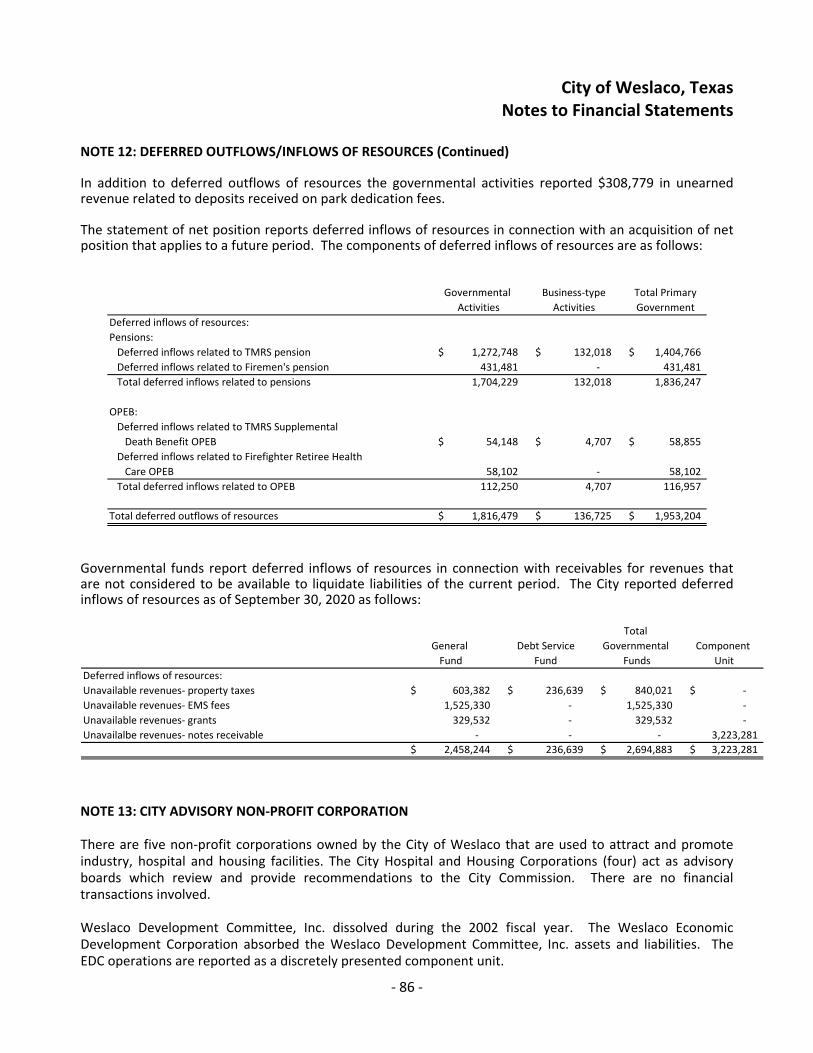
‐ 86 ‐
City of Weslaco, Texas Notes to Financial Statements
NOTE 12: DEFERRED OUTFLOWS/INFLOWS OF RESOURCES (Continued) In addition to deferred outflows of resources the governmental activities reported $308,779 in unearned revenue related to deposits received on park dedication fees. The statement of net position reports deferred inflows of resources in connection with an acquisition of net position that applies to a future period. The components of deferred inflows of resources are as follows:
Governmental Business‐type Total Primary
Activities Activities Government
Deferred inflows of resources:
Pensions:
Deferred inflows related to TMRS pension 1,272,748$ 132,018$ 1,404,766$
Deferred inflows related to Firemen's pension 431,481 ‐ 431,481
Total deferred inflows related to pensions 1,704,229 132,018 1,836,247
OPEB:
Deferred inflows related to TMRS Supplemental
Death Benefit OPEB 54,148$ 4,707$ 58,855$
Deferred inflows related to Firefighter Retiree Health
Care OPEB 58,102 ‐ 58,102
Total deferred inflows related to OPEB 112,250 4,707 116,957
Total deferred outflows of resources 1,816,479$ 136,725$ 1,953,204$
Governmental funds report deferred inflows of resources in connection with receivables for revenues that are not considered to be available to liquidate liabilities of the current period. The City reported deferred inflows of resources as of September 30, 2020 as follows:
Total
General Debt Service Governmental Component
Fund Fund Funds Unit
Deferred inflows of resources:
Unavailable revenues‐ property taxes 603,382$ 236,639$ 840,021$ ‐$
Unavailable revenues‐ EMS fees 1,525,330 ‐ 1,525,330 ‐
Unavailable revenues‐ grants 329,532 ‐ 329,532 ‐
Unavailalbe revenues‐ notes receivable ‐ ‐ ‐ 3,223,281
2,458,244$ 236,639$ 2,694,883$ 3,223,281$
NOTE 13: CITY ADVISORY NON‐PROFIT CORPORATION
There are five non‐profit corporations owned by the City of Weslaco that are used to attract and promote industry, hospital and housing facilities. The City Hospital and Housing Corporations (four) act as advisory boards which review and provide recommendations to the City Commission. There are no financial transactions involved. Weslaco Development Committee, Inc. dissolved during the 2002 fiscal year. The Weslaco Economic Development Corporation absorbed the Weslaco Development Committee, Inc. assets and liabilities. The EDC operations are reported as a discretely presented component unit.

‐ 87 ‐
City of Weslaco, Texas Notes to Financial Statements
NOTE 14: PROPRIETARY FUND‐SANITARY LANDFILL
Recognition of closure and post‐closure costs State and federal EPA laws require final cover closure as well as post‐closure care of the City of Weslaco landfill site in Alton, Texas. The Governmental Accounting Standards Board issued Statement No. 18‐Accounting for Municipal Solid Waste Landfill Closure and Post‐Closure Care Costs. This statement addresses the financial statement effect of the EPA rules and state rules and requires that all closure and post‐closure costs be recognized during the operating life of the landfill. The City's landfill is currently inactive. The closure and post‐closure costs considered are based on this inactive state. If the landfill begins receiving wastes, the closure and post‐closure and related liability balance will have to be revised based on the capacity of the landfill that will be used. Approximately twenty‐five percent of the landfill capacity has been used to date. Based on the current capacity used, $372,376 was estimated as a closure and post‐closure cost. This includes cost related to the transfer station, underground petroleum storage tanks, and landfill closure and post‐closure costs and is adjusted for inflation. The landfill has been closed and post‐closure costs liability is estimated at $372,376. These costs are currently reflected in the financial statements of the Solid Waste Fund. As costs are incurred during the year, the liability will be reduced. The City met the state's financial assurance requirements during the current fiscal year. The landfill remains in an inactive status as of September 30, 2020. The post‐closure costs include lab tests, gas monitoring, leachate disposal and general monitoring maintenance during its inactive status. NOTE 15: COMMITMENTS
At September 30, 2020, the City had ongoing commitments related to the following:
Project Original Amount Expensed
Remaining
Commitment
Governmental Activities:
FM 1015 Road Improvement Phase 1 815,871$ 815,871$ ‐$
Westgate Road Improvement Project 753,741 753,741 ‐
North Side Park 1,020,000 267,684 752,316
Pleasant View Project 4,775,000 742,387 4,032,613
Austin & Merida 500,000 61,097 438,903
Flap Gates 1,000,000 338,800 661,200
New Police and Fire Station 11,250,000 132,005 11,117,995
Mile 5 N. Rd. Improvement 101,578 101,578 ‐
Total governmental Activities 20,216,190 3,213,163 17,003,027
Business‐Type Activities:
Airport Kapal Project 129,000 59,058 69,942
Total business‐type activities 129,000 59,058 69,942
Total Primary Government 20,345,190$ 3,272,221$ 17,072,969$
Construction in progress amounts for which project contracts have not been finalized are not reflected in the schedule.

‐ 88 ‐
City of Weslaco, Texas Notes to Financial Statements
NOTE 15: COMMITMENTS (Continued) The Economic Development Corporation of Weslaco extended economic incentives to the following entities as follows:
Incentives
Paid in
Commitment
Paid in Prior
Year
Paid in Current
Year Balance Due
Wal‐Mart Neighborhood 900,000$ 400,000$ ‐$ 500,000$
R 5 Eateries (Bar B Cutie) 160,000 133,333 13,333 13,334
Claudia Hernandez‐Project Smile 75,000 15,000 ‐ 60,000
Rio Prevision Machine (Project Knob) 68,778 24,300 ‐ 44,478
Kapal Cabinet House, LLC 255,192 139,128 69,564 46,500
Kapal Cabinet House, LLC (II) 50,840 ‐ 50,840 ‐
Coastal Deli, Inc. d/b/a Jason's Deli 134,300 44,767 44,767 44,766
Kapal Millwork 62,414 ‐ 48,114 14,300
RGV Solar Power Systems 50,000 25,000 ‐ 25,000
City of Weslaco (Alley) 30,000 4,750 ‐ 25,250
City of Weslaco (Drainage) 415,468 ‐ ‐ 415,468
Domain Development Corp. 350,000 ‐ 116,667 233,333
A3H Foods II, LP 75,000 ‐ 25,000 50,000
A3H Foods II, LP (Project Box) 150,000 ‐ ‐ 150,000
LF Trinity (Project Fire & Water) 67,092 ‐ ‐ 67,092
Dr. Rolando Rios (Project Eye) 47,707 ‐ ‐ 47,707
Pharmaceutical Processing (Project Eli) 52,500 ‐ ‐ 52,500
Weslaco Glass (Project Windshield) 24,950 ‐ ‐ 24,950
Tomasita Hernandez (Project Tommy) 5,000 ‐ 5,000 ‐
Roberta Reyes‐Ramos (Project Bravo) 5,000 ‐ 5,000 ‐
Dance Time (Project Angie) 5,000 ‐ ‐ 5,000
Harbor Freight (Project Dock) 106,378 ‐ ‐ 106,378
City of Weslaco (Sports Complex) 500,000 ‐ 100,000 400,000
Total Monetary Incentives 3,590,619$ 786,278$ 478,285$ 2,326,056$
Subsequent year balances of $2,326,056 are contingent on the business entities maintaining agreed upon employment levels and other conditions of the loan/grant incentives. This amount is not recognized as a liability in the financial statements.
NOTE 16: RISK MANAGEMENT The City is exposed to various risks or torts; theft of, damage to, and destruction of assets; injuries to employees, citizens and the general public; and natural disasters. The City has purchased group health insurance, life insurance, general liability insurance, and workmen’s compensation insurance. The City has also purchased insurance coverage for fire and extended coverage on buildings and contents; and fire, lightning, and windstorm insurance for its vehicles for damages in excess of certain limits. There were no significant reductions in insurance coverage from coverage in the prior year by major category risk. In addition, there were no material insurance settlements exceeding insurance coverage in any of the past three years.
NOTE 17: CONTINGENT LIABILITIES
The City participates in a number of federally assisted grant programs such as the Community Development Block Grants, and the Texas Department of Transportation. These programs are subject to program compliance audits by the grantors or their representatives. The audit of these programs for/or including the year ended September 30, 2020 have not yet been conducted. Accordingly, the City's compliance with applicable grant requirements will be established at some future date. The amount, if any, of expenditures which may be disallowed by the granting agencies cannot be determined at this time although the City expects such amounts, if any, to be immaterial.
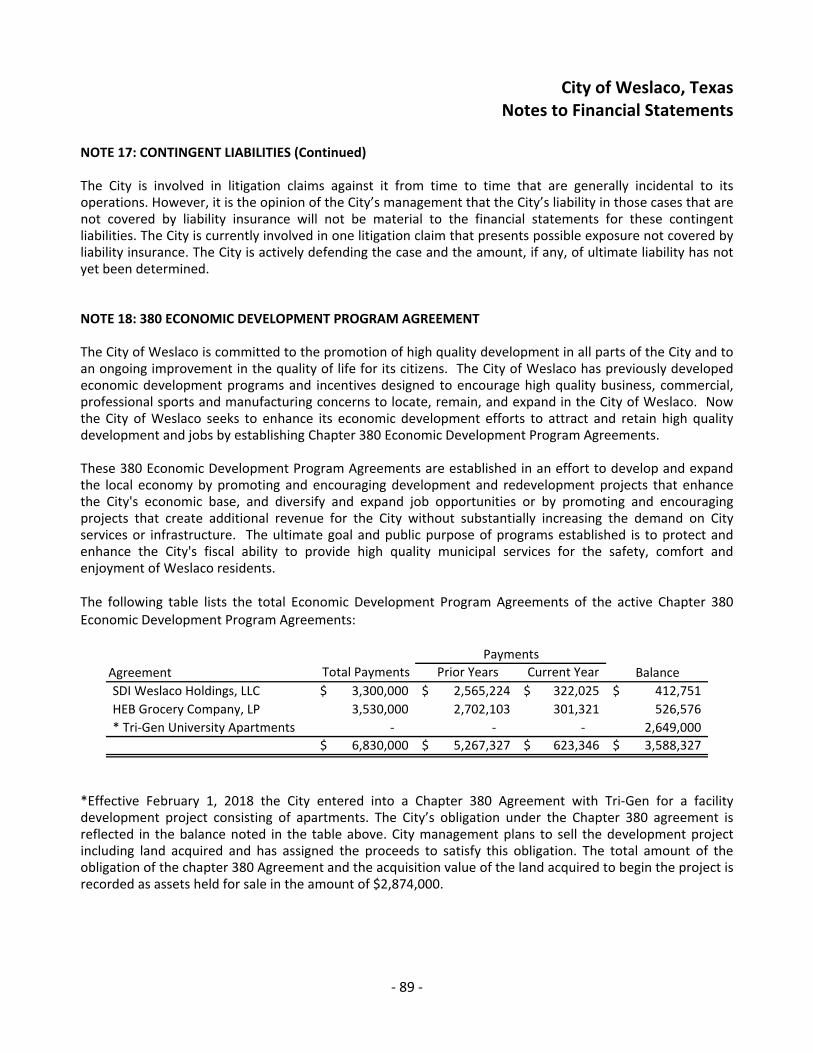
‐ 89 ‐
City of Weslaco, Texas Notes to Financial Statements
NOTE 17: CONTINGENT LIABILITIES (Continued) The City is involved in litigation claims against it from time to time that are generally incidental to its operations. However, it is the opinion of the City’s management that the City’s liability in those cases that are not covered by liability insurance will not be material to the financial statements for these contingent liabilities. The City is currently involved in one litigation claim that presents possible exposure not covered by liability insurance. The City is actively defending the case and the amount, if any, of ultimate liability has not yet been determined.
NOTE 18: 380 ECONOMIC DEVELOPMENT PROGRAM AGREEMENT
The City of Weslaco is committed to the promotion of high quality development in all parts of the City and to an ongoing improvement in the quality of life for its citizens. The City of Weslaco has previously developed economic development programs and incentives designed to encourage high quality business, commercial, professional sports and manufacturing concerns to locate, remain, and expand in the City of Weslaco. Now the City of Weslaco seeks to enhance its economic development efforts to attract and retain high quality development and jobs by establishing Chapter 380 Economic Development Program Agreements. These 380 Economic Development Program Agreements are established in an effort to develop and expand the local economy by promoting and encouraging development and redevelopment projects that enhance the City's economic base, and diversify and expand job opportunities or by promoting and encouraging projects that create additional revenue for the City without substantially increasing the demand on City services or infrastructure. The ultimate goal and public purpose of programs established is to protect and enhance the City's fiscal ability to provide high quality municipal services for the safety, comfort and enjoyment of Weslaco residents. The following table lists the total Economic Development Program Agreements of the active Chapter 380 Economic Development Program Agreements:
Agreement Total Payments Prior Years Current Year Balance
SDI Weslaco Holdings, LLC 3,300,000$ 2,565,224$ 322,025$ 412,751$
HEB Grocery Company, LP 3,530,000 2,702,103 301,321 526,576
* Tri‐Gen University Apartments ‐ ‐ ‐ 2,649,000
6,830,000$ 5,267,327$ 623,346$ 3,588,327$
Payments
*Effective February 1, 2018 the City entered into a Chapter 380 Agreement with Tri‐Gen for a facility development project consisting of apartments. The City’s obligation under the Chapter 380 agreement is reflected in the balance noted in the table above. City management plans to sell the development project including land acquired and has assigned the proceeds to satisfy this obligation. The total amount of the obligation of the chapter 380 Agreement and the acquisition value of the land acquired to begin the project is recorded as assets held for sale in the amount of $2,874,000.

‐ 90 ‐
City of Weslaco, Texas Notes to Financial Statements
NOTE 18: 380 ECONOMIC DEVELOPMENT PROGRAM AGREEMENT‐ (Continued) Sales Tax Rebate Agreements In addition to the Chapter 380 Agreements, the City also offered sales rebates as additional incentives to the developer and retail establishments, locating within the SDI development project. These rebates are not recorded as a liability or commitment, as the individual amounts are not known until the sales taxes are collected. The total rebates have been set at $10,500,000. These are to be reimbursed over ten years, beginning April 1, 2011. Total reimbursed sales tax proceeds to date is $5,833,367, of which $591,644 is current proceeds reimbursed. Total rebates balance owed is $4,666,633.
NOTE 19: FUND BALANCES Nonspendable –balances that cannot be spent because they are not expected to be converted to cash or they are legally or contractually required to remain intact. Restricted – external parties have restricted these funds to be used for their intended purpose. Committed – the City Commission has authorized the City to use these funds for specifically identified purposes. Unassigned – the unassigned fund balance has no constraints. The City of Weslaco reported fund balances in the following classifications as of September 30, 2020:
General
2019 Bond
Construction
Other
Governmental Component
Fund Fund Funds Total Unit
Nonspendable:
Inventories 9,055$ ‐$ ‐$ 9,055$ ‐$
Prepaid items 10,306 ‐ ‐ 10,306 ‐
Nonspendable total 19,361 ‐ ‐ 19,361 ‐
Restricted for:
Street improvements and other capital
projects ‐ 8,856,054 3,166,768 12,022,822 ‐
Tourism ‐ ‐ 702,921 702,921 ‐
Library activities ‐ ‐ 14,364 14,364 ‐
Project development ‐ ‐ 167,552 167,552 ‐
Debt Service ‐ ‐ 526,173 526,173 ‐
Restricted total ‐ 8,856,054 4,577,778 13,433,832 ‐
Assigned:
Assigned for debt service ‐ ‐ ‐ ‐ 320,000
Assigned for capital projects ‐ ‐ 1,455,433 1,455,433 ‐
Assigned for chapter 380 agreement 2,874,000 ‐ ‐ 2,874,000 ‐
Total assigned 2,874,000 ‐ 1,455,433 4,329,433 320,000
Unassigned 9,151,461 ‐ ‐ 9,151,461 6,263,923
Total Fund Balance 12,044,822$ 8,856,054$ 6,033,211$ 26,934,087$ 6,583,923$

‐ 91 ‐
City of Weslaco, Texas Notes to Financial Statements
NOTE 20: NET POSITION Net position is composed of three categories: net investment in capital assets, restricted and unrestricted.
Governmental Business‐type Component
Activities Activities Unit
Net investment in capital assets:
Capital assets, net of accumulated depreciation 53,904,990$ 100,224,704$ 4,950,721$
Less related liabilities (29,489,997) (51,158,091) ‐
Less unamortized bond premium (1,832,879) (4,424,654) ‐
Plus deferred charge on refunding 178,082 1,778,044 ‐
Plus unexpended bond proceeds 12,022,439 1,216,210 ‐
Net investment in capital assets 34,782,635 47,636,213 4,950,721
Restricted net position consists of the following:
Debt service 526,173 999,333 320,000
Tourism 702,921 ‐ ‐
Library activities 14,364 ‐ ‐
Building depreciation fund 167,552 ‐ ‐
Capital projects ‐ 13,590 ‐
Restricted net position 1,411,010 1,012,923 320,000
Unrestricted net position (4,471,815) (2,290,173) 8,603,477
Total net position 31,721,830$ 46,358,963$ 13,874,198$
NOTE 21: RELATED PARTY TRANSACTIONS On November 20, 2019, the City of Weslaco entered into a promissory note with the Economic Development Corporation of Weslaco for $1,450,810 for the purchase of land. Interest on the note is payable on June 20 and December 20 of each year commencing on June 20, 2020 and annual principal payments of $53,765 beginning December 20, 2020, continuing annually thereafter until December 20, 2024 at which time total principal plus interest is due. The interest rate is fixed at 3.00%. The note is secured by a vendor’s lien and superior title. During the fiscal year ended September 30, 2020, the City of Weslaco, Texas reimbursed the Economic Development Corporation of Weslaco a total of $307,567. The reimbursement was for the following cost sharing expenditures: $300,000 for Weslaco Small Business Loan Grants, $1,400 for advertising and promotion, and $6,167 for repairs. NOTE 22: UNCERTAINTIES In March 2020, the World Health Organization made the assessment that the outbreak of a novel coronavirus (COVID‐19) can be characterized as a pandemic. As a result, uncertainties have arisen that may have a significant negative impact on the operating activities and results of the City. The occurrence and extent of such an impact will depend on future developments, including (i) the duration and spread of the virus, (ii) government quarantine measures, (iii) voluntary and precautionary restrictions on travel or meetings, (iv) the effects on the financial markets, and (v) the effects on the economy overall, all of which are uncertain.

‐ 93 ‐
REQUIRED SUPPLEMENTARY INFORMATION

‐ 92 ‐
City of Weslaco, Texas Schedule of Revenues, Expenditures and
Changes in Fund Balance‐ Budget and Actual General Fund
For the Year Ended September 30, 2020
VarianceFinal BudgetPositive
Original Final Actual (Negative)
9,834,485$ 9,834,485$ 9,619,717$ (214,768)$ 12,034,797 12,005,797 12,309,448 303,651 2,888,590 2,493,590 2,271,717 (221,873) 595,116 408,316 356,116 (52,200) 574,029 587,029 653,513 66,484
1,066,753 2,813,773 6,120,352 3,306,579 203,000 203,000 162,416 (40,584) 182,714 176,014 320,215 144,201
27,379,484 28,522,004 31,813,494 3,291,490
126,097 136,097 119,642 16,455 359,920 379,288 383,953 (4,665) 389,574 369,574 323,268 46,306 872,291 867,791 893,530 (25,739) 279,135 290,035 318,544 (28,509) 836,008 848,508 806,000 42,508 257,274 257,274 254,588 2,686
Planning & Code Enforcement 1,373,680 1,378,680 1,282,785 95,895 Information Technology 1,259,786 1,254,786 1,049,350 205,436 Law 313,460 302,460 343,665 (41,205) Non‐departmental activities 682,392 682,392 654,974 27,418
6,749,617 6,766,885 6,430,299 336,586
8,662,687 9,969,788 8,881,026 1,088,762 6,279,927 6,279,927 7,003,538 (723,611)
325,900 323,900 309,396 14,504 53,576 165,576 1,066,538 (900,962)
15,322,090 16,739,191 17,260,498 (521,307)
Public Works Administration 286,551 285,451 277,266 8,185 Streets Department 1,278,145 1,318,145 1,283,571 34,574 Drain Ditch Department 718,592 757,592 988,900 (231,308) Fleet Maintenance Shop Department 362,952 362,952 279,715 83,237
2,646,240 2,724,140 2,829,452 (105,312)
Parks & Recreation Department 832,881 797,881 644,232 153,649 Library Department 921,834 872,834 815,702 57,132
1,754,715 1,670,715 1,459,934 210,781
584,785 584,785 591,644 (6,859)
665,090 665,090 879,965 (214,875) 36,291 36,291 36,291 ‐
Total debt service 701,381 701,381 916,256 (214,875)
27,758,828 29,187,097 29,488,083 (300,986)
(379,344) (665,093) 2,325,411 2,990,504
Budget
REVENUESProperty taxes ‐ including penalty and interestNonproperty taxesFees and chargesFines and forfeituresLicenses and permitsIntergovernmental
Miscellaneous
City SecretaryFinanceHuman resourcesBuilding MaintenanceMunicipal Court
Total revenues
EXPENDITURES General government
City CommissionCity Manager
Emergency Management Department Total public safety
Public works
Total general government
Public safetyPolice DepartmentFire DepartmentEmergency Medical Services Department
Total public works
Culture and Recreation
Debt servicePrincipal retirement Interest and fees
Investement income
Total culture and recreation
Other Economic Development
Total expenditures
EXCESS OF REVENUES OVER EXPENDITURES

‐ 93 ‐
City of Weslaco, Texas Schedule of Revenues, Expenditures and
Changes in Fund Balance‐ Budget and Actual General Fund‐ Continued
For the Year Ended September 30, 2020
VarianceFinal BudgetPositive
Original Final Actual (Negative)
48,095$ 48,095$ ‐$ (48,095)$ 1,690,561 1,690,561 2,683,817 993,256 (1,370,000) (1,610,000) (2,315,086) 705,086
368,656 128,656 368,731 240,075
NET CHANGE IN FUND BALANCE (10,688)$ (536,437)$ 2,694,142 3,230,579$
10,844,329 Prior period adjustment (1,493,649) Fund balances at beginning of year, adjusted 9,350,680
12,044,822$
Budget
OTHER FINANCING SOURCES (USES)Sale of capital assetsTransfers inTransfers out
Total other financing sources
Fund balance ‐‐ beginning
Fund balance ‐‐ ending
The accompanying notes to required supplementary information are an integral part of this schedule.

‐ 94 ‐
City of Weslaco, Texas Schedule of Changes in Net Pension Liability and Related Ratios‐ Texas Municipal
Retirement System
For the Plan Years Ended December 31, 2019 2018 2017 2016 2015 2014
Total Pension Liability
Service cost 1,548,576$ 1,489,094$ 1,511,814$ 1,414,112$ 1,184,809$ 1,162,103$
Interest (on the total pension liability) 3,140,037 2,968,169 2,805,747 2,738,324 2,603,802 2,504,972
Changes of benefit terms ‐ ‐ ‐ ‐ ‐ ‐
Difference between expected and actual experience (156,422) 155,641 93,970 (1,124,865) 734,282 (303,648)
Changes of assumptions 112,715 ‐ ‐ ‐ 828,135 ‐
Benefit payments, including refunds of
employee contributions (2,117,240) (2,075,643) (1,912,199) (2,242,933) (1,947,228) (1,978,636)
Net change in total pension liability 2,527,666 2,537,261 2,499,332 784,638 3,403,800 1,384,791
Total pension liability – beginning 46,803,406 44,266,145 41,766,813 40,982,175 37,578,375 36,193,584
Total pension liability – ending (a) 49,331,072$ 46,803,406$ 44,266,145$ 41,766,813$ 40,982,175$ 37,578,375$
Plan Fiduciary Net Position
Contributions – employer 871,252 833,181$ 741,999$ 572,328$ 561,365$ 542,202$
Contributions – employee 761,861 729,948 710,237 662,199 611,176 591,732
Net investment income 5,707,131 (1,157,250) 4,762,284 2,240,914 50,055 1,882,469
Benefit payments, including refunds of
employee contributions (2,117,240) (2,075,643) (1,912,199) (2,242,933) (1,947,228) (1,978,636)
Administrative expense (32,286) (22,377) (24,692) (25,318) (30,493) (19,657)
Other (971) (1,169) (1,251) (1,365) (1,506) (1,616)
Net change in plan fiduciary net position 5,189,747 (1,693,310) 4,276,378 1,205,825 (756,631) 1,016,494
Plan fiduciary net position – beginning 36,960,062 38,653,372 34,376,994 33,171,169 33,927,800 32,911,306
Plan fiduciary net position – ending (b) 42,149,809$ 36,960,062$ 38,653,372$ 34,376,994$ 33,171,169$ 33,927,800$
Net Pension Liability – Ending (a) – (b) 7,181,263$ 9,843,344$ 5,612,773$ 7,389,819$ 7,811,006$ 3,650,575$
Plan fiduciary net position as a percentage
of total pension liability 85.44% 78.97% 87.32% 82.31% 80.94% 90.29%
Covered payroll 10,851,968$ 10,427,824$ 10,119,236$ 9,452,621$ 8,731,090$ 8,453,317$
Net pension liability as a percentage
of covered payroll 66.17% 94.39% 55.47% 78.18% 89.46% 43.19%
GASB 68 requires 10 fiscal years of data to be provided in this schedule. However, until a full 10‐year trend is compiled, this schedule provides the information of those years for which information is available.

‐ 95 ‐
City of Weslaco, Texas Schedule of Changes in Net Pension Liability and Related Ratios‐ Firemen’s Pension
For the Plan Years Ended September 30, 2020 2019 2018 2017 2016 2015
Total Pension Liability
Service cost 594,954$ 555,465$ 497,258$ 463,644$ 421,208$ 398,097$
Interest (on the total pension liability) 1,235,267 1,159,947 1,087,522 995,631 848,579 845,051
Changes of benefit terms 514,707 ‐ ‐ 445,218 427,638 ‐
Difference between expected and actual experience (270,772) ‐ (99,445) ‐ 479,811 ‐
Changes of assumptions 286,156 ‐ ‐ ‐ (226,052) ‐
Benefit payments, including refunds of
employee contributions (595,725) (832,135) (764,180) (548,162) (645,296) (833,923)
Net change in total pension liability 1,764,587 883,277 721,155 1,356,331 1,305,888 409,225
Total pension liability – beginning 16,735,864 15,852,587 15,131,432 13,775,101 12,469,213 12,059,988
Total pension liability – ending (a) 18,500,451$ 16,735,864$ 15,852,587$ 15,131,432$ 13,775,101$ 12,469,213$
Plan Fiduciary Net Position
Contributions – employer 599,436$ 519,826$ 516,557$ 483,771$ 440,112$ 394,360$
Contributions – employee 599,436 513,232 509,963 476,078 425,463 388,865
Net investment income 328,295 207,493 928,177 882,963 755,912 (127,198)
Benefit payments, including refunds of
employee contributions (595,725) (832,135) (764,180) (548,162) (645,296) (833,923)
Administrative expense (28,930) (55,756) (42,719) (51,417) (45,252) (85,190)
Other ‐ ‐ ‐ ‐ ‐ ‐
Net change in plan fiduciary net position 902,512 352,660 1,147,798 1,243,233 930,939 (263,086)
Plan fiduciary net position – beginning 11,929,839 11,577,179 10,429,381 9,186,148 8,255,209 8,518,295
Plan fiduciary net position – ending (b) 12,832,351$ 11,929,839$ 11,577,179$ 10,429,381$ 9,186,148$ 8,255,209$
Net Pension Liability – Ending (a) – (b) 5,668,100$ 4,806,025$ 4,275,408$ 4,702,051$ 4,588,953$ 4,214,004$
Plan fiduciary net position as a percentage
of total pension liability 69.36% 71.28% 73.03% 68.93% 66.69% 66.20%
Covered payroll 4,995,300$ 4,276,933$ 4,249,692$ 3,967,317$ 3,545,525$ 3,119,208$
Net pension liability as a percentage
of covered payroll 113.47% 112.37% 100.61% 118.52% 129.43% 135.10%
GASB 68 requires 10 fiscal years of data to be provided in this schedule. However, until a full 10‐year trend is compiled, this schedule provides the information of those years for which information is available.

‐ 96 ‐
City of Weslaco, Texas Schedule of Contributions
For Texas Municipal Retirement System Pension Plan and Firemen’s Pension Plan
For the years ended September 30, 2020 2019 2018 2017 2016 2015
Primary Government‐ Texas Municipal Retirement System
Actuarial determined contribution 946,759$ 858,290$ 817,077$ 714,301$ 613,090$ 562,443$
Contributions in relation to actuarially
determined contribution (946,759) (858,290) (817,077) (714,301) (613,090) (562,443)
Contribution deficiency (excess) ‐ ‐ ‐ ‐ ‐ ‐
Covered payroll 11,267,095$ 10,731,656$ 10,428,523$ 9,900,449$ 9,710,623$ 8,538,660$
Contributions as a percentage of
covered payroll 8.40% 8.00% 7.84% 7.21% 6.31% 6.59%
For the years ended September 30, 2020 2019 2018 2017 2016 2015
Primary Government‐ Firemen's Pension
Actuarial determined contribution 599,436$ 513,232$ 516,557$ 476,078$ 425,463$ 379,251$
Contributions in relation to actuarially
determined contribution (599,436) (519,826) (516,557) (483,771) (440,112) (394,360)
Contribution deficiency (excess) ‐ (6,594) ‐ (7,693) (14,649) (15,109)
Covered payroll 4,995,300$ 4,276,933$ 4,249,692$ 3,967,317$ 3,545,525$ 3,119,208$
Contributions as a percentage of
covered payroll 12.00% 12.00% 12.16% 12.00% 12.00% 12.16%
GASB 68 requires 10 fiscal years of data to be provided in this schedule. However, until a full 10‐year trend is compiled, this schedule provides the information of those years for which information is available.

‐ 97 ‐
City of Weslaco, Texas Schedule of Changes in Total OPEB Liability and Related Ratios
Texas Municipal Retirement System‐ Supplemental Death Benefits Fund
For the Plan Year ended December 31, 2019 2018 2017
Total OPEB Liability
Service cost 24,960$ 27,112$ 22,262$
Interest (on the total OPEB liability) 26,224 24,287 23,866
Changes of benefit terms ‐ ‐ ‐
Difference between expected and actual experience (15,235) (19,296) ‐
Change of assumputions 144,552 (52,100) 60,004
Benefit payments, including refunds of employee contributions (5,425) (6,257) (6,072)
Net Change in Total OPEB Liability 175,076 (26,254) 100,060
Total OPEB Liability ‐ Beginning 697,077 723,331 623,272
Total OPEB Liability ‐ Ending (a) 872,153$ 697,077$ 723,332$
Covered Employee Payroll 10,851,968$ 10,427,824$ 10,119,236$
Total OPEB Liability as a Percentage of Covered Employee Payroll 8.04% 6.68% 7.15%
Notes to Schedule:
(1) Schedule is intended to show 10 years. Additional years will be presented as the information becomes available.
(2) No assets are accumulated in a trust that meets the criteria in paragraph 4 of GASB Statement No. 75 to pay related benefits.
(3) Due to the SDBF being considered an unfunded OPEB plan under GASB Statement No. 75, benefit payments are treated as being equal to the employer’s yearly contribution for retirees.

‐ 98 ‐
City of Weslaco, Texas Schedule of Changes in Total OPEB Liability and Related Ratios
Firefighter Retiree Health Care Plan
For the Plan Year ended September 30, 2020 2019 2018
Total OPEB Liability
Service cost 194,173$ 148,081$ 152,688$
Interest (on the total OPEB liability) 72,446 80,682 69,225
Changes of benefit terms (847,947) ‐ ‐
Difference between expected and actual experience 15,219 ‐ ‐
Change of assumputions 147,060 267,652 (73,262)
Benefit payments, including refunds of employee contributions (14,704) (12,780) (5,084)
Net Change in Total OPEB Liability (433,753) 483,635 143,567
Total OPEB Liability ‐ Beginning 2,454,914 1,971,279 1,827,712
Total OPEB Liability ‐ Ending (a) 2,021,161$ 2,454,914$ 1,971,279$
Covered Employee Payroll 4,995,300$ 4,276,933$ 4,249,692$
Total OPEB Liability as a Percentage of Covered Employee Payroll 40.46% 57.40% 46.39%
Notes to Schedule:
(1) Schedule is intended to show 10 years. Additional years will be presented as the information becomes available.
(2) No assets are accumulated in a trust that meets the criteria in paragraph 4 of GASB Statement No. 75 to pay related benefits.
(3) Due to the Firefighter Retiree Health Care Plan being considered an unfunded OPEB plan under GASB Statement No. 75, benefit payments are treated as being equal to the employer’s yearly contribution for retirees.

‐ 99 ‐
City of Weslaco, Texas Notes to Schedule of Contributions
For Texas Municipal Retirement System Pension Plan and Firemen’s Pension Plan
Texas Municipal Retirement System Pension Plan Valuation Date: Actuarially determined contribution rates are calculated as December
31 and become effective in January 13 months later. Methods and Assumptions Used to Determine Contribution Rates: Actuarial Cost Method Entry Age Normal Amortization Method Level Percentage of Payroll, Closed Remaining Amortization Period 25 Years Asset Valuation Method 10 Year Smoothed Market; 15% Soft Corridor Inflation 2.5% Salary Increases 3.5% to 10.5% including inflation Investment Rate of Return 6.75% Retirement Age Experience – based table based on rates that are specific to the City’s
plan of benefits. Last updated for the 2015 valuation pursuant to an experience study of the period 2010 – 2014.
Mortality RP2000 Combined Mortality Table with Blue Collar Adjustment with
male rates multiplied by 109% and female rates multiplied by 103% and projected on a fully generational basis with scale BB.
Other Information: 1) Granted 30% ad hoc COLA. 2) Granted 50% ad hoc USC with
transfer. Firemen’s Pension Contributions to the fund are based on negotiations between the members and the City rather than an actuarially determined rate. The funding policy of the Weslaco Firemen’s Relief and Retirement Fund requires contributions from both the City and the firefighters. The City’s contribution rate is currently 12.0% of member payroll for firefighters. Each active member contributes 12.0% of member payroll. The base benefit was increased from 2.5% to 2.65% per year of service, with a maximum of 20 years. This change increased the service retirement and pre‐retirement death benefit. There have been no other plan changes since the prior valuation. There were no changes to actuarial methods since the prior valuation. The mortality assumption was updated to the Society of Actuaries Public Safety 2010 tables with generational projection using Scale MP‐2019. There have been no other assumption changes since the prior valuation. The investment rate of return was 7.25%.
‐ 100 ‐
City of Weslaco, Texas Notes to Required Supplementary Information
Budgetary Information
The City adheres to the following procedures in establishing the budgetary data reflected in the financial statements:
a) The city manager prepares a proposed budget for the next succeeding fiscal year and submits it to the Commission prior to October 1. The recommended budget includes proposed expenditures and the sources of receipts to finance them.
b) Complete copies of the proposed budget are made available for public inspection. Public hearings are conducted to obtain taxpayers’ comments.
c) The budget is enacted through passage of an ordinance and becomes the basis for the tax rates levied by the commission.
d) The city manager is authorized to transfer budgeted amounts between line items within a department; however, any revisions that alter the total expenditures of any department must be approved by the council. Expenditures may not exceed legal appropriations at the department level. All appropriations lapse at year end.
e) Formal budgetary integration is employed as a management control device during the year for the General, Hotel/Motel Tax ‐ Special Revenue, Debt Service Fund, and Capital Improvement Program and Fire Department Equipment Replacement‐ capital project funds. In addition, the Water and Wastewater, Solid Waste, and Airport Proprietary Funds and the Equipment Replacement Internal Service Fund also employ formal budgetary integration as a management control device during the year. Budgets for these funds are adopted on a basis consistent with Generally Accepted Accounting Principles (GAAP).
f) Budgets are legally adopted on a basis consistent with GAAP except for transfers, debt service, and certain intragovernment amounts.
g) The budgetary comparison schedule shown in the accompanying required supplementary
information presents comparisons of the legally adopted budget, as amended, with actual results. The originally adopted budget is presented for purposes of comparison to the final, amended budget.

‐ 85 ‐
OTHER SUPPLEMENTARY INFORMATION

‐ 101 ‐
City of Weslaco, Texas Non‐Major Governmental Fund Statements and Component Unit
Special revenue fund: Hotel/Motel Tax Fund was established to account for monies collected from local hotel occupancy taxes. The funds are used for expenditures that enhance and promote tourism and benefit the convention and hotel industry. Special revenue fund: Library Fund was established to account for monies that have been collected from the sole use of the city’s Library through fund raising donations from various charitable organizations. Special revenue fund: Building Depreciation Fund was established to account for monies that have been collected from the rental agreement between the City and Weslaco Economic Development Corporation for the Weslaco Business Visitor and Event Center. Capital project fund: Capital Improvement Fund was established to account for financial resources to be used for the acquisition or construction of major capital facilities. Capital project fund: Fire Department Equipment Replacement fund is used to fund an apparatus replacement program for all fire and emergency medical services. Capital project fund: 2013 Certificate of Obligation Construction Fund was established to account for improvements to streets, parks, downtown, and the City’s cemetery. Capital project fund: Stormwater Improvement Fund was established to account for improvements to drainage throughout the City. Debt Service Fund: Debt Service Fund is used to account for the accumulation of financial resources for the payment of principal, interest and related costs on general long‐term debt paid primarily from taxes levied by the City. The fund balance of the Debt Service Fund is restricted to signify the amounts that are restricted exclusively for debt service expenditures. Debt Service Fund: 2019 Series Debt Service Fund is used to account for the accumulation of financial resources for the payment of principal, interest and related costs on the 2019 Series General Obligation Bonds primarily from taxes levied by the City. The fund balance of the 2019 Series Debt Service Fund is restricted to signify the amounts that are restricted exclusively for debt service expenditures.
Weslaco Economic Development Corporation (EDC): The five‐member board of directors is appointed by the City Commission. The EDC is authorized to administer the distribution of the proceeds of any development bonds issued and the proceeds of certain development sales taxes received on behalf of the City. The EDC’s operational and capital budget must be approved by the City Commission.

‐ 102 ‐
City of Weslaco, Texas Non‐Major Governmental Funds Combining Balance Sheet
September 30, 2020
Capital Projects Fund
Fire Department
Hotel/ Building Capital Equipment
Motel Tax Library Depreciation Improvement Replacement
Fund Fund Fund Fund Fund
Assets
Cash and cash equivalents 573,022$ 14,364$ 158,401$ 283,059$ 286,422$
Investments ‐ ‐ ‐ 909,862 ‐
Receivables (net of allowance for uncollectibles):
Ad valorem taxes ‐ ‐ ‐ ‐ ‐
Other 193,106 ‐ 9,151 ‐ ‐
Due from other funds ‐ ‐ ‐ ‐ ‐
Total Assets 766,128$ 14,364$ 167,552$ 1,192,921$ 286,422$
Liabilities
Accounts payable 63,207$ ‐$ ‐$ 23,910$ ‐$
Due to other funds ‐ ‐ ‐ ‐ ‐
Total Liabilities 63,207 ‐ ‐ 23,910 ‐
Deferred Inflows of Resources
Unavailable revenue‐ ad valorem taxes ‐ ‐ ‐ ‐ ‐
Total Deferred Inflows of Resources ‐ ‐ ‐ ‐ ‐
Fund Balances
Restricted 702,921 14,364 167,552 ‐ ‐
Assigned ‐ ‐ ‐ 1,169,011 286,422
Total Fund Balance 702,921 14,364 167,552 1,169,011 286,422
Total Liabilities, Deferred Inflows of Resources
and Fund Balances 766,128$ 14,364$ 167,552$ 1,192,921$ 286,422$
Special Revenue Funds

‐ 103 ‐
Capital Projects Fund
2013
Certificate of 2019 Total
Obligation Stormwater Series Non Major
Construction Improvement Debt Service Debt Service Governmental
Fund Fund Total Fund Fund Funds
986,374$ 2,108,287$ 4,409,929$ 381,990$ ‐$ 4,791,919$
55,474 ‐ 965,336 21,483 ‐ 986,819
‐ ‐ ‐ 268,769 18,263 287,032
24,597 ‐ 226,854 ‐ ‐ 226,854
‐ ‐ ‐ 75,736 7,003 82,739
1,066,445$ 2,108,287$ 5,602,119$ 747,978$ 25,266$ 6,375,363$
‐$ 7,964$ 95,081$ ‐$ ‐$ 95,081$
‐ ‐ ‐ ‐ 10,432 10,432
‐ 7,964 95,081 ‐ 10,432 105,513
‐ ‐ ‐ 223,948 12,691 236,639
‐ ‐ ‐ 223,948 12,691 236,639
1,066,445 2,100,323 4,051,605 524,030 2,143 4,577,778
‐ ‐ 1,455,433 ‐ ‐ 1,455,433
1,066,445 2,100,323 5,507,038 524,030 2,143 6,033,211
1,066,445$ 2,108,287$ 5,602,119$ 747,978$ 25,266$ 6,375,363$
Debt Service Funds

‐ 104 ‐
City of Weslaco, Texas Non‐Major Governmental Funds Combining Statement of Revenues, Expenditures, and
Changes in Fund Balances
For the Fiscal Year Ended September 30, 2020
Capital Projects Funds
Fire Department
Hotel/ Building Capital Equipment
Motel Tax Library Depreciation Improvement Replacement
Fund Fund Fund Fund Fund
Revenues
Property taxes ‐$ ‐$ ‐$ ‐$ ‐$
Nonproperty taxes 381,039 ‐ ‐ ‐ ‐
Fees and charges ‐ ‐ 113,322 ‐ ‐
Intergovernmental ‐ ‐ ‐ 100,000 ‐
Investment income ‐ ‐ ‐ ‐ ‐
Miscellaneous ‐ ‐ ‐ ‐ ‐
Total Revenue 381,039 ‐ 113,322 100,000 ‐
Expenditures
General government ‐ ‐ ‐ ‐ ‐
Public safety ‐ ‐ ‐ 1,794,183 ‐
Public works ‐ ‐ ‐ 653,740 ‐
Culture and recreation 360,793 ‐ 1,400 204,737 ‐
Debt service:
Principal ‐ ‐ ‐ 203,631 285,613
Interest and fees ‐ ‐ ‐ 48,214 41,410
Total Expenditures 360,793 ‐ 1,400 2,904,505 327,023
Excess (deficiency) of revenues
over expenditures 20,246 ‐ 111,922 (2,804,505) (327,023)
Other financing sources (uses)
Sale of capital assets ‐ ‐ ‐ 194,261 ‐
Issuance of debt ‐ ‐ ‐ 440,000 ‐
Transfers in ‐ ‐ ‐ 1,520,000 192,573
Total other financing sources (uses) ‐ ‐ ‐ 2,154,261 192,573
Net change in fund balances 20,246 ‐ 111,922 (650,244) (134,450)
Fund balances‐ beginning of year 682,675 14,364 55,630 1,819,255 420,872
Fund balances at end of year 702,921$ 14,364$ 167,552$ 1,169,011$ 286,422$
Special Revenue Funds

‐ 105 ‐
2013
Certificate of 2019 Total
Obligation Stormwater Series Non Major
Construction Improvement Debt Service Debt Service Governmental
Fund Fund Total Fund Fund Funds
‐$ ‐$ ‐$ 2,929,325$ 554,873$ 3,484,198$
‐ ‐ 381,039 ‐ ‐ 381,039
‐ ‐ 113,322 ‐ ‐ 113,322
5,525 ‐ 105,525 ‐ ‐ 105,525
‐ ‐ ‐ 37,827 ‐ 37,827
‐ ‐ ‐ ‐ ‐ ‐
5,525 ‐ 599,886 2,967,152 554,873 4,121,911
295,087 ‐ 295,087 ‐ ‐ 295,087
‐ ‐ 1,794,183 ‐ ‐ 1,794,183
‐ 916,705 1,570,445 ‐ ‐ 1,570,445
‐ ‐ 566,930 ‐ ‐ 566,930
‐ ‐ 489,244 2,130,000 220,000 2,839,244
‐ ‐ 89,624 695,225 332,730 1,117,579
295,087 916,705 4,805,513 2,825,225 552,730 8,183,468
(289,562) (916,705) (4,205,627) 141,927 2,143 (4,061,557)
‐ ‐ 194,261 ‐ ‐ 194,261
‐ ‐ 440,000 ‐ ‐ 440,000
‐ 100,000 1,812,573 ‐ ‐ 1,812,573
‐ 100,000 2,446,834 ‐ ‐ 2,446,834
(289,562) (816,705) (1,758,793) 141,927 2,143 (1,614,723)
1,356,007 2,917,028 7,265,831 382,103 ‐ 7,647,934
1,066,445$ 2,100,323$ 5,507,038$ 524,030$ 2,143$ 6,033,211
Debt Service Funds
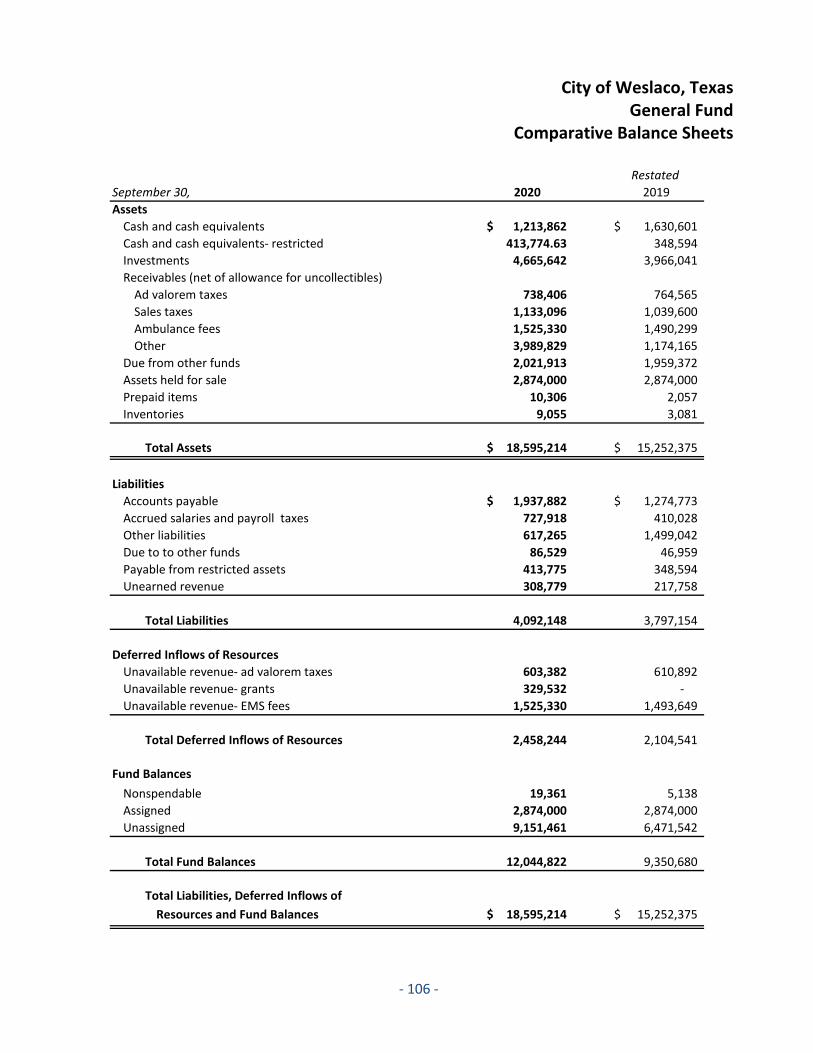
‐ 106 ‐
City of Weslaco, Texas General Fund
Comparative Balance Sheets
Restated
September 30, 2020 2019
Assets
Cash and cash equivalents 1,213,862$ 1,630,601$
Cash and cash equivalents‐ restricted 413,774.63 348,594
Investments 4,665,642 3,966,041
Receivables (net of allowance for uncollectibles)
Ad valorem taxes 738,406 764,565
Sales taxes 1,133,096 1,039,600
Ambulance fees 1,525,330 1,490,299
Other 3,989,829 1,174,165
Due from other funds 2,021,913 1,959,372
Assets held for sale 2,874,000 2,874,000
Prepaid items 10,306 2,057
Inventories 9,055 3,081
Total Assets 18,595,214$ 15,252,375$
Liabilities
Accounts payable 1,937,882$ 1,274,773$
Accrued salaries and payroll taxes 727,918 410,028
Other liabilities 617,265 1,499,042
Due to to other funds 86,529 46,959
Payable from restricted assets 413,775 348,594
Unearned revenue 308,779 217,758
Total Liabilities 4,092,148 3,797,154
Deferred Inflows of Resources
Unavailable revenue‐ ad valorem taxes 603,382 610,892
Unavailable revenue‐ grants 329,532 ‐
Unavailable revenue‐ EMS fees 1,525,330 1,493,649
Total Deferred Inflows of Resources 2,458,244 2,104,541
Fund Balances
Nonspendable 19,361 5,138
Assigned 2,874,000 2,874,000
Unassigned 9,151,461 6,471,542
Total Fund Balances 12,044,822 9,350,680
Total Liabilities, Deferred Inflows of
Resources and Fund Balances 18,595,214$ 15,252,375$

‐ 107 ‐
City of Weslaco, Texas General Fund
Comparative Statements of Revenues, Expenditures and Changes in Fund Balances
Restated
For the Fiscal Years Ended September 30, 2020 2019
Revenues
Property taxes 9,619,717$ 9,320,949$
Nonproperty taxes 12,309,448 12,055,612
Fees and charges 2,271,717 2,772,333
Fines and forfeitures 356,116 503,972
Licenses and permits 653,513 693,682
Intergovernmental 6,120,352 1,390,095
Investment income 162,416 222,974
Miscellaneous 320,215 353,746
Total Revenues 31,813,494 27,313,363
Expenditures
General government 6,430,299 6,237,293
Public safety 17,260,498 15,084,024
Public works 2,829,452 2,438,151
Culture and recreation 1,459,934 1,259,204
Economic development 591,644 590,635
Debt service:
Principal 879,965 862,483
Interest and fees 36,291 44,562
Total Expenditures 29,488,083 26,516,352
Excess (deficiency) of revenues
over expenditures 2,325,411 797,011
Other financing sources (uses):
Sale of capital assets ‐ 55,829
Transfers in 2,683,817 2,801,817
Transfers out (2,315,086) (2,444,268)
Total other financing sources (uses) 368,731 413,378
Net change in fund balances 2,694,142 1,210,389
Fund balances at beginning of year 9,350,680 9,423,776
Prior period adjustment ‐ (1,283,485)
Fund balances at beginning of year, as adjusted 9,350,680 8,140,291
Fund balances at end of year 12,044,822$ 9,350,680$

‐ 108 ‐
City of Weslaco, Texas Special Revenue Funds
Hotel/Motel Tax Comparative Balance Sheets
September 30, 2020 2019
Assets
Cash and cash equivalents 573,022$ 542,047$
Receivables (net of allowance for uncollectibles):
Other 193,106 145,967
Total assets 766,128$ 688,014$
Liabilities
Accounts payable 63,207$ 5,339$
Total liabilities 63,207 5,339
Fund balance
Restricted 702,921 682,675
Total fund balance 702,921 682,675
Total liabilities and fund balance 766,128$ 688,014$

‐ 109 ‐
City of Weslaco, Texas Special Revenue Funds
Hotel/Motel Tax Comparative Statements of Revenues, Expenditures
and Changes in Fund Balances
For the Fiscal Years Ended September 30, 2020 2019
Revenues
Nonproperty taxes 381,039$ 349,728$
Total revenues 381,039 349,728
Expenditures
Culture and recreation 360,793 304,759
Total expenditures 360,793 304,759
Net change in fund balances 20,246 44,969
Fund balances at beginning of year 682,675 637,706
Fund balances at end of year 702,921$ 682,675$

‐ 110 ‐
City of Weslaco, Texas Special Revenue Funds
Schedule of Revenues, Expenditures and Changes in Fund Balance‐ Budget and Actual‐
Hotel/Motel Tax
Variance
With
Original Final Actual Final Budget
Revenues
Nonproperty taxes 360,000$ 360,000$ 381,039$ 21,039$
Expenditures
Culture and recreation
Parks & recreation department 437,760 437,760 360,793 76,967
Net change in fund balances (77,760)$ (77,760)$ 20,246$ 98,006$
Fund balances at beginning of year 682,675
Fund balances at end of year 702,921$
Budget
For the Fiscal Year Ended September 30, 2020

‐ 111 ‐
City of Weslaco, Texas Special Revenue Funds
Library Fund Comparative Balance Sheets
September 30, 2020 2019
Assets
Cash and cash equivalents 14,364$ 14,364$
Total assets 14,364$ 14,364$
Liabilities ‐$ ‐$
Total liabilities ‐ ‐
Fund balance
Restricted 14,364 14,364
Total fund balances 14,364 14,364
Total liabilities and fund balance 14,364$ 14,364$
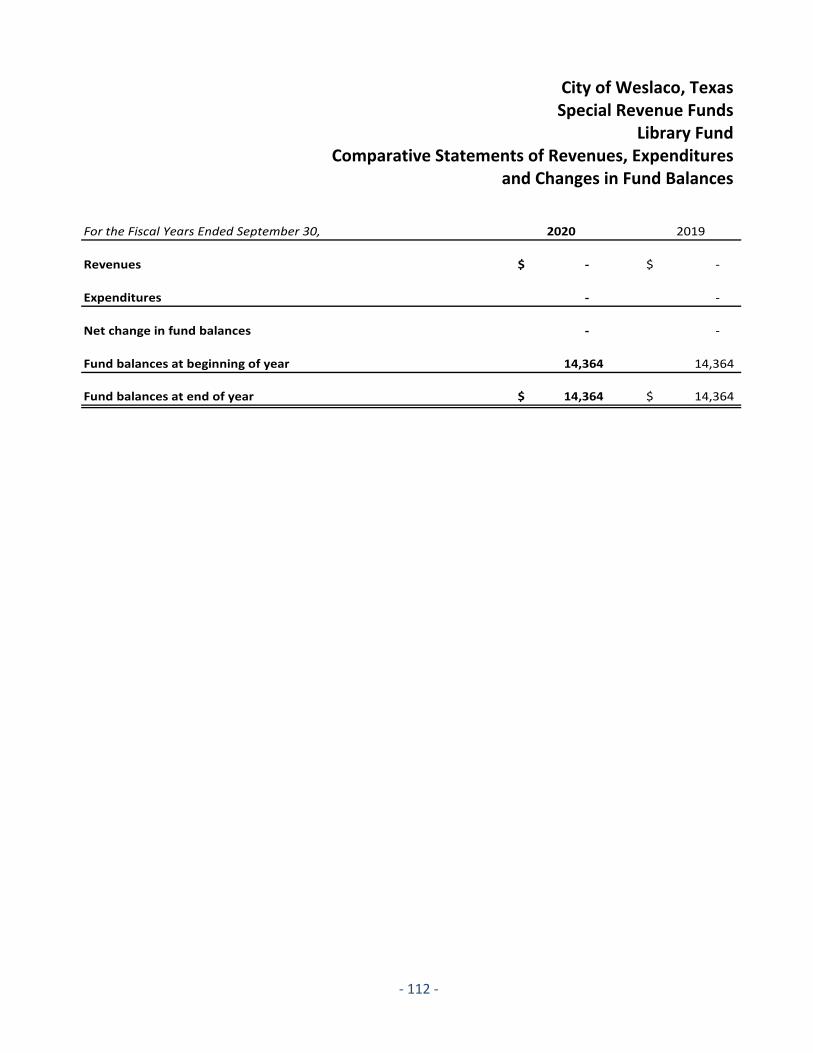
‐ 112 ‐
City of Weslaco, Texas Special Revenue Funds
Library Fund Comparative Statements of Revenues, Expenditures
and Changes in Fund Balances
For the Fiscal Years Ended September 30, 2020 2019
Revenues ‐$ ‐$
Expenditures ‐ ‐
Net change in fund balances ‐ ‐
Fund balances at beginning of year 14,364 14,364
Fund balances at end of year 14,364$ 14,364$

‐ 113 ‐
City of Weslaco, Texas Special Revenue Funds
Building Depreciation Fund Comparative Balance Sheets
September 30, 2020 2019
Assets
Cash and cash equivalents 158,401$ 91,263$
Receivables (net of allowance for uncollectibles):
Other 9,151 ‐
Total assets 167,552$ 91,263$
Liabilities
Accounts payable ‐$ 35,633$
Total liabilities ‐ 35,633
Fund balance
Restricted 167,552 55,630
Total fund balance 167,552 55,630
Total liabilities and fund balance 167,552$ 91,263$

‐ 114 ‐
City of Weslaco, Texas Special Revenue Funds
Building Depreciation Fund Comparative Statements of Revenues, Expenditures
and Changes in Fund Balances
For the Fiscal Years Ended September 30, 2020 2019
Revenues
Fees and charges 113,322$ 112,463$
Total revenues 113,322 112,463
Expenditures
Culture and recreation 1,400 56,833
Total expenditures 1,400 56,833
Net change in fund balances 111,922 55,630
Fund balances at beginning of year 55,630 ‐
Fund balances at end of year 167,552$ 55,630$

‐ 115 ‐
City of Weslaco, Texas Capital Projects Funds
2013 Certificates of Obligation Construction Fund Comparative Balance Sheets
September 30, 2020 2019
Assets
Cash and cash equivalents 986,374$ 1,745,085$
Investments 55,474 271,696
Receivables (net of allowance for uncollectibles):
Other 24,597 24,597
Total assets 1,066,445$ 2,041,378$
Liabilities
Accounts payable ‐$ 685,371$
Due to to other funds ‐ ‐
Total liabilities ‐ 685,371
Fund balance
Restricted 1,066,445 1,356,007
Total fund balances 1,066,445 1,356,007
Total liabilities and fund balance 1,066,445$ 2,041,378$

‐ 116 ‐
City of Weslaco, Texas Capital Projects Funds
2013 Certificates of Obligation Construction Fund Comparative Statements of Revenues, Expenditures
and Changes in Fund Balances
For the Fiscal Years Ended September 30, 2020 2019
Revenues
Intergovernmental 5,525$ ‐$
Total revenues 5,525 ‐
Expenditures
General government 295,087 ‐
Total expenditures 295,087 ‐
Net change in fund balances (289,562) ‐
Fund balances at beginning of year 1,356,007 1,356,007
Fund balances at end of year 1,066,445$ 1,356,007$

‐ 117 ‐
City of Weslaco, Texas Capital Projects Funds
Capital Improvement Program Fund Comparative Balance Sheets
September 30, 2020 2019
Assets
Cash and cash equivalents 283,059$ 568,400$
Investments 909,862 1,552,491
Total assets 1,192,921$ 2,120,891$
Liabilities
Accounts payable 23,910$ 301,636$
Total liabilities 23,910 301,636
Fund balance
Assigned 1,169,011 1,819,255
Total fund balances 1,169,011 1,819,255
Total liabilities and fund balance 1,192,921$ 2,120,891$
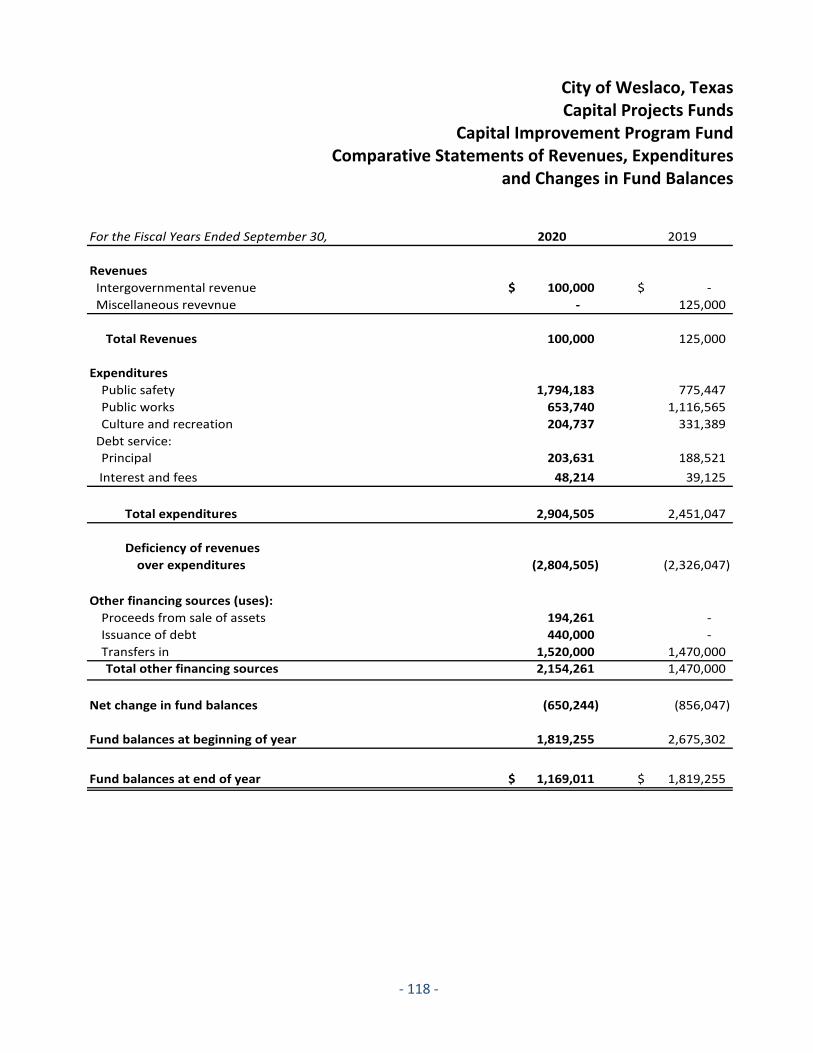
‐ 118 ‐
City of Weslaco, Texas Capital Projects Funds
Capital Improvement Program Fund Comparative Statements of Revenues, Expenditures
and Changes in Fund Balances
For the Fiscal Years Ended September 30, 2020 2019
Revenues
Intergovernmental revenue 100,000$ ‐$
Miscellaneous revevnue ‐ 125,000
Total Revenues 100,000 125,000
Expenditures
Public safety 1,794,183 775,447
Public works 653,740 1,116,565
Culture and recreation 204,737 331,389
Debt service:
Principal 203,631 188,521
Interest and fees 48,214 39,125
Total expenditures 2,904,505 2,451,047
Deficiency of revenues
over expenditures (2,804,505) (2,326,047)
Other financing sources (uses):
Proceeds from sale of assets 194,261 ‐
Issuance of debt 440,000 ‐
Transfers in 1,520,000 1,470,000
Total other financing sources 2,154,261 1,470,000
Net change in fund balances (650,244) (856,047)
Fund balances at beginning of year 1,819,255 2,675,302
Fund balances at end of year 1,169,011$ 1,819,255$

‐ 119 ‐
City of Weslaco, Texas Capital Projects Funds
Schedule of Revenues, Expenditures and Changes in Fund Balance‐ Budget and Actual‐
Capital Improvement Program Fund
Variance
With
Original Final Actual Final Budget
Revenues
Intergovernmental 725,000$ 725,000$ 100,000$ (625,000)$
Total Revenues 725,000 725,000 100,000 (625,000)
Expenditures
Public safety
Police Department 1,050,000 1,050,000 700,403 349,597
Fire Department 150,000 150,000 1,093,780 (943,780)
1,200,000 1,200,000 1,794,183 (594,183)
Public works
Streets Department 896,000 896,000 653,740 242,260
Culture and Recreation
Parks & Recreation Department 1,220,000 1,220,000 204,737 1,015,263
Debt service:
Principal 155,892 155,892 203,631 (47,739)
Interest and fees 6,701 6,701 48,214 (41,513)
Total Expenditures 3,478,593 3,478,593 2,904,505 574,088
Deficiency of revenues over
expenditures (2,753,593) (2,753,593) (2,804,505) (50,912)
Other financing sources (uses):
Proceeds from sale of assets 1,800,000 1,800,000 194,261 (1,605,739)
Issuance of debt ‐ ‐ 440,000 440,000
Transfers in 1,570,000 1,570,000 1,520,000 (50,000)
Total other financing sources 3,370,000 3,370,000 2,154,261 (1,215,739)
Net change in fund balances 616,407$ 616,407$ (650,244) (1,266,651)$
Fund balances at beginning of year 1,819,255
Fund balances at end of year 1,169,011$
Budget
For the Fiscal Year Ended September 30, 2020

‐ 120 ‐
City of Weslaco, Texas Capital Projects Funds
Fire Department Equipment Replacement Fund Comparative Balance Sheets
September 30, 2020 2019
Assets
Cash and cash equivalents 286,422$ 420,872$
Total Assets 286,422$ 420,872$
Liabilities ‐$ ‐$
Fund Balance
Assigned 286,422 420,872
Total Liabilities and Fund Balance 286,422$ 420,872$

‐ 121 ‐
City of Weslaco, Texas Capital Projects Funds
Fire Department Equipment Replacement Fund Comparative Statements of Revenues, Expenditures
and Changes in Fund Balances
For the Fiscal Years Ended September 30, 2020 2019
Revenues ‐$ ‐$
Expenditures
Public safety ‐ 112,846
Debt service:
Principal 285,613 267,024
Interest and fees 41,410 46,701
Total Expenditures 327,023 426,571
Ddeficiency of revenues
over expenditures (327,023) (426,571)
Other financing sources (uses):
Transfers in 192,573 408,371
Issuance of debt ‐ 71,145
Total other financing sources 192,573 479,516
Net change in fund balances (134,450) 52,945
Fund balances at beginning of year 420,872 367,927
Fund balances at end of year 286,422$ 420,872$

‐ 122 ‐
City of Weslaco, Texas Capital Projects Funds
Schedule of Revenues, Expenditures and Changes in Fund Balance‐ Budget and Actual‐
Fire Department Equipment Replacement Fund
Variance
With
Original Final Actual Final Budget
Revenues ‐$ ‐$ ‐$ ‐$
Expenditures
Public safety
Fire Department 174,570 174,570 ‐ 174,570
Debt service:
Principal 373,688 373,688 285,613 88,075
Interest and fees 41,411 41,411 41,410 1
Total Expenditures 589,669 589,669 327,023 262,646
Deficiency of revenues over
expenditures (589,669) (589,669) (327,023) 262,646
Other financing sources (uses):
Other financing sources 174,750 174,750 ‐ (174,750)
Transfers in 450,000 450,000 192,573 (257,427)
Total other financing sources 624,750 624,750 192,573 (432,177)
Net change in fund balance 35,081$ 35,081$ (134,450) (169,531)$
Fund balance at beginning of year 420,872
Fund balance at end of year 286,422$
Budget
For the Fiscal Year Ended September 30, 2020

‐ 123 ‐
City of Weslaco, Texas Capital Projects Funds
Storm Water Improvement Fund Comparative Balance Sheets
September 30, 2020 2019
Assets
Cash and cash equivalents 2,108,287$ 2,917,529$
Total Assets 2,108,287$ 2,917,529$
Liabilities
Accounts Payable 7,964$ 501$
Total Liabilities 7,964 501
Fund Balance
Restricted 2,100,323 2,917,028
Total Liabilities and Fund Balance 2,108,287$ 2,917,529$

‐ 124 ‐
City of Weslaco, Texas Capital Projects Funds
Storm Water Improvement Fund Comparative Statements of Revenues, Expenditures
and Changes in Fund Balances
For the Fiscal Years Ended September 30, 2020 2019
Revenues ‐$ ‐$
Expenditures
Public works 916,705 1,191,208
Debt service:
Interest and fees ‐ 70,712
Total Expenditures 916,705 1,261,920
Deficiency of revenues
over expenditures (916,705) (1,261,920)
Other financing sources (uses):
Transfers in 100,000 100,000
Issuance of debt ‐ 4,078,948
Total other financing sources 100,000 4,178,948
Net change in fund balances (816,705) 2,917,028
Fund balances at beginning of year 2,917,028 ‐
Fund balances at end of year 2,100,323$ 2,917,028$

‐ 125 ‐
City of Weslaco, Texas Capital Projects Funds
Schedule of Revenues, Expenditures and Changes in Fund Balance‐ Budget and Actual‐
Storm Water Improvement Fund
Variance
With
Original Final Actual Final Budget
Revenues ‐$ ‐$ ‐$ ‐$
Expenditures
Public works
Drain Ditch Department 2,673,147 2,673,147 916,705 1,756,442
Total Expenditures 2,673,147 2,673,147 916,705 1,756,442
Deficiency of revenues over
expenditures (2,673,147) (2,673,147) (916,705) 1,756,442
Other financing sources (uses):
Transfers in 100,000 100,000 100,000 ‐
Total other financing sources 100,000 100,000 100,000 ‐
Net change in fund balance (2,573,147)$ (2,573,147)$ (816,705) 1,756,442$
Fund balance at beginning of year 2,917,028
Fund balance at end of year 2,100,323$
Budget
For the Fiscal Year Ended September 30, 2020

‐ 126 ‐
City of Weslaco, Texas Capital Projects Funds
2019 Bond Construction Fund Comparative Balance Sheets
September 30, 2020 2019
Assets
Cash and cash equivalents 8,399,895$ 10,000,000$
Investments 472,409 ‐
Total Assets 8,872,304$ 10,000,000$
Liabilities
Accounts Payable 16,250$ ‐$
Total Liabilities 16,250 ‐
Fund Balance
Restricted 8,856,054 10,000,000
Total Liabilities and Fund Balance 8,872,304$ 10,000,000$

‐ 127 ‐
City of Weslaco, Texas Capital Projects Funds
2019 Bond Construction Fund Comparative Statements of Revenues, Expenditures
and Changes in Fund Balances
For the Fiscal Years Ended September 30, 2020 2019
Revenues ‐$ ‐$
Expenditures
Public works 1,143,946 ‐
Interest and fees ‐ 107,256
Total Expenditures 1,143,946 107,256
Deficiency of revenues
over expenditures (1,143,946) (107,256)
Other financing sources (uses):
Issuance of debt ‐ 10,107,256
Total other financing sources ‐ 10,107,256
Net change in fund balances (1,143,946) 10,000,000
Fund balances at beginning of year 10,000,000 ‐
Fund balances at end of year 8,856,054$ 10,000,000$

‐ 128 ‐
City of Weslaco, Texas Debt Service Fund
Comparative Balance Sheets
September 30, 2020 2019
Assets
Cash and cash equivalents 381,990$ 250,072$
Investments 21,483 38,934
Receivables (net of allowance for uncollectibles)
Ad valorem taxes 268,769 279,420
Due from other funds 75,736 38,809
Total assets 747,978$ 607,235$
Liabilities ‐$ ‐$
Total liabilities ‐ ‐
Deferred inflows of resources
Unavailable revenue‐ ad valorem taxes 223,948 225,132
Total deferred inflows of resources 223,948 225,132
Fund balance
Restricted 524,030 382,103
Total liabilities, deferred inflows of
resources and fund balances 747,978$ 607,235$

‐ 129 ‐
City of Weslaco, Texas Debt Service Fund
Comparative Statements of Revenues, Expenditures and Changes in Fund Balances
For the Fiscal Years Ended September 30, 2020 2019
Revenues
Property taxes 2,929,325$ 2,766,176$
Investment income 37,827 49,696
Total revenues 2,967,152 2,815,872
Expenditures
Debt service:
Principal 2,130,000 2,091,072
Interest and fees 695,225 743,205
Total expenditures 2,825,225 2,834,277
Net change in fund balance 141,927 (18,405)
Fund balances at beginning of year 382,103 400,508
Fund balances at end of year 524,030$ 382,103$

‐ 130 ‐
(This page intentionally left blank)

‐ 131 ‐
City of Weslaco, Texas Schedule of Revenues, Expenditures and
Changes in Fund Balance‐ Budget and Actual‐ Debt Service Fund
Variance
With
Original Final Actual Final Budget
Revenues
Property taxes 3,641,611$ 3,641,611$ 2,929,325$ (712,286)$
Investment income 46,000 46,000 37,827 (8,173)
Total revenues 3,687,611 3,687,611 2,967,152 (720,459)
Expenditures
Debt service:
Principal 2,690,833 2,690,833 2,130,000 560,833
Interest and fees 694,681 694,681 695,225 (544)
Total expenditures 3,385,514 3,385,514 2,825,225 (560,289)
Net change in fund balance 302,097$ 302,097 141,927$ (160,170)$
Fund balance at beginning of year 382,103
Fund balance at end of year 524,030$
Budget
For the Fiscal Year Ended September 30, 2020

‐ 132 ‐
City of Weslaco, Texas Series 2019 Debt Service Fund Comparative Balance Sheets
September 30, 2020 2019
Assets
Receivables (net of allowance for uncollectibles)
Ad valorem taxes 18,263$ ‐$
Due from other funds 7,003 ‐
Total assets 25,266$ ‐$
Liabilities
Due to to other funds 10,432 ‐
Total liabilities 10,432 ‐
Deferred inflows of resources
Unavailable revenue‐ ad valorem taxes 12,691 ‐
Total deferred inflows of resources 12,691 ‐
Fund balance
Restricted 2,143 ‐
Total liabilities, deferred inflows of
resources and fund balances 25,266$ ‐$
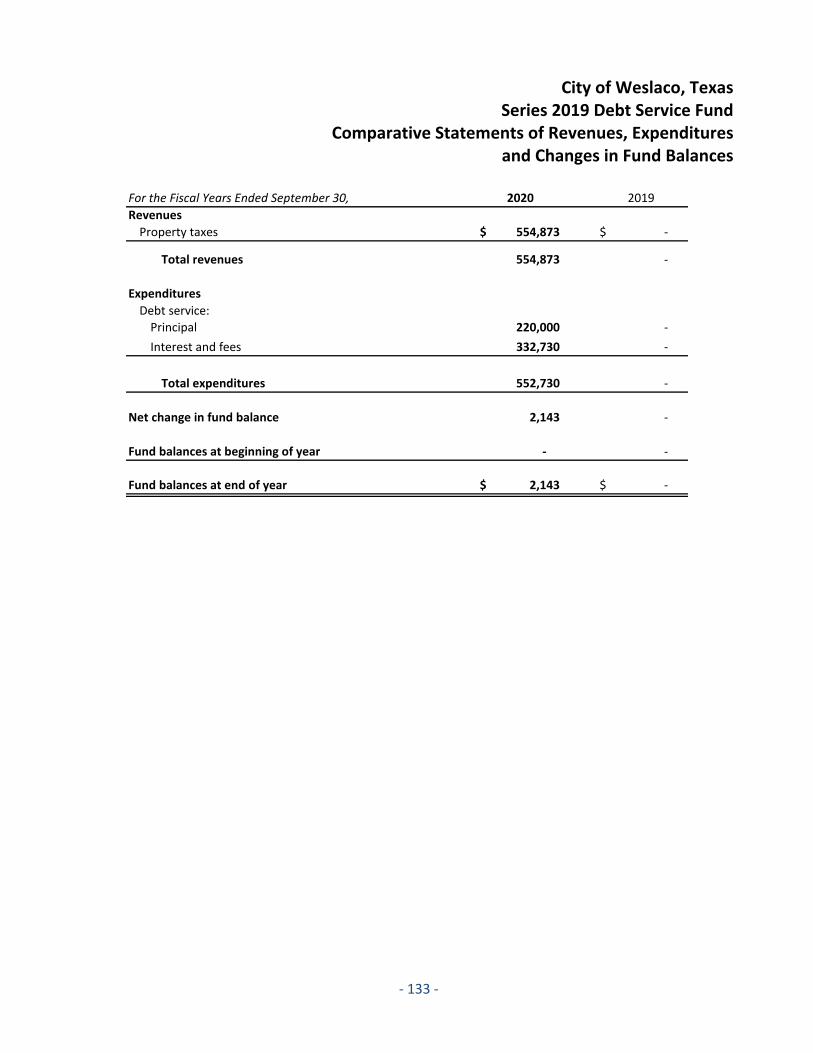
‐ 133 ‐
City of Weslaco, Texas Series 2019 Debt Service Fund
Comparative Statements of Revenues, Expenditures and Changes in Fund Balances
For the Fiscal Years Ended September 30, 2020 2019
Revenues
Property taxes 554,873$ ‐$
Total revenues 554,873 ‐
Expenditures
Debt service:
Principal 220,000 ‐
Interest and fees 332,730 ‐
Total expenditures 552,730 ‐
Net change in fund balance 2,143 ‐
Fund balances at beginning of year ‐ ‐
Fund balances at end of year 2,143$ ‐$

‐ 134 ‐
City of Weslaco, Texas Enterprise Funds
Water and Wastewater Fund Comparative Statements of Net Position
September 30, 2020 2019
Assets
Current assets
Cash and cash equivalents 432,813$ 225,446$
Cash and cash equivalents‐ restricted 1,652,862 2,054,891
Investments‐ restricted 562,681 789,655
Receivables,
net of allowances for uncollectibles 2,285,042 1,989,916
Inventories 254,530 160,900
Prepaid items 18,996 37,936
Total current assets 5,206,924 5,258,744
Non‐current assets
Land 665,175 665,175
Buildings 362,324 362,324
Equipment 5,824,096 5,550,697
Infrastructure 115,771,542 70,175,369
Capital Leases 6,934,391 6,934,391
Construction‐in‐progress 453,476 44,797,842
Total non‐current assets 130,011,004 128,485,798
Accumulated depreciation (43,169,530) (39,230,338)
Total non‐current assets, net 86,841,474 89,255,460
Total assets 92,048,398 94,514,204
Deferred outflows of resources
Deferred outflows related to pensions 83,503 200,827
Deferred outflows related to OPEB 9,980 3,322
Deferred charge on refunding 1,778,044 1,955,361
Total deferred outflows of resources 1,871,527 2,159,510
Total assets and deferred outflows
of resources 93,919,925$ 96,673,714$

‐ 135 ‐
City of Weslaco, Texas Enterprise Funds
Water and Wastewater Fund Comparative Statements of Net Position‐ Continued
September 30, 2020 2019
Liabilities
Current liabilities:
Accounts payable 947,439$ 924,733$
Accrued salaries and other liabilities 153,415 132,351
Due to other funds 2,259,258 2,000,000
Current portion of long term debt 3,407,201 3,243,951
Accrued interest on bonds 252,613 267,281
Total current liabilities 7,019,926 6,568,316
Noncurrent liabilities:
Compensated absences 78,807 78,245
Customer deposits 1,274,450 1,182,191
Capital lease payable 5,698,351 6,161,945
Revenue bonds payable,
net of unamortized premiums 44,464,654 48,248,304
Net pension liability 709,455 869,180
OPEB liability 54,505 44,000
Total noncurrent liabilities 52,280,222 56,583,865
Total liabilities 59,300,148 63,152,181
Deferred inflows of resources
Deferred inflows related to pensions 105,853 35,352
Deferred inflows related to OPEB 3,530 3,530
Total deferred inflows of resources 109,383 38,882
Net Position
Net investment in capital assets 36,274,278 35,783,631
Restricted for:
Revenue bond retirement 999,333 996,487
Unrestricted (2,763,217) (3,297,467)
Total net position 34,510,394 33,482,651
Total liabilities, deferred inflows
of resources, and net position 93,919,925$ 96,673,714$

‐ 136 ‐
City of Weslaco, Texas Enterprise Funds
Water and Wastewater Fund Comparative Statements of Revenues, Expenses
and Changes in Net Position
For the Fiscal Years Ended September 30, 2020 2019
Operating revenues:
Water services 7,483,073$ 7,090,130$
Sewer services 5,318,493 5,057,874
Miscellaneous 63,744 128,609
Total operating revenues 12,865,310 12,276,613
Operating expenses:
Personal services 845,022 888,498
Other services and charges 2,035,775 2,058,901
Supplies 209,394 223,795
Contractual services 3,037,989 2,765,472
Depreciation 3,939,191 2,934,073
Total operating expenses 10,067,371 8,870,739
Operating income 2,797,939 3,405,874
Non‐operating revenues (expenses)
Investment income 5,880 13,124
Interest expense (1,633,394) (1,728,279)
Total non‐operating revenues (expenses) (1,627,514) (1,715,155)
Income (loss) before transfers and capital contributions 1,170,425 1,690,719
Transfers in (out) and capital contributions
Transfers in 5,429,883 5,705,757
Transfers out (6,736,187) (7,271,318)
Capital improvement fees 696,141 642,214
Capital grants 467,481 39,750
Total transfers and capital contributions (142,682) (883,597)
Change in net position 1,027,743 807,122
Net position‐ beginning 33,482,651 32,675,529
Net position‐ ending 34,510,394$ 33,482,651$

‐ 137 ‐
City of Weslaco, Texas Enterprise Funds
Water and Wastewater Fund Comparative Statements Cash Flows
For the Fiscal Years Ended September 30, 2020 2019
Cash flows from operating activities
Cash received from customers 12,662,443$ 12,547,000$
Payments to suppliers (5,075,884) (5,452,262)
Payments to employees (614,132) (627,162)
Net cash provided by
operating activities 6,972,427 6,467,576
Cash flows from noncapital financing
activities
Transfers from other funds 5,429,883 5,705,757
Transfers to other funds (6,736,187) (7,271,318)
Net cash used in
noncapital financing activities (1,306,304) (1,565,561)
Cash flows from capital and related financing activities
Purchase of capital assets (1,521,318) (2,078,581)
Interest paid on bonds (2,456,712) (2,586,616)
Retirement of bonds (2,811,750) (2,317,266)
Capital improvement fees 696,141 642,214
Net cash used in capital
and related financing activites (6,093,639) (6,340,249)
Cash flow from investing activities:
Interest on cash and investments 5,880 13,124
Purchase of investments 226,974 (11,227)
Net cash provided by (used) in investing
activities 232,854 1,897
Net (decrease) in cash and cash equivalents (194,662) (1,436,337)
Cash and cash equivalents, beginning of year 2,280,337 3,716,674
Cash and cash equivalents, end of year 2,085,675$ 2,280,337$
Reconciliation of operating income
to net cash provided by operating activities
Operating income 2,797,939$ 3,405,874$
Adjustments to reconcile income
from operations to net cash from operating activities
Depreciation 3,939,191 2,934,073
(Increase) decrease in accounts receivables (295,126) 195,594
(Increase) decrease in inventories (93,630) 58,232
(Increase) decrease in prepaid items 18,940 6,162
(Increase) decrease in deferred outflows 287,983 72,806
Decrease (increase) in accounts payable 22,706 (460,480)
Decrease (increase) in accrued salaries and other liabilities 21,064 16,593
Decrease (increase) in due to other funds 259,258 (8,008)
Decrease (increase) in customer deposits 92,259 74,793
Decrease (increase) in compensated absences 562 (7,162)
Decrease (increase) in net pension liability (159,725) 253,835
Decrease (increase) in OPEB liability 10,505 (1,576)
Decrease (increase) in deferred inflows 70,501 (73,160)
Total adjustments 4,174,488 3,061,702
Net cash provided by operations 6,972,427$ 6,467,576$
Supplemental disclosure of noncash activities
Contributed capital assets from Urban County 467,481$ 39,750$
Initiation of capital lease ‐ 434,278

‐ 138 ‐
City of Weslaco, Texas Enterprise Funds
Schedule of Revenues, Expenses, and Changes in Net Position‐ Budget and Actual‐
Water and Wastewater Fund
Variance
With
Original Final Actual Final Budget
Operating revenues:
Water services 7,438,500$ 7,273,500$ 7,483,073$ 209,573$
Sewer services 5,119,700 5,019,700 5,318,493 298,793
Miscellaneous 81,751 81,751 63,744 (18,007)
Total operating revenues 12,639,951 12,374,951 12,865,310 490,359
Operating expenses:
Water treatment
Other services and charges 617,824 602,824 602,393 431
Contractual services 1,000,000 1,000,000 1,092,947 (92,947)
Supplies 47,000 67,870 20,055 47,815
Depreciation ‐ ‐ 146,656 (146,656)
Total water treatment 1,664,824 1,670,694 1,862,051 (191,357)
Water distribution
Personnel services 342,636 342,636 369,586 (26,950)
Other services and charges 283,165 283,670 178,787 104,883
Supplies 48,770 49,205 28,872 20,333
Depreciation ‐ ‐ 1,175,424 (1,175,424)
Total water distribution 674,571 675,511 1,752,669 (1,077,158)
Water meter division
Personnel services 112,951 106,951 99,217 7,734
Other services and charges 17,500 17,500 45,533 (28,033)
Supplies 188,400 263,400 45,781 217,619
Depreciation ‐ ‐ 347,602 (347,602)
Total water meter division 318,851 387,851 538,133 (150,282)
Utility billing
Personnel services 172,750 172,750 173,917 (1,167)
Other services and charges 137,500 137,500 269,191 (131,691)
Supplies 8,600 8,600 8,679 (79)
Depreciation ‐ ‐ 327 (327)
Total utility billing 318,850 318,850 452,114 (133,264)
Waste water treatment
Other services and charges 651,450 615,450 468,505 146,945
Contractual services 874,589 874,589 972,521 (97,932)
Supplies 10,000 82,740 9,034 73,706
Depreciation ‐ ‐ 1,006,044 (1,006,044)
Total waste water treatment 1,536,039 1,572,779 2,456,104 (883,325)
Waste water collection
Personnel services 245,839 200,839 202,302 (1,463)
Other services and charges 558,940 655,685 471,366 184,319
Contractual services 953,775 953,775 972,521 (18,746)
Supplies 322,625 318,880 96,973 221,907
Depreciation ‐ ‐ 1,263,138 (1,263,138)
Total waste water collection 2,081,179 2,129,179 3,006,300 (877,121)
Total operating expenses 6,594,314 6,754,864 10,067,371 (3,312,507)
Operating income 6,045,637 5,620,087 2,797,939 3,802,866
Budget
For the Fiscal Year Ended September 30, 2020

‐ 139 ‐
City of Weslaco, Texas Enterprise Funds
Schedule of Revenues, Expenses, and Changes in Net Position‐ Budget and Actual‐
Water and Wastewater Fund (Continued)
Variance
With
Original Final Actual Final Budget
Non‐operating revenues (expenses)
Investment income 12,000 12,000 5,880 6,120
Interest expense (5,561,025) (5,561,025) (1,633,394) 3,927,631
Total non‐operating revenues (expenses) (5,549,025) (5,549,025) (1,627,514) 3,921,511
Income before transfers and capital contributions 496,612 71,062 1,170,425 1,099,363
Transfers in (out) and capital contributions
Transfers in 6,381,213 6,381,213 5,429,883 (951,330)
Transfers (out) (7,582,994) (7,582,994) (6,736,187) 846,807
Capital improvement fees 759,110 669,110 696,141 (27,031)
Capital grants ‐ ‐ 467,481 (467,481)
Total transfers and capital contributions (442,671) (532,671) (142,682) 389,989
Change in net position 53,941$ (461,609)$ 1,027,743 1,489,352$
Net position‐ beginning 33,482,651
Net position‐ ending 34,510,394$
For the Fiscal Year Ended September 30, 2020
Budget

‐ 140 ‐
City of Weslaco, Texas Enterprise Funds Solid Waste Fund
Comparative Statements of Net Position
September 30, 2020 2019
Assets
Current assets
Cash and cash equivalents ‐$ ‐$
Receivables,
net of allowances for uncollectibles 820,550 675,576
Due from other funds 2,000,000 2,000,000
Total current assets 2,820,550 2,675,576
Non‐current assets
Land 421,247 421,247
Buildings 668,781 668,781
Equipment 1,734,678 1,734,678
Infrastructure 64,461 64,461
Capital lease 540,552 ‐
Total non‐current assets 3,429,719 2,889,167
Accumulated depreciation (2,353,018) (2,320,301)
Total non‐current assets, net 1,076,701 568,866
Total assets 3,897,251 3,244,442
Deferred outflows of resources
Deferred outflows related to pensions 2,158 8,024
Deferred outflows related to OPEB 470 137
Total deferred outflows of resources 2,628 8,161
Total assets and deferred outflows
of resources 3,899,879$ 3,252,603$
Liabilities
Current liabilities:
Accounts payable 391,694$ 390,048$
Due to other funds 890,709 470,232
Current portion of long term debt 110,581 678
Total current liabilities 1,392,984 860,958
Noncurrent liabilities:
Compensated absences 18,725 6,147
Capital lease payable 461,985 ‐
Landfill closure 372,376 387,764
Net pension liability 16,629 24,615
OPEB liability 2,399 1,874
Total noncurrent liabilities 872,114 420,400
Total liabilities 2,265,098 1,281,358
Deferred inflows of resources
Deferred inflows related to pensions 3,551 26
Deferred inflows related to OPEB 177 177
Total deferred inflows of resources 3,728 203
Net position
Net investment in capital assets 506,216 568,866
Unrestricted 1,124,837 1,402,176
Total net position 1,631,053 1,971,042
Total liabilities, deferred inflowsof resources, and net position 3,899,879$ 3,252,603$

‐ 141 ‐
City of Weslaco, Texas Enterprise Funds Solid Waste Fund
Comparative Statements of Revenues, Expenses and Changes in Net Position
For the Fiscal Years Ended September 30, 2020 2019
Operating Revenues:
Charges for services 5,375,985$ 5,093,075$
Miscellaneous ‐ 29,670
Total operating revenues 5,375,985 5,122,745
Operating Expenses:
Personal services 106,773 73,122
Other services and charges 186,927 163,279
Supplies 8,032 13,073
Contractual services 4,256,525 4,209,444
Depreciation 32,717 24,669
Total operating expenses 4,590,974 4,483,587
Operating income (loss) 785,011 639,158
Transfers in (out)
Transfers out (1,125,000) (1,125,000)
Change in net position (339,989) (485,842)
Net position‐ beginning 1,971,042 2,456,884
Net position‐ ending 1,631,053$ 1,971,042$

‐ 142 ‐
City of Weslaco, Texas Enterprise Funds Solid Waste Fund
Comparative Statements of Cash Flows
For the Fiscal Years Ended September 30, 2020 2019
Cash flows from operating activities
Cash received from customers 5,231,011$ 5,217,790$
Payments to suppliers (4,023,828) (3,981,093)
Payments to employees (96,728) (64,446)
Net cash provided by
operating activities 1,110,455 1,172,251
Cash flows from noncapital financing activities
Transfers to other funds (1,125,000) (1,125,000)
Net cash used in
noncapital financing activities (1,125,000) (1,125,000)
Cash flows from capital and related financing activities
Purchase of capital assets (540,552) (14,290)
Capital lease proceeds 570,485 ‐
Landfill closure costs (15,388) (32,961)
Net cash used in capital
and related financing activites 14,545 (47,251)
Net (decrease) in cash and cash equivalents ‐ ‐
Cash and cash equivalents, beginning of year ‐ ‐
Cash and cash equivalents, end of year ‐$ ‐$
Reconciliation of operating income
to net cash provided by operating activities
Operating income 785,011$ 639,158$
Adjustments to reconcile income
from operations to net cash from operating activities
Depreciation 32,717 24,669
(Increase) decrease in accounts receivables (144,974) 95,045
(Increase) decrease in deferred outflows 5,533 (5,225)
Increase (decrease) in accounts payable 1,646 (14,684)
Increase (decrease) in due to other funds 420,477 424,612
Increase (decrease) in compensated absences 13,981 (279)
Increase (decrease) in net pension liability (7,986) 12,692
Increase (decrease) in OPEB liability 525 (79)
Increase (decrease) in deferred inflows related to pensions 3,525 (3,835)
Increase (decrease) in deferred inflows related to OPEB ‐ 177
Total adjustments 325,444 533,093
Net cash provided by operations 1,110,455$ 1,172,251$

‐ 143 ‐
City of Weslaco, Texas Enterprise Funds
Schedule of Revenues, Expenses and Changes in Net Position‐ Budget and Actual‐
Solid Waste Fund
Variance
With
Original Final Actual Final Budget
Operating revenues:
Garbage fees 4,050,000$ 4,265,846$ 4,152,796$ (113,050)$
Brush fees 1,372,800 1,372,800 1,183,293 (189,507)
Recyclying services 5,000 5,000 3,112 (1,888)
Miscellaneous 82,000 82,000 36,784 (45,216)
Total operating revenues 5,509,800 5,725,646 5,375,985 (349,661)
Operating expenses:
Solid waste collection
Personnel services ‐ ‐ 2,391 (2,391)
Other services and charges 64,500 64,500 142,484 (77,984)
Contractual services 3,195,640 3,318,640 3,640,939 (322,299)
Depreciation ‐ ‐ 1,434 (1,434)
Total solid waste collection 3,260,140 3,383,140 3,787,248 (404,108)
Recycling
Personnel services 78,986 80,986 72,287 8,699
Other services and charges 8,755 8,722 7,903 819
Supplies 6,800 6,800 5,666 1,134
Depreciation ‐ ‐ 24,188 (24,188)
Total recycling 94,541 96,508 110,044 (13,536)
Landfill
Other services and charges 30,400 33,400 36,016 (2,616)
Total landfill 30,400 33,400 36,016 (2,616)
Brush collection
Personnel services ‐ ‐ 32,095 (32,095)
Other services and charges ‐ ‐ 524 (524)
Contractual services 650,000 685,000 615,586 69,414
Supplies ‐ ‐ 2,366 (2,366)
Capital outlay ‐ 570,485 ‐ 570,485
Depreciation ‐ ‐ 7,095 (7,095)
Total brush collection 650,000 1,255,485 657,666 597,819
Total operating expenses 4,035,081 4,768,533 4,590,974 177,559
Operating income 1,474,719 957,113 785,011 (172,102)
Transfers in (out)
Transfers out (1,125,000) (1,125,000) (1,125,000) ‐
Total transfers (1,125,000) (1,125,000) (1,125,000) ‐
Change in net position 349,719$ (167,887)$ (339,989) (172,102)$
Net position‐ beginning 1,971,042
Net position‐ ending 1,631,053$
Budget
For the Fiscal Year Ended September 30, 2020

‐ 144 ‐
City of Weslaco, Texas Enterprise Funds
Airport Fund Comparative Statements of Net Position
September 30, 2020 2019
Assets
Current assets:
Cash and cash equivalents 27,576$ 100$
Cash and cash equivalents‐ restricted 13,590 14,094
Receivables,
net of allowances for uncollectibles 135,331 99,199
Inventories 38,573 31,354
Total current assets 215,070 144,747
Non‐current assets
Land 2,866,462 1,465,448
Buildings 648,541 648,541
Equipment 640,947 640,947
Infrastructure 13,704,908 12,252,404
Construction‐in‐progress 97,058 1,490,750
Total non‐current assets 17,957,916 16,498,090
Accumulated depreciation (5,651,387) (5,220,466)
Total non‐current assets, net 12,306,529 11,277,624
Total assets 12,521,599 11,422,371
Deferred outflows of resources
Deferred outflows related to pensions 14,657 47,899
Deferred outflows related to OPEB 2,735 849
Total deferred outflows of resources 17,392 48,748
Total assets and deferred outflowsof resources 12,538,991$ 11,471,119$
Liabilities
Current liabilities:
Accounts payable 38,717$ 72,144$
Accrued salaries and other liabilities 32,768 26,657
Due to other funds 607,455 545,350
Current portion of long term debt 57,454 2,844
Total current liabilities 736,394 646,995
Noncurrent liabilities:
Compensated absences 33,203 27,199
Notes payable 1,397,045 ‐
Customer deposits 3,594 3,594
Net pension liability 113,236 158,491
OPEB liability 14,389 11,413
Total noncurrent liabilities 1,561,467 200,697
Total liabilities 2,297,861 847,692
Deferred inflows of resources
Deferred inflows related to pensions 22,614 2,639
Deferred inflows related to OPEB 1,000 1,000
Total deferred inflows of resources 23,614 3,639
Net Position
Net investment of capital assets 10,855,719 11,277,624
Restricted for:
Construction 13,590 14,094
Unrestricted (651,793) (671,930)
Total net position 10,217,516 10,619,788
Total liabilities, deferred inflowsof resources, and net position 12,538,991$ 11,471,119$

‐ 145 ‐
City of Weslaco, Texas Enterprise Funds
Airport Fund Comparative Statements of Revenues, Expenses
and Changes in Net Position
For the Fiscal Years Ended September 30, 2020 2019
Operating revenues:
Charges for services 302,600$ 321,634$
Miscellaneous 125 275
Total operating revenues 302,725 321,909
Operating expenses:
Personal services 270,744 247,744
Other services and charges 212,734 183,579
Supplies 232,826 258,497
Depreciation 430,922 345,539
Total operating expenses 1,147,226 1,035,359
Operating income (loss) (844,501) (713,450)
Non‐operating revenues (expenses)
Interest expense (25,393) ‐
Income (loss) before transfers and capital contributions (869,894) (713,450)
Transfers in (out) and capital grants
Capital grants 217,622 229,365
Transfers in 250,000 250,000
Total transfers and capital contributions 467,622 479,365
Change in net position (402,272) (234,085)
Net position‐ beginning 10,619,788 10,853,873
Net position‐ ending 10,217,516$ 10,619,788$

‐ 146 ‐
City of Weslaco, Texas Enterprise Funds
Airport Fund Comparative Statements of Cash Flows
For the Fiscal Years Ended September 30, 2020 2019
Cash flows from operating activities
Cash received from customers 266,593$ 250,792$
Payments to suppliers (424,101) (277,911)
Payments to employees (248,732) (231,967)
Net cash used in
operating activities (406,240) (259,086)
Cash flows from noncapital financing activities
Transfers from other funds 250,000 250,000
Net cash provided by
noncapital financing activities 250,000 250,000
Cash flows from capital and related financing activities
Purchase of capital assets (1,439,014) (79,829)
Notes payable proceeds received 1,450,810 ‐
Capital grants 196,809 71,802
Interest paid on notes payable (25,393) ‐
Net cash provided by (used) in capital
and related financing activites 183,212 (8,027)
Net (decrease) in cash and cash equivalents 26,972 (17,113)
Cash and cash equivalents, beginning of year 14,194 31,307
Cash and cash equivalents, end of year 41,166$ 14,194$
Reconciliation of operating loss
to net cash used in operating activities
Operating (loss) (844,501)$ (713,450)$
Adjustments to reconcile (loss)
from operations to net cash from operating activities
Depreciation 430,922 345,539
(Increase) decrease in accounts receivables (36,132) (71,117)
(Increase) decrease in inventories (7,219) ‐
(Increase) decrease in deferred outflows 31,356 (29,612)
Increase (decrease) in accounts payable (33,427) 66,116
Increase (decrease) in accrued salaries and other liabilities 6,111 18,255
Increase (decrease) in due to other funds 62,105 98,049
Increase (decrease) in compensated absences 6,849 (23,611)
Increase (decrease) in net pension liability (45,255) 71,920
Increase (decrease) in OPEB liability 2,976 (446)
Increase (decrease) in deferred inflows related to pensions 19,975 (21,729)
Increase (decrease) in deferred inflows related to OPEB ‐ 1,000
Total adjustments 438,261 454,364
Net cash used in operations (406,240)$ (259,086)$
Supplemental disclosure of noncash activities
Contributed capital assets from TxDOT ‐$ 157,563$

‐ 147 ‐
City of Weslaco, Texas Enterprise Funds
Schedule of Revenues, Expenses and Changes in Net Position‐ Budget and Actual‐
Airport Fund
Variance
With
Original Final Actual Final Budget
Operating revenues:
Fuel sales 220,000$ 220,000$ 222,981$ 2,981$
Hangar rentals 51,588 51,588 79,619 28,031
Miscellaneous 11,639 11,639 125 (11,514)
Total operating revenues 283,227 283,227 302,725 19,498
Operating expenses:
Airport operations
Personnel services 209,999 209,999 270,744 (60,745)
Other charges and services 103,350 103,350 112,735 (9,385)
Supplies 278,050 278,050 232,826 45,224
Depreciation ‐ ‐ 430,922 (430,922)
Total airport operations 591,399 591,399 1,047,227 (455,828)
Airport grant programs
Other charges and services 100,000 100,000 99,999 1
Total airport grant programs 100,000 100,000 99,999 1
Total operating expenses 691,399 691,399 1,147,226 (455,827)
Operating (loss) (408,172) (408,172) (844,501) (436,329)
Non‐operating revenues (expenses)
Interest expense ‐ ‐ (25,393) (25,393)
Total non‐operating revenues (expenses) ‐ ‐ (25,393) (25,393)
Income (loss) before transfers and captial contributions (408,172) (408,172) (869,894) (461,722)
Transfers in (out) and capital grants
Transfers in 260,000 260,000 250,000 (10,000)
Capital grants 50,000 50,000 217,622 167,622
Total transfers and capital contributions 310,000 310,000 467,622 157,622
Change in net position (98,172)$ (98,172)$ (402,272) (304,100)$
Net position‐ beginning 10,619,788
Net position‐ ending 10,217,516$
Budget
For the Fiscal Year Ended September 30, 2020

‐ 148 ‐
City of Weslaco, Texas Internal Service Fund
Equipment Replacement Fund Comparative Statements of Net Position
September 30, 2020 2019
Assets
Current assets
Cash and cash equivalents ‐$ ‐$
Total current assets ‐ ‐
Non‐current assets
Equipment 4,997,658 4,997,658
Improvements 70,864 70,864
Total non‐current assets 5,068,522 5,068,522
Accumulated depreciation (5,057,990) (4,954,624)
Total non‐current assets, net 10,532 113,898
Total assets 10,532$ 113,898$
Liabilities
Current liabilities:
Due to other funds 250,269$ 250,269$
Total current liabilities 250,269 250,269
Noncurrent liabilities:
Capital lease payable ‐ ‐
Total noncurrent liabilities ‐ ‐
Total liabilities 250,269 250,269
Net Position
Net investment in capital assets 10,532 113,898
Unrestricted (250,269) (250,269)
Total net position (239,737) (136,371)
Total liabilities and net position 10,532$ 113,898$
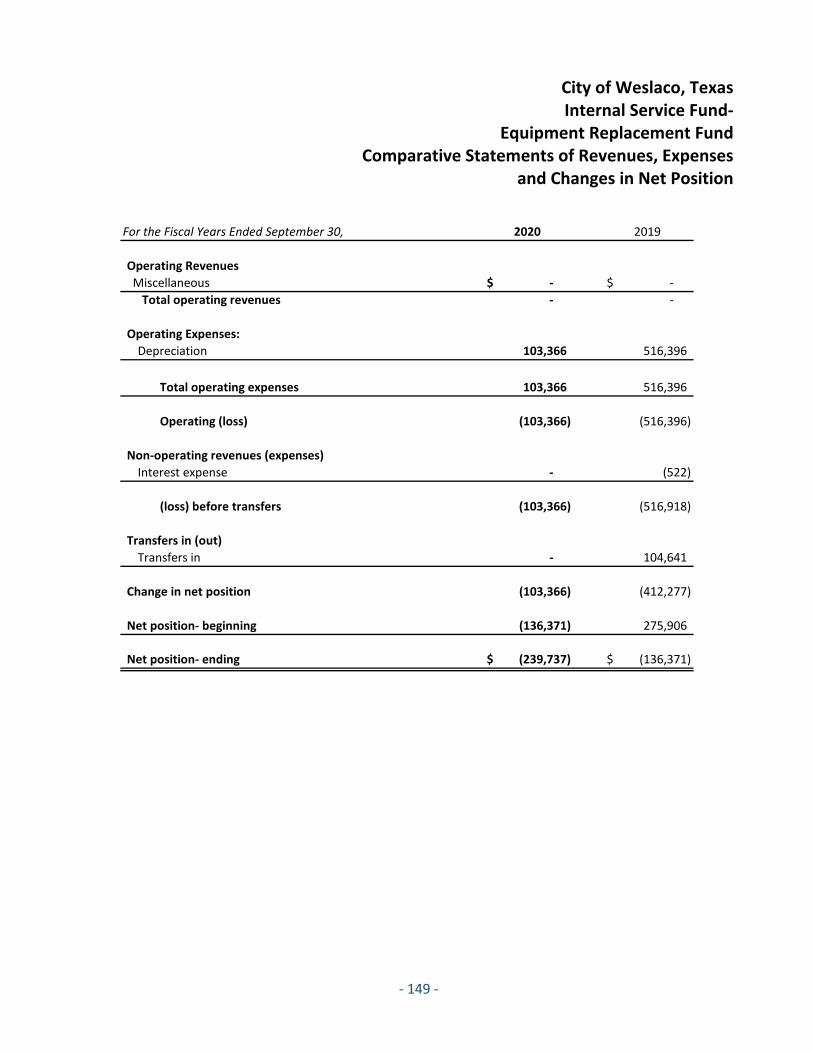
‐ 149 ‐
City of Weslaco, Texas Internal Service Fund‐
Equipment Replacement Fund Comparative Statements of Revenues, Expenses
and Changes in Net Position
For the Fiscal Years Ended September 30, 2020 2019
Operating Revenues
Miscellaneous ‐$ ‐$
Total operating revenues ‐ ‐
Operating Expenses:
Depreciation 103,366 516,396
Total operating expenses 103,366 516,396
Operating (loss) (103,366) (516,396)
Non‐operating revenues (expenses)
Interest expense ‐ (522)
(loss) before transfers (103,366) (516,918)
Transfers in (out)
Transfers in ‐ 104,641
Change in net position (103,366) (412,277)
Net position‐ beginning (136,371) 275,906
Net position‐ ending (239,737)$ (136,371)$

‐ 150 ‐
City of Weslaco, Texas Internal Service Fund‐
Equipment Replacement Fund Comparative Statements of Cash Flows
For the Fiscal Years Ended September 30, 2020 2019
Cash flows from operating activities
Cash received from customers ‐$ ‐$
Net cash provided by
operating activities ‐ ‐
Cash flows from noncapital financing activities
Transfers from other funds ‐ 104,641
Net cash provided by
noncapital financing activities ‐ 104,641
Cash flows from capital and related
financing activities
Retirement of capital leases ‐ (104,119)
Interest paid on notes ‐ (522)
Net cash used in capital
and related financing activites ‐ (104,641)
Net increase (decrease) in cash and cash equivalents ‐ ‐
Cash and cash equivalents, beginning of year ‐ ‐
Cash and cash equivalents, end of year ‐$ ‐$
Reconciliation of operating loss
to net cash provided by operating activities
Operating (loss) (103,366)$ (516,396)$
Adjustments to reconcile (loss)
from operations to net cash from operating activities
Depreciation 103,366 516,396
Increase (decrease) in due to other funds ‐ ‐
Total adjustments 103,366 516,396
Net cash provided by operations ‐$ ‐$

‐ 151 ‐
City of Weslaco, Texas Fiduciary Funds
Firemen’s Relief and Retirement Pension Trust Fund
Comparative Statements of Fiduciary Net Position
September 30, 2020 2019
Assets
Cash 7,573$ 11,098$
Investments, at fair value:
Equities 9,405,149 8,654,278
Mutual funds 117,985 ‐
Corporate bonds 782,304 1,292,024
Money market mutual funds 737,809 490,555
Municipal bonds 1,781,537 1,481,884
Total assets 12,832,357$ 11,929,839$
Liabilities
Accounts payable ‐$ ‐$
Total liabilities ‐ ‐
Net position
Net position restricted for pensions 12,832,357 11,929,839
Total net position 12,832,357 11,929,839
Total liabilities and net position 12,832,357$ 11,929,839$

‐ 152 ‐
City of Weslaco, Texas Fiduciary Funds
Firemen’s Relief and Retirement Pension Trust Fund
Comparative Statements of Changes in Fiduciary Net Position
For the Fiscal Years Ended September 30, 2020 2019
Additions
Contributions
Employer contributions 599,436$ 519,827$
Plan member contributions 599,436 513,232
Total contributions 1,198,872 1,033,059
Investment income
Net appreciation in fair value of investments 87,988 1,173
Interest and dividends 310,148 269,965
Total investment income 398,136 271,138
Less investment expense (66,104) (63,645)
Net investment income 332,032 207,493
Total additions 1,530,904 1,240,552
Deductions
Benefits paid 595,725 601,744
Refunds of contributions ‐ 230,391
Administrative expenses 32,661 55,756
Total deductions 628,386 887,891
Net change in fiduciary net position 902,518 352,661
Net position, beginning of year 11,929,839 11,577,178
Net position, end of year 12,832,357$ 11,929,839$

‐ 153 ‐
City of Weslaco, Texas Fiduciary Funds
Marion Booth Endowment Fund Private Purpose Trust Fund
Comparative Statements of Fiduciary Net Position
September 30, 2020 2019
Assets
Cash and cash equivalents 16,711$ 11,612$
Investments 494,114 492,003
Total assets 510,825$ 503,615$
Liabilities
Accounts payable 501 1,000$
Total liabilities 501 1,000
Net position
Net position restricted for other purposes 510,324 502,615
Total net position 510,324 502,615
Total liabilities and net position 510,825$ 503,615$

‐ 154 ‐
City of Weslaco, Texas Fiduciary Funds
Marion Booth Endowment Fund Private Purpose Trust Fund
Comparative Statements of Changes in Fiduciary Net Position
For the Fiscal Years Ended September 30, 2020 2019
Additions
Interest income 10,228$ 12,548$
Total additions 10,228 12,548$
Deductions
Administrative expenses 2,519 3,038
Total deductions 2,519 3,038
Net change in fiduciary net position 7,709 9,510
Net Position, beginning of year 502,615 493,105
Net position, end of year 510,324$ 502,615$

‐ 155 ‐
City of Weslaco, Texas Component Unit
Economic Development Corporation of Weslaco Comparative Balance Sheets
September 30, 2020 2019
Assets
Cash and cash equivalents 6,376,134$ 4,776,645$
Restricted assets:
Cash and cash equivalents ‐ 733,449
Accounts receivable, net 12,152 458,935
Due from City of Weslaco 283,274 ‐
Land Escrow 31,473 ‐
Long‐term note receivables 3,223,281 1,969,563
Total Assets 9,926,314$ 7,938,592$
Liabilities
Accounts payable 119,110$ 5,724$
Accrued salaries and payroll taxes ‐ 7,126
Total Liabilities 119,110 12,850
Deferred Inflows of Resources
Unavailable revenue‐ non‐current receivables 3,223,281 1,969,563
Total deferred inflows of resources 3,223,281 1,969,563
Fund Balances
Restricted for:
Debt service 320,000 320,000
Capital projects ‐ 733,449
Unassigned 6,263,923 4,902,730
Total Fund Balances 6,583,923 5,956,179
Total Liabilities, Deferred Inflows of
Resources and Fund Balances 9,926,314$ 7,938,592$
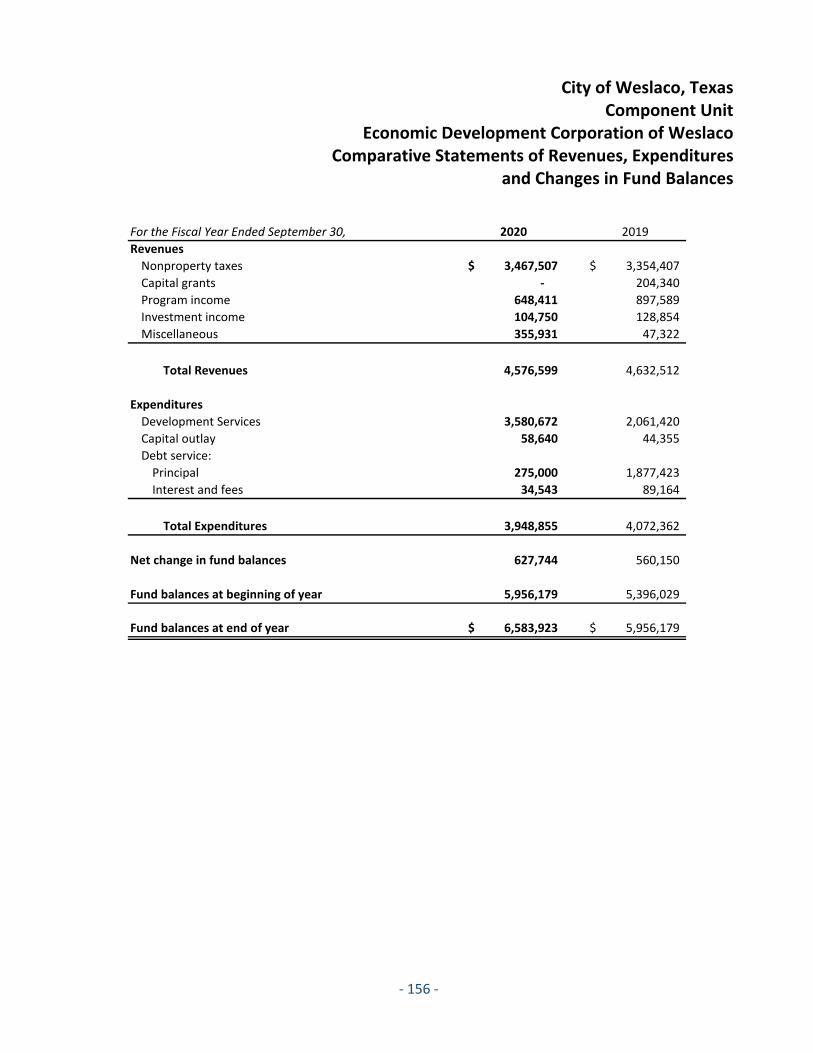
‐ 156 ‐
City of Weslaco, Texas Component Unit
Economic Development Corporation of Weslaco Comparative Statements of Revenues, Expenditures
and Changes in Fund Balances
For the Fiscal Year Ended September 30, 2020 2019
Revenues
Nonproperty taxes 3,467,507$ 3,354,407$
Capital grants ‐ 204,340
Program income 648,411 897,589
Investment income 104,750 128,854
Miscellaneous 355,931 47,322
Total Revenues 4,576,599 4,632,512
Expenditures
Development Services 3,580,672 2,061,420
Capital outlay 58,640 44,355
Debt service:
Principal 275,000 1,877,423
Interest and fees 34,543 89,164
Total Expenditures 3,948,855 4,072,362
Net change in fund balances 627,744 560,150
Fund balances at beginning of year 5,956,179 5,396,029
Fund balances at end of year 6,583,923$ 5,956,179$

‐ 157 ‐
City of Weslaco, Texas Component Unit
Economic Development Corporation of Weslaco Reconciliation of the Balance Sheet of Governmental Funds
To the Statement of Net Position
Fund balances of component unit 6,583,923$
Amounts reported for governmental activities in the statement of
net position are different because:
Capital assets used in governmental activities are not
financial resources and therefore are not reported in the funds 4,950,721
Long term note receivables are not available to pay for current period
expenditures and therefore are not reported as available resources and
deferred in the funds 3,223,281
Interest payable on long‐term debt does not require current financial
resources. Therefore interest payable is not reported as a liability in the
component unit balance sheet. (3,727)
Long term liabilities are not due and payable in the current period
and, therefore, they are not reported in the component unit
balance sheet. (880,000)
Net position of governmental activities 13,874,198$
September 30, 2020
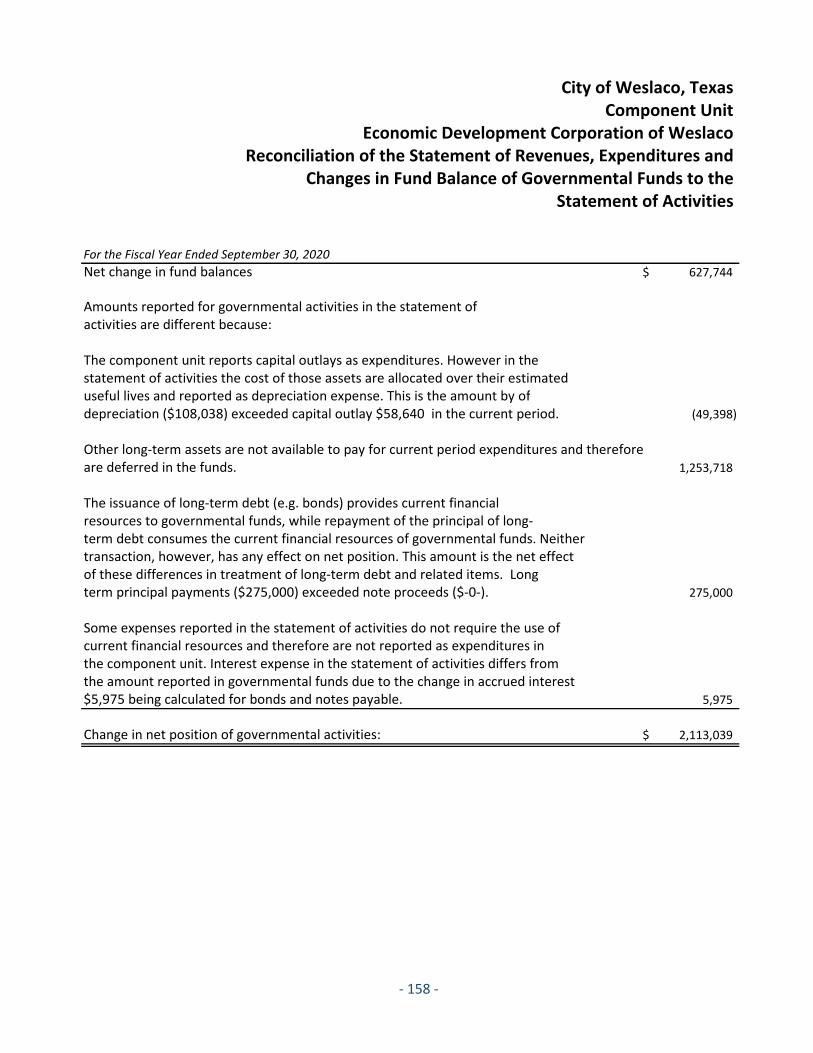
‐ 158 ‐
City of Weslaco, Texas Component Unit
Economic Development Corporation of Weslaco Reconciliation of the Statement of Revenues, Expenditures and
Changes in Fund Balance of Governmental Funds to the Statement of Activities
Net change in fund balances 627,744$
Amounts reported for governmental activities in the statement of activities are different because:
The component unit reports capital outlays as expenditures. However in the statement of activities the cost of those assets are allocated over their estimateduseful lives and reported as depreciation expense. This is the amount by ofdepreciation ($108,038) exceeded capital outlay $58,640 in the current period. (49,398)
Other long‐term assets are not available to pay for current period expenditures and thereforeare deferred in the funds. 1,253,718
The issuance of long‐term debt (e.g. bonds) provides current financial resources to governmental funds, while repayment of the principal of long‐term debt consumes the current financial resources of governmental funds. Neithertransaction, however, has any effect on net position. This amount is the net effect of these differences in treatment of long‐term debt and related items. Longterm principal payments ($275,000) exceeded note proceeds ($‐0‐). 275,000
Some expenses reported in the statement of activities do not require the use of current financial resources and therefore are not reported as expenditures in the component unit. Interest expense in the statement of activities differs from the amount reported in governmental funds due to the change in accrued interest$5,975 being calculated for bonds and notes payable. 5,975
Change in net position of governmental activities: 2,113,039$
For the Fiscal Year Ended September 30, 2020

‐ 159 ‐
SUPPLEMENTAL STATEMENTS AND SCHEDULES

‐ 159 ‐
City of Weslaco, Texas Schedule of Taxes Receivable – By Funds
At September 30, 2020
General Fund I & S Fund
Tax Year Total % Amount % Amount
2009 & Prior 417,229$ Various 285,558$ Various 131,671$
2010 53,959 72.47% 39,104 27.53% 14,855
2011 51,880 72.33% 37,523 27.67% 14,357 2012 50,869 72.00% 36,624 28.00% 14,245 2013 61,298 72.90% 44,686 27.10% 16,612 2014 61,594 71.91% 44,291 28.09% 17,303 2015 72,681 82.16% 59,717 17.84% 12,964 2016 88,988 83.79% 74,559 16.21% 14,429 2017 124,185 77.19% 95,854 22.81% 28,331 2018 224,910 77.14% 173,498 22.86% 51,412 2019 421,406 71.86% 302,827 28.14% 118,579
1,628,999 1,194,241 434,758
Less
Allowances for
uncollectible (618,310) (466,811) (151,499)
Net Amount 1,010,689$ 727,430$ 283,259$

‐ 160 ‐
City of Weslaco, Texas Analysis of Tax Collections, Adjustments,
and Allocation to Funds October 1, 2019 to September 30, 2020
TAX COLLECTIONS AND ADJUSTMENTS
Current
Uncollected Assessments Uncollected
Tax Year 10/1/19 & Correction Collections Adjustments 9/30/20
2009 & Prior 461,542$ ‐$ 29,556$ (14,757)$ 417,229$
2010 59,747 ‐ 4,038 (1,750) 53,959
2011 58,507 ‐ 4,445 (2,182) 51,880
2012 59,197 ‐ 6,216 (2,112) 50,869
2013 70,154 ‐ 6,956 (1,900) 61,298
2014 71,169 ‐ 8,085 (1,490) 61,594
2015 90,051 ‐ 11,328 (6,042) 72,681
2016 117,547 ‐ 26,322 (2,237) 88,988
2017 182,327 ‐ 53,067 (5,075) 124,185
2018 414,861 ‐ 133,918 (56,033) 224,910
2019 ‐ 12,988,669 12,512,099 (55,164) 421,406
Total 1,585,102$ 12,988,669$ 12,796,030$ (148,742)$ 1,628,999$
ALLOCATION TO FUNDS
I & S Fund
Tax Year Collections % $ % $
.
2009 & Prior 29,556$ Various 21,856$ Various 7,700$
2010 4,038 72.46% 2,926 27.54% 1,112
2011 4,445 72.33% 3,215 27.67% 1,230
2012 6,216 71.99% 4,475 28.01% 1,741
2013 6,956 72.90% 5,071 27.10% 1,885
2014 8,085 71.91% 5,814 28.09% 2,271
2015 11,328 82.16% 9,307 17.84% 2,021
2016 26,322 83.79% 22,054 16.21% 4,268
2017 53,067 77.19% 40,960 22.81% 12,107
2018 133,918 77.14% 103,306 22.86% 30,612
2019 12,512,099 73.33% 9,175,300 26.67% 3,336,799
Total 12,796,030$ 9,394,284$ 3,401,746$
General Fund

‐ 161 ‐
BONDED DEBT REQUIREMENTS

‐ 161 ‐
City of Weslaco, Texas Limited Tax Refunding Bonds, Series 2012
PrincipalFiscal Interest Due OutstandingYear Rate 15‐Feb 15‐Aug 15‐Feb 30‐Sep
2020 ‐$ ‐$ ‐$ 4,300,000$
2021 2.000% 54,635 40,637 1,400,000 2,900,000
2022 2.250% 40,637 24,550 1,430,000 1,470,000
2023 2.250% 24,550 ‐ 1,470,000 ‐
Total 119,822$ 65,187$ 4,300,000$
Interest Payments
As of September 30, 2020

‐ 162 ‐
City of Weslaco, Texas Tax and Revenue Certificates of Obligation, Series 2013
PrincipalFiscal Interest Due OutstandingYear Rate 15‐Feb 15‐Aug 15‐Feb 30‐Sep
2020 ‐$ ‐$ ‐$ 5,795,000$
2021 3.000% 127,300 127,300 360,000 5,435,000
2022 3.500% 121,900 121,900 370,000 5,065,000
2023 3.500% 115,425 115,425 390,000 4,675,000
2024 4.000% 108,600 108,600 380,000 4,295,000
2025 4.000% 101,000 101,000 400,000 3,895,000
2026 4.000% 93,000 93,000 415,000 3,480,000
2027 5.000% 84,700 84,700 430,000 3,050,000
2028 4.500% 73,950 73,950 450,000 2,600,000
2029 4.500% 63,825 63,825 470,000 2,130,000
2030 5.000% 53,250 53,250 495,000 1,635,000
2031 5.000% 40,875 40,875 520,000 1,115,000
2032 5.000% 27,875 27,875 545,000 570,000
2033 5.000% 14,250 14,250 570,000 ‐
Total 1,025,950$ 1,025,950$ 5,795,000$
Interest Payments
As of September 30, 2020

‐ 163 ‐
City of Weslaco, Texas Limited Tax Refunding Bonds, Series 2016
Principal PrincipalFiscal Interest Due OutstandingYear Rate 15‐Feb 15‐Aug 15‐Feb 30‐Sep
2020 ‐$ ‐$ ‐$ 2,915,000$
2021 5.00% 70,225 62,850 295,000 2,620,000
2022 5.00% 62,850 54,975 315,000 2,305,000
2023 5.00% 54,975 46,725 330,000 1,975,000
2024 5.00% 46,725 35,350 455,000 1,520,000
2025 5.00% 35,350 23,350 480,000 1,040,000
2026 5.00% 23,350 10,600 510,000 530,000
2027 4.00% 10,600 ‐ 530,000 ‐
Total 304,075$ 233,850$ 2,915,000$
Interest Payment
As of September 30, 2020

‐ 164 ‐
City of Weslaco, Texas Certificates of Obligation, Series 2018
Principal PrincipalFiscal Interest Due OutstandingYear Rate 15‐Feb 15‐Aug 15‐Feb 30‐Sep
2020 ‐$ ‐$ ‐$ 3,660,000$
2021 5.00% 72,378 72,378 135,000 3,525,000
2022 5.00% 69,003 69,003 145,000 3,380,000
2023 5.00% 65,378 65,378 150,000 3,230,000
2024 5.00% 61,628 61,628 160,000 3,070,000
2025 5.00% 57,628 57,628 165,000 2,905,000
2026 5.00% 53,503 53,503 175,000 2,730,000
2027 5.00% 49,128 49,128 185,000 2,545,000
2028 4.00% 44,503 44,503 195,000 2,350,000
2029 4.00% 40,603 40,603 200,000 2,150,000
2030 3.00% 36,603 36,603 210,000 1,940,000
2031 3.25% 33,453 33,453 215,000 1,725,000
2032 3.25% 29,959 29,959 220,000 1,505,000
2033 3.38% 26,384 26,384 230,000 1,275,000
2034 3.38% 22,503 22,503 235,000 1,040,000
2035 3.50% 18,538 18,538 245,000 795,000
2036 3.50% 14,250 14,250 255,000 540,000
2037 3.63% 9,788 9,788 265,000 275,000
2038 3.63% 9,969 ‐ 275,000 ‐
Total 715,199$ 705,230$ 3,660,000$
As of September 30, 2020
Interest Payment

‐ 165 ‐
City of Weslaco, Texas General Obligation Bonds, Series 2019
Principal PrincipalFiscal Interest Due OutstandingYear Rate 15‐Feb 15‐Aug 15‐Feb 30‐Sep
2020 ‐$ ‐$ ‐$ 8,630,000$
2021 5.00% 185,350 180,600 190,000 8,440,000
2022 5.00% 180,600 175,600 200,000 8,240,000
2023 5.00% 175,600 170,350 210,000 8,030,000
2024 5.00% 170,350 161,600 350,000 7,680,000
2025 5.00% 161,600 152,350 370,000 7,310,000
2026 5.00% 152,350 142,600 390,000 6,920,000
2027 5.00% 142,600 132,350 410,000 6,510,000
2028 5.00% 132,350 121,600 430,000 6,080,000
2029 4.00% 121,600 112,600 450,000 5,630,000
2030 4.00% 112,600 103,300 465,000 5,165,000
2031 4.00% 103,300 93,600 485,000 4,680,000
2032 4.00% 93,600 83,500 505,000 4,175,000
2033 4.00% 83,500 73,000 525,000 3,650,000
2034 4.00% 73,000 62,000 550,000 3,100,000
2035 4.00% 62,000 50,600 570,000 2,530,000
2036 4.00% 50,600 38,700 595,000 1,935,000
2037 4.00% 38,700 26,300 620,000 1,315,000
2038 4.00% 26,300 13,400 645,000 670,000
2039 4.00% 13,400 ‐ 670,000 ‐
Total 2,079,400$ 1,894,050$ 8,630,000$
As of September 30, 2020
Interest Payment

‐ 166 ‐
City of Weslaco, Texas Tax and Revenue Certificates of Obligation, Series 2012
PrincipalFiscal Interest Due OutstandingYear Rate 15‐Feb 15‐Aug 15‐Feb 30‐Sep
2020 ‐$ ‐$ ‐$ 1,200,000$
2021 3.000% 18,000 18,000 1,200,000 ‐
Total 18,000$ 18,000$ 1,200,000$
Interest Payments
As of September 30, 2020

‐ 167 ‐
City of Weslaco, Texas Tax and Revenue Certificates of Obligation, Series 2014
PrincipalFiscal Interest Due OutstandingYear Rate 15‐Feb 15‐Aug 15‐Feb 30‐Sep
2020 ‐$ ‐$ ‐$ 8,920,000$
2021 4.500% 201,300 201,300 75,000 8,845,000
2022 4.500% 200,363 200,363 75,000 8,770,000
2023 4.500% 199,238 199,238 80,000 8,690,000
2024 4.500% 198,038 198,038 80,000 8,610,000
2025 4.500% 196,438 196,438 80,000 8,530,000
2026 4.500% 194,838 194,838 90,000 8,440,000
2027 4.500% 193,038 193,038 100,000 8,340,000
2028 4.500% 191,038 191,038 1,035,000 7,305,000
2029 4.500% 167,750 167,750 1,085,000 6,220,000
2030 4.500% 143,338 143,338 1,140,000 5,080,000
2031 4.500% 117,688 117,688 1,185,000 3,895,000
2032 4.500% 91,025 91,025 1,245,000 2,650,000
2033 4.500% 63,013 63,013 1,295,000 1,355,000
2034 4.500% 33,875 33,875 1,355,000 ‐
Total 2,190,980$ 2,190,980$ 8,920,000$
Interest Payments
As of September 30, 2020

‐ 168 ‐
City of Weslaco, Texas Limited Tax Refunding Bonds, Series 2016
Principal Principal
Fiscal Interest Due Outstanding
Year Rate 15‐Feb 15‐Aug 15‐Feb 30‐Sep
2020 ‐$ ‐$ ‐$ 13,850,000$
2021 5.000% ‐ 292,350 1,700,000 12,150,000
2022 5.000% 292,350 247,850 1,780,000 10,370,000
2023 5.000% 247,850 201,100 1,870,000 8,500,000
2024 5.000% 201,100 151,975 1,965,000 6,535,000
2025 5.000% 151,975 100,100 2,075,000 4,460,000
2026 5.000% 100,100 45,600 2,180,000 2,280,000
2027 4.000% 45,600 ‐ 2,280,000 ‐
Total 1,038,975$ 1,038,975$ 13,850,000$
Interest Payment
As of September 30, 2020

‐ 169 ‐
City of Weslaco, Texas Limited Tax Refunding Bonds, Series 2017
Principal Principal
Fiscal Interest Due Outstanding
Year Rate 15‐Feb 15‐Aug 15‐Feb 30‐Sep
2020 ‐$ ‐$ ‐$ 19,045,000$
2021 3.000% 456,300 456,300 ‐ 19,045,000
2022 4.000% 456,300 456,300 1,230,000 17,815,000
2023 4.000% 431,700 431,700 1,280,000 16,535,000
2024 4.000% 406,100 406,100 1,455,000 15,080,000
2025 5.000% 377,000 377,000 1,500,000 13,580,000
2026 5.000% 339,500 339,500 1,565,000 12,015,000
2027 5.000% 300,375 300,375 1,640,000 10,375,000
2028 5.000% 259,375 259,375 1,875,000 8,500,000
2029 5.000% 212,500 212,500 1,970,000 6,530,000
2030 5.000% 163,250 163,250 2,070,000 4,460,000
2031 5.000% 111,500 111,500 2,175,000 2,285,000
2032 5.000% 57,125 57,125 2,285,000 ‐
Total 3,571,025$ 3,571,025$ 19,045,000$
Interest Payment
As of September 30, 2020

‐ 170 ‐
City of Weslaco, Texas Economic Development Sales Tax Revenue Refunding Bonds, Series 2012
Principal PrincipalFiscal Interest Due OutstandingYear Rate 15‐Feb 15‐Aug 15‐Feb 30‐Sep
2020 ‐$ ‐$ ‐$ 880,000$
2021 3.40% 14,960 10,200 280,000 600,000
2022 3.40% 10,200 5,185 295,000 305,000
2023 3.40% 5,185 ‐ 305,000 ‐
30,345$ 15,385$ 880,000$
Interest Payment
As of September 30, 2020

‐ 171 ‐
STATISTICAL SECTION

‐ 171 ‐
City of Weslaco, Texas Statistical Section
This part of the City of Weslaco, Texas’ comprehensive annual financial report presents detailed information as a context for understanding what the information in the financial statements, note disclosures, and required supplementary information says about the government’s overall financial health.
CONTENTS Financial Trends Tables I‐IV
These schedules contain trend information to help the reader understand how the government’s financial performance and well‐being have changed over time.
Revenue Capacity Tables V‐VIII
These schedules contain information to help the reader assess the government’s most significant local revenue sources, the property tax.
Debt Capacity Schedules IX‐XII These schedules present information to help the reader assess the affordability of the government’s current levels of outstanding debt and the government’s ability to issue additional debt in the future.
Demographic and Economic Information Tables XIII‐XVII These schedules offer demographic and economic indicators to help the reader understand the environment within which the government’s financial activities take place.
Operating Information Tables XVIII‐ XX These schedules contain service and infrastructure data to help the reader understand how the information in the government’s financial report related to the services the government provides and the activities it performs.
Sources: Unless otherwise noted, the information in these schedules is derived from the comprehensive annual financial report for the relevant year.

‐ 172 ‐
(This page intentionally left blank)

2020 2019 2018 2017 2016 2015 2014 2013 2012 2011
Governmental activities
Net investment in capital assets 34,782,635$ 32,298,614$ 28,246,600$ 26,444,251$ 23,122,052$ 20,001,901$ 11,915,869$ 6,236,897$ 13,564,135$ 14,042,568$
Restricted 1,411,010 1,134,772 1,052,578 952,339 1,211,727 1,787,280 11,967,344 13,059,262 5,760,438 6,259,134
Unrestricted (4,471,815) (7,151,192) (3,905,194) 588,485 3,639,565 6,148,950 729,653 9,294,414 4,806,131 1,330,224
Total governmental activities
net position 31,721,830$ 26,282,194$ 25,393,984$ 27,985,075$ 27,973,344$ 27,938,131$ 24,612,866$ 28,590,573$ 24,130,704$ 21,631,926$
Business‐type activities
Net investment in capital assets 47,636,213$ 47,630,121$ 46,083,251$ 40,509,740$ 39,969,259$ 38,975,364$ 34,020,461$ 12,912,376$ (1,310,318)$ 25,204,572$
Restricted 1,012,923 1,010,581 1,025,206 1,020,601 1,212,612 1,623,104 2,019,837 19,656,819 27,959,653 1,054,121
Unrestricted (2,290,173) (2,567,221) (1,122,171) 3,647,000 2,750,097 2,884,140 2,798,504 3,095,455 5,769,530 2,533,841
Total business‐type activities
net position 46,358,963$ 46,073,481$ 45,986,286$ 45,177,341$ 43,931,968$ 43,482,608$ 38,838,802$ 35,664,650$ 32,418,865$ 28,792,534$
Primary Government
Net investment in capital assets 82,418,848$ 79,928,735$ 74,329,851$ 66,953,991$ 63,091,311$ 58,977,265$ 45,936,330$ 19,149,273$ 12,253,817$ 39,247,140$
Restricted 2,423,933 2,145,353 2,077,784 1,972,940 2,424,339 3,410,384 13,987,181 32,716,081 33,720,091 7,313,255
Unrestricted (6,761,988) (9,718,413) (5,027,365) 4,235,485 6,389,662 9,033,090 3,528,157 12,391,770 10,575,661 3,864,065
Total primary government
net position 78,080,793$ 72,355,675$ 71,380,270$ 73,162,416$ 71,905,312$ 71,420,739$ 63,451,668$ 64,257,124$ 56,549,569$ 50,424,460$
Source: Government‐wide Statement of Activities
Fiscal 2014 net position has been restated to reflect the implementation of GASB Statement No. 68 "Accounting
and Financial Reporting for Pensions" and GASB 71 "Pension Transition for Contributions Made Subsequent
to the Measurement Date"
Fiscal year 2015 Governmental Activities net position has been restated to reflect prior period adjustments related
to GASB 68 implementation
Fiscal years prior to 2015 present the Economic Development Corporation as a blended component unit
Fiscal Year Ending September 30,
CITY OF WESLACO, TEXASNET POSITION BY COMPONENT
LAST TEN FISCAL YEARS(accrual basis of accounting)
TABLE I
‐173‐

2020 2019 2018 2017 2016 2015 2014 2013 2012 2011
Expenses
Governmental activities:
General government 7,411,268$ 7,783,921$ 6,439,519$ 7,877,473$ 7,793,661$ 7,475,817$ 4,699,927$ 4,077,130$ 4,079,035$ 4,426,526$
Public safety 17,299,968 16,488,279 15,315,946 15,375,565 13,374,018 11,530,338 10,217,398 10,714,272 10,195,023 11,562,667
Emergency medical service 200,937 185,668 151,728 144,283 137,335 101,226 269,969 332,102 462,305 398,347
Health ‐ ‐ ‐ ‐ ‐ ‐ ‐ 90,067 88,459 104,426
Public works 4,652,366 4,498,314 6,299,328 5,129,113 3,409,500 2,927,110 3,056,584 3,039,309 2,626,866 2,669,907
Culture and recreation 2,282,570 2,319,476 2,367,348 2,197,967 2,195,306 1,793,425 1,660,311 1,692,154 1,693,692 1,144,997
Development services ‐ ‐ ‐ ‐ ‐ ‐ 2,724,236 3,364,499 3,256,023 3,101,439
Interest on long‐term debt 1,195,174 1,299,788 919,744 828,514 1,134,675 1,009,379 1,182,183 1,187,398 2,326,416 1,452,443
Total governmental activities expenses 33,042,283 32,575,446 31,493,613 31,552,915 28,044,495 24,837,295 23,810,608 24,496,931 24,727,819 24,860,752
Business‐type activities:
Water and Wastewater 11,700,765 10,599,018 10,412,234 10,639,686 11,042,489 9,955,440 8,687,380 9,435,022 9,054,734 7,768,721
Solid Waste 4,590,974 4,483,587 4,368,411 3,850,543 4,147,973 4,348,050 4,117,588 4,044,683 4,047,757 3,863,097
Airport 1,172,619 1,035,359 925,905 850,901 687,702 668,097 536,560 507,619 505,452 532,689
Total business‐type activities expenses 17,464,358 16,117,964 15,706,550 15,341,130 15,878,164 14,971,587 13,341,528 13,987,324 13,607,943 12,164,507
Total primary government expenses 50,506,641$ 48,693,410$ 47,200,163$ 46,894,045$ 43,922,659$ 39,808,882$ 37,152,136$ 38,484,255$ 38,335,762$ 37,025,259$
Program Revenues
Governmental activities:
Fees, fines, and charges for services:
General government 1,384,500$ 1,468,352$ 959,157$ 896,763$ 714,548$ 725,949$ 588,302$ 405,601$ 381,323$ 363,068$
Public Safety 633,021 811,163 978,002 1,156,105 853,586 653,606 748,737 842,122 919,126 695,632
Emergency medical services 1,390,260 1,979,726 1,487,343 1,501,101 1,350,052 1,693,132 1,250,542 1,223,157 976,167 948,437
Other activities ‐ ‐ ‐ ‐ ‐ ‐ 155,378 394,360 399,142 260,053
Culture and recreation 18,568 33,373 43,670 76,676 85,163 73,359 ‐ ‐ ‐ ‐
Operating grants and contributions 6,120,352 889,479 648,763 585,580 484,336 273,122 233,899 99,359 16,179 ‐
Capital grants and contributions 435,057 625,616 446,200 137,739 571,469 1,065,726 463,568 454,010 724,994 500,163
Total governmental activities
program revenues 9,981,758 5,807,709 4,563,135 4,353,964 4,059,154 4,484,894 3,440,426 3,418,609 3,416,931 2,767,353
Business‐type activities:
Charges for services:
Water and Wastewater 12,865,310 12,276,613 12,297,037 12,205,565 10,806,055 12,121,383 11,744,692 12,160,485 11,034,905 9,411,060
Solid Waste 5,375,985 5,122,745 5,095,028 5,044,351 4,725,450 5,225,429 4,860,177 4,752,518 4,646,565 4,127,015
Airport 302,725 321,909 215,430 245,143 183,291 159,919 207,034 156,302 110,894 111,261
Operating grants and contributions ‐ ‐ ‐ ‐ ‐ ‐ ‐ ‐ ‐ ‐
Capital grants and contributions 1,381,244 911,329 1,001,408 2,325,711 1,658,319 4,148,622 481,853 664,218 2,424,601 154,017
Total business‐type activities
program revenues 19,925,264 18,632,596 18,608,903 19,820,770 17,373,115 21,655,353 17,293,756 17,733,523 18,216,965 13,803,353
Total primary government
program revenues 29,907,022$ 24,440,305$ 23,172,038$ 24,174,734$ 21,432,269$ 26,140,247$ 20,734,182$ 21,152,132$ 21,633,896$ 16,570,706$
Net (Expense)/Revenue
Governmental activities (23,060,525)$ (26,767,737)$ (26,930,478)$ (27,198,951)$ (23,985,341)$ (20,352,401)$ (20,370,182)$ (21,078,322)$ (21,310,888)$ (22,093,399)$
Business‐type activities 2,460,906 2,514,632 2,902,353 4,479,640 1,494,951 6,683,766 3,952,228 3,746,199 4,609,022 1,638,846
Total primary government net expense (20,599,619)$ (24,253,105)$ (24,028,125)$ (22,719,311)$ (22,490,390)$ (13,668,635)$ (16,417,954)$ (17,332,123)$ (16,701,866)$ (20,454,553)$
Fiscal years prior to 2015 present the Economic Development Corporation as a blended component unit
Fiscal year 2015 Governmental Activities net position has been restated to reflect prior period adjustments related
to implementation of GASB 68.
CITY OF WESLACO, TEXAS
For the Fiscal Year ended September 30,
TABLE II
(accrual basis of accounting)
LAST TEN FISCAL YEARS
CHANGES IN NET POSITION
‐174‐

For the Fiscal Years Ended September 30,
2020 2019 2018 2017 2016 2015 2014 2013 2012 2011
Governmental activities:
Taxes:
Ad valorem 13,107,912$ 12,127,801$ 12,002,082$ 11,615,301$ 11,264,052$ 10,352,897$ 9,767,217$ 9,823,287$ 9,710,670$ 9,632,751$
Sales 10,402,522 10,063,222 9,356,472 8,929,546 8,682,523 8,779,266 11,441,937 11,182,267 10,578,320 9,864,624
Occupancy 381,039 349,728 365,473 444,151 351,911 384,439 419,960 382,934 336,419 358,390
Franchise and other 1,906,926 1,992,390 1,926,341 1,890,883 1,893,085 1,855,156 1,664,769 1,640,932 1,631,134 1,724,786
Intergovernmental ‐ ‐ ‐ ‐ ‐ ‐ ‐ 16,149 4,421 77,375
Investment earnings 200,243 272,670 191,883 103,608 60,217 31,839 130,602 89,278 66,619 64,147
Gain (loss) on sale/retirement of
capital assets ‐ 55,829 ‐ 44,939 ‐ ‐ 56,720 (348,529) 116,255 100,339
Miscellaneous 320,215 353,746 858,322 353,902 721,662 232,759 377,674 226,739 249,246 301,972
Rescindment of contingency ‐ ‐ ‐ ‐ ‐ ‐ ‐ ‐ ‐ 550,000
Absences ‐ ‐ ‐ ‐ ‐ ‐ ‐ ‐ 191,261 ‐
Transfers 2,181,304 2,440,561 2,051,045 3,236,311 1,047,104 2,041,310 1,021,140 1,021,140 1,021,140 996,770
Total governmental activities 28,500,161 27,655,947 26,751,618 26,618,641 24,020,554 23,677,666 24,880,019 24,034,197 23,905,485 23,671,154
Business‐type activities
Investment earnings 5,880 13,124 7,672 2,044 1,513 1,350 4,013 19,609 13,629 109
Transfers (2,181,304) (2,440,561) (2,051,045) (3,236,311) (1,047,104) (2,041,310) (1,021,140) (1,021,140) (1,021,140) (996,770)
Total business‐type activities (2,175,424) (2,427,437) (2,043,373) (3,234,267) (1,045,591) (2,039,960) (1,017,127) (1,001,531) (1,007,511) (996,661)
Total primary government 26,324,737 25,228,510 24,708,245 23,384,374 22,974,963$ 21,637,706$ 23,862,892$ 23,032,666$ 22,897,974$ 22,674,493$
Change in Net Position
Governmental activities 5,439,636$ 888,210$ (178,860)$ (580,310)$ 35,213$ 3,325,265$ 4,509,837$ 2,955,875$ 2,594,597$ 1,577,755$
Business‐type activities 285,482 87,195 858,980 1,245,373 449,360 4,643,806 2,935,101 2,744,668 3,601,511 642,185
Total primary government 5,725,118$ 975,405$ 680,120$ 665,063$ 484,573$ 7,969,071$ 7,444,938$ 5,700,543$ 6,196,108$ 2,219,940$
CHANGES IN NET POSITION‐ CONTINTUED
CITY OF WESLACO, TEXAS
TABLE II‐ CONTINUED
(accrual basis of accounting)
LAST TEN FISCAL YEARS
‐175‐

For the Fiscal Years Ended September 30,
2020 2019 2018 2017 2016 2015 2014 2013 2012 2011
General Fund
Post GASB 54
Nonspendable 19,361$ 5,138$ 17,350$ 18,308$ 37,392$ 34,790$ 180,110$ 33,249$ ‐$ ‐$
Restricted ‐ ‐ 179,110 ‐ 104,886 466,288 466,288 696,765 65,791 57,391
Committed ‐ ‐ ‐ ‐ ‐ ‐ ‐ ‐ ‐ ‐
Assigned 2,874,000 2,874,000 2,874,000 ‐ ‐ ‐ ‐ ‐ ‐ ‐
Unassigned 9,151,461 7,965,191 6,353,316 7,511,496 7,939,293 8,523,908 6,478,642 4,738,640 1,627,107 779,427
Total General Fund 12,044,822$ 10,844,329$ 9,423,776$ 7,529,804$ 8,081,571$ 9,024,986$ 7,125,040$ 5,468,654$ 1,692,898$ 836,818$
All Other Governmental Funds
Post GASB 54
Nonspendable ‐$ ‐$ ‐$ ‐$ 34,311$ ‐$ ‐$ ‐$ ‐$ ‐$
Restricted 13,433,832 15,407,807 2,408,585 3,617,027 3,958,733 5,512,740 1,793,631 1,691,574 1,772,642 1,618,055
Assigned 1,455,433 2,240,127 3,043,229 2,001,223 1,950,380 1,250,000 ‐ ‐ ‐ ‐
Unassigned, reported in:
Special revenue funds ‐ ‐ ‐ ‐ ‐ ‐ 3,127,878 2,936,214 2,308,622 4,718,358
Capital projects funds ‐ ‐ ‐ ‐ ‐ ‐ 6,399,437 7,701,460 1,166,502 1,206,560
Total all other governmental funds 14,889,265$ 17,647,934$ 5,451,814$ 5,618,250$ 5,943,424$ 6,762,740$ 11,320,946$ 12,329,248$ 5,247,766$ 7,542,973$
Source: Information obtained from the City's Annual Financial Report
(1) The City implemented GASB Statement No. 54 in fiscal year 2011
FUND BALANCES OF GOVERNMENTAL FUNDS
CITY OF WESLACO, TEXAS
TABLE III
(modified accrual basis of accounting)
LAST TEN FISCAL YEARS (1)
‐176‐

For the Fiscal Years Ended September 30,
2020 2019 2018 2017 2016 2015 2014 2013 2012 2011
Revenues
Taxes:
Property taxes 13,103,915$ 12,087,125$ 12,131,253$ 11,645,836$ 11,273,279$ 10,550,931$ 9,932,967$ 10,011,483$ 9,710,637$ 9,847,584$
Sales 10,402,522 10,063,222 9,356,472 8,929,546 8,682,523 8,779,266 11,441,937 11,182,267 10,578,320 9,864,624
Occupancy 381,039 349,728 365,473 444,151 351,911 384,439 419,960 382,934 336,419 358,390
Franchise and other 1,906,926 1,992,390 1,926,341 1,890,883 1,893,085 1,855,156 1,664,769 1,640,932 1,631,134 1,724,786
Charges for services 2,385,039 3,094,960 2,051,705 2,003,126 1,644,414 3,471,864 2,783,840 2,832,851 2,540,973 2,565,294
Program income ‐ ‐ ‐ ‐ ‐ ‐ 360,576 389,134 341,845 150,054
Intergovernmental 6,225,877 1,390,095 893,763 723,319 1,055,805 1,338,849 697,467 569,518 745,594 577,538
Licenses and permits 653,513 693,682 719,740 664,177 493,175 479,501 446,828 405,601 381,323 363,068
Investment income 200,243 272,670 191,883 103,608 60,217 31,839 130,602 89,278 66,619 64,147
Fines and forfeitures 356,116 503,972 696,728 752,327 698,250 523,767 636,486 668,891 772,752 463,778
Contributions ‐ ‐ ‐ ‐ ‐ ‐ 2,736 50 500 142
Miscellaneous 320,215 478,746 1,059,521 314,916 889,172 394,982 374,938 527,110 248,746 301,830
Total revenues 35,935,405 30,926,590 29,392,879 27,471,889 27,041,831 27,810,594 28,893,106 28,700,049 27,354,862 26,281,235
Expenditures
General government 6,725,386 6,237,293 6,049,070 6,395,390 6,133,070 5,991,720 4,617,587 3,697,885 3,797,404 4,310,348
Public Safety 19,054,681 15,972,317 15,490,747 15,250,314 12,165,292 10,476,065 10,483,329 10,699,897 10,327,350 11,664,128
Public Works 5,543,843 4,745,924 5,665,443 4,377,328 2,104,864 1,790,960 1,558,496 1,556,054 1,299,033 1,342,074
Health ‐ ‐ ‐ ‐ ‐ ‐ ‐ 85,956 84,348 100,315
Culture and recreation 2,026,864 1,952,185 2,368,044 2,136,834 1,709,199 1,376,551 1,311,421 1,428,512 1,447,298 1,073,525
Economic development 591,644 590,635 576,780 581,915 589,640 593,849 1,568,220 2,144,101 1,923,521 2,171,025
Nondepartmental ‐ ‐ ‐ ‐ ‐ ‐ 565,216 477,223 395,172 684,020
Capital outlay ‐ ‐ ‐ 949,108 4,530,211 4,692,755 2,390,421 823,384 2,416,513 633,058
Debt service
Principal 3,719,209 3,409,100 3,094,444 3,347,137 2,389,617 2,418,462 2,711,314 2,526,603 2,004,577 9,628,025
Interest and fiscal charges 1,153,870 1,051,561 755,633 782,830 786,594 890,033 1,152,048 1,197,893 1,352,412 1,420,192
Advance refunding escrow ‐ ‐ ‐ ‐ 77,555 ‐ ‐ ‐ ‐ ‐
Total expenditures 38,815,497 33,959,015 34,000,161 33,820,856 30,486,042 28,230,395 26,358,052 24,637,508 25,047,628 33,026,710
Excess of revenues over (under) expenditures (2,880,092) (3,032,425) (4,607,282) (6,348,967) (3,444,211) (419,801) 2,535,054 4,062,541 2,307,234 (6,745,475)
Other Financing Sources (Uses)
Proceeds from sale of capital assets 194,261$ 55,829$ 92,117$ 300,741$ ‐$ ‐$ 56,720$ 56,950$ 124,435$ 367,174$
Debt Proceeds 440,000 14,257,349 4,506,702 2,184,974 4,450,281 658,299 ‐ 22,157,515 1,155,000 9,044,918
Proceeds from 380 Agreements ‐ ‐ ‐ ‐ ‐ ‐ ‐ ‐ ‐ ‐
Bond interest ‐ ‐ ‐ ‐ ‐ ‐ ‐ ‐ ‐ ‐
Premium on bond ‐ ‐ ‐ ‐ 701,808 ‐ ‐ ‐ ‐ ‐
Bond redemption ‐ ‐ ‐ ‐ (4,392,713) ‐ ‐ (14,630,000) ‐ ‐
Debt issuance costs ‐ ‐ ‐ ‐ ‐ ‐ ‐ (366,731) (30,323) (101,814)
Volunteer separation expense ‐ ‐ ‐ ‐ ‐ ‐ ‐ ‐ ‐ ‐
380 Agreement expenditures ‐ ‐ ‐ ‐ ‐ ‐ (738,139) (581,949) (780,562) (912,644)
Accrued 380 Agreement Interest ‐ ‐ ‐ ‐ ‐ ‐ ‐ ‐ (949,937) ‐
Sales Tax rebates ‐ ‐ ‐ ‐ ‐ ‐ (580,488) (645,082) (843,934) ‐
Transfers in 4,496,390 4,780,188 5,065,169 4,686,079 2,208,425 2,419,014 ‐ ‐ ‐ ‐
Transfers out (2,315,086) (2,444,268) (3,329,170) (1,699,768) (1,286,321) (2,460,758) (700,000) (700,000) (480,000) (200,000)
Total other financing sources (uses) 2,815,565 16,649,098 6,334,818 5,472,026 1,681,480 616,555 (1,961,907) 5,290,703 (1,805,321) 8,197,634
Net change in fund balances (64,527)$ 13,616,673$ 1,727,536$ (876,941)$ (1,762,731)$ 196,754$ 573,147$ 9,353,244$ 501,913$ 1,452,159$
Debt service as a percentage of noncapital
expenditures 14% 15% 13% 14% 14% 16% 19% 19% 17% 52%
CITY OF WESLACO, TEXAS
CHANGES IN FUND BALANCES, GOVERNMENTAL FUNDS
LAST TEN FISCAL YEARS
(modified accrual basis of accounting)
TABLE IV
‐177‐

Fiscal
Year
Tax Roll
YearAmount
Percentage
of LevyAmount
Percentage
of Levy
2011 2010 9,310,540 8,704,523 93.49% 537,361 9,241,884 99.26%2012 2011 9,346,948 8,859,282 94.78% 416,479 9,275,761 99.24%2013 2012 9,559,563 9,095,317 95.14% 386,401 9,481,717 99.19%2014 2013 9,667,300 9,119,003 94.33% 446,866 9,565,869 98.95%2015 2014 9,952,186 9,682,147 97.29% 151,976 9,834,123 98.81%2016 2015 10,995,171 10,562,367 96.06% 250,955 10,813,322 98.35%2017 2016 11,478,848 10,983,948 95.69% 474,357 11,458,305 99.82%2018 2017 11,812,045 11,481,619 97.20% 259,969 11,741,588 99.40%2019 2018 11,882,540 11,480,754 96.62% 192,992 11,673,746 98.24%2020 2019 12,988,669 12,512,099 96.33% ‐ 12,512,099 96.33%
Source: Hidalgo County Tax Assessor‐Collector
www.hidalgocountytax.org
CITY OF WESALCO, TEXASPROPERTY TAX LEVIES AND COLLECTIONS
LAST TEN FISCAL YEARS
Collected within the
Fiscal Year of the Levy Total Collections to DateTaxes Levied
for the
Fiscal Year
Collections
in Subsequent
Years
TABLE V
‐178‐

FISCAL
YEAR
RESIDENTIAL
PROPERTY
COMMERCIAL
PROPERTYTAX‐EXEMPT
TOTAL TAXABLE
ASSESSED VALUE
TOTAL DIRECT
OVERLAPPING
TAX RATE
2011 773,012,581 638,233,550 352,481,585 1,411,246,131 2.6978
2012 769,592,896 652,146,592 335,597,711 1,421,739,488 2.6978
2013 792,847,612 670,099,750 336,299,548 1,462,947,362 2.6996
2014 851,914,723 646,031,643 336,831,403 1,497,946,366 2.7113
2015 804,694,927 675,552,726 388,852,013 1,480,247,653 2.7363
2016 905,060,888 755,965,371 413,829,808 1,661,026,259 2.7357
2017 934,058,109 799,468,448 410,195,911 1,733,526,557 2.7357
2018 1,001,015,474 810,655,535 483,054,753 1,811,671,009 2.7357
2019 1,038,039,659 847,999,734 497,055,323 1,886,039,393 2.7357
2020 1,045,958,898 971,674,532 517,227,567 2,017,633,430 2.5842
Source: Hidalgo County Appraisal Districtwww.hidalgoad.org
CITY OF WESLACO, TEXASASSESSED VALUE OF TAXABLE PROPERTY
LAST TEN FISCAL YEARSTABLE VI
‐179‐

TAXPAYER
TAXABLE
ASSESSED
VALUE RANK
% OF TOTAL CITY
TAXABLE
ASSESSED VALUE
TAXABLE
ASSESSED
VALUE RANK
% OF TOTAL CITY
TAXABLE
ASSESSED VALUE
H E Butt Grocery Company 40,769,270$ 1 2.02% 38,475,794$ 1 2.73%H E B Weslaco Transportation 21,405,246 2 1.06% 12,594,975 2 0.89%Wal‐Mart Real Estate Business 16,413,816 3 0.81% 8,635,324 5 0.61%G3C Weslaco Westgate 15,173,098 4 0.75%Capcor Weslaco LTD 14,959,087 5 0.74%AEP Texas Central Co 14,077,720 6 0.70% 6,298,560 10 0.45%Weslaco Micro‐Hospital LLC 9,400,000 7 0.47%Jazman RGV Group 8,530,254 8 0.42%Lowes Home Centers Inc 7,689,390 9 0.38% 5,260,544 13 0.35%BOYD Weslaco LTD 7,669,766 10 0.38%Weslaco Palm Plaza 7,638,938 11 0.38% 5,807,190 11 0.41%Weslaco MHC Limited Partnership 7,577,505 12 0.38%JCPenney #1101 7,485,894 13 0.37% 6,747,644 8 0.48%Weslaco Motors LLP 7,363,133 14 0.36%WesFar Apartments LLC 7,165,969 15 0.36%HD Development Properties LP 7,091,344 16 0.35% 4,642,820 17 0.33%Parkwood Rentals LTD 6,587,499 17 0.33%HIC Texas LLC 6,226,022 18 0.31% 4,538,362 18 0.32%
RST Texas Retail Estate LP 6,106,901 19 0.30%
Weslaco Ford/Mercury Inc 6,006,444 20 0.30%
Clearview Weslaco LLP 10,878,712 3 0.77%
John Knox Villages 10,501,271 4 0.74%
Reyna Family Land LTD 8,626,661 6 0.61%
Wal‐Mart Property Tax Department 8,164,299 7 0.58%
Lowe's #2980 6,410,698 9 0.45%
2300 Sugar Sweet Realty LLC 5,722,531 12 0.41%
Home Depot Centers Inc 5,194,551 14 0.37%
Verizon Southwest 4,868,350 15 0.34%JC Penny #1101 4,714,172 16 0.33%
SDI Weslaco Holdings 4,524,398 19 0.32%
RGV Express LTD 4,488,802 20 0.32%
Saenz Maximo
TOTAL 225,337,296$ 11.17% 167,095,658$ 11.82%
Source:www.hidalgoad.org
2019 2010
CITY OF WESLACO, TEXASPRINCIPAL PROPERTY TAXPAYERS
CURRENT CALENDAR YEAR AND NINE YEARS AGOTABLE VII
‐180‐

FISCAL
YEAR
TAX
YEAR
MAINTENANCE &
OPERATION
INTEREST &
SINKING
(PER $100)
CITY
(Per $100)
WISD STC
(Per $100)
Hidalgo Co
(Per $100)
DD #1
(Per $100)
STISD
(Per $100)
Total
PROPERTY TAX RATES
2011 2010 0.5049 0.1918 0.6967 1.1397 0.1497 0.5900 0.0725 0.0492 2.69782012 2011 0.5039 0.1928 0.6967 1.1397 0.1497 0.5900 0.0725 0.0492 2.69782013 2012 0.5016 0.1951 0.6967 1.1397 0.1507 0.5900 0.0733 0.0492 2.69962014 2013 0.5006 0.1861 0.6867 1.1397 0.1500 0.5900 0.0957 0.0492 2.71132015 2014 0.4866 0.1901 0.6767 1.1397 0.1850 0.5900 0.0957 0.0492 2.73632016 2015 0.5560 0.1207 0.6767 1.1397 0.1850 0.5900 0.0951 0.0492 2.73572017 2016 0.5586 0.1081 0.6667 1.1597 0.1850 0.5800 0.0951 0.0492 2.73572018 2017 0.5146 0.1521 0.6667 1.1597 0.1850 0.5800 0.0951 0.0492 2.73572019 2018 0.5143 0.1524 0.6667 1.1597 0.1850 0.5800 0.0951 0.0492 2.73572020 2019 0.5109 0.1858 0.6967 1.0189 0.1718 0.5750 0.1026 0.0192 2.5842
TAX LEVIES
2011 2010 9,310,540 19,795,607 37,953,268 148,860,984 18,910,655 13,752,694 248,583,748 2012 2011 9,346,948 20,111,115 38,191,930 150,274,322 19,197,219 13,901,594 251,023,128 2013 2012 9,559,563 21,597,467 43,100,124 165,736,613 19,880,682 14,279,092 274,153,542 2014 2013 9,667,300 21,552,277 42,899,924 165,736,613 25,956,088 14,279,092 280,091,295 2015 2014 9,952,186 23,002,324 54,881,207 171,956,770 27,107,682 14,792,577 301,692,745 2016 2015 10,995,171 23,464,321 56,775,623 179,965,377 28,837,880 15,689,081 315,727,453 2017 2016 11,478,848 24,406,360 59,677,412 189,058,158 30,258,335 16,467,923 331,347,036 2018 2017 11,812,045 25,578,128 61,936,282 182,090,796 31,810,341 17,291,319 330,518,911 2019 2018 11,882,540 28,008,489 70,877,607 217,365,496 34,953,292 19,071,850 382,159,273 2020 2019 12,988,669 26,647,494 69,667,829 228,197,205 40,061,569 7,861,517 385,424,283
CITY OF WESLACO, TEXASPROPERTY TAX RATES AND TAX LEVIES ‐ ALL OVERLAPPING GOVERNMENTS
LAST TEN FISCAL YEARSTABLE VIII
City Direct Rates OVERLAPPING RATES
‐181‐

‐ 182 ‐
(This page intentionally left blank)

GROSS DEBT
Less
SINKING FUND
ESTIMATED %
DEBT APPLICABLE TO
CITY OF WESLACO
CITY OF WESLACO
SHARE OF DEBT
City of Weslaco, Texas 33,648,713$ 100.00% 33,648,713$ Total Direct Debt 33,648,713 33,648,713
Weslaco Ind School Dist 68,581,526 72.44% 49,680,457
Hidalgo County 366,620,000 5.31% 19,467,522
Hidalgo Co Drainage Dist #1 172,350,000 5.54% 9,548,190
South Texas College 128,814,693 4.99% 6,427,853Total overlapping debt 736,366,219 85,124,022
Total direct and overlapping debt: 118,772,735$
Percent of Assessed Valuation: 5.89%
Direct Overlapping Debt per Capita: 2,853$
POPULATION: 41,629
ASSESSED VALUATION 2,017,633,430$
CITY OF WESLACO, TEXASCOMPUTATION OF DIRECT AND OVERLAPPING DEBT
AS OF SEPTEMBER 30, 2020TABLE IX
‐183‐

Legal Debt Margin Calculation to Fiscal Year 2019
Assessed Value 2,017,633,430$
Debt Limit (10% of assessed value) 201,763,343
Debt applicable to limit:
General oustanding debt 90,923,453
Less: Amount set aside
for repayment of general
obligation debt (531,690)
Total net debt applicable to limit 90,391,763
Legal debt margin 111,371,580
2011 2012 2013 2014
Debt Limit 141,124,613$ 142,173,949$ 139,051,427$ 159,911,825$
Total net debt applicable to limit 24,605,645 21,684,025 26,487,380 24,605,645
Legal debt margin 116,518,968$ 120,489,924$ 112,564,047$ 135,306,180$
Total net debt applicable to the limit
as a percentage of debt limit 17.44% 15.25% 19.05% 15.39%
Note: In 1955, the State Legislature enacted the 10% debt limit rate for school districts
in Texas and has subsequently been used by municipalities as a general rule in
computing debt margin.
CITY OF WESLACO, TEXASLEGAL DEBT MARGIN INFORMATION
LAST TEN FISCAL YEARSTABLE X
-184-

2015 2016 2017 2018 2019 2020
151,195,149$ 166,102,626$ 173,352,656$ 181,167,101$ 188,603,939$ 201,763,343$
23,040,965 19,704,803 18,296,141 16,806,190 90,541,350 90,391,763
128,154,184$ 146,397,823$ 155,056,515$ 164,360,911$ 98,062,589$ 111,371,580$
15.24% 11.86% 10.55% 9.28% 48.01% 44.80%
-185-

Principal Interest
2011 8,789,754 6,094,985 621,415 3,316,184 542,298 64,930 5.46 2012 10,354,040 5,846,464 680,865 5,188,441 472,092 112,753 8.87 2013 11,475,677 6,655,622 684,808 5,504,863 480,224 97,652 9.53 2014 10,649,451 7,330,737 727,055 4,045,768 492,312 82,233 7.04 2015 11,372,511 6,702,152 703,986 5,374,345 532,148 65,993 8.99 2016 10,504,921 7,162,537 649,682 3,992,065 545,981 48,918 6.71 2017 11,207,113 8,364,535 689,843 3,532,421 560,500 31,398 5.97 2018 11,429,958 5,886,226 684,998 6,228,730 574,676 13,410 10.59 2019 12,148,004 8,870,739 642,214 3,919,479 138,151 2,152 27.94
2020 12,801,566 8,575,221 696,141 4,922,486 ‐ ‐ ‐
TABLE XI
Coverage
CITY OF WESLACO, TEXASPLEDGED‐REVENUE COVERAGE
LAST TEN FISCAL YEARS
Fiscal
Year
Utility
Service
Charges
Net
Available
Debt ServiceLess:
Operating
Expenses
Plus:
CIP Fee (1)
Non‐
Operating
‐186‐

Fiscal
Year
General
Obligation
Bonds
Certificate
of Obligation Capital Leases
Bond
Premiums
Notes
Payable
380 Agreement
Infrastructure
Total Governmental
Activities
Percentage of
Personal Income
Per
Capita2011 620,800 23,223,916 ‐ ‐ ‐ 6,815,202 30,659,918 5.78% 859.54 2012 419,200 21,776,008 ‐ 413,195 ‐ 6,034,640 28,643,043 5.02% 777.37 2013 208,000 26,443,550 ‐ 610,724 ‐ 5,452,691 32,714,965 5.65% 881.97 2014 ‐ 24,894,102 1,693,177 563,767 ‐ 4,714,552 31,865,598 5.41% 847.47 2015 2,006,250 21,110,000 1,947,164 516,809 ‐ 4,094,605 29,674,828 4.84% 751.76 2016 1,532,231 19,285,000 2,099,678 1,171,661 ‐ 3,719,205 27,807,775 4.04% 694.62 2017 1,037,731 17,800,000 2,983,316 1,000,740 431,333 2,820,616 26,073,736 3.62% 646.06 2018 527,407 16,425,000 3,921,594 1,017,845 395,458 4,804,646 27,091,950 3.49% 658.03 2019 8,850,000 18,800,000 3,199,442 2,071,103 357,091 4,211,673 37,489,309 4.83% 910.58 2020 8,630,000 16,670,000 2,494,617 1,832,879 756,053 3,588,327 33,971,876 4.32% 816.06
Fiscal
Year
General
Obligation
Bonds
Certificate
of Obligation Revenue Bonds
Capital
Leases Tax Notes Bond Premiums
Total Business‐Type
Activities
Percentage of
Personal Income
Per
Capita2011 1,300,284 2,845,000 21,290,000 ‐ ‐ ‐ 25,435,284 4.79% 713.07 2012 1,089,792 2,470,000 45,215,000 ‐ 8,500,000 1,366,793 58,641,585 10.27% 1,591.53 2013 870,768 2,090,000 44,790,000 ‐ 8,040,000 1,366,793 57,157,561 9.86% 1,540.93 2014 768,456 1,700,000 44,325,000 ‐ 7,735,000 1,800,466 56,328,922 9.56% 1,498.07 2015 529,308 19,230,000 34,700,000 ‐ 6,545,000 1,699,141 62,703,449 10.23% 1,588.47 2016 404,029 49,260,000 870,000 ‐ 4,810,000 4,734,806 60,078,835 8.74% 1,500.73 2017 273,745 48,090,000 440,000 ‐ 2,620,000 6,909,104 58,332,849 8.10% 1,445.39 2018 138,853 48,090,000 ‐ 6,501,903 ‐ 6,082,019 60,812,775 7.83% 1,477.08 2019 ‐ 45,880,000 ‐ 6,532,513 ‐ 5,233,304 57,645,817 7.42% 1,400.16 2020 ‐ 43,015,000 ‐ 6,692,281 ‐ 4,424,653 54,131,934 6.88% 1,300.34
Fiscal years prior to 2015 present the Economic Development Corporation as a blended component unit.
Business‐Type Activities
Governmental Activities
CITY OF WESLACO, TEXASRATIOS OF OUTSTANDING DEBT BY TYPE
LAST TEN FISCAL YEARSTABLE XII
‐187‐

‐ 188 ‐
(This page intentionally left blank)

Fiscal
Year
General
Obligation
Bonds
Certificate
of Obligation Capital Leases
Bond
Premiums
Notes
Payable
Debt Service
Restricted Net
Assets Net Bonded Debt
Percentage of
Actual Taxable
Value of Property
Per
Capita2011 620,800 23,223,916 ‐ ‐ ‐ 603,258 23,241,458 1.65% 651.572012 419,200 21,776,008 ‐ 413,195 ‐ 924,187 21,684,216 1.53% 588.512013 208,000 26,443,550 ‐ 610,724 ‐ 949,798 26,312,476 1.80% 709.372014 ‐ 24,894,102 1,693,177 563,767 ‐ 996,317 26,154,729 1.75% 695.592015 2,006,250 21,110,000 1,947,164 516,809 ‐ 798,285 24,781,938 1.67% 627.802016 1,532,231 19,285,000 2,099,678 1,171,661 ‐ 540,114 23,548,456 1.42% 588.232017 1,037,731 17,800,000 2,983,316 1,000,740 431,333 146,217 23,106,903 1.33% 572.552018 527,407 16,425,000 3,921,594 1,017,845 395,458 400,508 21,886,796 1.21% 531.612019 8,850,000 18,800,000 3,199,442 2,071,103 357,091 382,103 32,895,533 1.74% 799.002020 8,630,000 16,670,000 2,494,617 1,832,879 756,053 531,690 29,851,860 1.48% 717.09
Fiscal
Year
General
Obligation
Bonds
Certificate
of Obligation Revenue Bonds
Capital
Leases Tax Notes Bond Premiums
Debt Service
Restricted Net Assets Net Bonded Debt
Percentage of
Actual Taxable
Value of
Property
Per
Capita2011 1,300,284 2,845,000 21,290,000 ‐ ‐ ‐ 603,258 24,832,026 1.76% 696.16 2012 1,089,792 2,470,000 45,215,000 ‐ 8,500,000 1,366,793 924,187 57,717,398 4.06% 1,566.45 2013 870,768 2,090,000 44,790,000 ‐ 8,040,000 1,366,793 949,798 56,207,763 3.84% 1,515.32 2014 768,456 1,700,000 44,325,000 ‐ 7,735,000 1,800,466 996,317 55,332,605 3.69% 1,471.57 2015 529,308 19,230,000 34,700,000 ‐ 6,545,000 1,699,141 798,285 61,905,164 4.18% 1,568.25 2016 404,029 49,260,000 870,000 ‐ 4,810,000 4,734,806 540,114 59,538,721 3.58% 1,487.24 2017 273,745 48,090,000 440,000 ‐ 2,620,000 6,909,104 146,217 58,186,632 3.36% 1,441.76 2018 138,853 48,090,000 ‐ 6,501,903 ‐ 6,082,019 400,508 60,412,267 3.33% 1,467.35 2019 ‐ 45,880,000 ‐ 6,532,513 ‐ 5,233,304 382,103 57,263,714 3.04% 1,390.87 2020 ‐ 43,015,000 ‐ 6,692,281 ‐ 4,424,653 531,690 53,600,244 2.66% 1,287.57
Fiscal years prior to 2015 present the Economic Development Corporation as a blended component unit.
Business‐Type Activities
Governmental Activities
CITY OF WESLACO, TEXASRATIOS OF GENERAL BONDED DEBT OUTSTANDING BY TYPE
LAST TEN FISCAL YEARSTABLE XIII
‐189‐

CALENDAR YEAR
Description 2010 2011 2012 2013
Agriculture, Forestry, Fishing, Hunting ‐$ ‐$ ‐$ ‐$ Construction 998,716 1,547,374 2,839,442 4,144,701 Manufacturing 908,666 1,043,977 944,415 1,374,389 Wholesale Trade 9,751,237 10,052,972 12,488,875 12,138,082 Retail trade 274,769,984 296,818,500 317,956,827 321,405,175 Transportation and warehousing 1,417,200 1,311,262 1,637,871 303,218 Information 6,916,201 7,440,719 9,086,834 13,229,751 Finance and insurance 2,172,227 2,096,979 1,999,036 2,177,332 Real estate, rental and leasing 3,062,869 2,730,662 2,783,960 2,881,418 Professional, scientific and technical 891,767 1,136,202 1,072,369 838,393 Administration, support, waste management, and remediation 1,730,296 3,592,463 6,176,976 5,830,822 Educational Services 17,608 38,083 57,033 60,791 Health care and social assistance 696,535 512,033 560,036 560,511 Arts, entertainment, and recreation 1,143,847 1,774,225 1,692,620 1,952,878 Accomodation and food service 70,735,449 76,342,659 82,835,766 86,549,881 Other Services 8,923,286 9,623,843 10,287,220 10,073,577 Other 16,125 19,346 15,201 17,086
Total 384,152,013$ 416,081,299$ 452,434,481$ 463,538,005$
City Direct Sales Tax 2.00% 2.00% 2.00% 2.00%
Source:https://mycpa.cpa.state.tx.us/allocation/QtrSalesReportByResults
CITY OF WESLACO, TEXASTAXABLE SALES BY INDUSTRYLAST TEN CALENDAR YEARS
TABLE XIV
‐190‐

2014 2015 2016 2017 2018 2019
3,207$ 481$ ‐$ ‐$ ‐$ ‐$ 3,219,615 4,096,068 4,826,488 4,674,526 9,760,889 12,862,191 2,222,116 2,378,251 2,445,955 2,072,963 2,107,094 5,557,368
11,505,002 10,535,297 19,201,140 16,838,228 15,259,410 17,620,327 331,306,451 321,305,069 309,212,380 305,882,008 328,057,738 329,808,142
276,655 ‐ 281,022 ‐ ‐ 411,291 13,421,501 12,686,024 12,326,179 13,508,709 14,393,780 14,811,056 2,641,731 1,607,030 2,651,045 2,878,573 3,251,223 3,255,107 2,356,502 2,654,053 5,278,955 6,528,384 7,465,029 8,590,041 989,140 1,137,739 1,024,656 1,018,046 993,481 837,433
5,368,529 2,194,032 1,768,350 2,109,445 2,299,598 3,143,185 166,539 94,791 350,578 318,639 330,995 480,058 691,519 1,256,497 941,118 704,434 767,353 674,483
2,581,663 3,673,234 3,377,805 4,406,081 4,652,256 5,176,107 96,841,186 109,219,280 111,418,585 115,038,118 122,294,284 130,022,066 10,221,189 10,775,234 11,543,232 11,810,678 15,390,148 15,836,736
19,870 22,000 6,560 16,481 14,056 2,721
483,832,415$ 483,635,080$ 486,654,048$ 487,805,313$ 527,037,334$ 549,088,312$
2.00% 2.00% 2.00% 2.00% 2.00% 2.00%
‐191‐

Number
of Filers
%
of Total
Tax
Liability
%
of Total
Number
of Filers
%
of Total
Tax
Liability
%
of Total
Construction 71 5.50% 257,244$ 2.34% 49 4.73% 19,974$ 0.26%
Manufacturing 60 4.65% 111,147 1.01% 38 3.67% 18,173 0.24%
Wholesale Trade 79 6.12% 352,407 3.21% 34 3.29% 195,025 2.54%
Retail trade 572 44.31% 6,596,163 60.06% 460 44.44% 5,495,400 71.53%
Transportation and warehousing 6 0.46% 8,226 0.07% 6 0.58% 28,344 0.37%
Information 22 1.70% 296,221 2.70% 26 2.51% 138,324 1.80%
Finance and insurance 20 1.55% 65,102 0.59% 20 1.93% 43,445 0.57%
Real estate, rental and leasing 16 1.24% 171,801 1.56% 15 1.45% 61,257 0.80%
Professional, scientific and technical 39 3.02% 16,749 0.15% 49 4.73% 17,835 0.23%
Administration, support, waste
management, and remediation 48 3.72% 62,864 0.57% 47 4.54% 34,606 0.45%
Educational Services 8 0.62% 9,601 0.09% 6 0.58% 352 0.00%
Health care and social assistance 14 1.08% 13,490 0.12% 14 1.35% 13,931 0.18%
Arts, entertainment, and recreation 22 1.70% 103,522 0.94% 15 1.45% 22,877 0.30%
Accomodation and food service 193 14.95% 2,600,441 23.68% 132 12.75% 1,414,709 18.41%
Other Services 119 9.22% 316,735 2.88% 113 10.92% 178,466 2.32%
Other 2 0.15% 54 0.00% 11 1.06% 323 0.00%
Total 1,291 100.00% 10,981,766$ 100.00% 1,035 100.00% 7,683,040$ 100.00%
Note: The tax liability was calculated from amounts reported by the Comptroller's Office as sales subject to sales tax. Because of amounts retained by the state for administration and timingdifferences due to accounts under audit, the totals will not necessarily compare with actual salestax rebates received by the City.
CITY OF WESLACO, TEXAS
SALES TAX REVENUE PAYERS BY INDUSTRY
CALENDAR YEARS 2019 AND 2010
2019 2010
TABLE XV
‐192‐

FISCAL
YEAR
CITY DIRECT
RATE
STATE
RATE
TOTAL TAX
RATE
2011 2.00% 6.25% 8.25%2012 2.00% 6.25% 8.25%2013 2.00% 6.25% 8.25%2014 2.00% 6.25% 8.25%2015 2.00% 6.25% 8.25%2016 2.00% 6.25% 8.25%
2017 2.00% 6.25% 8.25%2018 2.00% 6.25% 8.25%2019 2.00% 6.25% 8.25%2020 2.00% 6.25% 8.25%
CITY OF WESLACO, TEXASDIRECT AND OVERLAPPING SALES TAX RATES
LAST TEN FISCAL YEARSTABLE XVI
‐193‐

Date of Incorporation: 1919Date of Adoption of City Charter: December 14, 1927Form of Government: Single Member DistrictArea: 14.72 Square Miles
Miles of Street: City:Graded 1.65 Number of City Employees 340Paved 227 Number of Street Lights 1600
Miles of Sewers: Municipal Water Plant:Storm 97.3 Number of Connections: 11,958 Sanitary 214.2 Miles of Water Mains 131.0
Building Permits: Average Daily: GallonsPermits Issued 591 Consumption 5,630,000Estimated Cost 58,919,796$ Daily Plant Capacity 8,800,000
Fire Protection: Water Sold for Year 1,631,888,300 Number of Stations 3Number of Employees 74 Population:Number of Volunteers 0 1940 Census 6,883
1950 Census 7,487 Police Protection 1960 Census 15,649
Number of Sub‐station 1 1970 Census 15,313 Number of Stations 1 1980 Census 19,331 Number of Employees 110 1990 Census 25,608
2000 Census 26,935 Recreation 2010 Census 35,670
Parks‐Number of Acres (Developed) 175.93 2019‐Estimated 41,629 Parks‐Number of Acres (Undeveloped) 57.99Skateboard Parks 1Tennis Courts 9 Number of Hospitals/ER'sGolf Courses 2 KNAPP Medical Center 1 No. of beds 233Swimming Pools 1 South Texas ER 1 No. of beds 10Parks 7 Valley Baptist Micro‐Hospital 1 No. of beds 22
Education: Public/Private Schools
Weslaco ISD, Grades Prek‐12 High School 3 Alternative Schools 2 Airports 1 Middle Schools 4 Elementary Schools 11IDEA Public Schools, Grades PreK‐12South Texas ISD, Grades 9‐12Horizon Montessori II, Grades K‐8San Martin De Porres Catholic School, Grades Prek‐5Mid Valley Christian School, Grades PreK‐12
Source: Colleges/Universities City of Weslaco
South Texas College Mid Valley Campus Finance DepartmentUTRGV‐Robert C. Vackar College of Business & Entrepreneurship www.weslacoedc.comTexas A&M University of Kingsville Citrus Center Weslaco ISD Texas A&M University AgriLife Research & Extension CenterSouth Texas Vo‐TechValley Grande Institude for Academic Studies
CITY OF WESLACO, TEXASMISCELLANEOUS STATISTICAL FACTS
SEPTEMBER 30, 2020TABLE XVII
‐194‐

CALENDAR
YEAR POPULATION
PERSONAL
INCOME
PER CAPITA
PERSONAL
INCOME
UNEMPLOYMENT
RATE
2010 34,701 514,199,418 14,818 9.9%2011 35,670 530,698,260 14,878 11.3%2012 36,846 570,744,540 15,490 11.4%2013 37,093 579,466,846 15,622 10.2%2014 37,601 589,433,276 15,676 8.2%2015 39,474 612,754,902 15,523 10.0%2016 40,033 687,726,907 17,179 9.7%2017 40,358 720,148,152 17,844 7.3%2018 41,171 776,443,889 18,859 7.4%2019 41,629 786,455,068 18,892 9.9%
Source: www.census.govSource: www.wfsolutions.og
CITY OF WESLACO, TEXASDEMOGRAPHIC AND ECONOMICS STATISTICS
LAST TEN CALENDAR YEARSTABLE XVIII
‐195‐

Function/Program 2011 2012 2013 2014 2015 2016 2017 2018 2019 2020
General GovernmentBuilding permits issued 1,964 1,946 1,935 1,998 2,001 2,039 2,099 2,309 1,688 591 Building inspections conducted 3,625 3,488 3,260 3,985 4,670 4,991 5,066 5,117 6,179 745
PolicePhysical Arrests‐Adults 2,624 2,619 2,747 2,308 2,572 2,531 2,693 2,774 2,460 1,607 Physical Arrests‐Juveniles 620 639 385 474 306 274 352 363 318 151
FireFire responses 1,876 1,704 1,696 1,751 2,097 1,897 1,876 2,197 2,410 2,311 EMS responses 5,042 5,486 5,251 5,919 5,443 5,880 6,424 6,511 6,614 8,607
LibraryVolumes in collection 58,814 67,800 66,368 69,903 72,514 76,787 80,723 83,145 90,066 92,098 Total volumes borrowed 60,876 64,790 46,606 53,185 53,416 52,469 49,769 50,267 55,688 44,365
WaterNew connections 133 133 126 74 121 168 281 281 377 349 Average daily consumption (million of gallons) 6.01 6.01 5.29 4.80 5.26 5.81 5.23 5.23 5.15 5.63 Peak daily consumption (million of gallons) 8.86 ‐ 6.80 7.95 6.17 6.74 5.15 5.15 6.45 6.60
WastewaterAverage daily wastewater treatment (million of gallons) 4.13 ‐ 4.92 3.79 3.68 3.68 4.10 4.10 3.67 4.00
PoliceStations 1 1 1 1 1 1 1 1 1 1 Substations 1 1 1 1 1 1 1 1 1 1 Patrol Units 26 70 56 59 59 59 60 60 75 75
Fire Stations 3 3 3 3 3 3 3 3 3 3 Other public works
Street (miles) 97.54 97.54 223.00 223.00 223.00 223.00 223.00 223.00 227.00 227.00 Streetlights 1,600 1,600 1,600 1,600 1,600 1,600 1,600 1,600 1,600 1,600
Parks & RecreationAcreage (Developed) 153.53 153.53 171.97 171.97 171.97 171.97 171.97 171.97 171.97 175.93 Acreage (Undeveloped) ‐ ‐ ‐ ‐ ‐ ‐ ‐ ‐ 57.99 57.99 Playgrounds 11 11 16 16 16 16 16 16 16 16 Golf courses (private) 1 1 2 2 2 2 2 2 2 2
WaterWater main (miles) 126.0 126.0 128.0 129.6 129.6 129.6 129.6 129.6 131.0 131.5 Fire hydrants ‐ ‐ ‐ 1,670 1,670 1,670 1,670 1,670 1,682 1,693 Storage capacity (million of gallons) 7.90 7.90 2.39 6.39 6.39 6.39 6.39 6.39 6.39 15.30
WastewaterSanitary sewer (miles) 118.01 118.01 213.00 213.31 213.31 213.31 213.31 213.31 214.20 214.80 Storm Sewer (miles) 50.94 50.94 96.00 96.39 96.39 96.39 96.39 96.39 97.30 97.50 Treatment capacity (million of gallons) 7.25 7.25 7.25 8.25 8.25 8.25 8.25 8.25 8.25 7.40
CITY OF WESLACO, TEXASOPERATING INDICATORS AND CAPITAL ASSET STATISTICS BY FUNCTION/PROGRAM
LAST TEN FISCAL YEARS(dollars in thousands)
TABLE XIX
‐196‐

EMPLOYER EMPLOYEES RANK
PERCENTAGE
OF TOTAL CITY
EMPLOYMENT EMPLOYEES RANK
PERCENTAGE
OF TOTAL CITY
EMPLOYMENT
Weslaco ISD 2,358 1 43.39% 2,817 1 44.30%Knapp Medical Center 900 2 16.56% 1,000 2 15.73%HEB (3 Locations) 450 3 8.28% 407 8 6.40%NAMCE/Woodcrafters 375 4 6.90% 592 3 9.31%City of Weslaco 298 5 5.48% 351 5 5.52%Wal‐Mart 260 6 4.78% 260 6 4.09%Payne Auto Group 250 7 4.60% 389 4 6.12%South Texas College 214 8 3.94% 214 7 3.37%Valley Grande Manor 180 9 3.31% 161 9 2.53%Texas A&M Ag 150 10 2.76% ‐ ‐ ‐Foremost Paving 168 10 2.64%
Total 5,435 100.00% 6,359 100.00%
Source: Municipal Advisory County of Texashttps://mactexas.com/IssuerAccess/Report/TopTenEmployers/101824
2019 2010
CITY OF WESLACO, TEXASTOP TEN PRINCIPAL EMPLOYERS CALENDAR YEAR 2019 AND 2010
TABLE XX
‐197‐

FUNCTION 2011 2012 2013 2014 2015 2016 2017 2018 2019 2020
General Government 38 31 36 40 53 49 51 53 53 54 Legislative 7 7 7 7 7 7 7 7 7 7 Other 31 24 29 33 46 42 44 46 46 47Public Safety 141 132 140 136 152 162 167 171 178 179Public Works 25 37 22 42 45 45 44 44 44 44Health & Welfare 2 1 2 2 3 3 3 4 4 5Recreation 3 3 2 7 12 12 12 14 11 11Refuse Collection 4 3 3 1 1 1 2 4 2 2Library 12 11 17 16 16 16 15 15 15 15Water 23 22 31 22 23 17 15 14 15 15Wastewater 0 0 14 11 12 3 4 4 5 5Airport 4 4 3 3 3 3 4 4 4 4Museum 0 0 0 0 0 0 0 0 0 0
Total 252 244 270 280 320 311 317 327 331 334
Full ‐ time Equivalent Employees as of September 30
CITY OF WESLACO, TEXASFULL TIME EQUIVALENT EMPLOYEES BY FUNCTION
LAST TEN FISCAL YEARSTABLE XXI
‐198‐

‐ 94 ‐
COMPLIANCE SECTION

‐ 199 ‐
INDEPENDENT AUDITORS’ REPORT ON INTERNAL CONTROL OVER FINANCIAL REPORTING AND ON COMPLIANCE AND OTHER MATTERS BASED ON AN AUDIT OF FINANCIAL STATEMENTS PERFORMED IN ACCORDANCE WITH GOVERNMENT AUDITING STANDARDS Honorable Mayor and Members of the City Commission City of Weslaco, Texas We have audited, in accordance with the auditing standards generally accepted in the United States of America and the standards applicable to financial audits contained in Government Auditing Standards issued by the Comptroller General of the United States, the financial statements of the governmental activities, the business‐type activities, each major fund, and the aggregate remaining fund information of the City of Weslaco, Texas, as of and for the year ended September 30, 2020, and the related notes to the financial statements, which collectively comprise the City of Weslaco, Texas’ basic financial statements and have issued our report thereon dated March 26, 2021. Our report includes a reference to other auditors who audited the financial statements of the aggregate discretely presented component unit, as described in our report on the City of Weslaco, Texas’ financial statements. This report does not include the results of the other auditors’ testing of internal control over financial reporting or compliance and other matters that are reported on separately by those auditors. Internal Control over Financial Reporting In planning and performing our audit of the financial statements, we considered the City of Weslaco, Texas’ internal control over financial reporting (internal control) as a basis for designing audit procedures that are appropriate in the circumstances for the purpose of expressing our opinions on the financial statements, but not for the purpose of expressing an opinion on the effectiveness of the City of Weslaco, Texas’ internal control. Accordingly, we do not express an opinion on the effectiveness of the City of Weslaco, Texas’ internal control. Our consideration of internal control was for the limited purpose described in the preceding paragraph and was not designed to identify all deficiencies in internal control that might be material weaknesses or significant deficiencies and therefore, material weaknesses or significant deficiencies may exist that have not been identified. However, as described in the accompanying schedule of findings and questioned costs, we did identify certain deficiencies in internal control that we consider to be a material weakness and significant deficiency. A deficiency in internal control exists when the design or operation of a control does not allow management or employees, in the normal course of performing their assigned functions, to prevent, or detect and correct, misstatements on a timely basis. A material weakness is a deficiency, or a combination of deficiencies, in internal control, such that there is a reasonable possibility that a material misstatement of the entity’s financial statements will not be prevented, or detected and corrected, on a timely basis. We consider the deficiency described in the accompanying schedule of findings and questioned costs as item 2020‐001 to be a material weakness.

‐ 200 ‐
(This page intentionally left blank)

‐ 201 ‐
A significant deficiency is a deficiency, or a combination of deficiencies, in internal control that is less severe than a material weakness, yet important enough to merit attention by those charged with governance. We consider the deficiency described in the accompanying schedule of findings and questioned costs as item 2020‐002 to be a significant deficiency. Compliance and Other Matters As part of obtaining reasonable assurance about whether the City of Weslaco, Texas’ financial statements are free from material misstatement, we performed tests of its compliance with certain provisions of laws, regulations, contracts, and grant agreements, noncompliance with which could have a direct and material effect on the financial statements. However, providing an opinion on compliance with those provisions was not an objective of our audit, and accordingly, we do not express such an opinion. The results of our tests disclosed an instance of noncompliance or other matter that is required to be reported under Government Auditing Standards and which is described in the accompanying schedule of findings and questioned costs as item 2020‐002. The City of Weslaco, Texas’ Response to Findings The City of Weslaco, Texas’ response to the findings identified in our audit is described in the accompanying schedule of findings and questioned costs. The City of Weslaco, Texas’ response was not subjected to the auditing procedures applied in the audit of the financial statements and, accordingly, we express no opinion on it. Purpose of this Report The purpose of this report is solely to describe the scope of our testing of internal control and compliance and the results of that testing, and not to provide an opinion on the effectiveness of the entity’s internal control or on compliance. This report is an integral part of an audit performed in accordance with Government Auditing Standards in considering the entity’s internal control and compliance. Accordingly, this communication is not suitable for any other purpose.
Harlingen, Texas March 26, 2021

‐ 202 ‐
(This page intentionally left blank)

‐ 203 ‐
INDEPENDENT AUDITOR’S REPORT ON COMPLIANCE FOR THE MAJOR PROGRAM AND ON INTERNAL CONTROL OVER COMPLIANCE REQUIRED BY THE UNIFORM GUIDANCE Honorable Mayor and Members of the City Commission City of Weslaco, Texas Report on Compliance for The Major Federal Program We have audited the City of Weslaco’s compliance with the types of compliance requirements described in the OMB Compliance Supplement that could have a direct and material effect on each of The City of Weslaco’s major federal programs for the year ended September 30, 2020. The City of Weslaco’s major federal programs are identified in the summary of auditor’s results section of the accompanying schedule of findings and questioned costs. Management’s Responsibility Management is responsible for compliance with federal statutes, regulations, and the terms and conditions of its federal awards applicable to its federal programs. Auditor’s Responsibility Our responsibility is to express an opinion on compliance for each of the City of Weslaco’s major federal programs based on our audit of the types of compliance requirements referred to above. We conducted our audit of compliance in accordance with auditing standards generally accepted in the United States of America; the standards applicable to financial audits contained in Government Auditing Standards, issued by the Comptroller General of the United States; the audit requirements of Title 2 U.S. Code of Federal Regulations Part 200, Uniform Administrative Requirements, Cost Principles, and Audit Requirements for Federal Awards (Uniform Guidance). Those standards and the Uniform Guidance require that we plan and perform the audit to obtain reasonable assurance about whether noncompliance with the types of compliance requirements referred to above that could have a direct and material effect on a major federal program occurred. An audit includes examining, on a test basis, evidence about the City of Weslaco’s compliance with those requirements and performing such other procedures as we considered necessary in the circumstances. We believe that our audit provides a reasonable basis for our opinion on compliance for each major federal program. However, our audit does not provide a legal determination of the City of Weslaco’s compliance. Opinion on The Major Federal Program In our opinion, the City of Weslaco complied, in all material respects, with the types of compliance requirements referred to above that could have a direct and material effect on each of its major federal programs for the year ended September 30, 2020.

‐ 204 ‐
(This page intentionally left blank)

‐ 205 ‐
Report on Internal Control over Compliance Management of the City of Weslaco is responsible for establishing and maintaining effective internal control over compliance with the types of compliance requirements referred to above. In planning and performing our audit of compliance, we considered the City of Weslaco’s internal control over compliance with the types of requirements that could have a direct and material effect on each major federal program to determine the auditing procedures that are appropriate in the circumstances for the purpose of expressing an opinion on compliance for each major federal program and to test and report on internal control over compliance in accordance with the Uniform Guidance, but not for the purpose of expressing an opinion on the effectiveness of internal control over compliance. Accordingly, we do not express an opinion on the effectiveness of the City of Weslaco’s internal control over compliance. A deficiency in internal control over compliance exists when the design or operation of a control over compliance does not allow management or employees, in the normal course of performing their assigned functions, to prevent, or detect and correct, noncompliance with a type of compliance requirement of a federal program on a timely basis. A material weakness in internal control over compliance is a deficiency, or a combination of deficiencies, in internal control over compliance, such that there is a reasonable possibility that material noncompliance with a type of compliance requirement of a federal program will not be prevented, or detected and corrected, on a timely basis. A significant deficiency in internal control over compliance is a deficiency, or a combination of deficiencies, in internal control over compliance with a type of compliance requirement of a federal program that is less severe than a material weakness in internal control over compliance, yet important enough to merit attention by those charged with governance. Our consideration of internal control over compliance was for the limited purpose described in the first paragraph of this section and was not designed to identify all deficiencies in internal control over compliance that might be material weaknesses or significant deficiencies and therefore, material weaknesses or significant deficiencies may exist that have not been identified. We did not identify any deficiencies in internal control over compliance that we consider to be material weaknesses. However, we did identity certain deficiencies in internal control over compliance, described in the accompanying schedule of findings and questioned costs as items 2020‐003, that we consider to be significant deficiencies. The City of Weslaco’s response to the internal control over compliance findings identified in our audit is described in the accompanying schedule of findings and questioned costs. The City of Weslaco’s response was not subjected to the auditing procedures applied in the audit of compliance and, accordingly, we express no opinion on the response. The purpose of this report on internal control over compliance is solely to describe the scope of our testing of internal control over compliance and the results of that testing based on the requirements of the Uniform Guidance. Accordingly, this report is not suitable for any other purpose.
Harlingen, Texas March 26, 2021

‐ 206 ‐
(This page intentionally left blank)

‐ 207 ‐
City of Weslaco, Texas Schedule of Findings and Questioned Costs
Section I ‐ Summary of Auditors’ Results
Financial Statements Type of auditors’ report issued: Unmodified Internal control over financial reporting: * Material weakness(es) identified? X yes _ no * Significant deficiencies identified that are not
considered to be material weakness(es)? X yes none reported Noncompliance material to financial statements
noted? X yes _ no
Federal Awards Internal control over major programs: * Material weakness(es) identified? yes X no * Significant deficiencies identified that are not considered to be material weakness(es)? X yes _ none reported
Type of auditors’ report issued on compliance for major programs: Unmodified
Any audit findings disclosed that are required to be reported in accordance with 2 CFR 200.516(a)? X yes _ no
Identification of major programs: CFDA Number(s) Name of Federal Program or Cluster
21.019 COVID‐19 Coronavirus Relief Fund‐ CARES Act
Dollar threshold used to distinguish between Type A and Type B programs: $750,000
Auditee qualified as low‐risk auditee? _ yes X no

‐ 208 ‐
City of Weslaco, Texas Schedule of Findings and Questioned Costs
Section II – Findings Relating to the Financial Statement Audit as Required to be Reported in Accordance with Generally Accepted Government Auditing Standards
A. Material Weakness in Internal Control
Reference Number: (2020‐001) Accounting for unavailable revenue in accordance with modified
accrual basis of accounting Criteria: Internal controls should be designed and implemented over the
accounting of governmental fund accounts receivable and related revenue to ensure amounts recorded in the financial statements are in accordance with the modified accrual basis of accounting. The material prior period adjustment in the City’s financial statements is an indication of a material weakness.
Condition Found: Accounts receivable for EMS billings for the year ended September
30, 2020 were not deferred and considered unavailable revenue in accordance with the modified accrual basis of accounting. These amounts related to EMS accounts receivable required adjustment during our audit.
Our audit procedures identified other additional amounts related to
grants receivable and related revenues which management also elected to correct. Because these errors were not prevented, or detected and corrected timely, there is an indication that the internal controls for accounting in accordance with the modified accrual basis of accounting were not effective for fiscal year 2020.
Cause: The City did not have internal controls in place to review
governmental fund accounts receivable and related revenue amounts, and identify and adjust for those amounts in accordance with the modified accrual basis of accounting.
Effect: The accounting treatment for EMS accounts receivable resulted in
material misstatements that were not prevented, or detected and corrected. Other amounts related to grants receivable and related revenues were not identified and adjusted by management in a timely manner.
Recommendation: We recommend that the City review amounts recorded as accounts
receivable and identify and adjust for those amounts that do not meet modified accrual basis of accounting. In addition, we recommend Management review its grant activity for proper recognition of accounts receivable and related revenues.
Views: Management agrees with the findings. See corrective action plan
beginning on page 210.

‐ 209 ‐
City of Weslaco, Texas Schedule of Findings and Questioned Costs
Section II – Findings Relating to the Financial Statement Audit as Required to be Reported in Accordance with Generally Accepted Government Auditing Standards‐ Continued
B. Significant Deficiency in Internal Control and Compliance Finding
Reference Number: (2020‐002) Budgetary process and expenditures in excess of appropriations Criteria: Internal controls should be designed to effectively monitor the
budget and ensure the legal level of budgetary control is followed and any necessary amendments are processed timely. Also, City ordinance requires budget amendments to be made prior to exceeding appropriations at the department level, which is the legal level of budgetary control.
Condition Found: As indicated in the notes to the City’s financial statements, we noted
instances in which the City’s budget had been exceed in multiple departments in the general fund. We noted nine departments with negative variances between the final budgeted amounts and actual expenditures for an aggregate total of $2,177,733.
Cause: Lack of proper budgeting techniques or timely action by
administration to amend the budget appropriately. Effect: The City incurs expenditures that are not budgeted in advance by
the City Commission. Recommendation: Monitoring of the budget versus actual comparison should continue
to be made on a monthly basis, and control over expenditures should include a review of available budget amounts prior to approval of purchase orders for the expenditure of funds.
Views: Management agrees with the findings. See corrective action plan
beginning on page 210.

‐ 210 ‐
City of Weslaco, Texas Schedule of Findings and Questioned Costs
Section III– Findings Relating to Internal Control Over Major Programs
B. Significant Deficiency in Internal Control over Compliance Reference Number: (2020‐003) Review of Reimbursement Request Forms and Supporting
Documentation CFDA 21.019 COVID‐19 Coronavirus Relief Fund Passed through identifying number: 2020‐HID‐CRF‐WES‐05 Award Year: 2019‐2020 Federal Agency: U.S. Department of Treasury Passed through Hidalgo County Criteria: Non‐federal entities are required to establish and maintain effective
internal controls over compliance in accordance with 2 CFR 200.303 Condition Found: During testing of payroll costs charged to the program, CRI identified
several instances where the amounts requested on the Reimbursement Request Forms did not match the support provided. Daily Activity Reports (DARs) submitted for reimbursement did not match actual supporting documentation such as check stubs. Differences were identified in both fringe benefits, and classification of time card hours.
Cause: Although the City did use the appropriate DARs provided by the
County, the City relied on the form’s automatic calculation for certain fringe benefits. Other differences were a result of oversight of the Request for reimbursements and the supporting documentation.
Effect: The noted oversight resulted in various adjustments made by the
County in their review of the reimbursement requests. The adjustment detail was not provided to the City for reconciliation of total costs charged to the program.
Questioned Cost: $972 Recommendation: CRI recommends that the support for the grant reimbursements be
reviewed in detail by the Accountant and Finance Director prior to submitting expenditures for reimbursement. The amounts requested should be crossed checked with the supporting expenditure detail to ensure only amounts paid by the City are being requested for reimbursement.
Views: Management agrees with the findings. See corrective action plan
beginning on page 210.

‐ 211 ‐
City of Weslaco
“The City on the Grow”
Schedule of Findings and Questioned Costs Corrective Action Plan
PROGRAM DESCRIPTION CORRECTIVE ACTION PLAN Reference Number: (2020‐001) Accounting for unavailable revenue in accordance with
modified accrual basis of accounting
Corrective Action Plan: Management will implement procedures that include review of governmental fund accounts receivable and related revenue amounts for EMS billing and grants and adjust for those amounts that do not meet revenue recognition in accordance with the modified accrual basis of accounting.
Reference Number: (2020‐002) Budgetary process and expenditures in excess of
appropriations
Corrective Action Plan: During the fiscal year there were two rounds of budget amendments designed to incorporate unbudgeted projects into the budget to prevent overages. In the new fiscal year, a mid year evaluation will be performed of all accounts and unbudgeted items and amendments will be prepared accordingly.
Reference Number: (2020‐003) Review of Reimbursement Request Forms and
Supporting Documentation
Corrective Action Plan: Management will implement procedures that include cross checking total reimbursement request to supporting check disbursement detail to ensure amounts requested are accurate and agree to financial records.
_________________________ Contact Person: Vidal Roman, Finance Director Implementation Time Frame: Ongoing during current fiscal year
David Suarez, Mayor Leo Munoz, Mayor Pro-Tem, District 1
Greg Kerr, Commissioner, District 2 Jose “J.P.” Rodriguez, Commissioner, District 3
Adrian Farias, Commissioner, District 4 Letty Lopez, Commissioner, District 5
Josh Pedraza, Commissioner, District 6
Mike R. Perez, City Manager

‐ 212 ‐
City of Weslaco, Texas Schedule of Findings and Questioned Costs Summary Schedule of Prior Audit Findings
STATUS OF PRIOR YEAR’S FINDINGS/COMPLIANCE
Reference Number: (2019‐001) Emergency medical service billing and reconciliation
process Status: Finding has been resolved, no further corrective action is
currently deemed necessary. Management performed a year‐end reconciliation of EMS collections receipted through the City’s accounting software and amounts posted to the separate billing software to make certain balances included all relevant EMS activity.
Reference Number: (2019‐002) Expenditures in excess of budget appropriations Status: The City formally amended the budget several times
during the year due to several supplements needed for expenditures that were not budgeted. However, the final budget amendments were insufficient to provide for the functional variances. See current year finding (2020‐002).

‐ 213 ‐
City of Weslaco, Texas Schedule of Expenditures of Federal Awards
(1) (2) (3) (4) (5)
FEDERAL GRANTOR/ Federal Pass‐through Provided
PASS‐THROUGH GRANTOR/ CFDA Entity Identifying to Federal
PROGRAM OR CLUSTER TITLE Number Number Subrecipients Expenditures
U.S. Department of Justice
COVID‐19 Coronavirus Emergency Supplemental Funding Program 16.034 ‐ 24,560
Law Enforcement Assistance FBI Advanced Police Training 16.300 ‐ 12,723
Public Safety Partnership and Community Policing Grants 16.710 ‐ 79,741
Recovery Act‐ Assistance to Rural Law Enforcement to Combat Crime and Drugs
Competitive Grant Program 16.810 ‐ 18,042
NICS Act Record Improvement Program 16.813 ‐ 15,000
Equitable Sharing Program 16.922 ‐ 56,519
Passed through Office of the Governor
Edward Byrne Memorial Justice Assistance Grant Program 16.738 3526101 ‐ 72,640
Violence Against Woment Formula Grants 16.588 3814701 ‐ 14,378
Victims of Crime Act Formula Grant Program 16.575 3814601 ‐ 33,984
Total Passed through Office of the Governor 121,002
Total U.S. Department of Justice 327,587
U.S. Department of Treasury
Passed through Hidalgo County, Texas
COVID ‐19 Coronavirus Relief Fund ‐ CARES ACT 21.019 2020‐HID‐CRF‐WES‐05 ‐ 4,888,975
U.S. Department of Homeland Security
Passed through Office of the Governor
Homeland Security Grant Program 97.067 3173404 ‐ 108,083
Homeland Security Grant Program 97.067 3814201 ‐ 19,000
Total passed through Office of the Governor 127,083
Total U.S. Department of Homeland Security 127,083
TOTAL EXPENDITURES OF FEDERAL AWARDS 5,343,645$
For the Year Ended September 30, 2020
The accompanying notes are an integral part of this schedule

‐ 214 ‐
City of Weslaco, Texas Notes on Accounting Policies for Federal Awards
General The accompanying Schedule of Expenditures of Federal Awards presents the activity of all federal award programs of the City of Weslaco, Texas, for the year ended September 30, 2020. The reporting entity consists of the primary government, organizations for which the primary government is financially accountable, and other organizations for which the primary government is not accountable, but for which the nature and significance of their relationship with the primary government are such that exclusion would cause the reporting entity’s financial statements to be misleading or incomplete. Basis of Presentation The accompanying schedule of expenditures of federal awards includes the federal grant activity of the City of Weslaco, Texas and is presented on the modified accrual basis of accounting. The information in this schedule is presented in accordance with the requirements of the Uniform Guidance. Therefore, some amounts presented in this schedule may differ from amounts presented in, or used in the preparation of the basic financial statements. Sub‐recipients During the year ended September 30, 2020, the City of Weslaco, Texas had no sub‐reciepients. Federal Loans and Loan Guarantees During the year ended September 30, 2020, the City had no outstanding federal loans payable or loan guarantees. Federally Funded Insurance During the year ended September 30, 2020, the City had no federally funded insurance. Noncash Awards During the year ended September 30, 2020, the City did not have any federal awards in the form of noncash assistance. Indirect Cost Rate The Uniform Guidance allows an organization to elect a 10% de minimus indirect cost rate. For the year ended September 30, 2020, the City did not elect to use this rate.