comprehensive annual financial report - atl compr… · analysis of the basic financial statements....
TRANSCRIPT

COMPREHENSIVEANNUAL FINANCIAL REPORT
For the fiscal years ended June 30, 2014 and 2013 • Prepared by the Finance Department
Department of Aviation
An enterprise fund of the City of Atlanta, Georgia


Comprehensive Annual Financial Report For the Fiscal Years Ended June 30, 2014 and 2013
Department of Aviation
An enterprise fund of the City of Atlanta, Georgia
Prepared by the Finance Department
Kasim Reed
Mayor
Miguel Southwell
General Manager

(THIS PAGE LEFT BLANK INTENTIONALLY)

CITY OF ATLANTA, GEORGIA
DEPARTMENT OF AVIATION
Table of Contents
Page
Introductory Section (Unaudited)
Letter of Transmittal i
GFOA Certificate of Achievement vi
Principal Officers vii
Organizational Chart viii
Financial Section
Independent Auditors’ Report 1
Management’s Discussion and Analysis (Unaudited) 3
Basic Financial Statements:
Statements of Net Position 12
Statements of Revenue, Expenses, and Changes in Net Position 14
Statements of Cash Flows 15
Notes to Financial Statements 17
Required Supplementary Information (Unaudited)
Schedule of Funding Progress for Pension Plans 44
Schedule of Funding Progress for OPEB 44
Statistical Section (Unaudited)
Financial Trends:
Total Annual Revenues, Expenses, and Changes in Net Position 45
Changes in Cash and Cash Equivalents 46
Revenue Capacity:
Principal Operating Revenues, Airlines Rates and Charges and Cost per Enplaned Passenger 47
Debt Capacity:
Net Revenues Available for General Aviation Revenue Bonds Debt Service 48

CITY OF ATLANTA, GEORGIA
DEPARTMENT OF AVIATION
Table of Contents
Page
Ratios of Outstanding Debt 49
Demographic and Economic Information:
Demographic and Economic Statistics 50
Top Private Sector Employers 51
Operating Information:
Aircraft Operations and Enplanement Trends 52
Historical Aircraft Landed Weights 53
Historical Air Cargo and Mail 54
Airlines Serving the Airport 55
Budget Staffing Levels 56
Airport Information 57

INTRODUCTORY SECTIONLetter of Transmittal
GFOA Certificate of Achievement
Principal Officers
Organizational Chart

(THIS PAGE LEFT BLANK INTENTIONALLY)

Letter of Transmittal
November 21, 2014
Honorable Mayor Kasim Reed, City of Atlanta
Honorable City Council President Ceasar C. Mitchell, Atlanta City Council
Honorable Felicia A. Moore, Chair – Transportation Committee, Atlanta City Council
Honorable Alex Wan, Chair – Finance Executive Committee, Atlanta City Council
Honorable Members, Atlanta City Council
Michael Geisler, Chief Operating Officer
55 Trinity Avenue
Atlanta, Georgia 30303
Ladies and Gentlemen:
We are pleased to present the 2014 Comprehensive Annual Financial Report (CAFR) for the City of Atlanta’s
Department of Aviation (Department). Responsibility for both the accuracy of the presented data and the
completeness and fairness of the presentation, including all disclosures, rests with management. To the best
of our knowledge and belief, the presented data are accurate in all material aspects and reported in a manner
that fairly presents the Department’s financial position, the results of its operations and all disclosures
necessary to enable the reader to gain the maximum understanding of the Department’s financial activities.
To provide a reasonable basis for making these representations, the Department has established an internal
control framework that is designed both to protect the Department’s assets from loss, theft or misuse, and to
compile sufficient reliable information for the preparation of the Department’s financial statements that
conform with U.S. generally accepted accounting principles (GAAP). The cost of internal controls should
never outweigh their benefits. The Department’s framework of internal controls has been designed to provide
reasonable, rather than absolute assurance that the financial statements are free from material misstatement.
This report conforms to the guidelines of GAAP as prescribed by the Governmental Accounting Standards
Board (GASB) and the Government Finance Officers Association (GFOA).
In addition, an audit of the financial statements has been completed by the Department’s independent auditor,
KPMG LLP. The audit was performed to provide reasonable assurance that the Department’s financial
statements are free of material misstatements. The audit involved examining, on a test basis, evidence
supporting the amounts and disclosures in the financial statements; assessing the accounting principles used
and significant estimates made by management; and evaluating the overall financial statement presentation.
The independent auditor concluded that there was a reasonable basis for issuing an unmodified (clean)
opinion that the Department’s financial statements for the fiscal year ended June 30, 2014, are fairly
presented in all material respects, in conformity with GAAP. The Independent Auditors’ Report is presented
at the front of the financial section of the CAFR.
The Letter of Transmittal is designed to complement and should be read in conjunction with the
Management’s Discussion and Analysis (MD&A), which is presented in the Financial Section immediately
KASIM REED Mayor MIGUEL SOUTHWELL Aviation General Manager

ii
following the Independent Auditors’ Report. MD&A provides a narrative introduction, overview and
analysis of the basic financial statements.
This report also may be accessed via the Internet at www.atlanta-airport.com.
Background
Hartsfield-Jackson Atlanta International Airport (Airport) is owned by the City of Atlanta (City) and operated
by the Department. It is classified as a large hub by the Federal Aviation Administration (FAA), is the
principal airport serving the state of Georgia and the southeastern United States, and serves as a primary
transfer point in the national air transportation system. The Department, led by the Aviation general manager,
directly supervises Airport operations. The Department has a staff of 1,131, including Atlanta Fire
Department and Atlanta Police Department employees. The Department is responsible for managing,
operating and developing the Airport and any other airfields that the City may control in the future;
negotiating leases, agreements and contracts; computing and supervising the collection of revenues generated
by the Airport; and coordinating aviation activities with the FAA. The FAA has regulatory authority over
equipment, air traffic control and operating standards at the Airport.
For financial reporting purposes, the Department is classified as an enterprise fund. The Airport does not
receive any funding from the General Fund of the City, the income of which is derived mostly from
ad-valorem taxes assessed to City of Atlanta residents. Instead, the Airport receives its revenues from landing
fees, property leases, parking and other Airport-specific revenue sources.
An annual budget for the Airport is prepared utilizing the various Airline Lease and Use Agreements, the
Central Passenger Terminal Complex (CPTC) lease and other significant agreements between the Airport
and its tenants. The budget is prepared on a non-GAAP basis since capital expenditures are included as
expenses and depreciation is not budgeted, which conforms to the budget process for the City. Budgetary
control is established at the office level of each department. The purchasing and accounts payable
subsystems, which automatically encumber budget monies prior to the issuance of purchase orders and
disbursement of funds, maintain and strengthen budgetary control.
Economic Conditions and Outlook
Historically, the financial performance of the air transportation industry has correlated with the state of the
national and global economy. Airline passenger traffic, as a key driver of financial performance, was
significantly impacted by the recession of 2008 – 2009 and the weak recovery that followed. In the past
several years, the Airport’s enplaned passenger and total passenger counts, which are significant factors in
the Airport’s financial performance, have exceeded pre-recession levels. As the economy continues to
strengthen, airline passenger traffic is expected to grow.
With the globalization of business and the increased importance of international trade and tourism, the state
of the U.S. economy has become more closely tied to worldwide economic, political and social conditions.
As a result, international economics, trade balances, currency exchange rates, political relationships, and
hostilities all influence passenger traffic at major U.S. airports. Sustained future increases in passenger traffic
at the Airport will depend on stable international conditions as well as national and global economic growth.
The Airport’s financial performance also will depend partly on the profitability of the U.S. airline industry
and its ability to continue serving its customers. Industry profitability will depend on, among other factors,
economic growth to support airline travel demand, continued capacity control to allow increased airfares,
and stable fuel prices.

iii
Another factor that will impact the Airport’s performance is the creation of additional passenger and cargo
routes. To support this objective, the Airport has launched an Air Service Incentive Program (ASIP). The
purpose of the ASIP is to offer economic incentives to stimulate international air service to Atlanta, to
encourage growth in cargo services, and to grow non-aeronautical revenues.
Airlines will receive specific incentives for initiating new international routes not already served from
Atlanta. Cargo carriers who start new routes can have their parking fees waived as part of the program.
Additionally to spur connections from Atlanta to the world’s fastest-growing economies, the Airport is
offering incentives to airlines that launch service to Brazil, Russia, India, China or South Africa.
One other factor that contributes to the Airport’s outlook is the strength and diversity of the business
community within the Atlanta region. Manufacturing, banking, information technology and financial
services are major business categories represented in the area, and Atlanta is the corporate home of
U.S. companies such as Coca-Cola, Home Depot, Delta Air Lines, and UPS.
Lastly, the Airport team is executing a list of priorities aimed at strengthening the Airport’s impact on the
local and regional economy. These objectives include continued expansion and development of the Airport's
cargo operations and capacity, maintaining "world's busiest airport" status by building additional air service,
growing revenue by implementing non-aeronautical revenue initiatives and enhancing the travelling
experience for the guests who travel through the Airport.
Aeronautical and Non-Aeronautical Revenue
Most of the passenger and cargo airlines serving the Airport operate under the terms of airport lease
agreements, under which the airlines pay landing fees, terminal rentals, and other charges calculated to allow
the Department to recover certain operating charges. Collectively these revenues are considered aeronautical
in nature, and a majority of them are used to calculate the “direct” cost per enplaned passenger (CPE), a key
metric for the industry. Some operating and maintenance costs incurred by third-party facility operators are
paid directly by the airlines and are reflected in the Airport’s all-in CPE figure.
Non-aeronautical revenues are composed mainly of food and beverage concessions, retail concessions,
parking, car rental, and other miscellaneous revenues.
Below is a chart reflecting the revenues as stated in various metrics monitored by the Airport.
Year
Landing
Fee
Direct
CPE
All-in
CPE
Non-Aeronautical
Revenue Per
Enplaned
Passenger
Total Revenue
Per Enplaned
Passenger
2010 $ 1.09795 $ 3.41 $ 5.31 $ 5.37 $ 8.83
2011 0.88231 2.84 4.27 6.03 8.90
2012 0.82084 2.34 3.85 5.97 8.36
2013 0.81206 3.70 5.61 6.37 10.32
2014 0.82049 3.36 5.37 6.05 10.49

iv
Major Initiatives
One of the Airport’s major challenges has been its ability to expand to meet the increasing demand for air
travel and ultimately reduce the strain this growth has on existing facilities and infrastructure. In 2014, the
Airport introduced its new master plan that will serve as the blueprint for Airport development over the next
two decades. In the near term, the Airport will focus on replacing existing four-level parking decks with
higher decks in order to double on-site parking; expanding south cargo facilities; remodeling various
elements of the domestic terminal and concourses; and building an end-around taxiway for Runway 9L –
27R. Longer-term plans include additional gates and a possible sixth runway, to be built just north of the
fifth runway.
To enhance the Airport’s landside operations, the Department is upgrading its inbound roadway network, to
widen and realign Airport Boulevard and realign connecting ramps and loops to the North and South
Terminal Parkway. This project will improve traffic merging, increase decision times and extend sight
distances.
The Airport has expanded the midpoint area of Concourse D to further enhance the passenger’s experience.
The midpoint expansion is a three-level addition that provides approximately 91,000 square feet of additional
circulation space for passengers and new concessions. The Airport is currently engaged in a similar
expansion of Concourse C.
Awards
Hartsfield-Jackson Atlanta International Airport, for the 15th consecutive year, retained the title of the world’s
busiest airport. The Airport handled 94.4 million passengers in calendar year 2013.
For the 11th year, the Airport has won the Global Efficiency Excellence Award from the Air Transport
Research Society. This recognition is based on a rigorous analysis of airport productivity, cost and revenue
data.
GFOA awarded a Certificate of Achievement for Excellence in Financial Reporting to the Department in
connection with its CAFR for the fiscal year ended June 30, 2013. In order to be awarded a Certificate of
Achievement, the Department published an easily readable and efficiently organized CAFR. This report
satisfied both GAAP and applicable legal requirements.
A Certificate of Achievement is valid for a period of one year only. We believe our current CAFR continues
to meet the Certificate of Achievement Program’s requirements, and we are submitting it to the GFOA for
their consideration.
Acknowledgements
We wish to thank all of the Department’s employees for their hard work and dedication during the past fiscal
year. We also would like to thank the Airport’s Department of Finance for their tireless efforts and
professionalism in preparing this report, as well as the City’s Department of Finance, and our external
auditors for their invaluable assistance.
Finally, a special acknowledgement is extended to the Mayor, the Atlanta City Council and members of the
Transportation and Finance Executive committees, and the chief operating officer for their continued
leadership in enabling the Department to fulfill its role.
The Comprehensive Annual Financial Report of the City of Atlanta’s Department of Aviation for the fiscal
year ended June 30, 2014 (FY 2014) is submitted herewith.


(THIS PAGE LEFT BLANK INTENTIONALLY)

vi
CAFR Certificate

(THIS PAGE LEFT BLANK INTENTIONALLY)

vii
Principal Officers
EXECUTIVE
Mayor…………………………………………………………………………………………………………………………. Kasim Reed Chief Operating Officer………………………………………………………………………………………………. Michael Geisler Chief of Staff ……………………………………………………………………………………………………………… Candace L. Byrd Chief Financial Officer………………………………………………………………………………………………… J. Anthony Beard City Attorney …………………………………………………………………………………………………………….. Cathy Hampton
LEGISLATIVE
President of Council ………………………………………………………………………………………………….. Ceasar C. Mitchell
Members of Council
Members of Council – At-Large
District 1 – Carla Smith */+ District 7 – Howard Shook * District 2 – Kwanza Hall District 8 – Yolanda Adrean * District 3 – Ivory Lee Young, Jr. District 9 – Felicia A. Moore */+ Chair District 4 – Cleta Winslow District 10 – C.T. Martin */+ District 5 – Natalyn Mosby Archibong * /+ District 11 – Keisha Lance Bottoms District 6 – Alex Wan * Chair/+ District 12 – Joyce M. Sheperd
City Council – At-Large – Post 1 – Michael Julian Bond City Council – At-Large – Post 2 – Mary Norwood + City Council – At-Large – Post 3 – Andre Dickens +
Committee Members with Department Oversight * Financial Executive Committee (FEC)
+ Transportation Committee (TC)
DEPARTMENT OF AVIATION ADMINISTRATIVE OFFICIALS
Aviation General Manager
Miguel Southwell
Aviation Deputy General Manager – Operations Aviation Deputy General Manager – Chief Financial Officer Aviation Deputy General Manager – Commercial Development
Balram “B” Bheodari Roosevelt Council, Jr. Michael Smith
Assistant General Manager Public Safety and Security Assistant General Manager Operations, Maintenance & Transportation Assistant General Manager Planning and Development
Richard L. Duncan Paul Meyer Jim Drinkard
Assistant General Manager Accounting and Finance Greg Richardson Interim Assistant General Manager Commercial Development Director, Marketing and Stakeholder Engagement Director, Human Resources and Organizational Development Director, Information Systems
Vivica Brown Myrna White Marshan Oden Sharon Jones

(THIS PAGE LEFT BLANK INTENTIONALLY)

viii
CHIEF OPERATING
OFFICERCITY ATTORNEY
CHIEF OF
STAFF
Department of
Aviation
CHIEF FINANCIAL
OFFICER
MAYOR
General Manager
HR &
Organizational
Development
DIT - AviationDepartment of
Law - Aviation
Deputy GM
Operations
Deputy GM
Commercial
Development
Deputy GM Finance
& Administration
Public Affairs
Assistant General
Manager Finance/
Accounting
Procurement
Assistant General
Manager Commercial
Development
Assistant General
Manager Operations,
Maintenance &
Transportation
Assistant General
Manager Public
Safety & Security
Assistant General
Manager Planning &
Development
Internal Audit
Support
Functions
CITY OF ATLANTA, GEORGIA
DEPARTMENT OF AVIATION
ORGANIZATIONAL CHART

(THIS PAGE LEFT BLANK INTENTIONALLY)

FINANCIAL SECTIONIndependent Auditors’ Report
Management’s Discussion and Analysis (Unaudited)
Basic Financial Statements
Notes to Financial Statements
Required Supplementary Information (Unaudited)

(THIS PAGE LEFT BLANK INTENTIONALLY)

KPMG LLP Suite 2000 303 Peachtree Street, N.E. Atlanta, GA 30308-3210
KPMG LLP is a Delaware limited liability partnership, the U.S. member firm of KPMG International Cooperative (“KPMG International”), a Swiss entity.
Independent Auditors’ Report
Honorable Mayor and Members of the City Council, City of Atlanta, Georgia:
Report on the Financial Statements
We have audited the accompanying financial statements of the Department of Aviation (the Department) of
the City of Atlanta, Georgia (the City), a major enterprise fund of the City, as of and for the years ended
June 30, 2014 and 2013, and the related notes to the financial statements, which collectively comprise the
Department’s basic financial statements as listed in the table of contents.
Management’s Responsibility for the Financial Statements
Management is responsible for the preparation and fair presentation of these financial statements in
accordance with U.S. generally accepted accounting principles; this includes the design, implementation,
and maintenance of internal control relevant to the preparation and fair presentation of financial statements
that are free from material misstatement, whether due to fraud or error.
Auditors’ Responsibility
Our responsibility is to express an opinion on these financial statements based on our audits. We conducted
our audits in accordance with auditing standards generally accepted in the United States of America and the
standards applicable to financial audits contained in Government Auditing Standards, issued by the
Comptroller General of the United States. Those standards require that we plan and perform the audit to
obtain reasonable assurance about whether the financial statements are free from material misstatement.
An audit involves performing procedures to obtain audit evidence about the amounts and disclosures in the
financial statements. The procedures selected depend on the auditors’ judgment, including the assessment of
the risks of material misstatement of the financial statements, whether due to fraud or error. In making those
risk assessments, the auditor considers internal control relevant to the entity’s preparation and fair
presentation of the financial statements in order to design audit procedures that are appropriate in the
circumstances, but not for the purpose of expressing an opinion on the effectiveness of the entity’s internal
control. Accordingly, we express no such opinion. An audit also includes evaluating the appropriateness of
accounting policies used and the reasonableness of significant accounting estimates made by management,
as well as evaluating the overall presentation of the financial statements.
We believe that the audit evidence we have obtained is sufficient and appropriate to provide a basis for our
audit opinion.
Opinion
In our opinion, the financial statements referred to above present fairly, in all material respects, the financial
position of the Department as of June 30, 2014 and 2013, and the changes in its financial position and its
cash flows for the years then ended, in accordance with U.S. generally accepted accounting principles.

(THIS PAGE LEFT BLANK INTENTIONALLY)

2
Emphasis of Matter
As discussed in note 1(a), the financial statements only include the Department of Aviation and do not
purport to, and do not, present fairly the financial position of the City of Atlanta, Georgia, as of June 30,
2014 and 2013, and the changes in financial position thereof for the years then ended in accordance with
U.S. generally accepted accounting principles. Our opinion is not modified with respect to this matter.
Other Matters
Required Supplementary Information
U.S. generally accepted accounting principles require that the information in the Management’s Discussion
and Analysis on pages 3 through 11 and Required Supplementary Information on page 44 be presented to
supplement the basic financial statements. Such information, although not a part of the basic financial
statements, is required by the Governmental Accounting Standards Board who considers it to be an essential
part of financial reporting for placing the basic financial statements in an appropriate operational, economic,
or historical context. We have applied certain limited procedures to the required supplementary information
in accordance with auditing standards generally accepted in the United States of America, which consisted
of inquiries of management about the methods of preparing the information and comparing the information
for consistency with management’s responses to our inquiries, the basic financial statements, and other
knowledge we obtained during our audit of the basic financial statements. We do not express an opinion or
provide any assurance on the information because the limited procedures do not provide us with sufficient
evidence to express an opinion or provide any assurance.
Other Information
Our audits were conducted for the purpose of forming an opinion on the basic financial statements. The
introductory section and the statistical section are presented for purposes of additional analysis and are not a
required part of the basic financial statements. Such information has not been subjected to the auditing
procedures applied in the audits of the basic financial statements, and accordingly, we do not express an
opinion or provide any assurance on it.
Other Reporting Required by Government Auditing Standards
In accordance with Government Auditing Standards, we have also issued our report dated November 21,
2014 on our consideration of the Department’s internal control over financial reporting and on our tests of
its compliance with certain provisions of laws, regulations, contracts, and grant agreements and other matters.
The purpose of that report is to describe the scope of our testing of internal control over financial reporting
and compliance and the results of that testing, and not to provide an opinion on internal control over financial
reporting or on compliance. That report is an integral part of an audit performed in accordance with
Government Auditing Standards in considering the Department’s internal control over financial reporting
and compliance.
Atlanta, Georgia
November 21, 2014

(THIS PAGE LEFT BLANK INTENTIONALLY)

INTRODUCTORY SECTIONLetter of Transmittal
GFOA Certificate of Achievement
Principal Officers
Organizational Chart
MANAGEMENT’S DISCUSSION AND ANALYSIS

(THIS PAGE LEFT BLANK INTENTIONALLY)

CITY OF ATLANTA, GEORGIA
DEPARTMENT OF AVIATION
Management’s Discussion and Analysis (Unaudited)
June 30, 2014 and 2013
(In thousands)
3 (Continued)
The following discussion and analysis of the financial performance and activity of the City of Atlanta, Georgia,
Department of Aviation (Department) provides an introduction and understanding of the Department’s basic
financial statements for fiscal years ended June 30, 2014 and June 30, 2013 with selected comparable data for the
fiscal year ended June 30, 2012. This discussion has been prepared by management and should be read in
conjunction with the basic financial statements, notes and supplementary information found in this report. This
information taken collectively is designed to provide the reader with an understanding of the Department’s
finances.
Overview of the Financial Statements
The Department is a major enterprise fund wholly owned by the City of Atlanta (City) and conducts business-type
activities in its operation of Hartsfield-Jackson Atlanta International Airport (Airport). The Airport is
self-supporting and does not draw on any other City resources in order to fund its operations, nor does the City
draw from any Airport revenues in order to fund non-Airport activities.
The Department’s financial statements are prepared on an accrual basis of accounting in accordance with
accounting principles generally accepted in the United States of America as promulgated by the Governmental
Accounting Standards Board (GASB). Therefore, revenues are recognized when earned and expenses recognized
when incurred. Capital assets, except for land and assets held for future use, are capitalized and depreciated over
their estimated useful lives. See “note 1 to the Financial Statements” for a summary of the Department’s significant
accounting policies and practices.
The Statements of Net Position present information on all of the Department’s assets, deferred outflows of
resources, and liabilities, with the difference between the assets and deferred outflows of resources less liabilities
as net position. Over time, increases or decreases in net position may serve as a useful indicator of the Department’s
financial standing.
The Statements of Revenues, Expenses and Changes in Net Position present information showing how the
Department’s net position changed during the year. All changes in net position are reported as soon as the
underlying event giving rise to the change occurs, regardless of timing of related cash flows. Thus revenues and
expenses are reported in this statement for certain items that will result in cash flows in future fiscal periods.
The Statements of Cash Flows report the flows of cash and cash equivalents. Consequently, only transactions that
affect the Department’s cash accounts are recorded in these statements. A reconciliation follows these statements
to assist in the understanding of the difference between cash flows from operating activities and operating income.
Aviation Highlights
Fiscal year 2014 was a year focused on further enhancing customer service and the financial health of the Airport.
Some of the significant accomplishments are summarized below:
Completed the Wi-Fi infrastructure upgrade. The upgrade can accommodate 15,000 simultaneous
users allowing the Airport to offer free Wi-Fi services to travelling passengers. “Wi-Fi Before You
Fly” will significantly enhance the customer experience at the Airport.

CITY OF ATLANTA, GEORGIA
DEPARTMENT OF AVIATION
Management’s Discussion and Analysis (Unaudited)
June 30, 2014 and 2013
(In thousands)
4 (Continued)
Refunded Series 2004 C&J PFC bonds totaling $528.9M, Series 2003RF-D and 2004A, B, F & G
GARB bonds totaling $348.1M, resulting in a net present value savings of $73.6M.
Moody’s Investor Services upgraded its rating for the General Airport Revenue Bonds (GARBS) from
“A1” to “Aa3” with a stable outlook.
Moody’s Investor Services affirmed its “A1” rating on the Passenger Facility Charge (PFC) revenue
bonds.
Completed expansion of the Concourse D center point with the addition of 8 new retail and 3 new
food & beverage concessions.
Korean Air’s Airbus A380, the world’s largest passenger aircraft, made its historic arrival at
Hartsfield-Jackson.
During fiscal year 2014, enplanements decreased by 0.4% from the previous year, which is the first decrease in
enplanements since 2009. The following chart shows total enplaned passengers, flight operations, and air cargo
and mail activity (measured in metric tons).
2014 2013 2012
Enplanements and operations activity:
Total enplanements 47,318,755 47,526,243 47,147,315
Percent change from prior year -0.4% 0.8% 2.1%
Flight operations 888,014 918,757 931,554
Percent change from prior year -3.3% -1.4% -0.6%
Air Cargo and Mail (metric tons) 600,418 637,022 653,383
Percent change from prior year -5.7% -2.5% -2.4%
The total number of passengers served by the Airport in fiscal year 2014 was 94.8 million, which is a decrease of
0.3% from the previous year. Total passengers in fiscal year 2013 and 2012 were 95.2 million and 94.2 million,
respectively.
Enplanements and operations are being impacted in fiscal year 2014 by the continued re-balancing efforts of
Southwest and Airtran routes as they finalize the impact of their recent merger. Flight operations continued their
downward trend compared to the previous year, as airlines remain focused on reducing the use of smaller regional
jets and increasing the utilization of mid-size and large jets for passenger traffic in Atlanta. Generally speaking,
this would result in lower operations but equal or increased passenger traffic.
Financial Highlights
Revenues
The City and most of the airlines serving the Airport have entered into agreements relating to the use of the airfield
(Airport Use Agreements or the Airport Use License Agreement). Under these agreements, the airlines pay landing
fees to the City that offset a portion of operating and maintenance expenses, debt service, and an additional 20%
coverage on General Airport Revenue Bonds issued to finance airline-approved airfield capital improvements.

CITY OF ATLANTA, GEORGIA
DEPARTMENT OF AVIATION
Management’s Discussion and Analysis (Unaudited)
June 30, 2014 and 2013
(In thousands)
5 (Continued)
The City also entered into agreements with the principal passenger airlines serving the Airport (Contracting
Airlines) relating to their use and lease of the Central Passenger Terminal Complex (CPTC Leases). The CPTC
Leases provide for the calculation of terminal rentals and charges by the City to recover a portion of certain
operating and maintenance expenses, debt service, and an additional 20% coverage on General Airport Revenue
Bonds issued to finance airline approved CPTC projects.
Both the Airport Use Agreements and the CPTC Leases have been extended through September 20, 2017 under
the Extended and Amended Airline Use Agreements and the Extended and Amended Airline Agreements.
Total revenues for the Airport increased 0.1% in 2014 compared to 2013. Operating revenues for the Airport
increased by 1.2% while nonoperating revenues decreased by 2.3%. Comparative figures for the last three fiscal
years are in the chart below (in thousands):
2014 2013 2012
Operating revenues $ 496,252 490,386 394,132
Percent change 1.2% 24.4% -4.2%
Nonoperating revenue 210,678 215,712 201,962
Percent change -2.3% 6.8% -3.0%
Total revenues $ 706,930 706,098 596,094
Total percent change 0.1% 18.5% -3.8%
Operating Revenues
Overall, operating revenues increased by 1.2% in fiscal year 2014 compared to fiscal year 2013. Other concessions
increased by $5.8 million due to higher concession sales, new outlets opening throughout the Airport and fees for
wireless service charged to customers. In fiscal year 2014, building and land rental decreased by $6.3 million. The
largest contributing factor to this decrease is elimination of supplemental rent previously charged to the airlines.
This was offset by an increase in tenant finish projects completed in various concourses. Other operating revenues
increased by $5.0 million, due primarily to police, fire, automated ground transportation system (AGTS), and other
cost recovery fees.
Operating revenues increased by 24.4% in fiscal year 2013 compared to fiscal year 2012. Other concessions
increased by $12.7 million due to higher concession sales related to a full year of operations for the International
Terminal, along with the impact of new agreements and new openings throughout the Airport. In fiscal year 2013,
building and land rental increased by $62.3 million. The largest contributing factor to this increase is the change
in the rates and charges for the airlines related to the opening of the International Terminal. The opening of the
parking garages at the International Terminal increased parking capacity for the entire airport, which helped to
drive an increase of $3.3 million in parking revenue. Other operating revenues increased by $17.5 million, due
primarily to police, fire, automated ground transportation system (AGTS), and other cost recoveries related to a
full year of operations of the International Terminal.

CITY OF ATLANTA, GEORGIA
DEPARTMENT OF AVIATION
Management’s Discussion and Analysis (Unaudited)
June 30, 2014 and 2013
(In thousands)
6 (Continued)
2014 2013 2012
Parking $ 118,461 117,425 114,129 Car rental 32,380 31,765 30,764 Other concessions 103,206 97,403 84,692 Building and land rental 136,603 142,893 80,578 Landing fees 47,084 47,416 48,009 Other 58,518 53,484 35,960
Total operating revenues $ 496,252 490,386 394,132
Nonoperating Revenues
Nonoperating revenues consist of net investment income, passenger facility charges (PFC’s), customer facility
charges (CFC’s), and other nonoperating income net of expenses. Net investment income was $23.3 million in
2014, $9.1 million in 2013 and $16.1 million in 2012. PFCs were $180.4 million in 2014, $180.1 million in 2013
and $177.9 million in 2012. CFCs, which are collected to fund the financing and operation of the Rental Car Center
(RCC), were $34.0 million in 2014, $32.7 million in 2013 and $30.0 million in 2012. For fiscal years 2014, 2013
and 2012 operating expenses of $10.6 million, $8.4 million, and $7.1 million, respectively, are netted against gross
revenues to arrive at each year’s reported revenues of $23.4 million, $24.3 million, and $22.9 million.
Operating Expenses
Operating expenses in fiscal year 2014 increased by $41.5 million in comparison to fiscal year 2013. Other
operating expenses contributed $12.6 million dollars to this increase which is driven by the Departments
cancellation and repayment of supplemental rent paid to the airlines from prior years. Depreciation and
amortization expenses increased $11.3 million resulting from the addition of $218 million in depreciable assets.
Repairs, maintenance and other contractual services contributed $10.9 million to this increase, which is primarily
attributed to an increase in the amount of large maintenance projects completed in fiscal year 2014 compared to
2013. Salaries and employee benefits contributed $9.6 million to this increase due to staffing of vacant positions,
and an increase in overtime, driven by increases in maintenance, fire and police overtime for ongoing operations
and managing two significant winter storm events that occurred in fiscal year 2014. Offsetting these increases was
a decrease in general services of $3.6 million driven mainly by a decrease in the Airport’s indirect costs for internal
services provided by other City Departments.

CITY OF ATLANTA, GEORGIA
DEPARTMENT OF AVIATION
Management’s Discussion and Analysis (Unaudited)
June 30, 2014 and 2013
(In thousands)
7 (Continued)
2014 2013 2012
Salaries and employee benefits $ 91,691 82,050 79,785 Repairs, maintenance and other contractual
services 112,676 101,742 98,258 General services 16,898 20,504 21,997 Utilities 8,990 8,768 8,151 Materials and supplies 4,720 4,353 4,090 Other operating expenses 24,742 12,146 7,761 Depreciation and amortization expenses 222,446 211,110 161,642
Total operating expenses $ 482,163 440,673 381,684
Operating expenses in fiscal year 2013 increased by $59.0 million in comparison to fiscal year 2012. Depreciation
and amortization expenses contributed $49.5 million to this increase driven by a full year of depreciation on the
International Terminal which only had two months of depreciation during 2012. In addition, repairs, maintenance
and other contractual services contributed $3.5 million to this increase, which is primarily attributed to an increase
in parking costs and shuttle services related to a full year of operations for the International Terminal. This was
offset by a decrease in airfield maintenance, SkyTrain and legal costs. There was an increase of $2.3 million in
salaries and employee benefits due to staffing of vacant positions. General services decreased by approximately
$1.5 million driven mainly by a decrease in the Airport’s indirect costs for internal services provided by other City
departments.
Nonoperating Expenses
Nonoperating expenses consist primarily of interest on long term debt. Interest expense was $139.8 million in
2014, $146.7 million in 2013, and $112.3 million in 2012. These amounts are net of any capitalized interest, which
is recorded in the Department’s capital assets as part of construction in process.
The decrease in interest expense in fiscal year 2014 is a result of savings associated with the 2014 refunding of the
Series 2004 C&J PFC bonds and Series 2003RF-D and 2004A, B, F & G General Airport Revenue bonds. The
change in interest expense also includes an increase in amortization of premiums and discounts which is being
offset by a decrease in capitalized interest.

CITY OF ATLANTA, GEORGIA
DEPARTMENT OF AVIATION
Management’s Discussion and Analysis (Unaudited)
June 30, 2014 and 2013
(In thousands)
8 (Continued)
Changes in Net Position
The changes in net position for the fiscal years ended June 30 are as follows (in thousands):
2014 2013 2012
Operating revenues $ 496,252 490,386 394,132 Operating expenses 259,717 229,563 220,042
Operating income, beforedepreciation and amortization 236,535 260,823 174,090
Depreciation and amortization 222,446 211,110 161,642
Operating income 14,089 49,713 12,448
Nonoperating income, net 70,852 68,994 89,648
Income before capital contributions,transfers and special items 84,941 118,707 102,096
Capital contributions 10,888 33,500 37,522 Transfers in (out) (6,781) (193) —
Increase in net position 89,048 152,014 139,618
Beginning net position 4,620,602 4,468,588 4,363,221
Effect of adoption of GASB 65 — — (34,251)
Ending net position $ 4,709,650 4,620,602 4,468,588
The Airport receives Airport Improvement Program Grants and other grant related funds from various sources to
support particular programs. In fiscal year 2014 the Airport recorded revenue of $5.6 million from the FAA, and
$5.3 million from the Transportation Security Administration. This is a decrease of $22.6 million from fiscal year
2013.
Financial Position
The statement of net position presents the financial position of the Airport at the end of a fiscal year. The statement
includes all assets, deferred outflows of resources and liabilities of the Airport. Net position represents the
difference between total assets and deferred outflows of resources and total liabilities and can be viewed as an
indicator of the financial health of the Airport. During fiscal year 2014, net position increased by $89.0 million, or
1.9%, over the previous fiscal year. Net position increased in fiscal year 2013 by $152.0 million, or 3.4% compared
to fiscal year 2012.
Total assets increased by $29.1 million, or 0.4%, in fiscal year 2014 compared to fiscal year 2013. Non-Current
Assets (excluding capital assets) which are predominately comprised of restricted cash and cash equivalents and
investments decreased by $22.8 million, or 2.0% in 2014. Capital assets, net of accumulated depreciation,
decreased by $35.2 million, or 0.6% in 2014. These assets will be used for annual debt obligations.

CITY OF ATLANTA, GEORGIA
DEPARTMENT OF AVIATION
Management’s Discussion and Analysis (Unaudited)
June 30, 2014 and 2013
(In thousands)
9 (Continued)
Current assets increased by $87.1 million, which is primarily due to operating income, exclusive of depreciation
and amortization, net of the reduction for annual debt service payments.
Total assets increased by $14.0 million, or 0.2%, in fiscal year 2013 compared to fiscal year 2012. Non-Current
Assets (excluding capital assets) which are predominately comprised of restricted cash and cash equivalents and
investments decreased by $162.9 million in 2013. This decrease is the result of the on-going construction costs as
seen by the net increase in capital assets of approximately $86.7 million. Additionally these assets will be used for
annual debt obligations.
2014 2013 2012
Current assets $ 925,520 838,463 748,198
Non-Current Assets 1,108,416 1,131,196 1,294,086 Capital assets, net 5,906,070 5,941,238 5,854,577
Total assets $ 7,940,006 7,910,897 7,896,861
For fiscal year 2014, total liabilities decreased by $50.0 million, due mainly to debt service payouts in fiscal year
2014 which is being offset by increases in restricted accounts payable for accrual of construction costs, increases
in other post-retirement benefits liability and changes in outstanding debt related to the 2014 debt refunding.
For fiscal year 2013, total liabilities decreased by $147.8 million, due mainly to debt service payouts in fiscal year
2013 and reduction of contract retention due to a number of large projects closing out.
2014 2013 2012
Current liabilities (payable from unrestricted assets) $ 147,500 150,135 149,760
Current liabilities (payable from restricted assets) 105,791 94,393 121,694
Noncurrent liabilities 3,051,356 3,110,152 3,231,069
Total liabilities $ 3,304,647 3,354,680 3,502,523
The majority of the Department’s total net position for each of the fiscal years reflects the investment in capital
assets less the related indebtedness outstanding used to acquire those capital assets. The Department uses these
capital assets to provide services to the airlines and to its passengers and visitors to the Airport; consequently, these
assets are not available for future spending. The Airport reports its investment in capital assets net of related debt.
The resources required to repay the debt must be provided annually from operations since it is unlikely that the
capital assets themselves will be liquidated to pay the liabilities.
Restricted net position reflects the portion of the Airport’s net position restricted for debt and capital projects that
are subject to external restrictions under the Department’s Restated and Amended Master Bond Ordinance adopted
on March 20, 2000, as amended, and PFCs that are restricted by federal regulations. The unrestricted portion of

CITY OF ATLANTA, GEORGIA
DEPARTMENT OF AVIATION
Management’s Discussion and Analysis (Unaudited)
June 30, 2014 and 2013
(In thousands)
10 (Continued)
net position, $708.0 million as of June 30, 2014, represents amounts that are not subject to external restrictions (in
thousands).
2014 2013 2012
Net investment in capital assets component of
net position $ 3,065,175 3,111,590 2,940,208
Restricted component of net position 936,495 889,522 869,781
Unrestricted component of net position 707,980 619,490 658,599
Total net position $ 4,709,650 4,620,602 4,468,588
Airport Capital Assets and Capital Improvement Plan
As of fiscal years ended 2014, 2013 and 2012, the Airport had capital assets of $5.9 billion in each of these fiscal
years. The majority of these balances are in runways, taxiways, and other land improvements and terminal,
maintenance buildings and other structures; net of any related accumulated depreciation. For these fiscal years, the
balance in construction in process was $240.5 million, $259.4 million, and $182.0 million, respectively. For fiscal
year 2014, the list below identifies the major components of the Airport’s construction in process account.
Additional information regarding the Department’s capital assets can be found in note 5 in the Notes to Financial
Statements (in thousands).
2014
Concourse projects $ 61,287
Airfield and runway projects 54,603
Concourse transportation system (AGTS) 6,610
Terminal/passenger projects 96,143
Security/operations projects 1,993
Other 19,837
Total construction in process $ 240,473
Long-Term Debt
As of June 30, 2014, the Airport had a total of $3.0 billion outstanding in General Airport Revenue, PFC
Subordinate Revenue, and CFC Taxable Revenue Bonds. These bonds mature from January 1, 2015 to January 1,
2042, with interest rates ranging from 2.00% to 6.00%. The bonds do not constitute debt of the City of Atlanta, or
a pledge of the full faith and credit of the City. Additional information regarding long-term obligations can be
found in note 6 in the Notes to Financial Statements.

11
Requests for Information
This financial report is designed to provide a general overview of the Department’s finances for all interested
parties. Questions concerning any of the information provided in this report, or requests for additional information
should be addressed to:
Aviation Deputy General Manager – Chief Financial Officer
P.O. Box 20509
Atlanta, Georgia, 30320

(THIS PAGE LEFT BLANK INTENTIONALLY)

STATISTICAL SECTIONUnlike the financial statements, this section usually covers
more than one fiscal year and may present non-accounting
data. This information is presented in five categories:
Financial Trends (Exhibits 1 and 2) – intended to help users
understand and assess how the Airport’s financial position has
changed over time.
Revenue Capacity (Exhibits 3) – intended to help users
understand and assess the factors that affect the Airport’s
ability to generate its own source revenues.
Debt Capacity (Exhibits 4 and 5) – intended to help users
understand and assess the Airport’s debt burden and its
ability to cover and issue additional debt.
Demographic and Economic (Exhibits 6 and 7) – intended to
help users understand the socio-economic environment in
which the Airport operates and to provide financial statement
information over time and among similar entities.
Operating Information (Exhibits 8 through 13) – intended to
provide contextual information about the Airport’s operations
and resources to help readers use financial statement
information to understand and assess the Airport’s
economic condition.
BASIC FINANCIAL STATEMENTS
These basic financial statements summarize the financial
position and operating results of the Department
of Aviation. They also introduce the more detailed financial
statements and supplemental schedules in the following
subsections.

12
CITY OF ATLANTA, GEORGIADEPARTMENT OF AVIATION
Statements of Net Position
June 30, 2014 and 2013
(In thousands)
Assets 2014 2013
Current assets:Cash and cash equivalents $ 67 5,413 Restricted cash and cash equivalents 67,619 63,562 Equity in cash management pool 799,071 712,587 Accounts receivable, net of allowance for doubtful accounts
of $3,780 in 2014 and $8,534 in 2013 11,442 10,433 Restricted other assets 38,172 39,325 Prepaid expenses 1,172 1,766 Materials and supplies, net of allowance
of $567 in 2014 and $587 in 2013 7,977 5,377
Total current assets 925,520 838,463
Noncurrent assets:Restricted cash and cash equivalents 661,016 720,772 Restricted investments 436,760 400,104 Due from other governments 10,640 10,320
Capital assets:Land 584,230 584,230 Land purchased for noise abatement 293,207 306,797 Runways, taxiways, and other land improvements 3,093,749 3,068,825 Terminal, maintenance buildings, and other structures 3,800,125 3,653,946 Other property and equipment 288,296 240,986 Construction in process 240,473 259,416 Less accumulated depreciation (2,394,010) (2,172,962)
Total capital assets, net 5,906,070 5,941,238
Total noncurrent assets 7,014,486 7,072,434
Total assets 7,940,006 7,910,897
Deferred outflows of resources:Accumulated deferred amount of debt refundings 74,291 64,385
Total assets and deferred outflows of resources 8,014,297 7,975,282
See accompanying notes to financial statements.

13
CITY OF ATLANTA, GEORGIADEPARTMENT OF AVIATION
Statements of Net Position
June 30, 2014 and 2013
(In thousands)
Liabilities and Net Position 2014 2013
Current liabilities:Accounts payable $ 16,327 15,042 Accrued expenses 15,586 10,321 Claims payable 1,900 1,893 Current maturities of long-term debt 71,385 73,465 Accrued interest payable 42,146 49,311 Current portion of other liabilities 156 103
Current liabilities 147,500 150,135
Current liabilities payable from restricted assets:Current maturities of long-term debt 33,730 32,120 Accrued interest payable 20,344 28,502 Accounts payable 46,653 29,403 Contract retention 5,064 4,368
Current liabilities payable from restricted assets 105,791 94,393
Total current liabilities 253,291 244,528
Long-term liabilities:Long-term debt, less current maturities 2,997,127 3,061,999 Contract retention 1,448 3,322 Accrued workers’ compensation 481 270 Other post-retirement benefits 52,300 44,561
Total long-term liabilities 3,051,356 3,110,152
Total liabilities 3,304,647 3,354,680
Net position:Net investment in capital assets 3,065,175 3,111,590 Restricted for:
Capital projects 554,081 534,521 Debt service 382,414 355,001
Unrestricted 707,980 619,490 Total net position $ 4,709,650 4,620,602
See accompanying notes to financial statements.

14
CITY OF ATLANTA, GEORGIADEPARTMENT OF AVIATION
Statements of Revenue, Expenses, and Changes in Net Position
Years ended June 30, 2014 and 2013
(In thousands)
2014 2013
Operating revenue:Parking, car rental, and other concessions $ 254,047 246,593 Terminal, maintenance buildings, and other rentals 136,603 142,893 Landing fees 47,084 47,416 Other 58,518 53,484
Total operating revenues 496,252 490,386
Operating expenses:Salaries and employee benefits 91,691 82,050 Repairs, maintenance and other contractual services 112,676 101,742 General services 16,898 20,504 Utilities 8,990 8,768 Materials and supplies 4,720 4,353 Other 24,742 12,146 Depreciation and amortization expenses 222,446 211,110
Total operating expenses 482,163 440,673
Operating income 14,089 49,713
Nonoperating revenue (expenses):Investment income, net 23,322 9,102 Passenger facility charges 180,382 180,077 Customer facility charges, net 23,437 24,290 Interest on long-term debt (139,826) (146,718) Other revenue (expenses) (16,463) 2,243
Nonoperating revenue (expenses), net 70,852 68,994
Income before contributions and transfers 84,941 118,707
Capital contributions 10,888 33,500 Operating transfer to the City (6,781) (193)
Change in net position 89,048 152,014
Net position, beginning of the year, as adjusted 4,620,602 4,468,588 Net position, end of the year $ 4,709,650 4,620,602
See accompanying notes to financial statements.

15 (Continued)
CITY OF ATLANTA, GEORGIADEPARTMENT OF AVIATION
Statements of Cash Flows
Years ended June 30, 2014 and 2013
(In thousands)
2014 2013
Cash flows from operating activities:Receipts from customers and tenants $ 499,254 484,946 Payments to suppliers for goods and services (168,740) (155,482) Payments to employees for services (83,714) (74,959)
Net cash provided by operating activities 246,800 254,505
Cash flows from investing activities:Interest and dividends on investments 19,314 21,059 Purchases of restricted investments (126,728) (312,681) Sales and redemptions of restricted investments 92,377 200,837 Change in pooled investment fund (85,101) (125,640)
Net cash used in investing activities (100,138) (216,425)
Cash flows from capital and related financing activities:Capital grants 8,482 40,076 Principal repayments of long-term debt and commercial notes (982,615) (96,810) Proceeds from bond and note issuances 929,738 — Acquisition, construction, and improvement of capital assets (186,936) (309,231) Passenger and customer facility charges 207,378 205,783 Contract retention withheld (1,178) (29,140) Interest and other fees paid on bonds (182,576) (148,412)
Net cash used in capital and related financingactivities (207,707) (337,734)
Decrease in cash and cash equivalents (61,045) (299,654)
Cash and cash equivalents:Beginning of year 789,747 1,089,401 End of year $ 728,702 789,747
16
CITY OF ATLANTA, GEORGIADEPARTMENT OF AVIATION
Statements of Cash Flows
Years ended June 30, 2014 and 2013
(In thousands)
2014 2013
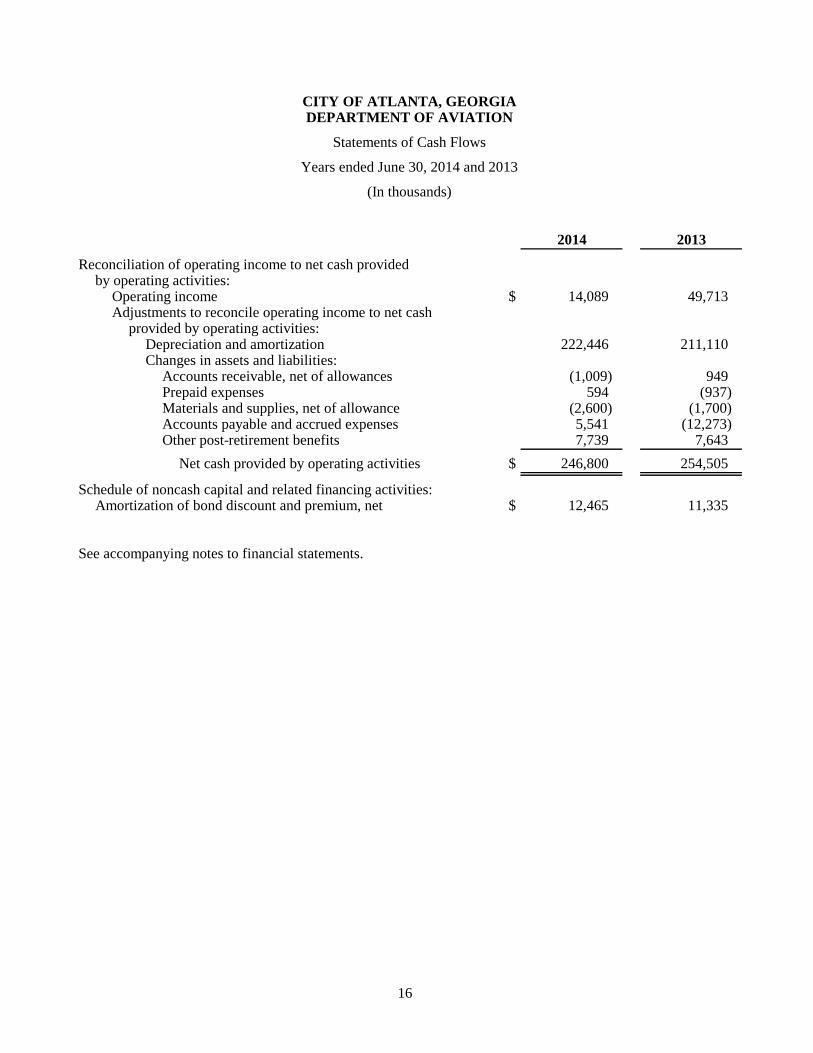
Reconciliation of operating income to net cash providedby operating activities:
Operating income $ 14,089 49,713 Adjustments to reconcile operating income to net cash
provided by operating activities:Depreciation and amortization 222,446 211,110 Changes in assets and liabilities:
Accounts receivable, net of allowances (1,009) 949 Prepaid expenses 594 (937) Materials and supplies, net of allowance (2,600) (1,700) Accounts payable and accrued expenses 5,541 (12,273) Other post-retirement benefits 7,739 7,643
Net cash provided by operating activities $ 246,800 254,505
Schedule of noncash capital and related financing activities:Amortization of bond discount and premium, net $ 12,465 11,335
See accompanying notes to financial statements.

REQUIRED SUPPLEMENTARY INFORMATIONNOTES TO FINANCIAL STATEMENTS1. Summary of Significant Accounting Policies
2. Deposits and Investments
3. Accounts Receivable
4. Restricted Assets
5. Capital Assets
6. Long-term Debt
7. Leased Facilities
8. Pension and Other Employee Benefit Plans
9. Risk Management
10. Commitments and Contingencies
11. Subsequent Events

(THIS PAGE LEFT BLANK INTENTIONALLY)

CITY OF ATLANTA, GEORGIA
DEPARTMENT OF AVIATION
Notes to Financial Statements
June 30, 2014 and 2013
17 (Continued)
(1) Summary of Significant Accounting Policies
(a) Reporting Entity
The Department of Aviation (the Department) of the City of Atlanta, Georgia (the City) operates
Hartsfield-Jackson Atlanta International Airport (the Airport). The accompanying financial statements
include only the financial activities of the Department. The Department is an integral part of the City’s
financial reporting entity, and its results are included in the Comprehensive Annual Financial Report
(CAFR) of the City as a major enterprise fund. The latest available CAFR is as of and for the year
ended June 30, 2014; that CAFR should be read in conjunction with these financial statements.
The accounting policies of the Department conform to accounting principles generally accepted in the
United States of America as applied to governmental units. The Department’s most significant
accounting policies are summarized below.
(b) Basis of Accounting
The financial statements are reported using the economic resources measurement focus and the accrual
basis of accounting. Revenues are recorded when earned and expenses are recorded when a liability is
incurred, regardless of the timing of related cash flows. Grants and contract revenues, which are
received or receivable from external sources, are recognized as revenues to the extent of related
expenses or satisfaction of eligibility requirements.
(c) Cash Equivalents
The Department considers all highly liquid securities with an original maturity of three months or less
to be cash equivalents. At June 30, 2014 and 2013, cash and cash equivalents included the following
(in thousands):
2014 2013
Unrestricted cash and cash equivalents $ 67 5,413 Restricted cash and cash equivalents 728,635 784,334
Total cash and cash equivalents $ 728,702 789,747
(d) Investments
Investments are reported at fair value based on quoted market prices, and include any accrued interest.
The City maintains a cash management pool in which the Department participates. Investment income
of this pooled fund is allocated to each participating fund based on that fund’s recorded equity in the
pooled fund. Construction, sinking, and special charges funds of the Department are held as restricted
assets and are not included in this pooled fund.
(e) Materials and Supplies
Materials and supplies are stated at the lower of average cost or market.

CITY OF ATLANTA, GEORGIA
DEPARTMENT OF AVIATION
Notes to Financial Statements
June 30, 2014 and 2013
18 (Continued)
(f) Restricted Assets
Restricted assets represent amounts that are required to be maintained pursuant to City ordinances
relating to bonded indebtedness (construction, renewal and extension, passenger facility charges,
customer facility charges, and sinking funds) – (note 4), and funds received for specific purposes
pursuant to U.S. government grants (related primarily to noise abatement programs and funding of
debt service).
(g) Capital Assets
Capital assets, which include runways, taxiways, terminals, maintenance buildings, other land
improvements, and property and equipment, are generally defined as assets with an individual cost in
excess of $5,000 and a useful life in excess of one year. Such assets are recorded at historical cost at
the time of acquisition or at fair value if donated. Major outlays for capital assets and improvements
and all expenses incurred in support of construction are capitalized as projects are constructed. The
costs of normal maintenance and repairs that do not add to the value of the asset or materially extend
assets’ lives are not capitalized.
Depreciation of capital assets is provided on the straight-line method over the following estimated
useful lives:
Classification Range of lives
Runways, taxiways, and other land improvements 15 – 35 yearsTerminal, maintenance buildings, and other structures 15 – 35 yearsOther property and equipment 2 – 20 years
The Department purchases certain residential parcels of land that are considered to be within the area
designated as “noise-impacted” surrounding the Airport. The costs of acquisition and relocation of
residents in this area are eligible under the Federal Aviation Administration (FAA) Noise Abatement
Grant Program for reimbursement. The FAA funds approximately 75% to 80% of these costs, and the
Department funds the remaining amount.
The FAA retains a continuing interest in the properties equal to its original funding percentage and
restricts the use of such properties to purposes, which are compatible with the noise levels associated
with the operation of the Airport. All costs associated with acquiring these parcels of land are recorded
under the caption “Land purchased for noise abatement” on the Department’s statements of net
position.
(h) Capitalization of Interest Costs
Net interest costs incurred during the construction of runways, taxiways, and other land improvements
and terminals, maintenance buildings, and other structures are capitalized as part of the historical costs
of acquiring these assets. The interest earned on investments acquired with proceeds from tax-exempt
borrowing (where such borrowings are restricted to the acquisition of assets) is offset against the
related interest costs in determining either the amount of interest to be capitalized or limitations on the

CITY OF ATLANTA, GEORGIA
DEPARTMENT OF AVIATION
Notes to Financial Statements
June 30, 2014 and 2013
19 (Continued)
amount of interest costs to be capitalized. Net interest costs capitalized for the years ended June 30,
2014 and 2013 totaled approximately $11.6 million and $13.9 million, respectively.
(i) Compensated Absences
City employees can accrue a maximum of 25 to 45 days of annual leave, depending upon their length
of service. Vested or accumulated vacation leave, including related benefits, is recorded as an expense
and liability as the benefits accrue to employees.
Employees can accrue unlimited amounts of sick leave. Sick leave can be taken only due to personal
illness or, in certain cases, illness of family members. Sick leave is not intended to be paid out except
under special circumstances where the City Council has given approval and the necessary funds are
available. Consequently, the Department does not record an accrued liability for the accumulated sick
leave.
(j) Bond Discounts and Premiums
Bond discounts and premiums are deferred and amortized over the term of the bonds. Bond discounts
and premiums are presented as a reduction or addition to the face amount of bonds payable.
(k) Deferred Outflows
The Department has deferred outflows of resources. The deferred outflows of resources are
consumption of net assets by the Department that are applicable to a future reporting period and include
the unamortized amounts for losses on the refunding of bond debt. Total accumulated deferred amount
of debt refunding for June 30, 2014 was $74.3 million, compared to $64.4 million for June 30, 2013.
(l) Capital Grants
Grants received for the acquisition or construction of capital assets are recorded as nonoperating
revenues (capital contributions), when earned. Grants are earned when costs relating to such capital
assets, which are reimbursable under the terms of the grants, have been incurred. During the years
ended June 30, 2014 and 2013, the Department recorded $10.8 million and $33.5 million, respectively,
in capital contributions consisting of federal grants in aid of construction and funding of debt services,
which are reimbursable.
(m) Operating Transfers
The department transfers funds to the City to cover its pro-rata share of costs when certain projects are
implemented by the City in which the Department is a direct beneficiary. During the years ended
June 30, 2014 and 2013, the Department recorded $6.8 million and $0.2 million, respectively, in
operating transfers. The fiscal year 2014 transfer was for the Department’s portion of the City’s Oracle
ERP system upgrade.

CITY OF ATLANTA, GEORGIA
DEPARTMENT OF AVIATION
Notes to Financial Statements
June 30, 2014 and 2013
20 (Continued)
(n) Net Position
Equity is classified as net position and displayed in three components, as applicable:
Net investment in capital assets – Consists of capital assets including restricted capital assets, net
of accumulated depreciation and reduced by the outstanding balances of any bonds, notes, or other
borrowings that are attributable to the acquisition, construction, or improvement of those assets.
If there are significant unspent related debt proceeds at year-end, the portion of the debt attributable
to the unspent proceeds is excluded from the calculation of invested in capital assets, net of related
debt.
Restricted – Consists of assets with constraints placed on the use either by (1) external groups,
such as creditors, grantors, contributors, or laws or regulations of other governments; or (2) law
through constitutional provisions or enabling legislation. When an expense is incurred for purposes
for which there are both restricted and unrestricted assets available, it is the Department’s policy
to apply those expenses to restricted assets, to the extent such are available, and then to unrestricted
assets.
Unrestricted – All other assets that constitute the components of net position that do not meet the
definition of “restricted” or “net investment in capital assets.”
(o) Classification of Revenue and Expenses
Operating revenue and expenses consist of those revenues and expenses that result from the ongoing
principal operations of the Department. Operating revenue is principally derived from agreements
relating to the use of Airport facilities. Landing fees are determined on the basis of the gross weight
of aircrafts landing at the Airport. Revenue from “terminal, maintenance buildings, and other rentals”
is derived from the leasing of various Airport facilities to air carriers and other tenants. Concession
revenue is earned through various agreements providing for the operation of concessions at the Airport,
such as parking lots, car rental agencies, newsstands, restaurants, etc. Nonoperating revenue and
expenses consist of those revenues and expenses that are related to financing and investing types of
activities and result from nonexchange transactions or ancillary activities.
Passenger Facility Charges
On February 26, 1997, in accordance with Section 158.29 of the Federal Aviation Regulations
(Title-14, Code of Federal Regulations, Part 158), the FAA approved the City’s application to impose
a Passenger Facility Charge (PFC) at the Airport and to use PFC revenue either now or in the future.
Between July 1997 and March 2001, the PFC was $3.00; effective April 2001, the PFC was increased
to $4.50. The Department recorded $180.4 million and $180.1 million in passenger facility charges for
the years ended June 30, 2014 and 2013, respectively.
Customer Facility Charges
The Installment Purchase Agreement entered into by the City with the City of College Park for the
purchase of a Rental Car Center (the RCC) on June 1, 2006 obligates the City to make debt service
payments through 2031, totaling $443.1 million, on the Series 2006A and Series 2006B Bonds issued

CITY OF ATLANTA, GEORGIA
DEPARTMENT OF AVIATION
Notes to Financial Statements
June 30, 2014 and 2013
21 (Continued)
by the City of College Park. In relation to the agreement, the City adopted an ordinance effective
October 1, 2005, imposing a Customer Facility Charge (CFC) at the Airport to fund the purchase. The
CFC of $5.00 is a charge on each Airport car rental transaction day applicable to both On-Airport
Operators and Off-Airport Operators. The Department recorded $34.0 million and $32.7 million in
customer facility charges for the years ended June 30, 2014 and 2013, respectively. Operating expenses
related to the RCC during fiscal years 2014 and 2013 of approximately $10.6 million and $8.4 million,
respectively, are netted against the CFC revenue and result in net CFC income of $23.4 million for
2014 and $24.3 million for 2013.
(p) Economic Concentration
Delta Air Lines and the Airport-owned parking facilities accounted for approximately 21.1% and 24%
of total operating revenues, respectively, for the year ended June 30, 2014. Delta Air Lines and the
Airport-owned parking facilities accounted for approximately 21.6% and 23.9% of total operating
revenues, respectively, for the year ended June 30, 2013, respectively.
(q) General Services Costs
The Department is one of a number of departments and/or funds maintained by the City. A portion of
general services costs (such as procurement, accounting, budgeting, and personnel administration) are
allocated to the Department for services provided by other City departments and/or funds. Such costs
are allocated to the Department based on a methodology employed by an independent study. Of the
Department’s recorded $16.9 million and $20.5 million in general services costs for the years ended
June 30, 2014 and 2013, respectively, the allocated expense amount for June 30, 2014 was
$8.5 million, compared to $11.7 million for June 30, 2013.
(r) New Accounting Standards
During fiscal year 2014, the Department adopted GASB Statement No. 66, Technical
Corrections-2012. The objective of this Statement is to improve accounting and financial reporting for
governments by resolving conflicting guidance that resulted from the issuance of Statement No. 54,
Fund Balance Reporting and Governmental Fund Type Definitions, and Statement No. 62,
Codification of Accounting and Financial Reporting Guidance Contained in Pre-November 30, 1989
FASB and AICPA Pronouncements.
During fiscal year 2013, the Department adopted GASB Statement No. 65, Items Previously Reported
as Assets and Liabilities. The Statement established accounting and financial reporting standards that,
among other things, recognized as outflows or inflows of resources, certain items that were previously
reported as assets and liabilities.
(s) Recently Issued Accounting Standard
In June 2012, GASB issued Statement No. 68, Accounting and Financial Reporting for Pensions. The
objective of this Statement is to improve accounting and financial reporting of government pensions.
Also, it improves information provided by government employers about financial support for pensions
that is provided by other entities. Requirements of this Statement are effective for financial statements
whose fiscal year begins after June 15, 2014 (fiscal year 2015 for the Department).

CITY OF ATLANTA, GEORGIA
DEPARTMENT OF AVIATION
Notes to Financial Statements
June 30, 2014 and 2013
22 (Continued)
The impact of this pronouncement on the Department’s financial statements is currently being
evaluated and has not yet been fully determined.
(t) Use of Estimates
The preparation of financial statements in conformity with U.S. generally accepted accounting
principles requires management to make estimates and assumptions that affect reported amounts and
disclosures. Actual results could differ significantly from those estimates.
(2) Deposits and Investments
Cash and cash equivalents and investments as of June 30, 2014 and 2013 are classified in the accompanying
financial statements as follows (in thousands):
2014 2013
Unrestricted:Cash and cash equivalents $ 67 5,413 Equity in cash management pool 799,071 712,587
Restricted:Cash and cash equivalents 728,635 784,334 Investments 436,760 400,104
Total deposits and investments $ 1,964,533 1,902,438
(a) Pooled Cash Held in City Treasury
The City maintains a cash pool that is available for use by all funds. The Department’s investment in
this pool is displayed in the accompanying financial statements as “Equity in cash management pool”.
As of June 30, 2014 and 2013, the Department had approximately $799.1 million and $712.6 million,
respectively, within the City’s cash management pool. At June 30, 2014 and 2013, the composition of
the equity in cash management pool portfolio consisted mainly of investments in Georgia Local
Government Investment Pool (Georgia Fund 1), Federal Home Loan Bank (FHLB), Federal Home
Loan Mortgage Corporation (FHLMC), Federal National Mortgage Association (FNMA), Federal
Farm Credit Bank (FFCB), Repos, and Negotiated Investment Deposit Agreements.
(b) Investments Authorized by the Georgia State Code Section 36-83-4 and the City of Atlanta
Investment Policy
The City has adopted an investment policy (the Policy) to minimize the inherent risks associated with
deposits and investments. The primary objective of the Policy is to invest funds to provide for the
maximum safety of principal.
Identified below are the investment types that are authorized for the City by the Policy. The Policy
also identifies certain provisions of the Official Code of Georgia (OCGA) that address interest rate
risk, credit risk, and concentration of credit risk. The Policy governs all governmental and
business-type activities for the City, but does not govern the City of Atlanta Pension Plans.

CITY OF ATLANTA, GEORGIA
DEPARTMENT OF AVIATION
Notes to Financial Statements
June 30, 2014 and 2013
23 (Continued)
The City’s investments are limited to U.S. government guaranteed securities and U.S. government
agency securities, which are limited to issues of the Federal Farm Credit Bank (FFCB), Federal Home
Loan Bank System (FHLBS), Federal Home Loan Mortgage Corporation (FHLMC), and Federal
National Mortgage Association (FNMA). Under the Policy, the City restricts investments in eligible
obligations to discount notes and callable or noncallable fixed-rate securities with a fixed principal
repayment amount.
The City may invest in fully collateralized repurchase agreements provided the City has on file a signed
Master Repurchase Agreement, approved by the City Attorney, detailing eligible collateral,
collateralization ratios, standards for collateral custody and control, collateral valuation, and conditions
for agreement termination. It also requires the securities being purchased by the City to be assigned to
the City, held in the City’s name, and deposited at the time the investment is made with the City or
with a third party selected and approved by the City; and is placed through a primary government
securities dealer, as defined by the Federal Reserve, or a financial institution doing business in the
state of Georgia, and is rated no less than A or its equivalent by two nationally recognized rating
services.
Under the Policy, the City’s investment portfolio, in aggregate, is to be diversified to limit its exposure
to interest rate, credit, and concentration risks by observing the above limitations.
(c) Investment in Local Government Investment Pool
The Department is a voluntary participant in Georgia Fund 1 that is managed by the Office of Treasury
and Fiscal Services. As of June 30, 2014 and 2013, the Department’s cash equivalent deposits in the
Georgia Fund 1 are approximately $93.7 million and $100.2 million, respectively. The total amount
recorded by all public agencies in Georgia Fund 1 at June 30, 2014 and 2013, was approximately
$10.9 billion and $9.9 billion, respectively.
(d) Investment Risk Disclosures
Interest Rate Risk
Interest rate risk is the risk that changes in market rates will adversely affect the fair value of an
investment. Generally, the longer the maturity of an investment the greater the sensitivity of its fair
value to changes in market interest rates. Additionally, the fair values of the investments may be highly
sensitive to interest rate fluctuations. By policy, the City establishes maximum maturity dates by
investment type in order to limit interest rate risk. The City manages its exposure to interest rate risk
by purchasing a combination of shorter-term and longer-term investments, and by timing cash flows
from maturities so that a portion is maturing, or coming close to maturing, evenly over time as
necessary to provide the cash flow and liquidity needs for operations.
Credit Risk
Credit risk is the risk that an issuer of an investment will not fulfill its obligation to the holder of the
investment. This risk is measured by the assignment of a rating by a nationally recognized statistical
rating organization. The City’s investment policy does not specify a minimum bond rating for
investments.

CITY OF ATLANTA, GEORGIA
DEPARTMENT OF AVIATION
Notes to Financial Statements
June 30, 2014 and 2013
24 (Continued)
As of June 30, 2014, the Department had the following investments with the corresponding credit
ratings and maturities (in thousands):
Maturity
Credit Under 31 – 180 181 – 365 Over Carrying
Type of investments rating 30 Days Days Days 1 – 5 Years 5 years value
U.S. government obligations Aaa/AAA $ 5,009 5,049 — 317,816 10,703 338,577 U.S. government treasuries Exempt — — — 75,393 — 75,393
Equity in cash management pool AAA 799,071 — — — — 799,071 GIC’s * — — — — 22,790 22,790
$ 804,080 5,049 — 393,209 33,493 1,235,831
* All Guaranteed Investment Contracts (GIC’s) are fully collateralized by U.S. Government Obligations or Agency securities.
As of June 30, 2013, the Department had the following investments with the corresponding credit
ratings and maturities (in thousands):
Maturity
Credit Under 31 – 180 181 – 365 Over Carrying
Type of investments rating 30 Days Days Days 1 – 5 Years 5 years value
U.S. government obligations Aaa/AAA $ — 10,012 5,099 287,330 4,788 307,229 U.S. government treasuries Exempt — — — 70,085 — 70,085
Equity in cash management pool AAA 712,587 — — — — 712,587 GIC’s * — — — — 22,790 22,790
$ 712,587 10,012 5,099 357,415 27,578 1,112,691
* All Guaranteed Investment Contracts (GIC’s) are fully collateralized by U.S. Government Obligations or Agency securities.
Custodial Credit Risk
Custodial credit risk for deposits is the risk that, in the event of the failure of a depository financial
institution, the City will not be able to recover its deposits or will not be able to recover collateral
securities that are in the possession of an outside party. The City requires that all uninsured collected
balances plus accrued interest in depository accounts be collateralized and that the market value of
collateralized pledged securities must be at least 110% of the deposit balances, and 102% for
repurchase agreements. As of June 30, 2014 and 2013, the City’s collateralization for pledged
securities at Wells Fargo was 110% in deposit accounts.
Custodial credit risks for investments, is the risk that in the event of the failure of the counterparty, the
City will not be able to recover the value of its investments or collateral securities that are in the
possession of an outside party. There was no counterparty risk to the City as of June 30, 2014 and
2013.
Concentration Credit Risk
The City’s investment policy contains no limitations on the amount that can be invested in any one
issuer beyond that stipulated by the OCGA. At June 30, 2014 and 2013, there were no investments in

CITY OF ATLANTA, GEORGIA
DEPARTMENT OF AVIATION
Notes to Financial Statements
June 30, 2014 and 2013
25 (Continued)
any one issuer, related to the Department, that were over 5% (excluding U.S. government securities)
by reporting unit.
Foreign Currency Risk
Foreign currency risk is the risk that changes in currency exchange rates could adversely affect an
investment’s or deposit’s fair value. The City is not exposed to this risk and its investment policy does
not provide for investments in foreign currency denominated securities.
(3) Accounts Receivable
Net accounts receivable as of June 30, 2014 and 2013 are due from airport tenants, customers, and
concessionaires. There are no material receivables expected to take longer than one year to collect.
(4) Restricted Assets
Restricted assets at June 30, 2014 and 2013 are summarized as follows (in thousands):
2014 2013
Airport Revenue Fund:
Cash and cash equivalents $ 5,047 5,047
Renewal and Extension Fund:
Cash and cash equivalents 34,991 34,817
Other assets 7,068 4,661
Passenger Facility Charge Fund:
Cash and cash equivalents 110,786 122,399
Other assets 28,326 31,675
Investments 413,970 377,314
Customer Facility Charge Fund:
Cash and cash equivalents 25,373 31,852
Other assets 2,778 2,989
Construction Fund:
Cash and cash equivalents 192,813 258,008
Sinking Funds:
Cash and cash equivalents 359,625 332,211
Investments 22,790 22,790
Total $ 1,203,567 1,223,763

CITY OF ATLANTA, GEORGIA
DEPARTMENT OF AVIATION
Notes to Financial Statements
June 30, 2014 and 2013
26 (Continued)
The following table is a summary of carrying amount of restricted assets as shown on the accompanying
statements of net position at June 30, 2014 and 2013 (in thousands):
2014 2013
Cash and cash equivalents $ 728,635 784,334
Other assets 38,172 39,325
Investments 436,760 400,104
Total $ 1,203,567 1,223,763
(5) Capital Assets
Summaries of capital asset activity and changes in accumulated depreciation for the years ended June 30,
2014 and June 30, 2013 are as follows (in thousands):
Balance at Balance at
June 30, Deletions and Transfers June 30,
2013 Additions retirements to additions 2014
Capital assets not being depreciated:
Land $ 891,027 316 (13,906) — 877,437
Construction in progress 259,416 197,695 — (216,638) 240,473
Total capital assets
not being depreciated 1,150,443 198,011 (13,906) (216,638) 1,117,910
Capital assets being depreciated:
Runways, taxiways, and
other land improvements 3,068,825 66 — 24,858 3,093,749
Terminal, maintenance buildings,
and other structures 3,653,946 — — 146,179 3,800,125
Other property and equipment 240,986 3,110 (1,401) 45,601 288,296
Total capital assets
being depreciated 6,963,757 3,176 (1,401) 216,638 7,182,170
Less accumulated depreciation for:
Runways, taxiways, and
other land improvements (1,173,899) (87,349) — — (1,261,248)
Terminal, maintenance buildings,
and other structures (885,111) (116,167) — — (1,001,278)
Other property and equipment (113,952) (18,930) 1,398 — (131,484)
Total accumulated
depreciation (2,172,962) (222,446) 1,398 — (2,394,010)
Net capital assets $ 5,941,238 (21,259) (13,909) — 5,906,070

CITY OF ATLANTA, GEORGIA
DEPARTMENT OF AVIATION
Notes to Financial Statements
June 30, 2014 and 2013
27 (Continued)
Balance at Balance at
June 30, Deletions and Transfers June 30,
2012 Additions retirements to additions 2013
Capital assets not being depreciated:
Land $ 891,027 — — — 891,027
Construction in progress 181,958 294,267 — (216,809) 259,416
Total capital assets
not being depreciated 1,072,985 294,267 — (216,809) 1,150,443
Capital assets being depreciated:
Runways, taxiways, and
other land improvements 3,024,783 — (35,828) 79,870 3,068,825
Terminal, maintenance buildings,
and other structures 3,566,204 — (3,008) 90,750 3,653,946
Other property and equipment 190,334 4,499 (36) 46,189 240,986
Total capital assets
being depreciated 6,781,321 4,499 (38,872) 216,809 6,963,757
Less accumulated depreciation for:
Runways, taxiways, and
other land improvements (1,121,056) (88,599) 35,756 — (1,173,899)
Terminal, maintenance buildings,
and other structures (782,476) (104,720) 2,085 — (885,111)
Other property and equipment (96,197) (17,791) 36 — (113,952)
Total accumulated
depreciation (1,999,729) (211,110) 37,877 — (2,172,962)
Net capital assets $ 5,854,577 87,656 (995) — 5,941,238
(6) Long-Term Debt
The City has issued various bonds to finance its extensive airport capital improvement projects. The net
revenues, as defined in the 2000 Airport Master Bond Ordinance as supplemented and amended, generated
by operating activities are pledged as security for the bonds. Interest is payable semi-annually in January and
July.
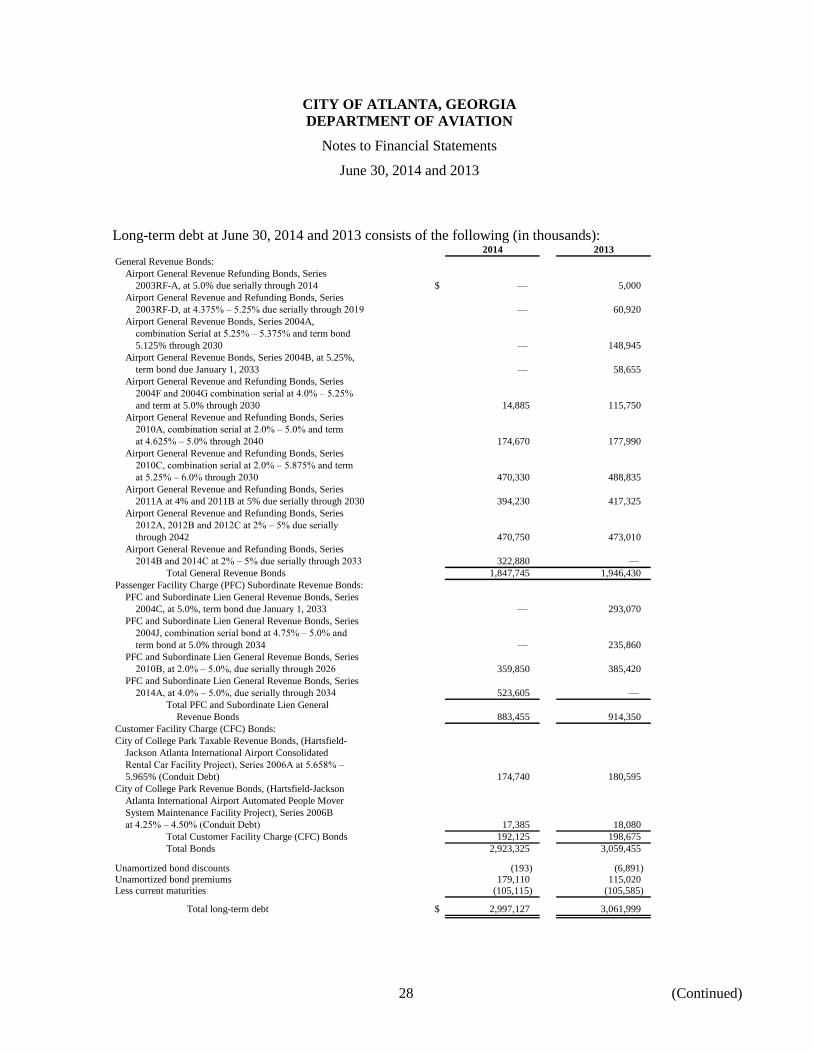
CITY OF ATLANTA, GEORGIA
DEPARTMENT OF AVIATION
Notes to Financial Statements
June 30, 2014 and 2013
28 (Continued)
Long-term debt at June 30, 2014 and 2013 consists of the following (in thousands):2014 2013
General Revenue Bonds:
Airport General Revenue Refunding Bonds, Series
2003RF-A, at 5.0% due serially through 2014 $ — 5,000
Airport General Revenue and Refunding Bonds, Series
2003RF-D, at 4.375% – 5.25% due serially through 2019 — 60,920
Airport General Revenue Bonds, Series 2004A,
combination Serial at 5.25% – 5.375% and term bond
5.125% through 2030 — 148,945
Airport General Revenue Bonds, Series 2004B, at 5.25%,
term bond due January 1, 2033 — 58,655
Airport General Revenue and Refunding Bonds, Series
2004F and 2004G combination serial at 4.0% – 5.25%
and term at 5.0% through 2030 14,885 115,750
Airport General Revenue and Refunding Bonds, Series
2010A, combination serial at 2.0% – 5.0% and term
at 4.625% – 5.0% through 2040 174,670 177,990
Airport General Revenue and Refunding Bonds, Series
2010C, combination serial at 2.0% – 5.875% and term
at 5.25% – 6.0% through 2030 470,330 488,835
Airport General Revenue and Refunding Bonds, Series
2011A at 4% and 2011B at 5% due serially through 2030 394,230 417,325
Airport General Revenue and Refunding Bonds, Series
2012A, 2012B and 2012C at 2% – 5% due serially
through 2042 470,750 473,010
Airport General Revenue and Refunding Bonds, Series
2014B and 2014C at 2% – 5% due serially through 2033 322,880 —
Total General Revenue Bonds 1,847,745 1,946,430
Passenger Facility Charge (PFC) Subordinate Revenue Bonds:
PFC and Subordinate Lien General Revenue Bonds, Series
2004C, at 5.0%, term bond due January 1, 2033 — 293,070
PFC and Subordinate Lien General Revenue Bonds, Series
2004J, combination serial bond at 4.75% – 5.0% and
term bond at 5.0% through 2034 — 235,860
PFC and Subordinate Lien General Revenue Bonds, Series
2010B, at 2.0% – 5.0%, due serially through 2026 359,850 385,420
PFC and Subordinate Lien General Revenue Bonds, Series
2014A, at 4.0% – 5.0%, due serially through 2034 523,605 —
Total PFC and Subordinate Lien General
Revenue Bonds 883,455 914,350
Customer Facility Charge (CFC) Bonds:
City of College Park Taxable Revenue Bonds, (Hartsfield-
Jackson Atlanta International Airport Consolidated
Rental Car Facility Project), Series 2006A at 5.658% –
5.965% (Conduit Debt) 174,740 180,595
City of College Park Revenue Bonds, (Hartsfield-Jackson
Atlanta International Airport Automated People Mover
System Maintenance Facility Project), Series 2006B
at 4.25% – 4.50% (Conduit Debt) 17,385 18,080
Total Customer Facility Charge (CFC) Bonds 192,125 198,675
Total Bonds 2,923,325 3,059,455
Unamortized bond discounts (193) (6,891) Unamortized bond premiums 179,110 115,020 Less current maturities (105,115) (105,585)
Total long-term debt $ 2,997,127 3,061,999

CITY OF ATLANTA, GEORGIA
DEPARTMENT OF AVIATION
Notes to Financial Statements
June 30, 2014 and 2013
29 (Continued)
Changes in long-term liabilities are as follows (in thousands):
Revenue, PFC, and CFC Bonds $ 3,059,455 846,485 (982,615) 2,923,325 105,115
Less:
Issuance discount and premium, net 108,129 83,253 (12,465) 178,917 —
Total bonded debt $ 3,167,584 929,738 (995,080) 3,102,242 105,115
Additions Retirements
Due within
one year
Balance at
June 30,
2014
Balance at
June 30,
2013
Revenue, PFC, and CFC Bonds $ 3,156,265 — (96,810) 3,059,455 105,585
Less:
Issuance discount and premium, net 119,464 — (11,335) 108,129 —
Total bonded debt $ 3,275,729 — (108,145) 3,167,584 105,585
Balance at
June 30,
2012 Additions Retirements
Due within
one year
Balance at
June 30,
2013
On June 21, 2006, the City of College Park, Georgia issued $211.9 million in Taxable Revenue Bonds
(Hartsfield Jackson Atlanta International Airport Rental Car Center Project), Series 2006A for the purpose
of acquiring, constructing, and installing a consolidated rental car facility. In addition, College Park issued
$22.0 million in Revenue Bonds (Hartsfield Jackson Atlanta International Airport Automated People Mover
System Maintenance Facility Project), Series 2006B for the purpose of acquiring, constructing, and installing
a maintenance facility for an automated people mover. The City (the Purchaser) pursuant to the terms of an
Installment Purchase Agreement dated June 1, 2006 (the Agreement) with the City of College Park
(the Issuer) obligates the Purchaser to make installment payments to the Issuer to cover the principal,
premium and interest of the Series 2006A/B Bonds. The City has adopted an Ordinance imposing a customer
facility charge (CFC) effective October 1, 2005. The CFC revenues have been pledged to secure the
payments due under the Agreement. At June 30, 2014 and 2013, the balance of outstanding conduit debt
totaled $192.1 million and $198.7 million, respectively.
On April 10, 2014, the City of Atlanta issued approximately $523.6 million of its Airport Passenger Facility
Charge and Subordinate Lien General Revenue Refunding Bonds, Series 2014A (Non-AMT), $141.0 million
of its Airport General Revenue Refunding Bonds, Series 2014B (Non-AMT), and $181.9 million of its
General Airport Revenue Refunding Bonds, Series 2014C (AMT), collectively referred to as the “Series
2014 Bonds”. The Series 2014 Bonds were issued to refund and redeem all of the outstanding principal
amount of the City’s Airport Passenger Facility Charge and Subordinate Lien General Revenue Bonds, Series
2004C and 2004J, the City’s Airport General Revenue Refunding Bonds, Series 2003RF-D, the City’s
Airport General Revenue Bonds, Series 2004A, Series 2004B, and a portion of the Series 2004F, and Series
2004G (the Refunded Bonds), to fund a deposit to the respective subaccounts in the Debt Service Reserve

CITY OF ATLANTA, GEORGIA
DEPARTMENT OF AVIATION
Notes to Financial Statements
June 30, 2014 and 2013
30 (Continued)
Account securing the Outstanding PFC Revenue Bonds and the Outstanding Senior Lien General Revenue
Bonds, and to pay the costs of issuance with respect to the Refunded Bonds. The refunding of the Series
2014 Bonds resulted in a net present value savings of $73.6 million and a reduction in annual debt service
of $3.2 million.
The annual debt service requirements at June 30, 2014 are as follows (in thousands):
Total debtPrincipal Interest service
Year:2015 $ 105,115 136,294 241,409 2016 116,085 143,013 259,098 2017 121,480 137,403 258,883 2018 127,675 131,377 259,052 2019 134,710 124,996 259,706 2020 – 2024 662,390 522,835 1,185,225 2025 – 2029 797,880 343,557 1,141,437 2030 – 2034 587,990 142,749 730,739 2035 – 2039 170,460 51,266 221,726 2040 – 2042 99,540 9,517 109,057
Total $ 2,923,325 1,743,007 4,666,332
All of the bond ordinances require the maintenance of sinking funds to provide for debt service on the related
bonds. The Airport Master Bond Ordinance also requires the Department to maintain a ratio of Net Airport
Revenue to Aggregate Debt Service, as defined, of at least 120%. As of June 30, 2014 and 2013, the
Department was in compliance with all significant limitations and restrictions contained in the various
revenue bond indentures.
(7) Leased Facilities
The Department leases terminal space, aircraft maintenance and overhaul facilities, cargo facilities, hangars,
and other structures to air carriers and other tenants at the Airport under various operating leases, a majority
of which terminate no later than 2017. The total cost of the facilities described above that are substantially
leased to various tenants is $5.2 billion with a carrying value of $3.5 billion. Depreciation expense for fiscal
year 2014 and 2013 on the facilities was $152.6 million and $145.0 million, respectively.
Certain of the leases provide for fixed and variable rental payments, and all are generally designed to allow
the Department to meet its debt service requirements and recover certain operating and maintenance costs.
Rental receipts related to the terminal are based on the cost of the facilities. In addition, certain of the
agreements under which the Department receives revenue from the operation of concessions at the Airport,
provide for the payment of a fee based on the greater of an aggregated percentage of gross receipts or a
guaranteed minimum.

CITY OF ATLANTA, GEORGIA
DEPARTMENT OF AVIATION
Notes to Financial Statements
June 30, 2014 and 2013
31 (Continued)
The agreement covering the operation of the parking facilities does not provide for a minimum fee and is
therefore not included in the following table. Revenue from this source, which is solely a function of parking
receipts as defined were $118.5 million and $117.4 million for the years ended June 30, 2014 and 2013,
respectively.
At June 30, 2014, minimum future rentals and fees to be received under noncancelable leases or concession
agreements for each fiscal year are as follows (in thousands):
2015 $ 320,168 2016 326,079 2017 253,937 2018 231,945 2019 170,011 2020 – 23 409,283
Total$ 1,711,423
The City and most of the airlines serving the airport have entered into operating lease agreements that extend
to 2017 relating to the use of the airfield. All of the Central Passenger Terminal Complex leases related to
the airlines expire in 2017. The City expects to negotiate renewals of these operating lease agreements with
the airlines.
(8) Pension and Other Employee Benefits Plans
Pension Plans
The City maintains the following separately administered pension plans:
Plan type Plan name
Agent, multiple-employer, defined benefit The General Employees’ Pension PlanSingle employer, defined benefit Firefighters’ Pension PlanSingle employer, defined benefit Police Officers’ Pension PlanSingle employer, defined contribution General Employees’ Defined Contribution Plan
The funding methods and determination of benefits payable were established by the legislative acts creating
such plans, as amended, and in general, provide that the pension funds are to be accumulated from employee
contributions, City contributions, and income from the investment of accumulated funds.
The plans are administered by separate boards of trustees that include an appointee of the Mayor, the City’s
Chief Financial Officer, a member of City Council, and members elected from active and retired employees
of the respective plans.
Prior to July 1, 2001, all permanent employees of the City, excluding sworn personnel of the Police and Fire
Departments and including employees of the Atlanta Independent School System (the School System) who
were not covered under the Teachers Retirement System of Georgia, were eligible to participate in the
CITY OF ATLANTA, GEORGIA
DEPARTMENT OF AVIATION
Notes to Financial Statements
June 30, 2014 and 2013
32 (Continued)
General Employees’ Pension Plan. Certain School System employees, employed prior to July 1, 1979, also
participate in the City’s General Employees’ Pension Plan (the Plan).
Effective July 1, 2001, all new, permanent employees of the City, excluding sworn personnel of the Police
and Fire Departments, are only eligible to participate in the Defined Contribution Plan. During 2002 persons
employed prior to July 1, 2001 were given the option of transferring to the Defined Contribution Plan. As of
December 31, 2002, employees previously participating in the General Employees’ Defined Benefit Plan do
not have the option of transferring to the new Defined Contribution Plan. Sworn personnel of the Police and
Fire Departments are eligible to participate in the Police Officers’ and Firefighters’ plans, respectively.
Effective September 1, 2005, classified employees and certain nonclassified employees pay grade 18, or its
equivalent, and below enrolled in the Defined Contribution Plan had a one-time option of transferring to the
General Employee’s Pension Plan. Classified employees and certain nonclassified employees pay grade 18,
or its equivalent, and below not covered by either the Police Officers or Firefighters’ Pension Plans, and
hired after September 1, 2005, are required to become members of the General Employee’s Pension Plan.
Complete financial statements for all Plans, except the General Employees’ Defined Contribution Plan, can
be obtained at the following address:
City of Atlanta
68 Mitchell Street, S.W.
Suite 1600
Atlanta, Georgia 30335
Separate financial statements have not been prepared for the General Employees’ Defined Contribution Plan.
(a) Defined Benefit Plans
In June 2011, the City Council approved changes to the City’s three separate defined benefit plans,
effective on September 1, 2011 for new hires and November 1, 2011 for existing employees. Currently
sworn personnel employed by the Atlanta Police Department are required to contribute to the Police
Officers’ Pension Fund. Sworn personnel employed by the Atlanta Fire Rescue Department are
required to contribute to the Firefighters’ Pension Fund. All nonsworn employees hired prior to July 1,
2001 regardless of payroll grade, and all nonsworn employees hired after July 1, 2001 below payroll
grade 19, or its equivalent, are required to contribute to the General Employees’ Pension Fund.
Beginning on November 1, 2011, all current employees participating in any one of the three defined
benefit plans and hired before September 1, 2011, or after January 1, 1984, will have an increase of
5% in their mandatory contributions into the funds in which they participate. The contribution will be
such that the new contribution will be 12% of salary (without a designated beneficiary) or 13% of
salary (with a designated beneficiary).
Employees hired on or after September 1, 2011 who are either sworn members of the police department
or the fire department, or who are below payroll grade 19, or its equivalent, will be required to
participate in a hybrid defined benefit plan with a mandatory defined contribution component (see
discussion below regarding Amendments to the Defined Contribution Plan). The defined benefit

CITY OF ATLANTA, GEORGIA
DEPARTMENT OF AVIATION
Notes to Financial Statements
June 30, 2014 and 2013
33 (Continued)
portion of this plan will include a 1% multiplier, the employee contribution will be 8% of salary with
or without beneficiary, and the retirement age will increase to age 57 for participants in the Police
Officers’ and Firefighters’ Pension Funds and to age 62 for participants in the General Employees’
Pension Fund. Early Retirement Age is changed from any age (as long as vested) with penalty to age
52 for hires after September 1, 2011. Upon retirement, these participants will receive an annually
calculated cost of living increase to their pension benefit that may not exceed 1% and is based upon
the Consumer Price Index. Sick and vacation leave are no longer applied to retirement benefit for hires
after September 1, 2011.
Beginning in fiscal year 2012 there is a cap on the maximum amount of the City’s contribution to the
three defined benefit pension funds measured as a percentage of payroll. The City’s annual
contribution to the funds may not exceed 35% of payroll of the participants in the three funds in
aggregate. In the event that this 35% cap is reached, the City will fund any overage for the first 12
month period from its reserves. During that period, the City’s management must agree on an alternative
method to reduce the overage. If no alternative is reached, beginning in the second 12 month period,
the City and the participants will equally split the cost of the overage, subject only to a provision that
employee contributions may not increase more than 5%.
Beginning with the 2012 valuation the amortization period for the Unfunded Accrued Actuarial
Liability (UAAL) is changed from the 30-year open period to a closed amortization period designed
to eliminate the UAAL by July 1, 2042.
The City’s practice is to have actuarial valuations of its defined benefit pension plans performed
annually by an enrolled actuary. The membership as of the latest actuarial valuations reports, in the
three defined benefit plans and related current period payrolls are as follows:
General Policeemployees Firefighters officers
Retirees and beneficiariescurrently receivingbenefits and terminatedemployees entitled tobenefits but not yetreceiving them 3,875 1,003 1,435
Currently active employees 2,989 1,045 2,021
Total membership 6,864 2,048 3,456
The latest valuation reports for purposes of current year funding are as of July 1, 2013.
Funding Policy
The City’s funding policy for its defined benefit plans is to contribute a percentage of each plan’s
covered employee payroll as developed in the actuarial valuation for the individual plan. Active

CITY OF ATLANTA, GEORGIA
DEPARTMENT OF AVIATION
Notes to Financial Statements
June 30, 2014 and 2013
34 (Continued)
participants are required to contribute 12% of base pay (or 13% if participant has a covered
beneficiary). The City’s contribution percentage is the actuarially determined amount necessary to
fund plan benefits after consideration of employee contributions.
The actuarially determined annual required contribution amount is the sum of the annual normal cost
(determined under the entry age normal actuarial cost method) and the amortization of the unfunded
actuarial accrued liability as a level percentage of future payrolls. The amortization period for the
unfunded pension liability (UAAL) is a closed 30 year period. The significant actuarial assumptions
used to compute the contribution requirements are the same as those used to compute the actuarial
accrued liability.
The required contribution percentages, developed in the most recent actuarial valuations for the plans,
to cover pension liabilities and the actual 2014 contribution amounts are (in thousands):
General Policeemployees Firefighters officers
Service Cost 5.89% 27.94% 24.29%
Amortization of the unfundedactuarial accrued liability 39.65% 25.83% 19.19%
Total requiredcontributions as apercentage ofcovered payroll 45.54% 53.77% 43.48%
2014 actual employee contributions:Dollar amount (in thousands) $ 17,366 5,682 11,230 Percent of covered payroll 11.95% 12.66% 12.17%
2014 actual City contributions:Dollar amount (in thousands) $ 42,145 20,656 30,197 Percent of covered payroll 28.92% 46.02% 32.74%
With respect to the General Employees’ Pension Plan, which is a multiple-employer plan, the City’s
actuarially determined contribution required above represents only the City’s portion.
The actual City contributions shown above include amounts used to fund retiree supplemental cost of
living increases and other minimum benefits. These amounts are components of the City’s
contributions for purposes of meeting its actuarially determined funding requirements.

CITY OF ATLANTA, GEORGIA
DEPARTMENT OF AVIATION
Notes to Financial Statements
June 30, 2014 and 2013
35 (Continued)
Annual Pension Cost
The City’s annual pension cost for the year ended June 30, 2014 was as follows for the respective
plans (in thousands):
General employees $ 42,145 Firefighters 20,656 Police officers 30,197
These amounts equaled the required and actual contributions for each of the respective plans.
The City’s annual pension cost and net pension obligation for the current year ended June 30, 2014
and each of the five preceding years were as follows (dollars in thousands):
Annual Percentage ofpension ARC Net pension
Plan/period cost (APC) contributed obligation
General employees:Year ended June 30, 2009 $ 69,991 100.0 % — Year ended June 30, 2010 51,762 100.0 — Year ended June 30, 2011 46,068 100.0 — Year ended June 30, 2012 35,237 100.0 — Year ended June 30, 2013 38,694 100.0 — Year ended June 30, 2014 42,145 100.0 —
Firefighters:Year ended June 30, 2009 28,752 100.0 — Year ended June 30, 2010 25,865 100.0 — Year ended June 30, 2011 24,912 100.0 — Year ended June 30, 2012 21,092 100.0 — Year ended June 30, 2013 17,491 100.0 — Year ended June 30, 2014 20,656 100.0 —
Police officers:Year ended June 30, 2009 44,810 100.0 — Year ended June 30, 2010 41,712 100.0 — Year ended June 30, 2011 39,135 100.0 — Year ended June 30, 2012 33,748 100.0 — Year ended June 30, 2013 26,525 100.0 — Year ended June 30, 2014 30,197 100.0 —
The actuarial cost method used for funding purposes and to calculate the actuarial accrued liability is
the Entry Age Normal Cost Method. This method is one of the approved methods for such plans in
Georgia, and provides for contributions estimated to be a level percentage of future payrolls. The
unfunded actuarial accrued liability for funding purposes, effective with the July 1, 2012 actuarial
report, is to be amortized over a closed period of 30 years.

CITY OF ATLANTA, GEORGIA
DEPARTMENT OF AVIATION
Notes to Financial Statements
June 30, 2014 and 2013
36 (Continued)
Other actuarial assumptions used to perform the most recent calculation (July 1, 2013 calculations for
funding purposes) are as follows:
General Policeemployees Firefighters officers
Rate of return on investments 7.50% 7.50% 7.50%Projected salary increases for:
Inflation 3.50 4.00 4.00Post-retirement benefit increases 3.00 3.00 3.00
The following schedule (derived from the most recent actuarial valuation reports) reflects accounting
policies and funding provisions for the City’s three plans as of June 30, 2014:
General Policeemployees Firefighters officers
Basis of accounting Accrual Accrual AccrualAsset valuation method Market value Market value Market value
Funded Status and Funding Progress
The following table is a summary by plan of Funding Status and Funding Progress (dollars in
thousands):
General Policeemployees Firefighters officers
Plan/valuation date July 1, 2013 July 1, 2013 July 1, 2013Actuarial value of assets $ 954,965 561,450 828,815 Actuarial accrued liability (AAL) 1,863,532 785,195 1,170,414 Percentage funded 51.24% 71.50% 70.81%Unfunded actuarial accrued liabilities $ 908,567 223,745 341,599 Covered payroll 133,069 44,886 92,245 Unfunded AAL as a percentage of
covered payroll 682.78% 498.47% 370.32%
The schedule of funding progress, presented as RSI following the notes to the financial statements,
presents multi-year trend information for all plans about whether the actuarial value of plan assets is
increasing or decreasing over time relative to the actuarial accrued liability for benefits.
The City accounts for and funds the costs of the defined benefit plans as they accrue. Such costs are
based on contribution rates determined by annual actuarial valuations. The total contributions by the

CITY OF ATLANTA, GEORGIA
DEPARTMENT OF AVIATION
Notes to Financial Statements
June 30, 2014 and 2013
37 (Continued)
Department were $12.2 million and $10.7 million for the years ended June 30, 2014 and 2013,
respectively.
(b) Defined Contribution Plan
The City’s General Employees’ Defined Contribution Plan provides funds at retirement for employees
of the City and in the event of death, provides funds for their beneficiaries, through an arrangement by
which contributions are made to the Plan by employees and the City. The current contribution of the
City is 6% of employee payroll.
Employees also make a mandatory pretax contribution of 6% plus have the option to contribute
amounts up to the amount legally limited for retirement contributions. All modifications to the Plan,
including contribution requirements, must receive the recommendations and advice from the offices
of the Chief Financial Officer and the City Attorney, respectively. Each pension law modification must
be adopted by at least two-thirds vote of the City Council and approved by the Mayor.
All new employees, hired after July 1, 2001, who previously would have been enrolled in the General
Employees’ Defined Benefit Plan, were enrolled in the General Employees’ Defined Contribution
Plan.
During 2002, persons employed prior to July 1, 2001 were given the option to transfer to the General
Employees’ Defined Contribution Plan.
Effective September 1, 2005, classified employees and certain nonclassified employees pay grade 18,
or its equivalent, and below then enrolled in the General Employees’ Defined Contribution Plan had
the one-time option of transferring to the General Employee’s Pension Plan. Classified employees and
certain nonclassified employees pay grade 18 and below, not covered by either the Police Officers or
Firefighters’ Pension Plans, hired after September 1, 2005 are required to become members of the
General Employee’s Pension Plan.
Amendments to Defined Contribution Plan
Employees hired on or after September 1, 2011 who are either sworn members of the police department
or the fire department, or who are below payroll grade 19, or its equivalent, are required to participate
in the mandatory defined contribution component that will include a mandatory employee contribution
of 3.75% of salary and be matched 100% by the City. Additionally, these employees may voluntarily
contribute up to an additional 4.25% of salary which will also be matched 100% by the City.
Employees vest in the amount of the City’s contributions at a rate of 20% per year and become fully
vested in the City’s contribution after five years of participation.
As of June 30, 2014 there were 1,267 participants in the General Employees’ Defined Contribution
Plan. The covered payroll for employees in the Plan was $85.0 million. Employer contributions for
the year ended June 30, 2014 were $7.4 million and employee contributions were $7.2 million or
17.2% of covered payroll.
As of June 30, 2013 there were 1,207 participants in the General Employees’ Defined Contribution
Plan. The covered payroll for employees in the Plan was $79.2 million. Employer contributions for

CITY OF ATLANTA, GEORGIA
DEPARTMENT OF AVIATION
Notes to Financial Statements
June 30, 2014 and 2013
38 (Continued)
the year ended June 30, 2013 were $6.2 million and employee contributions were $6.0 million or
15.4% of covered payroll.
The General Employees’ Defined Contribution Plan uses the accrual basis of accounting. Investments
are reported at fair value, based on quoted market prices and there were no nongovernmental individual
investments exceeding 5% of the net position of the Plan.
(c) Postretirement Benefits
Plan Description
The City of Atlanta Retiree Healthcare Plan (Plan) is a single-employer defined benefit healthcare plan
which provides Other Postemployment Benefits (OPEB) to eligible retirees, dependents and their
beneficiaries. The Plan was established by legislative acts and functions in accordance with existing
City laws. OPEB of the City includes health, dental, and vision care and life insurance. Separate
financial statements are not prepared for the Plan.
Funding Policy
The City is not required by law or contractual agreement to provide funding for OPEB other than the
pay-as-you-go amounts necessary to provide current benefits to retirees, eligible dependents and
beneficiaries. For the fiscal year ended June 30, 2014, the City made $44.6 million “pay-as-you-go”
payments on behalf of the Plan. Retiree contributions vary based on the plan elected, dependent
coverage and Medicare eligibility. Eligible retirees receiving benefits contributed $47.7 million
through their required contributions.
For the fiscal years ended June 30, 2014 and 2013, the Department made $5.4 million and $5.0 million
“pay-as-you-go” payments, respectively, on behalf of the Plan.
Annual OPEB Cost and Net OPEB Obligation – The City’s annual OPEB cost (expense) is calculated
based on the annual required contribution of the employer (ARC), an amount actuarially determined
using the Projected Unit Credit Actuarial Cost Method. The ARC represents a level of funding that, if
paid on an ongoing basis, is projected to cover normal cost each year and amortize any unfunded
actuarial liabilities over a period not to exceed 30 years.

CITY OF ATLANTA, GEORGIA
DEPARTMENT OF AVIATION
Notes to Financial Statements
June 30, 2014 and 2013
39 (Continued)
The following table shows the elements of the Department’s portion of the City’s OPEB cost for the
year, the amount actually contributed on behalf of the Plan, and changes in the Department’s portion
of the City’s net OPEB obligation to the Plan for the year ended June 30, 2014 and 2013 (in thousands):
2014 2013
Annual required contributions $ 13,231 12,606 Interest on net OPEB obligation 1,652 1,332 Adjustment to annual required contribution (1,721) (1,332)
Annual OPEB Cost 13,162 12,606
“Pay-as-you-go” payments made (5,423) (4,963)
Increase in net OPEB obligation 7,739 7,643
Net OPEB obligation – Beginning of the year 44,561 36,918
Net OPEB obligation – End of the year $ 52,300 44,561
The Department’s portion of the City’s annual OPEB cost, the percentage of annual OPEB cost
contributed to the Plan, and the Department’s portion of the City’s net OPEB obligation for the fiscal
years ended June 30, 2012 through June 30, 2014 are as follows (in thousands):
Percentage ofAnnual OPEB annual OPEB Net OPEB
cost cost paid obligation
Fiscal year ended:June 30, 2012 $ 11,716 54.8% $ 36,918June 30, 2013 12,606 39.4 44,561June 30, 2014 13,162 41.2 52,300
Funded Status and Funding Progress
As of June 30, 2012, the most recent actuarial valuation date, the Plan was not funded, except
“pay-as-you-go” payments. The unfunded actuarial accrued liability (UAAL) for benefits was
$1.48 billion. The covered payroll was $321 million, and the ratio of the UAAL to the covered payroll
was 461.9%.
Actuarial valuations of an ongoing plan involve estimates of the value of reported amounts and
assumptions about the probability of occurrence of events far into the future. The determined actuarial
valuations of OPEB provided under the Plan incorporated the use of various assumptions including
demographic and salary increases among others. Amounts determined regarding the funded status of
the Plan and the annual required contributions of the City are subject to continual revisions as actual
results are compared with past expectations and new estimates are made about the future. The schedule
of funding progress, shown as required supplementary information following the notes to the financial
statements, presents the results of the OPEB valuation as of June 30, 2012, the schedule will eventually
provide additional multi-year trend information about whether the actuarial values of Plan assets are

CITY OF ATLANTA, GEORGIA
DEPARTMENT OF AVIATION
Notes to Financial Statements
June 30, 2014 and 2013
40 (Continued)
increasing or decreasing over time relative to the actuarial accrued liabilities for benefits. Under the
provisions of GASB 45, the City elected to use the June 30, 2012 actuarial report as the basis for
determining the current year ARC requirement.
Actuarial Methods and Assumptions
Projections of benefits for financial reporting purposes are based on the substantive plan (the plan as
understood by the employer and plan members) and include the types of benefits provided at the time
of each valuation and the historical pattern of the sharing of benefit costs between the employer and
plan members to that point. The actuarial methods and assumptions used include techniques that are
designed to reduce short-term volatility in actuarial accrued liabilities and the actuarial value of assets,
consistent with the long-term perspective of the calculations.
In the June 30, 2012 actuarial valuation, the Individual Entry Age Normal actuarial cost method was
used. It is amortized as a level percent of payroll over a 27 year period and a closed amortization
method. The actuarial assumptions included 4.0% investment rate of return (net of administrative
expenses) and an annual medical cost trend rate of 8% initially, reduced by decrements to an ultimate
trend rate of 5% after 10 years. Both rates include a 3% inflation assumption. Currently there are no
assets set aside that are legally held exclusively for OPEB.
(d) Deferred Compensation Plan
The City has adopted a deferred compensation plan in accordance with the 1997 revision of
Section 457 of the Internal Revenue Code. The plan, available to all Department employees, allows an
employee to voluntarily defer up to 25% of his/her gross compensation, not to exceed certain limits
per year. Each participant selects one of three insurance providers to administer the investments of the
deferred funds. All administrative costs of the plan are deducted from the participants’ accounts. The
plan assets are held in custodial accounts for the exclusive benefit of the plan participants and their
beneficiaries, and are therefore, not included in the City’s nor the Department’s financial statements.
(9) Risk Management
(a) General
The City purchases a variety of insurance policies, including but not limited to all risks property and
specific liability policies. The City also purchases distinct and separate insurance policies for the
Airport, including but not limited to property, airport owners and operators liability, and environmental
liability. The policy limits are established in order to maximize potential recovery via insurance in the
event of loss. Policy limits may range up to $1 billion based on exposure to loss, and policies are
subject to a range of deductibles.
The City also administers an Owner Controlled Insurance Program (OCIP) that provides insurance
coverage for enrolled contractors for certain construction projects at the Airport. These policies include
but are not limited to builders risk, general liability, workers’ compensation, and pollution liability.
Insurance requirements are established with contractors and consultants that do business with the City
based on the scope of services and nature of the project(s). Contractors and consultants are generally

CITY OF ATLANTA, GEORGIA
DEPARTMENT OF AVIATION
Notes to Financial Statements
June 30, 2014 and 2013
41 (Continued)
required to maintain certain types of insurance coverage including but not limited to general liability,
automobile liability, workers’ compensation, and professional liability.
There has not been any material change to insurance coverage from the previous two years.
The City is self-insured for workers’ compensation, parts of the medical and dental plan, and general
claims liabilities. The City pays for such claims as they become due. These claims liabilities are
accounted for in the general fund and the applicable enterprise funds. Claims generated by
governmental funds expected to be paid subsequent to one year are recorded only in the City’s
government-wide financial statements.
(b) Property Insurance Claim
On March 18, 2013, the Department sustained hail damage to several buildings and other
structures. Negotiations are currently ongoing with the insurance parties involved. Based upon initial
estimates, repair costs are expected to range between $30 million and $50 million. The Department
has a deductible of $250 thousand for this incident. As of June 30, 2014, repair costs of $6.3 million
have been incurred by the Department related to this incident.
(c) Workers’ Compensation
The City’s workers’ compensation liability is calculated by an outside actuary. Liabilities are reported
when it is probable a loss has occurred and the amount can be reasonably estimated including amounts
for claims incurred but not yet reported. The calculation of the present value of future workers’
compensation liabilities, as calculated by the outside actuary, is based on a discount rate of 3.5% for
both 2014 and 2013.
Prior to March 1, 2011, the City had no specific excess or annual aggregate coverage for its self-insured
workers compensation claims. Effective March 1, 2011, the City purchased an annual excess insurance
policy with a $5 million per occurrence retention with no annual aggregate coverage.
(d) Health and Dental Insurance
The City’s medical plan under Blue Cross Blue Shield Point of Service and its dental plan under Cigna
are fully self-insured. The Kaiser HMO, OHS dental access plan, and Spectra vision plan are fully
insured. The City’s health and dental liability is calculated by an outside actuary firm. Liabilities are
reported when it is probable that a loss has occurred and the amount of the loss can be reasonably
estimated. Liabilities include an amount for claims that have been incurred but not reported.

CITY OF ATLANTA, GEORGIA
DEPARTMENT OF AVIATION
Notes to Financial Statements
June 30, 2014 and 2013
42 (Continued)
Changes in the balances of the liabilities for worker’s compensation and general claims attributable to
the Department during 2014, 2013, and 2012 were as follows (in thousands):
Current yearclaims and
Beginning of changes in Claimyear estimates payments End of year
Workers’ compensation:2014 $ 373 578 (314) 637 2013 810 (243) (194) 373 2012 1,709 (417) (482) 810
Claims liability:2014 $ 1,893 7 — 1,900 2013 1,893 — — 1,893 2012 1,893 — — 1,893
The City participates in the State Subsequent Injury Trust Fund, a public entity managed by the State
of Georgia. The pool is designed to provide insurance coverage for employees who are hired with
previous medical conditions. Historically, premiums have not been significant.
(10) Commitments and Contingencies
(a) Commitments
The Department has several significant construction projects budgeted. As of June 30, 2014 and 2013,
the Department was contractually obligated to expenditures of approximately $412.1 million and
$297.7 million, respectively, related to these projects.
(b) Grants from Other Governmental Units
Federal governmental grants represent an important source of supplementary funding, primarily for
the Airport’s noise abatement program. Amounts received or receivable from grantor agencies are
subject to audit and adjustment by such agencies, principally the federal government. Any disallowed
claims, including amounts already collected, may constitute a liability of the Department. The amount,
if any, of expenditures that may be disallowed by the grantor cannot be determined at this time
although the Department expects such amounts, if any, to be immaterial.

CITY OF ATLANTA, GEORGIA
DEPARTMENT OF AVIATION
Notes to Financial Statements
June 30, 2014 and 2013
43
(c) Litigation
The Department is subject to various lawsuits and proceedings arising in the ordinary conduct of its
affairs and has been named as defendant in several lawsuits claiming personal and property damages.
The City has also been named as a defendant in various lawsuits concerning alleged noise disturbance
at the Airport. The City is working with most of the property owners to settle these claims through its
noise abatement program, which consists of insulating homes and purchasing aviation easements. The
nature of the Department’s operations and the matters currently being alleged are such that similar
suits may be filed in the future. In the opinion of the City Attorney, the outcome of these matters will
not have a material adverse affect the Department’s financial position.
(d) Environmental Obligation
In an Assignment, Assumption and Release Agreement and Claim Resolution Agreement dated
February 25, 2011, the City entered into settlement agreements with Northwest and the Georgia
Environmental Protection Division (EPD) to settle all claims in exchange for transfer and assumption
of environmental obligations at the Leased Space formerly between Northwest and the Georgia EPD.
As of June 30, 2014 and 2013, a restricted noncurrent asset is recorded for approximately $5.0 million
as a result of this settlement.
(11) Subsequent Events
The Department has evaluated subsequent events from the statement of net position date through November
21, 2014, the date at which the financial statements are available to be issued, and determined that there were
no additional matters requiring disclosure.

(THIS PAGE LEFT BLANK INTENTIONALLY)

REQUIRED SUPPLEMENTARY INFORMATION

(THIS PAGE LEFT BLANK INTENTIONALLY)

44
CITY OF ATLANTA, GEORGIADEPARTMENT OF AVIATION
Required Supplementary Information (Unaudited)
Schedule of Funding Progress for Pension Plans
(Dollars in thousands)
Current UnfundedActuarial Unfunded year AAL as a
Actuarial accrued actuarial annual percentage ofvalue of liability Percentage accrued covered covered
Plan/valuation date assets (AAL) funded liabilities payroll payroll
General employees:7/1/2007 $ 749,352 1,436,278 52.2% $ 686,926 155,185 442.6%7/1/2008 829,734 1,483,733 55.9 653,999 179,982 363.47/1/2009 881,009 1,481,563 59.5 600,554 150,312 399.57/1/2010 866,906 1,614,267 53.7 747,361 142,597 524.17/1/2011 868,799 1,697,083 51.2 828,284 135,636 610.77/1/2012 917,486 1,798,404 51.0 880,918 139,393 632.07/1/2013 954,965 1,863,532 51.2 908,567 133,069 682.8
Firefighters:1/1/2008 $ 340,075 652,816 52.1% $ 312,741 45,561 686.4%1/1/2009 408,090 708,347 57.6 300,257 43,275 693.81/1/2010 422,791 699,175 60.5 276,384 43,910 629.41/1/2011 481,640 732,357 65.8 250,717 42,963 583.67/1/2011 509,590 730,535 69.8 220,945 39,482 559.67/1/2012 505,692 727,803 69.5 222,111 42,797 519.07/1/2013 561,450 785,195 71.5 223,745 44,886 498.5
Police officers:1/1/2008 $ 596,457 909,410 65.6% $ 312,953 84,016 372.5%1/1/2009 571,768 986,376 58.0 414,608 82,030 505.41/1/2010 591,981 990,600 59.8 398,619 78,520 507.71/1/2011 697,668 1,056,240 66.1 358,572 83,551 429.27/1/2011 735,470 1,036,001 71.0 300,531 73,688 407.87/1/2012 733,546 1,059,362 69.2 325,816 88,297 369.07/1/2013 828,815 1,170,414 70.8 341,599 92,245 370.3
Schedule of Funding Progress for OPEB
(Dollars in thousands)UnfundedAAL as a
Actuarial AAL percentage ofActuarial value of projected Unfunded Funded Covered covered
valuation date assets unit credit AAL (UAAL) ratio payroll payroll6/30/2008 $ — 1,085,315 1,085,315 — 278,039 390.3%7/01/2010 — 1,408,268 1,408,268 — 312,984 449.97/01/2012 — 1,482,842 1,482,842 — 321,056 461.9
See accompanying independent auditors’ report.

(THIS PAGE LEFT BLANK INTENTIONALLY)

STATISTICAL SECTIONUnlike the financial statements, this section usually covers
more than one fiscal year and may present non-accounting
data. This information is presented in five categories:
Financial Trends (Exhibits 1 and 2) – intended to help users
understand and assess how the Airport’s financial position has
changed over time.
Revenue Capacity (Exhibits 3) – intended to help users
understand and assess the factors that affect the Airport’s
ability to generate its own source revenues.
Debt Capacity (Exhibits 4 and 5) – intended to help users
understand and assess the Airport’s debt burden and its
ability to cover and issue additional debt.
Demographic and Economic (Exhibits 6 and 7) – intended to
help users understand the socio-economic environment in
which the Airport operates and to provide financial statement
information over time and among similar entities.
Operating Information (Exhibits 8 through 13) – intended to
provide contextual information about the Airport’s operations
and resources to help readers use financial statement
information to understand and assess the Airport’s
economic condition.

FINANCIAL TRENDS

45
Exhibit 1CITY OF ATLANTA, GEORGIADEPARTMENT OF AVIATION
Total Annual Revenues, Expenses, and Changes in Net Position
Fiscal years ended 2005-2014
(Accrual basis)
(In thousands)
2005 2006 2007 2008 2009 2010 2011 2012 2013 2014
Total revenues:Operating revenues:
Parking, car rental, and other concessions $ 157,114 80,801 202,527 206,139 203,027 199,453 222,796 229,585 246,593 254,047 Terminal, maintenance buildings, and other rentals 83,819 40,575 83,425 98,029 99,393 105,495 93,190 80,578 142,893 136,603 Landing fees 27,444 13,646 47,346 55,094 60,944 62,603 51,897 48,009 47,416 47,084 Other 21,101 12,199 19,208 26,944 26,171 33,248 43,330 35,960 53,484 58,518
Total operating revenues 289,478 147,221 352,506 386,206 389,535 400,799 411,213 394,132 490,386 496,252
Nonoperating revenues:Investment income (loss) 104,963 23,378 79,034 53,382 27,254 (38,382) 13,798 16,063 9,102 23,322 Passenger facility charges 164,833 85,438 163,275 167,520 166,911 165,022 172,673 177,899 180,077 180,382 Customer facility charges 5,366 12,101 22,887 23,892 23,136 21,316 19,265 22,943 24,290 23,437 Other — 9,997 — (2,015) (12,634) 125 2,382 (14,943) 2,243 (16,463)
Total nonoperating revenues 275,162 130,914 265,196 242,779 204,667 148,081 208,118 201,962 215,712 210,678
Capital contributions 84,599 30,668 42,526 52,692 80,043 19,266 49,379 37,522 33,500 10,888
Total revenues 649,239 308,803 660,228 681,677 674,245 568,146 668,710 633,616 739,598 717,818
Total expenses:Operating expenses:
Salaries and employees benefits 56,044 32,454 68,958 92,604 89,963 90,912 82,482 79,785 82,050 91,691 Repair, maintenance, and other
contractual services 29,404 15,781 41,256 57,646 63,812 82,461 85,945 98,258 101,742 112,676 General services 18,566 5,119 13,876 13,291 11,721 15,550 15,300 21,997 20,504 16,898 Utilities 4,741 1,951 4,542 6,108 8,438 8,420 9,627 8,151 8,768 8,990 Materials and supplies 2,543 1,477 4,161 3,280 5,042 4,164 2,888 4,090 4,353 4,720 Other 8,986 5,744 15,537 8,762 (413) 8,662 7,133 7,761 12,146 24,742 Depreciation 49,572 26,317 87,573 108,348 150,133 174,124 152,395 161,642 211,110 222,446
Total operating expenses 169,856 88,843 235,903 290,039 328,696 384,293 355,770 381,684 440,673 482,163
Operating income 119,622 58,378 116,603 96,167 60,839 16,506 55,443 12,448 49,713 14,089
Nonoperating expenses:Interest expense 61,275 38,977 100,638 83,223 81,559 64,572 84,010 112,314 146,718 139,826 Other — — 801 — — — — — — —
Total nonoperating expenses 61,275 38,977 101,439 83,223 81,559 64,572 84,010 112,314 146,718 139,826
Total expenses 231,131 127,820 337,342 373,262 410,255 448,865 439,780 493,998 587,391 621,989
Total expenses net of depreciationand amortization 181,559 101,503 249,769 264,914 260,122 274,741 287,385 332,356 376,281 399,543
Transfer (to)/from City — — — — (2,116) — 194 — (193) (6,781) Impairment losses — (8,500) (39,401) — (14,672) — — — — —
Increase in net position $ 418,108 172,483 283,485 308,415 247,202 119,281 229,124 139,618 152,014 89,048
Prior year change in net position $ — — 25,683 (63,795) — — — (34,251) — —
Net position:Net investment in capital assets $ 2,240,102 2,215,260 2,430,843 2,786,934 3,006,567 3,127,052 3,062,698 2,940,208 3,111,590 3,065,175 Restricted for capital projects and debt service 584,291 668,742 630,948 498,563 619,296 571,529 676,097 869,781 889,522 936,495 Unrestricted 216,950 329,824 461,203 482,117 388,953 435,516 624,426 658,599 619,490 707,980
Total net position $ 3,041,343 3,213,826 3,522,994 3,767,614 4,014,816 4,134,097 4,363,221 4,468,588 4,620,602 4,709,650
Sources: City of Atlanta, Department of Aviation
2006 represents a six-month period beginning January 1, 2006 and ending June 30, 2006.
2012 contains some adjustments due to adoption of GASB 65
See accompanying independent auditors’ report.

46
Exhibit 2CITY OF ATLANTA, GEORGIADEPARTMENT OF AVIATION
Changes in Cash and Cash Equivalents
Years ended 2005-2014
(In thousands)
2005 2006 2007 2008 2009 2010 2011 2012 2013 2014
Cash flows from operating activities:Cash received from customers and tenants $ 289,473 145,040 323,339 382,013 391,497 405,237 407,173 400,193 484,946 499,254 Cash paid to suppliers for goods and services (69,309) (30,700) (55,400) (89,728) (86,850) (118,161) (124,976) (134,631) (155,482) (168,740) Cash paid to employees for service (60,319) (32,575) (69,047) (76,546) (86,554) (82,894) (72,332) (74,917) (74,959) (83,714) Other receipts (payments), net (1,250) — — — — — — — — —
Net cash provided by operating activities 158,595 81,765 198,892 215,739 218,093 204,182 209,865 190,645 254,505 246,800
Cash flows from investing activities:Interest and dividends on investment 93,723 33,151 97,022 105,541 45,840 26,731 17,578 12,812 21,059 19,314 Swap termination — — — — — (58,470) — — — — Change in restricted investments 93,078 (100,488) 294,822 440,384 252,119 271,098 214,952 (138,175) (111,844) (34,351) Change in pooled investment fund (77,074) (16,618) (107,069) (47,286) 51,475 11,899 34,342 (184,052) (125,640) (85,101)
Net cash provided by (used in)investing activities 109,727 (83,955) 284,775 498,639 349,434 251,258 266,872 (309,415) (216,425) (100,138)
Cash flows from capital and related financing activities:Capital grants or capital contributions 97,953 31,845 42,430 41,841 91,470 17,151 48,400 29,379 40,076 8,482 Principal repayments of long-term debt (126,260) (45,684) (94,125) (470,575) (65,872) (108,263) (858,161) (867,292) (96,810) (982,615) Acquisition, construction, and improvement
of capital assets (496,294) (202,907) (470,266) (420,710) (579,490) (491,726) (474,498) (411,506) (309,231) (186,936) Passenger and customer facility charges 168,407 94,258 177,587 204,536 189,844 185,045 191,231 198,204 205,783 207,378 Contract retainage withheld 10,873 7,762 (17,797) (5,293) 16,862 4,254 1,033 (8,458) (29,140) (1,178) Proceeds from bond issuance, net 26,695 228,994 — 53,237 18,120 55,625 1,646,949 978,496 — 929,738 Interest paid on revenue bonds (118,357) (68,402) (151,221) (147,116) (155,296) (117,245) (105,431) (137,256) (148,412) (182,576)
Net cash provided by (used in) capital and relatedfinancing activities (436,983) 45,866 (513,392) (744,080) (484,362) (455,159) 449,523 (218,433) (337,734) (207,707)
Net increase (decrease) in cash andcash equivalents (168,661) 43,676 (29,725) (29,702) 83,165 281 926,260 (337,203) (299,654) (61,045)
Cash and cash equivalents:Beginning of year 206,021 37,360 81,036 51,311 21,609 104,774 105,055 1,426,604 1,089,401 789,747 End of year $ 37,360 81,036 51,311 21,609 104,774 105,055 1,031,315 1,089,401 789,747 728,702
Sources: City of Atlanta, Department of Aviation
2006 represents a six-month period beginning January 1, 2006 and ending June 30, 2006.
Note: The 2012 beginning cash balance has been adjusted to reflect the reclassification of certain investment balances as cash and cash equivalents.
Note: This schedule does not include the amount of equity in the cash management pool.
See accompanying independent auditors’ report.

REVENUE CAPACITY

(THIS PAGE LEFT BLANK INTENTIONALLY)

47
Exhibit 3CITY OF ATLANTA, GEORGIADEPARTMENT OF AVIATION
Principal Operating Revenues, Airlines Rates, and Charges and Cost per Enplaned Passenger
Years ended 2005-2014
(In thousands)
2005 2006 2007 2008 2009 2010 2011 2012 2013 2014
Landing fees:Signatory $ 27,088 13,495 46,957 54,744 60,655 62,190 51,652 47,712 47,145 46,745 Nonsignatory and other 356 151 389 350 289 413 245 297 271 339
Total landing fees 27,444 13,646 47,346 55,094 60,944 62,603 51,897 48,009 47,416 47,084
CPTC Rentals:Central Terminal Building and Apron 30,565 10,095 44,075 48,340 43,088 42,817 37,126 34,982 77,615 64,128 Central Terminal Tenant Finishes 30,119 17,772 43,087 51,228 57,868 60,997 57,903 52,564 75,739 81,610 Concession Credits — — (25,366) (28,340) (32,176) (30,461) (35,184) (44,861) (49,147) (49,728)
Total CPTC Rentals 60,684 27,867 61,796 71,228 68,780 73,353 59,845 42,685 104,207 96,010
CPTC cost recoveries: Operations charge 8,619 4,073 9,675 12,160 13,643 12,013 12,440 12,892 16,347 14,631 Automated Gateway Transit System 6,016 2,618 5,691 6,528 6,708 8,260 7,851 8,437 14,463 17,560 Insurance premium reimbursement 941 593 1,519 1,558 1,278 1,097 632 524 612 977 MHJIT O&M — — — — — — — 212 4,364 3,690
Total cost recoveries 15,576 7,284 16,885 20,246 21,629 21,370 20,923 22,065 35,786 36,858
Concession revenues:Terminal concessions 49,893 24,250 60,981 64,430 71,804 71,961 72,636 75,383 93,189 97,874 Communication services and other 4,435 530 2,785 2,837 2,563 3,675 2,954 7,688 2,357 3,375 Parking 70,663 41,217 105,808 105,653 98,016 95,577 114,354 114,129 117,425 118,462 Car rentals 31,134 14,230 31,976 32,165 29,758 26,665 31,202 30,764 31,765 32,380 Ground transportation 989 574 977 1,054 886 1,575 1,650 1,621 1,857 1,957
Total concessions revenues 157,114 80,801 202,527 206,139 203,027 199,453 222,796 229,585 246,593 254,048
Other revenues:Landside rentals 12,913 5,854 9,689 10,019 10,069 14,527 13,575 16,056 16,086 11,844 Airside rentals 10,221 6,854 11,940 16,782 20,544 17,615 19,770 21,837 22,599 28,748 Other income 5,526 4,915 2,323 6,698 4,542 5,722 11,419 4,693 8,563 9,794
Total other revenues 28,660 17,623 23,952 33,499 35,155 37,864 44,764 42,586 47,248 50,386
Non-Airline Cost Recoveries:SkyTrain and Rental Car Center — — — — — 4,098 3,996 4,364 4,410 6,582 Rental Car Center O&M — — — — — 2,058 6,992 4,838 4,726 5,284
Total Non-Airline Cost Recoveries — — — — — 6,156 10,988 9,202 9,136 11,866 Revenues $ 289,478 147,221 352,506 386,206 389,535 400,799 411,213 394,132 490,386 496,252
Airline rates and charges:Signatory landing fee rate (per 1,000 lbs.) $ 0.44305 0.47996 0.82173 0.91307 1.05050 1.09795 0.88231 0.82084 0.81206 0.82049 Enplaned passengers 43,020,532 21,079,673 43,292,611 45,287,174 44,808,982 45,375,298 46,191,667 47,147,315 47,526,243 47,318,755 Cost per enplaned passenger 2.40 2.31 2.90 3.18 3.33 3.41 2.84 2.34 3.70 3.36
Sources: City of Atlanta, Department of Aviation
2006 represents a six-month period beginning January 1, 2006 and ending June 30, 2006.
See accompanying independent auditors’ report.

(THIS PAGE LEFT BLANK INTENTIONALLY)

DEBT CAPACITY

(THIS PAGE LEFT BLANK INTENTIONALLY)

48
Exhibit 4CITY OF ATLANTA, GEORGIADEPARTMENT OF AVIATION
Net Revenues Available for General Aviation Revenue Bonds Debt Service
Years ended 2005-2014
(In thousands)
2005 2006 2007 2008 2009 2010 2011 2012 2013 2014
Revenues:Operating revenues – receipts from customers and tenants $ 289,473 145,040 323,339 382,013 391,497 405,237 407,173 400,193 484,946 499,254 Investment income 16,011 7,561 15,825 23,855 13,227 9,661 9,575 6,901 12,219 10,637
Total revenues 305,484 152,601 339,164 405,868 404,724 414,898 416,748 407,094 497,165 509,891
Operating expenses:Payments to suppliers for goods & services 69,309 30,700 55,400 89,728 86,850 118,161 124,976 134,631 155,482 168,740 Payments to or on behalf of employees 60,319 32,575 69,047 76,546 86,554 82,894 72,332 74,917 74,959 83,714 Other payments 1,250 — — — — — — — — — Additions from CIP reconciliations 17,850 11,078 8,993 — — — — — — —
Total operating expenses 148,728 74,353 133,440 166,274 173,404 201,055 197,308 209,548 230,441 252,454
Adjustment: Major Maintenance Expenditures - Planning & Development — — — — 7,409 16,780 27,509 22,740 19,245 28,178 Net revenues $ 156,756 78,248 205,724 239,594 238,729 230,623 246,949 220,286 285,969 285,615
General revenue bond debt service requirements $ 103,572 50,314 92,487 114,312 152,181 145,835 120,154 125,366 157,237 158,935 General revenue bond debt service paid from PFC revenues — — — — 23,100 19,000 24,800 8,300 — —
General revenue bond debt paid from net revenues $ 103,572 50,314 92,487 114,312 129,081 126,835 95,354 117,066 157,237 158,935
Debt service coverage on general revenue bond debt service paid from net revenues 1.51 1.56 2.22 2.10 1.85 1.82 2.59 1.88 1.82 1.80
Sources: City of Atlanta, Department of Aviation
2006 represents a six-month period beginning January 1, 2006 and ending June 30, 2006.
Adjustment for major maintence expenditures is effective starting in 2009 based on Material Events Notice filed during 2014.
See accompanying independent auditors’ report.

49
Exhibit 5CITY OF ATLANTA, GEORGIADEPARTMENT OF AVIATION
Ratios of Outstanding Debt
Fiscal years ended 2005-2014
(In thousands, except for per enplanement figures)
2005 2006 2007 2008 2009 2010 2011 2012 2013 2014
Total Debt Service (GARB only) $ 103,572 50,314 92,487 114,312 129,081 126,835 95,354 117,066 157,237 158,935
Total Operating Expenses net ofDepreciation & Amortization $ 103,949 53,926 155,862 181,691 178,563 210,169 203,375 220,042 229,563 259,717
Debt Service per Enplaned Passenger:Enplaned Passenger 43,021 21,080 43,293 45,287 44,809 45,375 46,192 47,147 47,526 47,319 Debt Service per Enplaned Passenger $ 2.41 2.39 2.14 2.52 2.88 2.80 2.06 2.48 3.31 3.36
Outstanding Debt per Enplaned Passenger:Outstanding Debt (GARB, PFC and CFC) $ 3,011,174 2,984,024 2,889,899 2,418,862 2,342,431 2,233,835 2,857,132 3,275,729 3,167,584 3,102,242 Enplaned Passengers 43,021 21,080 43,293 45,287 44,809 45,375 46,192 47,147 47,526 47,319 Outstanding Debt per Enplaned Passenger $ 69.99 70.78 66.75 53.41 52.28 49.23 61.85 69.48 66.65 65.56
Sources: City of Atlanta, Department of Aviation2006 represents a six-month period beginning January 1, 2006 and ending June 30, 2006.
See accompanying independent auditors’ report.

DEMOGRAPHIC AND ECONOMIC INFORMATION

(THIS PAGE LEFT BLANK INTENTIONALLY)

50
Exhibit 6CITY OF ATLANTA, GEORGIADEPARTMENT OF AVIATION
Demographic and Economic Statistics
Atlanta-Sandy Springs-Marietta, GA Metropolitan Statistical Area (1)
Personal Per capita Annual averageincome personal unemployment
Calendar year Population (4) (in thousands) (2) income (2) rate (3)2004 4,659,574 167,653,357 35,980 4.72005 4,770,870 179,726,762 37,672 5.32006 4,931,848 193,875,407 39,311 4.72007 5,066,356 204,549,504 40,374 4.62008 5,170,099 206,820,043 40,003 6.22009 5,240,828 198,609,824 37,897 9.72010 5,286,728 199,483,081 37,733 10.12011 5,374,678 214,362,959 39,884 9.82012 5,457,831 223,568,847 40,963 8.82013 5,522,943 231,840,894 41,978 7.9
Source:
1. The Atlanta metropolitan area or metro Atlanta, officially designated by the U.S. Census Bureau as the Atlanta-SandySprings-Marietta Metropolitan Statistical Area, spans 29 counties in north Georgia. [http://www.bea.gov/iTable]
2. 2004 thru 2012 data from U.S. Department of Commerce, Bureau of Economic Analysis last updated in May 2014. Note: 2013 is an estimate based on compound annual growth rate between 2002 through 2012. [http://www.bea.gov/regional/bearfacts/]
3. Unemployment Rate data from the U.S. Bureau of Labor Statistics (BLS) [http://www.bls.gov/]
4. Population figures for 2010 are decenial census counts; 2004-2009 and 2011-2013 are annual estimates by the U.S.Census Bureau. All population figures based on the new 29 county Atlanta MSA delineation. [http://www.census.gov/]
See accompanying independent auditors’ report.

51
Exhibit 7CITY OF ATLANTA, GEORGIADEPARTMENT OF AVIATION
Top Private Sector Employers
Atlanta-Sandy Springs-Marietta, GA Metropolitan Statistical Area
2014 (1) 2000 (2)Number of Percentage of Number of Percentage ofEmployees Total MSA Employees Total MSA
Employer Product/Service (in thousands) Rank Employment (in thousands) Rank Employment
Delta Air Lines Transportation 30,000 1 1.09% 31,606 1 1.15%Walmart Marketing and Manufacturing 26,000 2 0.94 14,700 3 0.53AT&T Services, Inc Telecommunication 18,339 3 0.67 12,000 4 0.44United Parcel Service Inc Transportation 10,849 4 0.39 8,500 6 0.31Wells Star Health System Inc Healthcare 9,717 5 0.35 N/A N/A N/APublix Super Markets Marketing and Manufacturing 9,656 6 0.35 N/A N/A N/AHome Depot Marketing and Manufacturing 9,000 7 0.33 9,889 5 0.36Piedmont Healthcare Healthcare 8,316 8 0.30 N/A N/A N/ASun Trust Bank Banking 7,126 9 0.26 6,835 10 0.25Cox Enterprises Media/Entertainment 7,065 10 0.26 5,820 12 0.21Lockheed Martin Aeronautics, Co. Marketing and Manufacturing 6,400 11 0.23 7,000 9 0.25Northside Hospital Healthcare 6,200 12 0.23 N/A N/A N/AChildren’s Healthcare of Atlanta Healthcare 5,629 13 0.20 N/A N/A N/AWells Fargo & Co. Banking 5,200 14 0.19 N/A N/A N/AGrady Health System Healthcare 4,098 15 0.15 N/A N/A N/ATurner Broadcasting Media/Entertainment N/A N/A N/A 5,493 13 0.20International Business Machine Corp Technology Services N/A N/A N/A 8,400 7 0.30Lucent Technologies Inc Technology Services N/A N/A N/A 7,200 8 0.26Bell South Corp Telecommunication N/A N/A N/A 23,560 2 0.85
163,595 5.94 141,003 5.11Other Employees 2,591,005 94.06 2,617,558 94.89
2,754,600 100.00% 2,758,561 100.00%
Source:
1. 2013 Largest Employers, Atlanta Business Journal, Book of Lists, 2013; pg 176
2. 2000 Largest Employers, City of Atlanta 2004 CDP: Economic Development Section, Table 6-16
See accompanying independent auditors’ report.

OPERATING INFORMATION

(THIS PAGE LEFT BLANK INTENTIONALLY)

52
Exhibit 8CITY OF ATLANTA, GEORGIADEPARTMENT OF AVIATION
Aircraft Operations and Enplanement Trends
Fiscal years ended 2005-2014
2005 2006 2007 2008 2009 2010 2011 2012 2013 2014Aircraft operations:
Domestic:Air carrier 644,792 289,366 640,566 680,325 671,757 656,791 658,152 670,585 665,578 649,355 Air taxi 275,504 150,377 268,761 237,631 222,623 237,899 205,655 184,940 177,234 160,437 General aviation 10,783 5,037 9,949 11,972 7,515 7,342 7,128 7,045 7,653 7,373 Military 1,889 1,006 917 1,058 1,080 1,141 520 394 295 230
Sub total 932,968 445,786 920,193 930,986 902,975 903,173 871,455 862,964 850,760 817,395 International:
Air carrier 47,418 27,617 67,592 68,142 63,480 60,633 65,649 68,590 67,997 70,619
Total 980,386 473,403 987,785 999,128 966,455 963,806 937,104 931,554 918,757 888,014 Passengers:
Domestic:On 39,661,560 19,066,987 39,022,194 40,747,762 40,344,232 40,953,747 41,442,852 42,277,924 42,565,430 42,077,139 Off 39,112,484 18,815,002 38,150,269 39,808,443 39,044,751 38,475,261 39,774,242 42,312,567 42,609,947 42,133,485
Sub total 78,774,044 37,881,989 77,172,463 80,556,205 79,388,983 79,429,008 81,217,094 84,590,491 85,175,377 84,210,624 International:
On 3,358,972 2,010,320 4,270,417 4,539,412 4,464,750 4,421,551 4,748,815 4,869,391 4,960,813 5,241,616 Off 3,375,480 1,933,089 4,286,630 4,565,057 4,497,442 4,500,861 4,822,110 4,933,473 5,018,821 5,382,072
Sub total 6,734,452 3,943,409 8,557,047 9,104,469 8,962,192 8,922,412 9,570,925 9,802,864 9,979,634 10,623,688 Direct transit 398,927 230,202 593,110 561,976 309,888 102,288 — — — —
Total enplaned 43,020,532 21,077,307 43,292,611 45,287,174 44,808,982 45,375,298 46,191,667 47,147,315 47,526,243 47,318,755 Total passengers 85,907,423 42,055,600 86,322,620 90,222,650 88,661,063 88,453,708 90,788,019 94,393,355 95,155,011 94,834,312
Sources: City of Atlanta, Department of Aviation2006 represents a six-month period beginning January 1, 2006 and ending June 30, 2006.
See accompanying independent auditors’ report.

53
Exhibit 9CITY OF ATLANTA, GEORGIADEPARTMENT OF AVIATION
Historical Aircraft Landed Weights
(amounts in thousands of pounds)
AnnualSignatory Nonsignatory Percent
Year end Airlines Airlines Total Change
2005 61,140,000 383,000 61,523,000 1.3%2006 57,581,000 378,000 57,959,000 (5.8)2007 57,144,000 288,000 57,432,000 (0.9)2008 59,956,000 211,000 60,167,000 4.82009 57,739,000 195,000 57,934,000 (3.7)2010 56,642,000 275,000 56,917,000 (1.8)2011 58,542,000 148,000 58,690,000 3.12012 58,126,000 164,000 58,290,000 (0.7)2013 58,056,000 182,000 58,238,000 (0.1)2014 57,157,000 166,000 57,323,000 (1.6)
Source: City of Atlanta, Department of Aviation
See accompanying independent auditors’ report.

54
Exhibit 10CITY OF ATLANTA, GEORGIADEPARTMENT OF AVIATION
Historical Air Cargo and Mail
(amounts in metric tons)
AnnualPercent
Year end Cargo Mail Total Change
2005 725,446 42,451 767,897 (10.8)%2006 738,180 8,322 746,502 (2.8)2007 726,574 4,134 730,708 (2.1)2008 703,458 5,764 709,222 (2.9)2009 565,250 6,005 571,255 (19.5)2010 609,683 12,238 621,921 8.92011 649,262 19,928 669,190 7.62012 621,817 31,566 653,383 (2.4)2013 592,104 44,918 637,022 (2.5)2014 551,022 49,396 600,418 (5.7)
Source: City of Atlanta, Department of Aviation
See accompanying independent auditors’ report.

55
Exhibit 11CITY OF ATLANTA, GEORGIADEPARTMENT OF AVIATION
Airlines Serving the Airport
Mainline Airlines Regional Airlines Foreign Flag Airlines All Cargo Airlines
AirTran Airways Allegiant Air Aeromexico ABXAlaska Airlines American Eagle Air Canada Jazz Air France/KLM CargoAmerican Airlines Chautauqua Airlines Air France Asiana CargoDelta Air Lines Comair British Airways British Airways CargoFrontier Airlines Compass Airlines KLM Royal Dutch Airlines Cargolux AirlinesSouthwest Airlines Endeavor Air Korean Air Cathay Pacific AirwaysSpirit Airlines Envoy Air Lufthansa German Airlines China Airlines CargoUnited Airlines ExpressJet Airlines DHL Worldwide ExpressUS Airways GoJet Airlines Emirates Sky Cargo
Mesa Airlines EVA AirwaysOmni Air International FedExRepublic Airlines Korean Air CargoShuttle America Lufthansa CargoSilver Airways Mountain Air CargoSkyWest Airlines Polar Air Cargo WorldwideVision Air Qatar Airways Cargo
Singapore Airlines CargoUPS Air Cargo
Sources: City of Atlanta, Department of Aviation
See accompanying independent auditors’ report.

56
Exhibit 12CITY OF ATLANTA, GEORGIADEPARTMENT OF AVIATION
Budget Staffing Levels
Fiscal years ended 2005-2014
Department 2005 2006 2007 2008 2009 2010 2011 2012 2013 2014
Airport Maintenance 190 198 197 193 196 196 175 179 179 181 Airport Operations 77 79 85 90 85 85 63 74 74 81 Commercial Properties 9 9 11 11 11 11 7 7 7 7 Concessions 13 14 16 17 18 18 15 13 14 16 Customer Service 4 4 4 3 3 3 3 3 3 3 Executive Administration 19 19 22 21 24 25 17 11 11 12 Finance 38 39 42 42 43 43 30 31 34 34 Human Resources 10 10 18 19 15 15 22 22 4 5 Information Technology 32 32 52 53 63 62 46 40 39 41 Internal Audit 5 5 4 4 4 4 3 3 4 4 Marketing 21 22 29 27 27 27 21 22 22 23 Planning and Development 148 148 154 154 142 142 105 113 114 111 Public Safety 442 451 445 446 457 457 455 516 494 536 Purchasing 10 10 11 11 11 11 9 9 9 9 Other City of Atlanta Departments — — — — — 37 37 54 62 68
Total 1,018 1,040 1,090 1,091 1,099 1,136 1,008 1,097 1,070 1,131
Sources: City of Atlanta, Department of Aviation
See accompanying independent auditors’ report.

57
Exhibit 13CITY OF ATLANTA, GEORGIADEPARTMENT OF AVIATION
Airport Information
OFFICIAL NAME Hartsfield-Jackson Atlanta International Airport
AIRPORT CODE ATL
OWNERSHIP/OPERATOR City of Atlanta/Department of Aviation
DISTANCE FROM DOWNTOWN ATLANTA 10 miles (16.2 kilometers)
ELEVATION ABOVE SEA LEVEL 1,026 feet (316 meters)TOTAL AIRPORT AREA 4,750 acres (1,922 hectares)TERMINAL COMPLEX The terminal complex measures 7.0 million square feet, or 160 acres.
The complex includes the terminal building and concourses T, A, B, C, andD; and the international terminal building and concourses E and F.Within these concourses, there are 152 domestic and 40 international gates.The Airport is free of any architectural barriers to people with disabilities.
RUNWAYS There are five parallel runways in an east-west configuration:9R-27L is 9,000 feet long (2,743 meters) – Category III9L-27R is 12,390 feet long (3,777 meters) – Category I8R-26L is 10,000 feet long (3,048 meters) – Category II8L-26R is 9,000 feet long (2,743 meters) – Category III10 – 28 is 9,000 feet long (2,743 meters) – Category III
PARKING CAPACITY There are 33,755 public parking spaces which includes 14,448 walkable Domesticand International parking deck spaces, in close proximity of the terminals, 7,254walkable Economy lot spaces, 11,318 Domestic and International TerminalPark Ride shuttle spaces, 571 employee parking spaces, and 164 "Cell phone lot" spaces. Special parking spaces are provided for the physically challenged in eachlot within close proximity.
GROUND TRANSPORTATION The Ground Transportation Center (GTC) is located at the west end of the terminalbuilding, outside of the north and south baggage claim areas. Located within the GTC are shared-ride shuttles that offer door-to-door reservation and on-demand service to hotels, convention centers, businesses and residences. Local shared-ride shuttles run approximately every 15 minutes and provide service to cities located within Clayton, Cobb, Dekalk, Fulton, and Gwinnett counties. Regional shared-ride shuttles provide scheduled service to areas outside of the 5 Atlanta metropolitan counties and to bordering states. The taxi staging area is located along the west curb in the GTC.
The Metropolitan Atlanta Rapid Transit Authority (MARTA) station is located at the west end of the terminal between the north and south baggage claims areas.
RENTAL CAR CENTER The Rental Car Center (RCC) is a convenient, state-of-the-art, 67.5 acre facilitythat houses all rental car company operations and vehicles. The RCC includestwo four-story parking decks, more than 8,700 parking spaces and a 137,000 square-foot customer service center. The rental car center features 13 rental car brands – Advantage, ACE/Airport, Alamo, Avis, Budget, Dollar, Enterprise, EZ,Hertz, National, Payless, SIXT, Thrifty, and Vanguard.
ATL SKYTRAIN The ATL SkyTrain is the Airports elevated automated people mover system that provides transportation between the main terminal, the RCC, and GeorgiaInternational Convention Center and Gateway Center hotel and restaurantcomplex. The SkyTrain system operates 24 hours each day, and consists of 12 Crystal Mover vehicles, nearly 1.5 miles of guideway, 6 stations, and a maintenancefacility. Each two-car train carries 100 passengers and their baggage.
THE PLANE TRAIN® The Plane Train® is the Airports underground automated people mover system thatprovides transportation between the domestic terminal, international terminal and seven concourses. The Plane Train® operates approximately 20 hours each day,and consists of 59 vehicles, a 3.5 mile loop track, 16 stations, and two maintenancefacilities. Each train carries approximately 300 passengers and their baggage.The Plane Train® transports approximately 240,000 passengers and employeesevery day.
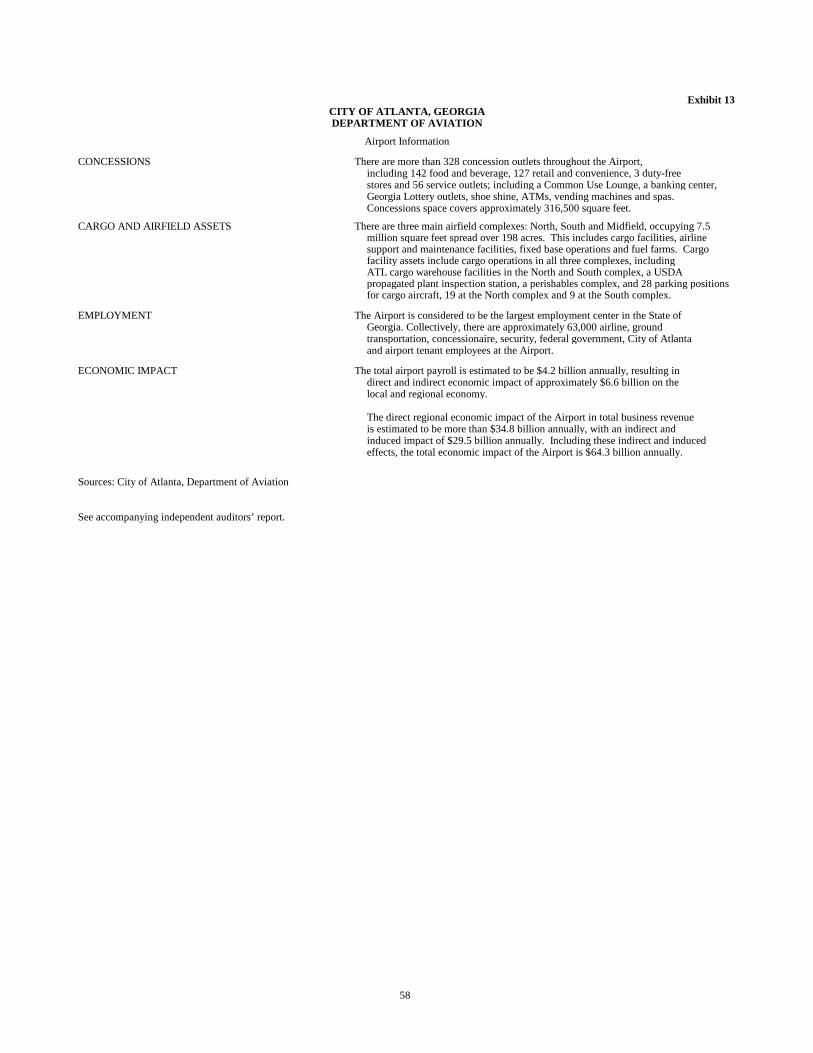
58
Exhibit 13CITY OF ATLANTA, GEORGIADEPARTMENT OF AVIATION
Airport Information
CONCESSIONS There are more than 328 concession outlets throughout the Airport,including 142 food and beverage, 127 retail and convenience, 3 duty-freestores and 56 service outlets; including a Common Use Lounge, a banking center,Georgia Lottery outlets, shoe shine, ATMs, vending machines and spas. Concessions space covers approximately 316,500 square feet.
CARGO AND AIRFIELD ASSETS There are three main airfield complexes: North, South and Midfield, occupying 7.5 million square feet spread over 198 acres. This includes cargo facilities, airline support and maintenance facilities, fixed base operations and fuel farms. Cargo facility assets include cargo operations in all three complexes, includingATL cargo warehouse facilities in the North and South complex, a USDApropagated plant inspection station, a perishables complex, and 28 parking positionsfor cargo aircraft, 19 at the North complex and 9 at the South complex.
EMPLOYMENT The Airport is considered to be the largest employment center in the State ofGeorgia. Collectively, there are approximately 63,000 airline, groundtransportation, concessionaire, security, federal government, City of Atlantaand airport tenant employees at the Airport.
ECONOMIC IMPACT The total airport payroll is estimated to be $4.2 billion annually, resulting indirect and indirect economic impact of approximately $6.6 billion on thelocal and regional economy.
The direct regional economic impact of the Airport in total business revenueis estimated to be more than $34.8 billion annually, with an indirect and induced impact of $29.5 billion annually. Including these indirect and inducedeffects, the total economic impact of the Airport is $64.3 billion annually.
Sources: City of Atlanta, Department of Aviation
See accompanying independent auditors’ report.