comprehensive annual financial report 12.31.2018 comprehensive annual financial report. for the year...
TRANSCRIPT

1134 Municipal Way Lansing, Michigan 48917
800.767.MERS (6377) www.mersofmich.com
for the fiscal year ending
12.31.2018
COMPREHENSIVE ANNUAL FINANCIAL REPORT


FOR THE YEAR ENDEDDECEMBER 31, 2018
PREPARED BYThe Finance Department of the
Municipal Employees’ Retirement System of Michigan1134 Municipal WayLansing, MI 48917
Contact MERS of Michigan800.767.MERS (6377)www.mersofmich.com
Chris DeroseChief Executive Officer
Leon Hank, CPAChief Financial Officer
COMPREHENSIVE ANNUAL FINANCIAL REPORT

2018comprehensive annual financial report
IV
Contents2018 ACHIEVEMENTS . . . . . . . . . . . . . . . . . . . . . . . . . . . . . . . . . . . . . . . . . . 1
Certificate of Achievement for Excellence in Financial Reporting . . . . . . . . . . . . . . . . . . . . . . . . . . . . 1Public Pension Standards Award. . . . . . . . . . . . . . . . . . . . . . 1Letter of Transmittal, May 16, 2018 . . . . . . . . . . . . . . . . . . . . 2Letter from the Chairperson, May 16, 2018 . . . . . . . . . . . . . . . . 5
MERS RETIREMENT BOARD . . . . . . . . . . . . . . . . . . . . . . . . . . . . . . . . . . . . . 6MERS OFFICERS . . . . . . . . . . . . . . . . . . . . . . . . . . . . . . . . . . . . . . . . . . . . . . 6MUNICIPAL Employees’ Retirement System of Michigan Organizational Structure – 2018 . . . . . . . . . . . . . . . . . . . . . . . . . . . . . . . . . . . 7OUTSIDE PROFESSIONAL SERVICES . . . . . . . . . . . . . . . . . . . . . . . . . . . . . . . 8ACKNOWLEDGEMENTS . . . . . . . . . . . . . . . . . . . . . . . . . . . . . . . . . . . . . . . . . 9
Office of Finance and Actuarial Services . . . . . . . . . . . . . . . . . . 9Office of Investments . . . . . . . . . . . . . . . . . . . . . . . . . . . 9Office of Strategic and External Affairs . . . . . . . . . . . . . . . . . . . 9Executive Office . . . . . . . . . . . . . . . . . . . . . . . . . . . . . . 9
INTRODUCTORY SECTION
FINANCIAL SECTIONINDEPENDENT AUDITOR’S REPORT . . . . . . . . . . . . . . . . . . . . . . . . . . . . . . . 13MANAGEMENT’S DISCUSSION AND ANALYSIS . . . . . . . . . . . . . . . . . . . . . . 16FINANCIAL HIGHLIGHTS . . . . . . . . . . . . . . . . . . . . . . . . . . . . . . . . . . . . . . . 16Basic Financial Statements . . . . . . . . . . . . . . . . . . . . . . . . . . . . . . . . . . . . . . 17
Required Supplemental Information . . . . . . . . . . . . . . . . . . . .17Supplementary Expense Schedules . . . . . . . . . . . . . . . . . . . .17Comparison Statement of Fiduciary Net Position . . . . . . . . . . . . . . . . . . . . . 17Comparison Statement of Changes in Fiduciary Net Position (Dollars in Thousands) . . . . . . . . . . . . . . . . . . . . . . . . . . . . . . 18Analysis of Fiduciary Net Position . . . . . . . . . . . . . . . . . . . . .19Investment Activities. . . . . . . . . . . . . . . . . . . . . . . . . . . .19Funding Status . . . . . . . . . . . . . . . . . . . . . . . . . . . . . .20Distribution of Funded Percentage among municipalities . . . . . . . . . . . . . . . 21Statement of Fiduciary Net Position as of December 31, 2018 . . . . . . . . . . 22Statement of Changes in Fiduciary Net Position for the Year Ended December 31, 2018 . . . . . . . . . . . . . . . . . . . . . . . . . . . . . . . . 24
NOTES TO BASIC FINANCIAL STATEMENTS . . . . . . . . . . . . . . . . . . . . . . . . . 261. REPORTING ENTITY AND PLAN DESCRIPTION . . . . . . . . . . . . . . . . . . . . . 26
MERS Participating Municipalities as of December 31, 2018 . . . . . . . . . . . . 29MERS Participants as of December 31, 2018 . . . . . . . . . . . . . . . . . . . . . . . 29
2. SUMMARY OF SIGNIFICANT ACCOUNTING POLICIES . . . . . . . . . . . . . . . . 30Reporting Entity . . . . . . . . . . . . . . . . . . . . . . . . . . . . . 30Blended Component Units . . . . . . . . . . . . . . . . . . . . . . . . 30Cost Allocation . . . . . . . . . . . . . . . . . . . . . . . . . . . . . 30Basis of Accounting . . . . . . . . . . . . . . . . . . . . . . . . . . . 30
*The Notes are part of the basic Financial Statements.
2018comprehensive annual financial report
V
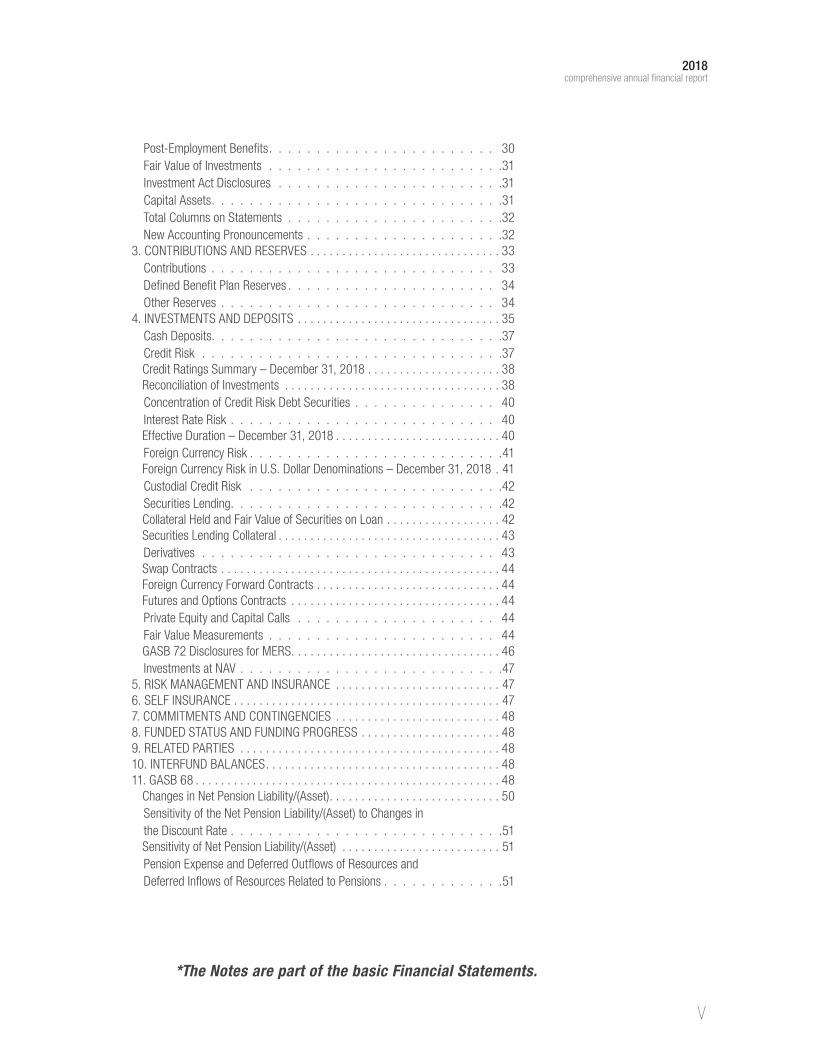
Post-Employment Benefits. . . . . . . . . . . . . . . . . . . . . . . . 30Fair Value of Investments . . . . . . . . . . . . . . . . . . . . . . . . .31Investment Act Disclosures . . . . . . . . . . . . . . . . . . . . . . . .31Capital Assets. . . . . . . . . . . . . . . . . . . . . . . . . . . . . . .31Total Columns on Statements . . . . . . . . . . . . . . . . . . . . . . .32New Accounting Pronouncements . . . . . . . . . . . . . . . . . . . . .32
3. CONTRIBUTIONS AND RESERVES . . . . . . . . . . . . . . . . . . . . . . . . . . . . . . 33Contributions . . . . . . . . . . . . . . . . . . . . . . . . . . . . . . 33Defined Benefit Plan Reserves . . . . . . . . . . . . . . . . . . . . . . 34Other Reserves . . . . . . . . . . . . . . . . . . . . . . . . . . . . . 34
4. INVESTMENTS AND DEPOSITS . . . . . . . . . . . . . . . . . . . . . . . . . . . . . . . . 35Cash Deposits. . . . . . . . . . . . . . . . . . . . . . . . . . . . . . .37Credit Risk . . . . . . . . . . . . . . . . . . . . . . . . . . . . . . . .37Credit Ratings Summary – December 31, 2018 . . . . . . . . . . . . . . . . . . . . . 38Reconciliation of Investments . . . . . . . . . . . . . . . . . . . . . . . . . . . . . . . . . . 38Concentration of Credit Risk Debt Securities . . . . . . . . . . . . . . . 40Interest Rate Risk . . . . . . . . . . . . . . . . . . . . . . . . . . . . 40Effective Duration – December 31, 2018 . . . . . . . . . . . . . . . . . . . . . . . . . . 40Foreign Currency Risk . . . . . . . . . . . . . . . . . . . . . . . . . . .41Foreign Currency Risk in U.S. Dollar Denominations – December 31, 2018 . 41Custodial Credit Risk . . . . . . . . . . . . . . . . . . . . . . . . . . .42Securities Lending. . . . . . . . . . . . . . . . . . . . . . . . . . . . .42Collateral Held and Fair Value of Securities on Loan . . . . . . . . . . . . . . . . . . 42Securities Lending Collateral . . . . . . . . . . . . . . . . . . . . . . . . . . . . . . . . . . . 43Derivatives . . . . . . . . . . . . . . . . . . . . . . . . . . . . . . . 43Swap Contracts . . . . . . . . . . . . . . . . . . . . . . . . . . . . . . . . . . . . . . . . . . . . 44Foreign Currency Forward Contracts . . . . . . . . . . . . . . . . . . . . . . . . . . . . . 44Futures and Options Contracts . . . . . . . . . . . . . . . . . . . . . . . . . . . . . . . . . 44Private Equity and Capital Calls . . . . . . . . . . . . . . . . . . . . . 44Fair Value Measurements . . . . . . . . . . . . . . . . . . . . . . . . 44GASB 72 Disclosures for MERS . . . . . . . . . . . . . . . . . . . . . . . . . . . . . . . . . 46Investments at NAV . . . . . . . . . . . . . . . . . . . . . . . . . . . .47
5. RISK MANAGEMENT AND INSURANCE . . . . . . . . . . . . . . . . . . . . . . . . . . 476. SELF INSURANCE . . . . . . . . . . . . . . . . . . . . . . . . . . . . . . . . . . . . . . . . . . 477. COMMITMENTS AND CONTINGENCIES . . . . . . . . . . . . . . . . . . . . . . . . . . 488. FUNDED STATUS AND FUNDING PROGRESS . . . . . . . . . . . . . . . . . . . . . . 489. RELATED PARTIES . . . . . . . . . . . . . . . . . . . . . . . . . . . . . . . . . . . . . . . . . 4810. INTERFUND BALANCES . . . . . . . . . . . . . . . . . . . . . . . . . . . . . . . . . . . . . 4811. GASB 68 . . . . . . . . . . . . . . . . . . . . . . . . . . . . . . . . . . . . . . . . . . . . . . . . 48
Changes in Net Pension Liability/(Asset) . . . . . . . . . . . . . . . . . . . . . . . . . . . 50Sensitivity of the Net Pension Liability/(Asset) to Changes in the Discount Rate . . . . . . . . . . . . . . . . . . . . . . . . . . . . .51Sensitivity of Net Pension Liability/(Asset) . . . . . . . . . . . . . . . . . . . . . . . . . 51Pension Expense and Deferred Outflows of Resources and Deferred Inflows of Resources Related to Pensions . . . . . . . . . . . . .51
*The Notes are part of the basic Financial Statements.

VI
12. SUMMARY INFORMATION – ACTUARIAL FUNDING METHODS AND ASSUMPTIONS . . . . . . . . . . . . . . 52REQUIRED SUPPLEMENTARY INFORMATION . . . . . . . . . . . . . . . . . . . . . . . . 54
Annual Money Weighted Return . . . . . . . . . . . . . . . . . . . . . 54Schedule of Employer Contributions . . . . . . . . . . . . . . . . . . . 54Schedule of Changes in Employer’s Net Pension Liability/(Asset) and Related Ratios . . . . . . . . . . . . . . . . . . . . . . . . . . . 55Schedule of Changes in the Net Pension Liability/(Asset) . . . . . . . . . . . . . . . 55
OTHER SUPPLEMENTARY INFORMATION . . . . . . . . . . . . . . . . . . . . . . . . . . . 56Schedule of Administrative Expenses for the Year Ended December 31, 2018 . . . . . . . . . . . . . . . . . . . . . . . . . . . . . 56Schedule of Investment Expenses for the Year Ended December 31, 2018 . . 57Schedule of Payments to Consultants – December 31, 2018 . . . . . . . . . . . 58
CHIEF INVESTMENT OFFICER REPORT . . . . . . . . . . . . . . . . . . . . . . . . . . . . 61Economic Overview . . . . . . . . . . . . . . . . . . . . . . . . . . . .61
REPORT ON INVESTMENT ACTIVITY . . . . . . . . . . . . . . . . . . . . . . . . . . . . . . 63DEFINED BENEFIT PLAN . . . . . . . . . . . . . . . . . . . . . . . . . . . . . . . . . . . . . . . 64INVESTMENT OBJECTIVES AND ACTIVITY . . . . . . . . . . . . . . . . . . . . . . . . . . 64PORTFOLIO HIGHLIGHTS . . . . . . . . . . . . . . . . . . . . . . . . . . . . . . . . . . . . . . . 64
Asset Allocation . . . . . . . . . . . . . . . . . . . . . . . . . . . . . 64Criteria for Inclusion of Asset Classes . . . . . . . . . . . . . . . . . . 65Current Targeted Allocations and Allocation Bands . . . . . . . . . . . . 65Portfolio Rebalance Policy . . . . . . . . . . . . . . . . . . . . . . . . 65Sub-Asset Class/ Manager Rebalancing . . . . . . . . . . . . . . . . . 66Performance Versus Custom Benchmarks as of December 31, 2018 (gross of fees) . . . . . . . . . . . . . . . . . . . . . . . . . . . . . . 66Downside Protection, Upside Participation as of December 31, 2018 . . . . . . 67Current Asset Allocation versus Target Allocation as of December 31, 2018 . . . . . . . . . . . . . . . . . . . . . . . . . . . . . . . . . . . . . . . . . 67Statistical Performance . . . . . . . . . . . . . . . . . . . . . . . . . . . . . . . . . . . . . . . 68Securities Lending . . . . . . . . . . . . . . . . . . . . . . . . . . . . . . . . . . . . . . . . . . 68Investment Summary for Defined Benefit Plan, Defined Contribution Plan, Hybrid Plan, Health Care Savings Program, Retiree Health Funding Vehicle, 457 Program, IRA, and Investment Services Program as of December 31, 2018 . . . . . . . . . . . . . . . . . . . . . . . . . . . . . . . . . . . . . 69
GLOBAL EQUITY ASSET CLASS SUMMARY . . . . . . . . . . . . . . . . . . . . . . . . . 70Equity Asset Class Summary . . . . . . . . . . . . . . . . . . . . . . . . . . . . . . . . . . . 70Global Equity Performance as of December 31, 2018 . . . . . . . . . . . . . . . . . 71Top 10 Public Equity Holdings as of December 31, 2018 . . . . . . . . . . . . . . . 72Global Equity Investment Strategies . . . . . . . . . . . . . . . . . . . . . . . . . . . . . . 72
INVESTMENTS SECTION
2018comprehensive annual financial report
*The Notes are part of the basic Financial Statements.

VII
ACTUARIAL SECTION2017 ACTUARIAL LETTER TO THE BOARD . . . . . . . . . . . . . . . . . . . . . . . . . . 85SUMMARY OF ACTUARIAL ASSUMPTIONS AND METHODS . . . . . . . . . . . . . 87ASSUMPTIONS AND METHOD CHANGES . . . . . . . . . . . . . . . . . . . . . . . . . . . 88
Actuarial Assumptions. . . . . . . . . . . . . . . . . . . . . . . . . . 88Interest Rate . . . . . . . . . . . . . . . . . . . . . . . . . . . . . . 88Pay Increases . . . . . . . . . . . . . . . . . . . . . . . . . . . . . . 88Annual Percentage Increase in Salary . . . . . . . . . . . . . . . . . . . . . . . . . . . . 89Inflation . . . . . . . . . . . . . . . . . . . . . . . . . . . . . . . . . .89Payroll Growth . . . . . . . . . . . . . . . . . . . . . . . . . . . . . .89Increase in Final Average Compensation . . . . . . . . . . . . . . . . . .89Retirement Rates . . . . . . . . . . . . . . . . . . . . . . . . . . . . 90Normal Retirement – Service Based Benefit F(N) Adopted . . . . . . . . . . . . . 90Early Retirement – Reduced Benefit . . . . . . . . . . . . . . . . . . . . . . . . . . . . . . 90Withdrawal Rates . . . . . . . . . . . . . . . . . . . . . . . . . . . . . . . . . . . . . . . . . . . 91Rates of Withdrawal (Excluding Death or Disability) from Active Employment Before Retirement . . . . . . . . . . . . . . . . . . . . . . . . . . . . . . . . . 91 Disability Rates . . . . . . . . . . . . . . . . . . . . . . . . . . . . . . . . . . . . . . . . . . . . . 91Rates of Withdrawal Due To Disability* . . . . . . . . . . . . . . . . . . . . . . . . . . . . 91Mortality Tables (Non – Disabled) . . . . . . . . . . . . . . . . . . . . . . . . . . . . . . . 92Mortality Tables (Disabled) . . . . . . . . . . . . . . . . . . . . . . . . . . . . . . . . . . . . 92
GLOBAL FIXED INCOME ASSET CLASS SUMMARY . . . . . . . . . . . . . . . . . . . 73Global Fixed Income Asset Allocation . . . . . . . . . . . . . . . . . . . . . . . . . . . . . 73Global Fixed Income Performance as of December 31, 2018 (gross of fees) . . . . . . . . . . . . . . . . . . . . . . . . . . . . . . 74Top 10 Global Fixed Income Holdings as of December 31, 2018 . . . . . . . . . 74Global Fixed Income – Investment Strategies . . . . . . . . . . . . . . . . . . . . . . . 75
REAL ASSETS CLASS SUMMARY . . . . . . . . . . . . . . . . . . . . . . . . . . . . . . . . 75Real Assets – Investment Strategies . . . . . . . . . . . . . . . . . . . . . . . . . . . . . 75Real Assets Allocation. . . . . . . . . . . . . . . . . . . . . . . . . . . . . . . . . . . . . . . . 76Real Assets Performance as of December 31, 2018 (gross of fees) . . . . . . . 76
DIVERSIFYING STRATEGIES CLASS SUMMARY . . . . . . . . . . . . . . . . . . . . . . 77Diversifying Strategies Performance as of December 31, 2018 (gross of fees) . . . . . . . . . . . . . . . . . . . . . . . . . . . . . . 77Diversifying Strategies – Investment Strategies . . . . . . . . . . . . . . . . . . . . . 78Investment Management Fees . . . . . . . . . . . . . . . . . . . . . . .78Schedule of Investment Fees as of December 31, 2018 . . . . . . . . . . . . . . . 78Schedule of Investment Commissions as of December 31, 2018 . . . . . . . . . 79
MERS INVESTMENT MENU SUMMARY (PARTICIPANT DIRECTED ACCOUNTS AND INSTITUTIONAL Funds) . . . . . . . . . . . . . . . . . . . . . . . . . . . 80
Retirement Strategies . . . . . . . . . . . . . . . . . . . . . . . . . . 80Premium Select Options . . . . . . . . . . . . . . . . . . . . . . . . . 80Self-Directed Brokerage Account . . . . . . . . . . . . . . . . . . . . 80Participant Directed Accounts . . . . . . . . . . . . . . . . . . . . . . .81Institutional Funds. . . . . . . . . . . . . . . . . . . . . . . . . . . . .81
2018comprehensive annual financial report
*The Notes are part of the basic Financial Statements.
VIII
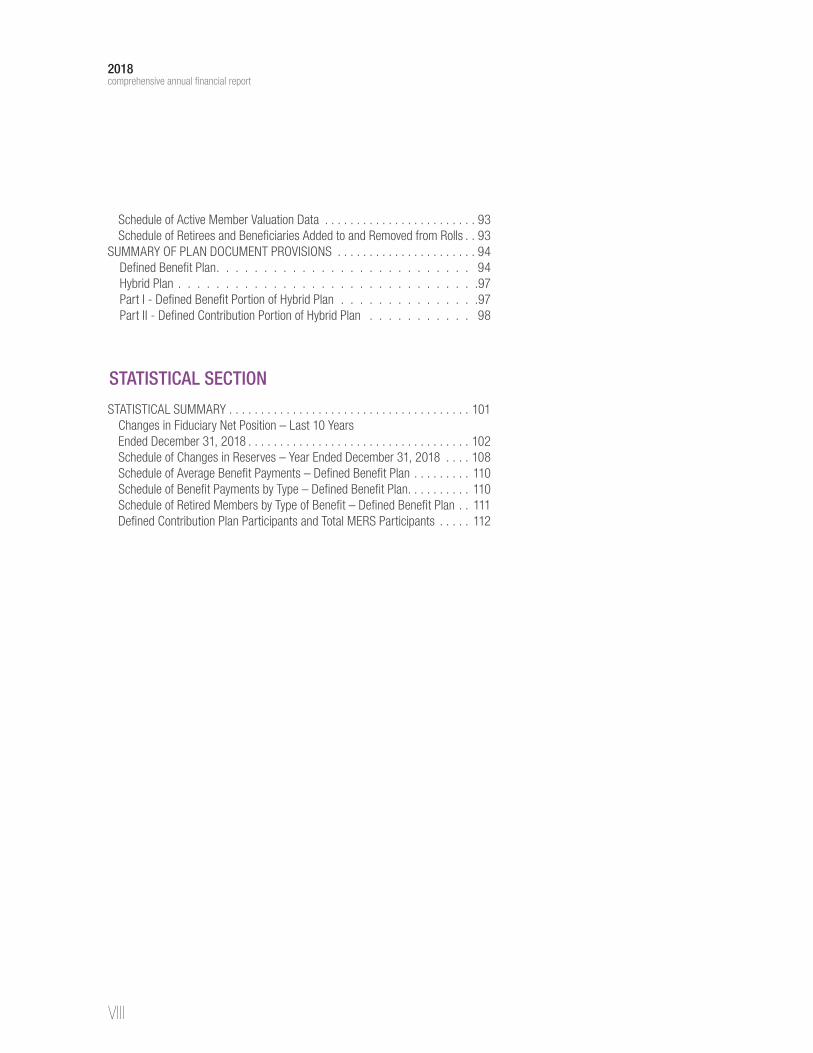
Schedule of Active Member Valuation Data . . . . . . . . . . . . . . . . . . . . . . . . 93Schedule of Retirees and Beneficiaries Added to and Removed from Rolls . . 93
SUMMARY OF PLAN DOCUMENT PROVISIONS . . . . . . . . . . . . . . . . . . . . . . 94Defined Benefit Plan. . . . . . . . . . . . . . . . . . . . . . . . . . . 94Hybrid Plan . . . . . . . . . . . . . . . . . . . . . . . . . . . . . . . .97Part I - Defined Benefit Portion of Hybrid Plan . . . . . . . . . . . . . . .97Part II - Defined Contribution Portion of Hybrid Plan . . . . . . . . . . . 98
STATISTICAL SECTION
2018comprehensive annual financial report
STATISTICAL SUMMARY . . . . . . . . . . . . . . . . . . . . . . . . . . . . . . . . . . . . . . 101Changes in Fiduciary Net Position – Last 10 Years Ended December 31, 2018 . . . . . . . . . . . . . . . . . . . . . . . . . . . . . . . . . . . 102Schedule of Changes in Reserves – Year Ended December 31, 2018 . . . . 108Schedule of Average Benefit Payments – Defined Benefit Plan . . . . . . . . . 110Schedule of Benefit Payments by Type – Defined Benefit Plan. . . . . . . . . . 110Schedule of Retired Members by Type of Benefit – Defined Benefit Plan . . 111Defined Contribution Plan Participants and Total MERS Participants . . . . . 112

INTRODUCTION


INTRODUCTION2018 comprehensive annual financial report
1
Certificate of Achievement for Excellence in Financial Reporting
The Municipal Employees’ Retirement System of Michigan
(MERS) received the Certificate of Achievement for Excellence
in Financial Reporting from the Government Finance Officers
Association for the December 31, 2017, Comprehensive Annual
Financial Report. This marks the 30th consecutive year MERS
has received this honor.
2018 ACHIEVEMENTS
Public Pension Standards Award
MERS also received the Public Pension Coordinating
Council (PPCC), Public Pension Standards Award
for 2018, in recognition of meeting the professional
standards for plan design and administration as
set forth in the Public Pension Standards. This
award is presented by the PPCC, a confederation
of the National Association of State Retirement
Administrators (NASRA), the National Conference on
Public Employee Retirement Systems (NCPERS), and
the National Council on Teacher Retirement (NCTR).
for the fiscal year ending
12.31.2017
COMPREHENSIVE ANNUAL FINANCIAL REPORT
1134 Municipal Way Lansing, Michigan 48917
800.767.MERS (6377) www.mersofmich.com

INTRODUCTION2018 comprehensive annual financial report
2
Municipal Employees’ Retirement System
Letter of Transmittal, May 28, 2019
Dear Board Members:
We are pleased to submit the Comprehensive Annual Financial Report (CAFR) for the Municipal Employees’ Retirement System of Michigan (MERS) for the fiscal year ending December 31, 2018.
Having completed the second year of our four-year Strategic Plan, MERS has laid a solid groundwork of goals and measurements by which we evaluate and move toward our vision aimed at delivering superior value to our customers by:
• Achieving a deeper understanding of customer needs and connection with them
• Proactively partnering with employers by providing options that help meet their unique needs
• Consistently delivering services through intuitive processes and systems
• Significantly increasing resources and awareness that help participants improve financial wellness to be ready for retirement
To accomplish this, MERS has developed a Balanced Scorecard focusing on four perspectives: Customer, Financial, Process, and Learning & Growth. Specific Projects within each perspective drive business efforts and are measured on an ongoing basis, reported on our Balanced Scorecard and drive team priorities and individual performance company-wide.
In 2018, MERS exceeded overall targets and included highlights such as significant increase in employer satisfaction with their voice being heard, engagement with MERS resources and actions to improve participant financial wellness, solid relative investment performance, holding operational costs in check, and the measurement of key processes. MERS launched two new programs in the year: offering MERS IRA accounts to provide greater saving opportunities at the individual level, and providing Health Care Exchange services to help retiring participants’ bridge post-employment healthcare needs. Our customer base continued to expand, as we partnered with 21 new local units of government for the first time, and many continue to enroll in multiple programs – 25% with 1 product, 26% with 2 products, and 49% with 3 products. In addition, participant accounts grew to 145,707.
MERS ProfileMERS is a statutory public corporation that was created to serve members across the state of Michigan on a not-for-profit basis. We are one of the largest, most established and successful shared services stories in Michigan. Our approach to efficiently managing retirement and other post-employment benefit plans allows local governments to focus on their core services. Our comprehensive platform of services includes: plan governance, actuarial services, legal counsel, on-staff auditor, information technology support, administration of benefits, participant education and investment portfolio management. The MERS Retirement Board (Board) provides oversight and serves as the fiduciary of the funds.

INTRODUCTION2018 comprehensive annual financial report
3
Report Structure and Contents Section 38.1536 of the Michigan Compiled Laws requires the Board to prepare this annual report in accordance with U.S. Generally Accepted Accounting Principles (GAAP). The financial information shown throughout this report meets that requirement. The MERS management team, under the oversight of the Board, is responsible for the preparation, integrity, and fairness of the financial statements and other information presented in this report.
Section 38.1536 also requires the Board to arrange for an annual audit of the MERS financial statements. Plante Moran, PLLC, MERS external auditor, conducted an independent audit of the financial statements in accordance with Generally Accepted Auditing Standards. This audit is described in the Independent Auditor’s Report in the Financial Section following this letter. MERS management provides the external auditors with unrestricted access to records and staff. This external audit is conducted annually to ensure the sufficiency of the internal controls and that our financial statements are fairly stated.
As a part of our financial statement process, we have identified necessary internal controls and have them in place to ensure that transactions are authorized, assets are safeguarded, and all supporting records are properly retained and managed. The cost of a control should not exceed the benefits to be derived. The internal control objective is to provide reasonable, rather than absolute, assurance that the financial statements are free of any material misstatements. Our on-staff auditor helps ensure we meet high standards for internal control. As a part of continually strengthening internal controls, MERS conducted an Internal Control Evaluation (ICE) in 2017 for the entire organization. In 2018, MERS also completed a Service Organization Control Audit (SOC 1, Type II audit) that disclosed no deficiencies in MERS internal control.
This CAFR is divided into five sections:
• Introduction – Achievements and structure of MERS
• Financial – Financial statements, notes, required supplemental information, Management’s Discussion and Analysis (MD&A), which is the MERS management team’s narrative and overview of the financial statements
• Investment – Investment activities and performance information
• Actuarial – Actuarial assumptions and methods as well as the actuary’s certification letter
• Statistical – Various schedules on member data and ten-year trends
Financial SummaryLike many investors, MERS has benefited from the long-running economic business cycle upturn since 2009. The calendar years of 2016 and 2017 were especially good, with MERS earning investment returns on our Defined Benefit (DB) Portfolio of 11.1% and 13.2% respectively (net of investment expenses). Despite these good returns, MERS expects a market correction or downturn as has happened in every business cycle since the early 1900s. In 2018, MERS experienced a market downturn with the DB Portfolio recording an investment loss of -3.51% based on a gross rate of return. The DB Portfolio, however, outperformed the policy benchmark by 285 basis points. This means that while the return for the year was negative, the MERS loss in a down market was much less than many of its peers experienced. MERS designs its investment strategy to perform this way, providing more protection against losses when markets are down. More information regarding our investment management performance, policies and processes are found with the Schedule of Fees and Commissions in the Investments Section.
MERS ended the year with a net position of $10.9 billion for all plan types, down $477 million from 2017. The reduction in asset size occurred primarily due to the investment loss for the year. Contributions and transfers in from all plan types exceeded $1 billion for the first time in MERS history. Strong cost control measures helped MERS hold its administrative costs to $19.1 million, close to last year’s costs of $19.2 million, and comparable to costs going all the way back to its 2009 spending level. Lower administrative costs also have a positive impact on DB and other plan types.

INTRODUCTION2018 comprehensive annual financial report
4
In 2018, the MERS 457 program grew at the highest rate of any product, increasing in asset size by $26 million to $108.8 million. As an indicator of how municipalities are more aggressively addressing their other post-employment benefit (OPEB) obligations, the MERS Health Care Savings Program and Retiree Health Funding Vehicle net plan assets grew by $25 million in 2018.
One other measure of a defined benefit retirement system’s financial health is the percentage of its actuarial liabilities owed that is covered by its available actuarial assets. Using this ratio (calculated from the most recent 2017 calendar year valuation data), nearly 59% of MERS’ municipalities were funded at 70% or higher (427 municipalities), which is up from 56% (401 municipalities) in 2016.
We continue to partner with all municipalities in helping them set fiscal goals and discussing options to find the programs and provisions that best fit each municipality’s unique needs. There are 746 local units of government within MERS Defined Benefit and Hybrid Plans, which encompasses 2,915 divisions with unique benefit designs. In 2018, 37 divisions adopted a Hybrid Plan or a lower tier Defined Benefit Plan for new employees and 56 divisions adopted a Defined Contribution Plan for new employees. There were also 130 divisions that increased cost sharing to their employees. In 2018, 330 plans made voluntary contributions, contributing an additional $263 million to help increase funding levels. These efforts helped strengthen the financial condition of all these plans. In addition, new local units of government joining the MERS Defined Benefit Plan brought in an extra $2 million.
More detail on these financial metrics is included in the MD&A document. A complete copy of the CAFR is provided to the Governor, the members of both the State House and Senate, and the Office of the State Treasurer, as required by law. The CAFR and Summary Report are available on our website, www.mersofmich.com.
AcknowledgementsWe are honored that for the 30th consecutive year, the Government Finance Officers Association (GFOA) awarded MERS its Certificate of Achievement for Excellence in Financial Reporting award for our 2017 CAFR.
We are very grateful to our Board members for their time and dedication which makes it possible for MERS to be successful for our customers. Their conscientious oversight and diligence of our well-run system is greatly appreciated. On behalf of all MERS local units of government and participants, we thank them for their dedication to public service.
We also express our deep gratitude to all staff members for their hard work and dedication to ensure the successful operation of MERS. Our staff applies its energy, innovation, skill, and a commitment to excellent service every day to ensure the security of a retirement plan for all of our participants.
Respectfully submitted,
Chris DeRoseChief Executive Officer
Leon E. Hank, CPAChief Financial Officer

INTRODUCTION2018 comprehensive annual financial report
5
Letter from the Chairperson, May 28, 2019
Dear MERS Members:
On behalf of the MERS Retirement Board, it is my pleasure to present the Municipal Employees’ Retirement System of Michigan’s (MERS) Comprehensive Annual Financial Report (CAFR). MERS is an independent, professional retirement services company that was created to administer the retirement plans for Michigan’s local units of government on a not-for-profit basis. Today we partner with 84% of Michigan’s local units of government. Included in this year’s report is all of the required financial information for the fiscal year ending December 31, 2018.
MERS is governed by an independent, unpaid board committed to fairness, transparency and accountability. Our board adheres to strong conflict of interest provisions and best fiscal practices making us a reliable fiduciary agent and a go-to expert for retirement security in Michigan. We just completed the second year of our four-year Strategic Plan and are working toward our shared vision of providing superior value.
We continue to grow in the number of local units of government and participants we serve. MERS partners with more than 900 local units of government across the state, from the western Upper Peninsula to the southeastern Lower Peninsula with a combined net position value of nearly $11 billion. MERS proudly serves over 100,000 participants, including police officers and firefighters, road crews, medical staff, librarians, clerks, and countless other roles that protect and serve the many communities across Michigan.
There is no one-size-fits-all approach to providing a secure retirement for Michigan’s public servants which is why we offer a broad range of flexible and customizable plans to fit our customers’ budgets, needs and goals. MERS responds to feedback and is consistently adding new, updated programs and tools to keep up with dynamic markets and help improve participants’ financial wellness. We continue to focus on providing more information and resources to assist our customers with managing their unfunded liabilities, enhancing online account access, and consistently delivering services through intuitive processes and systems.
Readying our participants for retirement is no small feat. However, I know that MERS staff will continue to work diligently to find the appropriate solutions. All of this speaks to the dedication of our leadership, the competency of our staff, and our passion for excellence in all we do for you.
In closing, I would like to take this opportunity to thank the Board members and staff for their expertise and professionalism. It is my pleasure to serve as your MERS Chairperson and, like all of you, I am proud to have played a role in serving all MERS’ local units of government and participants in our effort to provide superior value.
Sincerely,
Michael Brown, ChairpersonMERS Retirement Board

INTRODUCTION2018 comprehensive annual financial report
6
Back row (standing left to right): Dale Feldpausch, James Wiersma, Jason Sarata, Michael Brown, Tina Butler Front row (sitting): Amy Deford, John Ogden, Michael Gilmore, Randy Girard
Officer Members: Michael Brown (Chairperson), Barry County; Randy Girard, Charter Township of Marquette; Dale Feldpausch, Capital Region Airport Authority
Employee Members: Tina Butler, Cass County; Jason Sarata, Delta Township; Amy Deford, Saginaw County
Expert Members: Michael Gilmore, Red Cedar Investment Management, East Lansing; James R. Wiersma, Haworth, Holland
Retiree Member: John Ogden, City of Port Huron (Retired)
MERS RETIREMENT BOARD
MERS OFFICERS
From left to right: Carrie Lombardo, Chief Strategic & External Affairs OfficerDenise Boucke, Chief Operating Officer Chris DeRose, Chief Executive Officer Jeb Burns, Chief Investment Officer Leon Hank, Chief Financial Officer

INTRODUCTION2018 comprehensive annual financial report
7
MUNICIPAL EMPLOYEES’ RETIREMENT SYSTEM OF MICHIGAN ORGANIZATIONAL STRUCTURE – 2018
MERS Retirement
Board
Executive Office
Internal Auditor
ActuarialCustomer Relations
Process & Project
Management
Information Technology
Finance
Human Resources &
Facilities
Communications & Retirement
Strategies
Customer Support
Governmental Affairs
Growth Management
Office of Investments
Office of Finance and
Actuarial Services
Office of Internal
Operations
Office of Strategic
and External Affairs
Legal

INTRODUCTION2018 comprehensive annual financial report
8
ActuarialCBIZ, Inc.Gabriel, Roeder, Smith & Company
AuditingPlante & Moran, PLLC
BankingCommerceJP Morgan ChaseNorthern Trust
Business ConsultingAccurint Bloomberg BNAByrum & Fisk Advocacy Cammack RetirementCobalt Community ResearchGartner, Inc.Institute for Continuing Legal EducationLexisNexisMartin Commercial Properties, Inc.Moore TrosperPension Benefit InformationPricewaterhouseCoopersWoltersKluwer
Human Resource ConsultingAdvisaAmerican Society of EmployersEnergage, LLCGallagher Benefit Services, Inc. HR Management Group, Inc.Right Management
Custodial Banking and Securities Lending
State Street Bank & Trust Company
Investment Consulting and Research
BCA ResearchBloomberg Finance L.P. Gavekal CapitalInforma Investment Solutions Ned Davis ResearchStephen Morrow
Legal ConsultingBernstein, Litowitz, Berger and
Grossmann, LLP
Clark Hill, PLCDickinson Wright PLLCIce Miller, LLPJones DayMiller, Canfield, Paddock and Stone, PLCRobbins Geller Rudman and Dowd, LLP
Legislative ConsultingKaroub AssociatesMichigan Legislative Consultants
Medical AdvisingManaged Medical Review Organization
Systems Implementation and Maintenance
Atrio Systems Cylance, Inc.Databank IMX LLCManer Costerisan CorporationOptima Consulting LLCRapid7 LLC Tegrit Software Ventures, Inc. Total Solutions, Inc.VertivWinklevoss Technologies LLC
Third-Party AdministrationAlerus Retirement Solutions
Investment ManagementAcadian Asset Management Inc.Adveq Management US Inc.Alpine Lake Capital Partners, LLC
(Barings LLC)AlpInvest PartnersAngelo, Gordon & Co.ARA Asset Management LimitedBlackstone Alternative Asset
Management, LPBrookfield Asset ManagementBrookwood Financial Partners, LLCC.S. McKee, LPColony Capital, LLC Comvest PartnersConnor, Clark, & Lunn Investment
ManagementConsilium Investment ManagementCromwell Property GroupDomain Capital Advisors, LLCElmTree Funds, LLC
Exeter Property Group, LLCFortress Investment Group, LLCFrontier Market Asset Management, LLCGerchen Keller Capital, LLC (Burford
Capital)Grantham, Mayo, Van Otterloo & Co. LLCGreenOak Europe II, LPGrosvenor Capital Management, LPH/2 Capital PartnersHancock Natural Resource Group, Inc.Harbert Management CorporationHemisfério Sul Investimentos SAIL&FS Capital Advisors LimitedIonetixJ.P. Morgan Asset ManagementJanus Capital Management, LLCKennedy Capital Management Inc.LaSalle Investment ManagementLMCG Investments, LLCMC Credit Partners, LPMellon Capital Management
CorporationMerrowie Property TrustMesirow Private Equity Advisors, Inc.Metropolitan Real EstateMichigan eLab Capital Partners, LPMiravast Asset Management, LLCMountain Pacific Group, LLCNapier Park Global CapitalOak Hill Advisors, LPOak Street Real Estate Capital, LLCOberland Capital Management, LLCOch-Ziff Real Estate Advisors, LPOrchard Global Asset Management, LLPPioneer Asset Management SAPolunin Capital Partners LimitedPunch & AssociatesRialto Capital Management, LLCSPI Strategies, LLCSquare Mile Capital Management, LLCStarwood Capital GroupTenacis Systematic Macro Fund, LLCTerra Partners Asset ManagementThe Electrum Group, LLCThe Townsend GroupTrice Medical Inc.VerdantƒWilliam Blair & Company
OUTSIDE PROFESSIONAL SERVICES

INTRODUCTION2018 comprehensive annual financial report
9
ACKNOWLEDGEMENTS
The Office of Finance and Actuarial Services prepared the MERS Comprehensive Annual Financial
Report (CAFR) for the year ended December 31, 2018. Special thanks to the individuals who
contributed significant amounts of time and energy to help complete this report.
Office of Finance and Actuarial Services Betsy Waldofsky, Finance DirectorLuke Huelskamp, Senior Finance ManagerDanielle Williams, AccountantCourtney Allen, Accountant
Office of Investments Julian Ramirez, Investment Officer and Portfolio Manager Furat Zomay, Investment AnalystPeter Wujkowski, Investment and Administrative Officer and Portfolio Manager Paul Van Gilder, Investment Officer and Portfolio Manager
Office of Strategic and External AffairsBetsy Schaeffer, Digital Print and Mail Services Supervisor James Scofield, Design CoordinatorJanie Olivarez, Office Administrator Jennifer Mausolf, Communications & Retirement Strategies DirectorRichard Taylor, Print Production Specialist
Executive OfficeBrian LaVictoire, Deputy General Counsel for Investments and Compliance Valerie Lawver, Office AdministratorCarri Simon, Internal Auditor
Special thanks are also extended to Plante & Moran PLLC, Alerus Retirement Solutions, CBIZ, Inc., Gabriel Roeder Smith & Company, State Street Bank & Trust Company, and Tegrit Software Ventures, Inc.

INTRODUCTION2018 comprehensive annual financial report
10
This page intentionally left blank.

FINANCIAL

FINANCIAL2018 comprehensive annual financial report
13
INDEPENDENT AUDITOR’S REPORT
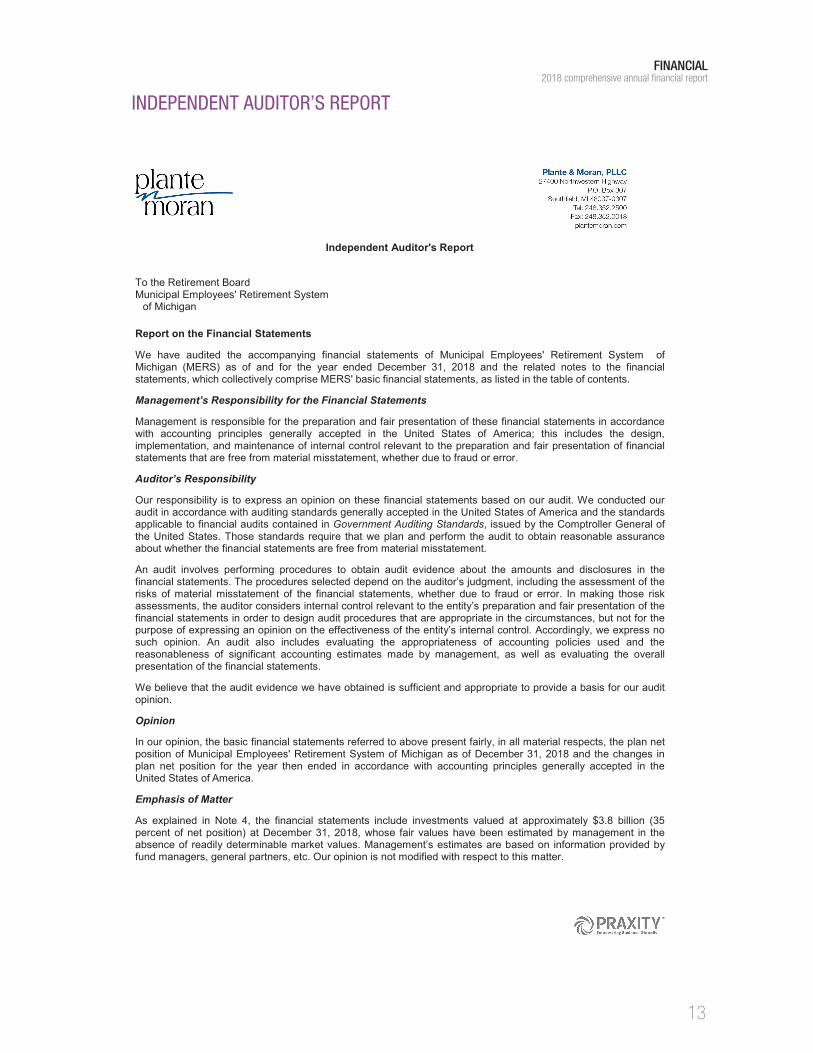
Independent Auditor's Report
To the Retirement Board Municipal Employees' Retirement System
of Michigan Report on the Financial Statements
We have audited the accompanying financial statements of Municipal Employees' Retirement System of Michigan (MERS) as of and for the year ended December 31, 2018 and the related notes to the financial statements, which collectively comprise MERS' basic financial statements, as listed in the table of contents.
Management’s Responsibility for the Financial Statements
Management is responsible for the preparation and fair presentation of these financial statements in accordance with accounting principles generally accepted in the United States of America; this includes the design, implementation, and maintenance of internal control relevant to the preparation and fair presentation of financial statements that are free from material misstatement, whether due to fraud or error.
Auditor’s Responsibility
Our responsibility is to express an opinion on these financial statements based on our audit. We conducted our audit in accordance with auditing standards generally accepted in the United States of America and the standards applicable to financial audits contained in Government Auditing Standards, issued by the Comptroller General of the United States. Those standards require that we plan and perform the audit to obtain reasonable assurance about whether the financial statements are free from material misstatement.
An audit involves performing procedures to obtain audit evidence about the amounts and disclosures in the financial statements. The procedures selected depend on the auditor’s judgment, including the assessment of the risks of material misstatement of the financial statements, whether due to fraud or error. In making those risk assessments, the auditor considers internal control relevant to the entity’s preparation and fair presentation of the financial statements in order to design audit procedures that are appropriate in the circumstances, but not for the purpose of expressing an opinion on the effectiveness of the entity’s internal control. Accordingly, we express no such opinion. An audit also includes evaluating the appropriateness of accounting policies used and the reasonableness of significant accounting estimates made by management, as well as evaluating the overall presentation of the financial statements.
We believe that the audit evidence we have obtained is sufficient and appropriate to provide a basis for our audit opinion.
Opinion
In our opinion, the basic financial statements referred to above present fairly, in all material respects, the plan net position of Municipal Employees' Retirement System of Michigan as of December 31, 2018 and the changes in plan net position for the year then ended in accordance with accounting principles generally accepted in the United States of America.
Emphasis of Matter
As explained in Note 4, the financial statements include investments valued at approximately $3.8 billion (35 percent of net position) at December 31, 2018, whose fair values have been estimated by management in the absence of readily determinable market values. Management’s estimates are based on information provided by fund managers, general partners, etc. Our opinion is not modified with respect to this matter.

FINANCIAL2018 comprehensive annual financial report
14
To the Retirement Board Municipal Employees' Retirement System
of Michigan Required Supplemental Information
Accounting principles generally accepted in the United States of America require that the management's discussion and analysis and the other required supplemental information, as listed in the table of contents, be presented to supplement the basic financial statements. Such information, although not a part of the basic financial statements, is required by the Governmental Accounting Standards Board, which considers it to be an essential part of financial reporting for placing the basic financial statements in an appropriate operational, economic, or historical context. We have applied certain limited procedures to the required supplemental information in accordance with auditing standards generally accepted in the United States of America, which consisted of inquiries of management about the methods of preparing the information and comparing the information for consistency with management's responses to our inquiries, the basic financial statements, and other knowledge we obtained during our audit of the basic financial statements. We do not express an opinion or provide any assurance on the information because the limited procedures do not provide us with sufficient evidence to express an opinion or provide any assurance.
Other Information
Our audit was conducted for the purpose of forming an opinion on the financial statements that collectively comprise Municipal Employees' Retirement System of Michigan's basic financial statements. The schedule of administrative expenses, schedule of investment expenses, and schedule of payments to consultants and introductory, investments, actuarial, and statistical sections are presented for the purpose of additional analysis and are not a required part of the basic financial statements.
The schedule of administrative expenses, schedule of investment expenses, and schedule of payments to consultants are the responsibility of management and were derived from and relate directly to the underlying accounting and other records used to prepare the basic financial statements. Such information has been subjected to the auditing procedures applied in the audit of the basic financial statements and certain additional procedures, including comparing and reconciling such information directly to the underlying accounting and other records used to prepare the basic financial statements or to the basic financial statements themselves, and other additional procedures in accordance with auditing standards generally accepted in the United States of America. In our opinion, the schedule of administrative expenses, schedule of investment expenses, and schedule of payments to consultants are fairly stated in all material respects in relation to the basic financial statements as a whole.
The introductory, investments, actuarial, and statistical sections have not been subjected to the auditing procedures applied in the audit of the basic financial statements, and, accordingly, we do not express an opinion or provide any assurance on them.
Report on Summarized Comparative Information
We have previously audited Municipal Employees' Retirement System of Michigan's December 31, 2017 financial statements, and we expressed an unmodified audit opinion on those audited financial statements in our report dated May 15, 2018. In our opinion, the summarized comparative information presented herein as of and for the year ended December 31, 2017 is consistent, in all material respects, with the audited financial statements from which it has been derived.

FINANCIAL2018 comprehensive annual financial report
15
To the Retirement Board Municipal Employees' Retirement System
of Michigan Other Reporting Required by Government Auditing Standards
In accordance with Government Auditing Standards, we have also issued our report dated May 23, 2019 on our consideration of Municipal Employees' Retirement System of Michigan's internal control over financial reporting and on our tests of its compliance with certain provisions of laws, regulations, contracts, grant agreements, and other matters. The purpose of that report is to describe the scope of our testing of internal control over financial reporting and compliance and the results of that testing, and not to provide an opinion on the internal control over financial reporting or on compliance. That report is an integral part of an audit performed in accordance with Government Auditing Standards in considering Municipal Employees' Retirement System of Michigan's internal control over financial reporting and compliance.
May 23, 2019

FINANCIAL2018 comprehensive annual financial report
16
MANAGEMENT’S DISCUSSION AND ANALYSIS
This narrative overview and analysis of Municipal Employees’ Retirement System of Michigan’s
(MERS or System) financial condition for the year ended December 31, 2018 is presented in
conjunction with the Chief Executive Officer and Chief Financial Officer’s Letter of Transmittal.
The Financial Section is comprised of the Independent Auditor’s Report, Management’s
Discussion and Analysis, two basic financial statements with explanatory notes, three required
supplementary schedules with explanatory notes, and three supplementary expense schedules.
• Total fiduciary net position for the Defined Benefit Plan, Defined Contribution Plan, Health Care Savings Program, Retiree Health Funding Vehicle, 457 Program, Investment Services Program, and Individual Retirement Account Program decreased by 4%, primarily due to market decline for the year. MERS finished the year with $10.9 billion in net fiduciary position. MERS is proud to announce our newest product in 2018, the Individual Retirement Account that is open to MERS members and their spouses.
• Defined Benefit investment returns saw a loss of -3.64% net of investment expenses for the year. The 10-year return was 8.25% net of investment expenses, which is above the long-term target of MERS’ expected investment rate of return of 7.75%.
• Contribution revenue increased by 19% from $858 million in 2017 to $1 billion in 2018, the first time in history MERS’ employers exceeded $1 billion in contributions. This increase was largely due to an increase in employer voluntary contributions compared to the previous year.
• Total annual benefits, transfers, and withdrawals increased by $78 million for a total of $987 million up from $909 million in 2017.
• Administrative expenses declined slightly by $157 thousand and ended at $19.1 million while MERS continues to grow, adding new municipal programs. MERS has continued to keep costs down through the growth of our pool and strong ongoing budgeting and cost-control measures.
• Investment expenses also declined slightly by $20 thousand and remained level at $14 million. Most of these expenses are related to investment manager fees. The decrease in investment manager expense was partly due to bringing in additional assets to be managed in-house by MERS Office of Investments at a lower cost.
• The most recent MERS actuarial valuation, dated December 31, 2017, showed 427 of 727 Defined Benefit municipalities are funded 70% or better, with 69 municipalities over 100% funded.
• The difference between the MERS actuarial and fair value assets declined from last year, as the actuarial calculation for 2018 is 109.3% of the fair value of assets as calculated by the actuaries (the ratio was 101.1% as of December 31, 2017). Total Defined Benefit Plan actuarial assets and fair value of assets were valued at $9.8 billion and $9.0 billion respectively at December 31, 2018.
• As part of the MERS 2018 Strategic Plan, MERS invested $5.1 million in capital assets. This includes $4.1 millions for pension administration software and actuarial valuation software. The MERS investment in all capital assets is $18.2 million, net of accumulated depreciation, up from $15.9 million in 2017. MERS expects these software improvements will enhance participant access to retirement services and reduce administrative costs for employers.
FINANCIAL HIGHLIGHTS
The following financial highlights occurred during the year ended December 31, 2018:

FINANCIAL2018 comprehensive annual financial report
17
BASIC FINANCIAL STATEMENTSThis Management’s Discussion and Analysis is an introduction to the MERS basic financial reporting statements:
1. Statement of Fiduciary Net Position2. Statement of Changes in Fiduciary Net Position3. Notes to Basic Financial Statements
The “Comparison Statement of Fiduciary Net Position” and “Comparison Statement of Changes in Fiduciary Net Position” provide a comparative summary of the financial condition of the plan as a whole with the prior year results.
The “Statement of Fiduciary Net Position” and “Statement of Changes in Fiduciary Net Position” provide the current financial condition of each MERS product.
Required Supplemental Information
1. Schedule of Annual Money Weighted Rates of Return
2. Schedule of Employer Contributions
3. Schedule of Changes in Employer Net Pension Liability/(Asset) and Related Ratios
Supplementary Expense Schedules
1. Schedule of Administrative Expenses
2. Schedule of Investment Expenses
3. Schedule of Payments to Consultants
Comparison Statement of Fiduciary Net Position (Dollars in Thousands)
December 31,
2018
December 31,
2017 $ Increase (Decrease)
% Increase (Decrease)
Assets
Cash and Short-Term Investments $17,538 $12,766 $4,772 37%
Receivables 478,177 367,227 110,950 30%
Interfund Receivables 127 136 (9) -7%
Loans 6,161 5,774 387 7%
Investments, at fair value 10,833,075 11,315,059 (481,984) -4%
Invested Securities Lending Collateral 573,927 528,514 45,413 9%
Other Assets/Prepaids 4,320 695 3,625 522%
Net Capital Assets 18,246 15,913 2,333 15%
Total Assets 11,931,570 12,246,084 (314,514) -3%
Deferred Outflow of Resources
Outflows Related to Pension 3,571 4,288 (717) -17%
Liabilities
Purchase of Investments 438,629 324,919 113,710 35%
Securities Lending Collateral 573,997 528,610 45,387 9%
Administrative/Investment Costs/Reserves 10,359 8,633 1,726 20%
Interfund Payables 127 136 (9) -7%
Total Liabilities 1,023,112 862,298 160,814 19%
Deferred Inflow of Resources
Inflows Related to Pension 717 717
Net Position Restricted for Pension and Health Benefits and Investment Accounts
Held for Others $10,911,312 $11,388,074 $(476,762) -4%
The expense schedules summarize all expenses associated with administering all MERS’ programs.

FINANCIAL2018 comprehensive annual financial report
18
December 31, 2018
December 31, 2017
$ Increase (Decrease)
% Increase/ Decrease
Additions
Contributions/Transfers in $1,024,586 $858,228 $166,358 19%
Investment Net Income (Loss) Investing Activities (498,201) 1,404,789 (1,902,990) -135%
Investment Net Income-Securities Lending 3,152 3,663 (511) -14%
Miscellaneous Income 221 55 166 302%
Total Additions 529,758 2,266,735 (1,736,977) -77%
Deductions
Benefits/Transfers and Withdrawals 987,449 909,116 78,333 9%
Forfeitures, Miscellaneous 6 15 (9) 100%
Special Litigation Expense 4,250 (4,250) 100%
Administrative Expense 19,065 19,222 (157) -1%
Total Distributions 1,006,520 932,603 73,917 8%
Net Increase/Decrease (476,762) 1,334,132 (1,810,894) -136%
Net Position-Restricted for Pension and Health Benefits and Investment Accounts Held for Others
Balance Beginning of Year 11,388,074 10,053,942 1,334,132 13%
Balance End of Year $10,911,312 $11,388,074 $(476,762) -4%
Comparison Statement of Changes in Fiduciary Net Position (Dollars in Thousands)
FINANCIAL2018 comprehensive annual financial report
19
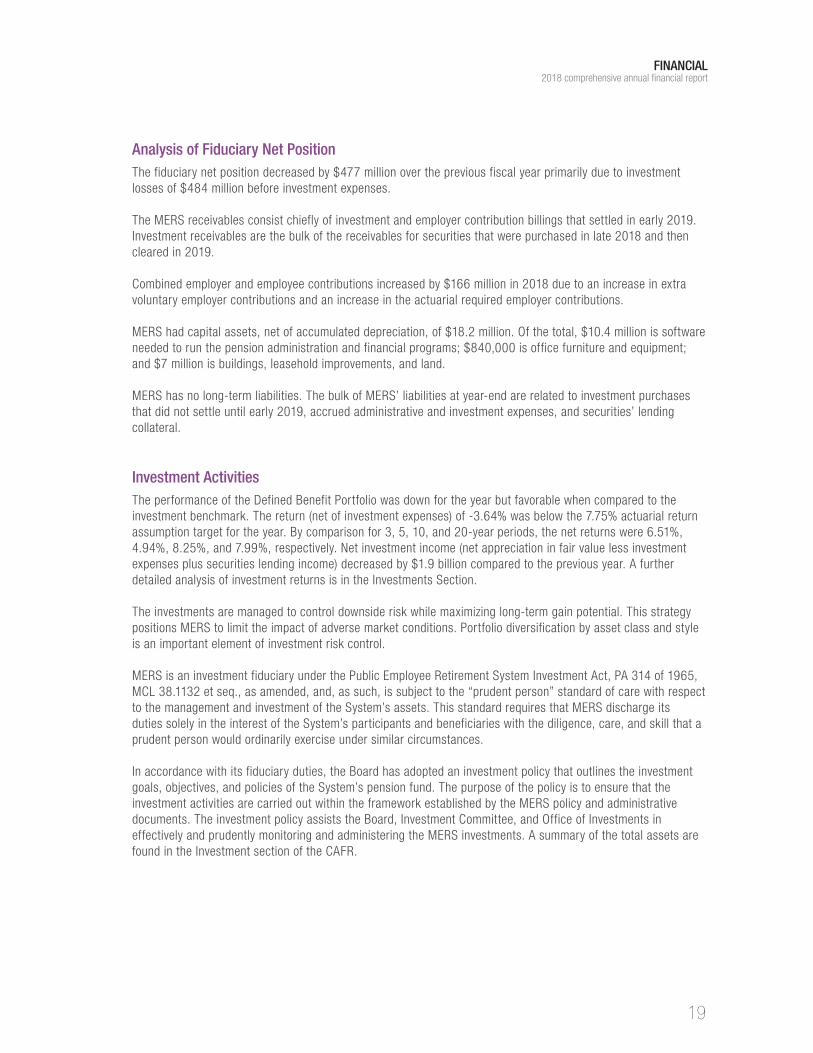
Analysis of Fiduciary Net PositionThe fiduciary net position decreased by $477 million over the previous fiscal year primarily due to investment losses of $484 million before investment expenses.
The MERS receivables consist chiefly of investment and employer contribution billings that settled in early 2019. Investment receivables are the bulk of the receivables for securities that were purchased in late 2018 and then cleared in 2019.
Combined employer and employee contributions increased by $166 million in 2018 due to an increase in extra voluntary employer contributions and an increase in the actuarial required employer contributions.
MERS had capital assets, net of accumulated depreciation, of $18.2 million. Of the total, $10.4 million is software needed to run the pension administration and financial programs; $840,000 is office furniture and equipment; and $7 million is buildings, leasehold improvements, and land.
MERS has no long-term liabilities. The bulk of MERS’ liabilities at year-end are related to investment purchases that did not settle until early 2019, accrued administrative and investment expenses, and securities’ lending collateral.
Investment ActivitiesThe performance of the Defined Benefit Portfolio was down for the year but favorable when compared to the investment benchmark. The return (net of investment expenses) of -3.64% was below the 7.75% actuarial return assumption target for the year. By comparison for 3, 5, 10, and 20-year periods, the net returns were 6.51%, 4.94%, 8.25%, and 7.99%, respectively. Net investment income (net appreciation in fair value less investment expenses plus securities lending income) decreased by $1.9 billion compared to the previous year. A further detailed analysis of investment returns is in the Investments Section.
The investments are managed to control downside risk while maximizing long-term gain potential. This strategy positions MERS to limit the impact of adverse market conditions. Portfolio diversification by asset class and style is an important element of investment risk control.
MERS is an investment fiduciary under the Public Employee Retirement System Investment Act, PA 314 of 1965, MCL 38.1132 et seq., as amended, and, as such, is subject to the “prudent person” standard of care with respect to the management and investment of the System’s assets. This standard requires that MERS discharge its duties solely in the interest of the System’s participants and beneficiaries with the diligence, care, and skill that a prudent person would ordinarily exercise under similar circumstances.
In accordance with its fiduciary duties, the Board has adopted an investment policy that outlines the investment goals, objectives, and policies of the System’s pension fund. The purpose of the policy is to ensure that the investment activities are carried out within the framework established by the MERS policy and administrative documents. The investment policy assists the Board, Investment Committee, and Office of Investments in effectively and prudently monitoring and administering the MERS investments. A summary of the total assets are found in the Investment section of the CAFR.

FINANCIAL2018 comprehensive annual financial report
20
Funding StatusA pension plan is well funded when it has sufficient assets invested to meet all expected future obligations to participants. The greater the level of funding — the larger the ratio of assets to actuarial accrued liability. While some municipalities are not fully funded, annual contributions are made at an actuarially determined rate to reach full funding over a fixed period of years. There is no single all-encompassing test for measuring a retirement system’s funding progress and current funded status. However, some common indicators that a retirement system has achieved progress in funding its obligations include: observing the changes over time of the ratio of valuation assets to actuarial accrued liabilities and the pattern of the unfunded actuarial accrued liability as a percentage of active payroll.
The Board has adopted a funding policy for MERS to achieve the following major objectives:
• Adequacy
• Inter-Period Equity (in particular intergenerational equity) and Transparency
• Contribution Stability and Governance
The actuarial method for calculating the accrued liability for all plans is entry age normal with the objective of maintaining employer contributions approximately level as a percentage of member payroll. A detailed discussion of the funding method is in the Actuarial Section.
MERS is an agent multiple-employer retirement system that pools assets of the participating employers for investment purposes, but maintains separate trusts for each individual employer. For this reason, MERS does not have a “funded status;” rather, each municipality has its own funded level. Each municipality is responsible for its own plan liabilities; a municipality cannot borrow from another municipality’s account to pay for pension expenses. A measure of a municipality’s funding progress is the ratio of its actuarial assets to actuarial accrued liabilities.
The most recent MERS actuarial valuation is as of December 31, 2017. On that date, of all 727 Defined Benefit and Hybrid municipalities, 427 municipalities in MERS are funded at 70% or higher (58.7% of all Defined Benefit and Hybrid municipalities) and 69 municipalities (9.5% of all Defined Benefit and Hybrid municipalities) are funded at 100% or more. The average funded percentage was 76% in 2017, up 2% from 2016.
MERS partners with our local governments to achieve the following:
• Determine the best retirement fit for each municipality
• Offer cost-reducing strategies
• Provide fiscal best practices
The difference between MERS’ actuarial and fair value of assets widened in 2018. The 2018 end of the year actuarial calculation of assets is 109.3% of the fair value of assets compared to 101.1% as of December 31, 2017. Ideally, the differences between actuarial value and fair value of assets should be small. The higher actuarial value of assets reflects smoothing losses of the 2008 downturn, and lower investment returns than the MERS expected rate of return of 7.75%. If investment returns are higher in the next few years than the MERS expected rate of return, the difference will continue to narrow between the actuarial and fair values.

FINANCIAL2018 comprehensive annual financial report
21
Distribution of Funded Percentage of Actuarial Accrued Liability among the 727 participating municipalities as of December 31, 2017, and the 720 participating municipalities as of December 31, 2016
180
160
140
120
100
80
60
40
20
0Under 50% 50 - 59% 60 - 69% 70-79% 80-89% 90-99%
2016
2017
2017
2017
2017
2016
2017
2017
2016
2016
2016
2016
2016
2016
Num
ber o
f Mun
icip
aliti
es (E
xclu
des
15 c
lose
d m
unic
ipal
ities
)
100% or more

FINANCIAL2018 comprehensive annual financial report
22
Statement of Fiduciary Net Position as of December 31, 2018 (Dollars in Thousands)
Defined Benefit
Defined Contribution
Health Care Savings Plan 457 Program
Individual Retirement
AccountRetiree Health
Funding Vehicle
Investment Services Program
As of December 31, 2018
As of December 31, 2017
Assets
Cash and Short-Term Investments $17,913 $17,913 $12,766
Receivables
Employer and Member Contributions 38,846 $262 $131 $39 $75 39,353 42,631
Sale of Investments 366,920 8,413 7,499 1,097 37,833 $2,483 424,245 310,601
Investment Income 12,609 288 257 38 1,300 85 14,577 13,285
Loans 5,824 337 6,161 5,774
Interfund Receivables 127 127 136
Other 3,809 3,809 710
Total Receivables/Loans/Other 422,311 14,787 7,887 1,511 0 39,208 2,568 488,272 373,137
Global Equities 4,393,363 100,728 89,793 13,129 6 453,002 29,733 5,079,754 6,199,488
Global Fixed Income 2,560,455 58,706 52,332 7,652 3 264,009 17,329 2,960,486 2,581,320
Real Assets 1,013,514 23,237 20,714 3,029 1 104,504 6,859 1,171,858 1,026,048
Diversifying Strategies 924,609 21,199 18,897 2,763 1 95,337 6,258 1,069,064 993,646
Land 1,402 1,402
Mutual Funds 447,073 15,675 83,697 35 546,480 510,905
Self Directed Accounts 3,614 417 4,031 3,652
Investments, at Fair Value 8,893,343 654,557 197,411 110,687 46 916,852 60,179 10,833,075 11,315,059
Invested Securities Lending Collateral 496,376 11,381 10,145 1,483 1 51,182 3,359 573,927 528,514
Prepaid Expenses 513 513 695
Capital Assets, at cost, net of accumulated depreciation 18,246 18,246 15,913
Total Assets 9,848,702 680,725 215,443 113,681 47 1,007,242 66,106 11,931,945 12,246,084
Deferred Outflow of Resources
Outflows related to pension 3,571 3,571 4,288
Liabilities
Purchase of Investments 379,685 8,705 7,760 1,135 39,149 2,569 439,004 324,919
Securities Lending Collateral 496,437 11,382 10,146 1,484 1 51,188 3,360 573,997 528,610
Reserves and Forfeitures 2,230 2,230 2,629
Administrative and Investment Costs 8,129 8,129 6,004
Interfund Payables 47 42 6 30 2 127 136
Total Liabilities 884,251 20,134 17,948 4,855 1 90,367 5,931 1,023,487 862,298
Deferred Inflow of Resources
Inflows related to pension 717 717
Net Position-Restricted for Pension and Health Benefits and Investment Accounts
Held for Others $8,967,305 $660,591 $197,495 $108,826 $46 $916,874 $60,175 $10,911,312 $11,388,074
The accompanying notes are an integral part of these Financial Statements.

FINANCIAL2018 comprehensive annual financial report
23
Defined Benefit
Defined Contribution
Health Care Savings Plan 457 Program
Individual Retirement
AccountRetiree Health
Funding Vehicle
Investment Services Program
As of December 31, 2018
As of December 31, 2017
Assets
Cash and Short-Term Investments $17,913 $17,913 $12,766
Receivables
Employer and Member Contributions 38,846 $262 $131 $39 $75 39,353 42,631
Sale of Investments 366,920 8,413 7,499 1,097 37,833 $2,483 424,245 310,601
Investment Income 12,609 288 257 38 1,300 85 14,577 13,285
Loans 5,824 337 6,161 5,774
Interfund Receivables 127 127 136
Other 3,809 3,809 710
Total Receivables/Loans/Other 422,311 14,787 7,887 1,511 0 39,208 2,568 488,272 373,137
Global Equities 4,393,363 100,728 89,793 13,129 6 453,002 29,733 5,079,754 6,199,488
Global Fixed Income 2,560,455 58,706 52,332 7,652 3 264,009 17,329 2,960,486 2,581,320
Real Assets 1,013,514 23,237 20,714 3,029 1 104,504 6,859 1,171,858 1,026,048
Diversifying Strategies 924,609 21,199 18,897 2,763 1 95,337 6,258 1,069,064 993,646
Land 1,402 1,402
Mutual Funds 447,073 15,675 83,697 35 546,480 510,905
Self Directed Accounts 3,614 417 4,031 3,652
Investments, at Fair Value 8,893,343 654,557 197,411 110,687 46 916,852 60,179 10,833,075 11,315,059
Invested Securities Lending Collateral 496,376 11,381 10,145 1,483 1 51,182 3,359 573,927 528,514
Prepaid Expenses 513 513 695
Capital Assets, at cost, net of accumulated depreciation 18,246 18,246 15,913
Total Assets 9,848,702 680,725 215,443 113,681 47 1,007,242 66,106 11,931,945 12,246,084
Deferred Outflow of Resources
Outflows related to pension 3,571 3,571 4,288
Liabilities
Purchase of Investments 379,685 8,705 7,760 1,135 39,149 2,569 439,004 324,919
Securities Lending Collateral 496,437 11,382 10,146 1,484 1 51,188 3,360 573,997 528,610
Reserves and Forfeitures 2,230 2,230 2,629
Administrative and Investment Costs 8,129 8,129 6,004
Interfund Payables 47 42 6 30 2 127 136
Total Liabilities 884,251 20,134 17,948 4,855 1 90,367 5,931 1,023,487 862,298
Deferred Inflow of Resources
Inflows related to pension 717 717
Net Position-Restricted for Pension and Health Benefits and Investment Accounts
Held for Others $8,967,305 $660,591 $197,495 $108,826 $46 $916,874 $60,175 $10,911,312 $11,388,074

FINANCIAL2018 comprehensive annual financial report
24
Statement of Changes in Fiduciary Net Position for the Year Ended December 31, 2018 (Dollars in Thousands)
The accompanying notes are an integral part of these Financial Statements.
Defined Benefit Defined Contribution
Health Care Savings Plan 457 Program
Individual Retirement
AccountRetiree Health
Funding Vehicle
Investment Services Program December 31, 2018 December 31, 2017
Additions
Contributions and Transfers In
Employer Contributions and Other $707,958 $49,077 $27,846 $1,048 $88,650 $874,579 $725,211
Plan Member Contributions 87,739 25,412 36,803 $53 150,007 133,017
Total Contributions and Transfers In 795,697 74,489 27,846 37,851 53 88,650 1,024,586 858,228
Net Appreciation/Depreciation in Fair Value (504,838) (43,777) (9,144) (8,070) (2) (54,298) $(2,806) (622,934) 1,297,259
Interest and Dividend Income 120,021 2,752 2,453 359 12,375 812 138,772 121,589
Subtotal of Investment Income/(Loss) (384,817) (41,025) (6,691) (7,711) (2) (41,923) (1,994) (484,162) 1,418,848
Less Investment Expense 12,648 204 182 27 918 60 14,039 14,059
Net Investment Income/(Loss) Before Securities Lending Activities (397,465) (41,229) (6,873) (7,737) (2) (42,841) (2,054) (498,202) 1,404,789
Security Lending Activities
Security Lending Income 15,606 358 319 47 1,609 106 18,044 10,749
Security Lending Expenses
Borrower Rebates 12,197 280 249 37 1,258 83 14,103 6,170
Management Fees 682 16 14 2 70 5 788 916
Total Securities Lending Expenses 12,879 296 263 39 1,328 87 14,892 7,086
Net Income from Security Lending Activities 2,727 62 56 8 281 19 3,152 3,663
Total Net Investment Income/(Loss) (394,738) (41,167) (6,817) (7,729) (2) (42,560) (2,036) (495,049) 1,408,452
Miscellaneous Income 221 221 55
Total Additions 401,180 33,322 21,029 30,121 51 46,090 (2,036) 529,758 2,266,735
Deductions
Benefits/Transfers and Withdrawals 892,530 39,015 5,954 4,386 5 35,004 10,554 987,448 909,116
Forfeitures, and Other Miscellaneous 6 6 15
Special Litigation Expense 4,250
Administrative Expenses 17,463 555 168 93 731 55 19,065 19,222
Total Deductions 909,999 39,570 6,123 4,479 5 35,735 10,609 1,006,519 932,603
Net Increase/Decrease (508,819) (6,248) 14,906 25,642 46 10,355 (12,644) (476,761) 1,334,132
Net Position-Restricted for Pension and Health Benefits and Investment Accounts Held for Others
Balance Beginning of Fiscal Period 9,476,123 666,839 182,589 83,184 906,519 72,819 11,388,074 10,053,942
Balance End of Fiscal Period $8,967,305 $660,591 $197,495 $108,826 $46 $916,874 $60,175 $10,911,312 $11,388,074

FINANCIAL2018 comprehensive annual financial report
25
Defined Benefit Defined Contribution
Health Care Savings Plan 457 Program
Individual Retirement
AccountRetiree Health
Funding Vehicle
Investment Services Program December 31, 2018 December 31, 2017
Additions
Contributions and Transfers In
Employer Contributions and Other $707,958 $49,077 $27,846 $1,048 $88,650 $874,579 $725,211
Plan Member Contributions 87,739 25,412 36,803 $53 150,007 133,017
Total Contributions and Transfers In 795,697 74,489 27,846 37,851 53 88,650 1,024,586 858,228
Net Appreciation/Depreciation in Fair Value (504,838) (43,777) (9,144) (8,070) (2) (54,298) $(2,806) (622,934) 1,297,259
Interest and Dividend Income 120,021 2,752 2,453 359 12,375 812 138,772 121,589
Subtotal of Investment Income/(Loss) (384,817) (41,025) (6,691) (7,711) (2) (41,923) (1,994) (484,162) 1,418,848
Less Investment Expense 12,648 204 182 27 918 60 14,039 14,059
Net Investment Income/(Loss) Before Securities Lending Activities (397,465) (41,229) (6,873) (7,737) (2) (42,841) (2,054) (498,202) 1,404,789
Security Lending Activities
Security Lending Income 15,606 358 319 47 1,609 106 18,044 10,749
Security Lending Expenses
Borrower Rebates 12,197 280 249 37 1,258 83 14,103 6,170
Management Fees 682 16 14 2 70 5 788 916
Total Securities Lending Expenses 12,879 296 263 39 1,328 87 14,892 7,086
Net Income from Security Lending Activities 2,727 62 56 8 281 19 3,152 3,663
Total Net Investment Income/(Loss) (394,738) (41,167) (6,817) (7,729) (2) (42,560) (2,036) (495,049) 1,408,452
Miscellaneous Income 221 221 55
Total Additions 401,180 33,322 21,029 30,121 51 46,090 (2,036) 529,758 2,266,735
Deductions
Benefits/Transfers and Withdrawals 892,530 39,015 5,954 4,386 5 35,004 10,554 987,448 909,116
Forfeitures, and Other Miscellaneous 6 6 15
Special Litigation Expense 4,250
Administrative Expenses 17,463 555 168 93 731 55 19,065 19,222
Total Deductions 909,999 39,570 6,123 4,479 5 35,735 10,609 1,006,519 932,603
Net Increase/Decrease (508,819) (6,248) 14,906 25,642 46 10,355 (12,644) (476,761) 1,334,132
Net Position-Restricted for Pension and Health Benefits and Investment Accounts Held for Others
Balance Beginning of Fiscal Period 9,476,123 666,839 182,589 83,184 906,519 72,819 11,388,074 10,053,942
Balance End of Fiscal Period $8,967,305 $660,591 $197,495 $108,826 $46 $916,874 $60,175 $10,911,312 $11,388,074

FINANCIAL2018 comprehensive annual financial report
26
NOTES TO BASIC FINANCIAL STATEMENTSYear ended December 31, 2018
1. REPORTING ENTITY AND PLAN DESCRIPTIONMERS is a statutory public corporation and governmental pension plan qualified under Section 401(a) of the Internal Revenue Code, independent from the State of Michigan, which was established to provide a pooled program for retirement, survivor and disability benefits on a voluntary basis to the State of Michigan’s municipal employees. MERS has helped provide retirement plans for municipal employees for over 70 years.
MERS was established by the Michigan Legislature under Public Act 135 of 1945. This act was repealed and replaced by the successor Municipal Employees’ Retirement Act of 1984 (PA 427), as last amended by 2004 PA 490 (MERS Act). On August 15, 1996, pursuant to 1996 PA 220, MERS became independent from the State of Michigan.
Since 1996, MERS is solely administered by a nine-member retirement board (Board). The Board consists of the following members, each of whom, except for the retiree member and the Board appointees, shall be from a different county at the time of election:
• Two members, appointed by the Board, who have knowledge or experience in retirement systems, administration of retirement systems, investment management, or advisory services
• One member, a retiree of the System, is appointed by the Board
• Three members of the System, officers of a participating municipality or of a participating court, who are elected as Officer Board members by the delegates at the MERS Annual Conference
• Three employee members of the System, who are not officers of a participating municipality or of a participating court, who are elected as Employee Board members by the delegates at the MERS Annual Conference
The regular term of office for members of the Board is three years. Members of the Board serve without compensation with respect to their duties, but are reimbursed by the System for their actual and necessary expenses incurred in the performance of their duties.
The Board establishes in its Plan Document the benefit plans and provisions that are available for adoption. The local municipality’s governing body adopts all benefits of the plan. The various plans are discussed in the Actuarial Section. Pursuant to Article 9, Section 24 of the Constitution of the State of Michigan: “The accrued financial benefits of each pension plan and retirement system of the state and its political subdivisions shall be a contractual obligation thereof which shall not be diminished or impaired thereby. Financial benefits arising on account of service rendered in each fiscal year shall be funded during that year and such funding shall not be used for financing unfunded accrued liabilities.”
MERS is an agent multiple-employer retirement system that pools assets of the participating employers for investment purposes, but maintains separate accounts for each individual employer.
Employee contribution rates vary depending on the benefit plan adopted by the local government. If an employee leaves employment or dies before becoming eligible for retirement benefits, accumulated employee contributions (plus interest) are refunded to the employee or designated beneficiary upon application.
The Internal Revenue Service (IRS) has determined that MERS’ Defined Benefit, Defined Contribution and Hybrid Plans are governmental plans that are tax-qualified trusts under Internal Revenue Code (the Code or IRC) Section 401(a) and tax exempt under Section 501(a). The IRS issued the most recent Letter of Favorable Determination for MERS on October 18, 2016. The benefits of tax-qualified status include the preferential deferred taxability of contributions, accumulated earnings, pensions, rollovers, annual compensation limits, and benefit limitations.
Under the Code, the retiree’s pension becomes subject to taxation upon periodic distribution unless the distribution is “rolled over” if permitted by law. Pursuant to IRC Section 72(d), any “after tax contributions” are recovered tax-free over the life expectancy of the retiree (or beneficiary, if applicable).

FINANCIAL2018 comprehensive annual financial report
27
IRC Section 401(a)(17) limits the amount of compensation that can be taken into account for benefit calculation purposes and, correspondingly, limits the amount of employer and employee contributions. Compensation in excess of the limit ($275,000 and $280,000 for 2018 and 2019 respectively) will not be included by MERS in any benefit determination. Employee contributions in excess of the limit will not be collected or accepted, nor included in final average compensation for benefit purposes.
In addition, IRC Section 415(b)(1)(A) imposes certain limitations on pension benefit payments from the MERS qualified trust. Any amounts that exceed the limitations shall be paid from a Qualified Excess Benefit Arrangement (QEBA), as authorized by IRC Section 415(m) and the Michigan Public Employee Benefit Protection Act, MCL 38.1686 (2002 PA 100). The QEBA is a separate plan, and is annually cash funded by the affected participating municipality or court. The Board established the MERS QEBA in 2003 solely for the purpose of providing retirees and beneficiaries that portion of the retirement allowance exceeding the Section 415 limits, which is otherwise not payable by the trust under the terms of the MERS qualified plan. The IRS approval of the QEBA was pursuant to Private Letter Ruling issued December 15, 2003. Retirees and beneficiaries do not have an election, directly or indirectly, to defer compensation to the QEBA.
The MERS Defined Contribution Plan became operative July 8, 1997, under Section 401(a) of the IRC. On this date, the MERS Plan Document of 1996 was first determined by the IRS Letter of Favorable Determination to meet qualifications as a “governmental plan” trust under Code Section 401(a), and tax exempt under Section 501(a). MERS has contracted with a third party administrator for recordkeeping and administrative functions. The plan is available to all MERS participating municipalities and may be adopted on a division-by-division basis. Plan provisions and requirements are specified in the MERS Plan Document. MERS Defined Contribution Plan provides participants with an account they manage. At retirement, benefits are based solely on the amount contributed by the participant and employer and the performance of investments. IRC Section 415(c) imposes certain limitations on the annual additions that can be accepted by the MERS qualified trust (for 2018, the limit was the lesser of $55,000 or 100% of compensation). The plan has several strategic investment categories designed to help participants meet their retirement goals. All participants have access to the MERS streamlined investment menu that allows for simple and strategic investing.
The MERS Hybrid Plan is an option for municipalities that includes both a defined benefit and a defined contribution component. The defined benefit component (Part I) is employer funded, with benefit multipliers of 1.0, 1.25, and 1.5%. The defined contribution component (Part II) is a combination of employer and participant contributions that are invested in mutual funds selected by the individual participant. On the financial statements, the Hybrid Plan is reflected in both Defined Benefit and Defined Contribution columns.
MERS received a Private Letter Ruling dated January 13, 2004, allowing the establishment of an IRC Section 115 Integral Governmental Trust, giving MERS the ability to create two programs – the Health Care Savings Program and the Retiree Health Funding Vehicle.
The MERS Health Care Savings Program became operational in June 2004 and was made available to all municipalities in Michigan. The employer-sponsored program provides medical reimbursement accounts to participants. Medical expenses are reimbursed, as defined in Code Section 213, once participants terminate employment, are on medical leave for six months or longer, or are on disability from any public pension plan.
There are four types of contributions that may be used in the program: 1) Basic Employer (tax-favored); 2) Mandatory Salary Reductions (tax-favored); 3) Mandatory Leave Conversions (tax-favored); and 4) Voluntary Employee Contributions (post-tax).
As a result of the Private Letter Ruling and Code Sections 106 and 213, reimbursements for medical expenses are tax-exempt for the participant, their spouse, and/or Code Section 152 dependent(s). The Health Care Savings Program accounts are invested in the MERS Investment Menu, and earnings are tax exempt as a result of the MERS Private Letter Ruling. Plan provisions and requirements are specified in the MERS Health Care Savings Program and Retiree Health Funding Vehicle Plan Document and Trust.
The MERS Retiree Health Funding Vehicle became operational in the fall of 2004, and was made available to all municipalities in Michigan. Participating municipalities can contribute monies to the Trust as desired and

FINANCIAL2018 comprehensive annual financial report
28
no contribution method is imposed. These funds constitute a health care fund, which enable municipalities to accumulate monies to provide or subsidize health benefits for retirees and beneficiaries. MERS does not provide benefits, only the funding vehicle for local governments. The Retiree Health Funding Vehicle accounts are invested in the MERS portfolio choices and earnings are tax exempt as a result of the MERS Private Letter Ruling. Plan provisions and requirements are specified in the MERS Health Care Savings Program and Retiree Health Funding Vehicle Plan Document and Trust.
The MERS 457(b) Deferred Compensation Program was established as a deferred compensation plan and trust and became operational November 8, 2011. Its purpose is to provide benefits under the Program to participants and beneficiaries upon retirement, termination, disability, or death, upon the terms and conditions, and subject to the limitations contained in the Program. The Program was created for the exclusive benefit of eligible participants and their beneficiaries of any employer electing to participate in the Program. The Program is intended to comply with Code Section 457(b). All assets held in connection with the Program, including all contributions and amounts of compensation deferred pursuant to the Program, all property and rights acquired or purchased with such amounts, and all income attributable to such amounts, property, or rights shall be held in trust for the exclusive benefit of participants and their beneficiaries under the Program. No part of the assets and income shall be used for, or diverted to, purposes other than for the exclusive benefit of participants and their beneficiaries and for defraying reasonable expenses of the Program.
The Investment Services Program is an investment trust fund that is available to all municipalities in Michigan to invest funds through the MERS portfolio while maintaining administrative functions at the municipal level. The program was established by the Board in March 2006 and began operations in June 2006. The Investment Services Program trust fund complies with all the requirements imposed by the Public Employee Retirement System Investment Act, 1965 PA 314. Like the other non-retirement plans, participation in the Investment Services Program alone does not qualify as membership in MERS, and the participating employer that does not otherwise participate in MERS’ 401(a) plan does not have a vote at the MERS Annual Conference.
The MERS deemed Individual Retirement Account (IRA) was established in 2018 and is a tax-advantaged retirement account for the exclusive benefit of current and former employees of MERS-partnered municipalities and their spouses. MERS offers two types of IRAs: A Roth IRA that provides tax-free income in retirement and a traditional IRA that allows tax-deductible contributions now. Both allow the participant to withdraw money at any time, without penalty, for qualified expenses including education expenses, buying a first home, and some medical expenses.
Through The Standard Insurance Company, MERS offers quality group life and disability insurance to Michigan municipalities. This group buying program offers comprehensive benefit features, a variety of plan designs, and family-friendly provisions at an affordable cost. The Standard Insurance Company fully administers the plan and MERS does not have any financial liability for the arrangement. In exchange for offering the group buying, MERS receives a small reimbursement that is reported in the service fee line item of the Defined Benefit administrative expenses.
MERS partners with the Mercer Marketplace 365 to offer a private health care exchange for eligible members. A private exchange is a marketplace where retirees can purchase benefits from the carrier of their choice with a wide variety of coverage options for pre-65 and Medicare-eligible retirees. Participants may use their MERS Health Care Savings Program funds for insurance premiums, co-payments, deductibles, etc., paid to providers available on the Exchange. The individual HCSP account would reflect any reimbursement for eligible expenses from HCSP as a distribution. As part of its collaboration agreement, MERS receives a quarterly reimbursement from Mercer to promote this partnership that is reported in the service fee line item of the Defined Benefit administrative expenses. Employers who partner with Mercer to manage their retiree group health plan receive a reimbursement for their retiree member list.
Any “municipality” (a term defined by Section 2b (2) of the MERS Act, MCL 38.1502b(2)) within the state may elect to become a participating member of MERS by a majority vote of the municipality’s governing body or by an affirmative vote of the qualified electors. Changes in retirement plan coverage are subject to approval by a majority vote of the municipality’s governing body.

FINANCIAL2018 comprehensive annual financial report
29
Defined Benefit
Defined Contribution Hybrid
Health Care Savings Program 457
Health Exchange IRA
Active 31,010 13,195 3,199 16,971 4,962 104 6
Deferred 9,223 NA 233 NA NA NA NA
Retired 40,972 NA 95 NA NA NA NA
Contributions not Vested 12,884 NA 8 NA NA NA NA
Terminated NA 6,021 NA 6,091 733 NA NA
Product Totals 94,089 19,216 3,535 23,062 5,695 104 6
Total MERS Accounts* 145,707
MERS Participating Municipalities as of December 31, 2018
Note: There are 929 different municipalities
that make up the 2,366 programs, as many
municipalities have more than 1 product.
746Defined Benefit
379Defined
Contribution
160Group Life
and Disability
90Hybrid
446457 Program
195Retiree Health
Funding Vehicle
342Health Care
Savings Program
5Investment Services Program
3Health
Exchange
929Different
Municipalities
2,366Programs
* Total MERS Accounts represents the total number of accounts within MERS; individuals may be represented multiple times across categories.
MERS Participants as of December 31, 2018

FINANCIAL2018 comprehensive annual financial report
30
2. SUMMARY OF SIGNIFICANT ACCOUNTING POLICIES
Reporting EntityThe Board is responsible for the administration of the System, has fiduciary responsibility for the investment of assets, and oversees all funds included in these financial statements. The Board appoints the Chief Executive Officer who manages and administers the System under the supervision and direction of the Board.
MERS financial statements are not included in the financial statements of any other organization.
Blended Component UnitsMERS Real Estate Corporation (MREC) is governed by a three-member board appointed by MERS as the sole member. Although it is legally separate from MERS, MREC is reported as if it were part of MERS because it is solely owned by MERS to function as a real estate holding company for the properties occupied by MERS.
Cost AllocationThe costs of administering the MERS Defined Benefit Plan are allocated proportionally based on the average daily balance asset size to the municipalities along with investment gains/losses on a quarterly basis.
The costs of administering the MERS Defined Contribution Plan, Health Care Savings Program, Retiree Health Funding Vehicle, Investment Services Program, and IRAs are allocated out to the employers and participants based on an administrative expense percentage for each employer and participant as well as their investment expenses based on fund choices.
Basis of AccountingThe financial statements for MERS are prepared on an accrual basis in accordance with Generally Accepted Accounting Principles (GAAP) as applicable to government organizations in the U.S. The preparation of financial statements, in conformity with GAAP, requires management to make estimates and assumptions that affect the reported amounts of assets and liabilities, disclosure of contingent assets and liabilities at the date of the financial statements, and the reported amounts of revenues and expenses during the reporting period. Actual results could differ from these estimates.
MERS Defined Benefit Plan employer and employee contributions are recognized when due pursuant to legal, statutory, and contractual requirements. Benefits and refunds are recognized when due and payable in accordance with the terms of the Plan. Expenses and the associated liabilities for those expenses are also recorded using the accrual method when the liability is incurred.
The Defined Contribution Plan, 457 Program, Health Care Savings Program, Retiree Health Funding Vehicle, Investment Services Program, and IRA financial statements are prepared using the accrual accounting method for revenues which are recorded when either payroll reports and/or funds are received. Expenses and the associated liabilities for those expenses are also recorded using the accrual method when the liability is incurred.
Plan investments are presented at fair value using the accrual method for those investments which are invested in the MERS portfolio. Investment purchases, sales, and associated payables and receivables are recorded on their trade date. Investments invested outside of the MERS portfolio (primarily mutual funds) are recorded at fair value.
Post-Employment BenefitsMERS does not provide other post-employment benefits to its employees and accordingly does not have any expense or liabilities for these benefits.

FINANCIAL2018 comprehensive annual financial report
31
Capital Assets Buildings LandLeasehold
ImprovementsOffice Furniture and Equipment Software
Total Capital Assets
Balances Dec 31, 2017 $6,504,700 $1,266,516 $155,811 $3,271,708 $16,737,712 $27,936,447
Additions 112,515 201,904 399,578 4,399,589 5,113,587
Deletions and Transfers (6,207) (6,207)
Balances Dec 31, 2018 6,617,215 1,266,516 357,715 3,665,080 21,137,301 33,043,827
Accumulated Depreciation
Balances Dec 31, 2017 810,503 87,954 2,466,153 8,658,783 12,023,393
Depreciation Expense 259,770 44,905 363,821 2,112,349 2,780,845
Deletions and Transfers (6,207) (6,207)
Balances Dec 31, 2018 1,070,274 132,859 2,823,767 10,771,132 14,798,031
Net Capital Assets Dec 31, 2018 $5,546,941 $1,266,516 $224,857 $841,313 $10,366,169 $18,245,796
Fair Value of InvestmentsPlan investments are presented at fair value. Short-term investments are valued at cost plus accrued interest, which approximates fair value. Securities traded on a national or international exchange are valued at the last reported sales price at current exchange rates. Corporate bonds not traded on a national or international exchange are based upon equivalent values of comparable securities with similar yield and risk. Independent appraisals are the basis for valuing the fair value of real estate. Other investments that do not have established markets are recorded at an estimated fair value. Real estate and private equity investments typically have a quarter lag in reporting, but the values as of December 31 are estimated based on the third quarter capital statements plus fourth quarter cash flows, adjusted for any other known events.
Investment Act DisclosuresThe Public Employee Retirement System Investment Act, MCL 38.1132, et seq., 1965 PA 314 requires MERS to follow certain financial management practices and provide related disclosures, and to provide a summary annual report, as defined by Act 314. Compliance with these requirements is achieved in this CAFR, in our Summary Report, and Consolidated Annual Actuarial Valuation found at www.mersofmich.com. MERS limits board member professional training, education, and travel expenses in compliance with MCL 38.1133(6) and is reported in the Schedule of Administrative Expenses.
Capital AssetsCapital assets represent land, buildings, office furniture, equipment, and software with a value of $5,000 or more. Assets are carried at cost, less accumulated depreciation. Depreciation expense is calculated by allocating the net cost of assets over their estimated useful lives using the straight-line method. Useful lives of the related assets vary from 3 to 30 years.
Capital Assets
FINANCIAL2018 comprehensive annual financial report
32
Total Columns on StatementsThe “Total” columns on the “Statement of Plan Net Position” and “Statement of Changes in Plan Net Position” are presented to facilitate financial analysis. Amounts in these columns do not present the plan net position and changes in plan net position in conformity with GAAP, nor is such data comparable to a consolidation. Transactions between the Defined Benefit Plan, Defined Contribution Plan, Health Care Savings Program, 457 Program, Retiree Health Funding Vehicle, Investment Services Program, and IRAs have not been eliminated from the “Total” columns.
The basic financial statements include certain prior-year summarized comparative information in total but not at the level of detail required for a presentation in conformity with generally accepted accounting principles. Accordingly, such information should be read in conjunction with the government’s financial statements for the year ended December 31, 2017, from which the summarized information was derived.
Certain prior year amounts have been reclassified to conform to the current year presentation.
New Accounting PronouncementsIn January 2017, the Governmental Accounting Standards Board issued GASB Statement No. 84, Fiduciary Activities, which improves guidance regarding the identification of fiduciary activities for accounting and financial reporting purposes and how these activities should be reported. This Statement establishes criteria for identifying fiduciary activities of all state and local governments. The focus of the criteria generally is on (1) whether a government is controlling the assets of the fiduciary activity and (2) the beneficiaries with whom a fiduciary relationship exists. An activity meeting the criteria should be reported in a fiduciary fund in the basic financial statements. The requirements of this Statement are effective for reporting periods beginning after December 15, 2018. Although the applicability of this standard to MERS itself is limited, employers who are in the MERS Retiree Health Funding Vehicle and Investment Services Program will need to report under the standard. MERS will be providing information to assist employers with the necessary reporting.
In June 2017, the Governmental Accounting Standards Board issued GASB Statement No. 87, Leases, which improves accounting and financial reporting for leases by governments. This statement requires recognition of certain lease assets and liabilities for leases that previously were classified as operating leases and recognized as inflows of resources or outflows of resources based on the payment provisions of the contract. It establishes a single model for lease accounting based on the foundational principle that leases are financings of the right to use an underlying asset. Under this statement, a lessee is required to recognize a lease liability and an intangible right-to-use lease asset, and a lessor is required to recognize a lease receivable and a deferred inflow of resources. The provisions of this statement are effective for the MERS financial statements for the year ending December 31, 2020. MERS has evaluated the standard and found that the impact would be insignificant. As such, MERS will not be implementing the standard in 2020, but will continue to evaluate this annually.

FINANCIAL2018 comprehensive annual financial report
33
3. CONTRIBUTIONS AND RESERVES
ContributionsThe Defined Benefit Plan contribution funding requirements are actuarially determined using the entry age normal actuarial cost method and are based upon the benefit plan adopted by the municipality. Some municipalities fund their entire pension obligations solely from employer contributions. Most municipalities jointly fund pension obligations from employee and employer contributions. Monthly employee contributions are based upon a percentage of actual compensation as determined by the employer. Employer contributions are based upon projected or accrued compensation as determined by an annual actuarial valuation. For details about normal cost and total employer contributions by employer, please see the MERS Summary Actuarial Report found on our website at www.mersofmich.com. Employee contributions are held in individual member accounts that are credited with interest annually. Pursuant to Board resolution adopted November 9, 2005, the interest rate for each year beginning in 2005 is the 1-year T-bill rate as of December 31 each year for the ensuing December 31 employee interest calculation. It is also used for interest calculations the subsequent year for those employees requesting a refund of their contributions.
Contributions to the Defined Contribution Plan are reported directly to the MERS third-party administrator by the participating municipalities and are separate from contributions made to the MERS Defined Benefit Plan. Both employer contributions and employee voluntary and mandatory contributions are governed by the contribution limits under the IRC. Municipalities may elect to have mandatory employee contributions where the participant pays a fixed dollar or percentage. If the municipality has a match contribution type, the participant will elect the amount of contribution at the time of enrollment and will not be allowed to make any changes to that contribution amount. Municipalities may also choose to allow additional voluntary after-tax contributions through payroll deduction. Municipalities may also choose to offer matching contributions into the Defined Contribution Plan based on elective deferrals made by participants to the MERS 457(b) Program.
Participating municipalities may, upon adoption of a Defined Contribution Plan resolution for new hires, offer current Defined Benefit employees an opportunity to opt into the Defined Contribution Plan. MERS transfers the actuarial present value of the employee’s accrued benefit in the Defined Benefit Plan into the employee’s Defined Contribution Plan account (at a stipulated funded ratio between 80%-100%). Employees direct their contributions to various investment options offered by the MERS Office of Investments, and may transfer their account balances between investment categories or make changes to the percentage allocation on a daily basis.
Contributions to the 457(b) Program are made pre-tax and can be either a flat dollar amount or a percentage of payroll. An employer may also adopt a Roth provision allowing for after-tax contributions. Participation in the program is voluntary, so contributions can start and stop at any time, as well as increase or decrease.
Participants can make contributions to the MERS IRAs at any frequency and work directly with MERS third-party administrator to set this up. It is the participant’s responsibility to ensure they do not exceed the IRA limits. Contributions are made post-tax to the Roth IRA, and participants may be able to deduct the contributions on their federal income tax returns for the traditional IRA.
Contributions to the Health Care Savings Program can come in many different forms based on the election of the employer. Mandatory pre-tax salary reductions can be elected based on a fixed dollar or required percentage that is mandatory for the entire group of participant or through a leave conversion election where vacation, personal time, sick time, or severance can be deposited into a Health Care Savings Program upon termination. In addition, post-tax voluntary employee contributions can be elected and can start or stop at any time.
Contributions to the Retiree Health Funding Vehicle and Investment Services Program can be made at any frequency for any amounts the employer wishes.

FINANCIAL2018 comprehensive annual financial report
34
Defined Benefit Plan ReservesPursuant to the MERS Plan Document, 3 reserves have been established. See “Schedule of Changes in Reserves” in the Statistical Section.
• Reserve for Employee Contributions
All additions to and deductions from this reserve are for the Defined Benefit Plan. Employee contributions and interest are credited to this reserve. Also credited are monies received from the purchase of service credit and monies received in repayment of previously refunded contributions. The reserve is reduced by amounts paid to employees who terminate employment and request refunds, and by amounts transferred into the “Reserve for Employer Contributions and Benefit Payments” upon an employee’s retirement. Interest is credited to each employee’s account, as provided in the Board’s November 9, 2005 resolution. The December 31, 2018 balance was $883 million.
• Reserve for Employer Contributions and Benefit Payments
All additions to and deductions from this reserve are for the Defined Benefit Plan. All employer contributions are credited to this reserve. Net income is allocated to this reserve from the “Reserve for Expenses and Undistributed Investment Income”. At retirement, the employee’s accumulated contributions, if any, and interest are transferred into this reserve from the “Reserve for Employee Contributions.” Monthly benefits paid to retirees reduce this reserve. The December 31, 2018 balance was $8.1 billion.
• Reserve for Expenses and Undistributed Investment Income
All additions to and deductions from this reserve are for the Defined Benefit Plan and Defined Benefit portion of the Hybrid Plan. All investment earnings and other monies received that are not dedicated to other areas are credited to this reserve. All administrative and investment expenses are paid from this reserve. Transfers from this reserve to the “Reserve for Employer Contributions and Benefit Payments” are at allocation rates determined by the Board. The unallocated reserve at the end of December 31, 2018 was $10 million.
Other ReservesEach of the products outside of the Defined Benefit Plan has its own reserve for additions and deductions to be recorded. MERS maintains separate employer account records for each municipality within the products. The December 31, 2018 reserve balances were as follows: Defined Contribution Plan $661 million, Health Care Savings Program $197 million, Retiree Health Funding Vehicle $917 million, Investment Services Program $60 million, 457(b) Program $109 million, and IRAs $46 thousand.
A more detailed analysis of the reserves can be found in the Statistical Section.

FINANCIAL2018 comprehensive annual financial report
35
4. INVESTMENTS AND DEPOSITS
The Board has the fiduciary responsibility and authority to oversee the investment portfolio. Various professional investment managers are contracted to manage the System’s assets. All investment decisions are subject to the Michigan Public Employee Retirement System Investment Act (PERSIA), 1965 PA 314, MCL 38.1132, et seq., and the investment policy established by the Board. Michigan law allows diverse investment in stocks, corporate and government bonds, mortgages, real estate, and other investments. PERSIA requires that the System invest its assets prudently and solely in the interest of the participants and beneficiaries. Under Plan Document Section 87(6), PERSIA, and Internal Revenue Code Section 401(a)(2), the investments shall be made for the exclusive purpose of providing benefits to the participants and their beneficiaries, and defraying reasonable expenses of the System.
The investment policy requires independent performance measurement of investment managers and establishes total return objectives for the total portfolio and major categories of investments. As of December 31, 2018, all securities held met the required statutory provisions and Board policy. As of the same dates, no investments were in default or subject to bankruptcy proceedings that had not been previously recorded.
MERS asset allocation policy is an important determinant of achieving the investment goals of the Plan. An asset allocation study is conducted every three years to assess portfolio construction and design. The study is presented to the Board for adoption. Factors influencing the allocation policy include projecting actuarial liabilities, historical and expected long-term market returns and risk, future economic conditions, inflation and interest rate risks, and liquidity requirements.
The investment policy provides for periodic rebalancing of the portfolio to reflect asset reallocation and ensuring investments remain within the Board approved parameters.
Investment manager selection is an important decision involving complex due diligence. Managers are selected after a lengthy and time consuming process involving a review of quantitative and qualitative components. Policy objectives include focusing on stable, long-term, financially secure, experienced, and disciplined investment managers in the selection decision. Once selected, managers are monitored and reviewed for investment returns, asset allocation compliance, and market related factors.
Other investment processes and procedures include capital calls, cash flow reconciliations, trade settlements, regular portfolio review, monthly account reconciliation, performance reporting and review, periodic manager conference calls, and asset allocation reviews.
The annual money weighted rate of return on pension plan investments is calculated as the internal rate of return on pension plan investments, net of investment expenses. This expresses investment performance adjusted for the changing amounts actually invested throughout the year, measured on monthly inputs with expenses measured on an accrual basis. For the year 2018, the annual money weighted rate of return net of investment expenses measured on monthly inputs was -3.59%. (See Required Supplemental Information)
The MERS Investment Policy is adopted by the Board with the Chief Executive Officer (CEO) being responsible for all activities and duties of the System. The CEO has delegated to the Office of Investments authority to manage MERS pension funds, other trust funds, and direct all investment management activities not reserved by the Board. The Board is the System’s sole fiduciary and sets general investment policy, including the Plan’s asset allocation, Investment Guidelines, and Investment Policy Statements. The Board’s investment authority and fiduciary responsibility is found in 1945 PA 135 and 1965 PA 314.
The Board has appointed an Investment Committee (IC) delegated with authority to make certain investment decisions and assist in investment policy development. The IC monitors investment management activity and policy recommendations developed by the MERS Office of Investments. The IC is composed of three voting Board
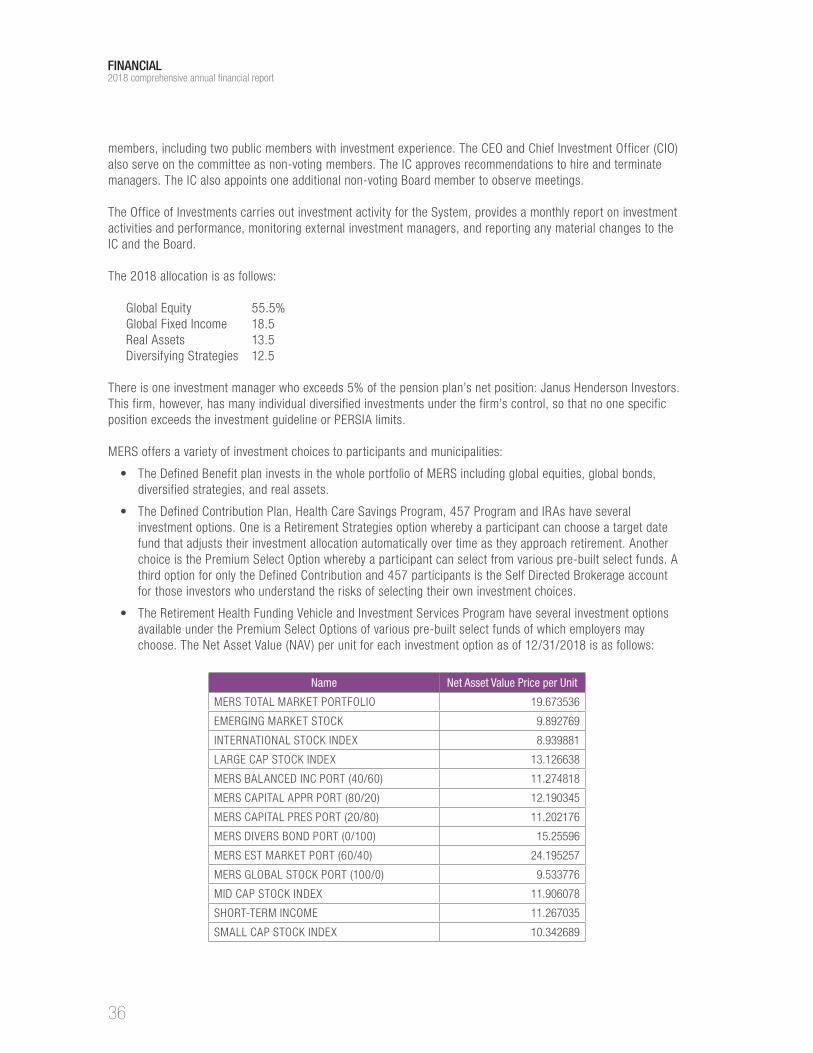
FINANCIAL2018 comprehensive annual financial report
36
members, including two public members with investment experience. The CEO and Chief Investment Officer (CIO) also serve on the committee as non-voting members. The IC approves recommendations to hire and terminate managers. The IC also appoints one additional non-voting Board member to observe meetings.
The Office of Investments carries out investment activity for the System, provides a monthly report on investment activities and performance, monitoring external investment managers, and reporting any material changes to the IC and the Board.
The 2018 allocation is as follows:
Global Equity 55.5%Global Fixed Income 18.5Real Assets 13.5Diversifying Strategies 12.5
There is one investment manager who exceeds 5% of the pension plan’s net position: Janus Henderson Investors. This firm, however, has many individual diversified investments under the firm’s control, so that no one specific position exceeds the investment guideline or PERSIA limits.
MERS offers a variety of investment choices to participants and municipalities:
• The Defined Benefit plan invests in the whole portfolio of MERS including global equities, global bonds, diversified strategies, and real assets.
• The Defined Contribution Plan, Health Care Savings Program, 457 Program and IRAs have several investment options. One is a Retirement Strategies option whereby a participant can choose a target date fund that adjusts their investment allocation automatically over time as they approach retirement. Another choice is the Premium Select Option whereby a participant can select from various pre-built select funds. A third option for only the Defined Contribution and 457 participants is the Self Directed Brokerage account for those investors who understand the risks of selecting their own investment choices.
• The Retirement Health Funding Vehicle and Investment Services Program have several investment options available under the Premium Select Options of various pre-built select funds of which employers may choose. The Net Asset Value (NAV) per unit for each investment option as of 12/31/2018 is as follows:
Name Net Asset Value Price per Unit
MERS TOTAL MARKET PORTFOLIO 19.673536
EMERGING MARKET STOCK 9.892769
INTERNATIONAL STOCK INDEX 8.939881
LARGE CAP STOCK INDEX 13.126638
MERS BALANCED INC PORT (40/60) 11.274818
MERS CAPITAL APPR PORT (80/20) 12.190345
MERS CAPITAL PRES PORT (20/80) 11.202176
MERS DIVERS BOND PORT (0/100) 15.25596
MERS EST MARKET PORT (60/40) 24.195257
MERS GLOBAL STOCK PORT (100/0) 9.533776
MID CAP STOCK INDEX 11.906078
SHORT-TERM INCOME 11.267035
SMALL CAP STOCK INDEX 10.342689

FINANCIAL2018 comprehensive annual financial report
37
Cash DepositsCustodial credit risk for cash deposits is the risk that, in the event of a failure of a depository financial institution, the system may not be able to recover its deposits. Balances on deposits are insured by the Federal Deposit Insurance Corporation (FDIC) up to specified limits. Balances in excess of FDIC limits are uninsured. MERS has not experienced any losses in its accounts and believes it is not exposed to a significant credit risk on its cash.
Credit RiskCredit risk is the financial risk that an issuer, or other counterparty, will not fulfill its obligations to MERS. Credit risk exposure is dictated by each investment manager’s agreement. Other criteria based on the Board’s investment policy, includes that if a security is downgraded below investment grade after purchase, a review with a written explanation shall be forwarded to the Investments staff. Board policy also allows that when calculating the average rating of the portfolio, the manager may use the highest rating of the major rating agencies to calculate the average. Board policy, with regard to global fixed income securities, is that no more than 10% of the portfolio may be invested in corporate bonds or sovereign bonds rated below investment grade, as defined by Moody’s and Standard & Poor’s rating agencies. Board policy for global fixed income securities is that the average weighted credit of the portfolio will be a minimum of A-. When calculating the average rating of the global portfolio, the manager may use the highest rating of the major agencies to calculate the average. Board policy with regard to global, non-investment grade fixed income securities includes criteria that credit quality must maintain a minimum of 10% of the portfolio in investment grade fixed income with at least two ratings of BBB-/Baa3 or higher at the time of purchase (as assigned by Standard & Poor’s or Moody’s). Each portfolio is managed in accordance with investment guidelines that are specific as to permissible credit quality ranges, exposure levels within individual security quality rating tiers, and/or the average credit quality of the overall portfolio.
As of December 31, 2018, the domestic fixed income portfolio consisted of fixed income investments with respective quality ratings, excluding those obligations of the U.S. government. Investments issued by or explicitly guaranteed by the U.S. government are not considered to have credit risk. The Plan’s exposure to credit risk, as of December 31, 2018, is presented on the following pages by investment category as rated by Standard & Poor’s, Moody’s, and Fitch credit ratings.

FINANCIAL2018 comprehensive annual financial report
38
Quality Rating Agencies Asset Backed Loan Corporate Bonds Foreign Currency
LMTD Part Units
Mortgage Backed Securities
Municipals Non Security Assets
Short-Term Cash
U.S. Treasuries Total % of Portfolio
AAA/Aaa $18,565,089 $6,418,866 $4,119,684 $9,233,312 $38,336,951 1.55%
AA+/Aa1 $75,038,232 4,110,840 9,358 $525,000 $1,413,651,232 1,493,334,662 60.28%
AA/Aa2 2,041,755 7,081,186 $2,638,279 11,761,220 0.47%
AA-/Aa3 15,486,108 15,486,108 0.63%
A+/A1 776,236 115,412 27,669,914 28,561,562 1.15%
A/A2 989,750 29,265,868 $893,103 31,148,721 1.26%
A-/A3 3,063,244 51,198,146 970,166 55,231,555 2.23%
BBB+/Baa1 660,356 46,674,596 20,563 47,355,515 1.91%
BBB/Baa2 3,035,846 66,184,294 133,786,837 203,006,976 8.19%
BBB-/Baa3 875,623 49,322,401 1,027,663 51,225,686 2.07%
BB+/Ba1 12,122,359 192,904 12,315,263 0.50%
BB/Ba2 15,917,692 7,164,671 23,082,363 0.93%
BB-/Ba3 5,131,144 1,512,064 6,643,208 0.27%
B+/B1 632,620 632,620 0.03%
B/B2 18,993,325 18,993,325 0.77%
B-/B3 75,338 75,338 0.00%
CCC+/Caa1 0 0.00%
CCC/Caa2 734,329 734,329 0.03%
CCC-/Caa3 0 0.00%
CC/Ca 436,628 436,628 0.02%
C 0 0.00%
D/C 3,711,339 3,711,339 0.15%
NA 0 0.00%
Cash with no ratings $33,223,983 33,223,983 1.34%
NR* 3,225,109 23,057,762 15,416,517 45,855,094 (28,258,142) 129,913,693 212,690,116 $18,542 401,918,691 16.22%
Totals $79,915,199 $51,529,213 $15,416,517 $383,071,127 $(24,138,458) $295,633,925 $225,731,484 $2,638,279 $18,542 $33,748,983 $1,413,651,232 $2,477,216,043 100.00%
Fixed income $2,960,761,077
Difference from Investments (483,545,034)
Payables settling in 2019 (19,625,073)
Currency difference (607)
Receivables settling in 2019 24,594,020
Cash in Fixed Income Portfolio 478,576,688
Small Difference 6
Total $483,545,034
Credit Ratings Summary – December 31, 2018
Reconciliation of Investments
*The Not Rated classification includes $129 million in commingled funds and limited partnerships without credit ratings. There is also $212 million in mortgage backed securities most of which are believed to be AAA or AA+. Removing those classifications leaves the overall portfolio at 2.8% Not Rated.

FINANCIAL2018 comprehensive annual financial report
39
Quality Rating Agencies Asset Backed Loan Corporate Bonds Foreign Currency
LMTD Part Units
Mortgage Backed Securities
Municipals Non Security Assets
Short-Term Cash
U.S. Treasuries Total % of Portfolio
AAA/Aaa $18,565,089 $6,418,866 $4,119,684 $9,233,312 $38,336,951 1.55%
AA+/Aa1 $75,038,232 4,110,840 9,358 $525,000 $1,413,651,232 1,493,334,662 60.28%
AA/Aa2 2,041,755 7,081,186 $2,638,279 11,761,220 0.47%
AA-/Aa3 15,486,108 15,486,108 0.63%
A+/A1 776,236 115,412 27,669,914 28,561,562 1.15%
A/A2 989,750 29,265,868 $893,103 31,148,721 1.26%
A-/A3 3,063,244 51,198,146 970,166 55,231,555 2.23%
BBB+/Baa1 660,356 46,674,596 20,563 47,355,515 1.91%
BBB/Baa2 3,035,846 66,184,294 133,786,837 203,006,976 8.19%
BBB-/Baa3 875,623 49,322,401 1,027,663 51,225,686 2.07%
BB+/Ba1 12,122,359 192,904 12,315,263 0.50%
BB/Ba2 15,917,692 7,164,671 23,082,363 0.93%
BB-/Ba3 5,131,144 1,512,064 6,643,208 0.27%
B+/B1 632,620 632,620 0.03%
B/B2 18,993,325 18,993,325 0.77%
B-/B3 75,338 75,338 0.00%
CCC+/Caa1 0 0.00%
CCC/Caa2 734,329 734,329 0.03%
CCC-/Caa3 0 0.00%
CC/Ca 436,628 436,628 0.02%
C 0 0.00%
D/C 3,711,339 3,711,339 0.15%
NA 0 0.00%
Cash with no ratings $33,223,983 33,223,983 1.34%
NR* 3,225,109 23,057,762 15,416,517 45,855,094 (28,258,142) 129,913,693 212,690,116 $18,542 401,918,691 16.22%
Totals $79,915,199 $51,529,213 $15,416,517 $383,071,127 $(24,138,458) $295,633,925 $225,731,484 $2,638,279 $18,542 $33,748,983 $1,413,651,232 $2,477,216,043 100.00%

FINANCIAL2018 comprehensive annual financial report
40
Concentration of Credit Risk Debt SecuritiesConcentration of credit risk is the risk of loss attributed to the magnitude of an entity’s exposure in a single issuer. The MERS investment policy states securities representing debt and equity of any one company shall not exceed 5% of the fair value of the portfolio. MERS did not hold any organization’s securities that exceeded 5% of the investment portfolio other than those issued or explicitly guaranteed by the U.S. government as of December 31, 2018.
Interest Rate RiskInterest rate risk is the risk that an investment’s value will change due to a change in the absolute level of interest rates. Interest rate risk is controlled through diversification of portfolio management styles. Duration is a measure of interest rate risk. The greater the duration of a bond or a portfolio of bonds, the greater its price volatility will be in response to a change in interest rates and vice-versa. Sensitivity to changing interest rates may derive from prepayment options embedded in an investment. The Board policy, in regard to interest rate risk, is that the effective duration of the domestic portfolio shall be (+/-) 20% of the Bloomberg Barclays Capital Aggregate Index or the Bloomberg Barclays Universal Bond Index. Board policy in regard to global non-investment grade fixed income securities is that the portfolio’s duration is (+/-) 2 years of the benchmark duration. The benchmark for global non-investment grade fixed income securities is 1/3 Bloomberg Barclays Capital U.S. Treasury Inflation Protected Securities Index, 1/3 Citigroup High Yield Market Index, and 1/3 JP Morgan Emerging Markets Global Bond Index. As of December 31, 2018, the System’s exposure to interest rate risk (as measured by the effective duration method summary) is listed below by investment type.
The term duration has a special meaning in the context of bonds. It is a measurement of how long, in years, it takes for the price of a bond to be repaid by its internal cash flows. It is an important measure for investors to consider, as bonds with higher durations carry more risk and have higher price volatility than bonds with lower durations.
Investment Type Fair Value Weighted
Effective Duration
Agency $80,534,237 2.06
Asset Backed 51,499,855 0.99
Bank Loan 15,416,517 0.59
CMBS 3,735,384 2.63
CMO 34,083,554 3.41
Corporate 354,961,879 4.81
Mortgage Pass-Through 184,586,359 3.72
Commingled Fund 198,467,344 6.50
US Treasury 1,413,651,226 2.88
Yankee (Intl bonds in U.S. dollars) 32,324,123 5.91
Total Fair Value of Effective Duration $2,369,260,478
Effective Duration – December 31, 2018

FINANCIAL2018 comprehensive annual financial report
41
Foreign Currency Risk in U.S. Dollar Denominations – December 31, 2018
Foreign Currency RiskForeign currency risk is the risk that changes in exchange rates will adversely affect the fair value of an investment. MERS currency risk exposure, or exchange rate risk, is primarily derived from its holdings in foreign currency denominated equities and fixed income investments. The Board investment policy for the global non-investment grade fixed income portfolio, allows currency hedging to mitigate currency exposure.
Hedging the non-U.S. dollar currency exposure of the portfolio is permitted. The portfolio will be limited to the maximum net currency exposure of 25% at any given time.
The MERS exposure to foreign currency risk in U.S. dollars is summarized below as of December 31, 2018.
Currency Equities Currency Private Equity Real Estate Total
Australian dollar $18,894,922 $629,441 $86,188,135 $294,555 $106,007,052
Brazilian real 1,574,501 102,437 1,676,938
British pound sterling 37,921,937 (281,792) 238,265 37,878,410
Canadian dollar 17,171,996 1,106,649 2,846,688 (5,370,226) 15,755,106
Danish krone 4,790,541 4,790,541
Euro 83,549,722 4,147,162 90,985,496 1,017,062 179,699,442
Hong Kong dollar 11,180,544 102,107 359,782 11,642,433
Indonesian rupiah 291,885 15,709 307,594
Japanese yen 96,951,778 19,488 1,908,523 98,879,788
Malaysian ringgit 470,283 15,107 485,390
Mexican peso 104,277 453,589 557,866
New Israeli shekel 12,279,570 3,265 1,426,559 218,631 13,928,025
New Taiwan dollar 4,997,971 163,812 5,161,782
New Zealand dollar 1,882,730 23,175 56,930 1,962,835
Norwegian krone 5,881,842 68,623 5,950,466
Philippine peso 39,978 16,929 56,907
Polish zloty 478,791 32,454 511,245
Singapore dollar 4,392,424 412,543 331,646 5,136,614
South African rand 206,718 (3,906) 22,566 225,378
South Korean won 3,439,036 61,400 3,500,436
Swedish krona 13,201,411 4,838 13,206,249
Swiss franc 11,748,388 11,748,388
Thailand baht 4,145,196 (429) 4,144,767
Turkish lira 236,564 35,177 15,585 287,326
Total Investment Securities $335,728,727 $6,778,465 $181,446,878 $(453,093) $523,500,977

FINANCIAL2018 comprehensive annual financial report
42
Custodial Credit Risk Custodial credit risk is the risk that deposits may not be recovered in the event of failure of a depository financial institution. As of December 31, 2018, the $17.9 million carrying amount of the System’s cash and short term investments was comprised of $17.9 million in deposits, $17.65 million which was subject to custodial credit risk because it was uninsured and uncollateralized.
Securities LendingThe MERS policy and statute authorizes participation in a securities lending program administered by its global custodian, State Street Bank and Trust Company. MERS receives income as the owner of securities and income from the lending of those securities. There are no dividends or coupon payments owing on the securities on loan. Securities lending earnings are credited to MERS and other participating clients on approximately the 15th day of the following month. The securities are open contracts and, therefore, could be terminated at any time by either party.
The borrower collateralizes the loan with cash at 102% of fair value plus accrued interest on domestic securities, and 105% of fair value plus accrued interest on international securities loaned. Due to the nature of the program’s collateralization of U.S. fixed income securities on loans at 102% plus accrued interest, MERS’ management believes that there is no credit risk per GASB 40 because the lender owes the borrower more than the borrower owes the lender. Cash collateral is invested for MERS in a dedicated short-term investment fund consisting of investment grade fixed income securities. The custodian provides for full indemnification to MERS for any losses that might occur in the event of borrower default resulting from negligence or intentional misconduct. Securities on loan are marked to fair value daily to ensure the adequacy of the collateral. There are no restrictions on the amount of securities that can be loaned at one time. MERS security lending is also in compliance with PERSIA 38.1140e.
MERS has never experienced a loss on securities lending transactions resulting from the default of a borrower or lending agent since it commenced lending securities in March 1995. As of December 31, 2018, the fair value of fixed income securities invested in the cash collateral pool was below the original cost, resulting in a cumulative unrealized loss of $70 thousand that is reflected in the financial statements. Securities lending produced a net income of $3.2 million excluding unrealized gains and losses.
Collateral Held and Fair Value of Securities on Loan
Fair Value of Securities on Loan Nature of Collateral Collateral Held
$573,661,642 Cash $573,997,167
Calculated Mark 666,978
Non-Cash 11,971,413
$573,661,642 $586,635,557

FINANCIAL2018 comprehensive annual financial report
43
Securities Lending CollateralS & P Rating Percentage Amount
Short-Term Credit Ratings A-1+/P-1 * 12.86% $73,793,879
A-1/P-1 * 50.20% 288,139,357
A-2 0.00%
Long-Term Credit Ratings AAA 0.00%
AA 7.49% 42,988,244
A 22.08% 126,765,300
BBB+ 0.00%
BBB 0.00%
BBB- 0.00%
BB+ 0.00%
BB 0.00%
BB- 0.00%
Other 7.37% 42,310,387
100.00% 573,997,167
Net accumulated depreciation in fair value (70,316)
Invested Securities Lending Collateral $573,926,851
DerivativesDerivative instruments are financial contracts whose value depends on the values of underlying assets, reference rates, or financial indices. They include futures contracts, swap contracts, credit-linked notes (CLN), and forward foreign currency exchange. While the Board has no formal policy specific to derivatives, MERS holds investments in futures contracts, swap contracts, credit linked notes, and forward foreign currency exchange. MERS enters into these derivative contracts primarily to obtain exposure to different markets to enhance the performance and reduce the volatility of the portfolio. It enters swaps and futures contracts to gain or hedge exposure to certain markets. They also manage interest rate risk and forward foreign exchange contracts primarily to hedge foreign currency exposure.
The following tables summarize the various contracts in the portfolio as of December 31, 2018. The notional value associated with these derivative instruments are generally not recorded on the financial statements; however, the amounts for the exposure (unrealized gains/losses) on these instruments are recorded. Interest rate risks associated with these investments are included in the table. MERS does not anticipate additional significant market risk from the swap arrangements.
* A short term obligation rated A-1/P-1 is rated in the highest category by both Standard & Poor’s (S&P) and Moody’s Investor Services. These Issuers have a superior ability to repay short-term obligations. S&P will designate certain issues with a plus sign (+) to indicate that the obligor’s capacity to meet its financial commitment is extremely strong.

FINANCIAL2018 comprehensive annual financial report
44
MERS could be exposed to risk if the counterparties to the contracts are unable to meet the terms of the contracts. MERS and its investment managers seek to control this risk through counterparty credit evaluations and approvals, counterparty credit limits, and exposure monitoring procedures. MERS anticipates that counterparties will be able to satisfy their obligations under the contracts. Investments in limited partnerships and combined funds may include derivatives that are not shown in the derivative totals.
Private Equity and Capital CallsThe Board has approved $3 billion available to call for private investments. As of December 31, 2018, $2.151 billion was invested in private investments leaving $849 million available for future investments. Investments in private market values reflect capital returns, income, and gains or losses.
MERS has various investments that can be difficult to value in that there are not readily accessible comparable market values. MERS has level 2 investment values of approximately $3.2 billion, (chiefly in global fixed income). Level 2 investments typically have quoted prices for similar type assets and have pricing models that can be derived principally from observable market data. MERS also has level 3 investments of approximately $4 billion (chiefly in real estate, private equity, timber, commingled funds, and limited partnerships). These investments tend to be illiquid and do not trade frequently. As a result, there may not be readily marketable prices for them.
Management’s estimates of these values are based on information provided by investment managers, general partners, real estate advisors, and other means. Because alternative investments are not readily marketable, their estimated value is subject to uncertainty and therefore may differ from the values that would have been used had a ready market for these securities existed. The differences could be material.
Swap Contracts
Foreign Currency Forward Contracts
Pending Receivable $6,983,932
Pending Payable (3)
Foreign Currency Forward Contract Asset (Liability) $6,983,929
Futures and Options Contracts
Futures Contract Expiration Date Long/Short Cost Market Value Unrealized Gain/(Loss)
Russell 2000 E Mini Futures March 15, 2019 Short $(196,356,226) $(187,106,300) $9,249,926
Fair Value MeasurementsInvestments are presented at fair value. The System categorizes their fair value measurements within the fair value hierarchy established by generally accepted accounting principles. The hierarchy is based on the valuation inputs used to measure the fair value of the asset and give the highest priority to unadjusted quoted prices in active markets for identical assets or liabilities (level 1 measurements) and the lowest priority to unobservable inputs (level 3 measurements).
Level 1 Unadjusted quoted prices for identical instruments in active markets.
Level 2 Quoted prices for similar instruments in active markets; quoted prices for identical or similar instruments in markets that are not active; and model-derived valuations in which all significant inputs are observable.
Level 3 Valuations derived from valuation techniques in which significant inputs are unobservable.
Name Maturity Date Position Cost Market Value Unrealized Gain
None

FINANCIAL2018 comprehensive annual financial report
45
Investments that are measured at fair value using the net asset value (or NAV) (or its equivalent) as a practical expedient are not classified in the fair value hierarchy. The tables on page 46 shows the fair value leveling on the investments for MERS.
In instances where inputs used to measure fair value fall into different levels in the fair value higher hierarchy, fair value measurements in their entirety are categorized based on the lowest level input that is significant to the valuation. (An investment having both level 2 and level 3 inputs would be categorized as level 3.) The system’s assessment of the significance of particular inputs to these fair value measurements requires judgment and considers factors specific to each asset. The tables on page 46 show the fair value leveling of the investments for MERS.
Global equities classified in level 1 are valued using prices quoted in active markets for those securities. Global equities classified in level 3 are values with last trade data having limited trading volume.
Global fixed income classified in level 2 and level 3 are valued using either a bid evaluation or a matrix pricing technique. Bid evaluations may include market quotations, yields, maturities, call features, and ratings. Matrix pricing is used to value securities based on the securities relationship to benchmark quoted prices. Level 2 fixed income securities have non-proprietary information that was readily available to market participants, from multiple independent sources, which are known to be actively involved in the market. Level 3 fixed income securities use proprietary information or single source pricing. Global fixed income classified in level 3 are investments with values in leases, real estate and credit limited partnerships that are not readily traded and are valued using a pricing model.
Real assets and Diversifying Strategies in level 1 are valued using prices quoted in active markets. Real assets classified in level 3 are primarily investments in real estate, infrastructure and timber generally valued using the income approach by internal manager reviews or independent external appraisers. Level 2 securities for real assets and Diversifying Strategies have non-proprietary information that was readily available to market participants, from multiple independent sources, which are actively involved in the market. Level 3 Diversifying Strategies are valued using appraisals, cash-flow analysis, and sales of similar investments. MERS policy is to obtain an external appraisal a minimum of every 3 years for properties that MERS has some degree of control or discretion. In practice, some investments are appraised annually. Appraisals are performed by an independent appraiser with preference for Member Appraisal Institute designated appraisers. The appraisals are performed using generally accepted valuation approaches applicable to the investment type.
Mutual funds and self-directed accounts are valued at quoted prices for those securities in active markets. Mutual funds that are not publicly traded are recorded as level 3 investments.
Certain alternative investments such as private equity, real assets, and diversifying strategies do not have readily ascertainable market values. Management, in consultation with their investment managers, value these investments in good faith based upon audited financials, cash-flow analysis, purchase and sales of comparable investments, other practices used within the industry, or other information provided by the underlying investment managers. The estimated fair value of these investments may differ significantly from values that would have been used had a ready market existed. These investments are classified as level 3.
The valuation method for investments measured at the net asset value (NAV) per share is presented in the table on page 46. The System holds shares or interests in investment companies where the fair value of the investments are measured on a recurring basis using net asset value per share (or its equivalent) of the investment companies as a practical expedient. Global equity, real assets and diversifying strategy investments at NAV are generally long term private market investments that are illiquid with redemptions restricted over the life of the partnership. During the life of the partnerships, distributions are received as underlying partnership investments are realized. As of December 31, 2018, it is probable that all of the investments in this type will be sold at an amount different from the NAV per share of MERS ownership interest in partners’ capital.

FINANCIAL2018 comprehensive annual financial report
46
Quoted Prices in Active Markets
Assets
Significant Other Observable
Inputs
Significant Unobservable
Inputs
Fair Value Investments Level 1 Level 2 Level 3 Totals
Global Equities $1,930,073,028
$2,121,985,677 $4,052,058,706
Global Fixed Income $2,540,369,930 96,551,279 2,636,921,210
Real Assets 134,803,188 3,365,268 868,071,923 1,006,240,379
Diversifying Strategies 42,410,615 129,797,889 682,663,970 854,872,474
Mutual Funds (DC, 457, HCSP, IRA) 21,446,630 21,446,630
Self Directed accounts (DC and 457) 4,030,838 4,030,838
Total investments by fair value 2,132,764,299 2,673,533,088 3,769,272,849 8,575,570,236
Investments at Net Asset Value (NAV) NAV Totals
Global Equities $962,368,680 962,368,680
Fixed Income 198,033,105 198,033,105
Real Assets 186,136,510 186,136,510
Diversifying Strategies 191,660,050 191,660,050
Mutual Funds (DC, 457, HCSP, IRA) 525,033,208 525,033,208
Total Investments at NAV 2,063,231,554 2,063,231,554
Total Fair Value and NAV Investments 2,063,231,554 2,132,764,299 2,673,533,088 3,769,272,849 10,638,801,789
Securities Lending Collateral 573,926,851 573,926,851
Total Fair Value and NAV Investments with Securities Lending
$2,063,231,554 $2,132,764,299 $3,247,459,939
$3,769,272,849
$11,212,728,640
GASB 72 Disclosures for MERS
Reconciliation to Investments on Financial Statements
Investments at fair value and NAV from above $10,638,801,789
Cash included in GASB 72 (12,547)
Investment in land 1,402,094
Foreign Exchange Receivables/Payables 5,145,142
Rounding 2,173
Future Index Russell 2000 Portfolio Hedge 187,736,791
Adjusted investments 10,833,075,442
Investments from financial statements $10,833,075,442
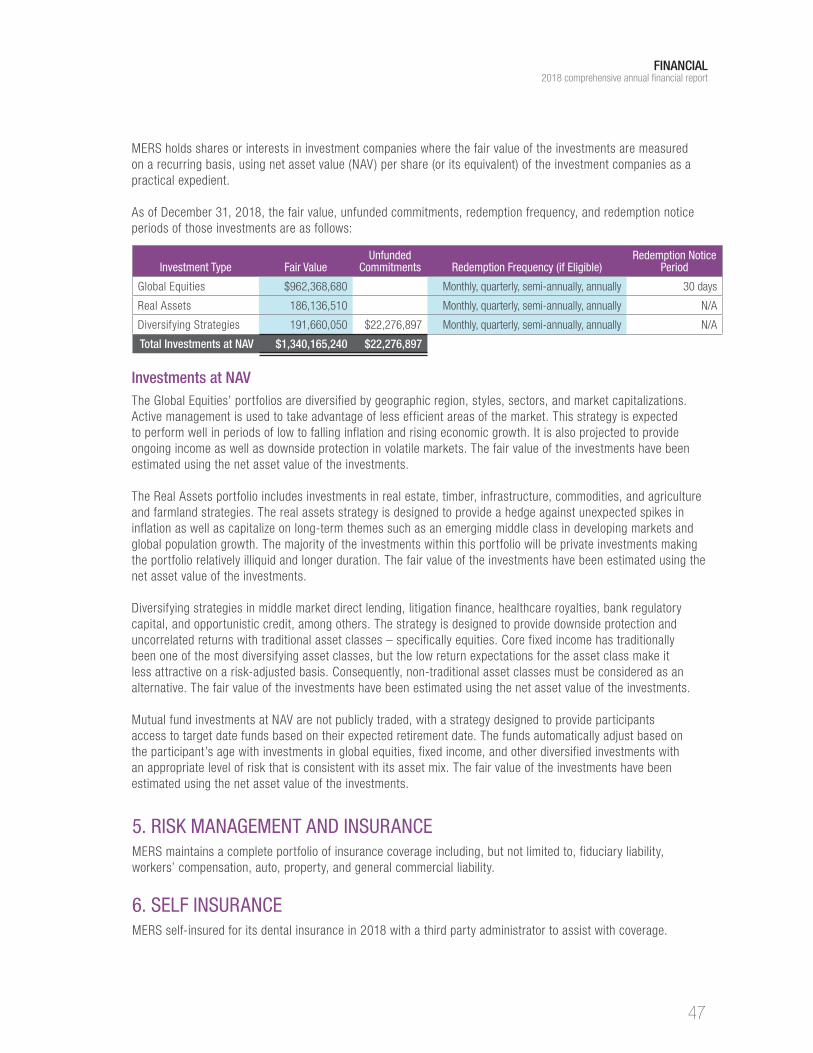
FINANCIAL2018 comprehensive annual financial report
47
Investment Type Fair ValueUnfunded
Commitments Redemption Frequency (if Eligible)Redemption Notice
Period
Global Equities $962,368,680 Monthly, quarterly, semi-annually, annually 30 days
Real Assets 186,136,510 Monthly, quarterly, semi-annually, annually N/A
Diversifying Strategies 191,660,050 $22,276,897 Monthly, quarterly, semi-annually, annually N/A
Total Investments at NAV $1,340,165,240 $22,276,897
MERS holds shares or interests in investment companies where the fair value of the investments are measured on a recurring basis, using net asset value (NAV) per share (or its equivalent) of the investment companies as a practical expedient.
As of December 31, 2018, the fair value, unfunded commitments, redemption frequency, and redemption notice periods of those investments are as follows:
Investments at NAVThe Global Equities’ portfolios are diversified by geographic region, styles, sectors, and market capitalizations. Active management is used to take advantage of less efficient areas of the market. This strategy is expected to perform well in periods of low to falling inflation and rising economic growth. It is also projected to provide ongoing income as well as downside protection in volatile markets. The fair value of the investments have been estimated using the net asset value of the investments.
The Real Assets portfolio includes investments in real estate, timber, infrastructure, commodities, and agriculture and farmland strategies. The real assets strategy is designed to provide a hedge against unexpected spikes in inflation as well as capitalize on long-term themes such as an emerging middle class in developing markets and global population growth. The majority of the investments within this portfolio will be private investments making the portfolio relatively illiquid and longer duration. The fair value of the investments have been estimated using the net asset value of the investments.
Diversifying strategies in middle market direct lending, litigation finance, healthcare royalties, bank regulatory capital, and opportunistic credit, among others. The strategy is designed to provide downside protection and uncorrelated returns with traditional asset classes – specifically equities. Core fixed income has traditionally been one of the most diversifying asset classes, but the low return expectations for the asset class make it less attractive on a risk-adjusted basis. Consequently, non-traditional asset classes must be considered as an alternative. The fair value of the investments have been estimated using the net asset value of the investments.
Mutual fund investments at NAV are not publicly traded, with a strategy designed to provide participants access to target date funds based on their expected retirement date. The funds automatically adjust based on the participant’s age with investments in global equities, fixed income, and other diversified investments with an appropriate level of risk that is consistent with its asset mix. The fair value of the investments have been estimated using the net asset value of the investments.
5. RISK MANAGEMENT AND INSURANCEMERS maintains a complete portfolio of insurance coverage including, but not limited to, fiduciary liability, workers’ compensation, auto, property, and general commercial liability.
6. SELF INSURANCEMERS self-insured for its dental insurance in 2018 with a third party administrator to assist with coverage.

FINANCIAL2018 comprehensive annual financial report
48
7. COMMITMENTS AND CONTINGENCIESIn the normal course of business, MERS is involved in a number of disputes over benefits or other claims. MERS does not anticipate any material loss as a result of these claims. Furthermore, the cost of a successful benefit claim is ultimately the responsibility of the affected municipality, in most cases, as it becomes a funding obligation of that municipality.
In 1998, MERS entered into a contractual agreement with a municipality and its bargaining units to pay for a certain portion of the municipality’s and employees’ benefit costs to settle a legal dispute over an alleged actuarial error. MERS took the position that its legal obligations under this agreement ended on December 31, 2015. The municipality and its bargaining units disagreed with MERS, resulting in litigation. The parties settled the matter in 2017. The settlement amount is reported as a special, one-time payment item in the Statement of Changes in Fiduciary Net Position for the year ended December 31, 2017.
8. FUNDED STATUS AND FUNDING PROGRESSThe MERS funded status is summarized in the Management’s Discussion and Analysis.
Actuarial valuations are prepared annually as of December 31 for each participating municipality. To facilitate budgetary planning needs, employer contribution requirements are provided for each municipality’s unique fiscal year that commences after the following calendar year end. For example, the contribution requirements for fiscal years that began in 2018 were determined by actuarial valuations as of December 31, 2016. Approximately 78% of the participating municipalities have fiscal years that begin January 1 or July 1.
9. RELATED PARTIESCobalt Community Research is a 501(c)(3) nonprofit, non-partisan coalition that helps local governments, schools and membership organizations measure, benchmark, and manage their efforts through shared data, high-quality affordable surveys, focus groups and meetings that use instant audience feedback technology. MERS facilitated the creation of Cobalt and MERS employees performed the regular work required to run Cobalt through August 31, 2017, after which time Cobalt Community Research took over all operations and MERS employees no longer performed these duties. Cobalt maintained separate financial reporting and was responsible for repaying MERS for all administrative costs including staff time. In 2017, Cobalt paid MERS $76,807.35 to cover the year’s pro-rated expenses.
10. INTERFUND BALANCESThe general purpose of the interfund receivables and payables in the financial statements relates to transactions that occurred between the various product positions within MERS that did not settle until 2019.
11. GASB 68The Governmental Accounting Standards Board (GASB) Statement No. 68, “Accounting and Financial Reporting for Pensions”, requires certain disclosures for employers who provide pensions. MERS employees participate in the MERS Defined Benefit Plan. The sections below are required and pertain to MERS staff only.
PensionsFor purposes of measuring the Net Pension Liability, deferred outflows of resources and deferred inflows of resources related to pensions, and pension expense, benefit payments (including refunds of employee contributions) are recognized when due and payable in accordance with the benefit terms. Investments are reported at fair value.
Plan DescriptionThe employer’s defined benefit pension plan provides certain retirement benefits to plan members and beneficiaries. MERS is an agent multiple employer, statewide public employee pension plan established by the Michigan Legislature under Public Act 135 of 1945 and administered by a nine member Board. MERS issues a publicly available financial report that includes financial statements and required supplementary information. This report is available on the MERS website at www.mersofmich.com.

FINANCIAL2018 comprehensive annual financial report
49
Benefits ProvidedBenefit Multiplier: 2.25% Multiplier (80% max) Normal Retirement Age: 60Vesting: 6 yearsEarly Retirement (Unreduced): 55/30Early Retirement (Reduced): 50/25, 55/15Final Average Compensation: 3 yearsCOLA for Future Retirees: 2.50% (Non-Compounded)Employee Contributions: 4%Act 88: Yes (Adopted 9/24/1996)
At the December 31, 2017, valuation date, the following employees were covered by the benefit terms:
Inactive Employees or Beneficiaries Currently Receiving Benefits: 38Inactive Employees Entitled to but Not Yet Receiving Benefits: 39 Active Employees: 128Total Employees: 205
ContributionsThe employer is required to contribute amounts at least equal to the actuarially determined rate, as established by the Board. The actuarially determined rate is the estimated amount necessary to finance the cost of benefits earned by employees during the year, with an additional amount to finance any unfunded accrued liability. The actuarial determined contribution rate for 2018 was 14.27% of payroll. MERS total employer contributions totaled $2,612,795.84. MERS employees are required to contribute 4% of their salaries to help fund the pension.
Article 9, Section 24 of the State of Michigan constitution requires that financial benefits arising on account of employee service rendered in each year be funded during that year.
Net Pension Liability/AssetMERS Net Pension Asset, measured as of December 31, 2017 was $3,185,095.59 and the total pension liability used to calculate the Net Pension liability was determined by an annual valuation for that date.
Actuarial AssumptionsThe total pension liability in the December 31, 2017 annual actuarial valuation was determined using the following actuarial assumptions, applied to all periods included in the measurement:
Inflation: 2.5%Salary Increases: 3.75% in the long termInvestment Rate of Return: 8.00% net of investment expenses, including inflation
The mortality table used to project the mortality experience of non-disabled plan members is a 50% male, 50% female blend of the following tables:
• The RP-2014 Healthy Annuitant Mortality Tables, with rates multiplied by 105%
• The RP-2014 Employee Mortality Tables
• The RP-2014 Juvenile Mortality Tables

FINANCIAL2018 comprehensive annual financial report
50
Discount RateThe discount rate used to measure the total pension liability was 8.00% for 2017. The projection of cash flows used to determine the discount rate assumes that employer and employee contributions will be made at the rates agreed upon for employees and the actuarially determined rates for employers. Based on these assumptions, the pension plan’s fiduciary net position was projected to be available to pay all projected future benefit payments of current active and inactive employees. Therefore, the long-term expected rate of return on pension plan investments was applied to all periods of projected benefit payments to determine the total pension liability.
Total Pension Liability/(Asset)
(a)
Plan Fiduciary Net Position
(b)
Net Pension Liability/(Asset)
(a) - (b)
Balances at December 31, 2016 $27,044,227 $27,387,571 $(343,344)
Changes for the Year
Service Cost 1,457,033 1,457,033
Interest on Total Pension Liability 2,192,266 2,192,266
Changes in benefits -
Difference Between Expected and Actual Experience 95,943 95,943
Changes in Assumptions -
Employer Contributions 2,367,084 (2,367,084)
Employee Contributions 525,320 (525,320)
Net Investment Income 3,753,767 (3,753,767)
Benefit Payments, Including Employee Refunds (738,847) (738,847) -
Administrative Expenses (59,178) 59,178
Other Changes 1 1
Net changes 3,006,395 5,848,147 (2,841,752)
Balances as of December 31, 2017 $30,050,622 $33,235,718 $(3,185,096)
Changes in Net Pension Liability/(Asset)
Asset ClassTarget
AllocationTarget Allocation
Gross Rate of ReturnLong-Term Expected Gross Rate of Return
Inflation Assumption
Long-Term Expected Real Rate of Return
Global Equity 55.50% 8.65% 4.80% 2.50% 3.41%
Global Fixed Income 18.50% 3.76% 0.70% 2.50% 0.23%
Real Assets 13.50% 9.72% 1.31% 2.50% 0.97%
Diversifying Strategies 12.50% 7.50% 0.94% 2.50% 0.63%
Total 100.00% 7.75% 5.25%
The mortality table used to project the mortality experience of disabled plan members is 50% Male, 50% Female blend of RP-2014 Disabled Retiree Mortality Tables.
The actuarial assumptions used in the valuation were based on the results of the actuarial experience study of 2009-2013.
The long-term expected rate of return on pension plan investments was determined using a model method in which the best-estimate ranges of expected future real rates of return (expected returns net of investment and administrative expenses and inflation) are developed for each major asset class. These ranges are combined to produce the long-term expected rate of return by weighting the expected future real rates of return by the target asset allocation percentage and by adding expected inflation. The target allocation and best estimates of arithmetic real rates of return for each major asset class are summarized in the following table:

FINANCIAL2018 comprehensive annual financial report
51
Sensitivity of the Net Pension Liability/(Asset) to Changes in the Discount RateThe following presents the Net Pension Liability of MERS, calculated using the discount rate of 8.00%, as well as what the employer’s Net Pension Asset would be using a discount rate that is 1% lower (7.00%) or 1% higher (9.00%) than the current rate.
Note: the current discount rate shown for GASB 68 purposes is higher than the MERS assumed rate of return. This is because GASB 68 requires that the discount rate must be gross of administrative expenses, whereas for funding purposes, it is net of administrative expenses. MERS has a net position asset due to the Plan Fiduciary Net Position exceeding the total Pension Liability.
Sensitivity of Net Pension Liability/(Asset)
1% Decrease (7%)
Current Discount Rate (8%)
1% Increase (9%)
Net Pension Liability (Asset) $(3,185,096)
Change in Net Pension Liability $4,780,233 $(3,909,839)
Adjusted Net Pension Liability $1,595,137 $(3,185,096) $(7,094,935)
Pension Expense and Deferred Outflows of Resources and Deferred Inflows of Resources Related to PensionsFor the year ended December 31, 2018, MERS recognized defined benefit pension expense of $1,205,408. MERS also reported deferred outflows and inflows of resources related to pensions from the following sources:
Deferred Outflows of Resources
Deferred Inflows of Resources
Differences in Experience $165,788 $-
Differences in Assumptions 792,395
Excess (Deficit) Investment Returns 717,429
Contributions Subsequent to the Measurement Date* 2,612,796
Total $3,570,980 $717,429
*The amount reported as deferred outflows of resources resulting from contributions subsequent to the measurement date will be recognized as a reduction in the Net Pension Liability for the measurement date of December 31, 2018, which is recorded in 2019.
Amounts reported as deferred outflows and inflows of resources related to pensions will be recognized in pension expense as follows:
There were changes in the actuarial assumptions or methods affecting the 2015 valuation for smoothing, price and wage inflation, discount rate, and mortality tables based on the experience study. This calculation was done with an effective date of December 31, 2015.
Year Ended Deferred Outflow
2019 $297,0322020 216,7752021 (222,983)2022 (58,312) 2023 (5,462)2024 13,706

FINANCIAL2018 comprehensive annual financial report
52
12. SUMMARY INFORMATION – ACTUARIAL FUNDING METHODS AND ASSUMPTIONS
Valuation Date December 31, 2017
Actuarial Cost Method Entry Age Normal
Amortization Method Level Percent of Payroll, Closed
Remaining Amortization Period For open divisions (new hires are included in the division) the amortization period is 22 years. The 22 year period will decline by one each year until the initial unfunded accrued liability is paid off.
For divisions that closed to new hires prior to 2016 (new hires are not covered by the MERS Defined Benefit Plan or Hybrid Plan (Part I) provisions in a linked division) of active municipalities, the employer had two amortization options. Under Accelerated to 5 Year Option, the amortization period is decreased annually by two years until the period reaches six or five years. Each year thereafter, It decreases by one each year until the unfunded liability is paid off. Under the Accelerated to 15 year Option, the amortization period is decreased annually by two years until the period reaches 16 or 15 years. Each year thereafter, the amortization period is decreased annually by one year until the unfunded accrued liability is paid off. Negative unfunded accrued liabilities are amortized over 10 years, with the 10 year period reestablished with each annual actuarial valuation.
Asset Valuation Method A 5-year smoothed fair value asset valuation method was adopted December 31, 2015.
Actuarial Assumptions Investment Rate of Return – 8.00% net of investment expenses
Projected Salary Increases A 3.75% for base inflation, plus a percentage based on an age-related scale to reflect merit, longevity and promotional pay increases.
Post-Retirement Benefit A 2.5% annual post-retirement benefit adjustment – if adopted by individual municipalities.

FINANCIAL2018 comprehensive annual financial report
53
Deferred Retirement Option Program (DROP+) Partial Lump Sum
Deferred Retirement Option Program (DROP): Traditional
If participants are covered by the Benefit Program DROP+, and retires at least 12 months after first becoming eligible for unreduced benefits, they have the option to receive a partial lump sum and a reduced monthly benefit:
• The participant can elect a lump sum equal to 12, 24, 36, 48, or 60 times their monthly straight life accrued benefit.
• For each 12 months included in the lump sum, the participant’s lifetime benefit is reduced by the DROP+ percentage adopted by the employer. The employer can adopt any of the following DROP+ reduction percentages: 4, 5, 6, 7, or 8%.
Benefit Program DROP+ may not be adopted after June 30, 2013. Two employers adopted this benefit prior to it ending.
If a member is covered by the Benefit Program DROP and is eligible for retirement, they have the option to elect a specified DROP period in which they will cease to accrue any additional retirement benefits, but remain employed by the participating municipality or court. The member must elect a DROP end date at least six months after the beginning date, but no more than sixty months after the beginning date, in one-month increments.
Upon the member’s election of DROP and the receipt of an application to enroll in DROP, MERS will calculate the member’s service retirement and benefit payment as of the beginning date. The System also shall calculate any age differential between the member and the member’s beneficiary as of the calendar year of the DROP exit date in accordance with Treasury Regulation § 1.401(a)(9)-6. Upon the beginning date of the DROP period, the member shall be responsible to continue employee contributions, if any.
On the next available benefit payment date after processing is complete, and monthly thereafter, an amount equal to 100% of the monthly service retirement benefit payment the member would have received if he or she had retired as of the DROP beginning date will be credited to a notional account for the benefit of the member. Funds in the DROP account are credited with interest in the amount of 3% annually, or prorated in the event of a DROP period that is less than twelve months.
Upon the end date, the member shall receive a lump-sum distribution of the member’s DROP account and on the first day of the calendar month following end date, the member will begin receiving monthly service retirement benefit payments.
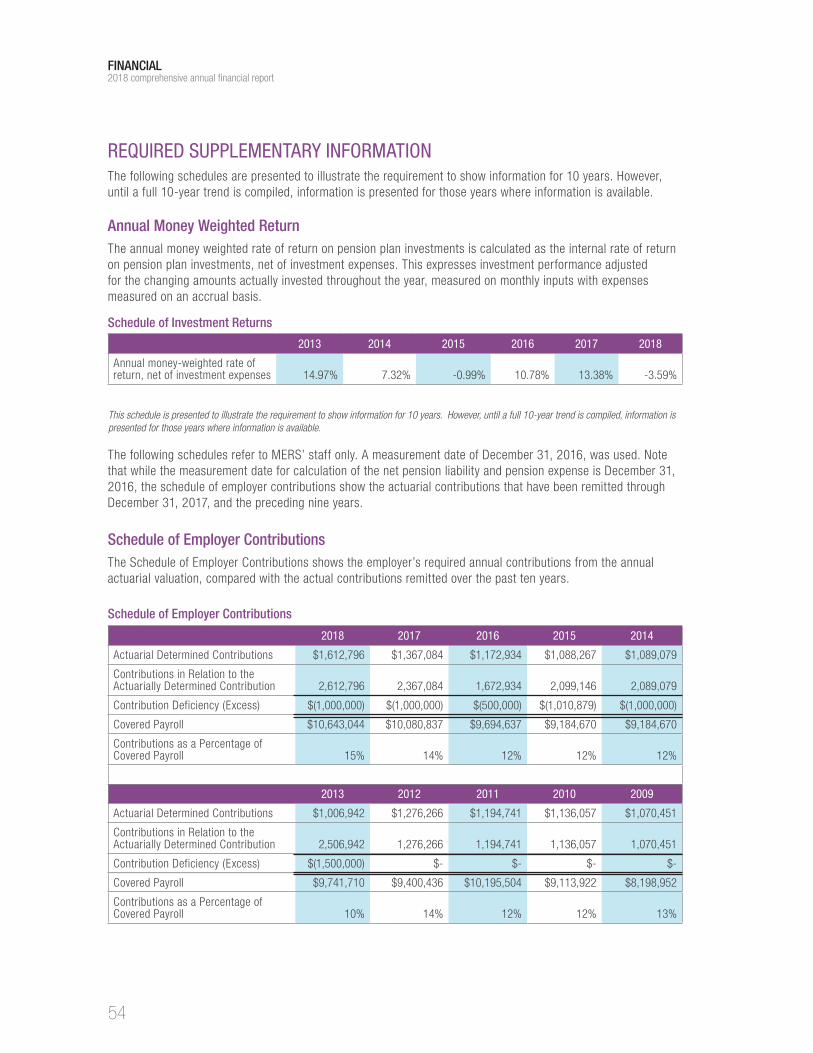
FINANCIAL2018 comprehensive annual financial report
54
2018 2017 2016 2015 2014
Actuarial Determined Contributions $1,612,796 $1,367,084 $1,172,934 $1,088,267 $1,089,079
Contributions in Relation to the Actuarially Determined Contribution 2,612,796 2,367,084 1,672,934 2,099,146 2,089,079
Contribution Deficiency (Excess) $(1,000,000) $(1,000,000) $(500,000) $(1,010,879) $(1,000,000)
Covered Payroll $10,643,044 $10,080,837 $9,694,637 $9,184,670 $9,184,670
Contributions as a Percentage of Covered Payroll 15% 14% 12% 12% 12%
2013 2012 2011 2010 2009
Actuarial Determined Contributions $1,006,942 $1,276,266 $1,194,741 $1,136,057 $1,070,451
Contributions in Relation to the Actuarially Determined Contribution 2,506,942 1,276,266 1,194,741 1,136,057 1,070,451
Contribution Deficiency (Excess) $(1,500,000) $- $- $- $-
Covered Payroll $9,741,710 $9,400,436 $10,195,504 $9,113,922 $8,198,952
Contributions as a Percentage of Covered Payroll 10% 14% 12% 12% 13%
Schedule of Employer ContributionsThe Schedule of Employer Contributions shows the employer’s required annual contributions from the annual actuarial valuation, compared with the actual contributions remitted over the past ten years.
Schedule of Employer Contributions
REQUIRED SUPPLEMENTARY INFORMATIONThe following schedules are presented to illustrate the requirement to show information for 10 years. However, until a full 10-year trend is compiled, information is presented for those years where information is available.
Annual Money Weighted ReturnThe annual money weighted rate of return on pension plan investments is calculated as the internal rate of return on pension plan investments, net of investment expenses. This expresses investment performance adjusted for the changing amounts actually invested throughout the year, measured on monthly inputs with expenses measured on an accrual basis.
This schedule is presented to illustrate the requirement to show information for 10 years. However, until a full 10-year trend is compiled, information is presented for those years where information is available.
2013 2014 2015 2016 2017 2018
Annual money-weighted rate of return, net of investment expenses 14.97% 7.32% -0.99% 10.78% 13.38% -3.59%
Schedule of Investment Returns
The following schedules refer to MERS’ staff only. A measurement date of December 31, 2016, was used. Note that while the measurement date for calculation of the net pension liability and pension expense is December 31, 2016, the schedule of employer contributions show the actuarial contributions that have been remitted through December 31, 2017, and the preceding nine years.

FINANCIAL2018 comprehensive annual financial report
55
Schedule of Changes in Employer’s Net Pension Liability/(Asset) and Related RatiosThe Schedule of Changes in Employer’s Net Pension Liability and Related Ratios shows the changes in the total pension liability less the statement of changes in fiduciary net position resulting in the net Pension Liability calculation for the employer.
Total Pension Liability/(Asset) 2015 2016 2017 2018
Service Cost $1,203,192 $1,269,997 $1,379,059 $1,457,033
Interest 1,523,654 1,706,312 1,985,384 2,192,266
Changes of Benefit Terms
Difference Between Expected and Actual Experience 313,939 (134,179) 95,943
Changes of Assumptions 1,386,692
Benefit Payments Including Employee Refunds (526,561) (565,862) (627,619) (738,847)
Other 1 (1) (1)
Net Change in Total Pension Liability/(Asset) 2,200,285 4,111,079 2,602,645 3,006,394
Total Pension Liability/(Asset) Beginning Balance 18,130,219 20,330,504 24,441,583 27,044,228
Total Pension/(Asset) Liability Ending Balance $20,330,504 $24,441,583 $27,044,228 $30,050,622
Plan Fiduciary Net Position
Contributions-Employer $2,089,079 $2,099,146 $1,672,934 $2,367,084
Contributions-Employee 398,940 520,710 514,304 525,320
Net Investment Income 1,193,652 (343,573) 2,735,307 3,753,767
Benefit Payments Including Employee Refunds (526,561) (565,862) (627,619) (738,847)
Administrative Expense (44,244) (48,754) (53,870) (59,178)
Net Change in Plan Fiduciary Net Position 3,110,866 1,661,667 4,241,055 5,848,147
Plan Fiduciary Net Position Beginning Balance 18,373,983 21,484,849 23,146,516 27,387,571
Plan Fiduciary Net Position Ending Balance $21,484,849 $23,146,516 $27,387,571 $33,235,718
Employer Net Pension Liability/(Asset) $(1,154,345) $1,295,067 $(343,343) $(3,185,096)
Plan Fiduciary Net Position as a percentage of the Total Pension Liability/(Asset) 106% 95% 101% 111%
Covered Payroll (from GASB 68 actuarial page) $9,184,670 $9,694,637 $10,080,837 $10,643,044
Employer’s Net Pension Liability/(Asset) as a percentage of covered payroll -13% 13% -3% -30%
Schedule of Changes in the Net Pension Liability/(Asset)
There were changes in the actuarial assumptions or methods affecting the 2015 valuation for smoothing, price and wage inflation, discount rate, and mortality tables based on the experience study. This calculation was done with an effective date of December 31, 2015.
Notes to Schedule of Employer Contributions:
Actuarial Cost Method: Entry Age NormalAmortization Method: Level percentage of payroll, openRemaining Amortization Period: 15 yearsAsset Valuation Method: 5 year smoothedInflation: 2.50% long-term wage inflationSalary Increases: 3.75%
Investment Rate of Return: 7.75% net of investment and administrative expensesNormal Retirement Age: 60Mortality: 50% Female/50% Male blend of the RP-2014 Healthy Annuitant Mortality Tables with rates multiplied by 105%, the RP-2014 Employee Mortality Tables, and the RP-2014 Juvenile Mortality Tables

FINANCIAL2018 comprehensive annual financial report
56
OTHER SUPPLEMENTARY INFORMATIONSchedule of Administrative Expenses for the Year Ended December 31, 2018
Budget (Unaudited) Actual Variance
Percentage of Budget
Personnel Services
Salaries $11,140,450 $11,160,999 $(20,549) 100%
Social Security 795,000 778,478 16,522 98%
Retirement 1,684,660 1,335,211 349,449 79%
Insurance 2,088,500 2,001,732 86,768 96%
Total Personnel Services 15,708,610 15,276,420 432,190 97%
Professional Services
Third Party Administrator 1,920,096 1,602,539 317,557 83%
Actuarial Services 1,512,900 1,680,129 (167,229) 111%
Audit Services 190,000 154,513 35,487 81%
Commercial Banking 100,000 95,686 4,314 96%
Temporary Personnel 10,000 0 10,000 0%
IT Services/Continuity/Records 214,995 277,429 (62,434) 129%
Business Consultants 612,380 440,017 172,363 72%
Legal Services 50,000 34,581 15,419 69%
Medical Services 170,000 126,225 43,775 74%
Total Professional Services 4,780,371 4,411,119 369,252 92%
Communication
Annual Conference 125,000 109,395 15,605 88%
Board Travel, Education and Meetings1 44,000 31,355 12,645 71%
Outreach 255,000 215,464 39,536 84%
Postage / Shipping 234,560 214,423 20,137 91%
Printing and Copying Services 87,000 82,632 4,368 95%
Telephone / Communications 230,660 207,239 23,421 90%
Travel and Meetings 195,664 178,536 17,128 91%
Total Communication 1,171,884 1,039,044 132,840 89%
Miscellaneous
Depreciation 2,968,200 2,780,844 187,356 94%
Equipment Purchases & Rental 44,590 60,896 (16,306) 137%
Insurance 395,000 388,471 6,529 98%
Building / Maintenance / Utilities 246,528 221,043 25,485 90%
Office Supplies/Subscriptions 99,321 100,088 (767) 101%
Operating Expenses 557,810 57,657 500,153 10%
Personnel Support 136,500 103,493 33,007 76%
Professional Development 208,352 179,015 29,337 86%
Software Support 1,587,314 1,150,721 436,593 72%
Service Fees2 (5,802,473) (6,703,595) 901,122 116%
Total Miscellaneous 441,142 (1,661,367) 2,102,509 -377%
Total Administrative Expenses $22,102,007 $19,065,216 $3,036,791 86%
1 Board Travel, Education, and Meetings includes $11,946 for board members training and educations, including related travel expenditures. These expenditures comply with the requirements of Section 38.1133 of the Michigan Compiled Laws.2 Service fees come primarily from fees paid on participant directed accounts to cover administrative expenses. They are treated as expenditure credit, not revenue.
Note: See accompanying Independent Auditor’s Report

FINANCIAL2018 comprehensive annual financial report
57
Note: See accompanying Independent Auditor’s Report
Budget (Unaudited) Actual Variance
Percentage of Budget
Personnel Services
Salaries $1,837,900 $1,824,366 $13,534 99%
Social Security 93,300 94,303 (1,003) 101%
Retirement 210,500 172,057 38,443 82%
Insurance 181,500 183,223 (1,723) 101%
Total Personnel Services 2,323,200 2,273,949 49,251 98%
Professional Services
Commercial Banking 1,000,000 1,052,329 (52,329) 105%
Investment Managers 14,000,000 10,298,951 3,701,049 74%
Business Consultants 125,000 71,954 53,046 58%
Total Professional Services 15,125,000 11,423,234 3,701,766 76%
Miscellaneous
Travel 143,000 82,072 60,928 57%
Office Supplies 5,000 1,386 3,614 28%
Professional Development 16,000 12,378 3,622 77%
Operating Expenses 10,000 3,866 6,134 39%
Research and Portfolio Management 400,000 243,060 156,940 61%
Total Miscellaneous 574,000 342,762 231,238 60%
Total Investment Expenses $18,022,200 $14,039,945 $3,982,255 78%
Schedule of Investment Expenses for the Year Ended December 31, 2018

FINANCIAL2018 comprehensive annual financial report
58
Firm Nature of Services Amount
Tegrit Software Ventures, Inc. Software Consulting and Configuration Services $3,123,936
Gabriel, Roeder, Smith & Company Actuarial Consultant 1,861,720
Alerus Retirement Solutions Third Party Administration 1,603,440
CBIZ, Inc. Actuarial Consultant 1,181,694
Plante & Moran, PLLC Auditing Services 180,963
Gartner, Inc. Software Consulting and Configuration Services 150,000
Jones Day Investment Consultant 149,281
Bloomberg Finance L.P. Investment Data Services 134,555
Managed Medical Review Organization Medical Advisors 126,225
Ice Miller, LLP Legal Services 107,419
Moore Trosper Construction and Building Modification 102,928
Miller, Canfield, Paddock, and Stone, PLC Legal Services 76,360
Rapid7 LLC Software Consulting and Configuration Services 65,043
Byrum & Fisk Advocacy Marketing and Public Relations Services 57,000
Winklevoss Technologies LLC Software Consulting and Configuration Services 52,000
Stephen Morrow Investment Consultant 51,159
Michigan Legislative Consultants Legislative Consultant 42,840
BCA Research Investment Consultant 41,754
Martin Commercial Properties, Inc. Real Estate Consultant 40,240
L.P. Gavekal Capital Investment Consultant 40,000
Cylance, Inc. Software Consulting and Configuration Services 34,600
Gallagher Benefit Services, Inc. Benefit Consultant 30,000
Ned Davis Research Investment Consultant 30,000
Karoub Associates Legislative Consultant 24,720
Informa Investment Solutions Investment Consultant 22,251
Total Solutions, Inc. Software Consulting and Configuration Services 22,023
This schedule only includes firms whose annual payment amount was $20,000 or above.
Fees paid to investment managers are included in the Investment Section.
Payments to consultants are already included in the Administrative and Investments Expenses reported in the Statement of Changes in Fiduciary Net Position.
See accompanying Independent Auditor’s Report.
Schedule of Payments to Consultants – December 31, 2018

INVESTMENTS


INVESTMENTS2018 comprehensive annual financial report
61
CHIEF INVESTMENT OFFICER REPORT
Dear Members and MERS Retirement Board:
I respectfully submit the investment activity for the Municipal Employees’ Retirement System (MERS) of Michigan’s Comprehensive Annual Financial Report for the year ending December 31, 2018.
As always, our goal is to invest fund assets to achieve the long-term objectives of our member municipalities established by the Board, within prudent risk parameters. Our investment returns consistently outperform various benchmarks and market averages, through a long-term approach designed to provide downside protection and upside market participation.
Economic Overview Global markets exhibited elevated levels of volatility as the year progressed, culminating in a significant fourth quarter correction across financial markets. Equity markets finished the year in negative territory across all segments and geographies. U.S. markets fared better than international markets with the S&P 500 down -4.38% versus the MSCI ACWI IMI returning -10.08%. Smaller capitalized equities experienced significant draw downs, particularly in international and emerging markets. International small cap equities where down -17.89% and emerging market equities -14.58%. Fixed income provided needed diversification and exhibited positive returns, with the Barclays U.S. Aggregate positive in the fourth quarter and flat at year-end. U.S. GDP grew at 2.9% in 2018 up from 2.6% in 2017. Job growth was strong throughout the year, but is expected to slow going forward. The unemployment rate continued to fall, finishing the year at 3.7%. The economy remains near full employment and wage pressure trended upward as the higher job numbers are likely a result in tighter job market for employers and increase cost for business expansions.
While interest rates remain at historic lows, the U.S. has entered into a new interest rate regime. Fed Chair, Jerome Powell signaled early in the year that rate hikes would continue and in fact initiated two, but signaled that they would be data dependent going forward, indicating that a pause in 2019 was possible. Despite economic strength, the U.S. Treasury yield curve flattened. The Eurozone’s cyclical recovery stalled with a year-over-year growth rate falling 2.1%, a rate below the U.S. However, the banking sector remains a concern in southern Europe. Populist sentiment once again increased across Europe after declining across the continent in 2017. Broad based economic acceleration is beginning to occur in the emerging markets which is reflected in expectations for 2018 global GDP growth to finish at 3.7%.
While global markets moved into negative territory in 2018, economic data remained broadly positive. Several themes articulated last year continue to hold. The backdrop of increasing market volatility and a shift toward increased nationalistic economic policies are likely to persist, and increase global volatility going forward. Geopolitical instability in Asia and the Middle East will continue to influence market perceptions, largely to the negative. In addition, U.S. economic and foreign policy shifts are expected to potentially contribute to elevated levels of geopolitical instability. Developed markets will continue to grapple with aging populations and high legacy costs.
Low interest rates may compress returns across all asset classes. The U.S. has signaled that it will pause its monetary tightening policy and expand fiscal policy through simulative public policy. This will eventually put upward pressure on both interest rates and inflation. However, interest rate levels remain artificially depressed from a historic perspective. This coupled with the increasing likelihood that we are nearing the top of the business cycle will make it difficult to meet return objectives in the near term, placing additional stress on financial systems.

INVESTMENTS2018 comprehensive annual financial report
62
MERS Total Portfolio The MERS Total Portfolio performed returned -3.51% gross of fees for the year, outperforming its policy benchmark which returned -5.36%. The portfolio continued to outperform consistently for longer time periods through 10 years. Global equities drove the Total Portfolio’s performance to the negative for the year with international and emerging market equities experiencing significant drawdowns. Diversifying strategies, real assets and fixed income asset classes provide much needed diversification and positive returns in 2018. MERS’ decision to reduce risk was rewarded with strong relative returns. The global fixed income market remained a challenging area due to persistently low interest rates. The fixed income portfolio continued to exhibit a strategically lower duration, which paid off as interest rates increased throughout the year causing bond prices to fall.
MERS 2018 highlights:
• MERS Total Portfolio returned -3.51% gross of fees for the year, outperforming its policy benchmark by 1.85%. The five year return of 5.16% outperformed the policy benchmark by 1.82% on an annualized basis. The portfolio returned 8.51% at the 10-year mark and has outperformed the policy benchmark in all time periods (1, 3, 5, 7, and 10 year).
• The Office of Investments completed work on a Valuation Based Allocation approach to its investment program.
• The target asset allocation breakdown is shown below:
Global Equity 55.5% Global Fixed Income 18.5%Real Assets 13.5% Diversifying Strategies 12.5%
• At the broad asset class level, absolute returns gross of investment fees for the year were as follows:
Global Equity -8.38%Global Fixed Income 0.69%Real Assets 3.50%Diversifying Strategies 1.98%
In conclusion, I would like to thank the MERS Retirement Board for their continued support of the Office of Investments in their roles as the fiduciaries of the MERS Plan. The clarity of MERS’ governance structure and the functional checks and balances has allowed the investment program to be successful for our members. This relationship makes for a more efficient decision-making process, benefiting our membership through stronger risk-adjusted returns.
Respectfully,
Jeb BurnsChief Investment Officer

INVESTMENTS2018 comprehensive annual financial report
63
REPORT ON INVESTMENT ACTIVITY
The Board, as “investment fiduciary” under the Public Employee Retirement System Investment Act (PERSIA), MCL 38.1132 et seq., has the fiduciary responsibility and authority to direct the investments of MERS’ trust assets. Board Members must discharge their duties for the exclusive benefit of plan participants and beneficiaries. PERSIA requires that the Board “act with the same care, skill, prudence, and diligence under the circumstances then prevailing that a prudent person acting in a similar capacity and familiar with those matters would use in the conduct of a similar enterprise with similar aims.” MCL 38.1133(3). MERS offers a Defined Benefit Plan (DB), Defined Contribution Plan (DC), Hybrid Plan, Health Care Savings Program (HCSP), 457 Program (457), Deemed Individual Retirement Account (IRA), Retiree Health Funding Vehicle (RHFV), and Investment Services Program (ISP) (the “Plans”). The Board has delegated all investment management operations and activities to the Chief Executive Officer and the Board’s Investment Committee, except those specifically reserved for the Board. The CEO is directly responsible for all day-to-day activities of MERS. The CEO has delegated management of MERS’ trust assets to the Office of Investments, including all investment management activities. All transactions undertaken on behalf of the Plans shall be for the sole interest of the Plans’ participants and beneficiaries.
The MERS Investment Policy Statement (IPS) outlines the investment goals, objectives, and policies of the MERS Total Portfolio (the Portfolio). The purpose of the IPS is to ensure that the investment activities are carried out within the framework established by MERS’ policy and administrative documents. The IPS assists the Board, Investment Committee, and the Office of Investments in effectively and prudently monitoring and administering MERS’ investment. The IPS addresses the following:
• The goals of MERS’ investment program• Investment policies• Performance objectives and evaluation• Major investment programs• Investment processes and procedures
The IPS is designed to provide sufficient flexibility in the management and oversight process to reflect the dynamic nature of the capital markets. It is a working document and may be modified as needed or as market conditions change. At a minimum, the IPS will be reviewed and approved annually by the Board.
Plan investments are presented at fair value. Short-term investments are valued at cost plus accrued interest, which approximates fair value. Securities traded on a national or international exchange are valued at the last reported sales price at current exchange rates. Corporate bonds not traded on a national or international exchange are based upon equivalent values of comparable securities with similar yield and risk. Independent appraisals are the basis for valuing the fair value of real estate. Other investments that do not have established markets are recorded at an estimated fair value. Real estate, private equity, and certain alternative investments typically have a quarter lag in reporting, which is the industry standard. Periodic and independent appraisals of these assets are carried out to ensure an accurate valuation to assist in properly assessing the value of the Portfolio.
MERS uses a time-weighted rate of return calculation methodology based on the market rate of return for the schedule of investment results in this report.
The annual money weighted rate of return on pension plan investments is calculated as the internal rate of return on pension plan investments, net of investment expenses. This expresses investment performance adjusted for the changing amounts actually invested throughout the year, measured on monthly inputs with expenses measured on an accrual basis. The annual money weighted rate of return net of investment expenses measured on monthly inputs was -3.59%.

INVESTMENTS2018 comprehensive annual financial report
64
DEFINED BENEFIT PLAN
In conformity with PERSIA, the primary goal of the MERS investment program is to grow assets at a rate which, when coupled with employer and employee contributions, satisfies promised benefits to MERS members. To achieve this objective, the Investment Committee allocates MERS assets with a strategic, long-term perspective and a high degree of prudence to reduce risk by:
• Exceeding the actuarial investment assumption on a long-term basis, which is currently 7.75% annually
• Maintaining adequate liquidity to pay promised benefits
• Adopting a strategic asset allocation plan that reflects current and future liabilities, minimizes volatility, and maximizes the long-term total rate of return
• Minimizing the costs associated with the implementation of the asset allocation through the efficient use of internal and external resources
• Maintaining above median peer rankings for the 10-year time period
• Exceeding the return of the Portfolio’s Policy Benchmark. The Policy Benchmark currently consists of 45% Russell 3000, 25% Bloomberg Barclays Global Aggregate Bond Index, 20% MSCI ACWI IMIex-US, and 10% Bloomberg Barclays Global Aggregate ex US
PORTFOLIO HIGHLIGHTSAsset AllocationThe Portfolio’s asset allocation is the single most important determinant of achieving the stated investment goals. The Office of Investments conducts an asset allocation study every 3 years to assess portfolio construction and strategy. The MERS Board adopts and implements an asset allocation policy that is predicated on a number of factors, including:
• A projection of actuarial assets, liabilities, and benefit payments
• Historical and expected long-term capital market risks and returns for each asset class
• Expected correlations of returns among various asset classes
• An assessment of future economic conditions, including inflation and interest rate levels
• Various risk/return scenarios
• Liquidity requirements
INVESTMENT OBJECTIVES AND ACTIVITY

INVESTMENTS2018 comprehensive annual financial report
65
Criteria for Inclusion of Asset ClassesThe following criteria will be used in assessing an asset class for inclusion in the Portfolio:
• Sufficient size and liquidity to permit an investment by the Portfolio
• Staff, external managers, or consultant expertise to ensure proper due diligence and cost-effective implementation
• The incorporation of the asset class contributes to the return enhancement and/or further diversification of the Portfolio’s assets
• Ability to readily measure performance and risk against appropriate benchmarks
The Board sets target allocations to various asset classes that are designed to meet MERS’ long-term objectives and establishes minimum and maximum allowable allocations for each asset class. The bands allow flexibility to pursue tactical shifts or investment strategies over shorter time periods.
Asset Class Target Weight Min/ Max Bands Minimum Allocation Maximum Allocation
Global Equity 55.5% +/- 10.0% 45.5% 65.5%
Global Fixed Income 18.5% +/- 7.5% 11.0% 26.0%
Real Assets 13.5% +/- 5.0% 8.5% 18.5%
Diversifying Strategies 12.5% +/- 5.0% 7.5% 17.5%
Current Targeted Allocations and Allocation Bands
Portfolio Rebalance PolicyIn conducting rebalancing activities, the Office of Investments operates in accordance with the following:
• Reviews the asset allocation at least monthly to ensure conformance with the asset allocation set by the Board
• Initiates rebalancing transactions to bring all percentages to values inside the bands or promptly seek Board approval to remain outside the bands in the event that an asset class falls out of the said bands
• Deviates from an asset class’ target allocation, but stay within the allowable bands when implementing a tactical shift or investment strategy
• Implements rebalancing activities at a reasonable cost using either index futures via an external derivatives manager or using hard dollars
• Approves all rebalancing transactions
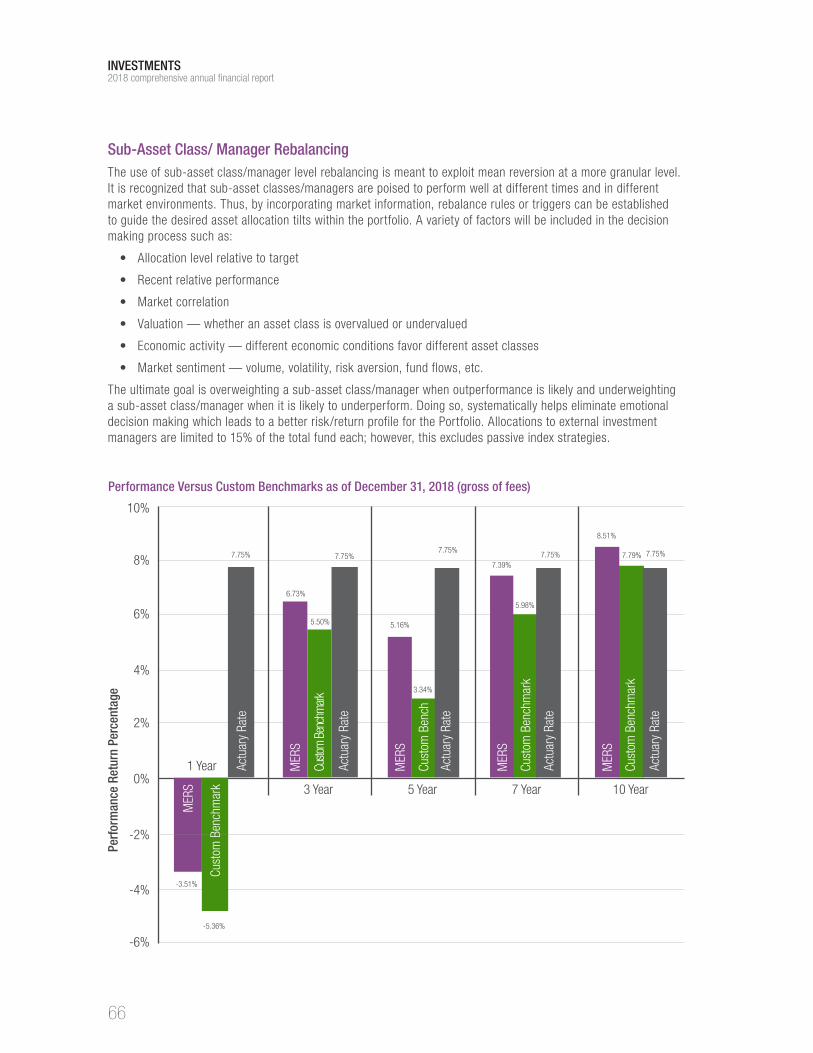
INVESTMENTS2018 comprehensive annual financial report
66
Performance Versus Custom Benchmarks as of December 31, 2018 (gross of fees)
10%
-4%
8%
-6%
6%
4%
2%
0%1 Year
Perf
orm
ance
Ret
urn
Perc
enta
ge
3 Year 5 Year 7 Year 10 Year
6.73%
MER
S
5.50%
Custo
m B
ench
mark
7.75%
Actu
ary
Rate
3.34%
Cust
om B
ench
7.75%
Actu
ary
Rate
5.16%
MER
S
5.98%
Cust
om B
ench
mar
k
7.75%Ac
tuar
y Ra
te7.39%
MER
S
7.79%
Cust
om B
ench
mar
k
7.75%
Actu
ary
Rate
8.51%
MER
S
7.75%
Actu
ary
Rate
-5.36%
Cust
om B
ench
mar
k
-3.51%
MER
S
-2%
Sub-Asset Class/ Manager RebalancingThe use of sub-asset class/manager level rebalancing is meant to exploit mean reversion at a more granular level. It is recognized that sub-asset classes/managers are poised to perform well at different times and in different market environments. Thus, by incorporating market information, rebalance rules or triggers can be established to guide the desired asset allocation tilts within the portfolio. A variety of factors will be included in the decision making process such as:
• Allocation level relative to target
• Recent relative performance
• Market correlation
• Valuation — whether an asset class is overvalued or undervalued
• Economic activity — different economic conditions favor different asset classes
• Market sentiment — volume, volatility, risk aversion, fund flows, etc.
The ultimate goal is overweighting a sub-asset class/manager when outperformance is likely and underweighting a sub-asset class/manager when it is likely to underperform. Doing so, systematically helps eliminate emotional decision making which leads to a better risk/return profile for the Portfolio. Allocations to external investment managers are limited to 15% of the total fund each; however, this excludes passive index strategies.

INVESTMENTS2018 comprehensive annual financial report
67
Downside Protection, Upside Participation as of December 31, 2018
Diversification is a portfolio strategy designed to reduce exposure to the volatility of returns by combining a variety of investments (such as stocks, bonds, real estate, and commodities) which are unlikely to all move in the same direction. The goal of diversification is to reduce the risk in a portfolio. While it is impossible to foresee all market risks, the strategic goal of the MERS asset allocation policy and the portfolio is to create a well-diversified portfolio that provides downside market protection with upside market participation.
Current Asset Allocation versus Target Allocation as of December 31, 2018
60%
50%
40%
30%
20%
0%
10%
Global Equity Global Fixed Income Real Assets Diversifying Strategies
49.4%
55.5%
Allo
catio
n %
28.9%
18.5%
11.3% 13.5%
10.4%
12.5%
Current Allocation
Target Allocation
Curr
ent A
lloca
tion
Targ
et A
lloca
tion
Targ
et A
lloca
tion
Targ
et
Targ
et
Curr
ent A
lloca
tion
Curr
ent
Curr
ent
$-
$50
$100
$150
$200
$250
$300
$350
$400
$450
$500
$550
$600
$650
Dec-96 Mar-98 Jun-99 Sep-00 Dec-01 Mar-03 Jun-04 Sep-05 Dec-06 Mar-08 Jun-09 Sep-10 Dec-11 Mar-13 Jun-14 Sep-15 Dec-16 Mar-18
Grow
th o
f $10
0
As of December 31, 2018
MERS Total Plan BBG Barclays U.S. Aggregate Russell 3000

INVESTMENTS2018 comprehensive annual financial report
68
Statistical Performance
*45% Russell 3000, 20% MSCI ACWI ex USA IMI (Net), 25% Bloomberg Barclays Aggregate, 10% BBG BARC Global Aggregate ex US
Securities LendingThe System participates in the securities lending program at the custodian as permitted under Section 20e of PERSIA. MCL 38.1140e. The securities lending program is managed in a prudent manner for the sole benefit of its participants and beneficiaries in accordance with PERSIA. MERS uses existing assets to generate an additional and steady source of income through conservative securities lending practices.
Gross Earnings Rebates Agent/Mgr fees Net earnings
First Quarter $3,707,263 $2,628,215 $215,803 $863,244
Second Quarter 4,614,267 3,461,286 230,588 922,393
Third Quarter 5,064,572 4,083,437 196,223 784,912
Fourth Quarter 4,657,541 3,929,756 145,555 582,230
Totals $18,043,642 $14,102,695 $788,169 $3,152,778
Securities Lending 2018 Rebates and Fees
Portfolio Characteristics 1 Year 3 Year 5 Year 7 Year 10 Year
Annualized Return (gross of fees) -3.51% 6.73% 5.16% 7.39% 8.51%
Annualized Standard Deviation 5.61% 5.01% 5.39% 5.62% 7.48%
Sharpe Ratio (0.96) 1.14 0.84 1.24 1.09
Excess Return 1.85% 1.23% 1.82% 1.41% 0.72%
Correlation to Policy Benchmark 0.98 0.92 0.92 0.93 0.96
1 Year 3 Year 5 Year 7 Year 10 Year
MERS Total Portfolio (Gross of Fees) -3.51% 6.73% 5.16% 7.39% 8.51%
MERS Total Portfolio (Net of Fees) -3.64% 6.51% 4.94% 7.16% 8.25%
MTP Custom Benchmark* -5.36% 5.50% 3.34% 5.98% 7.79%
Excess (Gross) 1.85% 1.23% 1.82% 1.41% 0.72%

INVESTMENTS2018 comprehensive annual financial report
69
Reconciliation of Investments to Financial Statements
Total Investments from above 10,259,702,631
Receivables - Sale of Investments, Interest & Dividends (438,824,838)
Alternative asset adjustment not on State Street portfolio 21,278,692
Investment in Land 1,402,094
Investments not in Mutual Funds and Self Directed Accounts 550,510,675
Investments in cash 30,769,779
Rounding 2,173
Payables - Purchases of Investments 408,234,235
Investments on Financial Statements $10,833,075,442
Investment Summary for Defined Benefit Plan, Defined Contribution Plan, Hybrid Plan, Health Care Savings Program, Retiree Health Funding Vehicle, 457 Program, IRA, and Investment Services Program as of December 31, 2018
Note: Includes receivables and payables for sales and purchases of securities with settlement dates after December 31, 2019.
Type of Investment Market Value Percentage
Global Fixed Income $2,960,761,077 28.9%
Global Equities 5,068,543,472 49.4%
Diversifying Strategies 1,063,959,520 10.4%
Real Assets 1,166,438,562 11.4%
Sub Total Investments 10,259,702,631

INVESTMENTS2018 comprehensive annual financial report
70
Global Equity AssetClass Summary
GLOBAL EQUITY ASSET CLASS SUMMARY
US Large
Cap
23.25%
US Mid Cap
7.05%
US Small Cap
0.66%
US Micro
Cap
7.75%
International
Developed
13.96%
International
Small Cap
10.07%
Emerging
Market
14.02%
Emerging Market
Small Cap
6.82%
Frontier
Market
6.40%
Private
10.02%
As of December 31, 2018, the Global Equity portfolio had a fair value of $5.1 billion, representing 49.4% of the Fund. Performance for this portfolio was -8.38% gross of fees for the year.
The Global Equity portfolio as of December 31, 2018, had a target allocation of 55.5% of the Portfolio, representing the largest portion of MERS’ Defined Benefit Portfolio. The portfolio is designed to provide long-term capital appreciation, generate current income, and provide a hedge against inflation. To manage risk the global equity assets are diversified across geographic regions, styles, and the market capitalization spectrum.
A core portion of the global equity portfolio is invested in highly liquid equity securities including, but not limited to, U.S. large cap equities, U.S. mid cap equities, and developed ex U.S. large and mid cap equities. The portfolio may also include higher risk investments such as small cap equities, micro cap equities, private equity, emerging market equities, and frontier market equities.
Both internal and external managers are used within the Global Equity portfolio. The use of a passive investment approach versus active management will vary based on the composition of the asset class. In efficient markets, such as U.S. large cap equities, passive exposure will be favored in order to reduce of management fees. In inefficient markets, such as emerging markets, active management will be favored in order to reduce risk and add value over a passive approach.
MERS uses a time-weighted rate of return calculation methodology based on the market rate of return for the schedule of investment results in this report.
Equity Asset Class Summary

INVESTMENTS2018 comprehensive annual financial report
71
Global Equity Performance as of December 31, 2018
1 19.82% S&P 500 Index, 4.5% S&P 400 Index, 4.5% S&P 600 Index, 11.71% Russell Microcap Index, 11.71% MSCI EAFE Index (Net), 10.81% MSCI EAFE Small Cap Index (Net), 13.51% MSCI Emerging Markets Index (Net), 9.01% MSCI Emerging Markets Small Cap Index (Net), 5.41% MSCI Frontier Markets Index (Net), 9.01% Private Equity Blend2 50% Russell 2000, 50% MSCI EAFE Small Cap Net
1 Year 3 Years 5 Years 10 Years
Global Equity -8.38% 7.26% 5.24% 10.43%
Global Equity Blend1 -12.49% 7.45% 5.79% 11.79%
Excess 4.11% -0.19% -0.55% -1.36%
U.S. Large Cap Equity -5.52% 9.68% 9.16% 14.02%
S&P 500 Index -4.38% 9.26% 8.49% 13.12%
Excess -1.14% 0.42% 0.67% 0.90%
U.S. Mid Cap Equity -10.82% 5.59% 5.11% 12.69%
S&P 400 Index -11.08% 7.66% 6.03% 13.68%
Excess 0.26% -2.07% -0.92% -0.99%
U.S. Small Cap Equity -9.12% 8.90% 4.71% 12.44%
S&P 600 Index -8.48% 9.46% 6.34% 13.60%
Excess -0.64% -0.56% -1.63% -1.16%
U.S. Micro Cap Index -11.12% 6.84% 3.58%
Russell Micro Cap Index -13.08% 5.79% 3.08%
Excess 1.96% 1.05% 0.50%
International Developed Equity -8.91% 2.13%
MSCI EAFE -13.79% 2.87%
Excess 4.88% -0.74%
International Small Cap Equity -17.02% 6.92% 5.41% 13.12%
MSCI EAFE Small Cap (Net) -17.89% 3.73% 3.06% 10.51%
Excess 0.87% 3.19% 2.35% 2.61%
Emerging Market Equity -15.67% 8.44% 0.93%
MSCI Emerging Markets -14.58% 9.25% 1.65%
Excess -1.09% -0.81% -0.72%
Emerging Market Small Cap Equity -17.24% 7.23%
MSCI EM Small Cap Equity -18.59% 3.68%
Excess 1.35% 3.55%
Frontier Market Equity -10.44% 6.27% 1.28% 5.58%
MSCI Frontier Market Index -16.41% 4.21% 0.67% 4.75%
Excess 5.97% 2.06% 0.61% 0.83%
Private Equity 17.25% 10.61% 11.33% 9.02%
Private Equity Blend2 -14.37% 5.73% 3.92% 11.45%
Excess 31.62% 4.88% 7.41% -2.43%
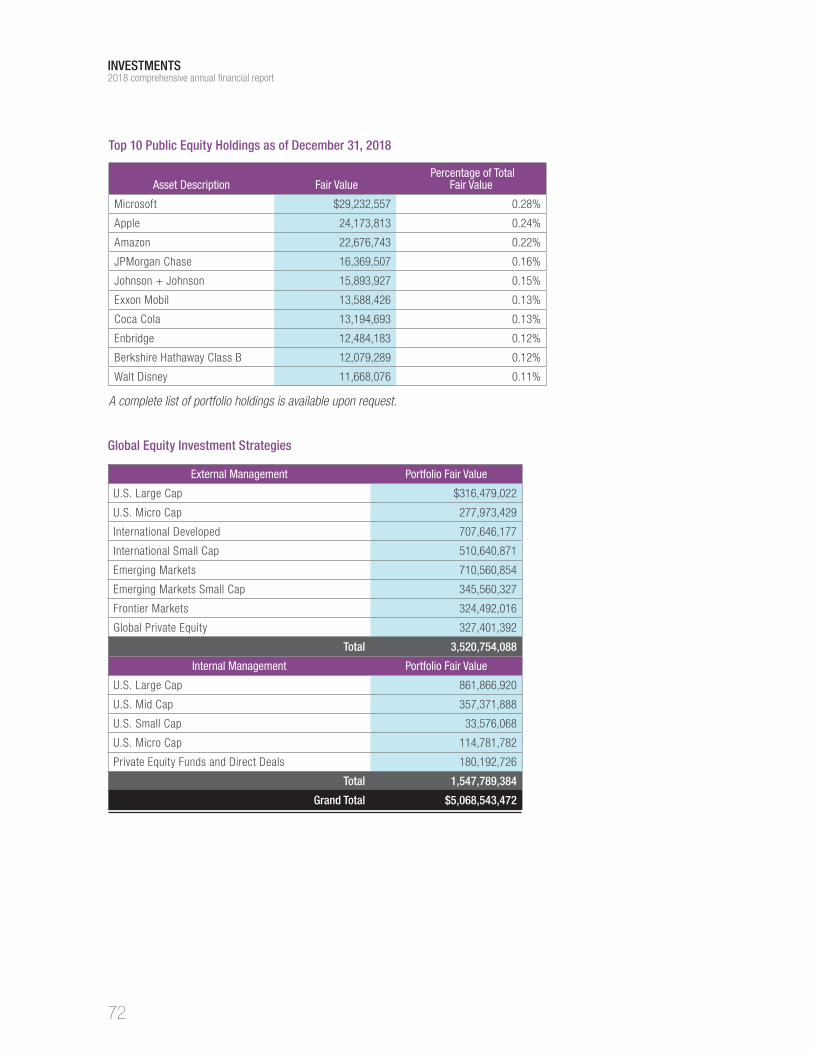
INVESTMENTS2018 comprehensive annual financial report
72
Asset Description Fair Value Percentage of Total
Fair Value
Microsoft $29,232,557 0.28%
Apple 24,173,813 0.24%
Amazon 22,676,743 0.22%
JPMorgan Chase 16,369,507 0.16%
Johnson + Johnson 15,893,927 0.15%
Exxon Mobil 13,588,426 0.13%
Coca Cola 13,194,693 0.13%
Enbridge 12,484,183 0.12%
Berkshire Hathaway Class B 12,079,289 0.12%
Walt Disney 11,668,076 0.11%
Top 10 Public Equity Holdings as of December 31, 2018
A complete list of portfolio holdings is available upon request.
Global Equity Investment Strategies
External Management Portfolio Fair Value
U.S. Large Cap $316,479,022
U.S. Micro Cap 277,973,429
International Developed 707,646,177
International Small Cap 510,640,871
Emerging Markets 710,560,854
Emerging Markets Small Cap 345,560,327
Frontier Markets 324,492,016
Global Private Equity 327,401,392
Total 3,520,754,088
Internal Management Portfolio Fair Value
U.S. Large Cap 861,866,920
U.S. Mid Cap 357,371,888
U.S. Small Cap 33,576,068
U.S. Micro Cap 114,781,782
Private Equity Funds and Direct Deals 180,192,726
Total 1,547,789,384
Grand Total $5,068,543,472

INVESTMENTS2018 comprehensive annual financial report
73
Emerging Markets Debt
10.20%
Cash
16.17%
Global High Yield
3.44%
Global Fixed Income
Asset Allocation
U.S. Core Fixed Income
70.19%
GLOBAL FIXED INCOME ASSET CLASS SUMMARYAs of December 31, 2018, the Global Fixed Income portfolio had a fair value of $2.5 billion, representing 24.2% of the Fund. Performance for fixed income was 0.69% gross of fees for the year.
The Global Fixed Income allocation (18.5% targeted) plays a vital role in the MERS Defined Benefit Portfolio. The core of the portfolio includes investment grade securities such as U.S. Treasury bonds, corporate bonds, and global investment grade debt. This portfolio is designed to provide downside protection, diversification, stable income, and liquidity. The core fixed income portfolio is expected to preserve capital and provide liquidity that may be used for portfolio rebalancing in stressed market environments.
The Global Fixed Income portfolio may also include higher risk investments such as high yield bonds, emerging market debt, structured credit investments, and other below investment grade securities. These below investment grade securities entail higher risk, including the potential impairment of capital and low liquidity. However, these securities tend to exhibit equity-like risk/return profiles combined with higher cash yields and will only be purchased when risk premiums are high.
Both internal and external management will be utilized within the Global Fixed Income portfolio.
Internal management will be focused on investment grade core fixed income and will entail active decisions regarding duration, sector allocation, and security selection within U.S. Treasuries, corporate bonds, and other sectors. External managers may also be used within Core Fixed Income. Risk characteristics (such as duration) will be monitored on an aggregate basis including both internal and external portfolios. External managers willbe used in the management of sub-investment grade securities. The Office of Investments will utilize specialized managers to opportunistically invest in certain portions of the sub-investment grade fixed income market. Exchange Traded Funds (ETFs) and other index-linked products may also be used to cost-effectively implement bond strategies in lieu of using active managers.
MERS uses a time-weighted rate of return calculation methodology based on the market rate of return for the schedule of investment results in this report.
Global Fixed Income Asset Allocation

INVESTMENTS2018 comprehensive annual financial report
74
1 Year 3 Years 5 Years 10 Years
Global Fixed Income 0.69% 4.01% 3.55% 4.43%
Global Fixed Income Blend* -1.34% 3.14% 2.50% 5.04%
Excess 2.03% 0.87% 1.05% -0.61%
U.S. Core Fixed Income 0.73% 2.09% 2.57% 5.16%
Bloomberg Barclays Aggragate Bond Index 0.01% 2.06% 2.52% 3.48%
Excess 0.72% 0.03% 0.05% 1.68%
Emerging Markets Debt -2.06% 7.18% 4.17%
JPMorgan EMBI Global Diversified Index -4.26% 5.15% 4.80%
Excess 2.20% 2.03% -0.63%
Global High Yield 1.90%
Bank of America Merrill Lynch Global High Yield Index -3.35%
Excess 5.25%
Cash 0.84% 1.26% 1.04% -1.56%
91 Day Treasury Bill 1.87% 1.02% 0.63% 0.37%
Excess -1.03% 0.24% 0.41% -1.93%
Global Fixed Income Performance as of December 31, 2018 (gross of fees)
*54.05% BBG Barclays US Agg, 27.03% JP Morgan EMBI Global Diversified, 10.81% BofA Merrill Lynch Global High Yield Index, 8.11% US 91-Day Treasury Bills
A complete list of the portfolio holdings is available upon request.
Asset Description Fair Value Percentage of Total
Fair Value
US TREASURY N/B $120,539,063 1.17%
TREASURY BILL 67,625,020 0.66%
US TREASURY N/B 59,674,219 0.58%
US TREASURY N/B 59,423,437 0.58%
US TREASURY N/B 59,322,656 0.58%
US TREASURY N/B 53,047,070 0.52%
US TREASURY N/B 50,091,797 0.49%
US TREASURY N/B 49,675,781 0.48%
US TREASURY N/B 49,625,000 0.48%
US TREASURY N/B 49,533,203 0.48%
Top 10 Global Fixed Income Holdings as of December 31, 2018

INVESTMENTS2018 comprehensive annual financial report
75
External Management Portfolio Fair Value
U.S. Core Fixed Income $952,737,592
Emerging Markets Debt 198,467,344
Global High Yield 101,907,333
Total 1,253,112,269
Internal Management Portfolio Fair Value
U.S. Core Fixed Income 1,125,404,550
Emerging Markets Debt 103,667,564
Total 1,229,072,114
Grand Total $2,482,184,383
Global Fixed Income – Investment Strategies
REAL ASSETS CLASS SUMMARYAs of December 31, 2018, the Real Assets portfolio had a fair value of $1.2 billion, representing 11.4% of the Fund’s portfolio. The target allocation is 13.5% of the total portfolio. Performance for Real Assets was 3.5% gross of fees for the year.
The primary objective of the Real Assets allocation is to provide some degree of protection for the Portfolio against inflation. Secondary objectives are capital growth and if possible, current yield through cash dividends. Examples of potential real asset categories include:
• Real Estate• Commodities• Infrastructure• Agriculture/Farmland
The Real Assets portfolio is constructed in a diversified manner, with no single investment comprising morethan 20% of the total allocation to Real Assets. Investments in real assets may be either liquid (those that could be liquidated within 30 days) or illiquid (investments where capital is committed for multi-year periods of time). Illiquid strategies are defined as strategies with contractual lockups that would take greater than one year to liquidate. Examples of liquid real assets investments include commodities futures, sector specific equities,or sector specific publicly traded debt. Examples of illiquid investments include commingled funds, limited partnerships, co-investments, or private placements.
MERS uses a time-weighted rate of return calculation methodology based on the market rate of return for the schedule of investment results in this report.
Strategy Portfolio Fair Value
Diversified Real Assets $50,313,904
Real Estate 311,197,855
Triple Net Real Estate 25,369,352
Timber 40,161,007
Infrastructure 170,160,719
Commodities 306,071,629
Agriculture & Farmland 263,164,096
Grand Total $1,166,438,562
Real Assets – Investment Strategies

INVESTMENTS2018 comprehensive annual financial report
76
Commodities
26.24%
Real Estate
26.69%
Timber 3.44%
Diversified Real Assets 4.31%
Infrastructure
14.59%
Agriculture &
Farmland
22.56%
Triple Net Real Estate 2.17%
Real AssetsAllocation
Real Assets Allocation
Real Assets Performance as of December 31, 2018 (gross of fees)
1 18.52% Real Estate Blend, 7.41% BBG Barclays Inv Grade CMBS BBB Index, 22.22% Private Infrastructure Blend, 33.33% Bloomberg Commodities Index, 18.52% S&P Global Agribusiness Equity Index2 80% FTSE NAREIT All Equity REITS, 20% Barclays Investment Grade CMBS BBB Index3 50% DJ Brookfield Global Infrastructure Index, 50% BBG Barclays Global Inflation-Linked
1 Year 3 Years 5 Years 10 Years
Real Assets 3.50% 8.01% 6.14% 4.07%
Real Assets Blend1 -7.25% 2.12% 1.45% 2.64%
Excess 10.75% 5.89% 4.69% 1.43%
Diversified Real Assets 2.61%
Real Assets Blend -7.25%
Excess 9.86%
Real Estate 10.48% 13.07% 13.67% 6.19%
Real Estate Blend2 -2.07% 4.84% 7.73% 13.01%
Excess 12.54% 8.23% 5.95% -6.82%
Triple Net Real Estate 29.69% 15.19% 15.10%
BBG BARC CMBS Inv Grd (Bbb) Idx 5.46% 6.71% 4.81%
Excess 24.23% 8.49% 10.29%
Timber 14.14% 13.45% 8.13% 5.16%
S&P Global Timber & Forestry Index Net -17.69% 7.72% 3.39% 8.70%
Excess 31.83% 5.73% 4.74% -3.54%
Infrastructure 3.29% 4.45% 4.76% 3.89%
Private Infrastructure Blend3 -4.53% 1.97% 2.88% 4.26%
Excess 7.82% 2.49% 1.88% -0.37%
Commodities -12.95% 10.88% 0.57% 2.85%
Bloomberg Commodity Index Total Return -11.25% 0.30% -8.80% -3.78%
Excess -1.70% 10.59% 9.37% 6.63%
Agriculture & Farmland 19.74% 7.67% 8.74%
S&P Global Agribusiness Equity Index -13.71% 4.73% 1.77%
Excess 33.45% 2.93% 6.97%

INVESTMENTS2018 comprehensive annual financial report
77
DIVERSIFYING STRATEGIES CLASS SUMMARYAs of December 31, 2018, the Diversifying Strategies portfolio had a fair value of $1.1 billion, representing 10.4% of the total portfolio. Performance for the strategy was 1.98% gross of fees for the year, making it the second highest asset class return for MERS.
The Diversifying Strategies allocation (12.5% targeted) is expected to provide the Fund with downside protection and uncorrelated returns with traditional asset classes, specifically equities.
The following criteria are used to classify a diversifying strategy
• Correlation or Beta of 0.40 or less with equity markets
• Superior risk-adjusted returns (as measured by Sharpe ratio and other appropriate statistical measures)
• Returns resulting from idiosyncratic (non-market) risks
Illiquid and liquid strategies are both considered when funding the Diversifying Strategies portfolio. As a result illiquid Diversifying Strategies are expected to deliver higher returns with higher levels of risk. Liquid strategies are defined as strategies that can be liquidated within thirty days. These strategies will have lower expected returnsand lower levels of risk.
The MERS Office of Investments adheres to the following portfolio construction guidelines for the Diversifying Strategies portfolio:
• The portfolio is diversified across a minimum of four different strategies at any one time
• Each strategy targets a minimum of $100M and positions will be initiated at a minimum size of $50M when possible
• The Asset Allocation Study determines the target allocation between illiquid strategies and liquid strategies
MERS uses a time-weighted rate of return calculation methodology based on the market rate of return for the schedule of investment results in this report.
Diversifying Strategies Performance as of December 31, 2018 (gross of fees)
1 Year 3 Years 5 Years 10 Years2
Diversifying Strategies 1.59% 4.53% 4.55%
Diversifying Strategies Blend1 -3.03% 2.50% 2.52%
Excess 4.62% 2.03% 2.03%
Liquid Diversifying Strategies -7.94% -6.40%
Diversifying Strategies Blend1 -3.03% 2.50%
Excess -4.91% -8.90%
Private Diversifying Strategies 7.72% 8.96% 6.85%
Diversifying Strategies Blend1 -3.03% 2.50% 2.52%
Excess 10.75% 6.46% 4.33%1 25% Russell 3000, 10% MSCI ACWI ex US IMI Net, 45% BBG Barclays US Agg, 20% BBG Barclays Global Agg ex US2 The Diversifying Strategies Allocation started in June 2012 and therefore does not possess 10 year returns.
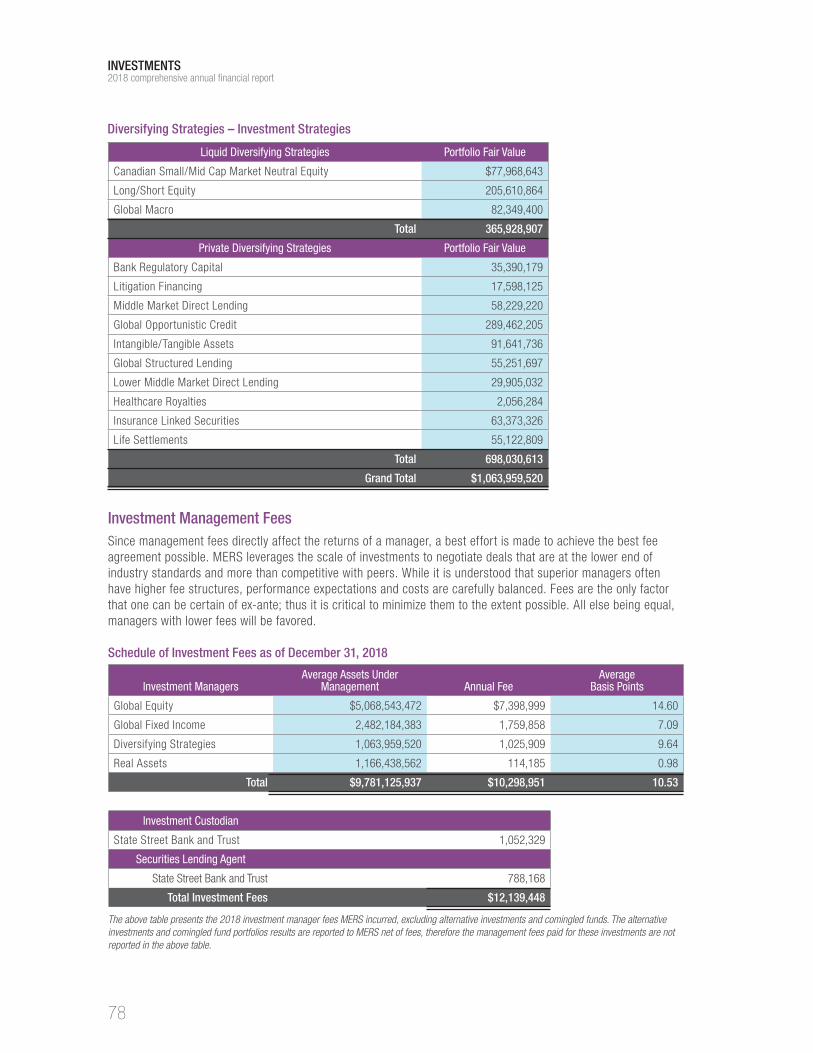
INVESTMENTS2018 comprehensive annual financial report
78
Investment Management FeesSince management fees directly affect the returns of a manager, a best effort is made to achieve the best fee agreement possible. MERS leverages the scale of investments to negotiate deals that are at the lower end of industry standards and more than competitive with peers. While it is understood that superior managers often have higher fee structures, performance expectations and costs are carefully balanced. Fees are the only factor that one can be certain of ex-ante; thus it is critical to minimize them to the extent possible. All else being equal, managers with lower fees will be favored.
Schedule of Investment Fees as of December 31, 2018
Liquid Diversifying Strategies Portfolio Fair Value
Canadian Small/Mid Cap Market Neutral Equity $77,968,643
Long/Short Equity 205,610,864
Global Macro 82,349,400
Total 365,928,907
Private Diversifying Strategies Portfolio Fair Value
Bank Regulatory Capital 35,390,179
Litigation Financing 17,598,125
Middle Market Direct Lending 58,229,220
Global Opportunistic Credit 289,462,205
Intangible/Tangible Assets 91,641,736
Global Structured Lending 55,251,697
Lower Middle Market Direct Lending 29,905,032
Healthcare Royalties 2,056,284
Insurance Linked Securities 63,373,326
Life Settlements 55,122,809
Total 698,030,613
Grand Total $1,063,959,520
Diversifying Strategies – Investment Strategies
Investment ManagersAverage Assets Under
Management Annual FeeAverage
Basis Points
Global Equity $5,068,543,472 $7,398,999 14.60
Global Fixed Income 2,482,184,383 1,759,858 7.09
Diversifying Strategies 1,063,959,520 1,025,909 9.64
Real Assets 1,166,438,562 114,185 0.98
Total $9,781,125,937 $10,298,951 10.53
Investment Custodian
State Street Bank and Trust 1,052,329
Securities Lending Agent
State Street Bank and Trust 788,168
Total Investment Fees $12,139,448
The above table presents the 2018 investment manager fees MERS incurred, excluding alternative investments and comingled funds. The alternative investments and comingled fund portfolios results are reported to MERS net of fees, therefore the management fees paid for these investments are not reported in the above table.

INVESTMENTS2018 comprehensive annual financial report
79
Schedule of Investment Commissions as of December 31, 2018
Brokerage Firm Shares Traded Total Dollars Commission/
Share
Merrill, Lynch,Pierce,Fenner & Smith Inc. 23,365,423 $229,366 0.01
Instinet U.K. Ltd 26,958,937 202,072 0.01
RBC Dominion Securities Inc. 10,877,511 135,624 0.01
BTIG, LLC 2,843,487 91,417 0.03
CIBC World Markets Inc. 10,466,203 80,183 0.01
Weeden + Co. 7,374,750 72,081 0.01
Capital Institutional Services Inc. 4,958,890 71,855 0.01
Toronto Dominion Securities Inc. 3,819,913 71,500 0.02
Nesbit Burns 5,798,308 70,403 0.01
Raymond James Ltd 5,156,333 68,199 0.01
Scotia McLeod Inc. 3,934,337 62,897 0.02
Cormack Securities Inc. 6,231,872 62,885 0.01
GMP Securities Inc. 4,578,919 59,774 0.01
Goldman Sachs International 18,050,607 58,685 0.00
Canaccord Genuity Corporation 4,589,144 49,164 0.01
Bloomberg Tradebook LLC 2,671,401 46,063 0.02
Pershing Securities Limited 3,317,161 44,235 0.01
NBC Clearing Services Inc. 2,644,881 42,441 0.02
Fidelity Clearing Canada 4,201,899 37,705 0.01
B.Riley & Co., LLC 1,127,579 33,480 0.03
Virtu Americas LLC 4,848,562 28,686 0.01
Peters and Co Limited 2,595,928 27,809 0.01
SG Securities Hong Kong 26,096,513 25,070 0.00
Credit Suisse Securities (USA) LLC 16,829,750 24,209 0.00
JonesTrading Institutional Services, LLC 845,153 22,951 0.03
Subtotal (25 Largest) 204,183,461 1,718,754 0.01
Remaining Total 71,499,455 198,345 0.00
Total Commissions 275,682,916 $1,917,099 0.01
INVESTMENTS2018 comprehensive annual financial report
80
MERS INVESTMENT MENU SUMMARY (PARTICIPANT DIRECTED ACCOUNTS AND INSTITUTIONAL FUNDS)The Board is the sole fiduciary for MERS’ institutional funds and participant directed retirement accounts with respect to establishing, monitoring, and amending the Plans’ investment menu and executes its duties solely in the interest of the Plans and their participants and beneficiaries.
The MERS Investment Menu is divided into three categories that PDA participants can use to address his/her investment needs: Retirement Strategies, Premium Select Options, and a Self-Directed Brokerage Account. The availability of the investment options in these categories is dependent on the plan of which a participant or municipality partakes.
Retirement StrategiesThe Retirement Strategies offer participants a simple way to invest. Each fund is named for a “target date”— the approximate year in which the participant is expected to retire and start withdrawing from their account. Funds farthest from the target dates emphasize growth potential by allocating a higher percentage of the portfolio to equities. As investors move closer to—and into—retirement, the funds automatically adjust to a more conservative asset mix. The Retirement Strategies are expected to meet the general needs of the average participant in different age groups by utilizing a glide path. A glide path represents the changes made to the asset allocation over time as the target date approaches.
The Retirement Strategies glide path shall be based on industry accepted investment theory and investment methodology as well as reasonable capital market assumptions. Plan demographics shall be taken into consideration when developing the glide path. The glide path will be monitored by the MERS Office of Investment and Investment Committee.
Premium Select Options
Premium Select - Asset Allocation PortfoliosThe Premium Select Asset Allocation Portfolios are multi-manager investment options built to offer participants the ability to benefit from economies of scale, by utilizing investments MERS’ Defined Benefit portfolio. The options are designed so a participant can select the option that best matches his/her risk tolerance and offer attractive risk-adjusted returns at a below-market fee.
Premium Select - Asset Specific FundsThe Premium Select Asset Specific Funds provide a participant the ability to structure his/her own unique portfolio by allocating his/her investments to a single asset class. These options give a participant the ability to build his/her own portfolio. The funds can either be components of the MERS Defined Benefit portfolio or outside investment fund options with a preference for index based investments. Whenever an outside investment is offered, the lowest share class available to MERS will be utilized.
Self-Directed Brokerage AccountParticipants who desire additional investment options and are willing to accept all risks and costs related to such alternatives can make his/her own investment decisions through the Self-Directed Brokerage Account (SDBA). The SDBA is available to participants through MERS DC, or 457 programs as long as they maintain a pre- determined account balance.

INVESTMENTS2018 comprehensive annual financial report
81
Retirement Strategies1
2005 Retirement Strategy2010 Retirement Strategy2015 Retirement Strategy2020 Retirement Strategy2025 Retirement Strategy2030 Retirement Strategy2035 Retirement Strategy2040 Retirement Strategy2045 Retirement Strategy2050 Retirement Strategy2055 Retirement Strategy2060 Retirement Strategy
Self-Directed Brokerage Account
TD Ameritrade (DC & 457 Only)
Premium Select OptionsPortfolios Built for YouMERS Total Market Portfolio MERS Global Stock Portfolio (100/0)MERS Capital Appreciation Portfolio (80/20)MERS Established Market Portfolio (60/40)2
MERS Balanced Income Portfolio (40/60)MERS Capital Preservation Portfolio (20/80)MERS Diversified Bond Portfolio (0/100)
Funds to Build Your Own Portfolio Large Cap Stock IndexMid Cap Stock IndexSmall Cap Stock Index Emerging Market StockInternational Stock IndexReal Estate StockBond IndexHigh-Yield BondShort-Term IncomeStable Value (DC &457 Only)
Portfolios Built for YouMERS Total Market Portfolio3 MERS Global Stock Portfolio (100/0)MERS Capital Appreciation Portfolio (80/20)MERS Established Market Portfolio (60/40)MERS Balanced Income Portfolio (40/60)MERS Capital Preservation Portfolio (20/80)MERS Diversified Bond Portfolio (0/100)
Funds to Build Your Own Portfolio Large Cap Stock IndexMid Cap Stock IndexSmall Cap Stock Index Emerging Market StockInternational Stock IndexShort-Term Income
Participant Directed Accounts Institutional Funds
Note: 1 Default investment option for DC and 457 2 Default investment option for HCSP 3 Default investment option for RHFV and ISP

INVESTMENTS2018 comprehensive annual financial report
82
This page intentionally left blank.

ACTUARIAL


ACTUARIAL2018 comprehensive annual financial report
85
CBIZ Retirement Plan Services CBIZ Benefits & Insurance Services, Inc.
17199 Laurel Park North, Ste. 405 Livonia, MI 48152
http://retirement.cbiz.com
CBIZ Retirement Plan Services is a trade name under which certain subsidiaries of CBIZ, Inc. market
investment advisory, third party administration, actuarial and other corporate retirement plan services.
September 18, 2018 The Retirement Board Municipal Employees’ Retirement System of Michigan 1134 Municipal Way Lansing, Michigan 48917 Dear Board Members: The basic financial objective of the Municipal Employees’ Retirement System of Michigan (MERS) is to establish and receive contributions for each municipality and court which:
(1) fully cover the cost of benefits that members earn during the coming fiscal year, and
(2) amortize the unfunded costs of benefits earned based on past service, and which
(3) when combined with present assets and future investment return will be sufficient to meet the financial obligations, of each municipality and court under MERS, to present and future retirees and beneficiaries.
In order to measure progress toward this fundamental objective, MERS has annual actuarial valuations completed. Separate actuarial valuations are prepared for each participating municipality and court. The purpose of the December 31, 2017 annual actuarial valuations was to (i) measure MERS’ funding progress, (ii) establish contribution requirements for fiscal years beginning in 2019 that provide for the normal cost (i.e. the costs assigned by the valuation method to the year of service about to be rendered) and amortization of unfunded actuarial accrued liabilities over a reasonable period (see the Appendix on the MERS website for a description of the amortization policy), and (iii) provide actuarial information in connection with applicable Governmental Accounting Standards Board statements. The valuations should not be relied upon for any other purpose. The valuations were completed based upon population data, asset data, and plan provision data as of December 31, 2017. The actuarial valuations are based upon financial data, plan provision data, and participant data which are prepared by MERS’ administrative staff. We checked the data for internal and year-to-year consistency as well as general reasonableness, but did not otherwise audit the data. As a result, we do not assume responsibility for the accuracy or completeness of the data provided by MERS’ administrative staff. The actuary summarizes and tabulates population data in order to analyze long term trends. MERS’ external auditor audits the actuarial data annually. This letter was prepared at the request of the Board and is intended for use by the Retirement System and those designated or approved by the Board. This letter may be provided to parties other than the System only in its entirety and only with the permission of the System.

ACTUARIAL2018 comprehensive annual financial report
86
CBIZ Retirement Plan Services CBIZ Benefits & Insurance Services, Inc.
17199 Laurel Park North, Ste. 405 Livonia, MI 48152
http://retirement.cbiz.com
CBIZ Retirement Plan Services is a trade name under which certain subsidiaries of CBIZ, Inc. market investment advisory, third party administration, actuarial and other corporate retirement plan services.
Actuarial valuations are based on assumptions regarding future rates of investment return and inflation, rates of retirement, withdrawal, death, disability, and pay increase among MERS members and their beneficiaries. These assumptions are adopted by the Board after considering the advice of the actuary and other professionals. The assumptions and methods used for funding purposes were developed based on the parameters set by the Actuarial Standards of Practice. The assumptions and methods comply with the requirements of Governmental Accounting Standards Board Statement No. 68. The demographic assumptions adopted by the Retirement Board were based upon the actual experience of MERS during the years 2009 to 2013 and were first reflected in the December 31, 2015 annual valuations. The economic assumptions were last revised by the Board for the December 31, 2015 annual valuations. Future actuarial valuation results may differ significantly from those presented in the annual valuations due to such factors as experience differing from that anticipated by the actuarial assumptions, or changes in plan provisions, actuarial assumptions/methods or applicable law. Due to the limited scope of the assignment, we did not perform an analysis of the potential range of future measurements. Assets are valued on a market related basis that fully recognizes expected investment return and averages unanticipated market return over a 5 year period. Prior to 2016, future unanticipated market returns were reflected in the valuation assets over a 10 year period. Based on the actuarial valuations, MERS’ staff prepared various supporting schedules in the Comprehensive Annual Financial Report. To the best of our knowledge, the actuarial valuations are complete and accurate and are made in accordance with generally recognized actuarial methods, in compliance with Act No. 220 of the Public Acts of 1996, as amended, and the MERS plan document, as revised. All of the undersigned are members of the American Academy of Actuaries (MAAA) and meet the Qualification Standards of the American Academy of Actuaries to render the actuarial opinion contained herein. The actuarial assumptions used in the December 31, 2017 annual actuarial valuation reports produce results that we believe are reasonable. Respectfully submitted,
W. James Koss, MAAA, ASA
Cathy Nagy, MAAA, FSA
Curtis Powell, MAAA, EA
Retirement BoardSeptember 18, 2018Page 2 of 2

ACTUARIAL2018 comprehensive annual financial report
87
SUMMARY OF ACTUARIAL ASSUMPTIONS AND METHODS
An actuarial valuation is the mathematical process that estimates plan liabilities and employer contribution requirements for the purpose of financing the Retirement System (System). This process is repeated annually to update the liabilities and contribution requirements for changes in participant census and plan features, and to reflect actual plan experience in the process. The valuation complies with the Municipal Employees’ Retirement Act, MCL 38.1501, et seq., as amended (MERS Act) and as embodied in the MERS Plan Document (as revised), the MERS Actuarial Policy, and other applicable laws.
In addition to using current membership and financial data, an actuarial valuation requires the use of a series of assumptions regarding uncertain future events. The assumptions and methods used in the December 31, 2017 actuarial valuations are those adopted by the MERS Retirement Board (Board). The actuarial assumptions are unchanged from those used in the December 31, 2016 valuations. The most recent experience study for the System was completed in 2015, and covered the period from January 1, 2009 through December 31, 2013.
There have been no changes in the funding method that was adopted by the Board commencing with the December 31, 1993 valuations. The basic funding method is entry age normal and employer contribution amounts are developed as a level percentage of payroll.
Valuation assets were valued for each municipality by taking the difference in investment income between expected return and market return and recognizing it over a 5-year period. This asset valuation method was first adopted for the December 31, 2016 valuation. For purposes of transition from the 10-year to the 5-year smoothing method, the entirety of prior unrecognized gains and losses at December 31, 2016 was combined into a single item and will be recognized over the next 4 years.
The employer contribution rate has been determined for each municipality based on the entry age normal funding method (adopted 1994). Under the entry age normal cost funding method, the total employer contribution is comprised of the normal cost plus the amortization payment required to fund the unfunded actuarial accrued liability over a period of years. For open divisions (new hires are included in the division) the amortization period is 21 years. The 21-year period will decline by 1 each year until the initial unfunded accrued liability is paid off. For divisions that closed to new hires prior to 2016 (new hires are not covered by the MERS Defined Benefit Plan or Hybrid Plan (Part I) provisions in a linked division) of active municipalities, the employer had 2 amortization options. Under the Accelerated to 5-Year Option, the amortization period decreases annually by 2 years until the period reaches 6 or 5 years. Each year thereafter it decreases by 1 each year until the unfunded liability is paid off. Under the Accelerated to 15-Year Option, the amortization period decreases annually by 2 years until the period reaches 16 or 15 years. Each year thereafter the amortization period decreases annually by 1 year until the unfunded accrued liability is paid off. Negative unfunded accrued liabilities are amortized over 10 years, with the 10-year period reestablished with each annual actuarial valuation. As of December 31, 2017, there were 1,520 closed divisions.
The total normal cost is, for each active participant, the level percentage of payroll contribution (from entry age to retirement) required to accumulate sufficient assets at the participant’s retirement to pay for his or her projected benefit. The employer normal cost is the total normal cost reduced by the participant contribution rate. Closed municipalities (no longer actively participating in MERS) are covered by special funding. Employer’s computed normal cost of benefits expressed as a percentage of valuation payroll is 6.94% and the total required contribution rate expressed as a percentage of valuation payroll is 25.73%.
For employers that adopt E-1 or E-2 post-retirement benefit increases, retirement benefits are assumed to increase by an annual, non-compounded rate of 2.5%. (Board adopted in 1981.)

ACTUARIAL2018 comprehensive annual financial report
88
There have been no recent changes that have had an impact on the System. Municipalities have the ability to modify provisions that apply to their individual plan. The individual municipality contribution rates are modified to account for changes in provisions of the plan selected by the municipality.
MERS’ staff has provided the data about participants and present assets. Although examined for general reasonableness, the actuary has not audited the data. The actuarial valuation computations were made by or under the supervision of a Member of the American Academy of Actuaries (MAAA). The Board adopted the assumptions used in the actuarial valuations after consulting with the actuary.
Note: the Annual Actuarial Valuation addresses assets and liabilities for participation under the MERS Defined Benefit Plan, including the defined benefit portion (Part I) of the Hybrid Plan. The defined contribution portion of the Hybrid Plan (Part II) is not addressed in the valuation results as it is not a defined benefit plan.
ASSUMPTIONS AND METHOD CHANGES
Actuarial AssumptionsTo calculate MERS’ contribution requirements, assumptions are made about future events that could affect the amount and timing of benefits to be paid, and the assets to be accumulated. The economic and demographic assumptions include:
• An assumed rate of investment return used to discount liabilities and project what plan assets will earn
• A mortality table projecting the number of participants who will die before retirement and the duration of benefit payments after retirement
• Assumed retirement rates projecting when participants will retire and commence receiving retirement benefits
• A set of withdrawal and disability rates to estimate the number of participants who will leave the workforce before retirement
• Assumed rate of pay increases to project participant compensation in future years
Interest RateFunding plan benefits involves the accumulation of assets to pay future benefits. These assets are invested, and the net rate of investment earnings is a significant factor when determining the contributions required to support the ultimate cost of benefits. For the 2017 actuarial valuation, the long-term investment yield, net of administrative and investment expenses, is assumed to be 7.75%. This assumption was first used for the December 31, 2015 actuarial valuations.
Although the actuarial value of assets for 2017 was 1% higher than the fair value, meeting the actuarial assumption in the next few years will require average annual market returns that exceed the 7.75% investment return assumption.
Pay Increases
Because benefits are based on a participant’s final average compensation (FAC), it is necessary to make an assumption with respect to each participant’s estimated pay progression. The pay increase assumption used in the actuarial valuation projects annual pay increases of 3.75% in the long term plus a percentage based on an age-related scale to reflect merit, longevity and promotional pay increases.
The pay increase assumption for sample ages is shown on the following page. The 3.75% long-term wage inflation assumption was first used for the December 31, 2015 actuarial valuation. The merit and longevity pay increase assumption was first used for the December 31, 2015 actuarial valuation.

ACTUARIAL2018 comprehensive annual financial report
89
InflationAlthough no specific price inflation assumption is needed for this valuation, the assumed long-term annual rate of price inflation is 2.5%.
Payroll GrowthFor divisions that are open to new hires, the number of active participants is projected to remain constant, and the total payroll is projected to increase 3.75% annually. This assumption was first used for the December 31, 2015 actuarial valuations.
Increase in Final Average Compensation The last three experience studies determined that for some retirees of some municipalities, the actual final average compensation (FAC) at retirement was larger than would be expected based on reported annual pays and FACs for the years just before retirement. Some possible sources for the differences are:
• Lump sum payments for unused paid time off. Unused sick leave payouts have been excluded from FAC since the mid-1970s. However, since that time it has become popular to combine sick and vacation time into paid time off, which is included in the FAC. Consequently, the lump sums that are includible in FAC have grown over the years.
• Extra overtime pay during the final year of employment. Our studies only reflect any increase in overtime during the final year, not any increase that occurs during the full three or more year averaging period.
The amount of unexpected FAC increase varies quite a bit between municipalities. Some municipalities show no sign of FAC loading, while other municipalities show increases above the average increase. This is presumably the result of different personnel policies and collective bargaining agreements among municipalities.
The Board adopted new FAC assumptions to be first used for the December 31, 2015 annual actuarial valuations. These assumptions reflect an FAC load of 0% to 12% for each municipality, based on the municipality’s experience in the 2009-2013 and earlier experience studies (it is anticipated that these assumptions will be updated after every 5-year experience study). The FAC increase assumption(s) for each municipality are shownin individual annual actuarial valuation reports. Note that for divisions that adopted Sick Leave in FAC (SLIF), the assumption is developed individually for each division based on the specific SLIF provision and/or past experience.
Annual Percentage Increase in Salary
Sample Ages
Base Inflation
Merit and Longevity
Total Percentage Increase in Salary
20 3.75% 11.00% 14.75%
25 3.75% 7.20% 10.95%
30 3.75% 3.10% 6.85%
35 3.75% 1.90% 5.65%
40 3.75% 1.20% 4.95%
45 3.75% 0.81% 4.56%
50 3.75% 0.52% 4.27%
55 3.75% 0.30% 4.05%
60 3.75% 0.00% 3.75%

ACTUARIAL2018 comprehensive annual financial report
90
Sample Replacement
Index
Percent of Eligible Active Participants Retiring Within the Next Year
5 8.0%
10 12.0%
15 16.0%
20 19.0%
25 19.5%
30 19.5%
35 19.5%
40 20.0%
45 21.0%
50 21.0%
55 21.0%
60 24.0%
65 24.0%
70 25.0%
75 28.0%
80 33.0%
85 36.0%
90 41.0%
95 46.0%
100+ 50.0%
Retirement RatesA schedule of retirement rates is used to measure the probability of eligible participants retiring during the next year.
The retirement rates for Normal Retirement are determined by each participant’s replacement index at the time of retirement. The replacement index is defined as the approximate percentage of the participant’s pay (after reducing participant contributions) that will be replaced by the participant’s benefit at retirement. The index is calculated as:
Replacement Index = 100 x Accrued Benefit ÷ by [Pay - Participant Contributions].
Retirement rates for early reduced retirement are determined by the participant’s age at early retirement.
The revised normal retirement rates and early retirement rates below were first used for the December 31, 2015 actuarial valuations.
Normal Retirement – Service Based Benefit F(N) Adopted
Early Retirement – Reduced Benefit
Retirement Ages
Percent of Eligible Active Participants
Retiring Within Next Year
50 2.00%
51 2.00%
52 3.30%
53 3.80%
54 5.60%
55 4.30%
56 4.20%
57 4.10%
58 5.00%
59 6.20%

ACTUARIAL2018 comprehensive annual financial report
91
Rates of Withdrawal (Excluding Death or Disability) from Active Employment Before Retirement
Withdrawal RatesThe withdrawal rates are used to estimate the number of participants at each age that are expected to terminate employment before qualifying for retirement benefits. The withdrawal rates do not apply to participants eligible to retire, and do not include separation on account of death or disability. The assumed rates of withdrawal applied in the current valuation are based on years of service and scaled up or down according to each division’s experience.
Sample rates of withdrawal from active employment, prior to the scaling factor, are shown. These rates were first used for the December 31, 2015 actuarial valuations.
The base withdrawal rates are multiplied by a scaling factor to obtain the assumed withdrawal rates. The scaling factor for each division is shown in each municipality’s annual actuarial report.
* 80% of the disabilities are assumed to be non-duty, and 20% of the disabilities are assumed to be duty related. For those plans that have adopted disability provision D-2, 40% of the disabilities are assumed to be non-duty, and 60% are assumed to be duty related
Disability RatesDisability rates are used in the valuation to estimate the incidence of participant disability in future years. The assumed rates of disablement at various ages are shown. These rates were first used for the December 31, 2015 actuarial valuations.
Rates of Withdrawal Due To Disability*
Sample Years of Service
% of Active Participants
Withdrawing Within the Next Year
0 19.6%
1 16.3%
2 13.3%
3 10.5%
4 8.6%
5 6.9%
10 4.6%
15 3.4%
20 2.6%
25 2.2%
30 and over 2.2%
Sample Ages
Percent of Active Participants
Becoming Disabled Within Next Year
20 0.02%
25 0.02%
30 0.02%
35 0.05%
40 0.08%
45 0.20%
50 0.29%
55 0.38%
60 0.39%
65 0.39%

ACTUARIAL2018 comprehensive annual financial report
92
Mortality TablesIn estimating the amount of reserves required at retirement to pay a participant’s benefit for the remainder of their lifetime, it is necessary to make an assumption with respect to the probability of surviving to retirement, and the life expectancy after retirement.
The mortality table used to project the mortality experience of non-disabled plan participants is a 50% male, 50% female blend of the following tables:
• The RP-2014 Healthy Annuitant Mortality Tables, with rates multiplied by 105%
• The RP-2014 Employee Mortality Tables
• The RP-2014 Juvenile Mortality Tables
For ages 0-17 we use the rates in Table 3; for ages 18-49 we use the rates in Table 2; for ages 50-69 we blend Table 1 and Table 2, and for ages 70 and older we use the rates in Table 1.
The mortality table used to project the mortality experience of disabled plan participants is a 50% Male, 50% Female blend of RP-2014 Disabled Retiree Mortality Tables.
These mortality tables were first used for the December 31, 2015 actuarial valuations.
It is assumed that 90% of active participants’ deaths are non-duty and 10% of deaths are assumed to be duty-related.
Possible future mortality improvements are reflected in the mortality assumption. The mortality assumptions include a 10% margin for future mortality improvements, relative to the actual mortality experience seen in the 2009-2013 Experience Study.
Mortality Tables (Non – Disabled) Mortality Tables (Disabled)
AgeExpected Years of Life
Remaining Mortality Rates
20 63.06 0.03%
25 58.15 0.03%
30 53.24 0.03%
35 48.33 0.04%
40 43.43 0.05%
45 38.56 0.08%
50 33.74 0.23%
55 29.18 0.37%
60 24.79 0.58%
65 20.59 0.94%
70 16.66 1.56%
75 13.07 2.51%
80 9.85 4.18%
AgeExpected Years of
Life Remaining Mortality Rates
20 46.95 0.47%
25 43.14 0.54%
30 39.24 0.55%
35 35.33 0.65%
40 31.52 0.82%
45 27.98 1.30%
50 24.87 1.62%
55 21.91 1.89%
60 18.97 2.18%
65 16.04 2.63%
70 13.19 3.43%
75 10.54 4.77%
80 8.18 6.88%

ACTUARIAL2018 comprehensive annual financial report
93
Schedule of Active Member Valuation Data
Schedule of Retirees and Beneficiaries Added to and Removed from Rolls
Valuation Dec 31
Participating Municipalities
Active Participants
Active Participants
Annual Payroll
Annual Average
Pay
Percent Increase in
Average Pay
Participants on
Deferred Status
2008 692 36,092 $1,624,855,145 $45,020 3.9% 6,662
2009 699 35,598 1,636,501,282 45,972 2.1% 6,726
2010 715 35,816 1,683,983,258 47,018 2.3% 6,961
2011 721 35,111 1,669,676,476 47,554 1.1% 7,160
2012 726 34,187 1,640,390,877 47,983 0.9% 7,262
2013 728 34,809 1,687,391,045 48,476 1.0% 7,620
2014 728 35,302 1,743,799,124 49,397 1.9% 7,690
2015 732 35,274 1,786,825,334 50,656 2.5% 8,340
2016 735 34,843 1,779,919,980 51,084 0.8% 8,252
2017 743 34,787 1,812,477,401 52,102 2.0% 8,361
Added to Rolls Removed from Rolls
End-of-Year Rolls
Valuation Dec 31
Retirees/ Beneficiaries
NumberAnnual
Allowance
Retirees/ Beneficiaries
NumberAnnual
Allowance
2008 2,015 $43,573,642 783 $5,156,426
2009 1,871 36,164,024 773 4,545,379
2010 2,809 67,149,443 809 9,250,641
2011 2,212 50,594,419 940 11,072,125
2012 2,348 53,957,105 811 9,477,177
2013 3,578 73,762,997 857 11,138,379
2014 4,242 107,064,445 948 12,090,122
2015 2,714 68,984,180 1,001 13,947,540
2016 2,847 70,269,768 1,540 25,743,252
2017 2,479 60,140,628 1,105 16,084,776
Valuation Dec 31
Retirees/ Beneficiaries
NumberAnnual
Allowance
% Increase in Annual Allowance
Average Annual
Allowance
2008 23,832 $391,959,046 10.9% $16,447
2009 24,930 423,577,691 8.1% 16,991
2010 26,930 481,476,493 13.7% 17,879
2011 28,202 520,998,787 8.2% 18,474
2012 29,739 565,478,715 8.5% 19,015
2013 32,460 628,103,333 11.1% 19,350
2014 35,754 723,077,656 15.1% 20,224
2015 37,467 778,114,296 7.6% 20,768
2016 38,774 822,640,812 5.7% 21,216
2017 40,148 866,696,664 5.4% 21,588

ACTUARIAL2018 comprehensive annual financial report
94
SUMMARY OF PLAN DOCUMENT PROVISIONSThere were no recent changes in the nature of the Defined Benefit Plan that would have a material impact on the actuarial valuations for December 31, 2017. Pursuant to a collective bargaining agreement, a participating municipality may provide for retirement benefits that are modifications of some of the MERS standard retirement benefits otherwise included, although the Hybrid Plan is not modifiable. The actuary took the known modifications into consideration when determining the municipality contribution rates in the December 31, 2017 actuarial valuation.
The benefits summarized in this section are intended only as general information regarding MERS. The CAFR and valuation are not a substitute for the language of the MERS Act and the MERS Plan Document, as revised. If any conflict occurs between the information in this summary and the MERS Act or the MERS Plan Document, as revised, the provision of the Act and the MERS Plan Document govern.
The December 31, 2017 actuarial valuation was based on the provisions of the MERS Plan Document as of that date.
Defined Benefit Plan
Eligibility for RetirementMonthly retirement payments are made over the lifetime of the retiree and/or over the lifetime of the beneficiary. Payments are based on the choice of benefits adopted by each municipality and the final payment option elected by the retiring participant.
Vesting occurs after 10 years of credited service unless the municipality selects a lesser number of years.
Members are eligible to retire after vesting and between the ages of 60 and 70. The municipality may choose other combinations of age and service such as age 55 and 15 years of service, age 50 and 25 years of service, etc.
Early retirement benefits are available if the vested member meets either the age 55 with 15 years of service or age 50 with 25 years of service eligibility requirements. The monthly payment is reduced (unless waived by the municipality) for each month the participant is younger than the age the unreduced retirement benefits are available.
Benefit FormulaThe annual benefit equals a specified percentage of the participant’s final average compensation, multiplied by the number of years and months of credited service. The plan has several benefit multipliers available. The benefit multipliers vary and are adopted by a participating municipality.
Mandatory RetirementThere is no mandatory retirement age; however, participants must take a required minimum distribution as required by law.
Deferred Retirement (Vesting)Deferred retirement occurs when a participant leaves MERS covered employment after vesting, but before reaching the minimum retirement age. The participant or beneficiary will become eligible for the deferred allowance once eligibility requirements for retirement are met. However, the participant’s contributions must remain on deposit with MERS.
Maximum Benefit Payable by MERSThe maximum benefit that may be paid by MERS is governed by Section 415 of the Internal Revenue Code (IRC). Benefits in excess of the maximum benefit will be paid by the MERS Excess Benefit Plan under Plan Section 88.
Act 88 (Reciprocal Retirement Act)If a municipality elects to come under the provision of Act 88, service with former and future public employers in Michigan may be used to satisfy the eligibility requirements for that municipality.

ACTUARIAL2018 comprehensive annual financial report
95
Final Average CompensationFinal average compensation (FAC) is the highest monthly average of a participant’s compensation over a consecutive period of months of credited service. The municipality selects the number of months. A FAC-3 is over a 36-month period, and a FAC-5 is over a 60-month period. The compensation used in calculating the final average compensation cannot exceed the limit set by IRC Section 401(a)(17).
Disability Retirement Allowance – Duty or Non-DutyDuty disability retirement is available to a participant who becomes totally and permanently disabled while employed by a participating municipality after meeting the vesting requirement of the benefit program. The service requirement is waived if the disability is the natural and proximate result of a personal injury or disease arising out of and in the course of the participant’s actual performance of duty with a municipality.
The allowance is computed in the same manner as a service retirement allowance, except that the reduction for retirement before age 60 is not applied.
If disability is duty-related, the amount of the retirement allowance shall not be less than 25% of the member’s final average compensation.
Death Allowance – Duty or Non-DutyIf a participant or vested former participant with the minimum years of service required to be vested dies before retirement, a monthly survivor allowance may be made payable. If the participant is married, the spouse is the automatic beneficiary unless the spouse, in writing, declines a benefit in favor of another named beneficiary.
A survivor beneficiary will receive a retirement allowance computed in the same manner as a service retirement allowance, based on service and final average compensation at death, but reduced to reflect an Option II election. The reduction for retirement before age 60 is not applied. Payment to the survivor beneficiary of a deceased participant commences immediately. Payment to the survivor beneficiary of a deceased vested former participant commences on the date the participant would have first satisfied eligibility for retirement with an unreduced service retirement allowance.
If there is no named beneficiary and the participant leaves a spouse, the spouse will receive an Option II survivor allowance. The amount shall be 85% of the deceased participant’s or the deceased former vested participant’s accrued retirement allowance computed in the same manner as a service retirement allowance, based on service and final average compensation at the time of death.
Payment to the surviving spouse of a deceased participant commences immediately. Payment to the surviving spouse of a deceased former vested participant commences on the date the member would have first satisfied eligibility for retirement with an unreduced service retirement allowance. The amount of a surviving spouse’s benefit is always the larger of (1) the benefit computed as a survivor beneficiary, and (2) the 85% of accrued retirement allowance benefit described above. If there is no named beneficiary and no retirement allowance being paid to a surviving spouse, unmarried children under 21 will be paid an equal share of 50% of the deceased participant’s or the deceased former vested participant’s accrued retirement allowance. The reduction for retirement before age 60 is not applied.
If no retirement benefits are payable on death, the beneficiary or, if none, the decedent’s estate would receive a refund of any remaining participant’s contributions.
A duty death allowance, computed in the same manner as a non-duty death allowance, may be payable to a spouse or child(ren) if death occurs as the natural and proximate result of a personal injury or disease arising out of and in the course of the participant’s actual performance of duty with a municipality. The vesting requirement is waived, and the minimum benefit is 25% of the deceased participant’s final average compensation.
Participant ContributionsEach participant may contribute a percentage of their annual compensation, if selected by the municipality, up to the compensation limit under Section 401(a)(17) of the Internal Revenue Code. The weighted average of participant contributions in 2017 was 4.29%. Interest is credited to accumulated participant contributions each December 31 at a rate determined by MERS. Currently MERS is using the 1-year U.S. Treasury bill rate determined as of December 31.
If a participant dies without a retirement allowance or other benefit payable on their account, the participant’s accumulated contributions plus interest are refunded to the participant, if living, or to the participant’s surviving spouse or a beneficiary named by the participant (with spousal consent). If a participant terminates employment, the participant may take a refund of participant contributions, while waiving any attributable service credit.

ACTUARIAL2018 comprehensive annual financial report
96
Post-Retirement AdjustmentsEach municipality may elect to provide post-retirement adjustments to retirees and their beneficiaries. The municipality can choose a one-time adjustment, an annual adjustment for all retirees, or an adjustment for future retirees only. This cost-of-living adjustment (COLA) increase is effective in January of each year.
Forms of Benefit PaymentThe participant elects a payment option as part of the retirement application process. Once the election is made, the selection is irrevocable after receipt of first payment. The payment options include:
• Straight Life paid over the retiree’s life only
• A reduced benefit paid over the joint lives of the retiree and beneficiary, and continuing to the beneficiary if s/he survives the retiree. If the retiree survives the beneficiary, the retiree’s benefit is prospectively converted to a straight life benefit.
• A reduced benefit paid over the life of the retirement, continuing as 75% or 50% of the original reduced amount for the life of the beneficiary if s/he survives the retiree. If the retiree survives the beneficiary, the retiree’s benefit is prospectively converted to a straight life benefit.
• A reduced benefit paid to the retiree for life, and if the retiree dies before the number of monthly benefits elected at retirement (60, 120, 180, or 240) is reached, the reduced benefit continues to the beneficiary until the sum of the number of the monthly benefits paid to the retiree and to the beneficiary reaches the number elected at retirement.
Deferred Retirement Option Program (DROP): Traditional If a participant is covered by the Benefit Program DROP and is eligible for retirement, they have the option to elect a specified DROP period in which they will cease to accrue any additional retirement benefits, but remain employed by the participating municipality or court. The member must elect a DROP end date at least six months after the beginning date, but no more than 60 months after the beginning date, in 1-month increments.
Upon the participant’s election of DROP and the receipt of an application to enroll in DROP, MERS will calculate the participant’s service retirement and benefit payment as of the beginning date. The System shall also calculate any age differential between the participant and the participant’s beneficiary as of the calendar year of the DROP exit date in accordance with Treasury Regulation § 1.401(a)(9)-6. Upon the beginning date of the DROP period, the participant shall be responsible to continue paying participant contributions, if any.
On the next available benefit payment date after processing is complete, and monthly thereafter, an amount equal to 100% of the monthly service retirement benefit payment the participant would have received if he or she had retired as of the DROP beginning date will be credited to a notional account for the benefit of the participant. Funds in the DROP account are credited with interest in the amount of 3% annually, or prorated in the event of a DROP period that is less than 12 months.
Upon the end date, the participant shall receive a lump-sum distribution of the participant’s DROP account and on the first day of the calendar month following end date, the participant will begin receiving monthly service retirement benefit payments.
Deferred Retirement Option Program (DROP+) Partial Lump Sum If a participant is covered by the Benefit Program DROP+ and retires at least 12 months after first becoming eligible for unreduced benefits, they have the option to receive a partial lump sum and a reduced monthly benefit:
• The participant can elect a lump sum equal to 12, 24, 36, 48, or 60 times their monthly accrued benefit.
• For each 12 months included in the lump sum, the participant’s lifetime benefit is reduced by the DROP+ percentage adopted by the employer. The employer can adopt any of the following DROP+ reduction percentages: 4, 5, 6, 7, or 8%.
As of June 30, 2013, Benefit Program DROP+ may no longer be adopted; 2 employers adopted the program prior to it ending.
Annuity WithdrawalUnder the Annuity Withdrawal Program, a retiring participant may elect to receive a refund of their accumulated participant contributions with interest in a lump sum at retirement. The participant’s monthly pension would then be reduced by the actuarial equivalent of the lump sum payment. The employer has two options for the interest discount rate used to compute the actuarial equivalent reduction: the current investment return assumption used in the annual actuarial valuations or the most recent December 31 interest rate used for crediting interest on participant contributions.

ACTUARIAL2018 comprehensive annual financial report
97
HYBRID PLAN
Part I - Defined Benefit Portion of Hybrid Plan
Eligibility for RetirementMonthly retirement payments are made over the lifetime of the retiree and/or over the lifetime of the beneficiary. Payments are based on the choice of benefits adopted by each municipality and the final payment option elected by the retiring participant.
Vesting occurs after six years of credited service.
Participants are eligible to retire at an age between 60 and 70, as selected by the participating municipality, or upon accruing 6 years of service, whichever is later.
Benefit FormulaThe annual benefit equals a specified percentage of the participant’s final average compensation multiplied by the number of years and months of credited service. Percentage options are 1.0, 1.25, and 1.5%, and may be selected by a participating municipality.
Mandatory RetirementThere is no mandatory retirement age; however, all benefits must commence by the required beginning dated determined under IRC Section 401(a)(9).
Deferred Retirement (Vesting)Deferred retirement occurs when a participant leaves MERS covered employment after vesting, but before reaching the applicable retirement age. The participant or beneficiary will become eligible for the deferred allowance once eligibility requirements are met. However, the participant’s contributions must remain on deposit with MERS.
Maximum Benefit Payable by MERSThe maximum benefit that may be paid by MERS is governed by Section 415 of the Internal Revenue Code (IRC). Benefits in excess of the maximum benefit will be paid by the MERS Excess Benefit Plan under Plan Section 88.
Act 88 (Reciprocal Retirement Act)If the municipality has elected to come under the provision of Act 88, service with former and future public employers in Michigan may be used to satisfy the eligibility requirements for that municipality.
Final Average CompensationFinal average compensation (FAC) is computed using the FAC-3 under the Defined Benefit Plan. The compensation used in calculating final average compensation cannot exceed the limit set by IRC Section 401(a)(17).
Disability Benefit – Duty or Non-DutyBenefits are the same as are provided in the Defined Benefit Plan, except that optional benefit program D-2 does not apply.
Death Allowance – Duty or Non-DutyBenefits are the same as are provided in the Defined Benefit Plan, except that the optional benefit program D-2 does not apply.
Participant ContributionsIn the event the municipality elects an employer cap under Plan Document section 66(3), each participant may contribute a percentage of their annual compensation, up to the compensation limit under IRC Section 401(a)(17). Interest is credited to accumulated participant contributions each December 31 at a rate determined by MERS.

ACTUARIAL2018 comprehensive annual financial report
98
Currently MERS is using the 1-year U.S. Treasury bill rate determined as of December 31.
If a participant leaves the municipality, or dies without a retirement allowance or other benefit payable on their account, the participant’s accumulated contributions plus interest are refunded with spousal consent to the participant, if living, or to the participant’s surviving spouse or a named beneficiary.
Post-Retirement AdjustmentsThere are no post-retirement adjustments within the Hybrid Plan.
Forms of Benefit PaymentThe participant elects a payment option as part of the retirement application process. Once the election is made, the selection is irrevocable after receipt of first payment. The payment options include:
• Straight Life paid over the retiree’s life only
• A reduced benefit paid over the joint lives of the retiree and beneficiary, and continuing to the beneficiary if s/he survives the retiree. If the retiree survives the beneficiary, the retiree’s benefit is prospectively converted to a straight life benefit.
• A reduced benefit paid over the life of the retirement, continuing as 75% or 50% of the original reduced amount for the life of the beneficiary if s/he survives the retiree. If the retiree survives the beneficiary, the retiree’s benefit is prospectively converted to a straight life benefit.
• A reduced benefit paid to the retiree for life, and if the retiree dies before the number of monthly benefits elected at retirement (60, 120, 180, or 240) is reached, the reduced benefit continues to the beneficiary until the sum of the number of the monthly benefits paid to the retiree and to the beneficiary reaches the number elected at retirement.
Deferred Retirement Option Program (DROP): TraditionalThere is no DROP option in the Hybrid Plan.
Deferred Retirement Option Program (DROP+) Partial Lump SumThere is no DROP+ option in the Hybrid Plan.
Annuity WithdrawalThere is no Annuity Withdrawal option in the Hybrid Plan.
Part II - Defined Contribution Portion of Hybrid Plan
Contributions — EmployerAny percentage of compensation that is allowed by federal law.There are three vesting schedules from which an employer may choose to adopt:
• Immediate vesting upon participation
• 100% vesting after stated years (the maximum vesting period is 5 years)
• Graded vesting percentages per year of service (must be 100% vested after 6 years)
Contributions — ParticipantAny percentage of compensation that is allowed by federal law and subject to procedures established by the Retirement Board. Participant contributions are vested immediately.
Note: The Annual Actuarial Valuation addresses assets and liabilities for participation under the MERS Defined Benefit Plan and the Defined Benefit portion of the Hybrid Plan. The Defined Contribution portion of the Hybrid Plan is not addressed in the valuation results

STATISTICAL


STATISTICAL2018 comprehensive annual financial report
101
STATISTICAL SUMMARYThe Statistical Section provides pertinent information to assist readers when viewing the Financial Statements, Notes to the Financial Statements, and Required Supplementary Information to help in understanding and assessing the System’s overall financial condition. The information reported here is in compliance with GASB Statement No. 44, Economic Condition Reporting: The Statistical Section. This statement establishes standardized reporting requirements for the supplementary information provided in this section.
The schedules and graphs beginning on the next page show financial trend information about the growth of the MERS assets for the past 10 years. These schedules provide detailed information about the trends of key sources of additions and deductions to the System’s assets, and assist in providing a context framing of how MERS’ financial position has changed over time. The financial trend schedules presented are:
• Changes in Fiduciary Net Position – Last 10 Years
• Schedule of Changes in Reserves
The next schedules show demographic, economic, operating, and trend information about the MERS environment.
• Schedule of Average Benefit Payments
• Schedule of Benefit Payments by Type
• Schedule of Retired Members by Type of Benefit
• Schedule of Retired Members by Type of Option Selected
• Defined Contribution Plan Participants, Defined Benefit Participants and Total MERS Participants

STATISTICAL2018 comprehensive annual financial report
102
Changes in Fiduciary Net Position – Last 10 Years Ended December 31, 2018 (Dollars in Thousands)
Year 2009 2010 2011 2012 2013 2014 2015 2016 2017 2018
Defined Benefit Plan
Additions:Plan Member Contributions $62,677 $83,573 $64,790 $73,133 $88,410 $102,446 $86,553 $87,043 $88,192 $87,739
Employer Contributions 350,737 341,354 298,328 783,292 409,563 523,372 635,581 566,815 609,707 707,958
Net Investment Gain (Loss) 789,800 754,011 130,115 668,303 988,639 501,254 (140,903) 867,584 1,176,099 (394,517)
Total Additions to Plan Net Assets 1,203,214 1,178,938 493,233 1,524,728 1,486,612 1,127,072 581,231 1,521,442 1,873,998 401,180 Deductions:Benefits and Employee Refunds 419,576 461,204 505,854 565,695 662,708 707,268 754,978 917,084 849,734 892,536
Special Litigation Expense 4,250
Administrative Expenses 19,254 21,340 22,514 24,483 20,342 17,822 17,665 17,446 17,389 17,463
Total Deductions from Plan Net Assets 438,830 482,544 528,368 590,178 683,050 725,090 772,643 934,530 871,373 909,999 Net Increase (Decrease) 764,384 696,394 (35,135) 934,550 803,562 401,982 (191,412) 586,912 1,002,625 (508,818)
Net Assets Held in Trust
Balance Beginning of Fiscal Period 4,512,787 5,277,171 5,973,565 5,938,430 6,872,980 7,676,016 8,077,998 7,886,586 8,473,498 9,476,123
Balance End of Fiscal Period $5,277,171 $5,973,565 $5,938,430 $6,872,980 $7,676,542 $8,077,998 $7,886,586 $8,473,498 $9,476,123 $8,967,305
Defined Contribution Plan
Additions:Plan Member Contributions $8,086 $8,694 $10,376 $1,997 $20,370 $20,805 $23,496 $20,882 $22,259 $25,412
Employer Contributions 21,994 26,374 22,079 40,103 42,706 26,112 38,151 56,696 32,666 49,077
Net Investment Gain (Loss) 39,951 28,971 1,862 38,552 63,614 25,208 (7,482) 45,744 85,984 (41,168)
Total Additions to Plan Net Assets 70,031 64,039 34,317 80,652 126,690 72,125 54,165 123,322 140,909 33,321 Deductions:Benefits and Withdrawals 8,868 10,902 19,901 18,532 26,021 63,304 34,797 61,088 34,722 39,015
Administrative Expenses 826 759 812 623 601 619 648 555
Total Deductions from Plan Net Assets 8,868 10,902 20,727 19,291 26,833 63,927 35,398 61,707 35,370 39,570 Net Increase (Decrease) 61,163 53,137 13,590 61,361 99,857 8,198 18,767 61,615 105,539 (6,249)
Net Assets Held in Trust
Balance Beginning of Fiscal Period 183,613 244,776 297,913 311,503 372,864 472,721 480,919 499,686 561,301 666,840
Balance End of Fiscal Period $244,776 $297,913 $311,503 $372,864 $472,721 $480,919 $499,686 $561,301 $666,840 $660,591
Health Care Savings Program
Additions:Employer Contributions $16,964 $11,651 $7,307 $10,742 $12,164 $11,649 $20,275 $27,158 $23,477 $27,846
Net Investment Gain (Loss) 2,978 4,055 918 5,406 7,979 3,480 (1,779) 11,393 19,926 (6,817)
Miscellaneous Income 263 377
Total Additions to Plan Net Assets 20,205 16,083 8,225 16,148 20,143 15,129 18,496 38,551 43,403 21,029 Deductions:Medical Disbursements Paid 512 890 1,474 1,787 2,316 3,011 3,694 4,925 5,645 5,954
Forfeitures and transfers 322 458 16 300 723 469 355
Administrative Expenses 159 (439) 717 144 125 163 145 165 187 168
Total Deductions from Plan Net Assets 993 909 2,207 2,231 3,164 3,643 4,194 5,090 5,832 6,123 Net Increase (Decrease) 19,212 15,174 6,018 13,917 16,979 11,486 14,302 33,461 37,571 14,906
Net Assets Held in Trust
Balance Beginning of Fiscal Period 14,469 33,681 48,855 54,873 68,790 85,769 97,255 111,557 145,018 182,589
Balance End of Fiscal Period $33,681 $48,855 $54,873 $68,790 $85,769 $97,255 $111,557 $145,018 $182,589 $197,495
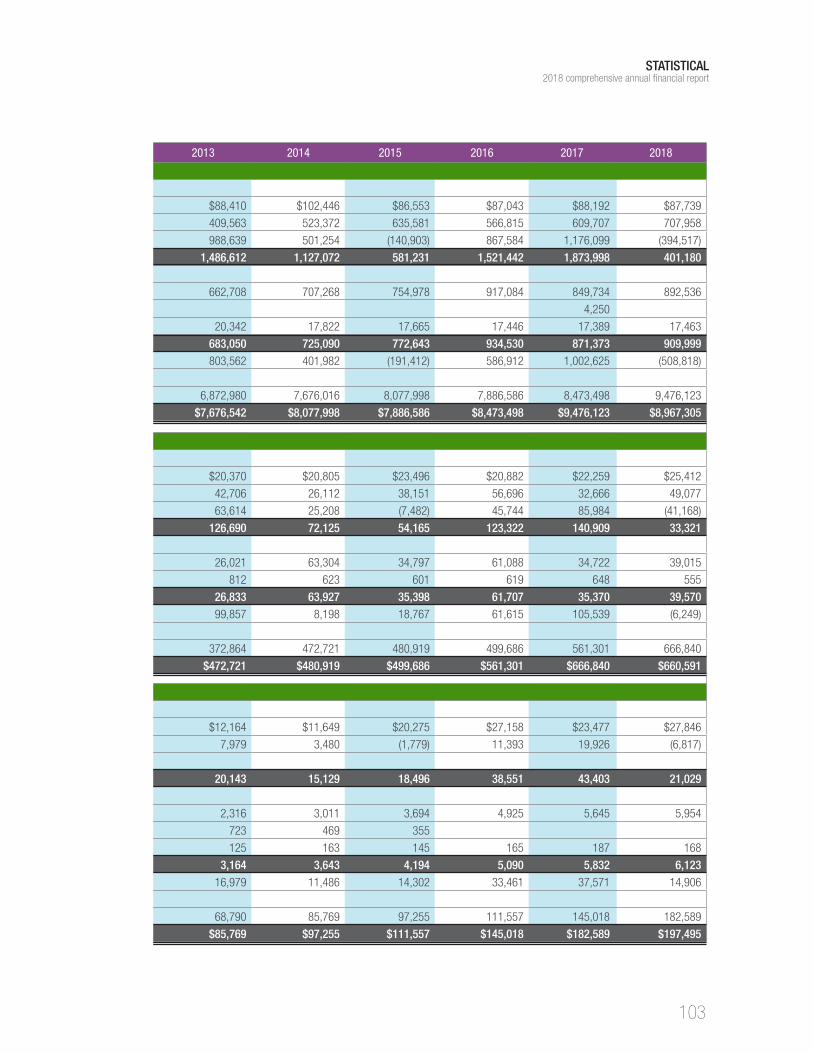
STATISTICAL2018 comprehensive annual financial report
103
Year 2009 2010 2011 2012 2013 2014 2015 2016 2017 2018
Defined Benefit Plan
Additions:Plan Member Contributions $62,677 $83,573 $64,790 $73,133 $88,410 $102,446 $86,553 $87,043 $88,192 $87,739
Employer Contributions 350,737 341,354 298,328 783,292 409,563 523,372 635,581 566,815 609,707 707,958
Net Investment Gain (Loss) 789,800 754,011 130,115 668,303 988,639 501,254 (140,903) 867,584 1,176,099 (394,517)
Total Additions to Plan Net Assets 1,203,214 1,178,938 493,233 1,524,728 1,486,612 1,127,072 581,231 1,521,442 1,873,998 401,180 Deductions:Benefits and Employee Refunds 419,576 461,204 505,854 565,695 662,708 707,268 754,978 917,084 849,734 892,536
Special Litigation Expense 4,250
Administrative Expenses 19,254 21,340 22,514 24,483 20,342 17,822 17,665 17,446 17,389 17,463
Total Deductions from Plan Net Assets 438,830 482,544 528,368 590,178 683,050 725,090 772,643 934,530 871,373 909,999 Net Increase (Decrease) 764,384 696,394 (35,135) 934,550 803,562 401,982 (191,412) 586,912 1,002,625 (508,818)
Net Assets Held in Trust
Balance Beginning of Fiscal Period 4,512,787 5,277,171 5,973,565 5,938,430 6,872,980 7,676,016 8,077,998 7,886,586 8,473,498 9,476,123
Balance End of Fiscal Period $5,277,171 $5,973,565 $5,938,430 $6,872,980 $7,676,542 $8,077,998 $7,886,586 $8,473,498 $9,476,123 $8,967,305
Defined Contribution Plan
Additions:Plan Member Contributions $8,086 $8,694 $10,376 $1,997 $20,370 $20,805 $23,496 $20,882 $22,259 $25,412
Employer Contributions 21,994 26,374 22,079 40,103 42,706 26,112 38,151 56,696 32,666 49,077
Net Investment Gain (Loss) 39,951 28,971 1,862 38,552 63,614 25,208 (7,482) 45,744 85,984 (41,168)
Total Additions to Plan Net Assets 70,031 64,039 34,317 80,652 126,690 72,125 54,165 123,322 140,909 33,321 Deductions:Benefits and Withdrawals 8,868 10,902 19,901 18,532 26,021 63,304 34,797 61,088 34,722 39,015
Administrative Expenses 826 759 812 623 601 619 648 555
Total Deductions from Plan Net Assets 8,868 10,902 20,727 19,291 26,833 63,927 35,398 61,707 35,370 39,570 Net Increase (Decrease) 61,163 53,137 13,590 61,361 99,857 8,198 18,767 61,615 105,539 (6,249)
Net Assets Held in Trust
Balance Beginning of Fiscal Period 183,613 244,776 297,913 311,503 372,864 472,721 480,919 499,686 561,301 666,840
Balance End of Fiscal Period $244,776 $297,913 $311,503 $372,864 $472,721 $480,919 $499,686 $561,301 $666,840 $660,591
Health Care Savings Program
Additions:Employer Contributions $16,964 $11,651 $7,307 $10,742 $12,164 $11,649 $20,275 $27,158 $23,477 $27,846
Net Investment Gain (Loss) 2,978 4,055 918 5,406 7,979 3,480 (1,779) 11,393 19,926 (6,817)
Miscellaneous Income 263 377
Total Additions to Plan Net Assets 20,205 16,083 8,225 16,148 20,143 15,129 18,496 38,551 43,403 21,029 Deductions:Medical Disbursements Paid 512 890 1,474 1,787 2,316 3,011 3,694 4,925 5,645 5,954
Forfeitures and transfers 322 458 16 300 723 469 355
Administrative Expenses 159 (439) 717 144 125 163 145 165 187 168
Total Deductions from Plan Net Assets 993 909 2,207 2,231 3,164 3,643 4,194 5,090 5,832 6,123 Net Increase (Decrease) 19,212 15,174 6,018 13,917 16,979 11,486 14,302 33,461 37,571 14,906
Net Assets Held in Trust
Balance Beginning of Fiscal Period 14,469 33,681 48,855 54,873 68,790 85,769 97,255 111,557 145,018 182,589
Balance End of Fiscal Period $33,681 $48,855 $54,873 $68,790 $85,769 $97,255 $111,557 $145,018 $182,589 $197,495

STATISTICAL2018 comprehensive annual financial report
104
Changes in Fiduciary Net Position – Last 10 Years Ended December 31, 2018 (Dollars in Thousands)
Year 2009 2010 2011 2012 2013 2014 2015 2016 2017 2018
Retiree Health Funding Vehicle
Additions:
Employer Contributions $48,029 $52,613 $48,644 $78,809 $58,111 $64,161 $73,764 $71,741 $59,219 $88,650
Net Investment Gain (Loss) 23,525 29,278 6,820 36,770 59,826 32,947 (8,833) 70,585 107,415 (42,560)
Total Additions to Plan Net Assets 71,554 81,891 55,464 115,579 117,937 97,108 64,931 142,326 166,634 46,090
Deductions:
Disbursements Paid to Municipalities 6,088 5,564 9,074 13,071 14,341 9,556 22,002 24,893 12,286 35,004
Transfers and Special Expenses 623 859 4
Administrative Expenses 54 1,039 1,647 521 659 692 732 773 841 731
Total Deductions from Plan Net Assets 6,765 7,462 10,721 13,592 15,004 10,248 22,734 25,666 13,127 35,735
Net Increase (Decrease) 64,789 74,429 44,743 101,987 102,933 86,860 42,197 116,660 153,507 10,355
Net Assets Held in Trust
Balance Beginning of Fiscal Period 118,415 183,204 257,633 302,376 404,363 507,296 594,156 636,352 753,012 906,519
Balance End of Fiscal Period $183,204 $257,633 $302,376 $404,363 $507,296 $594,156 $636,352 $753,012 $906,519 $916,874
Investment Services Program
Additions:
Employer Contributions $999 $700 $74,660 $19,721 $289 $142
Net Investment Gain (Loss) 3,376 $867 $162 791 $1,148 2,781 138 6,699 7,385 $(2,035)
Total Additions to Plan Net Assets 4,375 867 162 1,491 1,148 77,441 19,859 6,988 7,527 (2,035)
Deductions:
Disbursements and Transfers 33,593 106 300 280 40,798 3,309 3,355 10,554
Administrative Expenses 4 250 28 11 10 81 82 74 71 55
Total Deductions from Plan Net Assets 33,597 250 28 117 310 361 40,880 3,383 3,426 10,609
Net Increase (Decrease) (29,222) 617 134 1,374 838 77,080 (21,021) 3,605 4,101 (12,644)
Net Assets Held in Trust
Balance Beginning of Fiscal Period 35,313 6,091 6,708 6,842 8,216 9,054 86,134 65,113 68,718 72,819
Balance End of Fiscal Period $6,091 $6,708 $6,842 $8,216 $9,054 $86,134 $65,113 $68,718 $72,819 $60,175

STATISTICAL2018 comprehensive annual financial report
105
Year 2009 2010 2011 2012 2013 2014 2015 2016 2017 2018
Retiree Health Funding Vehicle
Additions:
Employer Contributions $48,029 $52,613 $48,644 $78,809 $58,111 $64,161 $73,764 $71,741 $59,219 $88,650
Net Investment Gain (Loss) 23,525 29,278 6,820 36,770 59,826 32,947 (8,833) 70,585 107,415 (42,560)
Total Additions to Plan Net Assets 71,554 81,891 55,464 115,579 117,937 97,108 64,931 142,326 166,634 46,090
Deductions:
Disbursements Paid to Municipalities 6,088 5,564 9,074 13,071 14,341 9,556 22,002 24,893 12,286 35,004
Transfers and Special Expenses 623 859 4
Administrative Expenses 54 1,039 1,647 521 659 692 732 773 841 731
Total Deductions from Plan Net Assets 6,765 7,462 10,721 13,592 15,004 10,248 22,734 25,666 13,127 35,735
Net Increase (Decrease) 64,789 74,429 44,743 101,987 102,933 86,860 42,197 116,660 153,507 10,355
Net Assets Held in Trust
Balance Beginning of Fiscal Period 118,415 183,204 257,633 302,376 404,363 507,296 594,156 636,352 753,012 906,519
Balance End of Fiscal Period $183,204 $257,633 $302,376 $404,363 $507,296 $594,156 $636,352 $753,012 $906,519 $916,874
Investment Services Program
Additions:
Employer Contributions $999 $700 $74,660 $19,721 $289 $142
Net Investment Gain (Loss) 3,376 $867 $162 791 $1,148 2,781 138 6,699 7,385 $(2,035)
Total Additions to Plan Net Assets 4,375 867 162 1,491 1,148 77,441 19,859 6,988 7,527 (2,035)
Deductions:
Disbursements and Transfers 33,593 106 300 280 40,798 3,309 3,355 10,554
Administrative Expenses 4 250 28 11 10 81 82 74 71 55
Total Deductions from Plan Net Assets 33,597 250 28 117 310 361 40,880 3,383 3,426 10,609
Net Increase (Decrease) (29,222) 617 134 1,374 838 77,080 (21,021) 3,605 4,101 (12,644)
Net Assets Held in Trust
Balance Beginning of Fiscal Period 35,313 6,091 6,708 6,842 8,216 9,054 86,134 65,113 68,718 72,819
Balance End of Fiscal Period $6,091 $6,708 $6,842 $8,216 $9,054 $86,134 $65,113 $68,718 $72,819 $60,175

STATISTICAL2018 comprehensive annual financial report
106
Changes in Fiduciary Net Position – Last 10 Years Ended December 31, 2018 (Dollars in Thousands)
Year 2009 2010 2011 2012 2013 2014 2015 2016 2017 2018
457 Program
Additions:
Employee Contributions $8,170 $4,582 $5,788 $12,442 $20,646 $22,566 $36,803
Employer Contributions 77 132 1,048
Net Investment Gain (Loss) 163 1,558 786 (747) 3,643 11,698 (7,729)
Total Additions to Plan Net Assets 8,333 6,217 6,706 11,695 24,289 34,264 30,122
Deductions:
Benefits 21 584 1,230 1,066 1,717 3,389 4,386
Administrative Expenses 6 34 70 51 66 86 93
Total Deductions from Plan Net Assets 27 618 1,300 1,117 1,783 3,475 4,479
Net Increase (Decrease) 8,306 5,599 5,406 10,578 22,506 30,789 25,642
Net Assets Held in Trust
Balance Beginning of Fiscal Period 8,306 13,905 19,311 29,889 52,395 83,184
Balance End of Fiscal Period $8,306 $13,905 $19,311 $29,889 $52,395 $83,184 $108,826
IRA Program
Additions:
Employee Contributions $53
Employer Contributions
Net Investment Gain (Loss) (2)
Total Additions to Plan Net Assets 51
Deductions:
Benefits 5
Administrative Expenses
Total Deductions from Plan Net Assets 5
Net Increase (Decrease) 46
Net Assets Held in Trust
Balance Beginning of Fiscal Period
Balance End of Fiscal Period $46
The Changes in Fiduciary Net Position over the last 10 years chart shows contributions being received from municipalities, investment gains/losses and disbursements to retirees/municipalities. The 457 and IRA programs have been in existence for less than 10 years.

STATISTICAL2018 comprehensive annual financial report
107
Year 2009 2010 2011 2012 2013 2014 2015 2016 2017 2018
457 Program
Additions:
Employee Contributions $8,170 $4,582 $5,788 $12,442 $20,646 $22,566 $36,803
Employer Contributions 77 132 1,048
Net Investment Gain (Loss) 163 1,558 786 (747) 3,643 11,698 (7,729)
Total Additions to Plan Net Assets 8,333 6,217 6,706 11,695 24,289 34,264 30,122
Deductions:
Benefits 21 584 1,230 1,066 1,717 3,389 4,386
Administrative Expenses 6 34 70 51 66 86 93
Total Deductions from Plan Net Assets 27 618 1,300 1,117 1,783 3,475 4,479
Net Increase (Decrease) 8,306 5,599 5,406 10,578 22,506 30,789 25,642
Net Assets Held in Trust
Balance Beginning of Fiscal Period 8,306 13,905 19,311 29,889 52,395 83,184
Balance End of Fiscal Period $8,306 $13,905 $19,311 $29,889 $52,395 $83,184 $108,826
IRA Program
Additions:
Employee Contributions $53
Employer Contributions
Net Investment Gain (Loss) (2)
Total Additions to Plan Net Assets 51
Deductions:
Benefits 5
Administrative Expenses
Total Deductions from Plan Net Assets 5
Net Increase (Decrease) 46
Net Assets Held in Trust
Balance Beginning of Fiscal Period
Balance End of Fiscal Period $46

STATISTICAL2018 comprehensive annual financial report
108
Schedule of Changes in Reserves – Year Ended December 31, 2018 (Dollars in Thousands)
The Schedule of Changes in Reserves shows the balance in each of the reserves and changes to those reserve balances over the year. The Employee Contributions, Employer Contributions and Reserve for Expenses and Undistributed Investment Income are components of the Defined Benefit Plan. A balance in the Reserve for Expenses and Undistributed Investment Income will be allocated at a future date.
Reserve for Employee
Contributions
Reserve for Employer
Contributions and Benefit Payments
Reserve for Expenses and Undistributed Investment
Income
Total Reserve for
Defined Benefit Plan
Reserve for Defined
Contribution
Reserve for Health Care Savings
Program
Reserve for Individual
Retirement Account
Reserve for Retiree Health
Funding Vehicle
Reserve for Investment Services Program
Reserve for 457 Program
Total Reserve for
Pension Trust Funds
Additions
Member Contributions $87,739 $87,739 $25,412 $53 $88,650 $36,803 $238,657
Employer Contributions $707,958 707,958 49,077 $27,846 1,048 785,929
Net Investment Income $(394,743) (394,743) (41,167) (6,818) (2) (42,560) $(2,036) (7,729) (495,056)
Miscellaneous Income 221 221 221
Total Additions 87,739 707,958 (394,522) 401,175 33,322 21,028 51 46,090 (2,036) 30,122 529,751
Deductions
Benefits and Withdrawals 8,633 883,897 892,530 39,015 5,954 5 35,004 10,554 4,386 987,449
Administrative Expense 17,463 17,463 555 168 731 55 93 19,065
Total Deductions 8,633 883,897 17,463 909,993 39,570 6,122 5 35,735 10,608 4,479 1,006,513
Net Increase (Decrease) 79,106 (175,939) (411,985) (508,818) (6,249) 14,906 46 10,355 (12,644) 25,642 (476,762)
Other Changes in Reserves 0
Investment Income Allocations 20,632 (407,156) 386,524 0
Retirement and Division Transfers (64,993) 64,993 0
Total Other Changes in Reserves (44,361) (342,163) 386,524 0
Net Increase in Reserves After Other Changes 34,745 (518,102) (25,461) (508,818) (6,249) 14,906 46 10,355 (12,644) 25,642 (476,762)
Reserve Balance Beginning of Year 848,518 8,591,683 35,922 9,476,123 666,840 182,589 906,519 72,819 83,184 11,388,074
Reserve Balance End of Year $883,263 $8,073,581 $10,461 $8,967,305 $660,591 $197,495 $46 $916,874 $60,175 $108,826 $10,911,312

STATISTICAL2018 comprehensive annual financial report
109
Reserve for Employee
Contributions
Reserve for Employer
Contributions and Benefit Payments
Reserve for Expenses and Undistributed Investment
Income
Total Reserve for
Defined Benefit Plan
Reserve for Defined
Contribution
Reserve for Health Care Savings
Program
Reserve for Individual
Retirement Account
Reserve for Retiree Health
Funding Vehicle
Reserve for Investment Services Program
Reserve for 457 Program
Total Reserve for
Pension Trust Funds
Additions
Member Contributions $87,739 $87,739 $25,412 $53 $88,650 $36,803 $238,657
Employer Contributions $707,958 707,958 49,077 $27,846 1,048 785,929
Net Investment Income $(394,743) (394,743) (41,167) (6,818) (2) (42,560) $(2,036) (7,729) (495,056)
Miscellaneous Income 221 221 221
Total Additions 87,739 707,958 (394,522) 401,175 33,322 21,028 51 46,090 (2,036) 30,122 529,751
Deductions
Benefits and Withdrawals 8,633 883,897 892,530 39,015 5,954 5 35,004 10,554 4,386 987,449
Administrative Expense 17,463 17,463 555 168 731 55 93 19,065
Total Deductions 8,633 883,897 17,463 909,993 39,570 6,122 5 35,735 10,608 4,479 1,006,513
Net Increase (Decrease) 79,106 (175,939) (411,985) (508,818) (6,249) 14,906 46 10,355 (12,644) 25,642 (476,762)
Other Changes in Reserves 0
Investment Income Allocations 20,632 (407,156) 386,524 0
Retirement and Division Transfers (64,993) 64,993 0
Total Other Changes in Reserves (44,361) (342,163) 386,524 0
Net Increase in Reserves After Other Changes 34,745 (518,102) (25,461) (508,818) (6,249) 14,906 46 10,355 (12,644) 25,642 (476,762)
Reserve Balance Beginning of Year 848,518 8,591,683 35,922 9,476,123 666,840 182,589 906,519 72,819 83,184 11,388,074
Reserve Balance End of Year $883,263 $8,073,581 $10,461 $8,967,305 $660,591 $197,495 $46 $916,874 $60,175 $108,826 $10,911,312
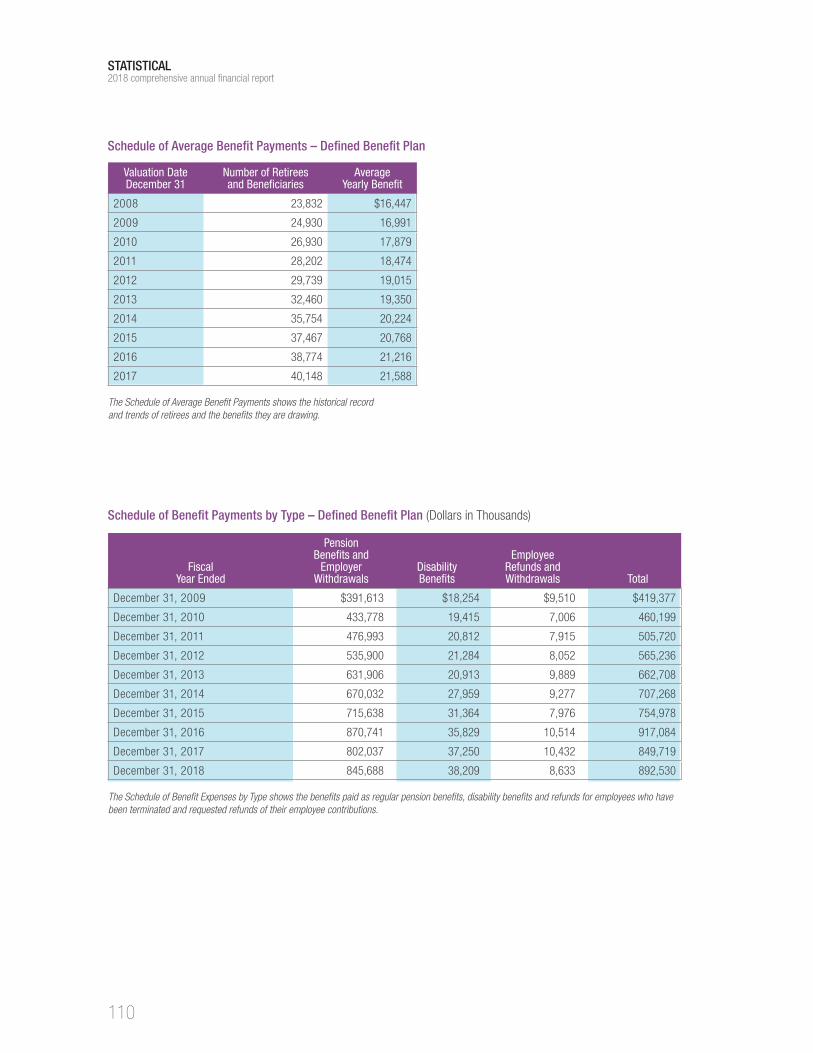
STATISTICAL2018 comprehensive annual financial report
110
Valuation Date December 31
Number of Retirees and Beneficiaries
Average Yearly Benefit
2008 23,832 $16,447
2009 24,930 16,991
2010 26,930 17,879
2011 28,202 18,474
2012 29,739 19,015
2013 32,460 19,350
2014 35,754 20,224
2015 37,467 20,768
2016 38,774 21,216
2017 40,148 21,588
Fiscal Year Ended
Pension Benefits and
Employer Withdrawals
Disability Benefits
Employee Refunds and Withdrawals Total
December 31, 2009 $391,613 $18,254 $9,510 $419,377
December 31, 2010 433,778 19,415 7,006 460,199
December 31, 2011 476,993 20,812 7,915 505,720
December 31, 2012 535,900 21,284 8,052 565,236
December 31, 2013 631,906 20,913 9,889 662,708
December 31, 2014 670,032 27,959 9,277 707,268
December 31, 2015 715,638 31,364 7,976 754,978
December 31, 2016 870,741 35,829 10,514 917,084
December 31, 2017 802,037 37,250 10,432 849,719
December 31, 2018 845,688 38,209 8,633 892,530
Schedule of Average Benefit Payments – Defined Benefit Plan
The Schedule of Average Benefit Payments shows the historical record and trends of retirees and the benefits they are drawing.
Schedule of Benefit Payments by Type – Defined Benefit Plan (Dollars in Thousands)
The Schedule of Benefit Expenses by Type shows the benefits paid as regular pension benefits, disability benefits and refunds for employees who have been terminated and requested refunds of their employee contributions.

STATISTICAL2018 comprehensive annual financial report
111
Type of BenefitNumber of Retirees
Total Monthly Benefits
Normal Retirement for age and service 32,819 $63,667,496
Non-Duty Disability1 1,187 1,588,303
Duty Disability1 591 1,067,322
Beneficiaries2 4,665 4,920,659
Non-Duty Death 829 921,884
Duty Death 57 59,058
Totals 40,148 $72,224,722
Type of BenefitNumber of Retirees
Total Monthly Benefits
Beneficiary draws 100% of retiree’s benefit 12,373 $23,338,574
Beneficiary draws 67% of retiree’s benefit 3 $12,816
Beneficiary draws 75% of retiree’s benefit 2,644 6,495,837
Beneficiary draws 60% of retiree’s benefit 413 1,481,510
Beneficiary draws 50% of retiree’s benefit 5,836 12,300,210
Equated Option (changing at Social Security age) 393 375,034
5 year certain and life 314 490,298
10 year certain and life 827 1,571,634
15 year certain and life 237 364,253
20 year certain and life 498 740,889
Straight life allowance 16,610 25,053,667
Totals 40,148 $72,224,722
Schedule of Retired Members by Type of Benefit – Defined Benefit PlanDecember 31, 2017, Tabulated by Optional Form of Benefit Being Paid, Tabulated by Type of Benefit Being Paid
1 At age 60, these benefit types are converted to normal retirement for age and service 2 Includes EDRO alternate payees
Schedule of Retired Members by Type of Option Selected – Defined Benefit PlanDecember 31, 2017, Tabulated by Optional Form of Benefit Being Paid
The Schedule of Retired Members by Type of Benefit and by Type of Option Selected present distributions of retirees and beneficiaries on the rolls by the types of benefit being paid and option selected.

STATISTICAL2018 comprehensive annual financial report
112
Number of Participants Total
Defined Benefit % of Total
Defined Contribution % of Total Hybrid % of Total
December 31, 2009 75,605 67,254 89.0% 8,351 11.0% N/A 0.0%
December 31, 2010 78,343 69,707 89.0% 8,636 11.0% N/A 0.0%
December 31, 2011 91,666 81,926 89.4% 9,193 10.0% 547 0.6%
December 31, 2012 93,462 82,331 88.1% 10,210 10.9% 921 1.0%
December 31, 2013 98,072 85,530 87.2% 11,340 11.6% 1,202 1.2%
December 31, 2014 101,589 87,661 86.3% 12,239 12.0% 1,689 1.7%
December 31, 2015 106,735 90,437 84.7% 13,912 13.0% 2,386 2.2%
December 31, 2016 108,412 91,125 84.1% 14,803 13.7% 2,484 2.3%
December 31, 2017 112,664 92,790 82.4% 16,819 14.9% 3,055 2.7%
December 31, 2018 116,840 94,089 80.5% 19,216 16.4% 3,535 3.0%
Defined Contribution Plan Participants and Total MERS Participants
Although MERS Defined Contribution Plan participants are not included in the annual actuarial valuation of the MERS Defined Benefit Plan, the trend in Defined Contribution participation is of interest. Numerous municipal divisions have established Defined Contribution Plan benefits for future new employees. Existing Defined Benefit Plan active members in those divisions were offered a choice of plans. The table above shows recent participation trends in Defined Contribution and Hybrid Plans, and overall MERS participants.


This publication contains a summary description of MERS benefits, policies or procedures. MERS has made every effort to ensure that the information provided is accurate and up to date (as of the date of publication 05/29/2019). If this publication conflicts with the relevant provisions of the Plan Document, the Plan Document Controls. MERS, as a governmental plan, is exempted by state and federal law from registration with the SEC. However, it employs registered investment advisors to manage the trust fund in compliance with Michigan Public Employee Retirement System Investment Act. Past Performance is not a guarantee of future returns. Please make independent investment decisions carefully and seek the assistance of independent experts when appropriate.
1134 Municipal Way Lansing, Michigan 48917
800.767.MERS (6377) www.mersofmich.com
PUB 9206 2019-05-29