compreensive annual financial report - … 2016.pdf · ... 12 financial ... notes to financial...
TRANSCRIPT

FY2016 COMPREHENSIVE ANNUAL
FINANCIAL REPORT
IOWA PUBLIC EMPLOYEES’ RETIREMENT SYSTEM
A PENSION TRUST FUND OF THE STATE OF IOWA FOR THE FISCAL YEAR ENDED JUNE 30, 2016


PB IPERS Comprehensive Annual Financial Report 2016
A PENSION TRUST FUND OF THE STATE OF IOWA FOR THE FISCAL YEAR ENDED JUNE 30, 2016 PREPARED BY IOWA PUBLIC EMPLOYEES’ RETIREMENT SYSTEM
DONNA M. MUELLER, CHIEF EXECUTIVE OFFICER
FY2016 COMPREHENSIVE ANNUAL FINANCIAL REPORT

ii IPERS Comprehensive Annual Financial Report 2016
Membership Active Members ........................................................................................................................................ 168,372
Inactive Members ........................................................................................................................................ 66,847
Retired Members* ..................................................................................................................................... 114,491
Total ........................................................................................................................................................... 349,710
Contributions Employee ..........................................................................................................................................$459,854,052
Employer ..........................................................................................................................................$684,664,998
Service Purchases ..............................................................................................................................$32,147,862
Distributions Benefits Paid ................................................................................................................................. $1,840,734,608
Refunds Paid .......................................................................................................................................$49,248,177
Investments Net Investment and Securities Lending Income ............................................................................. $624,853,651
Investment Rate of Return ........................................................................................................................... 2.15%
FinancialTotal Pension Liability ..................................................................................................................$34,619,749,147
Fiduciary Net Position................................................................................................................ $28,326,433,656
Net Pension Liability .....................................................................................................................$6,293,315,491
Ratio of Fiduciary Net Position to Total Pension Liability..........................................................................81.82%
Funding Ratio of Actuarial Assets to Actuarial Liabilities ......................................................................................83.86%
*Unless specifically noted, references to retirees throughout this report include beneficiaries.
FISCAL YEAR 2016 HIGHLIGHTS

ii IPERS Comprehensive Annual Financial Report 2016 IPERS Comprehensive Annual Financial Report 2016 iii
Introduction .................................................................Pages 1–12Letter of Transmittal .............................................................................3Professional Awards .............................................................................8
Administration .....................................................................................9Investment Board ................................................................................10Benefits Advisory Committee ............................................................11Professional and Consulting Services ...............................................12
Financial ......................................................................Pages 13–48Independent Auditor’s Report ............................................................15Management’s Discussion and Analysis ...........................................18Basic Financial Statements ................................................................21
Statement of Fiduciary Net Position ........................................21Statement of Changes in Fiduciary Net Position ....................22Notes to Financial Statements.................................................23
Required Supplementary Information ................................................42Schedule 1: Schedule of Changes in the Employers’ Net Pension Liability and Related Ratios.. ................................42Schedule 2: Schedule of Employers’ Contributions................ 43Schedule 3: Schedule of Investment Returns ......................... 44Notes to Required Supplementary Information ..................... 44
Supplementary Information ...............................................................46Schedule 1: Schedule of Administrative Expenses .................46Schedule 2: Schedule of Investment-Related Expenses.........47
Investments .............................................................. Pages 49–78Investment Overview ..........................................................................51Investment Results .............................................................................53Investment Policy and Goal Statement..............................................64
Actuarial .................................................................... Pages 79–102Actuary’s Certification Letter .............................................................81Principal Valuation Results .................................................................87Actuarial Balance Sheet .....................................................................88Solvency Test ......................................................................................89Schedule of Active Member Valuation Data .....................................90Retirees and Beneficiaries—Changes in Rolls .................................90Schedule of Funding Progress ............................................................91Actuarial Assumptions and Methods ................................................92Contribution Rate Funding Policy .....................................................100
Statistical ............................................................... Pages 103–120Statistical Overview .........................................................................105
Changes in Fiduciary Net Position .........................................106Membership and Benefit Payment Summary ..................................108
Special Statistics ....................................................................108Membership by Group ............................................................109Average Benefit Payments for Retirees ................................ .110New Retirees by Employer Type ............................................ 111Schedule of Benefit Payments by Type of Benefit ................ 112Schedule of Retired Members by Type of Benefit ................. 112Retired Members by Benefit Option ...................................... 113Benefit Payments by Iowa County ......................................... 114Benefit Payments by State ..................................................... 116Benefit Payment Summary ..................................................... 117Active Membership Statistics ................................................ 117Analysis of Change in Active Membership ............................ 117Principal Participating Employers .......................................... 118
Investment Statistics ........................................................................ 119 Growth of Net Investment Portfolio Assets .......................... 119 Investment Returns................................................................. 119
TABLE OF CONTENTS

iv IPERS Comprehensive Annual Financial Report 2016

Introduction

INTRODUCTION
LETTER OF TRANSMITTAL
PROFESSIONAL AWARDS
ADMINISTRATION
INVESTMENT BOARD
BENEFITS ADVISORY COMMITTEE
PROFESSIONAL AND CONSULTING SERVICES

PB INTRODUCTION IPERS Comprehensive Annual Financial Report 2016 IPERS Comprehensive Annual Financial Report 2016 INTRODUCTION 3
December 9, 2016
To the Governor and the General Assembly of the State of Iowa:
We are pleased to submit the Comprehensive Annual Financial Report (CAFR) of the Iowa Public Employees’ Retirement System (IPERS, System, or plan) for the fiscal year ended June 30, 2016 (FY2016). This report presents a thorough discussion of IPERS’ activities and financial status.
This publication fulfills the requirements set forth in Iowa Code section 97B.4(4)(a). The preparation of this report and the financial statements are the result of the combined effort of the System’s staff under the direction of the management and CEO, who are responsible for the contents of the report.
IPERS’ objective is to provide reasonable, rather than absolute, assurance that the financial statements are free of any material misstatements since the cost of internal control should not exceed the benefits obtained. To that end, IPERS’ administration maintains an internal accounting control system. It ensures that transactions are executed as intended by the administration, assets are accounted for, and the records of transactions are sufficient to permit preparation of the financial statements. Financial statements must be consistent with generally accepted accounting principles (GAAP) for governmental accounting and reporting. GAAP are pronounced or adopted by the Governmental Accounting Standards Board (GASB).
The Auditor of State is required by the Iowa Code to conduct an annual audit of the financial statements. The audit has been completed in accordance with generally accepted auditing standards, State law, and Government Auditing Standards. The Auditor’s report is contained in the Financial section.
The Financial section also contains Management’s Discussion and Analysis. This is intended to satisfy the GASB requirement that the System provide a narrative introduction, overview, and analysis to accompany the basic financial statements. This letter of transmittal complements Management’s Discussion and Analysis and should be read in conjunction with it.
Membership numbers in the Actuarial section differ from those in other sections because the Actuarial section reflects projections of future costs. Therefore, member deaths that occurred during the last month of the fiscal year are not counted in the membership numbers of that section. However, because there is a financial obligation for some of these members, they are included in the membership numbers in the remainder of this report.
System OverviewIPERS was established by the Iowa Legislature on July 4, 1953, to replace the Iowa Old-Age and Survivors’ Insurance System (IOASI). At that time, the Legislature also voted to include Iowa’s public employees in the federal Social Security plan retroactive to 1951.
Iowa Code chapter 97B was the chapter created to govern IPERS and the IPERS Trust Fund. The Code establishes IPERS as an independent agency within the Executive Branch of State Government. The Governor and the Iowa Legislature, as creators of the plan, are the plan sponsors.

4 INTRODUCTION IPERS Comprehensive Annual Financial Report 2016
Initially, IPERS was a money purchase system that calculated benefits based on contributions. Today, IPERS is a contributory defined benefit plan with benefits based on a formula using a member’s years of service, average salary, and a multiplier. IPERS is diligent in maintaining its tax qualification under the Internal Revenue Code. The most recent IRS determination letter of qualification is dated July 29, 2014. IPERS benefits are designed to provide an adequate retirement income when combined with Social Security benefits and individual savings.
Most public employees in Iowa become members of IPERS when they start employment with a covered employer, which includes schools, state agencies, counties, cities, townships, and other public entities. Public employees not covered by IPERS are judges, peace officers in the Iowa Department of Public Safety, police and fire personnel covered by the Municipal Fire and Police Retirement System of Iowa (MFPRSI), and university and community college personnel who elect other coverage.
As a multiple-employer, cost-sharing pension plan with 349,710 members, IPERS is the largest public pension system in Iowa. The IPERS Trust Fund paid $1.626 billion in benefits to Iowans in FY2016. One in ten Iowans is an IPERS member.
Major InitiativesIn FY2016, IPERS started calculating service purchase costs in-house, using the I-Que pension administration system. Previously, IPERS’ actuaries performed the calculations.
IPERS continued to work with its vendor to upgrade I-Que during the fiscal year. This three-year project is scheduled for completion in 2018.
IPERS also implemented GASB Statement No. 72, Fair Value Measurement and Application, which addresses accounting and financial reporting issues related to fair value measurements of investments. This was a combined effort of IPERS’ accounting and investment staff, the Bank of New York Mellon, and Deutsche Bank.
Membership ServicesMembers and employers have access to information online, by phone, and in print. The IPERS website contains news and announcements, publications, videos, forms, and retirement calculators.
Members have online access to their benefits statements, which are updated quarterly and mailed each spring. IPERS publishes easy-to-read booklets to explain benefits at various career stages, as well as a comprehensive Member Handbook. Annually, IPERS mails members information about benefits, plan changes, finances, and performance. Quarterly, IPERS publishes an online newsletter for members as well as one for employers.
IPERS’ 1,960 employers receive training and technical assistance to encourage voluntary compliance with IPERS’ requirements. Employers also receive newsletters and a handbook of procedures and reporting requirements. IPERS’ team of compliance officers conducts frequent employer audits.
InvestmentsIPERS manages a large and diversified investment portfolio using external investment advisers. The strategic target asset allocation policy adopted by IPERS’ Investment Board provides a framework for achieving this diversification. The policy limits the impact of large losses on individual investments and provides broad exposure to various markets. The Board periodically reviews the policy to balance the need for returns with the risks inherent in the market. IPERS’ long-term horizon allows it to maximize investment returns and lower transaction costs on behalf of its members in a way an individual investor cannot.
Fiscal Year 2016Preretirement counseling sessions 11,294Phone inquiries 88,389E-mail replies 8,878Benefit estimates prepared 43,149Service purchase cost quotes prepared 3,176Service purchases made 981
4 INTRODUCTION IPERS Comprehensive Annual Financial Report 2016 IPERS Comprehensive Annual Financial Report 2016 INTRODUCTION 5
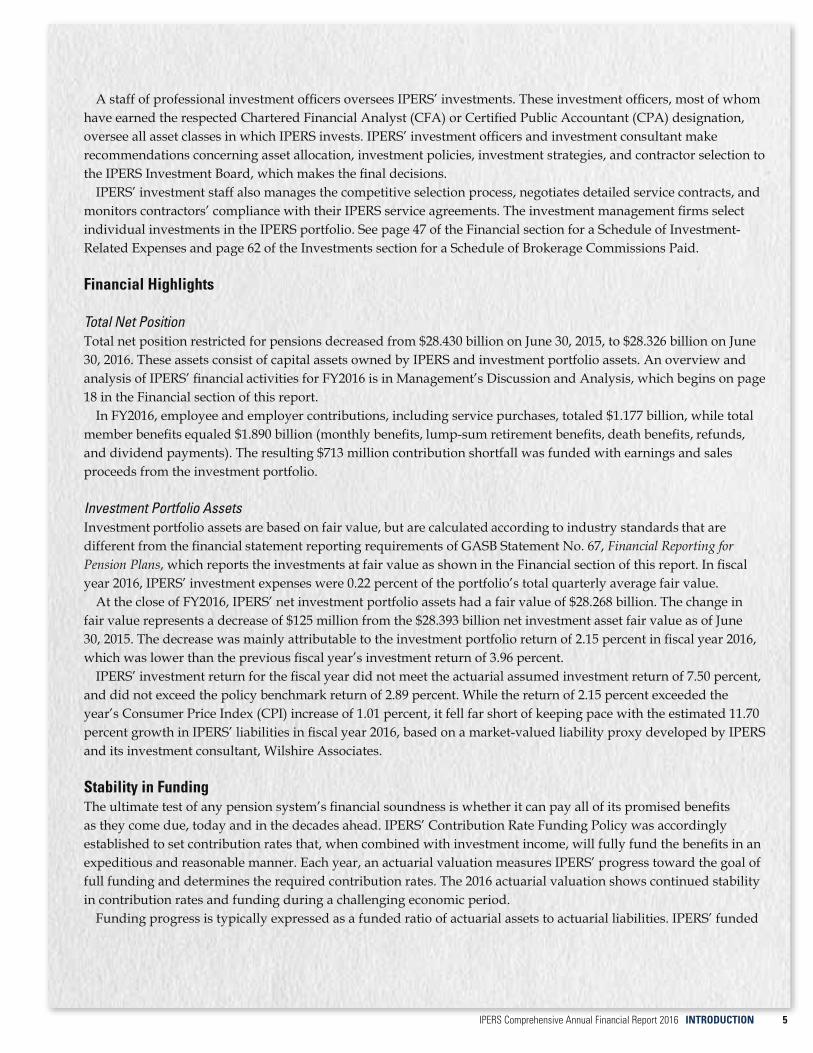
A staff of professional investment officers oversees IPERS’ investments. These investment officers, most of whom have earned the respected Chartered Financial Analyst (CFA) or Certified Public Accountant (CPA) designation, oversee all asset classes in which IPERS invests. IPERS’ investment officers and investment consultant make recommendations concerning asset allocation, investment policies, investment strategies, and contractor selection to the IPERS Investment Board, which makes the final decisions.
IPERS’ investment staff also manages the competitive selection process, negotiates detailed service contracts, and monitors contractors’ compliance with their IPERS service agreements. The investment management firms select individual investments in the IPERS portfolio. See page 47 of the Financial section for a Schedule of Investment-Related Expenses and page 62 of the Investments section for a Schedule of Brokerage Commissions Paid.
Financial Highlights
Total Net PositionTotal net position restricted for pensions decreased from $28.430 billion on June 30, 2015, to $28.326 billion on June 30, 2016. These assets consist of capital assets owned by IPERS and investment portfolio assets. An overview and analysis of IPERS’ financial activities for FY2016 is in Management’s Discussion and Analysis, which begins on page 18 in the Financial section of this report.
In FY2016, employee and employer contributions, including service purchases, totaled $1.177 billion, while total member benefits equaled $1.890 billion (monthly benefits, lump-sum retirement benefits, death benefits, refunds, and dividend payments). The resulting $713 million contribution shortfall was funded with earnings and sales proceeds from the investment portfolio.
Investment Portfolio AssetsInvestment portfolio assets are based on fair value, but are calculated according to industry standards that are different from the financial statement reporting requirements of GASB Statement No. 67, Financial Reporting for Pension Plans, which reports the investments at fair value as shown in the Financial section of this report. In fiscal year 2016, IPERS’ investment expenses were 0.22 percent of the portfolio’s total quarterly average fair value.
At the close of FY2016, IPERS’ net investment portfolio assets had a fair value of $28.268 billion. The change in fair value represents a decrease of $125 million from the $28.393 billion net investment asset fair value as of June 30, 2015. The decrease was mainly attributable to the investment portfolio return of 2.15 percent in fiscal year 2016, which was lower than the previous fiscal year’s investment return of 3.96 percent.
IPERS’ investment return for the fiscal year did not meet the actuarial assumed investment return of 7.50 percent, and did not exceed the policy benchmark return of 2.89 percent. While the return of 2.15 percent exceeded the year’s Consumer Price Index (CPI) increase of 1.01 percent, it fell far short of keeping pace with the estimated 11.70 percent growth in IPERS’ liabilities in fiscal year 2016, based on a market-valued liability proxy developed by IPERS and its investment consultant, Wilshire Associates.
Stability in FundingThe ultimate test of any pension system’s financial soundness is whether it can pay all of its promised benefits as they come due, today and in the decades ahead. IPERS’ Contribution Rate Funding Policy was accordingly established to set contribution rates that, when combined with investment income, will fully fund the benefits in an expeditious and reasonable manner. Each year, an actuarial valuation measures IPERS’ progress toward the goal of full funding and determines the required contribution rates. The 2016 actuarial valuation shows continued stability in contribution rates and funding during a challenging economic period.
Funding progress is typically expressed as a funded ratio of actuarial assets to actuarial liabilities. IPERS’ funded
Fiscal Year 2016Preretirement counseling sessions 11,294Phone inquiries 88,389E-mail replies 8,878Benefit estimates prepared 43,149Service purchase cost quotes prepared 3,176Service purchases made 981
6 INTRODUCTION IPERS Comprehensive Annual Financial Report 2016
ratio of 83.9 percent shows steadiness as compared to the FY2015 funded ratio of 83.7 percent. This funding strength in the face of volatile financial markets is the result of the System’s asset smoothing method and Contribution Rate Funding Policy.
IPERS’ total portfolio investment return was 2.15 percent in fiscal year 2016. This is the second consecutive year in which the return was less than the 7.50 percent actuarial assumed investment return. For actuarial funding purposes, only a portion of investment experience above or below the 7.50 percent actuarial assumed investment return is included in the valuation of assets each year. This results in a deferral of gains or losses to future years. Stronger investment returns in fiscal years 2013 and 2014 resulted in deferred investment gains to apply toward the experience losses on the actuarial value of assets in fiscal years 2015 and 2016. The end result in fiscal year 2016 was an experience loss on the actuarial value of assets of $236 million and a deferred investment loss of $708 million. This will be recognized in future years according to the System’s asset smoothing method.
Contribution rates effective July 1, 2017, were determined in the valuation as of June 30, 2016. The contribution rate for the Regular membership (95 percent of the active membership) will remain unchanged. This rate has held steady since fiscal year 2014, when it reached the actuarial rate for the first time in over a decade. Since FY2015, the rate has exceeded the actuarial rate.
Contribution rates for both Special service membership groups will also be greater than the actuarial rates, even with a 0.50 percentage point reduction in the required rate for sheriffs and deputies. The System’s Contribution Rate Funding Policy considers stability in contribution rates important to support the System’s commitment to full funding. To this end, the Policy places restrictions on lowering contribution rates. A membership group’s contribution rate can be lowered by 0.50 percentage point only when the group reaches a funded ratio of at least 95 percent, and its actuarial rate is at least 0.50 percentage point less than its current contribution rate. Both criteria were reached for the sheriff and deputy membership group for the past two valuations. While the protection occupation membership group is over 100 percent funded, the actuarial rate is only 0.41 percentage point lower than the current rate. Therefore, their rate will remain unchanged. While maintaining stability in the rates, paying more than the actuarial rate also helps pay down the unfunded actuarial liability, which in turn helps stabilize the funded ratio and work toward fully funding the benefits promised.
Independent Performance EvaluationsTo maintain a focus on effectively administering the plan, IPERS completed voluntary reviews of its performance during fiscal year 2016. CEM Benchmarking Inc., an independent company that reviews pension systems worldwide, conducted a benchmarking study on IPERS’ benefits administration for the previous year. IPERS was lowest in costs when compared to its peers, while receiving high ratings for its services.
CEM also conducted a benchmarking study of IPERS’ investment program that compared the Trust Fund’s costs and investment performance to results for peers in CEM’s extensive pension fund database. The study covered a 5-year period that ended December 31, 2015. IPERS’ investment program was rated by CEM as a low-cost program for that time period, and IPERS’ net added value was 0.05 percent, which matched peer results.
Wilshire Associates, IPERS’ investment consultant, also reviews IPERS’ investment performance against a peer group of U.S. public pension funds. IPERS’ FY2016 investment return ranked in the top 17th percentile of funds in the Trust Universe Comparison Service (TUCS) Universe of Public Funds with Assets Greater than $1 billion. IPERS’ ranking was due mainly to its comparatively more conservative investment structure in a year when risk-taking was generally not rewarded. When peer performance is measured in terms of return per unit of risk, Wilshire data shows that IPERS’ risk-adjusted returns (returns divided by standard deviations of returns) has ranked in the top 21 percent of the TUCS Universe of Public Funds with Assets Greater than $1 billion for the 10-year period.

6 INTRODUCTION IPERS Comprehensive Annual Financial Report 2016 IPERS Comprehensive Annual Financial Report 2016 INTRODUCTION 7
Professional AwardsThe Government Finance Officers Association of the United States and Canada (GFOA) awarded a Certificate of Achievement for Excellence in Financial Reporting to IPERS for its Comprehensive Annual Financial Report for the fiscal year ended June 30, 2015. A Certificate of Achievement is valid for only one year; this was the 23rd consecutive year IPERS has earned this prestigious award. To receive a Certificate of Achievement, a governmental entity must publish an easy-to-read and efficiently organized CAFR that satisfies both generally accepted accounting principles and applicable legal requirements. We believe our current CAFR continues to meet the Certificate of Achievement Program’s requirements, and we are submitting it to the GFOA to determine its eligibility for another certificate.
For the eighth consecutive year, IPERS received the Public Pension Standards Award for the fiscal year ended June 30, 2016, from the Public Pension Coordinating Council (PPCC), in recognition of meeting the professional standards for plan funding and administration as set forth in the Public Pension Standards. The PPCC is a confederation of the National Association of State Retirement Administrators (NASRA), the National Conference on Public Employee Retirement Systems (NCPERS), and the National Council on Teacher Retirement (NCTR).
AcknowledgmentsThis report is available online or in hard copy by request. It is provided to the Governor, legislative leadership, IPERS Investment Board members, IPERS Benefits Advisory Committee members, and state fiscal staff in the Executive and Legislative Branches. IPERS also publishes an annual summary of the information contained in this report, which is offered to members, employers, policymakers, and others.
This report is intended to provide complete and reliable information as a basis for management decisions, legal compliance, and stewardship of the System’s assets. We appreciate the dedication and commitment of IPERS’ Board members and staff to provide the highest possible level of service to members and retirees.
Respectfully submitted,
Donna M. Mueller Darla IversonChief Executive Officer Chief Financial Officer

8 INTRODUCTION IPERS Comprehensive Annual Financial Report 2016
PROFESSIONAL AWARDS
Public Pension Coordinating Council
Public Pension Standards Award For Funding and Administration
2016
Presented to
Iowa Public Employees' Retirement System
In recognition of meeting professional standards for plan funding and administration as
set forth in the Public Pension Standards.
Presented by the Public Pension Coordinating Council, a confederation of
National Association of State Retirement Administrators (NASRA) National Conference on Public Employee Retirement Systems (NCPERS)
National Council on Teacher Retirement (NCTR)
Alan H. Winkle
Program Administrator
P CP C

8 INTRODUCTION IPERS Comprehensive Annual Financial Report 2016 IPERS Comprehensive Annual Financial Report 2016 INTRODUCTION 9
Table of Organization
ADMINISTRATION
IPERS’ primary purposes are to provide a secure core retirement benefit to Iowa’s former and current public employees, and to attract and retain quality employees in public service. The activities of the administration are designed to accomplish these purposes and include:• Providing counseling services and retirement
information to active and retired members.• Providing retirement, disability, and death benefits to
members and beneficiaries.• Providing refunds to members, which may be rolled
over to other IRS-qualified retirement plans.• Collecting employer contributions, employee
contributions, and employee wage information inaccordance with State law and IPERS’ administrativerules.
• Providing recommendations to the Governor andGeneral Assembly on plan design adjustments.
• Overseeing the investment of the System’s fundsin accordance with the Investment Policy and GoalStatement adopted by the Investment Board.
Iowa Public Employees’ Retirement System Donna M. Mueller, Chief Executive Officer
Investments DivisionKarl C. Koch, Chief Investment Officer
Benefits DivisionDavid Martin, Chief Benefits Officer
General Counsel OfficeGregg A. Schochenmaier, General Counsel
Financial DivisionDarla Iverson, Chief Financial Officer
Information Management DivisionRick Hindman, Chief Technology Officer

10 INTRODUCTION IPERS Comprehensive Annual Financial Report 2016
INVESTMENT BOARD
The IPERS Investment Board is designated as the Fund’s trustee. The Board has eleven members: seven voting members and four nonvoting members. The following voting members serve six-year terms:• Three public members appointed by the Governor
and confirmed by the Iowa Senate.• Three members of the System appointed by the
Governor and confirmed by the Iowa Senate.The State Treasurer is also a voting member. The
nonvoting members include two state representatives and two state senators.
APPOINTED BY THE GOVERNOR:David Creighton, ChairpersonPublic MemberTerm Ends: April 30, 2021
Marlene Sprouse, Vice ChairpersonIPERS Educational MemberTerm Ends: April 30, 2017
Phyllis Peterson Retired IPERS Member Term Ends: April 30, 2022
Lisa Stange Public Member Term Ends: April 30, 2017
Wayne WalterActive IPERS MemberTerm Ends: April 30, 2019
Dennis YoungPublic MemberTerm Ends: April 30, 2019
EX OFFICIO MEMBER:Michael Fitzgerald State Treasurer
APPOINTED BY THE HOUSE SPEAKER AND MINORITY LEADER:Representative Mary MascherState RepresentativeTerm Ends: January 12, 2017
Representative Dawn PettengillState RepresentativeTerm Ends: January 12, 2017
APPOINTED BY THE SENATE MAJORITY AND MINORITY LEADERS:Senator Julian GarrettState SenatorTerm Ends: January 12, 2017
Senator Matt McCoyState SenatorTerm Ends: January 12, 2017

10 INTRODUCTION IPERS Comprehensive Annual Financial Report 2016 IPERS Comprehensive Annual Financial Report 2016 INTRODUCTION 11
BENEFITS ADVISORY COMMITTEE
The IPERS Benefits Advisory Committee (BAC) members represent major member, employer, and retiree associations; and have extensive experience in education, public safety, workforce development, human resources, and other disciplines. While Iowa law names the constituent groups to serve on the BAC, each association chooses its BAC representative.
Len Cockman, ChairpersonEmployer RepresentativeIowa Association of School Boards
Bradley Hudson, Vice ChairpersonMember RepresentativeIowa State Education Association
Susanna Brown Member RepresentativeState Police Officers Council
Matt CarverMember RepresentativeSchool Administrators of Iowa
Jesse CaseMember RepresentativeInternational Brotherhood of Teamsters
Lowell DauenbaughPublic Member
Andrew HennesyMember RepresentativeIPERS Improvement Association
Steve HoffmanMember RepresentativeIowa State Sheriffs and Deputies Association
Danny HomanMember RepresentativeAFSCME
A.J. MummEmployer RepresentativeIowa Association of Counties
Janet PhippsEx Officio Employer RepresentativeIowa Department of Administrative Services
Philip TetzloffMember RepresentativeRetired School Personnel Association
Mark TombEmployer RepresentativeIowa League of Cities
Sandy TryonEmployer RepresentativeIowa Association of Community College Trustees

12 INTRODUCTION IPERS Comprehensive Annual Financial Report 2016
PROFESSIONAL AND CONSULTING SERVICES
Actuary• Cavanaugh Macdonald
Consulting, LLC
Legal Counsel• Foster Pepper PLLC• Ice Miller, LLP
Securities Litigation Monitoring Counsel• Barrack, Rodos & Bacine• Kessler Topaz Meltzer
Check• Lieff Cabraser Heimann
& Bernstein
Investment Management Consultant• Wilshire Associates, Inc.
Master Custodian• The Bank of New York
Mellon
Securities Lending Agent• Deutsche Bank
Information Technology Consultant• Vitech Systems Group,
Inc.
Benchmarking Consultant• CEM Benchmarking Inc.
Investment Managers
Domestic Equity• BlackRock Institutional
Trust Company, NA• Columbia Management
Investment Advisers,LLC
• Fisher Investments• Janus Capital
Management LLC• J.P. Morgan Investment
Management, Inc.• Mellon Capital
ManagementCorporation
• PanAgora AssetManagement, Inc.
• Wellington ManagementCompany, LLP
International Equity• BlackRock Institutional
Trust Company, NA• GAM USA Inc.• Mellon Capital
ManagementCorporation
• Oechsle InternationalAdvisors, LLC
• QuantitativeManagement AssociatesLLC
• Wellington ManagementCompany, LLP
Core-Plus Fixed Income• BlackRock Financial
Management, Inc.• MacKay Shields LLC• Mellon Capital
ManagementCorporation
• Principal GlobalInvestors, LLC
• PGIM, Inc.• TCW Asset Management
Company LLC• Western Asset
Management Company
Credit Opportunities• AEGON USA
InvestmentManagement, LLC
• Oaktree CapitalManagement, L.P.
• PGIM, Inc.
U.S. Treasury Inflation- Protected Securities• BlackRock Institutional
Trust Company, NA• Fischer Francis Trees &
Watts, Inc.
Other Real Assets• Forest Investment
Associates L.P.• Harvest Fund Advisors
LLC• UBS Farmland Investors
LLC
Private Equity/Debt• Pathway Capital
Management, LP
Real Estate• Blackstone Real
Estate Debt StrategiesAssociates II L.P.
• CenterSquareInvestmentManagement, Inc.
• Clarion Partners, LLC• Invesco Real Estate• Principal Real Estate
Debt Fund, LP• RREEF America, LLC• State Street Global
Advisors• UBS Realty Investors,
LLC
Transition Management Services• BlackRock Institutional
Trust Company, NA• Russell Implementation
Services, Inc.• State Street Bank and
Trust Company

Financial

FINANCIAL
INDEPENDENT AUDITOR’S REPORT
MANAGEMENT’S DISCUSSION AND ANALYSIS
BASIC FINANCIAL STATEMENTS
Statement of Fiduciary Net Position
Statement of Changes in Fiduciary Net Position
Notes to Financial Statements
REQUIRED SUPPLEMENTARY INFORMATION
SUPPLEMENTARY INFORMATION

PB FINANCIAL IPERS Comprehensive Annual Financial Report 2016 IPERS Comprehensive Annual Financial Report 2016 FINANCIAL 15
OFFICE OF AUDITOR OF STATE STATE OF IOWA
State Capitol Building Des Moines, Iowa 50319-0004
Telephone (515) 281-5834 Facsimile (515) 242-6134
Mary Mosiman, CPA Auditor of State
Independent Auditor's Report
To the Members of the Iowa Public Employees’ Retirement System Investment Board:
Report on the Financial Statements
We have audited the accompanying Statement of Fiduciary Net Position of the Iowa Public Employees’ Retirement System (IPERS) as of June 30, 2016, and the related Statement of Changes in Fiduciary Net Position for the year then ended and the related Notes to Financial Statements, which collectively comprise the Iowa Public Employees’ Retirement System’s basic financial statements listed in the table of contents.
Management’s Responsibility for the Financial Statements
Management is responsible for the preparation and fair presentation of these financial statements in accordance with U.S. generally accepted accounting principles. This includes the design, implementation and maintenance of internal control relevant to the preparation and fair presentation of financial statements that are free from material misstatement, whether due to fraud or error.
Auditor’s Responsibility
Our responsibility is to express an opinion on these financial statements based on our audit. We conducted our audit in accordance with U.S. generally accepted auditing standards and the standards applicable to financial audits contained in Government Auditing Standards, issued by the Comptroller General of the United States. Those standards require that we plan and perform the audit to obtain reasonable assurance about whether the financial statements are free from material misstatement.
An audit involves performing procedures to obtain audit evidence about the amounts and disclosures in the financial statements. The procedures selected depend on the auditor’s judgment, including the assessment of the risks of material misstatement of the financial statements, whether due to fraud or error. In making those risk assessments, the auditor considers internal control relevant to IPERS’ preparation and fair presentation of the financial statements in order to design audit procedures that are appropriate in the circumstances, but not for the purpose of expressing an opinion on the effectiveness of IPERS’ internal control. Accordingly, we express no such opinion. An audit also includes evaluating the appropriateness of accounting policies used and the reasonableness of significant accounting estimates made by management, as well as evaluating the overall presentation of the financial statements.
We believe the audit evidence we have obtained is sufficient and appropriate to provide a basis for our audit opinion.

16 FINANCIAL IPERS Comprehensive Annual Financial Report 2016
Opinion
In our opinion, the financial statements referred to above present fairly, in all material respects, the fiduciary net position of IPERS at June 30, 2016, and the changes in its fiduciary net position for the year then ended in accordance with U.S. generally accepted accounting principles.
Emphasis of a Matter
As discussed in Note 1, the financial statements present the financial position and the changes in financial position of only that portion of the reporting entity of the State of Iowa that is attributable to the transactions of IPERS. They do not purport to, and do not, present fairly the financial position of the State of Iowa as of June 30, 2016, and the changes in its financial position and its cash flows, where applicable, for the year then ended in conformity with U.S. generally accepted accounting principles.
Report on Summarized Comparative Information
We have previously audited the financial statements of IPERS for the year ended June 30, 2015, and we expressed an unmodified audit opinion on those audited financial statements in our report dated December 9, 2015. In our opinion, the summarized comparative information presented herein as of and for the year ended June 30, 2015 is consistent, in all material respects, with the audited financial statements from which it has been derived.
Other Matters
Required Supplementary Information
U.S. generally accepted accounting principles require Management’s Discussion and Analysis, the Schedule of Changes in the Employers’ Net Pension Liability and Related Ratios, the Schedule of Employers’ Contributions and the Schedule of Investment Returns on pages 18 through 20 and 42 through 45 be presented to supplement the basic financial statements. Such information, although not a part of the basic financial statements, is required by the Governmental Accounting Standards Board which considers it to be an essential part of financial reporting for placing the basic financial statements in an appropriate operational, economic or historical context. We have applied certain limited procedures to the required supplementary information in accordance with U.S. generally accepted auditing standards, which consisted of inquiries of management about the methods of preparing the information and comparing the information for consistency with management’s responses to our inquiries, the basic financial statements and other knowledge we obtained during our audit of the basic financial statements. We do not express an opinion or provide any assurance on the information because the limited procedures do not provide us with sufficient evidence to express an opinion or provide any assurance.
Supplementary Information
Our audit was conducted for the purpose of forming an opinion on the financial statements that collectively comprise IPERS’ basic financial statements. The supplementary information included in Schedules 1 and 2 on pages 46 and 47 is presented for purposes of additional analysis and is not a required part of the basic financial statements.

16 FINANCIAL IPERS Comprehensive Annual Financial Report 2016 IPERS Comprehensive Annual Financial Report 2016 FINANCIAL 17
The supplementary information is the responsibility of management and was derived from and relates directly to the underlying accounting and other records used to prepare the basic financial statements. Such information has been subjected to the auditing procedures applied in the audit of the basic financial statements and certain additional procedures, including comparing and reconciling such information directly to the underlying accounting and other records used to prepare the basic financial statements or to the basic financial statements themselves, and other additional procedures in accordance with U.S. generally accepted auditing standards. In our opinion, the supplementary information is fairly stated in all material respects in relation to the basic financial statements taken as a whole.
Other Information
We did not audit the data included in the Introduction, Investments, Actuarial and Statistical sections and, accordingly, we express no opinion on the information presented in those sections.
Other Reporting Required by Government Auditing Standards
Our report on IPERS’ internal control over financial reporting and our tests of its compliance with certain provisions of laws, regulations, contracts and other matters required by Government Auditing Standards will be issued under separate cover. The purpose of that report is to describe the scope of our testing of internal control over financial reporting and compliance and the results of that testing and not to provide an opinion on the internal control over financial reporting or on compliance. That report is an integral part of an audit performed in accordance with Government Auditing Standards in considering IPERS’ internal control over financial reporting and compliance.
MARY MOSIMAN, CPA Auditor of State
December 9, 2016

18 FINANCIAL IPERS Comprehensive Annual Financial Report 2016
MANAGEMENT’S DISCUSSION AND ANALYSIS
This discussion and analysis of the Iowa Public Employees’ Retirement System provides an overview of the retirement system’s financial activities for the fiscal year ended June 30, 2016. It is intended to be used in conjunction with the transmittal letter and IPERS’ financial statements and notes, which begin on page 21of this report.
Using This Financial Report This Comprehensive Annual Financial Report reflects the activities of the Iowa Public Employees’ Retirement System as reported in the Statement of Fiduciary Net Position and the Statement of Changes in Fiduciary Net Position (see pages 21–22). These statements are presented on an accrual basis and reflect all Trust Fund activities as incurred. The Notes to Financial Statements are an integral part of the financial statements and include additional information not readily evident in the statements themselves. The Required Supplementary Information and Supplementary Information following the Notes to Financial Statements provide historical information and additional details considered useful in evaluating the condition of the plan. Investment data in the Financial section are presented at fair value. See the Actuarial section of this report for a detailed discussion of the actuarial value of assets and liabilities and the funded status.
Financial Highlights • IPERS’ net position restricted for pensions decreased
by $103.4 million during fiscal year 2016. On June30, 2016, total plan assets (including capital assets of$20.8 million) were $31.236 billion, exceeding totalliabilities of $2.910 billion, resulting in a net positionrestricted for pensions of $28.326 billion.
• Covered wages, from which both employee andemployer contributions are calculated, increased$230.2 million, or 3.14 percent, over the last fiscalyear and totaled $7.557 billion. In comparison,fiscal year 2015 wages totaled $7.326 billion, a 3.20percent increase from the prior fiscal year’s wagesof $7.099 billion.
• Additions from employee and employercontributions totaled $1.145 billion in fiscal year2016, an increase of 4.22 percent. In comparison,fiscal year 2015 saw a 2.80 percent increase incontributions. Growth in covered payroll increasedcontributions in both years.
• Contribution rates remained the same for theRegular members and the sheriffs and deputies inFY2016 and decreased for the protection occupationmembers. In comparison, none of the groups’contribution rates changed between FY2015 andFY2014.
• Service purchase contributions for FY2016 were $32.1million, an 83.96 percent increase over the prior year.In contrast, service purchase contributions were $17.5million for FY2015, a 22.00 percent increase from theFY2014 amount of $14.3 million. The large increasein service purchases in FY2016 is related to anadministrative rule change mandating that, effectiveJanuary 1, 2016, service purchases can be made onlyat the time of retirement.
• Net investment and securities lending income, afterall investment-related expenses, was $624.9 millionin FY2016, $1.080 billion in FY2015, and $3.904billion in FY2014. These differences are explainedby the disparity in IPERS’ investment returns—theFY2016 return was 2.15 percent, while the returnsfor FY2015 and FY2014 were 3.96 percent and 15.88percent, respectively.
• Investment management expenses were $60.6 millionfor FY2016. In comparison, investment managementexpenses were $78.0 million for FY2015 and $62.6million for FY2014. The decrease in investmentmanagement expenses in FY2016 was primarilyrelated to lower performance incentive fees paid toinvestment managers in the domestic equity, otherreal assets, and international equity asset classes. TheSystem’s ratio of investment management expensesto the portfolio’s quarterly average fair value was0.22 percent for FY2016, compared to ratios of 0.28percent for FY2015 and 0.23 percent for FY2014.
• Total contributions, investments, and other income

18 FINANCIAL IPERS Comprehensive Annual Financial Report 2016 IPERS Comprehensive Annual Financial Report 2016 FINANCIAL 19
resulted in total additions to the Fund of $1.802 billion in fiscal year 2016. This compares to total additions of $2.196 billion in FY2015 and $4.987 billion in FY2014. The decreased additions in fiscal years 2015 and 2016 resulted from the lower market returns.
• FY2016 benefit payments increased $96.1 million andrefunds increased $2.1 million. Benefit and refundpayments have fluctuated from $1.890 billion inFY2016, to $1.792 billion in FY2015, to $1.812 billionin FY2014. Benefit payments increased in FY2016due to an increased number of retirees. Benefitpayments decreased in FY2015 because retireesstopped receiving Favorable Experience Dividend(FED) payments, after the FED reserve account wasdepleted in January 2014.
• Administrative expenses totaled $14.9 million inFY2016, compared to $12.6 million for FY2015 and$14.9 million for FY2014. Higher computer supportcosts related to I-Que (the pension administrationsystem) drove the increased expenses in FY2016and FY2014, with much of the FY2016 costs beingrelated to the upgrade of the system. This resulted inadministrative expenses varying from 0.05 percent ofthe value of net position in FY2016, to 0.04 percent inFY2015 and 0.05 percent in FY2014.
• In FY2016, capital assets decreased from $22.4 millionto $20.8 million, mostly as a result of depreciation.Capital assets decreased from $24.0 million at the endof FY2014 to $22.4 million at the end of FY2015 for thesame reason.
Analysis of Net Position The investment rates of return for the current and preceding two fiscal years were 2.15 percent, 3.96 percent, and 15.88 percent, respectively. IPERS’ total net position decreased 0.36 percent in FY2016, increased 1.40 percent in FY2015, and increased 12.70 percent in FY2014, primarily as a result of these market returns. The following table contains the fiscal year 2016 performance of each asset class and its respective benchmark, as well as the Fund’s allocation to each asset class as a percentage of total Fund fair value at June 30, 2016. (See also the Investments section of this report beginning on page 49 for more information on rates of return.)
Investment Returns and Allocations Fiscal Year Ended June 30, 2016
Asset Class Return Benchmark Allocation Domestic equity –0.28% 2.96% 24.31%
International equity –10.27% –9.80% 15.73%
Core-plus fixed income 5.92% 5.82% 28.05%
Credit opportunities 2.84% 3.96% 5.17%
U.S. TIPS 3.83% 3.84% 4.83%
Other real assets –10.75% –10.68% 1.45%
Private equity/debt 6.72% 6.72% 11.57%
Real estate 15.71% 13.74% 8.39%
Cash 0.31% 0.19% 0.50%
Total Fund 2.15% 2.89% 100.00%
The two tables on the next page present condensed summaries of IPERS’ net position and a breakdown of the changes in the net position with comparison to the previous two fiscal years.
A large percentage of total assets, 94 percent, is represented by investments held to provide retirement, death, and disability benefits to members and their beneficiaries. Other assets, including cash and cash equivalents, receivables from employee and employer contributions, receivables from investment-related transactions, and capital assets, make up 6 percent of total assets.
Total liabilities in the following table represent current liabilities and do not reflect the actuarial liabilities discussed in other sections of this report. These current liabilities chiefly consist of amounts owed for investment-related transactions, including the value of rebates and collateral due back to borrowers of securities at the conclusion of securities lending transactions, amounts owed to members or their beneficiaries, and amounts owed to contractors and vendors. Total liabilities increased $950.8 million from fiscal year 2015 to 2016. In comparison, liabilities decreased by $1.278 billion between fiscal years 2014 and 2015. These fluctuations are primarily related to investment payables.
Benefits paid out exceeded contributions received by $713.3 million, $676.2 million, and $729.7 million for fiscal years 2016, 2015, and 2014, respectively. This excess of benefits paid relative to contributions received is characteristic of a mature pension plan such as IPERS.

20 FINANCIAL IPERS Comprehensive Annual Financial Report 2016
Request for Information This financial report is designed to provide the Governor and Iowa Legislature (plan sponsors), the Investment Board, the Benefits Advisory Committee, the System’s membership, contributors, taxpayers, and creditors with a general overview of the System’s finances and to demonstrate the System’s accountability for the money it manages. Questions about this report or requests for additional financial information should be directed to the Iowa Public Employees’ Retirement System by e-mail at [email protected], by phone at 515-281-0020 or 1-800-622-3849, or by mail at P.O. Box 9117,Des Moines, IA 50306-9117.
Fiduciary Net Position(Dollar Values Expressed in Thousands)Fiscal Years Ended June 30
2016 2015
2016/2015 Percentage
Change 2014
2015/2014 Percentage
ChangeCash and investments at fair value $29,436,328 $29,046,141 1.3 $28,471,552 2.0 Receivables 1,778,545 1,319,598 34.8 2,779,050 (52.5)Capital assets 20,755 22,440 (7.5) 23,998 (6.5)Other assets 704 712 (1.1) 815 (12.6)
Total assets 31,236,332 30,388,891 2.8 31,275,415 (2.8)Total liabilities 2,909,898 1,959,056 48.5 3,236,865 (39.5)
Total net position $28,326,434 $28,429,835 (0.4) $28,038,550 1.4
Changes in Fiduciary Net Position(Dollar Values Expressed in Thousands)Fiscal Years Ended June 30
Additions 2016 2015
2016/2015 Percentage
Change 2014
2015/2014 Percentage
Change
Contributions and service purchases $1,176,667 $1,115,600 5.5 $1,082,521 3.1 Net investment and securities lending income 624,854 1,080,045 (42.1) 3,904,374 (72.3)
Total additions 1,801,521 2,195,645 (18.0) 4,986,895 (56.0)Deductions
Benefits and refunds 1,889,983 1,791,768 5.5 1,812,185 (1.1) Administrative expenses 14,939 12,592 18.6 14,866 (15.3)
Total deductions 1,904,922 1,804,360 5.6 1,827,051 (1.2)Increase/(decrease) in net position $ (103,401) $ 391,285 (126.4) $3,159,844 (87.6)

20 FINANCIAL IPERS Comprehensive Annual Financial Report 2016 IPERS Comprehensive Annual Financial Report 2016 FINANCIAL 21
BASIC FINANCIAL STATEMENTS
Statement of Fiduciary Net PositionJune 30, 2016, with Comparative Totals for June 30, 2015
2016 2015
ASSETSCash and cash equivalents $ 159,901,133 $ 239,272,391
ReceivablesContributions 82,401,235 68,110,378
Accrued interest and dividends 84,699,481 79,458,974
Investment sales 542,419,711 518,782,977
Foreign exchange contracts 1,068,997,870 653,245,413
Miscellaneous 26,821 ---
Total receivables 1,778,545,118 1,319,597,742
Investments at fair valueFixed income 9,551,789,775 9,614,624,576
Domestic equity 6,964,440,047 6,873,198,695
International equity 4,428,330,317 4,514,880,142
Real assets 408,567,660 452,383,026
U.S. TIPS 1,364,305,697 1,279,855,747
Real estate 2,369,772,797 2,275,126,213
Private equity/debt 3,267,902,339 3,242,207,126
Total investments at fair value 28,355,108,632 28,252,275,525
Securities lending collateral pool 921,318,376 554,592,727
Capital assetsDepreciable assets, net of accumulated depreciation 20,254,512 21,939,738
Nondepreciable assets: land 500,000 500,000
Total capital assets 20,754,512 22,439,738
Other assets 704,337 712,447
Total assets 31,236,332,108 30,388,890,570
LIABILITIESAccounts payable and accrued expenses 25,828,127 39,004,065
Investment purchases payable 902,219,928 708,132,271
Rebates and collateral payable 921,097,660 554,404,832
Foreign exchange contracts payable 1,060,752,737 657,514,573
Total liabilities 2,909,898,452 1,959,055,741
Net position restricted for pensions (Note 7, page 41) $28,326,433,656 $28,429,834,829
See accompanying Notes to Financial Statements beginning on page 23.

22 FINANCIAL IPERS Comprehensive Annual Financial Report 2016
Statement of Changes in Fiduciary Net PositionYear Ended June 30, 2016, with Comparative Totals for Year Ended June 30, 2015
2016 2015
ADDITIONSContributions
Employer contributions $ 684,664,998 $ 656,911,160
Employee contributions 459,854,052 441,213,236
Service purchases 32,147,862 17,475,633
Total contributions 1,176,666,912 1,115,600,029
InvestmentsInterest 341,473,663 314,701,345
Dividends 102,061,857 109,804,697
Real estate and private equity/debt 108,461,322 109,488,751
Net appreciation in fair value of investments 129,240,118 622,196,068
Recaptured commissions 223,697 90,362
Investment management expenses (60,644,538) (77,977,569)
Net investment income 620,816,119 1,078,303,654
Securities lendingSecurities lending income 1,546,911 281,300
Securities lending expenses/rebates 2,490,621 1,460,150
Net securities lending income 4,037,532 1,741,450
Total net investment income 624,853,651 1,080,045,104
Total additions 1,801,520,563 2,195,645,133
DEDUCTIONSBenefit payments 1,840,734,608 1,744,601,010
Member refunds 49,248,177 47,167,431
Administrative expenses 14,938,951 12,591,756
Total deductions 1,904,921,736 1,804,360,197
Net increase/(decrease) (103,401,173) 391,284,936
Net position restricted for pensions, beginning of year 28,429,834,829 28,038,549,893
Net position restricted for pensions (Note 7, page 41) $28,326,433,656 $28,429,834,829
See accompanying Notes to Financial Statements beginning on page 23.

22 FINANCIAL IPERS Comprehensive Annual Financial Report 2016 IPERS Comprehensive Annual Financial Report 2016 FINANCIAL 23
Notes to Financial Statements June 30, 2016, and 2015
(1) SUMMARY OF SIGNIFICANTACCOUNTING POLICIESIPERS, a public employee retirement system, was created by the Iowa Legislature. IPERS is an integral part of the primary government of the State of Iowa and, accordingly, has been included as a pension trust fund in the Iowa Comprehensive Annual Financial Report (CAFR) as well as having its own stand-alone Comprehensive Annual Financial Report. The State’s CAFR may be viewed on the Iowa Department of Administrative Services’ website.
For financial reporting purposes, IPERS considers all potential component units for which it is financially accountable and other organizations for which the nature and significance of their relationship with IPERS is such that exclusion would cause IPERS’ financial statements to be misleading or incomplete. The Governmental Accounting Standards Board (GASB) has set forth criteria to be considered in determining financial accountability. These criteria are (1) whether IPERS could appoint a voting majority of anorganization’s governing body, (2) the ability of IPERSto impose its will on that organization, and (3) thepotential for the organization to provide specific benefitsto or impose specific financial burdens on IPERS. IPERShas no component units that meet the GASB criteria.
A. Basis of AccountingIPERS’ financial statements have been prepared using the accrual basis of accounting in conformity with U.S. generally accepted accounting principles (GAAP) as applied to governmental accounting for fiduciary funds. The preparation of financial statements in conformity with GAAP requires management to make estimates and assumptions that affect the reported amounts of assets, liabilities, revenues, and expenses. Actual amounts could differ from those estimates.
The System is funded through a combination of employee and employer contributions and investment income. Revenues are recognized when they are earned and become measurable. Employee contributions are recognized in the period in which the contributions are due. Employer contributions are recognized when due and the employer has made a formal commitment to provide them.
Expenses are recognized when the liability is incurred.
Benefits and refunds are recognized when due and payable in accordance with the terms of the plan.
Investment sales and purchases are recorded as of their trade date. All investments are reported at fair value. The determination of fair value is generally based on published market prices and quotations from major investment brokers. Investments without quoted market prices have been valued based on yields and maturities currently available on comparable securities of similar issue. Fair values for real estate investments are based on periodic assessments or appraisals of the underlying investments. Private equities and one real estate investment, Blackstone Real Estate Debt Strategies, are valued based on March 31 net asset values plus or minus purchases, sales, and cash flows from April 1 through June 30 of the reporting year. Futures contracts are valued daily with the resulting adjustments recorded as realized gains/losses arising from the daily settlement of the variation margin.
The basic financial statements include prior-year summarized comparative information in total, but not at the level of detail required for a presentation in conformity with U.S. generally accepted accounting principles. Accordingly, such information should be read in conjunction with IPERS’ financial statements for the year ended June 30, 2015, from which the summarized information was derived.
B. New Accounting PronouncementIPERS has implemented GASB Statement No. 72, Fair Value Measurement and Application. This statement is effective for financial reporting periods beginning after June 15, 2015. GASB 72 addresses accounting and financial reporting issues related to fair value measurements by clarifying the definition of fair value, establishing general principles for measuring fair value, providing additional fair value application guidance, and enhancing fair value measurement disclosures. Adoption of the guidance did not have a significant impact on amounts reported or disclosed in the financial statements.
C. Cash and Cash EquivalentsFor the purpose of financial reporting, cash and cash equivalents represent cash and money market investments with an original maturity of three months or less held by the System’s administration, and cash allocated to the System’s investment managers for investment.

24 FINANCIAL IPERS Comprehensive Annual Financial Report 2016
D. Foreign Exchange ContractsThe System’s investment managers enter into forward foreign exchange contracts to obtain or short an exposure to foreign currencies or to minimize the short-term impact of currency fluctuations on their foreign investments. The gains or losses on these contracts are recorded in the period in which the exchange rates change.
E. InvestmentsIowa Code section 97B.7 grants the IPERS Investment Board authority to establish investment policies. These policies are documented in the IPERS Investment Policy and Goal Statement, and reviewed annually by the Investment Board. The Investment Policy and Goal Statement is located on pages 64–77.
The Investment Board adopted the following significant changes to IPERS’ investment policy during the fiscal year: • Clarified the objectives for active management by
adding that excess returns (alpha) should also assistIPERS in funding its liabilities by being positivelycorrelated to liability returns.
• Added requirements for the use of a managedaccount platform and the use of external experts asneeded to perform due diligence for portable alphastrategies.The investment activities of the System are designed
to provide a return on the Fund that, when coupled with the periodic contributions of the membership and employers, will meet or exceed the funding requirements of the plan over time while staying within the Investment Board’s tolerance for risk as expressed in the Investment Policy and Goal Statement. Of primary consideration is the maintenance of funding adequate to provide for the payment of the plan’s actuarial liabilities over time. The following is the Investment Board’s adopted asset allocation policy as of June 30, 2016.
Target AllocationsAs of June 30, 2016
Asset Class Target Allocation
Core-plus fixed income 28%Domestic equity 24%International equity 16%Private equity/debt 11%Real estate 8%Credit opportunities 5%U.S. TIPS 5%Other real assets 2%Cash 1%
For FY2016, the annual money-weighted rate of return on pension plan investments, net of pension plan investment expenses, was 2.23 percent. The money-weighted rate of return expresses investment performance, net of investment expense, adjusted for the changing amounts actually invested.
The Treasurer of State is the statutory custodian of the System, and in this capacity, has arranged to have the custodial bank account collateralized or covered by the State Sinking Fund. The Treasurer of State selected the Bank of New York Mellon, a AA-rated bank according to Fitch Ratings, to serve as the custodian bank for IPERS.
Consistent with the System’s investment policy, the investment securities are held by the System’s custodian and registered in the System’s name. All of the System’s investment securities are held by the System’s custodial bank in the System’s name, except for investment securities on loan with brokers for cash collateral, investments in mutual and commingled funds, real estate properties, and limited partnerships, which, by nature, are not required to be categorized. Investments in the Short-Term Investment Funds (STIF) are held in a collective trust fund offered through the System’s custodial bank. The fair value of the position in the trust fund equals the value of the fund shares.
The System has categorized its fair value measurements within the fair value hierarchy established by generally accepted accounting principles. The hierarchy is based on the valuation inputs used to measure the fair value of the asset and gives the highest priority to unadjusted quoted prices in active markets for identical assets or liabilities (level 1 measurements) and the lowest priority to unobservable inputs (level 3 measurements).

24 FINANCIAL IPERS Comprehensive Annual Financial Report 2016 IPERS Comprehensive Annual Financial Report 2016 FINANCIAL 25
Fair Value Hierarchy LevelsLevel 1 Unadjusted quoted prices for identical instruments in
active markets.
Level 2
Quoted prices for similar instruments in active markets; quoted prices for identical or similar instruments in markets that are not active; and model-derived valuations in which all significant inputs are observable.
Level 3 Valuations derived from valuation techniques in which significant inputs are unobservable.
Investments that are measured at fair value using the net asset value (NAV) per share (or its equivalent) as a practical expedient are not classified in the fair value hierarchy.
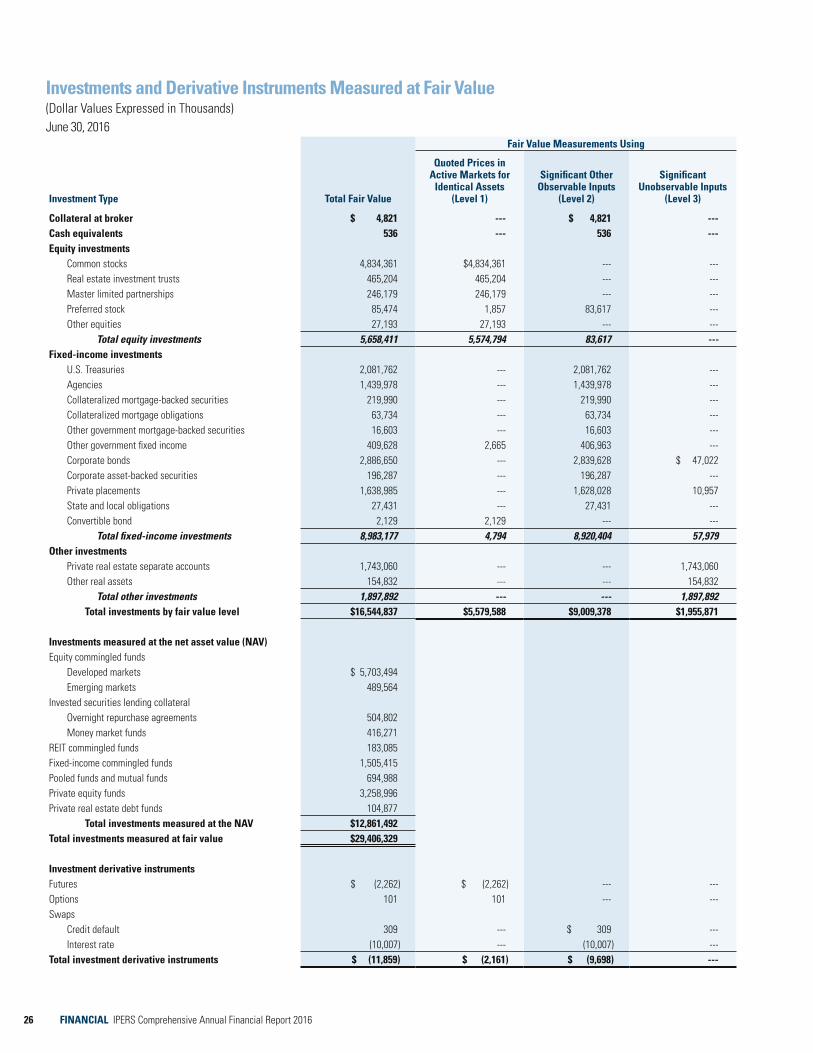
In instances where inputs used to measure fair value fall into different levels in the fair value hierarchy, fair value measurements in their entirety are categorized based on the lowest-level input that is significant to the valuation. The System’s assessment of the significance of particular inputs to these fair value measurements requires judgment and considers factors specific to each asset or liability. The table on page 26 shows the fair value leveling of the investments for the System.
Short-term securities generally include investments in money market-type securities reported at cost plus accrued interest, which approximates fair value.
Debt, equity, and derivative securities classified in Level 1 are valued using prices quoted in active markets for those securities. Derivative securities classified in Level 2 are securities whose values are either derived daily from associated traded securities or are determined by using a market approach that considers benchmark interest rates.
Debt and debt derivative securities classified in Level 2 and Level 3 are valued using either a bid evaluation or a matrix pricing technique. Bid evaluations may include market quotations, yields, maturities, call features, and ratings. Matrix pricing is used to value securities based on the securities’ relationship to benchmark quoted prices. Level 2 debt securities have nonproprietary information that is readily available to market participants, from multiple independent sources, which are known to be actively involved in the market. Level 3 debt securities are solely composed of bank loans and these investments use proprietary information or single-source pricing.
Real assets and private real estate separate accounts classified in Level 3 are investments generally valued
using one or a combination of the following accepted valuation approaches: market, cost, or income. Independent third-party appraisals are required every three years. Annual appraisals are done internally by the advisors and all portfolios have audited financials completed at fiscal year-end.
26 FINANCIAL IPERS Comprehensive Annual Financial Report 2016
Investments and Derivative Instruments Measured at Fair Value(Dollar Values Expressed in Thousands)June 30, 2016
Fair Value Measurements Using
Investment Type Total Fair Value
Quoted Prices in Active Markets for
Identical Assets (Level 1)
Significant Other Observable Inputs
(Level 2)
Significant Unobservable Inputs
(Level 3)
Collateral at broker $ 4,821 --- $ 4,821 --- Cash equivalents 536 --- 536 --- Equity investments
Common stocks 4,834,361 $4,834,361 --- --- Real estate investment trusts 465,204 465,204 --- --- Master limited partnerships 246,179 246,179 --- --- Preferred stock 85,474 1,857 83,617 --- Other equities 27,193 27,193 --- ---
Total equity investments 5,658,411 5,574,794 83,617 --- Fixed-income investments
U.S. Treasuries 2,081,762 --- 2,081,762 --- Agencies 1,439,978 --- 1,439,978 --- Collateralized mortgage-backed securities 219,990 --- 219,990 --- Collateralized mortgage obligations 63,734 --- 63,734 --- Other government mortgage-backed securities 16,603 --- 16,603 --- Other government fixed income 409,628 2,665 406,963 --- Corporate bonds 2,886,650 --- 2,839,628 $ 47,022 Corporate asset-backed securities 196,287 --- 196,287 --- Private placements 1,638,985 --- 1,628,028 10,957 State and local obligations 27,431 --- 27,431 --- Convertible bond 2,129 2,129 --- ---
Total fixed-income investments 8,983,177 4,794 8,920,404 57,979 Other investments
Private real estate separate accounts 1,743,060 --- --- 1,743,060 Other real assets 154,832 --- --- 154,832
Total other investments 1,897,892 --- --- 1,897,892 Total investments by fair value level $16,544,837 $5,579,588 $9,009,378 $1,955,871
Investments measured at the net asset value (NAV)Equity commingled funds
Developed markets $ 5,703,494 Emerging markets 489,564
Invested securities lending collateralOvernight repurchase agreements 504,802Money market funds 416,271
REIT commingled funds 183,085 Fixed-income commingled funds 1,505,415 Pooled funds and mutual funds 694,988 Private equity funds 3,258,996 Private real estate debt funds 104,877
Total investments measured at the NAV $12,861,492Total investments measured at fair value $29,406,329
Investment derivative instrumentsFutures $ (2,262) $ (2,262) --- --- Options 101 101 --- --- Swaps
Credit default 309 --- $ 309 --- Interest rate (10,007) --- (10,007) ---
Total investment derivative instruments $ (11,859) $ (2,161) $ (9,698) ---
26 FINANCIAL IPERS Comprehensive Annual Financial Report 2016 IPERS Comprehensive Annual Financial Report 2016 FINANCIAL 27
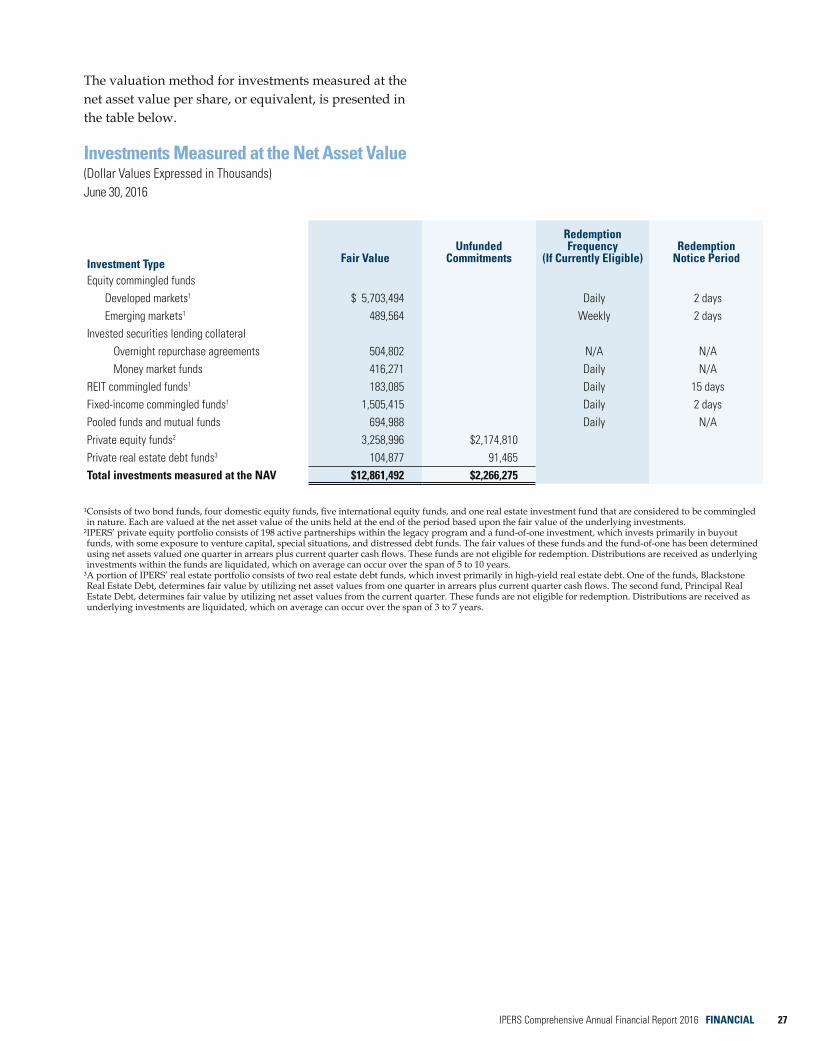
The valuation method for investments measured at the net asset value per share, or equivalent, is presented in the table below.
Investments Measured at the Net Asset Value (Dollar Values Expressed in Thousands)June 30, 2016
Investment Type Fair ValueUnfunded
Commitments
Redemption Frequency
(If Currently Eligible)Redemption
Notice Period
Equity commingled fundsDeveloped markets1 $ 5,703,494 Daily 2 daysEmerging markets1 489,564 Weekly 2 days
Invested securities lending collateral Overnight repurchase agreements 504,802 N/A N/A Money market funds 416,271 Daily N/AREIT commingled funds1 183,085 Daily 15 daysFixed-income commingled funds1 1,505,415 Daily 2 daysPooled funds and mutual funds 694,988 Daily N/APrivate equity funds2 3,258,996 $2,174,810 Private real estate debt funds3 104,877 91,465 Total investments measured at the NAV $12,861,492 $2,266,275
¹ Consists of two bond funds, four domestic equity funds, five international equity funds, and one real estate investment fund that are considered to be commingled in nature. Each are valued at the net asset value of the units held at the end of the period based upon the fair value of the underlying investments.
² IPERS’ private equity portfolio consists of 198 active partnerships within the legacy program and a fund-of-one investment, which invests primarily in buyout funds, with some exposure to venture capital, special situations, and distressed debt funds. The fair values of these funds and the fund-of-one has been determined using net assets valued one quarter in arrears plus current quarter cash flows. These funds are not eligible for redemption. Distributions are received as underlying investments within the funds are liquidated, which on average can occur over the span of 5 to 10 years.
³ A portion of IPERS’ real estate portfolio consists of two real estate debt funds, which invest primarily in high-yield real estate debt. One of the funds, Blackstone Real Estate Debt, determines fair value by utilizing net asset values from one quarter in arrears plus current quarter cash flows. The second fund, Principal Real Estate Debt, determines fair value by utilizing net asset values from the current quarter. These funds are not eligible for redemption. Distributions are received as underlying investments are liquidated, which on average can occur over the span of 3 to 7 years.
28 FINANCIAL IPERS Comprehensive Annual Financial Report 2016
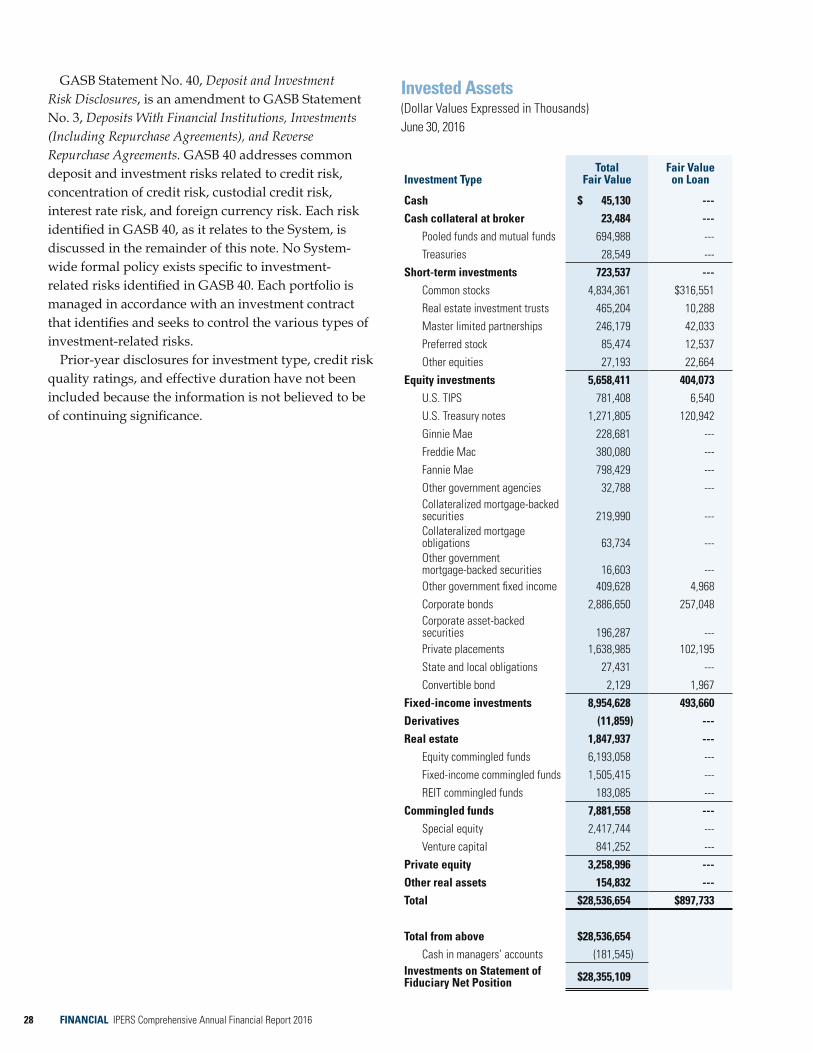
Invested Assets(Dollar Values Expressed in Thousands)June 30, 2016
Investment Type Total
Fair Value Fair Value
on Loan
Cash $ 45,130 --- Cash collateral at broker 23,484 ---
Pooled funds and mutual funds 694,988 --- Treasuries 28,549 ---
Short-term investments 723,537 --- Common stocks 4,834,361 $316,551 Real estate investment trusts 465,204 10,288 Master limited partnerships 246,179 42,033 Preferred stock 85,474 12,537 Other equities 27,193 22,664
Equity investments 5,658,411 404,073 U.S. TIPS 781,408 6,540 U.S. Treasury notes 1,271,805 120,942 Ginnie Mae 228,681 --- Freddie Mac 380,080 --- Fannie Mae 798,429 --- Other government agencies 32,788 --- Collateralized mortgage-backed securities 219,990 --- Collateralized mortgage obligations 63,734 --- Other government mortgage-backed securities 16,603 --- Other government fixed income 409,628 4,968 Corporate bonds 2,886,650 257,048 Corporate asset-backed securities 196,287 --- Private placements 1,638,985 102,195 State and local obligations 27,431 --- Convertible bond 2,129 1,967
Fixed-income investments 8,954,628 493,660 Derivatives (11,859) --- Real estate 1,847,937 ---
Equity commingled funds 6,193,058 --- Fixed-income commingled funds 1,505,415 --- REIT commingled funds 183,085 ---
Commingled funds 7,881,558 --- Special equity 2,417,744 --- Venture capital 841,252 ---
Private equity 3,258,996 --- Other real assets 154,832 --- Total $28,536,654 $897,733
Total from above $28,536,654Cash in managers’ accounts (181,545)
Investments on Statement of Fiduciary Net Position $28,355,109
GASB Statement No. 40, Deposit and Investment Risk Disclosures, is an amendment to GASB Statement No. 3, Deposits With Financial Institutions, Investments (Including Repurchase Agreements), and Reverse Repurchase Agreements. GASB 40 addresses common deposit and investment risks related to credit risk, concentration of credit risk, custodial credit risk, interest rate risk, and foreign currency risk. Each risk identified in GASB 40, as it relates to the System, is discussed in the remainder of this note. No System-wide formal policy exists specific to investment-related risks identified in GASB 40. Each portfolio is managed in accordance with an investment contract that identifies and seeks to control the various types of investment-related risks.
Prior-year disclosures for investment type, credit risk quality ratings, and effective duration have not been included because the information is not believed to be of continuing significance.
28 FINANCIAL IPERS Comprehensive Annual Financial Report 2016 IPERS Comprehensive Annual Financial Report 2016 FINANCIAL 29
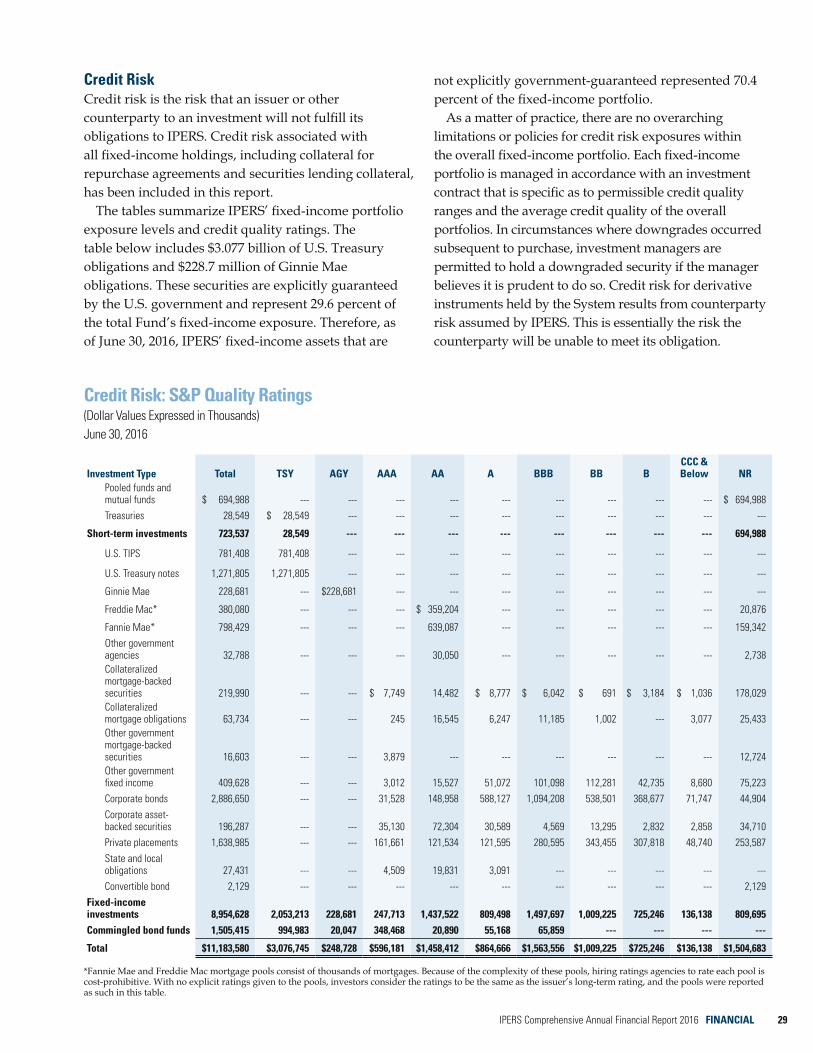
Credit RiskCredit risk is the risk that an issuer or other counterparty to an investment will not fulfill its obligations to IPERS. Credit risk associated with all fixed-income holdings, including collateral for repurchase agreements and securities lending collateral, has been included in this report.
The tables summarize IPERS’ fixed-income portfolio exposure levels and credit quality ratings. The table below includes $3.077 billion of U.S. Treasury obligations and $228.7 million of Ginnie Mae obligations. These securities are explicitly guaranteed by the U.S. government and represent 29.6 percent of the total Fund’s fixed-income exposure. Therefore, as of June 30, 2016, IPERS’ fixed-income assets that are
not explicitly government-guaranteed represented 70.4 percent of the fixed-income portfolio.
As a matter of practice, there are no overarching limitations or policies for credit risk exposures within the overall fixed-income portfolio. Each fixed-income portfolio is managed in accordance with an investment contract that is specific as to permissible credit quality ranges and the average credit quality of the overall portfolios. In circumstances where downgrades occurred subsequent to purchase, investment managers are permitted to hold a downgraded security if the manager believes it is prudent to do so. Credit risk for derivative instruments held by the System results from counterparty risk assumed by IPERS. This is essentially the risk the counterparty will be unable to meet its obligation.
Credit Risk: S&P Quality Ratings(Dollar Values Expressed in Thousands)June 30, 2016
Investment Type Total TSY AGY AAA AA A BBB BB B CCC & Below NR
Pooled funds and mutual funds $ 694,988 --- --- --- --- --- --- --- --- --- $ 694,988 Treasuries 28,549 $ 28,549 --- --- --- --- --- --- --- --- ---
Short-term investments 723,537 28,549 --- --- --- --- --- --- --- --- 694,988
U.S. TIPS 781,408 781,408 --- --- --- --- --- --- --- --- ---
U.S. Treasury notes 1,271,805 1,271,805 --- --- --- --- --- --- --- --- ---
Ginnie Mae 228,681 --- $228,681 --- --- --- --- --- --- --- ---
Freddie Mac* 380,080 --- --- --- $ 359,204 --- --- --- --- --- 20,876
Fannie Mae* 798,429 --- --- --- 639,087 --- --- --- --- --- 159,342 Other government agencies 32,788 --- --- --- 30,050 --- --- --- --- --- 2,738 Collateralized mortgage-backed securities 219,990 --- --- $ 7,749 14,482 $ 8,777 $ 6,042 $ 691 $ 3,184 $ 1,036 178,029 Collateralized mortgage obligations 63,734 --- --- 245 16,545 6,247 11,185 1,002 --- 3,077 25,433 Other government mortgage-backed securities 16,603 --- --- 3,879 --- --- --- --- --- --- 12,724 Other government fixed income 409,628 --- --- 3,012 15,527 51,072 101,098 112,281 42,735 8,680 75,223 Corporate bonds 2,886,650 --- --- 31,528 148,958 588,127 1,094,208 538,501 368,677 71,747 44,904 Corporate asset-backed securities 196,287 --- --- 35,130 72,304 30,589 4,569 13,295 2,832 2,858 34,710 Private placements 1,638,985 --- --- 161,661 121,534 121,595 280,595 343,455 307,818 48,740 253,587 State and local obligations 27,431 --- --- 4,509 19,831 3,091 --- --- --- --- --- Convertible bond 2,129 --- --- --- --- --- --- --- --- --- 2,129
Fixed-income investments 8,954,628 2,053,213 228,681 247,713 1,437,522 809,498 1,497,697 1,009,225 725,246 136,138 809,695 Commingled bond funds 1,505,415 994,983 20,047 348,468 20,890 55,168 65,859 --- --- --- ---
Total $11,183,580 $3,076,745 $248,728 $596,181 $1,458,412 $864,666 $1,563,556 $1,009,225 $725,246 $136,138 $1,504,683
*Fannie Mae and Freddie Mac mortgage pools consist of thousands of mortgages. Because of the complexity of these pools, hiring ratings agencies to rate each pool is cost-prohibitive. With no explicit ratings given to the pools, investors consider the ratings to be the same as the issuer’s long-term rating, and the pools were reported as such in this table.

30 FINANCIAL IPERS Comprehensive Annual Financial Report 2016
Information regarding IPERS’ credit risk related to derivatives is found under the derivatives disclosures on pages 31–33 of these notes. Policies related to credit risk pertaining to IPERS’ securities lending program are found under the securities lending disclosures on pages 33–34 of these notes.
Concentration of Credit RiskConcentration of credit risk is the risk of loss that may be attributed to the magnitude of investment in a single issuer. IPERS’ guidelines for each investment manager establish limits on investments in any corporate entity. The System has no separate account investment in any specific stock or bond issues of any commercial or industrial organization other than the U.S. government and its instrumentalities whose fair value exceeds 5 percent of IPERS’ net position restricted for pensions.
Custodial Credit RiskCustodial credit risk is the risk that, in the event of a failure of the counterparty, the System will not be able to recover the value of its investment or collateral securities that are in the possession of an outside party. Investment securities are exposed to custodial credit risk if the securities are uninsured, are not registered in the name of the System, and are held by either the counterparty or the counterparty’s trust department or agent but not in the System’s name.
Interest Rate RiskInterest rate risk is the risk that changes in interest rates will adversely affect the fair value of a fixed- income investment. This risk is measured using the effective duration (or option-adjusted) methodology. The methodology takes into account optionality on bonds and scales the risk of price changes on bonds depending upon the degree of change in rates and the slope of the yield curve.
There are no organization-wide policies for interest rate risk exposure within the overall fixed-income portfolio. The System’s core-plus fixed-income investment contracts generally require the effective duration of the manager’s portfolio to remain between 75 percent and 125 percent of the effective duration measure of a specific fixed-income index. However, two of IPERS’ core-plus managers have authority under their contracts to reduce the interest rate sensitivity of their core-plus portfolios to less than 75 percent of the benchmark’s effective duration (up to zero effective
duration) if the managers forecast a period of rising interest rates. For high-yield bond portfolios, the effective duration must remain between 75 percent and 125 percent of the benchmark’s effective duration. The reporting of effective duration found in the following table quantifies to the fullest extent possible the interest rate risk of the System’s fixed-income assets. Interest rate risks associated with swaps and other derivative instruments are found in the derivatives disclosures. No interest rate futures or options positions will be established that affect the duration or weighted average maturity of the managed account by more than one year.
Effective Duration(Dollar Values Expressed in Thousands)June 30, 2016
Investment TypeFair
Value
Effective Duration (Years)
Pooled funds and mutual funds $ 694,988 0.00Treasuries 28,549 0.35
Short-term investments 723,537 0.01 U.S. TIPS 781,408 5.58U.S. Treasury notes 1,271,805 8.55Ginnie Mae 228,681 1.99Freddie Mac 380,080 1.72Fannie Mae 798,429 1.38Other government agencies 32,788 1.93Collateralized mortgage-backed securities 219,990 4.75Collateralized mortgage obligations 63,734 0.38
Other government mortgage-backed securities 16,603 2.64
Other government fixed income 409,628 8.24Corporate bonds 2,886,650 6.07Corporate asset-backed securities 196,287 0.63Private placements 1,638,985 3.95State and local obligations 27,431 9.61Convertible bond 2,129 1.84
Fixed-income investments 8,954,628 5.18Commingled bond funds 1,505,415 6.63Total $11,183,580 5.04
Foreign Currency RiskForeign currency risk is the risk that changes in exchange rates will adversely impact the fair value of an investment. IPERS’ currency policy is to allow its investment managers the discretion to hedge their foreign currency exposures. IPERS generally
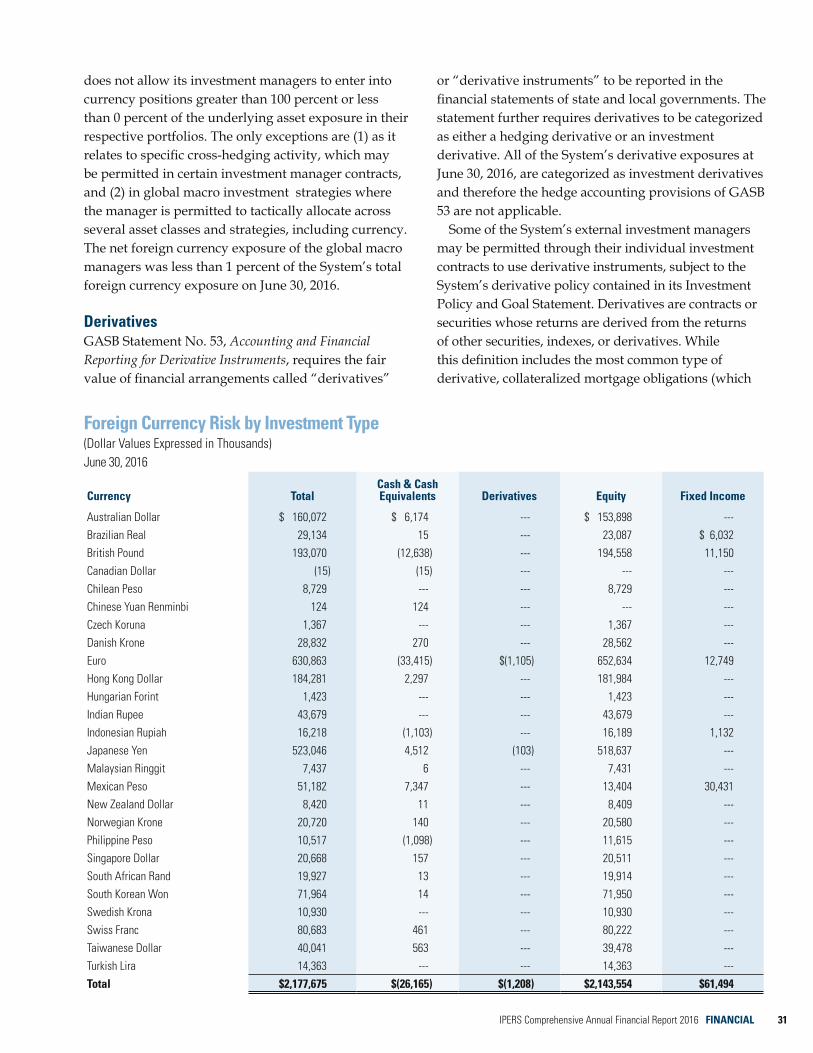
30 FINANCIAL IPERS Comprehensive Annual Financial Report 2016 IPERS Comprehensive Annual Financial Report 2016 FINANCIAL 31
does not allow its investment managers to enter into currency positions greater than 100 percent or less than 0 percent of the underlying asset exposure in their respective portfolios. The only exceptions are (1) as it relates to specific cross-hedging activity, which may be permitted in certain investment manager contracts, and (2) in global macro investment strategies where the manager is permitted to tactically allocate across several asset classes and strategies, including currency. The net foreign currency exposure of the global macro managers was less than 1 percent of the System’s total foreign currency exposure on June 30, 2016.
DerivativesGASB Statement No. 53, Accounting and Financial Reporting for Derivative Instruments, requires the fair value of financial arrangements called “derivatives”
or “derivative instruments” to be reported in the financial statements of state and local governments. The statement further requires derivatives to be categorized as either a hedging derivative or an investment derivative. All of the System’s derivative exposures at June 30, 2016, are categorized as investment derivatives and therefore the hedge accounting provisions of GASB 53 are not applicable.
Some of the System’s external investment managers may be permitted through their individual investment contracts to use derivative instruments, subject to the System’s derivative policy contained in its Investment Policy and Goal Statement. Derivatives are contracts or securities whose returns are derived from the returns of other securities, indexes, or derivatives. While this definition includes the most common type of derivative, collateralized mortgage obligations (which
Foreign Currency Risk by Investment Type(Dollar Values Expressed in Thousands)June 30, 2016
Currency Total Cash & Cash Equivalents Derivatives Equity Fixed Income
Australian Dollar $ 160,072 $ 6,174 --- $ 153,898 --- Brazilian Real 29,134 15 --- 23,087 $ 6,032 British Pound 193,070 (12,638) --- 194,558 11,150 Canadian Dollar (15) (15) --- --- --- Chilean Peso 8,729 --- --- 8,729 --- Chinese Yuan Renminbi 124 124 --- --- --- Czech Koruna 1,367 --- --- 1,367 --- Danish Krone 28,832 270 --- 28,562 --- Euro 630,863 (33,415) $(1,105) 652,634 12,749 Hong Kong Dollar 184,281 2,297 --- 181,984 --- Hungarian Forint 1,423 --- --- 1,423 --- Indian Rupee 43,679 --- --- 43,679 --- Indonesian Rupiah 16,218 (1,103) --- 16,189 1,132 Japanese Yen 523,046 4,512 (103) 518,637 --- Malaysian Ringgit 7,437 6 --- 7,431 --- Mexican Peso 51,182 7,347 --- 13,404 30,431 New Zealand Dollar 8,420 11 --- 8,409 --- Norwegian Krone 20,720 140 --- 20,580 --- Philippine Peso 10,517 (1,098) --- 11,615 --- Singapore Dollar 20,668 157 --- 20,511 --- South African Rand 19,927 13 --- 19,914 --- South Korean Won 71,964 14 --- 71,950 --- Swedish Krona 10,930 --- --- 10,930 --- Swiss Franc 80,683 461 --- 80,222 --- Taiwanese Dollar 40,041 563 --- 39,478 --- Turkish Lira 14,363 --- --- 14,363 --- Total $2,177,675 $(26,165) $(1,208) $2,143,554 $61,494

32 FINANCIAL IPERS Comprehensive Annual Financial Report 2016
typically make up a portion of the System’s fixed-income portfolio), it is also intended to include (but not be limited to) futures, forwards, options, options on futures, swaps, and swaptions. The System’s managers are not permitted to utilize derivatives for speculative purposes, but may use them to efficiently access desired markets and to control and manage portfolio risk. Examples of appropriate applications of derivative strategies include hedging interest rate and currency risk, maintaining exposure to a desired asset class while effecting asset allocation changes, managing duration risk, augmenting index fund performance through index arbitrage, and implementing portable alpha strategies.
The various derivatives utilized by the System’s investment managers are described below. Although the notional values associated with these derivative instruments are not recorded in the financial statements, the fair value amounts of exposure (unrealized gains/losses) are reported in the Statement of Fiduciary Net Position. IPERS holds investments in limited partnerships and commingled investment funds, which may utilize derivatives from time to time for hedging purposes, and any derivatives held by these types of investment vehicles are not included in the information describing the System’s derivatives on pages 31–33. IPERS could be exposed to risk if the counterparties to derivatives contracts are unable to meet the terms of the contracts. IPERS’ investment managers seek to control this risk through counterparty credit evaluations and approvals, counterparty credit limits, exposure monitoring procedures, and in some cases the collateralization of gains or losses. IPERS anticipates the counterparties will be able to satisfy their obligations under the contracts. Limited partnerships and commingled investment vehicles in which IPERS invests may also have exposure to counterparty risk from the use of derivatives for hedging purposes.
Futures and Options ContractsIPERS had investments in various futures and options in FY2016. The Statement of Fiduciary Net Position reports these contracts at fair value.
A listing of contracts outstanding at June 30, 2016, follows. Futures and options can potentially offer lower-cost, more efficient alternatives to buying the underlying securities or currency. They can also serve to minimize certain unwanted risks within the
portfolio. The market, currency, and credit risk of the futures were the same as if IPERS had owned the underlying securities or currency.
Futures Exposure Summary (Dollar Values Expressed in Thousands)June 30, 2016
Expiration Date
Long/Short
Notional Value
Fair Value
U.S. 10-year Treasury notes Sept. 2016 Short $(443,769) $(8,078)U.S. 10-year Ultra bonds Sept. 2016 Short (115,081) (4,019)U.S. 2-year Treasury notes Sept. 2016 Short (151,994) (1,030)U.S. 5-year Treasury notes Sept. 2016 Long 854,415 11,739E-mini (S&P 500) Sept. 2016 Long 66,050 1,146 Euro bunds Sept. 2016 Short (70,366) (1,335)Euro BOBL Sept. 2016 Long 37,106 300 SPI 200 Index Sept. 2016 Long 5,588 ---TOPIX Index Sept. 2016 Long 1,335 (103)U.S. Treasury bonds Sept. 2016 Short (124,949) (5,790)U.S. Ultra bonds Sept. 2016 Long 102,134 5,591 90-day Eurodollar Dec. 2016 Short (130,861) (683)Total $ 29,608 $(2,262)
Options Exposure Summary (Dollar Values Expressed in Thousands)June 30, 2016
Expiration Date
Long/Short
Option Type
Strike Price
Fair Value
U.S. Treasury bonds Aug. 2016 Short Put $161.00 $ (16)
U.S. 5-year Treasury notes Aug. 2016 Long Call 123.00 203
U.S. 5-year Treasury notes Aug. 2016 Short Put 122.50 (227)
U.S. 10-year Treasury notes Aug. 2016 Long Put 132.25 178
U.S. 10-year Treasury notes Aug. 2016 Short Call 134.00 (37)Total $101
Credit Default SwapsThe System had investments in credit default swaps during the year. The credit default swaps held by the System are derivative instruments that are used to hedge or to replicate investments in debt obligations of corporate bond issuers. The risk of the credit default swap is comparable to the credit risk of the reference security. At June 30, 2016, the net notional value of the

32 FINANCIAL IPERS Comprehensive Annual Financial Report 2016 IPERS Comprehensive Annual Financial Report 2016 FINANCIAL 33
credit default swaps held in the System’s fixed-income portfolio was $18.5 million. The credit default swaps are reported at a fair value of $318,099 in the Statement of Fiduciary Net Position.
Interest Rate SwapsInterest rate swaps are transactions between two parties in which interest payments from different indexes are swapped. Interest rate swaps are often used to alter the portfolios’ exposure to interest rate fluctuations, by swapping fixed-rate obligations for floating-rate obligations, or swapping floating-rate obligations for fixed-rate obligations. By utilizing interest rate swaps, the System’s investment managers are able to alter their interest rate exposure and bring it in line with their strategic objectives for interest rate risk. At June 30, 2016, the net notional value of the interest rate swaps held in the System’s fixed-income portfolio was –$157.0 million. All interest rate swaps held by the System are reported at a fair value of –$10.6 million in the Statement of Fiduciary Net Position.
Mortgage-Backed SecuritiesThe System invests in mortgage-backed securities, which are reported in the Statement of Fiduciary Net Position at fair value based on estimated future cash flows from the interest and principal payments of the underlying mortgages. Mortgage-backed securities prices are sensitive to prepayments by mortgagees, a scenario that is more likely in declining-interest-rate environments. The System invests in mortgage-backed securities to diversify the portfolio and earn the return premium associated with prepayment risk. Details on interest rate risks for these investments are included in the interest rate risk disclosures on page 30.
Securities LendingIPERS participates in the securities lending program administered by the Treasurer of State. Deutsche Bank, a bank rated A- by Fitch Ratings, serves as the
lending agent for IPERS’ securities lending program. In this capacity, Deutsche Bank is responsible for operating the program and is permitted to lend IPERS’ securities to broker-dealers and other entities in exchange for collateral.
Deutsche Bank is permitted to accept collateral in the form of cash in U.S. dollars, U.S. government securities, or irrevocable letters of credit. A borrower is required to initially deliver collateral in an amount equal to 102 percent of the fair value of any U.S. securities lent and 105 percent of the fair value of any non-U.S. securities lent. Borrowers are required to provide additional collateral anytime the value of the collateral drops below 100 percent of the value of the security lent plus accrued investment income.
At fiscal year-end, IPERS had $42,956 in risk exposure to borrowers because the amounts they owed IPERS exceeded the amount IPERS owed them on three separate loans. The contract with Deutsche Bank requires it to indemnify IPERS only if (1) a borrower becomes insolvent, or (2) a loss is incurred from an investment of collateral in an overnight repurchase agreement.
The securities lending contract does not allow IPERS to pledge or sell any collateral securities unless the borrower defaults. As of June 30, 2016, IPERS had securities on loan, including accrued interest income, with a fair value (carrying value) of $897.7 million against collateral, including borrower rebate, with a total fair value (carrying value) of $921.1 million.
The majority of securities loans are open loans, that is, one-day maturity, where the rebate rate due to the borrower is renegotiated daily. Either IPERS or the borrower can terminate all securities loans on demand. Cash collateral received from borrowers is invested in a cash collateral investment account, which is managed by Deutsche Bank in accordance with investment guidelines established by the Treasurer of State and reviewed by IPERS. The investment guidelines do not require a matching of investment maturities with loan
Securities Lending Cash Collateral Account(Dollar Values Expressed in Thousands)June 30, 2016
Credit Risk: S&P Quality Rating
Investment Type Fair Value AAA A-1 Not RatedInvestment
Maturity (Years)Overnight repurchase agreements $504,802 --- $209,802 $295,000 Less than 1Money market funds 416,271 $291,271 --- 125,000 Less than 1Total $921,073 $291,271 $209,802 $420,000
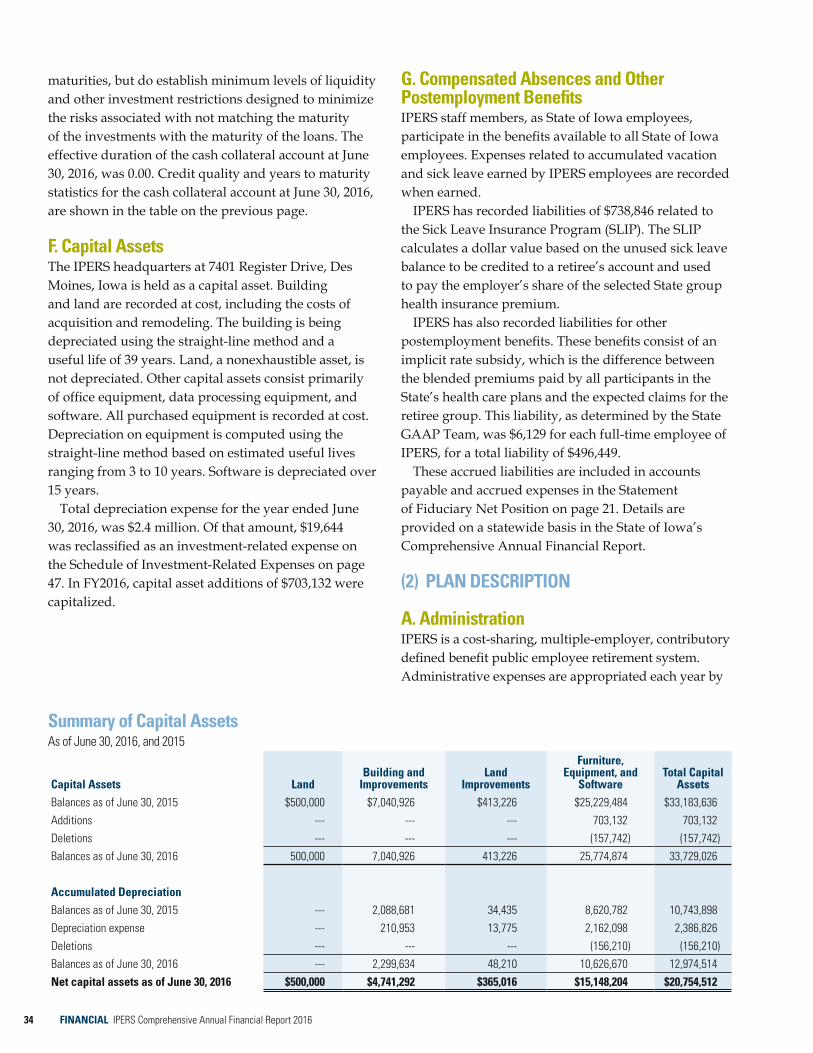
34 FINANCIAL IPERS Comprehensive Annual Financial Report 2016
maturities, but do establish minimum levels of liquidity and other investment restrictions designed to minimize the risks associated with not matching the maturity of the investments with the maturity of the loans. The effective duration of the cash collateral account at June 30, 2016, was 0.00. Credit quality and years to maturity statistics for the cash collateral account at June 30, 2016, are shown in the table on the previous page.
F. Capital AssetsThe IPERS headquarters at 7401 Register Drive, Des Moines, Iowa is held as a capital asset. Building and land are recorded at cost, including the costs of acquisition and remodeling. The building is being depreciated using the straight-line method and a useful life of 39 years. Land, a nonexhaustible asset, is not depreciated. Other capital assets consist primarily of office equipment, data processing equipment, and software. All purchased equipment is recorded at cost. Depreciation on equipment is computed using the straight-line method based on estimated useful lives ranging from 3 to 10 years. Software is depreciated over 15 years.
Total depreciation expense for the year ended June 30, 2016, was $2.4 million. Of that amount, $19,644 was reclassified as an investment-related expense on the Schedule of Investment-Related Expenses on page 47. In FY2016, capital asset additions of $703,132 werecapitalized.
G. Compensated Absences and OtherPostemployment BenefitsIPERS staff members, as State of Iowa employees, participate in the benefits available to all State of Iowa employees. Expenses related to accumulated vacation and sick leave earned by IPERS employees are recorded when earned.
IPERS has recorded liabilities of $738,846 related to the Sick Leave Insurance Program (SLIP). The SLIP calculates a dollar value based on the unused sick leave balance to be credited to a retiree’s account and used to pay the employer’s share of the selected State group health insurance premium.
IPERS has also recorded liabilities for other postemployment benefits. These benefits consist of an implicit rate subsidy, which is the difference between the blended premiums paid by all participants in the State’s health care plans and the expected claims for the retiree group. This liability, as determined by the State GAAP Team, was $6,129 for each full-time employee of IPERS, for a total liability of $496,449.
These accrued liabilities are included in accounts payable and accrued expenses in the Statement of Fiduciary Net Position on page 21. Details are provided on a statewide basis in the State of Iowa’s Comprehensive Annual Financial Report.
(2) PLAN DESCRIPTION
A. AdministrationIPERS is a cost-sharing, multiple-employer, contributory defined benefit public employee retirement system. Administrative expenses are appropriated each year by
Summary of Capital Assets As of June 30, 2016, and 2015
Capital Assets Land Building and
Improvements Land
Improvements
Furniture, Equipment, and
Software Total Capital
Assets Balances as of June 30, 2015 $500,000 $7,040,926 $413,226 $25,229,484 $33,183,636 Additions --- --- --- 703,132 703,132 Deletions --- --- --- (157,742) (157,742)Balances as of June 30, 2016 500,000 7,040,926 413,226 25,774,874 33,729,026
Accumulated DepreciationBalances as of June 30, 2015 --- 2,088,681 34,435 8,620,782 10,743,898 Depreciation expense --- 210,953 13,775 2,162,098 2,386,826Deletions --- --- --- (156,210) (156,210)Balances as of June 30, 2016 --- 2,299,634 48,210 10,626,670 12,974,514 Net capital assets as of June 30, 2016 $500,000 $4,741,292 $365,016 $15,148,204 $20,754,512

34 FINANCIAL IPERS Comprehensive Annual Financial Report 2016 IPERS Comprehensive Annual Financial Report 2016 FINANCIAL 35
City 23,24114%
Education 87,494 52%
Inactive nonvested
39,887 11%Active
168,372 48%
Retired 103,883
30%
Retired reemployed 10,608
3%
Inactive vested 26,960
8%
County 26,626 16%
State 25,355 15%
Other5,6563%
the Iowa Legislature and paid from the Trust Fund.The IPERS Investment Board is designated as the
Fund’s trustee. It sets investment policies and oversees the System’s actuarial program. The Board holds public meetings regularly to review actuarial findings and investment performance, and to formalize policies with the administration.
Eleven members serve on the Investment Board: seven voting members and four nonvoting members.
The voting members include:• Three public members, appointed by the Governor,
who have substantial institutional investment or financial experience and are not IPERS members.
• Three members, appointed by the Governor, who are IPERS members: an active member who is an employee of a school district, area education agency, or merged area; an active member who is not an employee of a school; and a retired IPERS member.
• The Treasurer of State.The nonvoting members include:
• Two state representatives (one appointed by the speaker of the Iowa House of Representatives, and one appointed by the minority leader of the House).
• Two state senators (one appointed by the majority leader of the Iowa Senate, and one appointed by the minority leader of the Senate).Gubernatorial appointees serve six-year terms, and
must be confirmed by the Iowa Senate.The IPERS Benefits Advisory Committee is statutorily
charged to make benefit and service recommendations to IPERS and the General Assembly.
The Committee is composed of representatives of constituent groups concerned with the System, and includes representatives of all major employer groups and major active and retired member associations.
B. MembershipIPERS participation is mandatory for most employees of the State of Iowa and its political subdivisions, including public school systems. Exceptions include employees covered by a retirement system other than Social Security, supported at least partially by public contributions. Membership is optional for members of the Iowa General Assembly and certain others.
At June 30, 2016, IPERS had 168,372 contributing (active) members, employed by 1,960 public employers. The number of active members increased by 0.60 percent in FY2016. The Plan Membership tables and pie charts provide further information.
Plan MembershipFiscal Years Ended June 30
Members 2016 2015Retirees and beneficiaries 114,491 111,368 Active vested 104,741 106,743 Inactive vested 26,960 27,659 Active nonvested 63,631 60,624 Inactive nonvested 39,887 39,715 Total 349,710 346,109
Note: Retired reemployed members are included in the number of retirees and beneficiaries. Retired reemployed members consist of all retirees who have at any time returned to covered employment but have not subsequently requested a refund or a benefit recalculation.
2016 2015
Employer Type
Number of Entities
Covered Wages
Number of Entities
Covered Wages
City 960 $ 947,519,172 965 $ 929,872,850 Education 359 3,704,823,676 362 3,582,036,843 County 349 1,249,697,569 349 1,213,466,809 Other 159 126,502,223 158 108,881,714 Utilities 132 101,365,129 133 98,060,023 State 1 1,426,607,951 1 1,394,029,902 Total 1,960 $7,556,515,720 1,968 $7,326,348,141
Note: Employer counts are adjusted to be in compliance with GASB 67. A correction has been made to FY2015 counts and, in addition, Health was previously reported separately to assist in tracking licensed health care professionals due to a unique bona fide retirement provision that is no longer in effect. Membership Status
Active Members by Major Employer Type

36 FINANCIAL IPERS Comprehensive Annual Financial Report 2016
C. Benefit PlanIPERS benefits are established under Iowa Code chapter 97B and the administrative rules thereunder. Chapter 97B and the administrative rules are the official plan documents. The following brief description is provided for general informational purposes only. Refer to the plan documents for more information.
VestingRegular members who complete seven years of covered service or reach the age of 65 while in IPERS-covered employment become vested. Special service members who complete four years of covered service or reach the age of 55 while in IPERS-covered employment become vested.
Service PurchasesAt retirement, members who have reached the years-of-service requirement for vesting may purchase service. These members may restore (buy back) previously refunded member service, purchase (buy in) IPERS service credit for employment elsewhere or time spent away from work, or convert (buy up) Regular service credit to Special service credit.
RefundsIPERS members who terminate public employment for any reason may request a full refund of their accumulated contributions. Vested members requesting a refund also receive a portion of their accumulated employer contributions. Acceptance of the refund automatically terminates IPERS membership and all claims to future benefits. If an employee works in covered employment for less than six months, the employer may file a wage adjustment and the applicable IPERS contributions will be refunded to the individual and employer.
Eligibility for PensionsA Regular member may retire at normal retirement age and receive monthly benefits without an early- retirement reduction. Normal retirement age is age 65, anytime after reaching age 62 with 20 or more years of covered employment, or when the member’s years of service plus the member’s age at the last birthday equals or exceeds 88, whichever comes first. (These qualifications must be met on the member’s first month of entitlement to benefits.) Members cannot begin receiving retirement benefits before age 55.
Members who are age 70 and still working for an IPERS-covered employer may apply to begin receiving IPERS retirement benefits while still employed.
Special service members are eligible for retirement benefits if they are vested, no longer working for an IPERS-covered employer, and reach age 55. Sheriffs and deputies may become eligible for retirement benefits at age 50 if they have 22 years of qualified service.
Pension Benefit FormulaThe formula used to calculate a Regular member’s monthly IPERS benefit includes:• A multiplier (based on years of service).• The member’s highest five-year average salary.
(For members with service before June 30, 2012, thehighest three-year average salary as of that datewill be used if it is greater than the highest five-yearaverage salary.)
• An early-retirement reduction, only if the benefitis first paid before the member reaches normalretirement age.If a Regular member receives benefits before normal
retirement age, a permanent early-retirement reduction will apply. For service earned before July 1, 2012, a reduction of 0.25 percent per month is applied for each month the benefit is paid before normal retirement age. For service earned after June 30, 2012, the reduction is 0.50 percent times the number of months the member receives a benefit before age 65.
The formula used to calculate a Special service member’s monthly IPERS benefit includes:• A multiplier (based on years of service).• The member’s highest three-year average salary.
Benefit OptionsUpon retirement, an IPERS member may choose from six benefit options. Each of the six options provides a lifetime benefit for the IPERS member. The amount of the member’s benefits and the amount and availability of death benefits vary according to the option selected.
Option 1A member receives a lifetime monthly benefit. At retirement, the member specifies a lump-sum death benefit amount, in an increment of $1,000, to be paid to a designated beneficiary upon the death of the member. The death benefit cannot exceed the member’s accumulated contributions. The death benefit cannot lower the monthly benefit as calculated under Option 2 by more than 50 percent.

36 FINANCIAL IPERS Comprehensive Annual Financial Report 2016 IPERS Comprehensive Annual Financial Report 2016 FINANCIAL 37
Option 2A member receives a lifetime monthly benefit. When the member dies, the designated beneficiary receives a lump-sum refund of the excess, if any, of the member’s accumulated contributions minus the amount of all retirement benefits paid to the member prior to death.
Option 3A member receives the maximum lifetime monthly benefit. No payment is made to a beneficiary upon the member’s death.
Option 4A member receives a lifetime monthly benefit actuarially reduced to provide for a lifetime monthly benefit to the contingent annuitant upon the member’s death. The age of the contingent annuitant can affect the cost of the lifetime payments to the member based on actuarial tables. The contingent annuitant can receive 100 percent, 75 percent, 50 percent, or 25 percent of the member’s monthly benefit. The choice in percentages will be limited if the contingent annuitant is not the member’s spouse and is more than ten years younger than the member.
Option 5A member receives a lifetime benefit with a ten-year guarantee. If the member dies before ten full years have passed (120 monthly payments are made), the member’s designated beneficiary will receive a monthly benefit for the remainder of the ten years. If the beneficiary dies before the ten years expire, the beneficiary’s estate will receive a commuted lump-sum settlement. If the member designates more than one beneficiary, payments will be made in a lump sum only. Members who have attained age 90 as of the first month of entitlement are not allowed to select this option.
Option 6The member receives a reduced monthly benefit so that a lifetime monthly benefit may be provided after the member’s death to the person named by the member as the contingent annuitant. In addition, the monthly amounts are reduced to pay for a pop-up feature. The pop-up feature provides that if the contingent annuitant dies before the member, the member’s benefit will pop back up to what it would have been under IPERS Option 2, and death benefits may be payable to the member’s designated beneficiary if certain conditions are met.
Level Payment OptionsSpecial service members may choose to apply a level payment feature to Options 1–5. Level payment options provide for a lifetime monthly benefit that will be permanently reduced when the member reaches age 62. Level payment options allow members to receiveapproximately equal payments before and after theybegin receiving Social Security benefits. The deathbenefit provisions for each level payment option matchthe provisions of the corresponding “normal” option.
Dividend PaymentsOnce a member selects a benefit option, a monthly benefit is calculated and remains the same for the rest of the member’s lifetime.
However, for retirees who began receiving benefits prior to July 1990, a guaranteed dividend is included with a member’s November benefit payment. The dividend payable in any given year is the sum of the dollar amount of the dividend payable in the previous November and a dividend adjustment. The dividend adjustment, set out in Iowa Code section 97B.49F(1)(b), is calculated by multiplying the total of the retiree’s monthly benefit payments and the dividend payable to the retiree in the previous calendar year by the applicable percentage, up to 3 percent.
For retirees who began receiving benefits after June 30, 1990, a Favorable Experience Dividend (FED) may be paid if there are funds in the FED reserve account. There are currently no funds in the reserve account. Pursuant to Iowa Code section 97B.49F(2)(c)(5), IPERS cannot transfer additional funds to the FED reserve account until the Trust Fund is 100 percent funded and would remain so after the transfer.
Disability BenefitsA vested member who is awarded federal Social Security disability or Railroad Retirement disability benefits is eligible to claim IPERS benefits regardless of age. Disability benefits are not reduced for early retirement.
Special service members who retire because of a disability may meet the requirements to receive Regular or Special service disability benefits from IPERS.
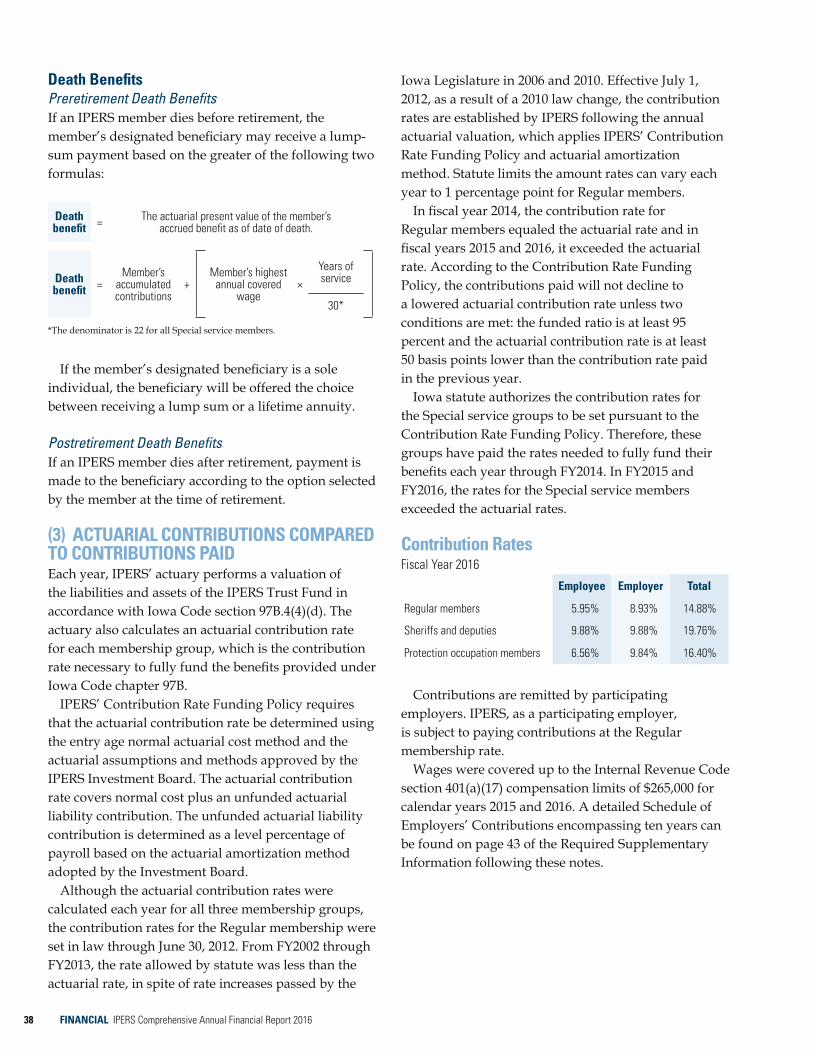
38 FINANCIAL IPERS Comprehensive Annual Financial Report 2016
Death BenefitsPreretirement Death BenefitsIf an IPERS member dies before retirement, the member’s designated beneficiary may receive a lump- sum payment based on the greater of the following two formulas:
Death benefit = The actuarial present value of the member’s
accrued benefit as of date of death.
Death benefit =
Member’s accumulated contributions
+Member’s highest
annual covered wage
×
Years of service
30*
*The denominator is 22 for all Special service members.
If the member’s designated beneficiary is a sole individual, the beneficiary will be offered the choice between receiving a lump sum or a lifetime annuity.
Postretirement Death BenefitsIf an IPERS member dies after retirement, payment is made to the beneficiary according to the option selected by the member at the time of retirement.
(3) ACTUARIAL CONTRIBUTIONS COMPARED TO CONTRIBUTIONS PAIDEach year, IPERS’ actuary performs a valuation of the liabilities and assets of the IPERS Trust Fund in accordance with Iowa Code section 97B.4(4)(d). The actuary also calculates an actuarial contribution rate for each membership group, which is the contribution rate necessary to fully fund the benefits provided under Iowa Code chapter 97B.
IPERS’ Contribution Rate Funding Policy requires that the actuarial contribution rate be determined using the entry age normal actuarial cost method and the actuarial assumptions and methods approved by the IPERS Investment Board. The actuarial contribution rate covers normal cost plus an unfunded actuarial liability contribution. The unfunded actuarial liability contribution is determined as a level percentage of payroll based on the actuarial amortization method adopted by the Investment Board.
Although the actuarial contribution rates were calculated each year for all three membership groups, the contribution rates for the Regular membership were set in law through June 30, 2012. From FY2002 through FY2013, the rate allowed by statute was less than the actuarial rate, in spite of rate increases passed by the
Iowa Legislature in 2006 and 2010. Effective July 1, 2012, as a result of a 2010 law change, the contribution rates are established by IPERS following the annual actuarial valuation, which applies IPERS’ Contribution Rate Funding Policy and actuarial amortization method. Statute limits the amount rates can vary each year to 1 percentage point for Regular members.
In fiscal year 2014, the contribution rate for Regular members equaled the actuarial rate and in fiscal years 2015 and 2016, it exceeded the actuarial rate. According to the Contribution Rate Funding Policy, the contributions paid will not decline to a lowered actuarial contribution rate unless two conditions are met: the funded ratio is at least 95 percent and the actuarial contribution rate is at least 50 basis points lower than the contribution rate paid in the previous year.
Iowa statute authorizes the contribution rates for the Special service groups to be set pursuant to the Contribution Rate Funding Policy. Therefore, these groups have paid the rates needed to fully fund their benefits each year through FY2014. In FY2015 and FY2016, the rates for the Special service members exceeded the actuarial rates.
Contribution RatesFiscal Year 2016
Employee Employer Total
Regular members 5.95% 8.93% 14.88%
Sheriffs and deputies 9.88% 9.88% 19.76%
Protection occupation members 6.56% 9.84% 16.40%
Contributions are remitted by participating employers. IPERS, as a participating employer, is subject to paying contributions at the Regular membership rate.
Wages were covered up to the Internal Revenue Code section 401(a)(17) compensation limits of $265,000 for calendar years 2015 and 2016. A detailed Schedule of Employers’ Contributions encompassing ten years can be found on page 43 of the Required Supplementary Information following these notes.

38 FINANCIAL IPERS Comprehensive Annual Financial Report 2016 IPERS Comprehensive Annual Financial Report 2016 FINANCIAL 39
(4) NET PENSION LIABILITYThe components of the net pension liability (NPL) at June 30, 2016, were as follows:
Total pension liability $34,619,749,147Plan fiduciary net position $28,326,433,656Employers’ net pension liability $6,293,315,491
Plan fiduciary net position as a percentage of the total pension liability 81.82%
The total pension liability (TPL) was determined by an actuarial valuation as of June 30, 2016. Actuarial valuations involve projections of benefit payments, contributions, and other amounts decades into the future. These projections are based on actuarial assumptions and methods adopted by the IPERS Investment Board. Assumptions such as salary increases, investment rates of return, retirement and disability rates, mortality rates, and inflation rates are compared against actual experience in actuarial experience studies conducted every four years. These studies assist IPERS in evaluating the accuracy with which the assumptions predict actual experience. The Investment Board adopted and approved the use of the assumptions and methods shown in the following table. These are the assumptions the actuary used to comply with GASB 67. Additional methods and assumptions used in the actuarial valuation for funding purposes are listed in the Actuarial section of this report.
Actuarial Methods and AssumptionsActuarial cost method Entry age normalAssumed investment return 7.50%Projected salary increases 4%–17% depending upon years of serviceMortality tables RP-2000 Employee and Healthy Annuitant
Tables with generational scaling and age adjustments
Inflation rate 3%Payroll increase assumption 4%
The long-term actuarial assumed investment return reflects the anticipated returns on current and future plan assets. It provides a discount rate to determine the present value of future benefit payments.
The actuarial assumed investment return is reviewed as part of the experience studies prepared for the System by IPERS’ actuary. The most recent analysis, performed for the period covering fiscal years 2010 through 2013, is outlined in a report dated May 27, 2014. Several factors are considered in evaluating the
actuarial assumed investment return including long-term historical data, estimates inherent in current market data, and a log-normal distribution analysis in which best-estimate ranges of expected future real rates of return (expected return, net of investment expense and inflation) were developed by the investment consultant for each major asset class. These ranges were combined to produce the actuarial assumed investment return by weighting the expected future real rates of return by the target asset allocation percentage and then adding expected inflation. The capital market assumptions developed by the investment consultant are intended for use over a 10-year horizon and may not be useful in setting the actuarial assumed investment return for funding pension plans, which covers a longer timeframe. The assumption is intended to be a long-term assumption and is not expected to change absent a significant change in the asset allocation, a change in the inflation assumption, or a fundamental change in the market that alters expected returns in future years.
Best estimates of arithmetic real rates of return for each major asset class included in IPERS’ target asset allocation as of June 30, 2016, are shown in the following table.
Target Allocations and Long-Term Expected Real Rates of ReturnAs of June 30, 2016
Target Allocation
Long-Term Expected Real Rate of Return
Core-plus fixed income 28% 1.90%
Domestic equity 24% 5.85%
International equity 16% 6.32%
Private equity/debt 11% 10.31%
Real estate 8% 3.87%
Credit opportunities 5% 4.48%
U.S. TIPS 5% 1.36%
Other real assets 2% 6.42%
Cash 1% –0.26%
A. Discount RateThe discount rate used to calculate the TPL is 7.50 percent. The projection of cash flows used to determine the discount rate assumed that contributions from employees and employers will be made at the contractually required rates, which

40 FINANCIAL IPERS Comprehensive Annual Financial Report 2016
are set by the Contribution Rate Funding Policy and derived from the actuarial valuation. Based on those assumptions, IPERS’ fiduciary net position was projected to be available to make all projected future benefit payments of current members. Therefore, the actuarial assumed investment return was applied to all periods of projected benefit payments to determine the TPL.
B. Net Pension Liability SensitivityGASB 67 requires the disclosure of the sensitivity of the NPL to changes in the discount rate. The table below shows the NPL if it were calculated using discount rates 1 percentage point lower and 1 percentage point higher than the actuarial assumed investment return (discount rate) of 7.50 percent.
1% Decrease: 6.50%
Current Discount Rate:
7.50%1% Increase:
8.50%
$10,404,301,460 $6,293,315,491 $2,824,129,075
C. Proportioning the Net Pension LiabilityMany of IPERS’ employers implemented GASB Statement No. 68, Accounting and Financial Reporting for Pensions, in FY2015. This standard requires employers following U.S. generally accepted accounting principles (GAAP) to record a portion of IPERS’ net pension liability on their financial statements, as well as a portion of the net pension liability from any other defined benefit pension plans administered through trusts in which they participate.
IPERS, in association with the Auditor of State, provides information needed by the employers to comply with this new reporting standard. Previously, employers reported only their contributions paid to IPERS. With the implementation of GASB 68, employers that report on a GAAP basis will report their proportionate share of the NPL, a new measure of pension expense, deferred inflows of resources, and deferred outflows of resources related to pensions on their financial statements. GASB 68 also requires additional note disclosures, as well as new tables and related notes in the Required Supplementary Information.
Employers with a June 30 fiscal year-end employ a one-year lag by using IPERS’ June 30, 2015, information for their June 30, 2016, reporting, as allowed by the GASB. The NPL of $6.293 billion
will be apportioned to employers for their FY2017 financial reporting. IPERS apportions the NPL among participating employers based on the contributions each employer paid during the fiscal year as a percentage of all employer contributions paid to IPERS for the fiscal year.
(5) LITIGATION AND CONTINGENCIESIPERS monitors, evaluates, and takes the necessary actions related to litigation for or against IPERS. This includes, but is not limited to, federal and state court actions and defending administrative appeals filed against IPERS. IPERS employs outside legal counsel, utilizes the legal services of the Iowa Attorney General’s Office, and utilizes in-house legal counsel to assert and defend claims for IPERS.
IPERS participates in federal securities class actions as the lead plaintiff, the co-lead plaintiff, a named plaintiff, or a member of the class action. During the fiscal year, IPERS made several recoveries benefiting the Trust Fund in the amount of $3.7 million. The recoveries are reflected in the financial statements for the year ended June 30, 2016.
In the fraud action against Westridge Capital Management, IPERS continues to pursue full recovery. On October 26, 2015, IPERS received a distribution of $20 million that is reflected in the financial statements ended June 30, 2016. The total recovery through June 30, 2016, is nearly 97 percent of IPERS’ initial investment.
IPERS remains a defendant, along with approximately 500 other investors, in an action before the United States Bankruptcy Court for the Southern District of New York known as Motors Liquidation Company Avoidance Action Trust v. JP Morgan Chase Bank, N.A. et. al., Proceeding Nos. 09-50026 and 09-00504. IPERS cannot estimate its potential lossesbecause the Court has sealed the documents relatedto this action.
IPERS successfully defended several appeals filed under the Iowa Administrative Procedures Act. No administrative appeal resulted in a loss to the Trust Fund.

40 FINANCIAL IPERS Comprehensive Annual Financial Report 2016 IPERS Comprehensive Annual Financial Report 2016 FINANCIAL 41
(6) COMMITMENTSAt June 30, 2016, IPERS had commitments to fund an additional $2.175 billion to various private equity/ debt partnerships and $91.5 million to real estate debt partnerships.
(7) NET POSITION RESTRICTED FORPENSIONSThere is only one IPERS Trust Fund where all investment income, employee contributions, and employer contributions are pooled. However, IPERS’ three distinct membership groups are characterized by different benefit levels and occupation types. Because of these varied characteristics, each group has its own contribution rate. To calculate contribution rates, it is necessary to separately identify the liabilities and assets associated with each group. Assets of members with service in more than one membership group are aggregated in a single group, as noted on the “transfers between groups” line in the following table. The end result is a closer match of liabilities with assets and therefore more refined contribution rates.
Allocation of Net Position Restricted for PensionsFiscal Year Ended June 30, 2016
Regular Members
Sheriffs and Deputies
Protection Occupation Members Total
Net position as of June 30, 2015 $26,480,405,923 $578,331,440 $1,371,097,466 $28,429,834,829
Additions
Contributions 1,068,130,830 20,814,192 55,574,028 1,144,519,050
Service purchases 30,278,567 380,233 1,489,062 32,147,862
Investment and miscellaneous income 638,043,796 14,051,181 33,403,212 685,498,189
Total additions 1,736,453,193 35,245,606 90,466,302 1,862,165,101
Deductions
Benefit payments 1,755,991,771 26,518,389 58,224,448 1,840,734,608
Member refunds 43,227,299 658,752 5,362,126 49,248,177
Administrative expenses 14,348,459 111,622 478,870 14,938,951
Investment expenses 56,446,351 1,243,077 2,955,110 60,644,538
Total deductions 1,870,013,880 28,531,840 67,020,554 1,965,566,274
Preliminary net position 26,346,845,236 585,045,206 1,394,543,214 28,326,433,656
Transfers between groups (5,437,947) 3,071,824 2,366,123 ---
Adjusted net position as of June 30, 2016 $26,341,407,289 $588,117,030 $1,396,909,337 $28,326,433,656
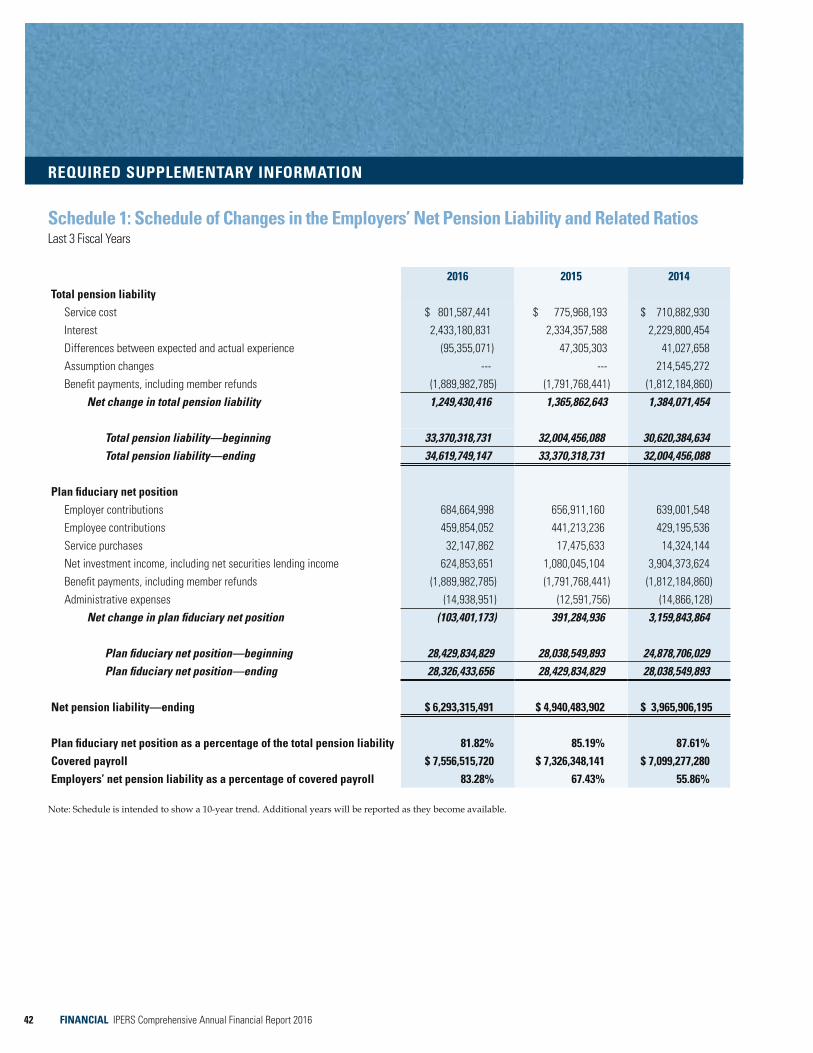
42 FINANCIAL IPERS Comprehensive Annual Financial Report 2016
REQUIRED SUPPLEMENTARY INFORMATION
Schedule 1: Schedule of Changes in the Employers’ Net Pension Liability and Related RatiosLast 3 Fiscal Years
2016 2015 2014Total pension liability Service cost $ 801,587,441 $ 775,968,193 $ 710,882,930 Interest 2,433,180,831 2,334,357,588 2,229,800,454 Differences between expected and actual experience (95,355,071) 47,305,303 41,027,658 Assumption changes --- --- 214,545,272 Benefit payments, including member refunds (1,889,982,785) (1,791,768,441) (1,812,184,860)
Net change in total pension liability 1,249,430,416 1,365,862,643 1,384,071,454
Total pension liability—beginning 33,370,318,731 32,004,456,088 30,620,384,634Total pension liability—ending 34,619,749,147 33,370,318,731 32,004,456,088
Plan fiduciary net position Employer contributions 684,664,998 656,911,160 639,001,548 Employee contributions 459,854,052 441,213,236 429,195,536 Service purchases 32,147,862 17,475,633 14,324,144 Net investment income, including net securities lending income 624,853,651 1,080,045,104 3,904,373,624 Benefit payments, including member refunds (1,889,982,785) (1,791,768,441) (1,812,184,860) Administrative expenses (14,938,951) (12,591,756) (14,866,128)
Net change in plan fiduciary net position (103,401,173) 391,284,936 3,159,843,864
Plan fiduciary net position—beginning 28,429,834,829 28,038,549,893 24,878,706,029Plan fiduciary net position—ending 28,326,433,656 28,429,834,829 28,038,549,893
Net pension liability—ending $ 6,293,315,491 $ 4,940,483,902 $ 3,965,906,195
Plan fiduciary net position as a percentage of the total pension liability 81.82% 85.19% 87.61%Covered payroll $ 7,556,515,720 $ 7,326,348,141 $ 7,099,277,280Employers’ net pension liability as a percentage of covered payroll 83.28% 67.43% 55.86%
Note: Schedule is intended to show a 10-year trend. Additional years will be reported as they become available.
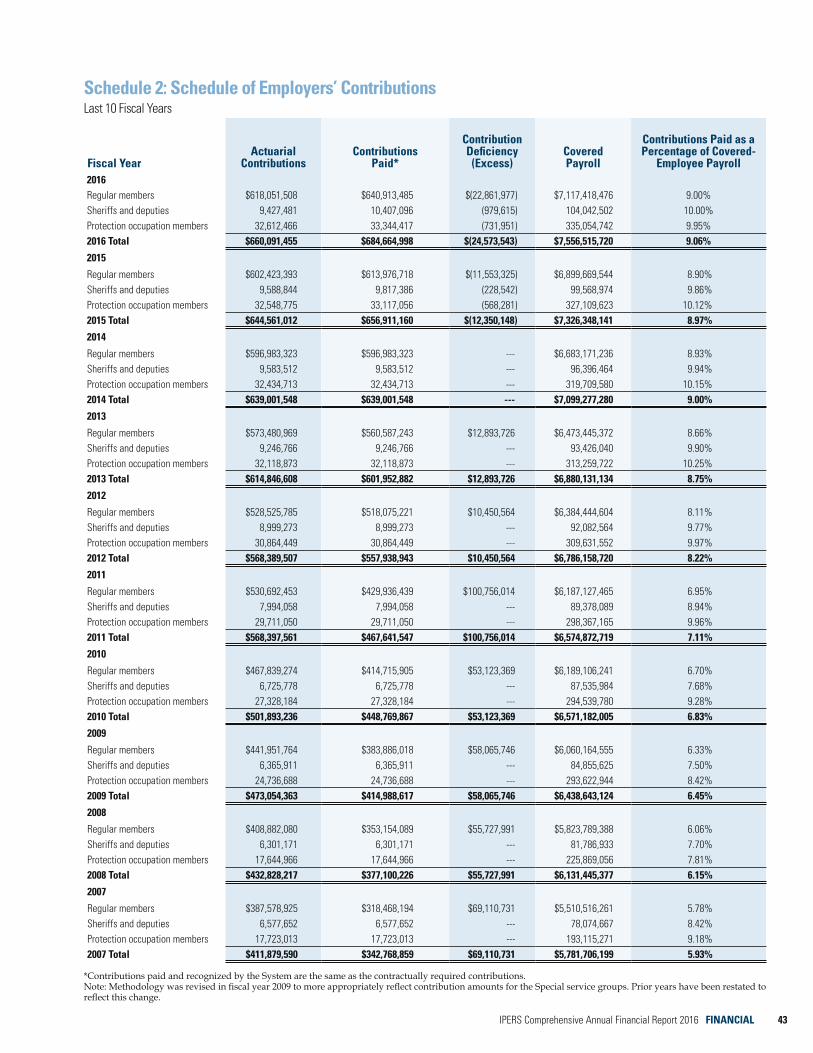
42 FINANCIAL IPERS Comprehensive Annual Financial Report 2016 IPERS Comprehensive Annual Financial Report 2016 FINANCIAL 43
Schedule 2: Schedule of Employers’ Contributions Last 10 Fiscal Years
Fiscal YearActuarial
Contributions Contributions
Paid*
Contribution Deficiency
(Excess)Covered Payroll
Contributions Paid as a Percentage of Covered-
Employee Payroll2016Regular members $618,051,508 $640,913,485 $(22,861,977) $7,117,418,476 9.00%Sheriffs and deputies 9,427,481 10,407,096 (979,615) 104,042,502 10.00%Protection occupation members 32,612,466 33,344,417 (731,951) 335,054,742 9.95%2016 Total $660,091,455 $684,664,998 $(24,573,543) $7,556,515,720 9.06%
2015
Regular members $602,423,393 $613,976,718 $(11,553,325) $6,899,669,544 8.90%Sheriffs and deputies 9,588,844 9,817,386 (228,542) 99,568,974 9.86%Protection occupation members 32,548,775 33,117,056 (568,281) 327,109,623 10.12%2015 Total $644,561,012 $656,911,160 $(12,350,148) $7,326,348,141 8.97%
2014
Regular members $596,983,323 $596,983,323 --- $6,683,171,236 8.93%Sheriffs and deputies 9,583,512 9,583,512 --- 96,396,464 9.94%Protection occupation members 32,434,713 32,434,713 --- 319,709,580 10.15%2014 Total $639,001,548 $639,001,548 --- $7,099,277,280 9.00%
2013
Regular members $573,480,969 $560,587,243 $12,893,726 $6,473,445,372 8.66%Sheriffs and deputies 9,246,766 9,246,766 --- 93,426,040 9.90%Protection occupation members 32,118,873 32,118,873 --- 313,259,722 10.25%2013 Total $614,846,608 $601,952,882 $12,893,726 $6,880,131,134 8.75%
2012
Regular members $528,525,785 $518,075,221 $10,450,564 $6,384,444,604 8.11%Sheriffs and deputies 8,999,273 8,999,273 --- 92,082,564 9.77%Protection occupation members 30,864,449 30,864,449 --- 309,631,552 9.97%2012 Total $568,389,507 $557,938,943 $10,450,564 $6,786,158,720 8.22%
2011
Regular members $530,692,453 $429,936,439 $100,756,014 $6,187,127,465 6.95%Sheriffs and deputies 7,994,058 7,994,058 --- 89,378,089 8.94%Protection occupation members 29,711,050 29,711,050 --- 298,367,165 9.96%2011 Total $568,397,561 $467,641,547 $100,756,014 $6,574,872,719 7.11%
2010
Regular members $467,839,274 $414,715,905 $53,123,369 $6,189,106,241 6.70%Sheriffs and deputies 6,725,778 6,725,778 --- 87,535,984 7.68%Protection occupation members 27,328,184 27,328,184 --- 294,539,780 9.28%2010 Total $501,893,236 $448,769,867 $53,123,369 $6,571,182,005 6.83%
2009
Regular members $441,951,764 $383,886,018 $58,065,746 $6,060,164,555 6.33%Sheriffs and deputies 6,365,911 6,365,911 --- 84,855,625 7.50%Protection occupation members 24,736,688 24,736,688 --- 293,622,944 8.42%2009 Total $473,054,363 $414,988,617 $58,065,746 $6,438,643,124 6.45%
2008
Regular members $408,882,080 $353,154,089 $55,727,991 $5,823,789,388 6.06%Sheriffs and deputies 6,301,171 6,301,171 --- 81,786,933 7.70%Protection occupation members 17,644,966 17,644,966 --- 225,869,056 7.81%2008 Total $432,828,217 $377,100,226 $55,727,991 $6,131,445,377 6.15%
2007
Regular members $387,578,925 $318,468,194 $69,110,731 $5,510,516,261 5.78%Sheriffs and deputies 6,577,652 6,577,652 --- 78,074,667 8.42%Protection occupation members 17,723,013 17,723,013 --- 193,115,271 9.18%2007 Total $411,879,590 $342,768,859 $69,110,731 $5,781,706,199 5.93%
*Contributions paid and recognized by the System are the same as the contractually required contributions.Note: Methodology was revised in fiscal year 2009 to more appropriately reflect contribution amounts for the Special service groups. Prior years have been restated to reflect this change.

44 FINANCIAL IPERS Comprehensive Annual Financial Report 2016
Schedule 3: Schedule of Investment ReturnsLast 3 Fiscal Years
2016 2015 2014Annual money-weighted rate of return, net of investment expense 2.23% 3.91% 15.96%
Note: Schedule is intended to show a 10-year trend. Additional years will be reported as they become available.
Notes to Required Supplementary InformationBenefit terms, actuarial assumptions and methods, and funding policies affect the actuarial contribution rates. Changes over the past ten years that had a significant impact on the actuarial contribution rates are summarized below. More detail may be obtained from the annual valuation reports.
(1) CHANGES IN BENEFIT TERMSLegislation passed in 2010 modified benefit terms for current Regular members. The definition of final average salary changed from the highest three to the highest five years of covered wages. The vesting requirement changed from four years of service to seven years. The early retirement reduction increased from 3 percent per year measured from the member’s first unreduced retirement age to a 6 percent reduction for each year of retirement before age 65.
In 2008, legislative action transferred four groups—emergency medical service providers, county jailers, county attorney investigators, and National Guard installation security officers—from Regular membership to the protection occupation group for future service only.
(2) CHANGES IN ACTUARIAL ASSUMPTIONSAND METHODSThe 2014 valuation incorporated the following refinements after a quadrennial experience study:• Decreased the inflation assumption from 3.25 percent
to 3.00 percent per year.• Decreased the assumed rate of interest on member
accounts from 4.00 percent to 3.75 percent per year.• Adjusted male mortality rates for retirees in the
Regular membership group.• Reduced retirement rates for sheriffs and deputies
between the ages of 55 and 64.• Moved from an open 30-year amortization period
to a closed 30-year amortization period for the
UAL beginning June 30, 2014. Each year thereafter, changes in the UAL from plan experience will be amortized on a separate closed 20-year period.The 2010 valuation incorporated the following
refinements after a quadrennial experience study:• Adjusted retiree mortality assumptions.• Modified retirement rates to reflect fewer retirements.• Lowered disability rates at most ages.• Lowered employment termination rates.• Increased the probability that terminating members
would eventually receive a retirement benefit.• Modified salary increase assumptions based on
various service durations.The 2007 valuation:
• Adjusted the application of the entry age normal costmethod to better match projected contributions to theprojected salary stream in future years.
• Included in the calculation of the UAL amortizationpayment the one-year lag between the valuationdate and the effective date of the annual actuarialcontribution rate.
(3) FUNDING POLICIESThe difference between the actuarial contribution rates and contributions paid is due entirely to statutorily set contributions that have differed from the actuarial contribution rates. Special service members have always paid at least the actuarial contribution rates.
Contribution rates for Regular members were set in statute at 9.45 percent from 1979 to 2007. In 2006, legislation allowed a 0.50 percentage point increase for each of the following four years, leading to a rate of 11.45 percent effective for FY2011. In 2010, an additional contribution rate increase to 13.45 percent, effective in FY2012, was passed by the Legislature.
The same legislation authorized IPERS to change the contribution rates by 1 percentage point each year, to bring them closer in line with the actuarial contribution rates, starting in FY2013. The FY2013 contribution rate for Regular members was capped at 14.45 percent because of the statutory restriction, while the actuarial contribution rate was 14.77 percent. In FY2014, the contribution rate for Regular members equaled the actuarial contribution rate, and in FY2015 and FY2016, the contribution rate exceeded the actuarial contribution rate.
The Contribution Rate Funding Policy adopted by the IPERS Investment Board establishes procedures for setting the contribution rates for all membership

44 FINANCIAL IPERS Comprehensive Annual Financial Report 2016 IPERS Comprehensive Annual Financial Report 2016 FINANCIAL 45
groups. The actuarial contributions in the Schedule of Employers’ Contributions are calculated annually on each valuation date (June 30), and apply one year after the valuation. Accordingly, the actuarial methods and assumptions shown in the following table are from the June 30, 2014 actuarial valuation, which established the actuarially determined employer contributions for FY2016.
FY2014 Actuarial Methods and Assumptions Actuarial cost method Entry age normal
Amortization method Level percentage of payroll, closed
Amortization period 30 years
Asset valuation method
Expected value plus 25% of difference between market value and expected value
Inflation rate 3%
Payroll increase assumption 4%
Projected salary increases
4%–17%, including inflation, depending on years of service
Assumed investment return
7.50% compounded annually, net of investment expense and including inflation
Mortality tables RP-2000 Generational Mortality Tables, with age setbacks and age set-forwards as well as other adjustments based on different membership groups. Future mortality improvements are anticipated using Projection Scale AA. Different adjustments apply to preretirement, postretirement, and postdisability mortality tables.

46 FINANCIAL IPERS Comprehensive Annual Financial Report 2016
SUPPLEMENTARY INFORMATION
Schedule 1: Schedule of Administrative Expenses Fiscal Years Ended June 30, 2016, and 2015
2016 2015 Personnel
Salaries and wages $ 6,725,843 $ 6,268,284 Travel 130,591 129,908
Professional and technical servicesProfessional 694,556 502,282 Actuary 219,060 185,890 Computer support services 3,690,454 2,083,995 Auditing 144,767 141,668
CommunicationsTelephone 144,383 137,090 Printing 152,555 137,172
Other expensesSupplies 532,152 489,523Utilities 54,917 50,780 Depreciation 2,368,036 2,370,821 Miscellaneous 81,637 94,343
Total administrative expenses $14,938,951 $12,591,756
Note: Administrative expenses related to investments do not appear here but are included in the investment expenses reported in the Schedule of Investment-Related Expenses on the next page.

46 FINANCIAL IPERS Comprehensive Annual Financial Report 2016 IPERS Comprehensive Annual Financial Report 2016 FINANCIAL 47
Schedule 2: Schedule of Investment-Related Expenses Fiscal Years Ended June 30, 2016, and 2015
2016 2015BlackRock Institutional Trust Company, NA $ 678,142 $ 2,236,300 Columbia Management Investment Advisors, LLC 574,121 2,938,790 First Quadrant, L.P. --- 526,007 Fisher Investments 584,504 771,021 Janus Capital Management LLC 1,517,332 1,530,428 J.P. Morgan Investment Management, Inc. 344,277 1,755,616 Mellon Capital Management Corporation 423,194 3,914,605 PanAgora Asset Management, Inc. 487,457 492,273 Wellington Management Company, LLP 2,588,020 3,031,651
Total domestic equity 7,197,047 17,196,691 BlackRock Financial Management, Inc. 693,147 1,019,795 MacKay Shields LLC 1,430,917 1,720,576 Mellon Capital Management Corporation (72,076) (985,960)Pacific Investment Management Company LLC 81 --- Principal Global Investors, LLC 403,250 437,863 PGIM, Inc. 1,893,281 --- TCW Asset Management Company LLC 909,449 --- Western Asset Management Company 1,528,315 2,546,952
Total core-plus fixed income 6,786,364 4,739,226 AEGON USA Investment Management, LLC 1,537,941 2,266,153 Oaktree Capital Management, L.P. 1,189,210 1,152,541 PGIM, Inc. 116,404 ---Western Asset Management Company 249,220 308,635
Total credit opportunities 3,092,775 3,727,329 BlackRock Institutional Trust Company, NA 101,242 101,602 Fischer Francis Trees & Watts, Inc. 432,694 398,809
Total U.S. TIPS 533,936 500,411 Forest Investment Associates L.P. 975,614 1,089,156 Harvest Fund Advisors LLC 2,730,986 3,584,362 UBS Farmland Investors LLC 1,254 ---
Total other real assets 3,707,854 4,673,518 Ashmore Equities Investment Management (US), LLC --- 2,230,537 BlackRock Institutional Trust Company, NA 5,754,345 5,939,745 GAM USA Inc. 347,711 398,100 Mellon Capital Management Corporation (134,732) (7,775)Oechsle International Advisors, LLC 1,049,549 4,890,730 Quantitative Management Associates LLC 1,198,153 2,502,046 Wellington Management Company, LLP 2,633,861 2,773,946
Total international equity 10,848,887 18,727,329 Blackstone Real Estate Debt Strategies II L.P. 1,698,244 1,543,500 CenterSquare Investment Management, Inc. 1,960,406 1,931,839 Clarion Partners, LLC 3,008,587 1,878,536 Invesco Real Estate 2,083,673 2,593,555 Principal Real Estate Debt Fund, LP 148,660 50,690 RREEF America, LLC 2,872,526 2,479,243 RREEF America, LLC (REIT) --- 377,477 State Street Global Advisors 121,039 113,368 UBS Realty Investors, LLC 1,660,989 1,776,756
Total real estate 13,554,124 12,744,964 Pathway Capital Management, LP 6,075,798 5,650,467
Total private equity/debt 6,075,798 5,650,467 Wilshire Associates, Inc. 344,000 331,000
Total investment consultant fees 344,000 331,000 The Bank of New York Mellon 727,309 294,957 Treasurer of State 106,818 87,997
Total custody expenses 834,127 382,954 Commission expenses 5,363,623 7,194,138 Investment staff and Board expenses 1,308,005 1,374,204 Miscellaneous expenses 997,998 735,338
Total other investment expenses 7,669,626 9,303,680 Total investment-related expenses $60,644,538 $77,977,569

48 FINANCIAL IPERS Comprehensive Annual Financial Report 2016

Investments

INVESTMENTS
INVESTMENT OVERVIEW
INVESTMENT RESULTS
INVESTMENT POLICY AND GOAL STATEMENT

PB INVESTMENTS IPERS Comprehensive Annual Financial Report 2016 IPERS Comprehensive Annual Financial Report 2016 INVESTMENTS 51
INVESTMENT OVERVIEW
This section of the CAFR was compiled by IPERS’ investment staff using information provided by Wilshire Associates and the Bank of New York Mellon. Except where noted otherwise, investment returns are based on investment asset fair value and calculated using time-weighted return calculation methodologies.
Investment returns play an important role in the funded status of the IPERS Trust Fund. The Investment Board has adopted an Investment Policy and Goal Statement, with the objective to benefit the members of the System by maximizing the total rate of return on investments within prudent risk parameters. IPERS’ overall investment performance goal is to achieve an annualized rate of return which, when combined with employee and employer contributions, will meet or exceed the benefits and administrative funding requirements of the System. (See the Investment Policy and Goal Statement at the end of this section for more information concerning IPERS’ investment return objectives.)
The System’s investments are managed by professional investment management firms based upon statutory investment authority, the investment policies adopted by the Investment Board, and a detailed service contract with each manager. The investment staff coordinates and monitors the investment of the Trust Fund’s assets and assists the Investment Board in the formulation and implementation of investment policies and long-term investment strategy.
IPERS’ net investment portfolio fair values reported in this section, and used as the basis for calculating investment returns, differ from those shown in the Financial and Actuarial sections of this report. The values used in this section are the appropriate industry standard basis for investment return calculation. Compared to the fair values shown in this report’s Financial and Actuarial sections, the values reflected in this Investments section are gross of investment receivables and cash in investment manager accounts, and net of payables and securities lending collateral.
Asset Allocation and DiversificationAsset allocation is a process designed to construct an optimal long-term asset mix that achieves a specific set of investment objectives. The Investment Policy and Goal Statement establishes the System’s asset allocation policy as designed to meet those objectives. The asset allocation policy is adopted to provide for diversification of assets in an effort to maximize the investment return to IPERS consistent with prudent levels of market and economic risks. Of all the components of investment strategy formulation, the determination of asset allocation targets is the most important decision.
The chart below illustrates the actual allocation to each type of investment, as of June 30, 2016.
Summary of Investments by Asset Class(Fair Values in Millions) As of June 30, 2016
Cash $143
0.50%
Domestic equity$6,87124.31%
Core-plus fixed income
$7,92928.05%
International equity$4,447 15.73%
Private equity/debt
$3,269 11.57%
Other real assets $410
1.45%
U.S. TIPS $1,365 4.83%
Credit opportunities
$1,462 5.17%
Real estate $2,3728.39%

52 INVESTMENTS IPERS Comprehensive Annual Financial Report 2016
In addition to diversifying the portfolio through asset class diversification, IPERS seeks to diversify the investment portfolio by investment management styles. The success of a particular investment style tends to be cyclical. For example, growth stock investing may outperform value stock investing for several quarters, or perhaps several years, until that trend is inevitably reversed for a subsequent period.
By utilizing several investment management firms with a variety of investment styles, the investment performance at the total Fund level is not dependent upon the success of one particular investment style.
The System also requires its investment managers to diversify their portfolios at the security level. Managers are required to diversify across sectors, industries, and individual securities. IPERS develops specific contractual investment guidelines for each manager that control the risk of high concentrations in a particular sector, industry, or security.
Overall, diversification of the System’s assets among various asset classes, investment management styles, and individual securities enhances the potential of the IPERS investment portfolio to achieve its long-term objectives.
Capital Markets CommentaryFiscal year 2016 was a period of mostly positive but relatively low investment returns. The U.S. stock market produced an annual return of 2.96 percent for the 12 months ended June 30, 2016, while core U.S. bonds returned 5.82 percent, U.S. high-yield bonds returned 0.88 percent, Treasury Inflation-Protected Securities (TIPS) returned 3.84 percent, and 91-day Treasury bills returned 0.19 percent. There were a couple of outliers: U.S. real estate returned 13.74 percent for the fiscal year, while international (non-U.S.) stocks produced a return of –9.80 percent overthe same period. Investment returns on non-U.S.assets were hurt in FY2016 by currency losses as theU.S. dollar remained quite strong relative to othercurrencies, driven by concerns over the slowingChinese economy and by the unexpected decision inJune 2016 by citizens of the United Kingdom to leavethe European Union (also known as Brexit).
The fiscal year saw the U.S. Federal Reserve make its first interest rate hike in eight years, although it was a very small 0.25 percent increase. Interest rates around the world remained at historical lows. While the
Federal Reserve was raising interest rates, the central banks of other developed nations sought to battle deflation by providing stimulus through lower interest rates and/or open market purchases of financial assets. Japan and Germany both experienced negative interest rates—an unprecedented occurrence in modern financial history.
While low interest rates may signal continued slow economic growth and little inflation, low borrowing costs are a boon for consumers and for investment strategies that utilize leverage, such as private equity, real estate, and REITs to name a few. There were signs late in the fiscal year that the American consumer could be ready to drive the U.S. economy to higher growth levels, but the rest of the world, especially Europe, Japan, and several emerging market countries, appeared to be on divergent paths.
Investment Portfolio AssetsAt the close of fiscal year 2016, IPERS’ net investment portfolio assets had a fair value of $28.268 billion. This represents a decrease of $125 million from the $28.393 billion net investment asset fair value as of June 30, 2015. The main reason for the small decrease in net assets was the low investment portfolio return for fiscal year 2016.

52 INVESTMENTS IPERS Comprehensive Annual Financial Report 2016 IPERS Comprehensive Annual Financial Report 2016 INVESTMENTS 53
INVESTMENT RESULTS
IPERS posted a total portfolio investment return of 2.15 percent for the fiscal year ended June 30, 2016. This return fell short of the 2.89 percent return of IPERS’ policy benchmark, a set of market indexes and weightings to those indexes that reflect IPERS’ target asset class allocations. The underperformance against the policy benchmark was almost entirely attributable to poor performance by IPERS’ active equity managers.
IPERS’ 2.15 percent return did not meet the actuarial assumed investment return of 7.50 percent, but did exceed the annual rate of inflation, as measured by the Consumer Price Index, which was 1.01 percent for the fiscal year. IPERS’ annual investment return was also far behind the 11.70 percent estimated return of its liabilities, based on a market-valued liability proxy developed by IPERS and its investment consultant, Wilshire Associates.
IPERS’ real estate program had the highest investment return for the fiscal year at 15.71 percent, followed by the private equity portfolio, which produced a return of 6.72 percent for the fiscal year. IPERS’ core-plus fixed-income program returned 5.92 percent, U.S. TIPS earned 3.83 percent, and credit opportunities (high-yield and emerging market bonds) returned 2.84 percent for the fiscal year. The lowest-performing assets in the IPERS portfolio for the fiscal year were other real assets (investments in timberland and energy-related master limited partnerships) with
a –10.75 percent return, international equities with a –10.27 percent return, and U.S. equities with a –0.28percent return for the fiscal year.
The following tables provide a historical perspective of IPERS’ investment returns and performance over the last ten years. IPERS’ net-of-fees investment returns are shown for the total portfolio and for each asset class over various time periods. For comparison purposes, the benchmark for each asset class is also shown.
The IPERS Trust Fund’s annualized investment returns for the 15-, 20-, 25-, and 30-year periods ended June 30, 2016, were 6.62 percent, 7.85 percent, 8.43 percent, and 8.64 percent, respectively. The annual investment returns for the IPERS Trust Fund for each of the past 30 years are shown in the Statistical section.
The total return an investment portfolio achieves over the long term is largely determined by the level of risk that the investor is willing to accept. In general, the greater the risk, the higher the return has to be over long time periods to compensate the investor for accepting that risk. A pension fund’s willingness to accept additional risk is often the result of its need to achieve or maintain an actuarially sound funded status. Given the disparities in funding levels and the resulting differences in asset allocation that exist among pension funds, it is often difficult, if not impossible, to make a meaningful comparison of a pension system’s investment performance based solely on returns.
2016 2015 2014 3-YEAR 5-YEAR 10-YEAR
20
15
10
5
0Rate
of r
etur
n (%
)
Investment Performance SummaryFor the Periods Ended June 30
*A benchmark composed of market indexes with weightings reflective of IPERS’ asset allocation targets.**Trust Universe Comparison Service (TUCS) Public Funds with Total Market Value Greater than $1 billion.Note: 3-, 5-, and 10-year results are annualized returns.
IPERS’ portfolio, net of fees Policy benchmark* Large public fund median**
15.8
8%
15.3
6%
17.4
4%3.96
%
3.51
%
3.43
%
7.17
%
7.11
%
7.02
%
7.06
%
7.40
%
6.96
%
6.31
%
6.71
%
5.98
%
2.15
%
2.89
%
0.97
%

54 INVESTMENTS IPERS Comprehensive Annual Financial Report 2016
Rates of ReturnFor Periods Ended June 30, 20161
Annualized Returns (%)Asset Class 1-Year 3-Year 5-Year 10-Year Total FundIPERS 2.15 7.17 7.06 6.31 Policy benchmark2 2.89 7.11 7.40 6.71 CPI + 3 percentage points 4.01 4.06 4.32 4.74 Actuarial assumed investment return 7.50 7.50 7.50 7.50 TUCS Public Funds > $1 billion universe median 0.97 7.02 6.96 5.98 Domestic equityIPERS –0.28 10.62 11.29 6.24 Wilshire 5000 2.96 11.26 11.64 7.46 International equityIPERS –10.27 1.79 0.52 2.02 Custom benchmark –9.80 1.62 0.56 2.33 Core-plus fixed incomeIPERS 5.92 4.26 4.19 5.49 Custom benchmark 5.82 4.20 4.01 5.30 Credit opportunitiesIPERS 2.84 3.93 5.29 6.75 Custom benchmark 3.96 4.57 5.41 6.99 Private equity/debt3
IPERS 6.72 14.00 12.43 12.37 Custom benchmark 6.72 13.36 13.47 9.66 Real estateIPERS 15.71 12.90 11.57 6.69 Custom benchmark 13.74 12.57 12.18 8.07 U.S. TIPS composite4
IPERS 3.83 2.00 2.22 NA Custom benchmark 3.84 1.97 2.64 NA Other real assets5
IPERS –10.75 2.29 NA NA Custom benchmark –10.68 –1.21 NA NA CashIPERS 0.31 0.19 0.20 1.41 U.S. Treasury bills 0.19 0.09 0.09 1.04 1 All returns are time-weighted returns. All returns beyond one year are annualized.
2 The policy benchmark on June 30, 2016, consisted of 24 percent Wilshire 5000, 16 percent MSCI ACWI ex U.S., 28 percent Barclays Universal, 5 percent Barclays U.S. TIPS, 1 percent Treasury bills, 5 percent Citigroup High-Yield Cash-Pay Capped, 11 percent IPERS private equity portfolio, 2 percent custom benchmark for other real assets, and 8 percent of a weighted benchmark consisting of 75 percent NCREIF Property index and 25 percent Wilshire REIT index. The composition of the policy benchmark has changed over the 10-year period.
3 Private equity/debt portfolio returns and benchmark returns are provided here as time-weighted returns to allow comparison to the time-weighted returns used for other asset classes. However, the more appropriate performance measurement for the private equity asset class is a dollar-weighted or internal rate of return (IRR) calculation over long periods of time, usually many years. Note that effective Oct. 1, 2013, the private equity component of the policy benchmark changed from Wilshire 5000 + 3 percentage points to the return of the private equity portfolio itself. The change was made in recognition of the very long-term nature of private equity, the lack of investable benchmarks for the asset class, and the ineffectiveness of time-weighted returns to measure the performance of private equity. See the Private Equity/Debt section of this report for a discussion of the private equity/debt portfolio’s performance using IRRs.
4Initial funding for this asset class occurred in the fourth quarter of 2010.5Initial funding for this asset class occurred in the second quarter of 2012.
A more meaningful peer comparison can be made if returns are compared on the basis of how much return was earned for each unit of risk taken, where risk is measured by the volatility (standard deviation) of returns.
The following graph provides a comparison of IPERS’ investment return per unit of risk taken for the last five years against the TUCS Universe of Public Funds with Assets Greater than $1 billion. The vertical line represents the median level of risk experienced by this universe of funds. The horizontal line represents the median rate of return earned by the group of funds. As shown in the graph, the return on IPERS’ investments for the five years ended June 30, 2016, was slightly greater than the median large public pension fund return, but it was earned with less risk than the median large public pension fund.
Risk vs. Total ReturnPublic Funds Greater than $1 billion5 Years Ended June 30, 2016
Domestic Equity At June 30, 2016, 24.31 percent of IPERS’ total portfolio was invested in domestic equities (U.S. stocks). The total net fair value of the domestic equity portfolio was $6.871 billion. The portfolio is widely diversified across various equity market sectors and industries. The IPERS domestic equity portfolio has three components:
PASSIVE EQUITY. The passive component is divided into large-cap and small- to midcap strategies for management purposes and consists primarily of investments in commingled index funds, index futures, and short-term securities. The return objective for each passive strategy is to track, within a certain range, the returns of a broad market index. The passive component is designed to add diversity to the overall
2 4 6 8 10 12 14 16 18 20
14
12
10
8
6
4
2
Median Fund Return
Med
ian
Fund
Ris
k
Risk (%)
Annu
alize
d re
turn
(%)
IPERS Fund

54 INVESTMENTS IPERS Comprehensive Annual Financial Report 2016 IPERS Comprehensive Annual Financial Report 2016 INVESTMENTS 55
2016 2015 2014 3-YEAR 5-YEAR 10-YEAR
portfolio while complementing the active investment styles of IPERS’ other domestic equity portfolios. The passive component constitutes an efficient, low-cost means of obtaining market exposure to the domestic stock markets.
ACTIVE EQUITY. An actively managed portfolio consists primarily of large-capitalization stocks. For management purposes, the portfolio is divided among separate strategies that focus on different investment styles: a value portfolio, which focuses on companies undervalued relative to their prospective dividend and earnings growth; a growth portfolio, which focuses on companies whose earnings are expected to grow at rates exceeding that of the general economy; and a core portfolio, which seeks to add value across all sectors through stock selection. Each investment strategy is expected to exceed an appropriate style benchmark over a full market cycle.
PORTABLE ALPHA. Traditional active equity strategies seek to produce returns in excess of the market (known as “alpha”) through sector and stock
selection. However, these traditional active strategies have historically produced mediocre excess returns, usually with a lot of volatility. This is generally because the U.S. equity market is the most efficient market in the world, making it very difficult for the average active stock manager to consistently beat the market return. IPERS’ utilization of portable alpha strategies within the domestic equity portfolio is an effort to improve the return of the portfolio without significantly increasing the risk. Portable alpha strategies attempt to achieve better risk-adjusted returns by blending excess returns (alpha) from a skillful manager, regardless of the asset class where the alpha may be achieved, with the return of any specified market index. Portable alpha strategies should work as long as (1) skillful managers exist and can be identified, (2) the alpha is not highly correlated to the market returns, and (3) derivatives are available that can replicate market returns at a low cost. The concept is that alpha is no longer constrained to the asset class—IPERS can look for alpha anywhere, and then use low-cost derivatives or index funds to obtain the required market exposure so the System can maintain its strategic asset allocation targets. The portable alpha program was eliminated within the domestic equity program at the end of FY2016, but will be reestablished as an overlay on IPERS’ 1 percent allocation to cash in fiscal year 2017.
For the year ended June 30, 2016, IPERS’ domestic equity portfolio delivered a return of –0.28 percent, compared to 2.96 percent for its benchmark, the Wilshire 5000 index. Significant underperformance by most of the active equity investment managers during the calendar quarter ended March 31, 2016, was the reason the domestic equity portfolio underperformed its benchmark for the fiscal year.
Domestic Equity PerformanceFor Periods Ended June 30
Note: 3-, 5-, and 10-year results are annualized returns.
IPERS’ portfolio, net of fees Wilshire 5000
25
20
15
10
5
0
–5
24.6
3%
24.9
2%
8.93
%
7.09
%
10.6
2%
11.2
6%
11.2
9%
11.6
4%
6.24
%
7.46
%
Rate
of r
etur
n (%
)
Domestic Equity PortfolioJune 30, 2016
Portable alpha
1%Passive equity
44%
Active equity55%
–0.2
8% 2.96
%

56 INVESTMENTS IPERS Comprehensive Annual Financial Report 2016
International Equity At June 30, 2016, the international equity portfolio had a net fair value of $4.447 billion, representing 15.73 percent of the total IPERS portfolio. IPERS’ international equity portfolio is composed primarily of common stocks or equity commingled funds, foreign exchange contracts, and cash. The portfolio assets are allocated across many regions, countries, industries, and securities for diversification purposes. Regional weights are maintained in the same proportions as reflected in the MSCI All Country World ex U.S. asset class benchmark. The international equity portfolio has two components:
International Equity PortfolioJune 30, 2016
ACTIVE EQUITY. This component is an actively managed diversified portfolio consisting primarily of equity securities issued by foreign companies in both developed and emerging countries. For purposes of investment management, a regional approach is used to invest in these international markets. The active equity portfolio’s performance objective is to exceed the return of the MSCI All Country World ex U.S. index.
PASSIVE EQUITY. This component is a passively managed diversified portfolio consisting of commingled index fund investments in Canadian, European, EAFE (European, Australasian, and Far East), and global emerging market countries’ corporate equity securities. The objective of the passive equity portfolios is to track the performance of the respective MSCI indexes for each region.
All developed and international equity markets suffered moderate to significant drawdowns in FY2016. Ongoing concerns over future economic growth in China, along with volatile oil prices and concerns over central banks’ potential monetary actions were key drivers of the negative returns experienced. On a regional basis, Canada and its commodity-driven economy suffered only a –6.26 percent return in FY2016 while the emerging market region fell by 12.05 percent. The potential for rising interest rates, along with a sluggish global economy, drove the negative returns in emerging markets. The international equity market returned –9.80 percent, as measured by the MSCI All Country World Free ex U.S. index in U.S. dollars, for
International Equity PerformanceFor Periods Ended June 30
Note: 3-, 5-, and 10-year results are annualized returns.
2016 2015 2014 3-YEAR 5-YEAR 10-YEAR
IPERS’ portfolio, net of fees Custom benchmark
25
20
15
10
5
0
–5
–10
–15
22.9
4%
22.1
8%
–4.4
0%
–4.8
5%
1.79
%
1.62
%
0.52
%
0.56
%
2.02
%
2.33
%
Rate
of r
etur
n (%
)
Pacific Basin28%
Europe45%
North America
7%
Emerging markets
20%
–10.
27%
–9.8
0%

56 INVESTMENTS IPERS Comprehensive Annual Financial Report 2016 IPERS Comprehensive Annual Financial Report 2016 INVESTMENTS 57
the fiscal year ended June 30, 2016. Concerns over the vote by the United Kingdom to exit the European Union instilled a significant amount of fear in the international investment community.
IPERS’ international equity portfolio modestly trailed its benchmark in fiscal year 2016, returning –10.27 percent versus –9.80 percent for the benchmark. Strong overall stock selection by IPERS’ active emerging market manager and some active managers in the developed market mandates were overshadowed by other active managers’ decisions in the European and Pacific regions. The more systematically driven managers within the European and Pacific regional portfolios were able to outperform their comparatively traditional fundamental counterparts during FY2016. At June 30, 2016, the portfolio’s respective 3- and 5-year returns of 1.79 and 0.52 percent were in line with the 1.62 and 0.56 percent recorded for the asset class’s composite benchmark over the same time periods.
Public Equity Portfolio: Top Ten Holdings The top ten holdings within the public equity portfolio (domestic and international combined) at June 30, 2016, follow. The listing does not include the fair value of units held in commingled fund investments. A complete listing of the holdings, including commingled fund holdings, is available upon request.
Ten Largest Holdings at June 30, 2016
Fair Value ($000)
% of Total
Amazon.com, Inc. $ 55,764 0.99Apple, Inc. 54,105 0.96Facebook, Inc. 53,317 0.94Microsoft Corporation 47,568 0.84Simon Property Group, Inc. 40,782 0.72Bristol-Myers Squibb Company 40,507 0.72Wells Fargo & Company 34,405 0.61Comcast Corporation 33,112 0.58Enterprise Products Partners, LP 33,014 0.58Nike, Inc. 32,539 0.58
Total $425,113 7.52
Fixed Income IPERS has a significant allocation to fixed-income securities, with a target asset allocation of 28 percent to core-plus fixed-income securities and 5 percent to credit opportunities securities. At fiscal year-end, IPERS’ core-plus portfolio was 28.05 percent of total Fund assets and the credit opportunities bond portfolio was 5.17 percent of total Fund assets. The total return for the consolidated fixed-income portfolio (core-plus and credit opportunities portfolios combined) for the year ended June 30, 2016, was 5.49 percent. The consolidated fixed-income portfolio fair value was $9.391 billion and the average bond rating for the portfolio was A. IPERS’ fixed-income portfolio has two main components:
CORE-PLUS FIXED INCOME. The objective of the core-plus fixed-income portfolio is to generate a return above the return of the core fixed-income market. Approximately 10 percent of the core-plus portfolio is dedicated to a passively managed “core” investment in an index fund designed to earn the return of the Barclays U.S. Aggregate index (Aggregate index), an index consisting of high-quality U.S. investment-grade fixed-income securities. The remainder of the core-plus portfolio is actively managed with the objective of exceeding the return of the Barclays U.S. Universal index (Universal index), net of fees, over a full market cycle. The Universal index is a broader index, consisting of the core Aggregate index, plus other fixed-income sectors available to U.S. investors, such as high-yield bonds, dollar-denominated emerging market debt, and eurodollar bonds.
The core-plus portfolio is a diversified portfolio of fixed-income securities, utilizing cash and cash equivalents, forward foreign exchange contracts, swaps, currency options, financial futures, government and government agency bonds, eurobonds, nondollar bonds, nonconvertible preferred stock, options on fixed-income instruments, mortgage-backed bonds, corporate bonds, commercial mortgage-backed securities, private placement corporate bonds, and asset-backed securities. The actively managed portion of the core-plus portfolio is expected to have interest rate sensitivity similar to the Universal index, and be diversified by industry, sector, and security issuers.
The fixed-income market provided solid returns for fiscal year 2016 as interest rates fell significantly. This was partially offset by widening credit spreads over the fiscal year due to market weakness in early 2016. The market recovered somewhat by the end of the

58 INVESTMENTS IPERS Comprehensive Annual Financial Report 2016
fiscal year and investors were generally rewarded for investing in credit sectors. According to the Barclays index returns, the Treasury sector generated a return of 6.22 percent, while the U.S. credit sector provided a return of 7.55 percent and the U.S. corporate high-yield sector generated a return of 1.62 percent. Emerging market debt securities returned 10.31 percent, according to the J.P. Morgan EMBI Global index. IPERS’ core-plus fixed-income portfolio return of 5.92 percent slightly outperformed the Barclays Capital U.S. Universal index return of 5.82 percent for the fiscal year ended June 30, 2016.
Core-Plus Fixed-Income PortfolioJune 30, 2016
CREDIT OPPORTUNITIES FIXED INCOME. The objective of the credit opportunities fixed-income portfolio is to enhance the long-term returns of the Fund, to provide current income, and to provide diversification benefits. Approximately two-thirds of the credit opportunities portfolio is invested in high- yield securities, while approximately one-third is invested in emerging market debt securities.
IPERS’ credit opportunities fixed-income portfolio generated a return of 2.84 percent for fiscal year 2016 versus its custom benchmark return of 3.96 percent. The high-yield portion of the portfolio provided a return of 0.60 percent versus the Citigroup High-Yield Cash-Pay Capped index return of 0.88 percent. The emerging market debt portion of the portfolio generated a return of 8.53 percent through June 30, 2016, underperforming the J.P. Morgan EMBI Global index return of 10.31 percent over the same time period.
Credit Opportunities Fixed-Income PortfolioJune 30, 2016
Core-Plus Fixed-Income PerformanceFor Periods Ended June 30
Note: 3-, 5-, and 10-year results are annualized returns.
IPERS’ portfolio, net of fees Custom benchmark
2016 2015 2014 3-YEAR 5-YEAR 10-YEAR
10
5
0
5.22
%
5.20
%
1.68
%
1.61
% 4.19
%
4.01
%
5.49
%
5.30
%
Rate
of r
etur
n (%
)
Corporates36%
Government/agency
28%
Utilities 4%Mortgages
19%
Cash 1%
ABS 4%
Non-U.S. 3%
Miscellaneous4%
Municipals1%
BB41%
B31%
Other9%
BBB14%
CCC 5%
5.92
%
5.82
%
4.26
%
4.20
%

58 INVESTMENTS IPERS Comprehensive Annual Financial Report 2016 IPERS Comprehensive Annual Financial Report 2016 INVESTMENTS 59
Credit Opportunities Fixed-Income PerformanceFor Periods Ended June 30
Note: 3-, 5-, and 10-year results are annualized returns.
Fixed-Income Portfolio: Top Ten Holdings The top ten holdings within the consolidated fixed-income portfolio (core-plus and credit opportunities combined) at June 30, 2016, are illustrated below. The listing does not include the fair value of units held in commingled fund investments. A complete listing of the holdings, including commingled fund holdings, is available upon request.
Ten Largest Holdings at June 30, 2016
Fair Value ($000)
% of Total
U.S. Treasury note—1.125%, 06/30/21 $118,987 1.33
U.S. TIPS—0.375%, 7/15/25 107,102 1.20
U.S. TIPS—0.125%, 4/15/20 94,851 1.06
U.S. TIPS—0.125%, 7/15/24 85,002 0.95
U.S. TIPS—0.375%, 7/15/23 81,765 0.91
U.S. Treasury note—1.375%, 05/31/21 74,839 0.84
U.S. TIPS—0.125%, 4/15/19 73,236 0.82
U.S. Treasury bond—2.875%, 5/15/43 63,877 0.71
U.S. Treasury note—0.750%, 10/31/17 62,591 0.70
U.S. Treasury note—0.875%, 5/31/18 60,341 0.67
Total $822,591 9.19
Private Equity/Debt At June 30, 2016, IPERS’ private equity/debt portfolio had a fair value of $3.269 billion, representing 11.57 percent of the total IPERS portfolio. From the inception of the private equity/debt portfolio through June 30, 2016, the System has committed $9.752 billion to 269 partnerships and one fund-of-one investment. During fiscal year 2016, IPERS committed a total of $739.9 million to the fund-of-one investment. At June 30,
2016, commitments of $2.175 billion remained to be called for investment.
IPERS began investing in private equity in 1985 and has, since January 1, 1993, utilized the services of a full-discretion investment management firm, Pathway Capital Management, LLP, to select partnerships and manage the portfolio of private equity funds. Beginning January 1, 2014, IPERS began utilizing a new structure for private equity investments by creating a fund-of- one partnership (Pathway Private Equity Fund XXV) with Pathway. The fund-of-one investment structure is expected to reduce IPERS’ operational burden while allowing IPERS to more efficiently invest in secondary and co-investment opportunities. The new structure did not result in any changes to Pathway’s existing contract, including fee arrangements.
IPERS seeks to minimize the risk associated with private equity by investing in a variety of top-tier partnerships with different investment styles and objectives. The portfolio is also diversified by industry focus, geographic location, and, most importantly, time, which means that capital is committed to partnerships over the full course of the business cycle and not concentrated in any one year.
IPERS’ goal for the private equity/debt portfolio is to exceed the internal rate of return (IRR) of the Wilshire 5000 index by 3 percentage points (net of investment management fees) over rolling 10-year periods. The internal rate of return is used because private equity investments are generally illiquid and cash inflows and outflows can be controlled by the general partner of the private equity partnership, making time-weighted returns inappropriate. Private equity investments typically span ten years or more, so a longer evaluation time horizon is appropriate.
2016 2015 2014 3-YEAR 5-YEAR 10-YEAR
2016 2015 2014 3-YEAR 5-YEAR 10-YEAR
IPERS’ portfolio, net of fees Custom benchmark
10.4
7%
11.1
6%
–1.2
0%
–1.0
6%
3.93
%
4.57
%
5.29
%
5.41
%
6.75
%
6.99
%
Rate
of r
etur
n (%
) 15
10
5
0
–5
–10
2.84
%
3.96
%

60 INVESTMENTS IPERS Comprehensive Annual Financial Report 2016
The total private equity/debt portfolio returned 11.98 percent (net IRR) versus its benchmark return of 10.78 percent for the 10-year period ended June 30, 2016. Since inception in 1985, IPERS’ total private equity/debt portfolio has returned 14.08 percent, slightly underperforming the 14.62 percent asset class benchmark for private equity (Wilshire 5000 + 3 percentage points).
“Distributions to paid-in capital” (DPI) ratios, which measure the ratio of cumulative distributions to cumulative paid-in capital for the time period, are another metric for evaluating private equity performance. Since 1985, the total private equity/debt portfolio’s DPI was 1.23.
The Burgiss All Regions Private Equity Composite performance database includes data from thousands of partnerships and makes it possible to compare a portfolio to a universe of private equity partnerships that raised capital over the same time period. As explained in the Summary of Significant Accounting Policies in the Financial section of this report, IPERS utilizes a one-quarter valuation lag for its private equity/debt investments. All Burgiss information is as of October 2016, with data current for reporting periods ended March 31, 2016 (that is, it is also lagged by one quarter). Data is continuously updated and is therefore subject to change.
The following table compares the IRR and DPI of IPERS’ private equity/debt portfolio to those calculated for all private equity partnerships in the Burgiss database for the period 1985–2016. The IPERS program compares favorably for this period.
Vintage Years 1985–2016 IRR DPI
IPERS’ private equity/debt portfolio 14.08% 1.23Burgiss All Regions Private Equity Composite 13.65% 1.00
Real Estate At June 30, 2016, $2.372 billion, or 8.39 percent, of IPERS’ total portfolio at fair value was invested in various private equity real estate properties, two real estate private debt funds, and publicly traded real estate investment trusts (REITs). In FY2013, IPERS expanded its real estate program to include private real estate debt strategies. As of June 30, 2016, IPERS had funded approximately $159.4 million across the two debt funds and had remaining commitments of $91.5 million.
The real estate program serves three distinct purposes for IPERS: diversification, income production, and inflation protection. In order to mitigate risk, the real estate portfolio is diversified by both geographic location and property type, as shown in the following charts.
Real Estate PortfolioJune 30, 2016
The IPERS real estate portfolio benchmark is a blended benchmark of 75 percent NCREIF Open-End Diversified Core index and 25 percent Wilshire REIT index. For the fiscal year, IPERS’ real estate program posted a return of 15.71 percent versus the benchmark return of 13.74 percent. As with the private equity/debt portfolio, the real estate program invests in assets with long holding periods and should be evaluated over a longer time horizon. For the 10 years ended June 30, 2016, the real estate portfolio returned 6.69 percent, net of fees, versus the portfolio’s benchmark of 8.07 percent. The long-term underperformance can be explained entirely by the private portion of the real estate program, with much of it attributable to one manager that was terminated in 2012.
West34%
International2%
South21%
Midwest13%
East30%
By Property Location
Office25%
Industrial20%
Retail14%
Apartment25%
Other9%
Hotel7%
By Property Type
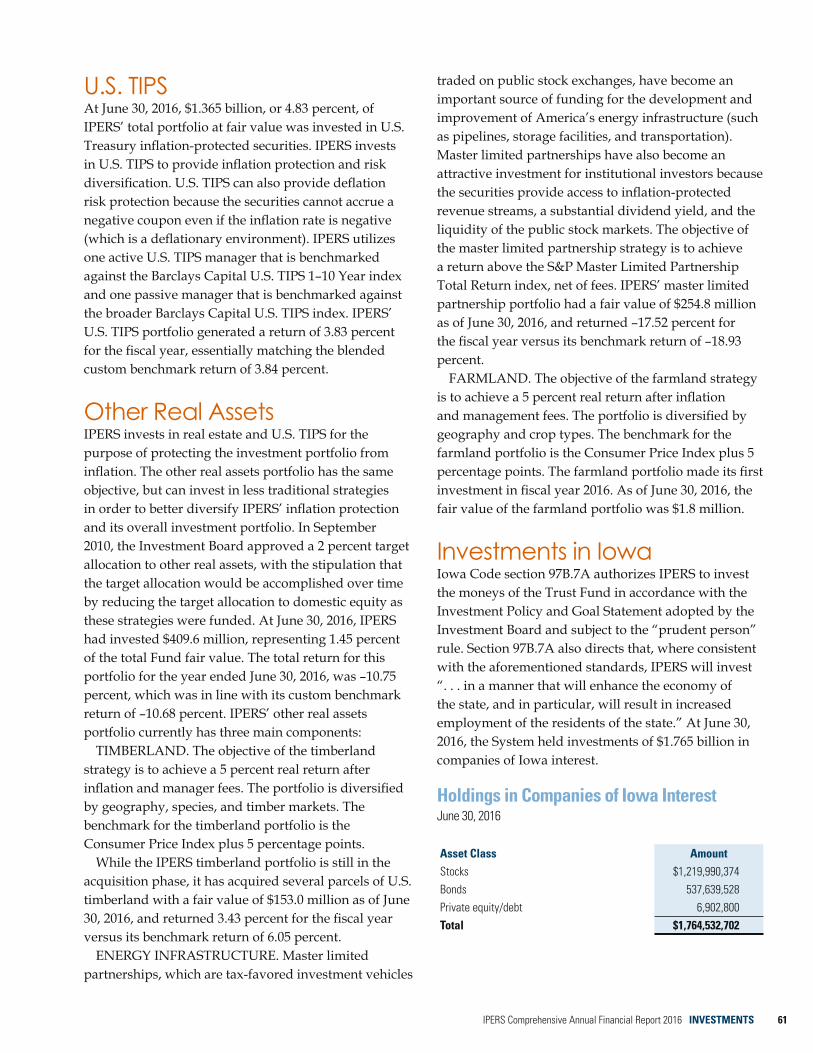
60 INVESTMENTS IPERS Comprehensive Annual Financial Report 2016 IPERS Comprehensive Annual Financial Report 2016 INVESTMENTS 61
U.S. TIPS At June 30, 2016, $1.365 billion, or 4.83 percent, of IPERS’ total portfolio at fair value was invested in U.S. Treasury inflation-protected securities. IPERS invests in U.S. TIPS to provide inflation protection and risk diversification. U.S. TIPS can also provide deflation risk protection because the securities cannot accrue a negative coupon even if the inflation rate is negative (which is a deflationary environment). IPERS utilizes one active U.S. TIPS manager that is benchmarked against the Barclays Capital U.S. TIPS 1–10 Year index and one passive manager that is benchmarked against the broader Barclays Capital U.S. TIPS index. IPERS’ U.S. TIPS portfolio generated a return of 3.83 percent for the fiscal year, essentially matching the blended custom benchmark return of 3.84 percent.
Other Real Assets IPERS invests in real estate and U.S. TIPS for the purpose of protecting the investment portfolio from inflation. The other real assets portfolio has the same objective, but can invest in less traditional strategies in order to better diversify IPERS’ inflation protection and its overall investment portfolio. In September 2010, the Investment Board approved a 2 percent target allocation to other real assets, with the stipulation that the target allocation would be accomplished over time by reducing the target allocation to domestic equity as these strategies were funded. At June 30, 2016, IPERS had invested $409.6 million, representing 1.45 percent of the total Fund fair value. The total return for this portfolio for the year ended June 30, 2016, was –10.75 percent, which was in line with its custom benchmark return of –10.68 percent. IPERS’ other real assets portfolio currently has three main components:
TIMBERLAND. The objective of the timberland strategy is to achieve a 5 percent real return after inflation and manager fees. The portfolio is diversified by geography, species, and timber markets. The benchmark for the timberland portfolio is the Consumer Price Index plus 5 percentage points.
While the IPERS timberland portfolio is still in the acquisition phase, it has acquired several parcels of U.S. timberland with a fair value of $153.0 million as of June 30, 2016, and returned 3.43 percent for the fiscal year versus its benchmark return of 6.05 percent.
ENERGY INFRASTRUCTURE. Master limited partnerships, which are tax-favored investment vehicles
traded on public stock exchanges, have become an important source of funding for the development and improvement of America’s energy infrastructure (such as pipelines, storage facilities, and transportation). Master limited partnerships have also become an attractive investment for institutional investors because the securities provide access to inflation-protected revenue streams, a substantial dividend yield, and the liquidity of the public stock markets. The objective of the master limited partnership strategy is to achieve a return above the S&P Master Limited Partnership Total Return index, net of fees. IPERS’ master limited partnership portfolio had a fair value of $254.8 million as of June 30, 2016, and returned –17.52 percent for the fiscal year versus its benchmark return of –18.93 percent.
FARMLAND. The objective of the farmland strategy is to achieve a 5 percent real return after inflation and management fees. The portfolio is diversified by geography and crop types. The benchmark for the farmland portfolio is the Consumer Price Index plus 5 percentage points. The farmland portfolio made its first investment in fiscal year 2016. As of June 30, 2016, the fair value of the farmland portfolio was $1.8 million.
Investments in Iowa Iowa Code section 97B.7A authorizes IPERS to invest the moneys of the Trust Fund in accordance with the Investment Policy and Goal Statement adopted by the Investment Board and subject to the “prudent person” rule. Section 97B.7A also directs that, where consistent with the aforementioned standards, IPERS will invest “. . . in a manner that will enhance the economy of the state, and in particular, will result in increased employment of the residents of the state.” At June 30, 2016, the System held investments of $1.765 billion in companies of Iowa interest.
Holdings in Companies of Iowa InterestJune 30, 2016
Asset Class Amount Stocks $1,219,990,374 Bonds 537,639,528 Private equity/debt 6,902,800 Total $1,764,532,702

62 INVESTMENTS IPERS Comprehensive Annual Financial Report 2016
Schedule of Brokerage Commissions PaidFiscal Year Ended June 30, 2016
PUBLIC EQUITY Amount Paid
Shares Traded
Average Per ShareBrokerage Firm
Merrill Lynch $ 556,487 93,026,779 $0.006J.P. Morgan 369,371 46,272,133 0.008Goldman Sachs & Co. 343,953 27,046,275 0.013UBS 310,327 71,266,082 0.004Morgan Stanley & Co. Inc. 304,942 44,797,411 0.007Deutsche Bank 285,342 80,347,890 0.004Citigroup 284,118 39,448,573 0.007Credit Suisse 219,701 34,838,315 0.006Instinet Corporation 127,225 70,934,064 0.002Macquarie Securities 112,194 14,234,886 0.008Barclays Capital, Inc. 100,204 8,382,334 0.012Weeden & Co. 96,666 3,747,911 0.026Liquidnet 93,462 14,042,921 0.007Jefferies & Co. Inc. 71,785 11,662,166 0.006HSBC Securities 70,315 11,783,471 0.006Wells Fargo Securities LLC 69,998 3,289,749 0.021Bernstein Sanford C & Co. 69,708 7,752,498 0.009Calyon Securities 59,253 9,848,608 0.006RBC Capital Markets LLC 57,154 3,185,076 0.018ISI Group Inc. 49,740 2,570,626 0.019Citation Group/BCC Clearing 43,889 1,173,040 0.037BTIG LLC 32,935 1,049,738 0.031BNP Paribas Securities Corporation 30,477 855,441 0.036Scotia Capital Inc. 28,003 6,146,368 0.005Credit Lyonnais Securities 26,482 2,329,121 0.011All others (includes 128 brokerage firms) 607,245 58,645,216 0.010Total Public Equity $4,420,976 668,676,692 $0.007
FUTURES AND OPTIONS Amount Paid
Contracts Traded
Average Per ContractBrokerage Firm
Goldman Sachs & Co. $ 345,589 113,991 $3.03 Morgan Stanley & Co. Inc. 333,745 152,923 2.18 J.P. Morgan 123,163 49,870 2.47 Citigroup 95,450 52,434 1.82 Newedge Group 36,314 12,184 2.98 UBS 8,386 7,384 1.14 Total Futures and Options $ 942,647 388,786 $2.42
Total Commissions $5,363,623
Note: Brokerage commissions do not include commissions paid by external managers utilizing commingled fund structures.

62 INVESTMENTS IPERS Comprehensive Annual Financial Report 2016 IPERS Comprehensive Annual Financial Report 2016 INVESTMENTS 63
Schedule of Investment FeesFiscal Year Ended June 30, 2016
Amount Paid
Average Quarterly Fair Value
Domestic equity $ 7,197,047 $ 6,680,753,250
Core-plus fixed income 6,786,364 7,812,830,250
Credit opportunities 3,092,775 1,387,767,750
U.S. TIPS 533,936 1,302,821,250
Other real assets 3,707,854 380,825,250
International equity 10,848,887 4,372,690,750
Real estate 13,554,124 2,290,178,750
Private equity/debt 6,075,798 3,253,011,500
Total $51,796,785 $27,480,878,750
Note: See Schedule 2: Schedule of Investment-Related Expenses on page 47 for fees by manager.

64 INVESTMENTS IPERS Comprehensive Annual Financial Report 2016
INVESTMENT POLICY AND GOAL STATEMENT
The following excerpt from the Iowa Public Employees’ Retirement System’s Investment Policy and Goal Statement, as adopted by the IPERS Investment Board and last revised in September 2015, includes all Policy text, but excludes the addenda referenced in the Policy. IPERS’ current investment policies are available online at www.ipers.org.
I. INTRODUCTION: IPERS’ PURPOSE AND PRINCIPLES
The Iowa Public Employees’ Retirement System (IPERS or System) was established in 1953, and isgoverned by Iowa Code chapter 97B. Since its creation, IPERS’ activities have been directed towardfulfilling the foundational purpose of the System, as described in §97B.2:
. . . to promote economy and efficiency in the public service by providing an orderly means for employees, without hardship or prejudice, to have a retirement system which will provide for the payment of annuities, enabling the employees to care for themselves in retirement, and which will improve public employment within the state, reduce excessive personnel turnover, and offer suitable attraction to high-grade men and women to enter public service in the state.
The Investment Board (Board) is the trustee of the IPERS Trust Fund (Fund). The Board’s primary mission is to establish the System’s tolerance for investment risk. The primary duties of the Board are to establish investment policy, to communicate its tolerance for investment risk, review policy implementation, and approve the retention of service providers in matters relating to the investment of IPERS’ assets. As trustee, the Board also adopts the actuarial methods and assumptions, approves the retention of service providers in matters relating to the actuarial valuation of the System’s assets and liabilities, and adopts the System’s contribution rate funding policy.
IPERS is administered through a chief executive officer, chief investment officer, chief benefits officer, and other full-time staff. The investment activities of the Board and staff are governed by the “prudent person” rules as defined in §97B.7A. The purposes of the System and the prudent person rule shall guide the Board and staff in developing this investment policy and goal statement. IPERS’ investment activities shall be executed in a manner to fulfill these goals. The investment policy and the investment strategies will be periodically reviewed to ensure they conform to §§97B.2 and 97B.7A.
The chief investment officer is responsible for the administration of the investment program pursuant to the policies of the Board. Additionally, the Board supports the retention and development of sufficient investment staff and the provision of other resources as necessary to ensure the thorough oversight and administration of each investment program undertaken by the System.
II. INVESTMENT OBJECTIVES
The Board adopts the following investment objectives for the Fund:
A. The investment activities will be designed and executed in a manner that serves the best interests ofthe members and beneficiaries of the System.
B. The investment program will strive to maintain the Board’s investment risk tolerance ascommunicated through this policy.

64 INVESTMENTS IPERS Comprehensive Annual Financial Report 2016 IPERS Comprehensive Annual Financial Report 2016 INVESTMENTS 65
C. The investment activities will be designed to provide a return on the Fund that, when coupled withthe periodic contributions of the membership and employers, will meet or exceed the benefit funding requirements of the plan over time while staying within the Board’s tolerance for risk expressed inthis policy. Of primary consideration is the maintenance of funding which is adequate to provide forthe payment of the plan's actuarially determined liabilities over time.
D. The investment activities will achieve, after the deduction of management expenses, an annualizedinvestment return that exceeds the return of the Policy Benchmark (defined in Section III.A.1 of thispolicy) over a minimum evaluation period of five years while staying within the Board’s tolerance foractive risk expressed in this policy.
III. INVESTMENT POLICY STATEMENT
IPERS’ investment policies are structured to maximize the probability that the investment goals will befulfilled. All investment policy decisions shall include liquidity and risk considerations that are prudentand reasonable under the circumstances that exist over time. IPERS’ investment policies will evolve as theinternal conditions of the Fund and the capital markets environments change.
Achievement of IPERS’ investment goals ultimately depends upon earning a sufficient return on theSystem’s investments while taking a prudent amount of risk to attain the return. Investment return iscomprised of two components known as “beta” and “alpha.” Beta return is the return generated fromexposure to a specific market or asset class. Alpha return is the excess return resulting from subtractingthe beta return from the total investment return, and is conditional upon skillful active investmentdecision making. IPERS believes that risk-adjusted investment returns can be improved by separating beta and alpha decisions in actively managed (that is, non-passive or non-index) portfolios.
Beta decisions should focus on maximizing expected market returns at prudent levels of risk. The Boardwill adopt a Policy Benchmark representing what it believes is the most efficient portfolio of marketexposures (the beta portfolio) that will meet the Fund’s mission and goals while staying within the Board’stolerance for risk. Staff, with the assistance of the System’s consultants, will implement the Board’s betadecisions in the most cost-efficient manner possible and will be responsible for maintaining the betaexposure levels within the acceptable ranges established by the Board.
Alpha decisions are expected to provide additional return without significantly increasing the overall risk of the portfolio. Alpha returns can come from selection decisions of external active managers or tacticalasset allocation and manager selection decisions of investment staff. The Board will adopt an active riskbudget that establishes its tolerance for active risk. Staff will be responsible for allocating and rebalancing active risk with the objective of maintaining the active risk budget established by the Board.
Beta and alpha decisions shall be made and evaluated according to the Risk Management Policy adoptedby the Board. (See Appendix F.) The Risk Management Policy communicates the Board’s tolerance forinvestment risk by establishing investment risk budgets for the Fund’s surplus risk and active risk.(Surplus risk takes into account the timing and potential volatility of the Fund’s liabilities.)
A. The Beta Portfolio
1. Policy Benchmark
The System adopts a Policy Benchmark that represents a mix of beta exposures that is expectedover the long term to maximize the risk-adjusted beta return to the System consistent with theBoard’s tolerance for risk. The Policy Benchmark is predicated on a number of factors, including:
a. The liabilities.
b. The relationship between the current and projected assets of the plan and the plan’s projected liabilities.

66 INVESTMENTS IPERS Comprehensive Annual Financial Report 2016
c. Expectations regarding long-term capital market returns and risks, including the impact ofcorrelations.
d. Historical distribution of returns, average volatility of returns, and correlations between assetclasses as well as liabilities.
e. The perception of future economic conditions, including inflation and interest rateassumptions, and their impacts on the System’s assets and liabilities.
The table below represents the Board’s adopted Policy Benchmark. The Policy Benchmark Weights establish the Board’s target exposure to each asset class, measured on a market value basis, while the Asset Class Ranges establish the ranges within which actual weights may fluctuate. The Policy Benchmark Return is the sum of the products of the Policy Benchmark Weights and the respective Policy Benchmark Index returns for the period. If staff utilizes futures for rebalancing or tactical allocation decisions, the gross (notional) amount of futures contracts shall be used in calculating compliance with Policy Benchmark Weights and Asset Class Ranges.
Asset Class Asset Class
Ranges
Policy Benchmark
Weights Policy Benchmark
Index Equities 51%
Domestic Equities 21%–27% 24% Wilshire 5000 International Equities 13%–19% 16% MSCI ACWI ex-U.S. Private Equity / Debt 8%–13% 11% Custom Index1
Fixed Income 33% Core Plus Fixed Income 25%–31% 28% Barclays Capital U.S. Universal Credit Opportunities 3%–7% 5% Custom Index2
Real Assets 15% Equity Real Estate 6%–10% 8% Custom Index3 U.S. TIPS 3%–7% 5% Custom Index4 Other Real Assets 0%–4% 2% Custom Index5
Cash -2%–4% 1% Merrill Lynch 91-Day T-Bill
1For purposes of calculating a Policy Benchmark return for this asset class, the custom index is the private equity/debt portfolio itself. See Private Equity/Debt section under 2. Policy Benchmark Components for explanation. 2The credit opportunities custom index for purposes of the Policy Benchmark Index is weighted 67 percent Citigroup HY Cash Pay Capped Index and 33 percent JP Morgan EMBI Global Index. 3The equity real estate custom index for purposes of the Policy Benchmark Index is weighted 75 percent NCREIF Open-End Diversified Core Index (ODCE) and 25 percent Wilshire REIT Index. 4This benchmark is defined as 50 percent Barclays Capital U.S. TIPS Index and 50 percent Barclays Capital 1-10 Year U.S. TIPS Index. 5This benchmark will be defined as specific real asset mandates are funded. See discussion under “Other Real Assets” below.

66 INVESTMENTS IPERS Comprehensive Annual Financial Report 2016 IPERS Comprehensive Annual Financial Report 2016 INVESTMENTS 67
c. Expectations regarding long-term capital market returns and risks, including the impact of correlations.
d. Historical distribution of returns, average volatility of returns, and correlations between asset
classes as well as liabilities.
e. The perception of future economic conditions, including inflation and interest rate assumptions, and their impacts on the System’s assets and liabilities.
The table below represents the Board’s adopted Policy Benchmark. The Policy Benchmark Weights establish the Board’s target exposure to each asset class, measured on a market value basis, while the Asset Class Ranges establish the ranges within which actual weights may fluctuate. The Policy Benchmark Return is the sum of the products of the Policy Benchmark Weights and the respective Policy Benchmark Index returns for the period. If staff utilizes futures for rebalancing or tactical allocation decisions, the gross (notional) amount of futures contracts shall be used in calculating compliance with Policy Benchmark Weights and Asset Class Ranges.
Asset Class
Asset Class
Ranges
Policy Benchmark
Weights
Policy Benchmark
Index Equities 51%
Domestic Equities 21%–27% 24% Wilshire 5000 International Equities 13%–19% 16% MSCI ACWI ex-U.S. Private Equity / Debt 8%–13% 11% Custom Index1
Fixed Income 33% Core Plus Fixed Income 25%–31% 28% Barclays Capital U.S. Universal Credit Opportunities 3%–7% 5% Custom Index2
Real Assets 15% Equity Real Estate 6%–10% 8% Custom Index3 U.S. TIPS 3%–7% 5% Custom Index4 Other Real Assets 0%–4% 2% Custom Index5
Cash -2%–4% 1% Merrill Lynch 91-Day T-Bill
1For purposes of calculating a Policy Benchmark return for this asset class, the custom index is the private equity/debt portfolio itself. See Private Equity/Debt section under 2. Policy Benchmark Components for explanation. 2The credit opportunities custom index for purposes of the Policy Benchmark Index is weighted 67 percent Citigroup HY Cash Pay Capped Index and 33 percent JP Morgan EMBI Global Index. 3The equity real estate custom index for purposes of the Policy Benchmark Index is weighted 75 percent NCREIF Open-End Diversified Core Index (ODCE) and 25 percent Wilshire REIT Index. 4This benchmark is defined as 50 percent Barclays Capital U.S. TIPS Index and 50 percent Barclays Capital 1-10 Year U.S. TIPS Index. 5This benchmark will be defined as specific real asset mandates are funded. See discussion under “Other Real Assets” below.
2. Policy Benchmark Components
Apart from any alpha expectations described in Section III.B., IPERS seeks to earn market returns from each asset class in the Policy Benchmark. This market exposure may be achieved by purchasing securities that comprise the respective asset classes or by purchasing derivatives designed to provide the return of a particular market. Each public market asset class has a Policy Benchmark Index that is believed to best represent the broadest market opportunity set for the respective asset class. The return on each Policy Benchmark Index is the market return (beta return) for each asset class. Domestic Equities
IPERS invests in the domestic equity market to earn an equity risk premium to enhance the long-term returns of the Fund. This asset class includes the broad market of publicly traded U.S. equities with varying characteristics related to market capitalization and investment style. The Policy Benchmark Index for Domestic Equities is the Wilshire 5000 Index.
International Equities
IPERS invests in international equities to earn an equity risk premium and to diversify the equity exposure within the Fund. The International Equities asset class includes both developed and emerging equity markets. The Policy Benchmark Index for International Equities is the Morgan Stanley Capital International (MSCI) All-Country World Index ex-U.S. (ACWI ex-U.S.) calculated gross of tax credits from dividend reinvestment.
Core Plus Fixed Income
IPERS invests in fixed income assets to provide stable income for the payment of benefit obligations and to diversify the market risk of the investment portfolio. The Core Plus fixed income market represents a global opportunity set of fixed income instruments available to U.S. institutional investors. The Policy Benchmark Index for Core Plus fixed income is the Barclays Capital U.S. Universal Index.
Credit Opportunities
IPERS has made a strategic allocation to credit opportunities in high-yield corporate bonds and emerging markets corporate and sovereign debt to enhance the long-term returns of the investment portfolio, to provide current income, and to provide diversification benefits. The Policy Benchmark Index for Credit Opportunities is a weighted custom index of 67 percent the Citigroup High-Yield Cash-Pay Capped Index and 33 percent the JP Morgan EMBI Global Index. Equity Real Estate
IPERS invests in equity real estate to provide diversification in the investment portfolio, provide some inflation protection, and for income generation. The Policy Benchmark Index for Equity Real Estate is a weighted custom index of 75 percent the National Council of Real Estate Investment Fiduciaries’ (NCREIF) Open-End Diversified Core Index (ODCE) and 25 percent the Wilshire Real Estate Investment Trust Index (Wilshire REIT). (See Appendix A for IPERS’ Real Estate Investment Policy.) Private Equity/Debt
IPERS invests in private equity/debt to enhance the investment portfolio return through long-term capital appreciation. Private equity investments are highly illiquid, generally have lock-up periods of ten years or more, and are subject to long valuation lags. IPERS seeks to be compensated for such illiquidity by earning returns substantially greater than those available from publicly traded equity markets. There is no appropriate benchmark for measuring private equity performance on a time-weighted basis over short time periods. Therefore, for purposes of

68 INVESTMENTS IPERS Comprehensive Annual Financial Report 2016
calculating a Policy Benchmark return for this asset class, the custom index is the portfolio itself. However, Private Equity/Debt will be evaluated annually against a Wilshire 5000 plus 300 basis point benchmark, but using internal rates of return and long-term evaluation periods and vintage year comparisons. (See Appendix B for IPERS’ Private Equity/Debt Investment Policy.)
U.S. TIPS
IPERS invests in U.S. Treasury Inflation Protected Securities (U.S. TIPS) to provide inflation protection and risk diversification for the investment portfolio. U.S. TIPS can also provide some deflation risk protection because the securities cannot accrue a negative coupon even if the inflation rate is negative (which is a deflationary environment). However, U.S. TIPS can introduce interest rate risk into the Fund portfolio, and IPERS will utilize some shorter duration U.S. TIPS strategies in order to mitigate some of the interest rate risk. The Policy Benchmark Index for U.S. TIPS is a weighted custom index of 50 percent the Barclays Capital U.S. Treasury Inflation Protected Securities Index and 50 percent the Barclays Capital 1-10 Year U.S. Treasury Inflation Protected Securities Index.
Other Real Assets
IPERS invests in other real assets to provide inflation protection for the investment portfolio. Other real assets may consist of commodities, farmland, timberland, private energy partnerships, public energy partnerships (aka master limited partnerships (MLPs)), or infrastructure investments where principal or future income streams are protected from inflation. The Policy Benchmark Index for Other Real Assets will be created based upon the type of mandate that is funded, and will be revised as additional real asset strategies are added to the portfolio over time. The Policy Benchmark allocation for Other Real Assets shall not take effect until a mandate is funded in this asset category, and the allocation percentage shall be adjusted quarterly to reflect the actual investment in the asset class until such time that the target Policy Benchmark Weight has been achieved. Any “unused” allocation prior to reaching the target weight will remain in the target weight for Domestic Equities. Once the target weight for Other Real Assets has been achieved, the Policy Benchmark Weight will be two percent for future periods.
Cash
Cash, for the purpose of applying the Policy Benchmark Weights and Asset Class Ranges, is limited to funds available prior to distribution to investment managers and the amount reserved to pay near-term benefits and administrative costs. The Policy Benchmark Index for Cash is the Merrill Lynch 91-Day Treasury Bill Index.
3. Policy Benchmark Rebalancing
Because of the fluctuation of market values, and the effect of cash flows in and out of the System, the actual weights of each asset class can differ from the target weights established in the PolicyBenchmark. In recognition of this, the Board has also adopted Asset Class Ranges for each assetclass, and positioning within a specified Asset Class Range is acceptable and constitutescompliance with the Policy Benchmark. It is the responsibility of IPERS staff to keep actualweights within the Asset Class Ranges. However, it is anticipated that the Board will makeperiodic revisions to the Policy Benchmark, and it is recognized that in some cases it may beprudent to allow an extended period of time to fully implement revisions to the PolicyBenchmark. In the absence of suitable opportunities within a specific market, the funds shall bedirected to the other components within the ranges specified. The Board and staff will regularlymonitor the actual asset allocation versus the Policy Benchmark Weights and evaluate anyvariations. In addition, it is acknowledged that market conditions or circumstances beyondIPERS’ control may lead to asset class weightings being temporarily out of their target ranges,especially as those ranges relate to illiquid asset classes.

68 INVESTMENTS IPERS Comprehensive Annual Financial Report 2016 IPERS Comprehensive Annual Financial Report 2016 INVESTMENTS 69
B. The Alpha Portfolio
Alpha is the difference resulting from subtracting a beta return from a portfolio’s actual return. IPERSbelieves that positive alpha can be consistently earned by selecting skillful managers and applyingthat skill to a broad set of investment strategies. By employing a combination of strategies that havelow return correlation with one another, exhibit low correlation with beta returns and highercorrelation to liability returns, IPERS believes that consistent positive active returns (net of all fees)can be achieved at low levels of additional risk to the total fund.
Various strategies may be employed in the creation of a diversified alpha portfolio. Factors that willdetermine the alpha portfolio composition will include market structure and dynamics, the estimated degree of correlation between a strategy’s performance and the Policy Benchmark, the breadth anddepth of available active managers, and contribution to the active risk budget. Traditional long-onlymanagement strategies may continue to be utilized in order to capture alpha, while portable alphastrategies, which allow alpha earned in other asset classes to be transported to a particular asset class or the total fund as an overlay through the use of derivatives, may also be utilized. In reviewing theeffectiveness of alpha portfolio decisions, it is understood that a sufficient time frame is necessary tomeasure results through market cycles. A five-year period will generally be used to judge the resultsof alpha portfolio decisions.
The Board acknowledges that portable alpha strategies introduce a component of leverage into theportfolio, since market exposure is obtained through the use of derivatives while cash not needed tomaintain the derivatives position is invested in alpha-producing assets. However, it is believed that a properly constructed alpha portfolio with a low correlation to the underlying beta portfolio is, froman economic perspective, equivalent to utilizing traditional long-only strategies in terms of risk andreturn.
Properly executed portable alpha strategies, which seek to apply manager skill across multiple alpha sources with low correlation to one another, can also have unique implementation risks that must becarefully monitored and managed. Some strategies can introduce high levels of financial leverage,valuation risks due to a lack of transparency, custody risks due to assets being held by prime brokers, and operational risks due to the use of complex, highly quantitative strategies. Staff will seek tomitigate these risks by employing a careful and thorough due diligence process in the evaluation and selection of reputable, experienced portable alpha managers, utilizing only separate accountsmaintained on an independent custody and administrative platform, and utilizing the services ofexperts as needed to perform due diligence on prospective portable alpha investment managers.However, it is acknowledged that it may not be possible to eliminate some implementation risksassociated with some portable alpha strategies.
The alpha portfolio will be structured to meet an active risk budget established and defined in theRisk Management Policy that reflects the Board’s tolerance for active risk. The Board and staff willannually evaluate the alpha portfolio against the Active Risk Target and determine if any actionsshould be taken to address any deviations.
It shall be the staff’s responsibility to manage the alpha portfolio’s active risk. Staff will monitor active risk on an ex-ante and ex-post basis, and shall have the discretion to take action to lower or increasethe ex-ante active risk if necessary to stay within the Active Risk Budget established in the RiskManagement Policy. Because of the volatility of short-term alpha returns, positioning within thespecified Active Risk Range is acceptable and constitutes compliance with the policy. It is anticipated that the Board will periodically revise the active risk budget, and it is acknowledged that it may beprudent to allow an extended period of time to fully implement revisions to the active risk budget.

70 INVESTMENTS IPERS Comprehensive Annual Financial Report 2016
C. Investment Management
IPERS will select and utilize external investment management firms or funds to manage each of itsportfolio accounts. Staff has authority to buy and sell exchange-traded futures contracts and exchange traded funds (ETFs) for the purpose of implementing risk management or tactical asset allocationstrategies. The System will also utilize the services of investment management consultants for thepurpose of performance review, asset allocation studies, risk budgeting, manager selection screening, and topical studies.
1. Manager/Consultant Utilization and Selection
The selection of the managers and consultants is accomplished in accordance with the applicable provisions of Iowa Code §§ 8.47 and 8.52, and the administrative rules adopted thereunder,except as otherwise provided in duly issued waivers by the ruling authority. The System willprocure manager and consultant services with adequate attention to the principles of competition and reasonableness of costs, and will wherever feasible compensate the external managersthrough the use of performance-based fees.
Each investment manager and consultant shall function under a formal contract that delineatestheir responsibilities and the appropriate risk management and performance expectations.
2. Manager Discretion
The investment managers shall have full discretion to direct and manage the investment andreinvestment of assets allocated to their accounts in accordance with this document, applicablefederal and state statutes and regulations, and the executed contracts. Further, the investmentmanagers shall have full discretion to establish and execute trades through accounts with one ormore securities broker/dealers as the managers may select. The investment managers willattempt to obtain the “best available price and most favorable execution” with respect to all of the portfolio transactions. In accordance with this principle, broker/dealers with an office in Iowawill be given an opportunity to compete for various transactions.
The Board and staff will consider the comments and recommendations of the managers andconsultants in conjunction with other available information in making informed, prudentdecisions.
3. Manager Evaluation
The investment managers under contract with the System will meet periodically with theInvestment Board and/or staff for the purpose of reviewing the investment activities of theirassigned portfolio, its performance, the investment strategy that governs its management, and the marketplace in which it exists. Such meetings may be conducted at the offices of the investmentfirms. A detailed discussion of IPERS’ manager evaluation policies and procedures is provided in the IPERS Manager Monitoring and Retention Policy. (See Appendix C for IPERS’ InvestmentManager Monitoring and Retention Policy.)
4. Manager Diversification
The investment manager structure shall be diversified to reduce the risk of having too many ofIPERS’ actively managed investment assets with one firm or having IPERS’ assets comprise toomuch of a firm’s actively managed investment strategy. The following diversification limits shallapply:
a. An investment manager’s combined responsibility for actively managed investmentstrategies on behalf of IPERS shall not exceed 15 percent of the Fund’s total assets;

70 INVESTMENTS IPERS Comprehensive Annual Financial Report 2016 IPERS Comprehensive Annual Financial Report 2016 INVESTMENTS 71
b. IPERS’ investment in an investment manager’s actively managed strategy shall not exceed 20 percent of the manager’s total assets under management in that strategy. However, the chief investment officer shall have discretion to determine what types of similar products offered by a manager can be included in the definition of “actively managed strategy” for purposes of this calculation.
For purposes of this section, enhanced indexing, equity real estate, and private equity are considered to be actively managed investment strategies.
The Board acknowledges that there may be times when manager diversification limits could be exceeded due to manager terminations, abrupt changes in market conditions, or decisions made by other clients of a manager. In such times, staff shall inform the Board of the situation and shall attempt to rebalance to the diversification limits as soon as prudently possible, with periodic progress reports to the Board.
D. Cash Management
Staff will ensure that adequate cash is available for the payment of benefit obligations and the funding of investments, and any cash held pending such uses shall be temporarily invested in the custodian’s Short Term Investment Fund (STIF) or other suitable short-term investment vehicle authorized by the Board. Cash held within the accounts of investment management firms will be managed in accordance with the guidelines established in the contractual agreement with each firm. In the case of cash denominated in a currency other than the U.S. dollar (USD), it shall be the responsibility of the investment management firm to repatriate or obtain foreign currency for any non-USD cash flows in its account. Investment managers are expected to obtain best execution on all foreign exchange transactions. IPERS staff shall have responsibility for repatriating or funding any non-USD cash flows from the Private Equity/Debt program, and will use an agency broker to attempt to obtain best execution on those foreign exchange transactions.
E. Currency Risk Management
Investment in non-USD denominated assets introduces the risk of loss due to currency fluctuations. It shall be the responsibility of each investment manager to manage any currency risk within its portfolio according to the terms of the contract between the manager and the System. The objective of currency management is not the elimination of all currency risk, but rather the prudent management of risks associated with investing in currencies or in assets that are not denominated in U.S. dollars.
F. Custody
The Treasurer of the State of Iowa is the custodian of the Fund. The Treasurer will hold the System’s assets in a custody/recordkeeping account in a master custody bank located in a national money center and in the international subcustodian banks under contract to the custodian bank. The Treasurer shall consult with the Board prior to selecting the master custody bank. A formal written agreement shall be established between the Treasurer of State and any third-party custodian. The custodian bank agreement shall be reviewed periodically by the staff and Investment Board.
G. Securities Lending
The primary objective of the securities lending program shall be to safely generate income from lending the System’s securities to qualified borrowers. The program will only utilize lending agents that agree to indemnification provisions in the event of a counterparty insolvency.
Cash collateral received against loans of securities shall be prudently invested in a low-risk investment strategy that invests only in: (a) commingled funds or money market funds managed in accordance with the regulations and criteria specified in Rule 2(a)(7) promulgated under the Investment Company Act of 1940, or (b) separate accounts that have investment guidelines identical to those required of a 2(a)(7) fund, or (c) overnight repurchase agreements collateralized with

72 INVESTMENTS IPERS Comprehensive Annual Financial Report 2016
obligations issued by the United States Treasury or obligations issued by agencies or government-sponsored entities of the United States government. The key investment objectives for investing the cash collateral shall be to: (a) safeguard principal; (b) maintain adequate liquidity; and (c) consistent with the foregoing objectives, optimize the spread between the collateral earnings and the rebate paid to the borrower of securities.
The Investment Board may select its own securities lending agent or authorize the Treasurer of the State of Iowa to manage the securities lending program in accordance with the risk guidelines established herein. Staff shall execute a formal written agreement between any lending agent (or the Treasurer, as the case may be) and IPERS stipulating the risk parameters and performance benchmarks of the program, which shall be in accordance with these guidelines. The securities lending program will be annually reviewed by the Board, and the ongoing operation of such program shall be subject to periodic reauthorization by the Board.
H. Proxy Voting
IPERS acknowledges that proxies are a significant and valuable tool in corporate governance andtherefore have economic value. The System commits to managing its proxy voting rights with thesame care, skill, diligence, and prudence as is exercised in managing its other valuable assets. Asresponsible fiduciaries, the System’s staff, its designated voting agents, its investment managers, and the trustees or agents of the System’s collective, common, or pooled fund investments will exercisetheir proxy voting rights in the sole interest of the System’s members and in accordance with theapplicable statutes.
The voting rights of individual stocks held in any separate account, or any collective, common, orpooled fund will be exercised by the manager, trustees, or agents of said account or fund inaccordance with their own proxy voting policies, upon the review and determination by the Systemthat such proxy policies fulfill the above-stated mandates.
I. Commission Recapture and Soft-Dollars
The System encourages, but does not require, certain of its active equity managers to direct brokerage transactions to commission recapture brokers to the extent these brokers can provide best execution.Best execution is defined as achieving the most favorable price and execution service available,bearing in mind the System’s best interests, and considering all relevant factors. The System willmonitor on an ongoing basis the services provided by the commission recapture brokers so as toassure that the investment managers are securing the best execution of the Fund’s brokeragetransactions.
All rebates or credits from commissions paid by the System’s investment managers to the commission recapture brokers will be realized in cash and remitted directly to the Fund. It is the System’s policy to refrain from using soft- dollar credits to acquire products or services to be used in the internaladministration of the Fund. If the generation of soft-dollar credits is unavoidable in certain instances, the System will make a best effort to have the credits converted to cash and remitted directly to theFund, and, failing such conversion, will regularly monitor the managers’ expenditure of soft-dollarcredits to ensure an appropriate relationship to the management of their IPERS accounts.
J. Derivatives
The System recognizes that certain derivative instruments can be useful tools in managing portfoliorisk and in efficiently replicating cash market positions. However, the System also recognizes thatderivatives can introduce unique risks into the portfolio that must be controlled. The followingguidelines shall apply to the use of derivatives by the System’s managers, and are designed to provide general risk controls that apply to all managers. The System’s staff and investment consultant shallestablish specific guidelines in each manager’s contract to control the various risks associated with the use of derivatives for a particular manager and mandate. With the exception of portable alpha

72 INVESTMENTS IPERS Comprehensive Annual Financial Report 2016 IPERS Comprehensive Annual Financial Report 2016 INVESTMENTS 73
strategies, a manager is only authorized to utilize the derivative instruments permitted in this policy, and then only to the extent such usage is authorized in the manager’s contract with the System.
The System defines a derivative instrument (derivative) to be a financial instrument with a return or value that is obtained from the return or value of another underlying financial instrument. Mortgage-backed securities and asset-backed securities are not considered derivatives for the purposes of this policy.
The following is a list of categories of derivatives that are permitted under this policy.
1. Futures – Bond futures, interest rate futures, stock index futures, and currency futures that arelisted on major exchanges in the United States, Japan, France, the United Kingdom, and Germany.
2. Options – Options on stocks and bonds, index options, currency options, and options on futuresand swaps.
3. Currency forward contracts.
4. Swaps – Interest rate, currency, index, credit default, or specific security or a group of securitiesswaps.
5. Warrants – A manager is not permitted to purchase warrants separately. However, a managermay purchase securities that have warrants attached to them if such securities are permittedunder their contract. A manager may also hold warrants in its portfolio if such warrants werereceived as part of a restructuring or settlement concerning an authorized investment.
The following restrictions shall apply to any manager using derivatives in the portfolio they manage for IPERS (in addition to any other restrictions or limitations included in the manager’s contract):
1. Under no circumstances shall a manager use derivatives for the purpose of leveraging itsportfolio.
2. Prior to utilizing any derivative, a manager shall take all steps necessary to fully understand theinstrument, its potential risks and rewards, and the impact adverse market conditions could have on the instrument and the overall portfolio, and to ensure that it has all of the operational and risk management capabilities required to prudently monitor and manage the derivative.
3. A manager utilizing over the counter, non-exchange-traded swaps or options (OTC Derivatives)shall use prudent caution in selecting counterparties, and shall have written policies in placespecifying how the manager will manage the credit risk of the counterparties. Such policies shall include, at a minimum, how the management firm will evaluate and monitor the creditworthiness of counterparties, an explanation of how the firm will determine the maximum firm-wide netmarket exposure amount to each counterparty, how the firm will monitor and enforce compliance with its credit policies, and other key terms that are required to be included in non-exchange- traded derivative contracts. Staff and IPERS’ investment consultant shall periodically reviewthese policies.
4. A manager shall not invest in OTC Derivatives with a counterparty that has a rating below “A3”as defined by Moody’s or “A-” as defined by Standard & Poor’s (S&P). Managers shall not useunrated counterparties, nor shall they use counterparties that have a “split rating” where one ofthe ratings is below A3 by Moody’s or A- by S&P. However, managers may utilize an unratedcounterparty if the manager has documentation evidencing that a parent or affiliate of thecounterparty is: (a) legally bound to cover the obligations of the counterparty, and (b) has a rating of at least A3 by Moody’s or A- by S&P. The counterparty shall be regulated in either the UnitedStates or the United Kingdom.
5. A manager utilizing OTC Derivatives in IPERS’ account shall control the counterparty credit riskof such transactions by: (a) utilizing payment netting arrangements to minimize the amount at

74 INVESTMENTS IPERS Comprehensive Annual Financial Report 2016
risk, (b) performing daily marking-to-market of derivatives contracts, and (c) requiring collateralization of net amounts owed under the contracts after meeting minimum threshold for transfers.
6. A manager shall limit the System’s exposure to counterparty defaults from OTC Derivatives bylimiting the dollar amount at risk with any counterparty (net of the value of any collateral held) tono more than 5 percent of the market value of the IPERS account for a counterparty with a ratingabove A by Moody’s or A+ by S&P, or 3 percent of the market value of the IPERS account for acounterparty with a rating of or below A by Moody’s or A+ by S&P. The limitations of thisparagraph apply only to the net exposure attributable to OTC Derivatives.
7. OTC Derivative transactions shall be executed under an International Swap Dealers Association(ISDA) agreement, or a clearing agreement in the case of a cleared swap. Collateral provided toIPERS by counterparties under a derivatives contract shall be delivered to and held by theSystem’s custodian bank, or delivered and held by a third party agent under a swap clearingagreement or a Credit Support Annex (CSA) to the ISDA agreement executed by IPERS or theinvestment manager on behalf of IPERS.
8. Managers shall reconcile cash and margin requirements concerning derivatives on a daily basiswith the System’s custodian bank or any applicable third party under a CSA or swap clearingagreement.
9. These restrictions do not apply to portable alpha strategies utilized by the System. In lieu of such restrictions, staff shall attempt to ensure that contracts with managers executing portable alphastrategies adequately address as many of the restrictions as possible while allowing thesemanagers the latitude necessary to manage a portable alpha portfolio where the alpha and betasources are in different asset classes.
10. Contracts for portable alpha portfolios will articulate the specific derivative usage allowed withinthe manager’s strategy. Additionally, the contract will incorporate the derivatives exposureparameters for that strategy. The contract will also articulate the data to be provided to IPERSstaff and consultants in order to enable sufficient monitoring and evaluation of derivativesexposures.
K. Social Investing
As fiduciaries, the IPERS Investment Board, staff, and investment managers must perform their duties for the exclusive benefit and in the best economic interest of the System’s members and beneficiaries.The System and the Board will not support investment policies or strategies which seek to promotespecific social issues or agendas through investment or divestment of IPERS’ assets. To act otherwisecould be construed as a violation of fiduciary duty and could endanger the System’s tax-exemptstatus.
L. Securities Monitoring and Litigation
IPERS has a fiduciary duty to preserve trust assets to meet the retirement promises made to itsmembers. Included in this duty is the obligation to recover investments in public securities that incur losses as a result of corporate mismanagement and/or fraud. To preserve trust assets, the Board hasadopted a securities monitoring and litigation policy to guide the System’s involvement in andmonitoring of securities litigation. (See Appendix D for IPERS’ Securities Monitoring and LitigationPolicy.)
M. Confidential Investment Information
Iowa Code §22.7 and §97B.17(2)e provide that certain records and information in IPERS’ possessionare considered confidential and thus are exceptions to Iowa’s Open Records (chapter 22) laws.Included in the exceptions is information which, if released:

74 INVESTMENTS IPERS Comprehensive Annual Financial Report 2016 IPERS Comprehensive Annual Financial Report 2016 INVESTMENTS 75
1. Could result in a loss to the System or to the provider of the information.
2. Would give advantage to competitors and serve no public purpose.
3. Would violate trade secrets which are recognized and protected by law.
While the staff shall provide the Board with all essential information about the investment program, communication of information that is confidential under the above Iowa Code provisions will be identified as such in the communication.
Iowa Code §97B.8A(5), an explicit exception to Iowa’s Open Meetings (chapter 21) laws, reinforces the need and obligation to maintain the confidentiality of such information by expressly authorizing the Board to hold closed sessions for discussion of this information.
N. Ethics
Fiduciaries of the System must exercise the highest standards of care in acting for the exclusive benefit of the plan participants. IPERS has adopted an ethics policy to govern the activities of Board members,staff, consultants, and managers as it relates to the System. (See Appendix E for IPERS’ Ethics Policy.)
O. Sudan and Iran Investment Restrictions and Divestment
Iowa Code chapters 12F and 12H require IPERS to develop lists of scrutinized companies withoperations in the Sudan and/or Iran, and to restrict its purchases of, and, under certain circumstances, to divest of holdings of publicly traded securities in any company determined to have active businessoperations in the Sudan and/or Iran. To comply with this legislative mandate, IPERS will utilize theresearch and findings of an organization recognized to be an authoritative source of information inthis area. This list will be updated quarterly. Staff will engage the companies on the scrutinizedcompanies list to determine if such companies are prohibited investments under Iowa law. Firms that are deemed to be prohibited under Iowa law will be placed on a prohibited companies list.
P. Continuing Education
The Investment Board consists of dedicated Iowans that have agreed to serve the public in the veryimportant roles of fiduciary and trustee for the Fund. The Board members have been entrusted withmaking decisions concerning complex actuarial and investment issues. However, it is recognized that Board members have varying degrees of knowledge and experience in dealing with actuarial andinvestment issues. Therefore, to facilitate the ongoing education of its members so that they mayobtain the knowledge required to make informed decisions, the Board establishes the followingcontinuing education guidelines applicable to all Board members:
1. In the first 12 months following appointment, a Board member is encouraged to attend aneducational session concerning fiduciary duties of trustees, and another educational sessionconcerning asset allocation, actuarial principles, or investment policy.
2. For the period from 12 months following appointment until the end of the Board member’sservice on the Board, a Board member is encouraged to attend at least one educational session peryear concerning any investment-related topic relevant to the Fund.
3. An educational session is defined as a conference, seminar, workshop, course, or other substantive educational activity on any investment or pension fund administration subject. If possible, staffwill attempt to make some educational sessions annually available in Iowa in order to meet theneeds of Board members’ schedules.
4. Board members are responsible for self-evaluating their educational needs and obtainingknowledge in specific-needs areas in a fiscally responsible manner. Board members are encouraged to engage the chief executive officer or IPERS investment staff to assist them in determining what educational sessions are available to meet their educational needs.

76 INVESTMENTS IPERS Comprehensive Annual Financial Report 2016
5. Board members must receive approval of the Board if they wish to attend more than twoeducational sessions in any 12-month period. This requirement applies only to educationalsessions that require out-of-state travel.
IV. RESPONSIBILITIES OF THE INVESTMENT BOARD AND STAFF
Successful management and oversight of IPERS’ investment activities require the Investment Board andstaff to have specific responsibilities, as outlined below:
A. Statutory Responsibilities
1. The Board shall annually adopt an Investment Policy and Goal Statement which is consistent withIowa Code §§97B.7A and 97B.8A.
2. The Board shall at least annually conduct a review of the investment policies and proceduresutilized by the System.
3. The Board shall at least annually conduct a public meeting to review the policies and theinvestment performance of the Fund.
4. With the approval of the Board, the Treasurer of State may conduct a program of lendingsecurities in the IPERS portfolio.
5. The Board shall review and approve, prior to the execution of a contract, the hiring of eachinvestment manager and investment consultant outside of state government.
6. The Board shall select the actuary to be employed by the System, and shall adopt the mortalitytables, and actuarial methods and assumptions to be used by the actuary for the annual valuationof assets.
7. The chief executive officer will consult with the Board prior to employing a chief investmentofficer.
8. The Board shall participate in the annual performance evaluation of the chief investment officer.
9. The chief executive officer shall consult with the Board on the budget program for the System.
10. The Treasurer of State shall consult with the Board prior to selecting any bank or other third party for purposes of investment asset safekeeping, other custody, or settlement services.
11. The Board shall consist of seven voting members and four nonvoting members as required byIowa Code §97B.8A. Four voting members of the Board shall constitute a quorum.
12. Staff shall provide advance notice to the public of the time, date, tentative agenda, and place ofeach Board meeting in compliance with Iowa Code chapter 21.
13. The Board shall set the salary of the chief executive officer.
B. Operational Responsibilities
1. Upon recommendation of the staff, consultants, or of individual Board members, the Board shall periodically and as necessary adopt changes to the Investment Policy and Goal Statement,including revisions to the Policy Benchmark targets, beta portfolio components, and active riskbudgets.
2. The Board shall review the specific types and proportions of assets being utilized inimplementing the overall policy, as established by the staff (for example, the proportion ofmortgage bonds within the Core Plus Fixed Income portfolio).

76 INVESTMENTS IPERS Comprehensive Annual Financial Report 2016 IPERS Comprehensive Annual Financial Report 2016 INVESTMENTS 77
3. The Board shall periodically review the staff’s rebalancing activities and the System’s compliance with Policy Benchmark Weights and Active Risk Targets within their designated ranges.
4. The staff shall have the authority to terminate, amend, or renew contracts with existing managers.Staff shall inform the Board in advance of its decision to terminate a manager.
5. The Board shall approve the termination of consultants and the solicitation of proposals forconsultants. The staff shall have the authority to amend or renew contracts with existing consultants.
6. If the chief executive officer, chief investment officer, chief risk officer, any investment officer, orany IPERS attorney is in possession of information which would lead a reasonable person familiar with such matters to conclude that an investment, a commitment to an investment, or a decision to engage or terminate a contracted service provider, contradicts the fiduciary duties of the party or parties having the final authority to take such actions, it is the Board’s expectation that the issue will be placed on a Board meeting agenda for review.
7. The Board shall hold public meetings to review the investment performance of the Fund, to hearpresentations from a portion of the System’s investment managers, and to effect its statutory and operational responsibilities.
8. To maintain and strengthen the investment management of the System: a. The Board and staff shall participate in conferences/seminars related to the investment
activities of public and private institutional investors.
b. The staff, and as appropriate, the Board, shall meet periodically with the investmentmanagers of the Fund at the firms’ offices to review and clarify investment or administrative issues related to the management of the portfolio.
c. The staff, and as appropriate, the Board, shall participate in investor meetings conducted bythe various managers of the Fund.
These activities shall be conducted in compliance with Iowa Code chapter 68B, the “Iowa Public Officials Act.”
C. Administrative Responsibilities
1. Board meeting dates for the fiscal year shall be set by members of the Board at the first meeting ofthe fiscal year.
2. At the first meeting in each fiscal year, the voting Board members shall elect a chair and vicechair.
3. Parties wishing to present items for the Board’s next meeting agenda shall file a written requestwith the chair at least five business days prior to the meeting. The Board may take up matters notincluded on its agenda.
4. To the extent there is no law, statute, or administrative rule governing a procedure, Boardmeetings shall be governed by the procedural rules established in the latest version of Robert’s Rules of Order, Newly Revised.
3. The Board shall periodically review the staff’s rebalancing activities and the System’s compliance with Policy Benchmark Weights and Active Risk Targets within their designated ranges.
4. The staff shall have the authority to terminate, amend, or renew contracts with existing managers.Staff shall inform the Board in advance of its decision to terminate a manager.
5. The Board shall approve the termination of consultants and the solicitation of proposals for consultants. The staff shall have the authority to amend or renew contracts with existingconsultants.
6. If the chief executive officer, chief investment officer, chief risk officer, any investment officer, or any IPERS attorney is in possession of information which would lead a reasonable person familiarwith such matters to conclude that an investment, a commitment to an investment, or a decision to engage or terminate a contracted service provider, contradicts the fiduciary duties of the party or parties having the final authority to take such actions, it is the Board’s expectation that theissue will be placed on a Board meeting agenda for review.
7. The Board shall hold public meetings to review the investment performance of the Fund, to hearpresentations from a portion of the System’s investment managers, and to effect its statutory andoperational responsibilities.
8. To maintain and strengthen the investment management of the System:
a. The Board and staff shall participate in conferences/seminars related to the investment activities of public and private institutional investors.
b. The staff, and as appropriate, the Board, shall meet periodically with the investment managers of the Fund at the firms’ offices to review and clarify investment or administrativeissues related to the management of the portfolio.
c. The staff, and as appropriate, the Board, shall participate in investor meetings conducted bythe various managers of the Fund.
These activities shall be conducted in compliance with Iowa Code chapter 68B, the “Iowa Public OfficialsAct.”
C. Administrative Responsibilities
1. Board meeting dates for the fiscal year shall be set by members of the Board at the first meeting ofthe fiscal year.
2. At the first meeting in each fiscal year, the voting Board members shall elect a chair and vicechair.
3. Parties wishing to present items for the Board’s next meeting agenda shall file a written request with the chair at least five business days prior to the meeting. The Board may take up matters not included on its agenda.
4. To the extent there is no law, statute, or administrative rule governing a procedure, Board meetings shall be governed by the procedural rules established in the latest version of Robert’s Rules of Order, Newly Revised.

78 INVESTMENTS IPERS Comprehensive Annual Financial Report 2016

Actuarial

ACTUARIAL
ACTUARY’S CERTIFICATION LETTER
PRINCIPAL VALUATION RESULTS
ACTUARIAL BALANCE SHEET
SOLVENCY TEST
SCHEDULE OF ACTIVE MEMBER VALUATION DATA
RETIREES AND BENEFICIARIES—CHANGES IN ROLLS
SCHEDULE OF FUNDING PROGRESS
ACTUARIAL ASSUMPTIONS AND METHODS
CONTRIBUTION RATE FUNDING POLICY

PB ACTUARIAL IPERS Comprehensive Annual Financial Report 2016 IPERS Comprehensive Annual Financial Report 2016 ACTUARIAL 81
November 10, 2016
This report presents the results of the June 30, 2016 annual actuarial valuation of the Iowa Public Employees’ Retirement System (IPERS). The primary purposes of performing the valuation are as follows:
• to determine the Actuarial Contribution Rates (ACR) and the Required Contribution Rates (RCR) for the Regularmembership, Sheriffs and Deputies, and the Protection Occupation group (all public safety members other thanSheriffs and Deputies) in accordance with IPERS’ Contribution Rate Funding Policy,
• to evaluate the funded status of the System and disclose various asset and liability measures as of June 30, 2016,
• to determine the experience of the System since the last valuation, and
• to analyze and report on trends in System contributions, assets, and liabilities over the past several years.
The actuarial valuation results provide a “snapshot” view of the System’s financial condition on June 30, 2016. There were no changes in the plan provisions or actuarial assumptions and methods since the prior valuation. The plan provisions used in the valuation are summarized in the Financial Section (see pages 34 to 38) and the actuarial assumptions are shown on pages 92 to 99 in the Actuarial Section.
The valuation results reflect net unfavorable experience for the past plan year as demonstrated by an unfunded actuarial liability (UAL) that was higher than expected. The UAL on June 30, 2016 for all three membership groups covered by IPERS is $5.586 billion as compared to an expected UAL of $5.479 billion. The unfavorable experience was the net result of an experience loss of $236 million on the actuarial value of assets and an experience gain of $128 million on System liabilities.
Historically, the contribution rate for Regular members was set by state statute. Effective with the 2011 valuation, IPERS has the authority to set the Required Contribution Rate for the Regular membership group based on the Actuarial Contribution Rate (ACR) developed in the annual actuarial valuation, subject to a change of no more than 1% per year. Based on the current Contribution Rate Funding Policy, the Required Contribution Rate for Sheriffs and Deputies will decrease 0.50% for FY2018, and it will remain unchanged for Protection Occupation and Regular members. The Required Contribution Rate is higher than the ACR for all three groups, as shown in the following table:
Cavanaugh Macdonald C O N S U L T I N G, L L C
The experience and dedication you deserve

82 ACTUARIAL IPERS Comprehensive Annual Financial Report 2016
Contribution Rate for FY2018
Regular Membership
Sheriffs and Deputies
Protection Occupation
1. Normal Cost Rate 10.20% 16.41% 15.99% 2. Amortization of UAL 4.01% 0.91% (0.23)%* 3. Actuarial Contribution Rate 14.21% 17.32% 15.99% 4. Required Contribution Rate 14.88% 18.76% 16.40% 5. Shortfall/(Margin) (3) - (4) (0.67)% (1.44)% (0.41)% 6. Employee Contribution Rate 5.95% 9.38% 6.56% 7. Employer Contribution Rate (4) - (6) 8.93% 9.38% 9.84%
8. Unfunded Actuarial Liability ($M) $5,576 $23 $(13) 9. Funded Ratio 82.9% 96.4% 100.9%
* According to the Actuarial Amortization Method, a negative UAL rate is not reflected until the group has been 110% funded forthree consecutive years.
Actuarial Value of Net Assets
For financial statement purposes, the System’s assets are reported at current fair values. For actuarial purposes, the assets are valued using a technique which dampens the volatility in the fair value. Specifically, the assets are valued at their expected value at the valuation date (based on the assumed rate of investment return) plus 25% of the difference between the fair value and the expected value on the valuation date. The actuarial value of assets must fall within a corridor of 80% to 120% of market value. Based on this methodology, there was an actuarial loss on assets of $236 million. Between June 30, 2015 and June 30, 2016, the actuarial value of assets increased by $1.119 billion. This represented an approximate rate of return of 6.65%, lower than the actuarial assumed rate of return of 7.50%.
Liabilities
The actuarial liability is that portion of the present value of future benefits that will not be paid by future normal costs. The difference between this liability and the actuarial value of assets at the same date is called the unfunded actuarial liability. The dollar amount of unfunded actuarial liability is reduced if the contributions to the System exceed the normal cost for the year plus interest on the prior year’s UAL.
The unfunded actuarial liability by group is shown as of June 30, 2016 in the following table:
($Millions) Regular
Membership Sheriffs & Deputies
Protection Occupation Total*
Actuarial Liability $32,578 $625 $1,417 $34,620 Actuarial Value of Assets 27,001 602 1,430 29,034 Unfunded Actuarial Liability* 5,576 23 (13) 5,586
Funded Ratio 82.9% 96.4% 100.9% 83.9%
*May not add due to rounding.
82 ACTUARIAL IPERS Comprehensive Annual Financial Report 2016 IPERS Comprehensive Annual Financial Report 2016 ACTUARIAL 83
Changes in the UAL occur for various reasons. The net increase in the UAL from June 30, 2015 to June 30, 2016 was $131 million. The components of this net change are shown in the following table (in millions):
Unfunded Actuarial Liability, June 30, 2015 ($M) $ 5,455
• Expected increase from amortization method 54 • Expected decrease from contributions above actuarial rate (38) • Investment experience 236 • Liability experience* (128) • Other 7
Unfunded Actuarial Liability before FED transfer, June 30, 2016 $ 5,586 • FED Transfer for favorable experience 0 Unfunded Actuarial Liability after FED transfer, June 30, 2016 $ 5,586
* Liability experience is 0.37% of the actuarial liability.
As can be observed above, various factors impacted the UAL. Actuarial gains (losses), which result from actual experience that is more (less) favorable than anticipated based on the actuarial assumptions, are reflected in the UAL and are measured as the difference between the expected unfunded actuarial liability and the actual unfunded actuarial liability, taking into account any changes due to actuarial assumptions and methods or benefit provision changes. Overall, the System experienced a net actuarial loss of $108 million. The total actuarial loss may be explained by considering the separate experience of assets and liabilities. As noted earlier, there was a $236 million actuarial loss as measured on the actuarial value of assets. There was a net actuarial gain of $128 million from demographic experience that was more favorable than anticipated by the actuarial assumptions.
Contribution Rate
As with most public sector retirement systems, one important funding policy objective is to fund the plan in a manner that keeps contribution rates approximately level from generation to generation. A funding method that is specifically designed to maintain annual costs that are level as a percent of covered payroll is the Entry Age Normal (EAN) cost method. It is for this reason that the EAN cost method was selected by the Investment Board to be used in the actuarial valuation. Under the EAN cost method, the actuarial contribution rate consists of two components:
• a “normal cost” for the portion of projected liabilities allocated by the actuarial cost method to service of membersduring the year following the valuation date, and
• an “unfunded actuarial liability contribution” for the excess of the portion of projected liabilities allocated toservice to date over the actuarial value of assets on hand.
In 2006 and 2010, legislation was passed that increased the statutory contribution rate for Regular members. Beginning with the 2011 valuation (which applied to FY2013), the Investment Board was given the authority to set the Required Contribution Rate for Regular members subject to certain statutory limitations. A historical summary of the actual contribution rate and the actuarial contribution rate is shown in the following graph:
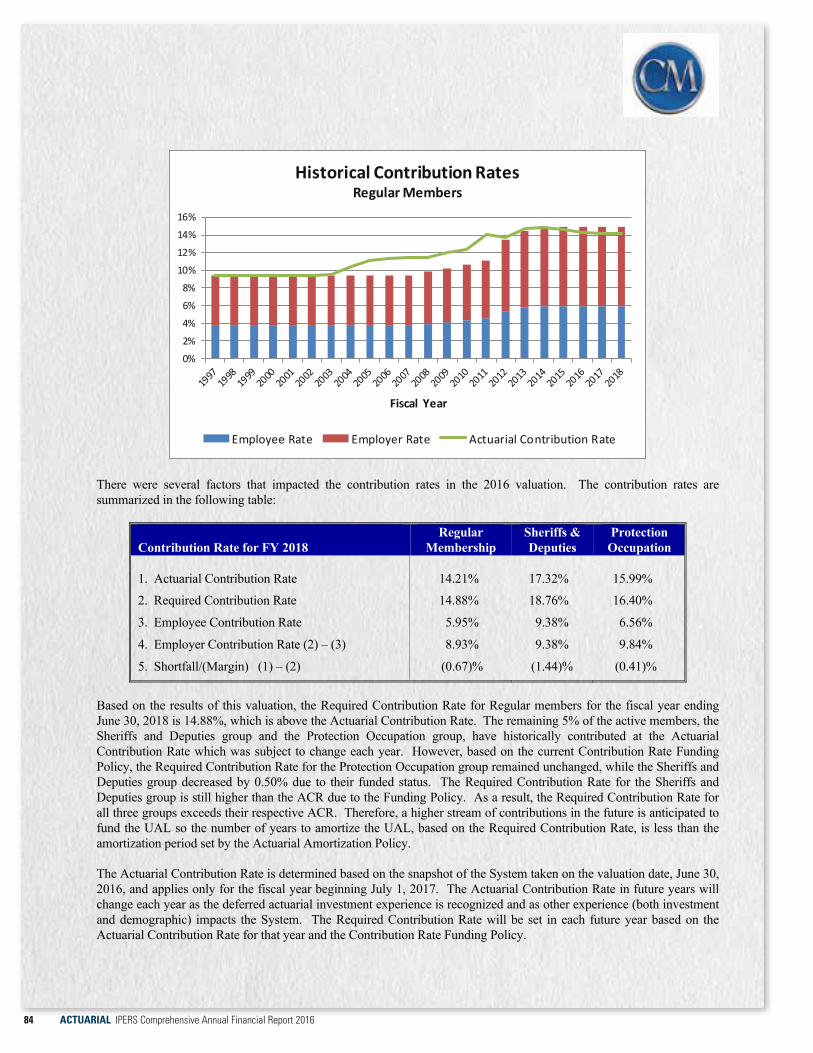
84 ACTUARIAL IPERS Comprehensive Annual Financial Report 2016
There were several factors that impacted the contribution rates in the 2016 valuation. The contribution rates are summarized in the following table:
Contribution Rate for FY 2018 Regular
Membership Sheriffs & Deputies
Protection Occupation
1. Actuarial Contribution Rate
2. Required Contribution Rate
3. Employee Contribution Rate
4. Employer Contribution Rate (2) – (3)
5. Shortfall/(Margin) (1) – (2)
14.21%
14.88%
5.95%
8.93%
(0.67)%
17.32%
18.76%
9.38%
9.38%
(1.44)%
15.99%
16.40%
6.56%
9.84%
(0.41)%
Based on the results of this valuation, the Required Contribution Rate for Regular members for the fiscal year ending June 30, 2018 is 14.88%, which is above the Actuarial Contribution Rate. The remaining 5% of the active members, the Sheriffs and Deputies group and the Protection Occupation group, have historically contributed at the Actuarial Contribution Rate which was subject to change each year. However, based on the current Contribution Rate Funding Policy, the Required Contribution Rate for the Protection Occupation group remained unchanged, while the Sheriffs and Deputies group decreased by 0.50% due to their funded status. The Required Contribution Rate for the Sheriffs and Deputies group is still higher than the ACR due to the Funding Policy. As a result, the Required Contribution Rate for all three groups exceeds their respective ACR. Therefore, a higher stream of contributions in the future is anticipated to fund the UAL so the number of years to amortize the UAL, based on the Required Contribution Rate, is less than the amortization period set by the Actuarial Amortization Policy.
The Actuarial Contribution Rate is determined based on the snapshot of the System taken on the valuation date, June 30, 2016, and applies only for the fiscal year beginning July 1, 2017. The Actuarial Contribution Rate in future years will change each year as the deferred actuarial investment experience is recognized and as other experience (both investment and demographic) impacts the System. The Required Contribution Rate will be set in each future year based on the Actuarial Contribution Rate for that year and the Contribution Rate Funding Policy.
0%
2%
4%
6%
8%
10%
12%
14%
16%
Fiscal Year
Historical Contribution RatesRegular Members
Employee Rate Employer Rate Actuarial Contribution Rate

84 ACTUARIAL IPERS Comprehensive Annual Financial Report 2016 IPERS Comprehensive Annual Financial Report 2016 ACTUARIAL 85
Summary
The investment return on the market value of assets for FY2016 was 2.15%, as reported by IPERS. As a result of anactuarial gain on liabilities and an actuarial loss on assets, the System’s funded ratio increased slightly from 83.7% in theJune 30, 2015 valuation to 83.9% in the June 30, 2016 valuation.
As mentioned earlier in this section, the System utilizes an asset smoothing method in the valuation process. While thisis a common procedure for public retirement systems, it is important to identify the potential impact of the deferred investment experience. The asset smoothing method impacts only the timing of when the actual market experience isrecognized in the valuation process. As a result of favorable investment experience in several recent years that had notyet been fully recognized in the asset smoothing method, the return on the actuarial value of assets was 6.65%, despite a return of 2.15% on the market value of assets. Due to the return on the market value of assets, the deferred investmentgain of $514 million in last year’s valuation is now a deferred investment loss of $708 million in the current valuation.
Based on the Contribution Rate Funding Policy adopted by the Investment Board, the Required Contribution Ratedetermined in this year’s valuation for Regular members will remain unchanged from last year, i.e., 14.88%, and will apply for the fiscal year ending June 30, 2018. The Required Contribution Rate for the Sheriffs and Deputies group in this valuation declined by 0.50% from last year’s rate due to their funded ratio and the provisions of the Contribution Rate Funding Policy, but the Required Contribution Rate remains higher than the Actuarial Contribution Rate. TheRequired Contribution Rate for the Protection Occupation group remains unchanged. As a result, for all three groups theRequired Contribution Rate exceeds the Actuarial Contribution Rate for FY2018.
The Actuarial Contribution Rate is determined based on the snapshot of the System taken on the valuation date, June 30,2016, and applies only for the fiscal year beginning July 1, 2017. The Actuarial Contribution Rate in future years will change each year as the deferred actuarial investment experience is recognized and as other experience (both investment and demographic) impacts the System. While the Required Contribution Rate can vary each year, the annual change to the rate is limited to 1.0% for Regular members. Therefore, depending on actual experience in future years, the Required Contribution Rate may vary from the Actuarial Contribution Rate.
The long-term financial health of this retirement system is heavily dependent on two key items: (1) future investmentreturns and (2) systematic contributions to the System at the full actuarially determined rate. Given the System’s currentfunded status, the Actuarial Contribution Rate, and the Required Contribution Rate, the System’s funded ratio isexpected to improve over the long term, assuming all actuarial assumptions are met.
In performing the valuation, we have relied upon membership and financial data reported to us by the System. We did not verify the accuracy of the information, but did review it for reasonableness in relation to the data submitted forprevious years. We provided the Principal Valuation Results, the Actuarial Balance Sheet, the Schedule of Funding Progress, and the Solvency Test in the Actuarial section. We also provided some information in the Financial Section, including the calculation of the Total Pension Liability, the Schedule of Changes in the Employers’ Net PensionLiability, and the sensitivity analysis on the Net Pension Liability. In addition, we provided the contribution rates used to calculate the actuarially required contributions reflected in the Schedule of Employers’ Contributions found in theRequired Supplementary Information.
On the basis of the foregoing, we hereby certify that, to the best of our knowledge and belief, this information iscomplete and accurate and has been prepared in accordance with generally recognized and accepted actuarial principlesand practices which are consistent with the Actuarial Standards of Practice promulgated by the Actuarial StandardsBoard and the applicable Guides to Professional Conduct, amplifying Opinions, and supporting Recommendations of theAmerican Academy of Actuaries.
We further certify that all costs, liabilities, rates of interest and other factors for the System have been determined on the basis of actuarial assumptions and methods which are individually reasonable (taking into account the experience of theSystem and reasonable expectations of future experience); and which, in combination, offer our best estimate ofanticipated experience affecting the System. Nevertheless, the emerging costs will vary from those presented in thisreport to the extent actual experience differs from that projected by the actuarial assumptions. The Investment Board hasthe final decision regarding the appropriateness of the assumptions and adopted them as of the dates shown for each assumption.
Summary
The investment return on the market value of assets for FY2016 was 2.15%, as reported by IPERS. As a result of an actuarial gain on liabilities and an actuarial loss on assets, the System’s funded ratio increased slightly from 83.7% in the June 30, 2015 valuation to 83.9% in the June 30, 2016 valuation. As mentioned earlier in this section, the System utilizes an asset smoothing method in the valuation process. While this is a common procedure for public retirement systems, it is important to identify the potential impact of the deferred investment experience. The asset smoothing method impacts only the timing of when the actual market experience is recognized in the valuation process. As a result of favorable investment experience in several recent years that had notyet been fully recognized in the asset smoothing method, the return on the actuarial value of assets was 6.65%, despite areturn of 2.15% on the market value of assets. Due to the return on the market value of assets, the deferred investmentgain of $514 million in last year’s valuation is now a deferred investment loss of $708 million in the current valuation. Based on the Contribution Rate Funding Policy adopted by the Investment Board, the Required Contribution Rate determined in this year’s valuation for Regular members will remain unchanged from last year, i.e., 14.88%, and will apply for the fiscal year ending June 30, 2018. The Required Contribution Rate for the Sheriffs and Deputies group in this valuation declined by 0.50% from last year’s rate due to their funded ratio and the provisions of the Contribution Rate Funding Policy, but the Required Contribution Rate remains higher than the Actuarial Contribution Rate. The Required Contribution Rate for the Protection Occupation group remains unchanged. As a result, for all three groups the Required Contribution Rate exceeds the Actuarial Contribution Rate for FY2018. The Actuarial Contribution Rate is determined based on the snapshot of the System taken on the valuation date, June 30, 2016, and applies only for the fiscal year beginning July 1, 2017. The Actuarial Contribution Rate in future years will change each year as the deferred actuarial investment experience is recognized and as other experience (both investmentand demographic) impacts the System. While the Required Contribution Rate can vary each year, the annual change tothe rate is limited to 1.0% for Regular members. Therefore, depending on actual experience in future years, the RequiredContribution Rate may vary from the Actuarial Contribution Rate. The long-term financial health of this retirement system is heavily dependent on two key items: (1) future investment returns and (2) systematic contributions to the System at the full actuarially determined rate. Given the System’s current funded status, the Actuarial Contribution Rate, and the Required Contribution Rate, the System’s funded ratio isexpected to improve over the long term, assuming all actuarial assumptions are met. In performing the valuation, we have relied upon membership and financial data reported to us by the System. We did not verify the accuracy of the information, but did review it for reasonableness in relation to the data submitted for previous years. We provided the Principal Valuation Results, the Actuarial Balance Sheet, the Schedule of Funding Progress, and the Solvency Test in the Actuarial section. We also provided some information in the Financial Section, including the calculation of the Total Pension Liability, the Schedule of Changes in the Employers’ Net Pension Liability, and the sensitivity analysis on the Net Pension Liability. In addition, we provided the contribution rates used to calculate the actuarially required contributions reflected in the Schedule of Employers’ Contributions found in the Required Supplementary Information. On the basis of the foregoing, we hereby certify that, to the best of our knowledge and belief, this information is complete and accurate and has been prepared in accordance with generally recognized and accepted actuarial principles and practices which are consistent with the Actuarial Standards of Practice promulgated by the Actuarial Standards Board and the applicable Guides to Professional Conduct, amplifying Opinions, and supporting Recommendations of the American Academy of Actuaries. We further certify that all costs, liabilities, rates of interest and other factors for the System have been determined on the basis of actuarial assumptions and methods which are individually reasonable (taking into account the experience of the System and reasonable expectations of future experience); and which, in combination, offer our best estimate ofanticipated experience affecting the System. Nevertheless, the emerging costs will vary from those presented in this report to the extent actual experience differs from that projected by the actuarial assumptions. The Investment Board has the final decision regarding the appropriateness of the assumptions and adopted them as of the dates shown for each assumption.

86 ACTUARIAL IPERS Comprehensive Annual Financial Report 2016
Actuarial computations presented in the 2016 actuarial valuation report are for purposes of determining the recommended funding amounts for the System. The calculations have been made on a basis consistent with our understanding of the System’s funding requirements and goals. Determinations for purposes other than meeting these requirements may be significantly different from the results shown in the June 30, 2016 actuarial valuation report.
We also prepared actuarial computations as of June 30, 2016 for purposes of fulfilling financial accounting requirements for the System under Governmental Accounting Standard No. 67 (GASB 67) based on the results of the June 30, 2016 actuarial valuation. The actuarial assumptions used in the funding valuation were also used for the GASB 67 reporting. The assumptions include an assumed rate of return of 7.50%, net of investment expenses, which is used to determine the actuarial liability in the funding valuation as well as the discount rate used to determine the Total Pension Liability for GASB 67 reporting. In addition, as noted earlier, the Entry Age Normal actuarial cost method, which is required to be used under GASB 67, is also used in the funding valuation.
An experience study is performed for IPERS every four years, as required by statute. In June, 2014, the results of the experience analysis covering plan experience for the four-year period from June 30, 2009 through June 30, 2013 were presented to the Investment Board. This information provided an updated view of all economic and demographic assumptions. Based on this information, the Investment Board adopted certain changes to the set of actuarial assumptions which were first reflected in the June 30, 2014 actuarial valuation and continue to be used. The actuarial assumptions and methods in the 2016 valuation meet the parameters set by Actuarial Standards of Practice, as issued by the Actuarial Standards Board, and generally accepted accounting principles (GAAP) applicable in the United States of America as promulgated by the Governmental Accounting Standards Board.
In conclusion, on the following page we present comparative statistics and actuarial information on both the June 30, 2016 and June 30, 2015 valuations. All figures shown include the Regular members, Sheriffs and Deputies and the Protection Occupation groups. The membership counts reflect the data as of June 30, appropriate for valuation purposes, and may differ from other reporting numbers.
I, Patrice A. Beckham, F.S.A., am a member of the American Academy of Actuaries and a Fellow of the Society of Actuaries, and meet the Qualification Standards of the American Academy of Actuaries to render the actuarial opinion contained herein.
I, Brent A. Banister, F.S.A., am a member of the American Academy of Actuaries and a Fellow of the Society of Actuaries, and meet the Qualification Standards of the American Academy of Actuaries to render the actuarial opinion contained herein.
Respectfully Submitted,
CAVANAUGH MACDONALD CONSULTING, LLC
Patrice A. Beckham, FSA, EA, FCA, MAAA Brent A. Banister, PhD, FSA, EA, FCA, MAAA Principal and Consulting Actuary Chief Pension Actuary

86 ACTUARIAL IPERS Comprehensive Annual Financial Report 2016 IPERS Comprehensive Annual Financial Report 2016 ACTUARIAL 87
PRINCIPAL VALUATION RESULTS June 30, 2016 June 30, 2015 % Chg
SYSTEM MEMBERSHIP 1. Active Membership
- Number of Members(excluding Retired/Reemployed) 168,372 167,368 0.6
- Projected Payroll for Upcoming Fiscal Year $7,812M $7,573M 3.2 - Average Salary $46,399 $45,247 2.5
2. Inactive Membership- Number Not in Pay Status 66,847 67,374 (0.8) - Number of Retirees/Beneficiaries 114,240 111,127 2.8 - Average Annual Benefit $16,149 $15,745 2.6
ASSETS AND LIABILITIES 1. Net Assets (excluding FED reserve)
- Market Value $28,326M $28,430M (0.4) - Actuarial Value 29,034M 27,915M 4.0
2. Projected Liabilities- Retired Members $17,657M $16,843M 4.8 - Inactive Members 748M 699M 7.0 - Active Members 23,192M 22,599M 2.6 - Total Liability $41,597M $40,142M 3.6
3. Actuarial Liability $34,620M $33,370M 3.7
4. Unfunded Actuarial Liability $5,586M $5,455M 2.4
5. Funded Ratioa. Actuarial Value Assets/Actuarial Liability 83.86% 83.65% 0.3 b. Market Value Assets/Actuarial Liability 81.82% 85.19% (4.0)
SYSTEM CONTRIBUTIONS Required Contribution Rate, Regular Members* 14.88% 14.88% 0.0 Employer Contribution Rate 8.93% 8.93% 0.0 Employee Contribution Rate 5.95% 5.95% 0.0 Total Actuarial Contribution Rate 14.21% 14.17% 0.3 Shortfall/(Margin) (0.67%) (0.71%) (5.6) Note: Totals may not add due to rounding
M = ($)Millions * Contribution rates for Sheriffs and Deputies are 9.38% for employers, 9.38% for employees
Contribution rates for Protection Occupation are 9.84% for employers, 6.56% for employees
Note: For valuation purposes, the data provided by IPERS was reclassified by CMC into the membership category that would most accurately reflect the actuarial liability of the individual member on the valuation date. As a result, the counts shown in this exhibitmay vary from those shown in other sections of this report.
88 ACTUARIAL IPERS Comprehensive Annual Financial Report 2016
ACTUARIAL BALANCE SHEET as of June 30, 2016
Regular Membership
Sheriffs & Deputies
Protection Occupation Total
ASSETS
Actuarial value of assets $27,001,194,364 $602,213,442 $1,430,288,781 $29,033,696,587
Present value of future normal costs 6,289,129,437 157,094,078 531,443,763 6,977,667,278
Present value of future contributions to amortize unfunded actuarial liability 5,576,463,229 22,578,193 (12,988,862) 5,586,052,560
Total Assets $38,866,787,030 $781,885,713 $1,948,743,682 $41,597,416,425
LIABILITIES
Present Value of Future Benefits:
Retired Members and Beneficiaries $16,768,695,428 $281,179,979 $607,529,406 $17,657,404,813
Active Members 21,392,676,368 492,066,050 1,307,266,457 23,192,008,875
Inactive Members 705,415,234 8,639,684 33,947,819 748,002,737
Total Liabilities $38,866,787,030 $781,885,713 $1,948,743,682 $41,597,416,425

88 ACTUARIAL IPERS Comprehensive Annual Financial Report 2016 IPERS Comprehensive Annual Financial Report 2016 ACTUARIAL 89
SOLVENCY TEST
A short-term solvency test, which is one means of determining a system’s progress under its funding program, compares the plan’s present assets with: 1) the liability for active member contributions on deposit; 2) the liability for future benefits to present retirees; and (3) the liability for service already rendered by active members. In a system that has been following the level percent of payroll financing discipline, the obligation for active member contributions on deposit (Item 1) and the liabilities for future benefits to present retired lives (Item 2) will be fully covered by present assets with the exception of rare circumstances. The obligation for service already rendered by active members (Item 3) will be partially covered by the remainder of present assets. Absent any significant benefit changes, if the system has been using level cost financing, the funded portion of Item 3 usually will increase over a period of time.
Actuarial Valuation
Active Member
Contributions Retirees and Beneficiaries
Active Members Employer Financed
Portion Actuarial Value
of Assets Portions of Liabilities
Covered by Assets (1) (2) (3) (1) (2) (3)
2016 $4,344,382,843 $17,657,404,813 $12,617,961,491 $29,033,696,587 100% 100% 56% 2015 4,150,432,107 16,843,177,973 12,376,708,651 27,915,379,103 100% 100% 56% 2014 3,974,396,951 15,974,726,784 12,055,332,353 26,460,428,085 100% 100% 54% 2013 3,789,330,469 15,000,576,427 11,708,435,424 24,711,096,187 100% 100% 51% 2012 3,675,848,243 14,151,967,558 11,618,381,685 23,530,094,461 100% 100% 49% 2011 3,562,999,712 13,252,276,665 11,441,803,737 22,575,309,199 100% 100% 50% 2010 3,569,189,416 12,321,926,878 10,577,303,356 21,537,458,560 100% 100% 53% 2009 3,501,951,261 10,623,480,763 11,893,161,799 21,123,979,941 100% 100% 59% 2008 3,343,722,874 9,922,758,244 11,255,735,471 21,857,423,183 100% 100% 76% 2007 3,165,389,448 9,217,242,773 10,643,481,561 20,759,628,415 100% 100% 79%
Note: The combined accrued liabilities in columns 1, 2, and 3 are based on the entry age normal cost method.

90 ACTUARIAL IPERS Comprehensive Annual Financial Report 2016
SCHEDULE OF ACTIVE MEMBER VALUATION DATA
Fiscal Years Ended June 30
Participating Employers
Active Members
Annual Covered Payroll
Annual Average Pay
Percentage Change in Average Pay
2016 1,960 168,372 $7,556,515,720 $44,880 2.53 2015 1,968 167,367 7,326,348,141 43,774 2.30 2014 1,973 165,913 7,099,277,280 42,789 2.68 2013 2,147 165,095 6,880,131,134 41,674 0.83 2012 2,153 164,200 6,786,158,720 41,329 3.38 2011 2,177 164,467 6,574,872,719 39,977 0.78 2010 2,229 165,660 6,571,182,005 39,667 3.33 2009 2,241 167,717 6,438,643,124 38,390 5.09 2008 2,259 167,850 6,131,445,367 36,529 4.40 2007 2,293 165,241 5,781,706,199 34,990 3.31
Note: In compliance with GASB Statement No. 67, the 2014 employer counts were adjusted in 2014. Further adjustments were made to the 2014, 2015, and 2016 counts.
RETIREES AND BENEFICIARIES—CHANGES IN ROLLS
Schedule of Retirees Added to and Removed From Rolls
Fiscal Year
Added to Rolls Removed From Rolls Rolls at Year-End Percentage Change in
Annual Allowances
Average Annual Allowances Number*
Annual Allowances Number
Annual Allowances Number
Annual Allowances
2016 5,958 $120,723,975 3,123 $15,826,861 108,672 $1,759,112,251 6.34 $16,187 2015 5,926 8,930,554 3,104 18,262,385 105,837 1,654,215,137 (0.56) 15,630 2014 6,008 124,411,510 3,008 30,068,643 103,015 1,663,546,968 6.01 16,149 2013 5,759 133,822,874 3,004 27,729,949 100,015 1,569,204,101 7.25 15,690 2012 5,979 116,825,979 2,788 24,589,757 97,260 1,463,111,176 6.73 15,043 2011 7,383 183,137,035 2,767 13,377,850 94,069 1,370,874,954 14.13 14,573 2010 6,387 104,167,926 2,705 12,096,634 89,453 1,201,115,769 8.30 13,427 2009 4,908 92,013,786 2,761 12,041,683 85,771 1,109,044,477 7.77 12,930 2008 5,098 92,991,307 2,687 10,789,250 83,624 1,029,072,374 8.68 12,306 2007 5,246 88,603,387 2,718 10,883,501 81,213 946,870,317 8.94 11,659
Schedule of Beneficiaries Added to and Removed From Rolls
Fiscal Year
Added to Rolls Removed From Rolls Rolls at Year-End Percentage Change in
Annual Allowances
Average Annual Allowances Number*
Annual Allowances Number
Annual Allowances Number
Annual Allowances
2016 543 $6,736,612 255 $1,277,504 5,819 $61,801,058 9.69 $10,621 2015 580 2,130,837 267 1,321,475 5,531 56,341,950 1.46 10,187 2014 555 7,013,711 255 2,175,827 5,218 55,532,588 9.54 10,643 2013 496 6,073,050 266 2,129,400 4,918 50,694,704 8.44 10,308 2012 464 5,918,466 247 1,858,259 4,688 46,751,054 9.51 9,972 2011 456 4,497,000 224 911,691 4,471 42,690,847 9.17 9,548 2010 397 4,387,178 239 1,231,637 4,239 39,105,538 8.78 9,225 2009 429 3,930,377 214 876,249 4,081 35,949,997 9.28 8,809 2008 335 3,673,542 205 934,239 3,866 32,895,869 9.08 8,509 2007 374 3,299,984 157 857,512 3,736 30,156,566 8.81 8,072
*The number of retirees and beneficiaries added to rolls in these tables does not equal the number of new retirees reported elsewhere in the CAFR. This is because all retirees who died during the fiscal year have been removed from the retiree table and their beneficiaries have been added to the beneficiary table.
Note: Tables on pages 90–91 are provided by IPERS.

90 ACTUARIAL IPERS Comprehensive Annual Financial Report 2016 IPERS Comprehensive Annual Financial Report 2016 ACTUARIAL 91
SCHEDULE OF FUNDING PROGRESS
Fiscal Years Ended June 30
Actuarial Value of Assets
Actuarial Liability
Percentage Funded
Unfunded Actuarial Liability (UAL)
Annual Covered Payroll*
UAL as a Percentage of
Covered Payroll
2016 $29,033,696,587 $34,619,749,147 83.86 $5,586,052,560 $7,556,515,720 73.922015 27,915,379,103 33,370,318,731 83.65 5,454,939,628 7,326,348,141 74.46 2014 26,460,428,085 32,004,456,088 82.68 5,544,028,003 7,099,277,280 78.09 2013 24,711,096,187 30,498,342,320 81.02 5,787,246,133 6,880,131,134 84.12 2012 23,530,094,461 29,446,197,486 79.91 5,916,103,025 6,786,158,720 87.18 2011 22,575,309,199 28,257,080,114 79.89 5,681,770,915 6,574,872,719 86.42 2010 21,537,458,560 26,468,419,650 81.37 4,930,961,090 6,571,182,005 75.04 2009 21,123,979,941 26,018,593,823 81.19 4,894,613,882 6,438,643,124 76.02 2008 21,857,423,183 24,522,216,589 89.13 2,664,793,406 6,131,445,367 43.46 2007 20,759,628,415 23,026,113,782 90.16 2,266,485,367 5,781,706,199 39.20
*Annual covered payroll is the amount of wages subject to contributions to IPERS, not to exceed the federal covered wage limit in effect at the time the wages are paid.
Note: See the ten-year Schedule of Employers’ Contributions in the Required Supplementary Information on page 43 for information on actuarial contributions and required contributions paid.

92 ACTUARIAL IPERS Comprehensive Annual Financial Report 2016
ACTUARIAL ASSUMPTIONS AND METHODS
ECONOMIC ASSUMPTIONS:
Rate of Inflation (effective June 30, 2014)
3.00% per annum
Rate of Crediting Interest on Contribution Balances (effective June 30, 2014)
3.75% per annum, compounded annually
Rate of Investment Return (effective June 30, 1996)
7.50% per annum, compounded annually, net of expenses.
Wage Growth Assumption (effective June 30, 1999)*
4.00% per annum based on 3.00% inflation assumption and 1.00% real wage inflation.
*Total of 4.00% did not change, but the components changed June 30, 2006 and June 30, 2014
Payroll Increase Assumption (effective June 30, 1999)
4.00% per year
DEMOGRAPHIC ASSUMPTIONS:
Rates of Mortality
To reflect anticipated future mortality improvements, generational mortality is used with projected mortality improvements based on Projection Scale AA.
Pre-Retirement (effective June 30, 2010)
State Male RP-2000 Employee Table, Generational, set back 3 years Female RP-2000 Employee Table, Generational, set back 8 years
School Male RP-2000 Employee Table, Generational, set back 3 years Female RP-2000 Employee Table, Generational, set back 8 years
Other Male RP-2000 Employee Table, Generational, no set back Female RP-2000 Employee Table, Generational, set back 8 years
Sheriffs/Deputies and Protection Occupation
And Services
Male RP-2000 Employee Table, Generational Female RP-2000 Employee Table, Generational
5% of active deaths are assumed to be service related for non-regular members.

92 ACTUARIAL IPERS Comprehensive Annual Financial Report 2016 IPERS Comprehensive Annual Financial Report 2016 ACTUARIAL 93
Post-Retirement (effective June 30, 2014)
State RP-2000 Healthy Annuitant Table, Generational Male No age adjustment Female 1 Year set back with 5% increase above age 75
School RP-2000 Healthy Annuitant Table, Generational
Male 1 Year set back with rates decreased by 5% below age 75 Female 3 Year set back with 10% decrease before age 75 and 10% increase above age
75
Other RP-2000 Healthy Annuitant Table, Generational Male No age adjustment Female 2 Year set back with 5% increase above age 75
Sheriffs/Deputies and Protection Occupation
RP-2000 Healthy Annuitant Table, Generational
Male No age adjustment Female No age adjustment
Beneficiaries: Same as members
Disabled Members (all groups):
RP-2000 Disabled Mortality, Generational Set back 1 year for males and set forward 3 years for females
Retirement Rates (effective June 30, 2014)
Upon meeting the requirements for early retirement, the following rates apply to Regular Members:
Assumed Retirement Rates – Early Age State School Other 55 5.0% 8.0% 5.0% 56 5.0% 8.0% 5.0% 57 5.0% 8.0% 5.0% 58 5.0% 8.0% 5.0% 59 5.0% 9.0% 5.0% 60 5.0% 10.0% 5.0% 61 15.0% 15.0% 10.0% 62 15.0% 20.0% 20.0% 63 15.0% 20.0% 20.0% 64 15.0% 20.0% 20.0%

94 ACTUARIAL IPERS Comprehensive Annual Financial Report 2016
Upon reaching the requirements for normal retirement (unreduced benefits), the following rates apply:
Assumed Retirement Rates – Select Unreduced Age State School Other 55 20.0% 30.0% 20.0% 56 15.0% 30.0% 20.0% 57 15.0% 30.0% 20.0% 58 15.0% 30.0% 20.0% 59 15.0% 30.0% 20.0% 60 15.0% 30.0% 20.0% 61 20.0% 30.0% 20.0% 62 40.0% 40.0% 40.0% 63 35.0% 30.0% 35.0% 64 30.0% 30.0% 35.0% 65 30.0% 30.0% 30.0%
Assumed Retirement Rates – Ultimate Unreduced Age State School Other 55 15.0% 23.0% 15.0% 56 15.0% 23.0% 15.0% 57 15.0% 23.0% 15.0% 58 15.0% 23.0% 15.0% 59 15.0% 23.0% 15.0% 60 15.0% 23.0% 15.0% 61 20.0% 30.0% 20.0% 62 40.0% 35.0% 35.0% 63 30.0% 30.0% 25.0% 64 30.0% 30.0% 25.0% 65 30.0% 45.0% 40.0% 66 30.0% 35.0% 30.0% 67 20.0% 25.0% 20.0% 68 20.0% 25.0% 20.0% 69 35.0% 40.0% 40.0% 70 100.0% 100.0% 100.0%

94 ACTUARIAL IPERS Comprehensive Annual Financial Report 2016 IPERS Comprehensive Annual Financial Report 2016 ACTUARIAL 95
Assumed Retirement Rates Age Sheriffs and Deputies Protection Occupation 50 20.0% 51 20.0% 52 20.0% 53 20.0% 54 20.0% 55 17.0% 20.0% 56 17.0% 10.0% 57 17.0% 10.0% 58 17.0% 10.0% 59 17.0% 10.0% 60 17.0% 10.0% 61 17.0% 10.0% 62 30.0% 35.0% 63 30.0% 30.0% 64 30.0% 30.0% 65 100.0% 100.0%
Terminated vested members are assumed to retire at age 62 (55 for Sheriffs/Deputies and Protection Occupation groups).
For Regular membership, retired reemployed members are assumed to retire at a rate of 25% per year until age 80 when all are assumed to retire.
All retirees are assumed to elect a modified cash refund annuity (Option 2).
Rates of Disablement (effective June 30, 2010)
Assumed Rates Males Females
Age State School Other State School Other 27 0.020% 0.020% 0.020% 0.020% 0.030% 0.020% 32 0.020% 0.020% 0.020% 0.020% 0.030% 0.020% 37 0.040% 0.040% 0.040% 0.032% 0.040% 0.032% 42 0.065% 0.065% 0.065% 0.051% 0.050% 0.051% 47 0.120% 0.110% 0.140% 0.087% 0.090% 0.087% 52 0.220% 0.160% 0.326% 0.220% 0.165% 0.200% 57 0.320% 0.260% 0.630% 0.390% 0.240% 0.350% 62 0.420% 0.360% 0.900% 0.620% 0.320% 0.500%

96 ACTUARIAL IPERS Comprehensive Annual Financial Report 2016
Assumed Rates Sheriffs/Deputies
Protection Occupation Age Rate 27 0.150% 32 0.150% 37 0.150% 42 0.180% 47 0.230% 52 0.280% 57 0.380% 62 0.510%
Rates of Termination of Employment (effective June 30, 2010)
Regular Membership
Male Female Years of Service State School Other State School Other
1 15.4% 15.0% 21.0% 15.4% 15.0% 21.0% 5 5.5% 6.9% 8.4% 5.5% 6.9% 9.2%
10 2.2% 2.9% 4.3% 2.2% 2.9% 5.8% 15 1.7% 1.8% 2.6% 1.7% 1.8% 4.1% 20 1.1% 1.3% 2.4% 1.1% 1.3% 3.2% 25 1.1% 1.2% 2.0% 1.1% 1.2% 2.4% 30 1.1% 1.2% 1.2% 1.1% 1.2% 1.5%
Sheriffs/Deputies and Protection Occupation
Age Rate of Termination 22 5.8% 27 5.8% 32 3.5% 37 3.0% 42 2.6% 47 2.0% 52 2.0%

96 ACTUARIAL IPERS Comprehensive Annual Financial Report 2016 IPERS Comprehensive Annual Financial Report 2016 ACTUARIAL 97
Probability of Electing a Deferred Vested Benefit (effective June 30, 2010)
Regular Membership Male Female
Years of Service State School Other State School Other 5 66.0% 76.0% 61.0% 61.0% 80.0% 70.0%
10 73.0% 81.0% 66.0% 66.0% 80.0% 73.0% 15 78.0% 86.0% 71.0% 76.0% 85.0% 80.0% 20 83.0% 91.0% 76.0% 86.0% 90.0% 85.0% 25 88.0% 95.0% 80.0% 96.0% 95.0% 90.0% 30 90.0% 95.0% 80.0% 100.0% 100.0% 90.0%
Sheriffs/Deputies and Protection Occupation
Years of Service Rate 5 53%
10 65% 15 85% 20 95% 25 100% 30 100%
Rates of Salary Increase* (effective June 30, 2010)
Annual Increase Years of Service State School Other
Sheriffs/Deputies and Protection
Occupation 1 15.0% 17.0% 15.0% 17.0% 5 7.6% 6.5% 6.1% 6.5%
10 6.3% 5.3% 5.3% 5.3% 15 5.2% 4.5% 4.8% 4.8% 20 4.8% 4.2% 4.5% 4.5% 25 4.6% 4.0% 4.4% 4.5%
30+ 4.3% 4.0% 4.4% 4.0%
* Includes 4.0% wage growth
98 ACTUARIAL IPERS Comprehensive Annual Financial Report 2016
ACTUARIAL COST METHOD (adopted 1996)
The actuarial cost method is a procedure for allocating the actuarial present value of pension plan benefits and expenses to time periods. The method used for the valuation is known as the entry age normal actuarial cost method. Under this method, a total contribution rate is determined which consists of two parts: (i) the normal cost rate and (ii) the unfunded actuarial liability (UAL) rate. The entry age normal cost method has the following characteristics:
(i) The annual normal costs for each individual active member are sufficient to accumulate the value of themember’s pension at time of retirement.
(ii) Each annual normal cost is a constant percentage of the member’s year by year projected compensation rates.
The entry age normal actuarial cost method allocates the actuarial present value of each member’s projected benefits on a level basis over the member’s compensation rates between the entry age of the member and the assumed exit ages.
ACTUARIAL AMORTIZATION METHOD (adopted 2013)
The portion of the actuarial present value of benefits allocated to the valuation year is called the normal cost. The portion of the actuarial present value of benefits not provided for by the actuarial present value of future normal costs is called the actuarial liability. Deducting the actuarial value of assets from the actuarial liability determines the unfunded actuarial liability (UAL). The one-year lag between the valuation date and the date the contribution rate is effective is reflected in calculating the corresponding amortization payment. The UAL is amortized according to the Actuarial Amortization Method adopted by the Investment Board and summarized below:
1. Amortization payments will be calculated as a level percentage of payroll.
2. For the actuarial valuation prepared as of June 30, 2013, the amortization period of the UAL shall be 30-yearopen for all membership groups.
3. For the actuarial valuation prepared as of June 30, 2014:a. The UAL for each membership group shall be amortized over a 30-year closed period.b. This will be designated as the initial UAL base for subsequent valuations and it will be amortized over
the remaining years of the 30-year closed period set on June 30, 2014.
4. For each valuation subsequent to June 30, 2014, annual net experience gains/losses for each membershipgroup will be amortized over a new, closed 20-year period.
5. Subsequent plan amendments or changes in actuarial assumptions or methods that create a change in the UALwill be amortized over a demographically appropriate period selected by the Investment Board at the time thatthe change is incurred.
6. The dollar amount of the UAL payment for purposes of computing the UAL component of the actuarial andrequired contribution rate will be the sum of the amortization payments for each amortization scheduledivided by the total projected payroll. Unless the plan has been 110 percent funded for the current and priortwo years, a negative amortization payment shall be ignored.
7. If the valuation shows that the group has surplus, the prior amortization bases will be eliminated and one baseequal to the amount of surplus shall be established. The amortization period of a surplus shall be a 30-yearopen period for all groups.

98 ACTUARIAL IPERS Comprehensive Annual Financial Report 2016 IPERS Comprehensive Annual Financial Report 2016 ACTUARIAL 99
ACTUARIAL VALUE OF ASSETS SMOOTHING METHOD (adopted 2007)
The market value of assets, representing a fair value of System assets, may not necessarily be the best measure of the System’s ongoing ability to meet its obligations.
To arrive at a suitable value for the actuarial valuation, a technique for determining the actuarial value of assets is used which dampens volatility in the market value while still indirectly recognizing market value. The specific technique follows:
Step 1: Determine the expected value of plan assets at the current valuation date using the actuarial assumption for investment return applied to the prior actuarial value and the actual receipts and disbursements of the fund for the previous 12 months.
Step 2: Subtract the expected value determined in Step 1 from the total market value of the Fund at the current valuation date.
Step 3: Multiply the difference between market and expected values determined in Step 2 by 25%.
Step 4: Add the expected value of Step 1 and the product of Step 3 to determine the actuarial value of assets.
Step 5: Verify the preliminary actuarial value of assets in Step 4 is not more than 120% of the market value of assets nor less than 80% of the market value. If it is, adjust the actuarial value of assets so it falls within the 80% - 120% corridor.

100 ACTUARIAL IPERS Comprehensive Annual Financial Report 2016
CONTRIBUTION RATE FUNDING POLICY
Background:
IPERS is charged with setting a “Required Contribution Rate” for each membership category within IPERS that will discharge its liabilities. Iowa Code §97B.11(3)(d) provides the basic framework for implementing this charge by stating:
The Required Contribution Rate that is set by the system for a membership category shall be the contribution rate the system actuarially determines, based upon the most recent actuarial valuation of the system and using the actuarial methods, assumptions, and funding policy approved by the investment board, is the rate required by the system to discharge its liabilities as a percentage of the covered wages of members in that membership category. However, the Required Contribution Rate set by the system for members in regular service for a fiscal year shall not vary by more than one percentage point from the Required Contribution Rate for the prior fiscal year.
Goal:
To establish policy and procedures in setting contribution rates that combined with investment income will fund the benefits specified in Chapter 97B of the Iowa Code.
To move towards fully funding the benefits (100% or greater funded ratio) in as expeditious manner as is reasonable within the guidelines acknowledged herein.
Procedure:
The Investment Board shall retain a consulting actuary to conduct an annual actuarial valuation of assets and liabilities. The consulting actuary shall use the entry age normal cost method and all other actuarial assumptions and methods approved by the Investment Board.
In the annual valuation process, the consulting actuary shall calculate an Actuarial Contribution Rate and a Required Contribution Rate pursuant to this policy. Each shall be calculated as a level percent of pay.
There is a one year lag between the completion of an annual actuarial valuation report and the fiscal year to which the contribution rates calculated therein are applied. Therefore, the Actuarial Contribution Rate and the Required Contribution Rate declared in the annual valuation process are applicable to the fiscal year immediately following the completion of the valuation report (for example the rates declared in the report presented to the Investment Board in December, 2013 are applicable to the rates for the fiscal year beginning July 1, 2014).
Actuarial Contribution Rate (ACR):
1. ACR is the combined employer and employee contribution rate that is the minimum rate necessary to fund thebenefits using the actuarial assumptions and methods approved by the Investment Board.
2. A separate ACR shall be determined for each membership group within IPERS according to this policy.
3. The ACR shall consist of:
a. Normal cost and an amortization payment (not less than zero) of any unfunded actuarial liability.b. Normal cost may only be offset by a negative amortization payment after a membership group has
attained a funded ratio of 110 percent or greater for 3 consecutive years.

100 ACTUARIAL IPERS Comprehensive Annual Financial Report 2016 IPERS Comprehensive Annual Financial Report 2016 ACTUARIAL 101
Required Contribution Rate:
1. The Required Contribution Rate is the combined employer and employee rate payable pursuant to this policyand Iowa Code §97B.11(3)(d).
2. The Required Contribution Rate shall be determined by comparing the ACR determined in the annual valuationprocess to the Required Contribution Rate of the previous year.
a. If the ACR is less than the previous Required Contribution Rate by fewer than 50 basis points, then theRequired Contribution Rate shall remain unchanged from the previous year.
b. If the ACR is less than the previous Required Contribution Rate by 50 basis points or more, then theRequired Contribution Rate shall be lowered by 50 basis points provided the funded ratio of themembership group is 95% or higher.
c. If the ACR is greater than the Required Contribution Rate of the previous year, then the RequiredContribution Rate shall be:
i. Increased to be equal to ACR for Sheriffs and Deputies.ii. Increased to be equal to ACR for Protection Occupation.
iii. Increased to be equal to ACR for Regular Members, or one percentage point greater thanthe prior year’s Required Contribution Rate, whichever is smaller.
Policy Guidelines:
In adopting actuarial assumptions and methods to be used in setting contribution rates, the Investment Board shall strive to provide a balance among the following:
1. Stability in contribution rates (such as use of smoothing and amortization schedules that do not producedramatic swings in the required contributions from year to year).
2. Disciplined funding approach (such as requiring full payment of normal cost and an amortization paymenttowards the unfunded actuarial liability and deferring decreases in contribution rates until strong funded ratiosare attained).
3. Interperiod equity (such as shortening the amortization schedule when reasonable and amortization ofretroactive benefit enhancements over a reasonable time period such as the average working lifetime for activemembers and the average life expectancy of retired members).
4. Support an affordable, sustainable plan (in consultation with the Benefits Advisory Committee reviewaffordability of required contribution rates and/or the benefit provisions).
5. At a minimum, this policy will be reviewed in conjunction with the quadrennial experience study.

102 ACTUARIAL IPERS Comprehensive Annual Financial Report 2016
Statistical

STATISTICAL
STATISTICAL OVERVIEW
MEMBERSHIP AND BENEFIT PAYMENT SUMMARY
INVESTMENT STATISTICS

PB STATISTICAL IPERS Comprehensive Annual Financial Report 2016 IPERS Comprehensive Annual Financial Report 2016 STATISTICAL 105
STATISTICAL OVERVIEW
ObjectivesThe objective of the Statistical section is to provide the detail and historical context needed for a thorough assessment and understanding of IPERS’ financial condition. Data in this section are presented in multiple-year format to show previous and emerging trends.
ContentsThe Statistical section provides financial, demographic, operating, and investment trend information. The financial trend information presented on pages 106–107 is intended to help explain how the System’s financial position has changed over time.
The demographic and operating information presented on pages 108–118 provides data on IPERS’ membership, including years of service, benefits, benefit options, active membership statistics, and principal participating employers.
The investment information presented on page 119 shows the growth of net investment portfolio assets and investment returns since 1987.
Tables related to types of refunds are not included in the Statistical section because IPERS pays only one type of refund—termination refunds.
Data SourcesData for the Statistical section are derived from financial statements, an actuary member file, and an actuary retirement file, all prepared by IPERS. The data in the actuary files are also used by IPERS’ actuaries to prepare the annual actuarial valuation. The investment data in the Statistical section are provided by Wilshire Associates.
MethodsIPERS uses several data extraction and statistical tools to produce the information for the Statistical section. In some cases, data are imported into Microsoft Excel for further analysis and calculations.
AssumptionsActive members are defined as those with wages reported for the last quarter of the fiscal year. Retired members and beneficiaries are those who were paid benefits in the last month of the fiscal year.

106 STATISTICAL IPERS Comprehensive Annual Financial Report 2016
Changes in Fiduciary Net Position(Dollar Values Expressed in Thousands)Fiscal Years Ended June 30
2016 2015 2014 2013 2012Additions
Employee contributions $ 459,854 $ 441,213 $ 429,196 $ 404,654 $ 366,377 Employer contributions 684,665 656,908 638,996 601,945 557,930 QBA Fund contributions --- 3 5 7 9 Service purchases 32,148 17,476 14,324 12,011 17,611 Net investment income/(loss) 624,854 1,080,045 3,904,374 2,338,201 823,983 QBA Fund income --- --- --- --- --- Miscellaneous noninvestment income --- --- --- --- 500
Total additions 1,801,521 2,195,645 4,986,895 3,356,818 1,766,410 Deductions
Trust Fund benefits* 1,840,735 1,744,598 1,764,059 1,667,462 1,549,167 QBA Fund benefits --- 3 5 7 9 Refunds 49,248 47,167 48,121 42,597 43,328 Trust Fund administrative expenses 14,939 12,592 14,866 11,587 12,498 QBA Fund administrative expenses --- --- --- --- ---
Total deductions 1,904,922 1,804,360 1,827,051 1,721,653 1,605,002 Change in net position $ (103,401) $ 391,285 $3,159,844 $1,635,165 $ 161,408
Continued on page 107
*A Schedule of Benefit Payments by Type of Benefit is found on page 112.
Note: The purpose of the Qualified Benefits Arrangement (QBA) is to permit IPERS retirees to receive the amount of their calculated monthly benefit that exceeds the IRS limits under IRC section 415(b). IPERS began collecting QBA contributions and paying QBA benefits in FY2006.

106 STATISTICAL IPERS Comprehensive Annual Financial Report 2016 IPERS Comprehensive Annual Financial Report 2016 STATISTICAL 107
Changes in Fiduciary Net Position(Dollar Values Expressed in Thousands)Fiscal Years Ended June 30Continued from page 106
2011 2010 2009 2008 2007Additions
Employee contributions $ 306,472 $ 293,472 $ 270,934 $ 245,898 $ 223,515 Employer contributions 467,633 448,765 414,966 377,080 342,769 QBA Fund contributions 8 5 23 20 --- Service purchases 14,847 12,614 9,301 10,875 8,026 Net investment income/(loss) 3,922,569 2,477,824 (3,863,761) (338,575) 3,298,842 QBA Fund income --- --- --- --- 1 Miscellaneous noninvestment income --- --- --- --- ---
Total additions 4,711,529 3,232,680 (3,168,537) 295,298 3,873,153 Deductions
Trust Fund benefits* 1,456,998 1,278,550 1,183,098 1,096,078 1,013,956 QBA Fund benefits 7 6 21 20 17 Refunds 41,215 41,470 34,337 36,205 38,116 Trust Fund administrative expenses 9,256 8,613 10,560 9,567 8,766 QBA Fund administrative expenses 1 1 1 1 1
Total deductions 1,507,477 1,328,640 1,228,017 1,141,871 1,060,856 Change in net position $3,204,052 $1,904,040 $(4,396,554) $(846,573) $2,812,297
*A Schedule of Benefit Payments by Type of Benefit is found on page 112.
Note: The purpose of the Qualified Benefits Arrangement (QBA) is to permit IPERS retirees to receive the amount of their calculated monthly benefit that exceeds the IRS limits under IRC section 415(b). IPERS began collecting QBA contributions and paying QBA benefits in FY2006.

108 STATISTICAL IPERS Comprehensive Annual Financial Report 2016
MEMBERSHIP AND BENEFIT PAYMENT SUMMARY
Special StatisticsFiscal Years Ended June 30
Fiscal Year
Retired Members
Active Members
Total Additions
Total Deductions
Total Investments
Total Net Position
2016 114,491 168,372 $1,801,520,563 $1,904,921,736 $29,276,427,008 $28,326,433,656 2015 111,368 167,367 2,195,645,133 1,804,360,197 28,806,868,252 28,429,834,829 2014 108,233 165,913 4,986,894,852 1,827,050,988 28,186,974,092 28,038,549,893 2013 104,933 165,095 3,356,818,792 1,721,653,271 25,136,870,851 24,878,706,029 2012 101,948 164,200 1,766,410,045 1,605,002,472 23,508,268,276 23,243,540,508 2011 98,540 164,467 4,711,529,286 1,507,476,979 24,064,559,555 23,082,132,935 2010 93,692 165,660 3,232,679,640 1,328,639,663 20,432,970,506 19,878,080,628 2009 89,852 167,717 (3,168,536,719) 1,228,017,619 18,715,729,776 17,974,040,651 2008 87,490 167,850 295,298,357 1,141,871,314 24,454,328,362 22,370,594,989 2007 84,949 165,241 3,873,152,655 1,060,855,755 26,605,342,485 23,217,167,946
Note: Total investments in this table include the securities lending collateral pool.

108 STATISTICAL IPERS Comprehensive Annual Financial Report 2016 IPERS Comprehensive Annual Financial Report 2016 STATISTICAL 109
Membership by GroupFiscal Years Ended June 30
Fiscal Year
Regular Members
Sheriffs and Deputies
Protection Occupation Members Total
2016 Active members 159,782 1,598 6,992 168,372
Inactive members 65,002 126 1,719 66,847
Retired members 111,103 889 2,499 114,491Total 335,887 2,613 11,210 349,710
2015 Active members 158,808 1,552 7,007 167,367Inactive members 65,625 125 1,624 67,374 Retired members 108,220 849 2,299 111,368 Total 332,653 2,526 10,930 346,109
2014 Active members 157,349 1,538 7,026 165,913 Inactive members 70,557 122 1,588 72,267 Retired members 105,298 795 2,140 108,233 Total 333,204 2,455 10,754 346,413
2013 Active members 156,679 1,527 6,889 165,095 Inactive members 71,071 121 1,432 72,624 Retired members 102,235 754 1,944 104,933 Total 329,985 2,402 10,265 342,652
2012 Active members 155,800 1,530 6,870 164,200 Inactive members 67,566 123 1,261 68,950 Retired members 99,519 674 1,755 101,948 Total 322,885 2,327 9,886 335,098
2011 Active members 156,011 1,524 6,932 164,467 Inactive members 64,712 126 1,130 65,968 Retired members 96,252 657 1,631 98,540 Total 316,975 2,307 9,693 328,975
2010 Active members 157,118 1,546 6,996 165,660 Inactive members 64,415 114 992 65,521 Retired members 91,657 616 1,419 93,692 Total 313,190 2,276 9,407 324,873
2009 Active members 159,113 1,492 7,112 167,717 Inactive members 65,855 113 874 66,842 Retired members 88,074 585 1,193 89,852 Total 313,042 2,190 9,179 324,411
2008 Active members 161,583 1,520 4,747 167,850 Inactive members 63,534 108 655 64,297 Retired members 86,072 442 976 87,490 Total 311,189 2,070 6,378 319,637
2007 Active members 159,092 1,470 4,679 165,241 Inactive members 61,501 108 633 62,242 Retired members 83,666 397 886 84,949 Total 304,259 1,975 6,198 312,432
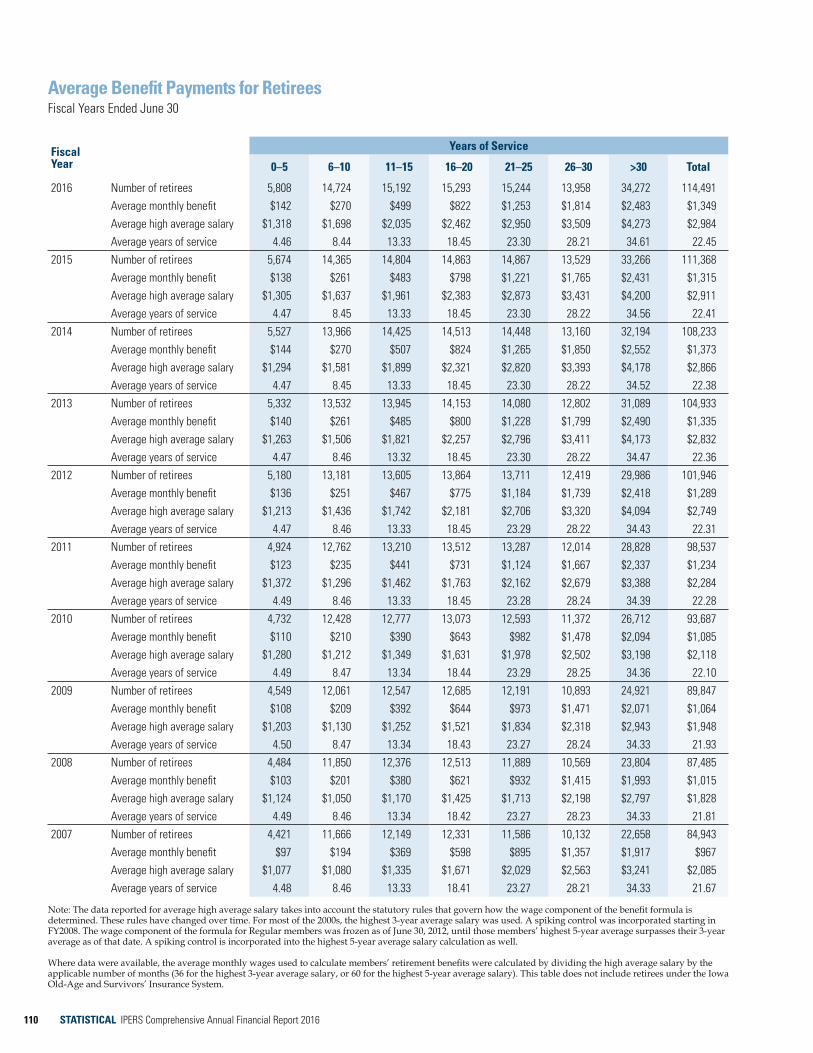
110 STATISTICAL IPERS Comprehensive Annual Financial Report 2016
Average Benefit Payments for RetireesFiscal Years Ended June 30
Fiscal Year
Years of Service
0–5 6–10 11–15 16–20 21–25 26–30 >30 Total
2016 Number of retirees 5,808 14,724 15,192 15,293 15,244 13,958 34,272 114,491Average monthly benefit $142 $270 $499 $822 $1,253 $1,814 $2,483 $1,349Average high average salary $1,318 $1,698 $2,035 $2,462 $2,950 $3,509 $4,273 $2,984Average years of service 4.46 8.44 13.33 18.45 23.30 28.21 34.61 22.45
2015 Number of retirees 5,674 14,365 14,804 14,863 14,867 13,529 33,266 111,368 Average monthly benefit $138 $261 $483 $798 $1,221 $1,765 $2,431 $1,315 Average high average salary $1,305 $1,637 $1,961 $2,383 $2,873 $3,431 $4,200 $2,911 Average years of service 4.47 8.45 13.33 18.45 23.30 28.22 34.56 22.41
2014 Number of retirees 5,527 13,966 14,425 14,513 14,448 13,160 32,194 108,233 Average monthly benefit $144 $270 $507 $824 $1,265 $1,850 $2,552 $1,373 Average high average salary $1,294 $1,581 $1,899 $2,321 $2,820 $3,393 $4,178 $2,866 Average years of service 4.47 8.45 13.33 18.45 23.30 28.22 34.52 22.38
2013 Number of retirees 5,332 13,532 13,945 14,153 14,080 12,802 31,089 104,933 Average monthly benefit $140 $261 $485 $800 $1,228 $1,799 $2,490 $1,335 Average high average salary $1,263 $1,506 $1,821 $2,257 $2,796 $3,411 $4,173 $2,832 Average years of service 4.47 8.46 13.32 18.45 23.30 28.22 34.47 22.36
2012 Number of retirees 5,180 13,181 13,605 13,864 13,711 12,419 29,986 101,946 Average monthly benefit $136 $251 $467 $775 $1,184 $1,739 $2,418 $1,289 Average high average salary $1,213 $1,436 $1,742 $2,181 $2,706 $3,320 $4,094 $2,749 Average years of service 4.47 8.46 13.33 18.45 23.29 28.22 34.43 22.31
2011 Number of retirees 4,924 12,762 13,210 13,512 13,287 12,014 28,828 98,537 Average monthly benefit $123 $235 $441 $731 $1,124 $1,667 $2,337 $1,234 Average high average salary $1,372 $1,296 $1,462 $1,763 $2,162 $2,679 $3,388 $2,284 Average years of service 4.49 8.46 13.33 18.45 23.28 28.24 34.39 22.28
2010 Number of retirees 4,732 12,428 12,777 13,073 12,593 11,372 26,712 93,687 Average monthly benefit $110 $210 $390 $643 $982 $1,478 $2,094 $1,085 Average high average salary $1,280 $1,212 $1,349 $1,631 $1,978 $2,502 $3,198 $2,118 Average years of service 4.49 8.47 13.34 18.44 23.29 28.25 34.36 22.10
2009 Number of retirees 4,549 12,061 12,547 12,685 12,191 10,893 24,921 89,847 Average monthly benefit $108 $209 $392 $644 $973 $1,471 $2,071 $1,064 Average high average salary $1,203 $1,130 $1,252 $1,521 $1,834 $2,318 $2,943 $1,948 Average years of service 4.50 8.47 13.34 18.43 23.27 28.24 34.33 21.93
2008 Number of retirees 4,484 11,850 12,376 12,513 11,889 10,569 23,804 87,485 Average monthly benefit $103 $201 $380 $621 $932 $1,415 $1,993 $1,015 Average high average salary $1,124 $1,050 $1,170 $1,425 $1,713 $2,198 $2,797 $1,828 Average years of service 4.49 8.46 13.34 18.42 23.27 28.23 34.33 21.81
2007 Number of retirees 4,421 11,666 12,149 12,331 11,586 10,132 22,658 84,943 Average monthly benefit $97 $194 $369 $598 $895 $1,357 $1,917 $967 Average high average salary $1,077 $1,080 $1,335 $1,671 $2,029 $2,563 $3,241 $2,085 Average years of service 4.48 8.46 13.33 18.41 23.27 28.21 34.33 21.67
Note: The data reported for average high average salary takes into account the statutory rules that govern how the wage component of the benefit formula is determined. These rules have changed over time. For most of the 2000s, the highest 3-year average salary was used. A spiking control was incorporated starting in FY2008. The wage component of the formula for Regular members was frozen as of June 30, 2012, until those members’ highest 5-year average surpasses their 3-year average as of that date. A spiking control is incorporated into the highest 5-year average salary calculation as well.
Where data were available, the average monthly wages used to calculate members’ retirement benefits were calculated by dividing the high average salary by the applicable number of months (36 for the highest 3-year average salary, or 60 for the highest 5-year average salary). This table does not include retirees under the Iowa Old-Age and Survivors’ Insurance System.

110 STATISTICAL IPERS Comprehensive Annual Financial Report 2016 IPERS Comprehensive Annual Financial Report 2016 STATISTICAL 111
New Retirees by Employer TypeFiscal Years Ended June 30
Fiscal Year City County Education State Utility Health
28E Agency
Township & Cemetery Other Total
2016 Number of retirees 872 986 3,049 908 66 --- --- --- 130 6,011 Average monthly benefit $1,636 $1,642 $1,677 $2,380 $1,888 --- --- --- $789 $1,755 Average years of service 21.24 21.42 21.62 23.02 20.36 --- --- --- 13.95 21.56
2015 Number of retirees 657 637 3,102 899 52 528 --- --- 95 5,970Average monthly benefit $1,750 $1,737 $1,580 $2,422 $1,833 $1,369 --- --- $893 $1,715 Average years of service 21.90 22.21 21.48 23.72 19.71 18.28 --- --- 14.17 21.53
2014 Number of retirees 810 608 3,064 986 62 426 --- --- 120 6,076 Average monthly benefit $1,550 $1,566 $1,642 $2,170 $1,739 $1,232 --- --- $760 $1,663 Average years of service 20.61 21.30 21.70 22.24 19.78 17.46 --- --- 12.73 21.11
2013 Number of retirees 665 673 3,011 809 50 473 --- --- 133 5,814 Average monthly benefit $1,655 $1,593 $1,685 $2,327 $1,833 $1,271 --- --- $849 $1,709 Average years of service 21.78 21.66 22.11 23.46 21.66 17.47 --- --- 14.10 21.64
2012 Number of retirees 671 617 3,487 618 53 463 --- --- 112 6,021 Average monthly benefit $1,547 $1,549 $1,728 $2,253 $1,754 $1,378 --- --- $1,024 $1,703 Average years of service 21.63 21.47 22.45 21.22 21.78 18.28 --- --- 15.57 21.68
2011 Number of retirees 776 859 3,822 1,728 55 --- 82 --- 38 7,360 Average monthly benefit $1,387 $1,397 $1,799 $2,285 $1,741 --- $655 --- $544 $1,803 Average years of service 20.51 20.80 23.95 25.85 23.00 --- 13.11 --- 11.93 23.48
2010 Number of retirees 786 811 3,186 1,476 31 --- 58 3 34 6,385 Average monthly benefit $1,274 $1,317 $1,739 $2,119 $1,471 --- $620 $1,098 $606 $1,698 Average years of service 20.25 20.40 23.92 25.14 19.70 --- 12.12 20.50 11.62 23.11
2009 Number of retirees 620 800 2,571 765 44 --- 49 --- 28 4,877 Average monthly benefit $1,226 $1,241 $1,610 $2,067 $1,586 --- $881 --- $467 $1,558 Average years of service 20.62 19.69 23.34 24.40 21.46 --- 14.51 --- 11.75 22.39
2008 Number of retirees 697 738 2,730 777 35 --- 52 1 31 5,061 Average monthly benefit $1,261 $1,119 $1,552 $1,901 $1,872 --- $617 $112 $578 $1,489 Average years of service 20.66 19.76 23.25 23.71 24.74 --- 13.61 6.25 12.61 22.29
2007 Number of retirees 620 809 2,697 965 32 --- 50 2 26 5,201 Average monthly benefit $1,108 $1,190 $1,570 $1,936 $1,057 --- $752 $314 $376 $1,506 Average years of service 19.71 20.04 23.72 24.85 18.94 --- 14.54 6.75 8.03 22.67
Note: With the implementation of I-Que, revised employer classifications are being used for FY2012 and forward. Health was previously reported separately to assist in tracking licensed health care professionals due to a unique bona fide retirement provision that is no longer in effect.

112 STATISTICAL IPERS Comprehensive Annual Financial Report 2016
Schedule of Benefit Payments by Type of BenefitFiscal Years Ended June 30
Fiscal Year
Number of
Retirees
Normal Retirement
Benefit
Early Retirement
Benefit
Death Benefit
(Normal, Early, or Disability Retirement)
Preretirement Death Benefit
Disability Benefit
Special Service
In-Service Disability
Benefit
Special Service Ordinary Disability
Benefit
Total
2016 114,491 $1,358,625,886 $330,328,320 $54,759,110 $5,157,531 $42,716,696 $1,305,876 $402,828 $1,793,296,247 2015 111,368 1,280,932,627 318,701,798 50,655,108 4,815,714 41,345,123 1,206,633 415,647 1,698,072,650 2014 108,233 1,291,948,738 328,584,720 50,993,939 4,569,515 43,468,128 1,080,553 409,438 1,721,055,031 2013 104,933 1,215,721,455 312,460,044 46,566,814 4,155,084 41,507,779 902,784 372,139 1,621,686,099 2012 101,948 1,134,393,596 290,216,887 43,180,523 3,595,564 39,968,472 801,062 362,184 1,512,518,288 2011 98,540 1,088,085,798 253,413,138 39,533,700 3,096,481 28,381,456 771,831 376,798 1,413,659,202 2010 93,692 951,375,232 220,803,713 36,386,690 2,653,287 27,960,711 624,888 330,890 1,240,135,411 2009 89,852 882,890,118 197,219,959 33,554,573 2,323,743 28,042,167 584,892 304,352 1,144,919,804 2008 87,490 818,804,704 180,411,922 30,892,964 1,919,799 28,284,772 563,314 303,042 1,061,180,517 2007 84,949 758,739,140 159,904,983 28,429,483 1,637,857 27,449,602 489,088 287,504 976,937,657
Note: This table does not include lump-sum payments.
Schedule of Retired Members by Type of BenefitAs of June 30, 2016
Amount of Monthly Benefit
Number of
Retirees
Normal Retirement
Benefit
Early Retirement
Benefit
Death Benefit
(Normal, Early, or Disability Retirement)
Preretirement Death Benefit
Disability Benefit
Special Service
In-Service Disability
Benefit
Special Service Ordinary Disability
Benefit
$ <250 20,292 8,911 9,649 872 105 754 1 --- 250–499 16,530 6,981 7,540 1,067 84 857 --- 1 500–749 11,470 5,030 4,914 846 70 610 --- --- 750–999 8,673 4,154 3,312 698 42 467 --- ---
1,000–1,249 8,036 4,486 2,570 557 31 391 1 --- 1,250–1,499 6,417 3,713 2,008 372 38 280 2 41,500–1,749 5,841 3,805 1,511 281 24 211 3 61,750–1,999 5,794 4,285 1,122 191 25 157 11 32,000–2,249 5,826 4,629 924 138 16 108 8 32,250–2,499 5,360 4,499 661 107 11 74 5 32,500–2,749 4,755 4,144 471 78 10 51 1 --- 2,750–2,999 3,985 3,554 352 24 5 42 8 --- 3,000–3,249 3,170 2,921 182 36 3 26 2 --- 3,250–3,499 2,333 2,175 114 26 --- 16 2 ---3,500–3,749 1,685 1,566 89 19 2 7 2 --- 3,750–3,999 1,186 1,102 58 14 2 9 1 ---
4,000+ 3,138 2,908 155 20 5 49 1 --- Total 114,491 68,863 35,632 5,346 473 4,109 48 20
Note: The above tables do not include types of refunds because IPERS pays only one type of refund (termination refunds).

112 STATISTICAL IPERS Comprehensive Annual Financial Report 2016 IPERS Comprehensive Annual Financial Report 2016 STATISTICAL 113
Retired Members by Benefit OptionAs of June 30, 2016
Amount of Monthly Benefit
Number of Retirees Option 1 Option 2 Option 3 Option 4 Option 5 Option 6 Misc.
$ <250 20,292 6,012 4,900 3,890 2,007 2,203 1,270 10 250–499 16,530 4,987 4,028 2,245 2,174 1,685 1,404 7 500–749 11,470 3,320 2,716 1,315 1,741 1,117 1,261 --- 750–999 8,673 2,246 1,991 968 1,520 780 1,168 ---
1,000–1,249 8,036 1,952 1,821 802 1,556 698 1,207 --- 1,250–1,499 6,417 1,445 1,416 597 1,217 557 1,185 --- 1,500–1,749 5,841 1,333 1,127 529 1,107 551 1,194 --- 1,750–1,999 5,794 1,091 1,194 557 1,017 588 1,347 --- 2,000–2,249 5,826 1,138 1,111 590 843 587 1,557 --- 2,250–2,499 5,360 926 1,055 570 735 509 1,565 --- 2,500–2,749 4,755 786 947 562 510 439 1,511 --- 2,750–2,999 3,985 672 837 460 329 399 1,288 --- 3,000–3,249 3,170 495 648 375 296 263 1,093 --- 3,250–3,499 2,333 361 506 234 236 187 809 --- 3,500–3,749 1,685 221 373 208 166 124 593 --- 3,750–3,999 1,186 173 256 130 108 106 413 ---
4,000+ 3,138 406 572 361 376 300 1,123 --- Total 114,491 27,564 25,498 14,393 15,938 11,093 19,988 17
See definitions of benefit options beginning on page 36.Note: Miscellaneous column consists of survivor death benefits based upon law provisions no longer available.

114 STATISTICAL IPERS Comprehensive Annual Financial Report 2016
Benefit Payments by Iowa CountyFiscal Year 2016
County Amount Annual Average Payees County Amount Annual Average Payees
Adair $ 4,942,520 $13,215 374 Johnson $ 51,999,764 $17,055 3,049
Adams 2,750,353 12,733 216 Jones 14,694,222 16,529 889
Allamakee 7,433,268 13,180 564 Keokuk 5,874,105 12,445 472
Appanoose 7,243,710 14,203 510 Kossuth 9,251,603 14,103 656
Audubon 3,721,831 12,203 305 Lee 19,954,924 16,588 1,203
Benton 12,665,415 14,642 865 Linn 100,990,953 17,585 5,743
Black Hawk 62,302,878 16,430 3,792 Louisa 5,279,182 13,966 378
Boone 20,160,806 15,975 1,262 Lucas 5,626,495 14,066 400
Bremer 15,872,388 16,049 989 Lyon 4,173,676 12,962 322
Buchanan 14,368,782 15,567 923 Madison 9,166,870 14,905 615
Buena Vista 10,281,841 14,261 721 Mahaska 10,604,378 13,613 779
Butler 8,712,596 13,404 650 Marion 15,089,388 13,959 1,081
Calhoun 7,030,035 13,624 516 Marshall 26,708,703 15,785 1,692
Carroll 9,122,330 12,652 721 Mills 13,569,190 17,047 796
Cass 11,247,542 15,261 737 Mitchell 6,376,260 13,480 473
Cedar 9,422,963 14,655 643 Monona 5,868,887 13,492 435
Cerro Gordo 26,222,651 15,912 1,648 Monroe 4,769,754 14,154 337
Cherokee 10,036,441 14,399 697 Montgomery 7,366,347 14,501 508
Chickasaw 7,156,126 14,725 486 Muscatine 19,762,335 15,367 1,286
Clarke 4,966,318 12,900 385 O’Brien 7,043,042 12,995 542
Clay 10,634,919 13,920 764 Osceola 2,656,363 12,649 210
Clayton 11,513,886 14,268 807 Page 12,147,045 14,813 820
Clinton 19,982,086 13,848 1,443 Palo Alto 6,904,533 13,177 524
Crawford 8,249,120 13,457 613 Plymouth 11,677,161 13,918 839
Dallas 36,541,948 17,286 2,114 Pocahontas 5,148,019 13,583 379
Davis 6,414,928 14,161 453 Polk 232,407,335 18,452 12,595
Decatur 4,432,177 11,979 370 Pottawattamie 36,830,470 16,575 2,222
Delaware 10,823,097 15,573 695 Poweshiek 9,168,749 15,410 595
Des Moines 22,509,107 16,252 1,385 Ringgold 3,845,220 11,723 328
Dickinson 15,474,426 15,937 971 Sac 6,105,752 12,991 470
Dubuque 38,603,421 15,899 2,428 Scott 69,876,673 18,009 3,880
Emmet 6,067,493 14,045 432 Shelby 7,646,948 13,828 553
Fayette 11,361,275 14,096 806 Sioux 10,574,106 12,664 835
Floyd 9,934,899 14,610 680 Story 55,891,977 18,307 3,053
Franklin 6,305,705 13,859 455 Tama 10,847,672 14,659 740
Fremont 4,540,781 13,355 340 Taylor 4,100,118 12,425 330
Greene 7,417,399 13,059 568 Union 9,602,635 13,544 709
Grundy 7,800,452 13,426 581 Van Buren 5,888,898 14,021 420
Guthrie 8,525,342 14,185 601 Wapello 19,129,533 15,915 1,202
Hamilton 11,485,508 15,334 749 Warren 31,758,188 17,973 1,767
Hancock 5,330,552 12,254 435 Washington 10,851,289 12,373 877
Hardin 13,350,470 13,980 955 Wayne 3,870,647 11,983 323
Harrison 6,411,677 12,953 495 Webster 19,969,584 14,947 1,336
Henry 15,932,739 16,528 964 Winnebago 5,766,118 13,795 418
Howard 5,839,150 12,345 473 Winneshiek 13,526,380 15,080 897
Humboldt 6,161,424 12,836 480 Woodbury 44,106,526 16,409 2,688
Ida 3,602,243 13,391 269 Worth 3,278,402 13,061 251
Iowa 9,148,064 15,247 600 Wright 7,713,178 12,942 596
Jackson 10,563,645 14,314 738
Jasper 21,429,009 15,144 1,415 Total Iowa Benefit Payments: $1,625,956,965 Jefferson 8,449,632 14,593 579
Note: Payments determined by zip code.
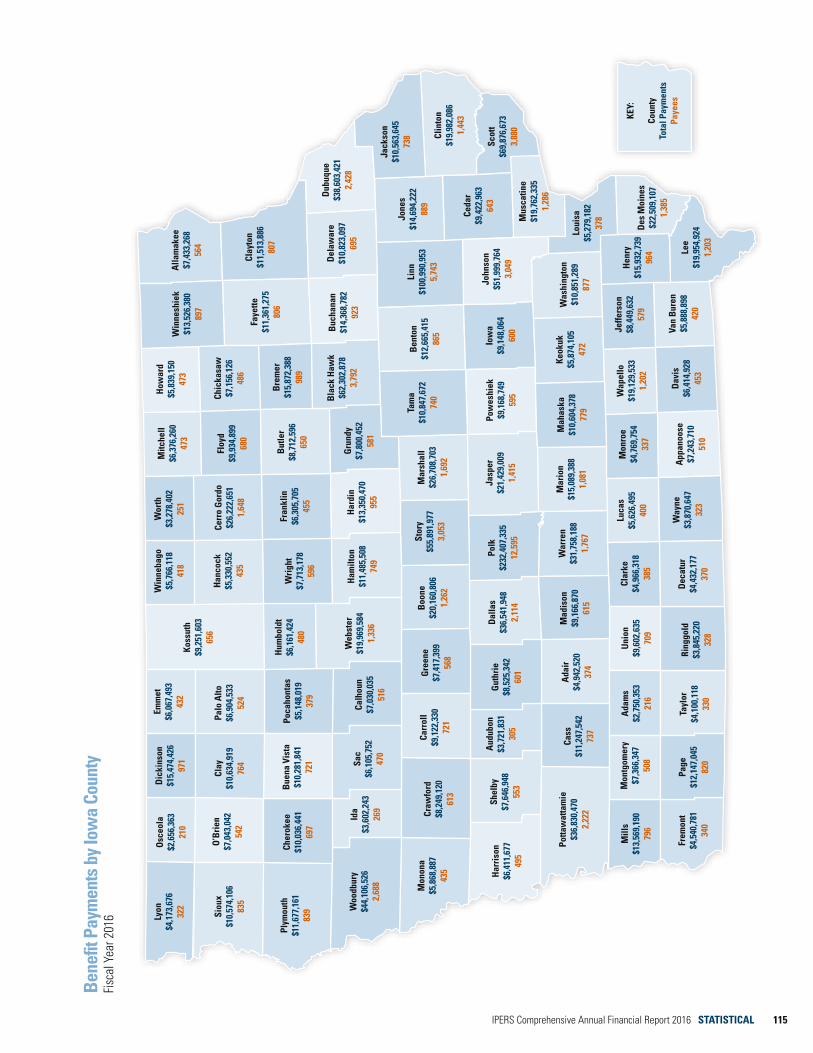
114 STATISTICAL IPERS Comprehensive Annual Financial Report 2016 IPERS Comprehensive Annual Financial Report 2016 STATISTICAL 115
Bene
fit P
aym
ents
by
Iow
a Co
unty
Fisc
al Y
ear 2
016 Ly
on$4
,173
,676
32
2
Osc
eola
$2,6
56,3
63
210
Dic
kins
on$1
5,47
4,42
6 97
1
Emm
et$6
,067
,493
43
2Ko
ssut
h$9
,251
,603
65
6
Win
neba
go$5
,766
,118
41
8
Wor
th$3
,278
,402
25
1
Mitc
hell
$6,3
76,2
60
473
How
ard
$5,8
39,1
50
473
Win
nesh
iek
$13,
526,
380
897
Alla
mak
ee$7
,433
,268
56
4
Siou
x$1
0,57
4,10
6 83
5
O’B
rien
$7,0
43,0
42
542
Clay
$10,
634,
919
764
Palo
Alto
$6,9
04,5
33
524
Han
cock
$5,3
30,5
5243
5
Cerr
o G
ordo
$26,
222,
651
1,64
8
Floy
d$9
,934
,899
68
0
Chic
kasa
w$7
,156
,126
48
6Fa
yette
$11,
361,
275
806
Clay
ton
$11,
513,
886
807
Plym
outh
$11,
677,
161
839
Cher
okee
$10,
036,
441
697
Bue
na V
ista
$10,
281,
841
721
Poca
hont
as$5
,148
,019
37
9
Hum
bold
t$6
,161
,424
48
0W
righ
t$7
,713
,178
59
6
Fran
klin
$6,3
05,7
05
455
But
ler
$8,7
12,5
96
650
Bre
mer
$15,
872,
388
989
Dub
uque
$38,
603,
421
2,42
8
Del
awar
e$1
0,82
3,09
7 69
5
Buc
hana
n$1
4,36
8,78
2 92
3
Bla
ck H
awk
$62,
302,
878
3,79
2G
rund
y$7
,800
,452
58
1
Har
din
$13,
350,
470
955
Ham
ilton
$11,
485,
508
749
Web
ster
$19,
969,
584
1,33
6Ca
lhou
n$7
,030
,035
51
6
Sac
$6,1
05,7
52
470
Ida
$3,6
02,2
43
269
Woo
dbur
y$4
4,10
6,52
6 2,
688 Mon
ona
$5,8
68,8
87
435
Craw
ford
$8,2
49,1
20
613
Carr
oll
$9,1
22,3
30
721
Gre
ene
$7,4
17,3
99
568
Boo
ne$2
0,16
0,80
6 1,
262
Stor
y$5
5,89
1,97
7 3,
053
Mar
shal
l$2
6,70
8,70
3 1,
692
Tam
a$1
0,84
7,67
2 74
0
Ben
ton
$12,
665,
415
865
Linn
$100
,990
,953
5,
743
Jone
s$1
4,69
4,22
2 88
9
Jack
son
$10,
563,
645
738 Cl
into
n$1
9,98
2,08
6 1,
443
Scot
t$6
9,87
6,67
3 3,
880
Ceda
r$9
,422
,963
64
3Jo
hnso
n$5
1,99
9,76
4 3,
049
Mus
catin
e$1
9,76
2,33
51,
286
Loui
sa$5
,279
,182
37
8
Des
Moi
nes
$22,
509,
107
1,38
5
Lee
$19,
954,
924
1,20
3
Hen
ry$1
5,93
2,73
9 96
4
Van
Bur
en$5
,888
,898
42
0
Iow
a$9
,148
,064
60
0
Pow
eshi
ek$9
,168
,749
59
5
Jasp
er$2
1,42
9,00
9 1,
415
Polk
$232
,407
,335
12
,595
Dal
las
$36,
541,
948
2,11
4
Gut
hrie
$8,5
25,3
42
601
Aud
ubon
$3,7
21,8
31
305
Shel
by$7
,646
,948
55
3
Har
riso
n$6
,411
,677
49
5
Potta
wat
tam
ie$3
6,83
0,47
0 2,
222
Cass
$11,
247,
542
737
Mill
s$1
3,56
9,19
0 79
6
Frem
ont
$4,5
40,7
81
340
Page
$12,
147,
045
820
Mon
tgom
ery
$7,3
66,3
47
508
Tayl
or$4
,100
,118
33
0
Ring
gold
$3,8
45,2
20
328
Uni
on$9
,602
,635
70
9
Ada
ms
$2,7
50,3
53
216
Ada
ir$4
,942
,520
37
4
Mad
ison
$9,1
66,8
7061
5
War
ren
$31,
758,
188
1,76
7
Mar
ion
$15,
089,
388
1,08
1
Mah
aska
$10,
604,
378
779
Keok
uk$5
,874
,105
47
2
Was
hing
ton
$10,
851,
289
877
Jeffe
rson
$8,4
49,6
32
579
Wap
ello
$19,
129,
533
1,20
2
Mon
roe
$4,7
69,7
54
337
Way
ne$3
,870
,647
32
3
Luca
s$5
,626
,495
40
0
Dec
atur
$4,4
32,1
77
370
Clar
ke$4
,966
,318
38
5
App
anoo
se$7
,243
,710
51
0
Dav
is$6
,414
,928
45
3
KEY:
Coun
tyTo
tal P
aym
ents
Paye
es

116 STATISTICAL IPERS Comprehensive Annual Financial Report 2016
Bene
fit P
aym
ents
by
Stat
eFi
scal
Yea
r 201
6
WA
$3,0
05,9
72
276
OR
$2,7
76,1
74
217
CA$4
,715
,826
45
2
NV
$2,5
24,1
57
181
ID$8
24,7
50
79
UT
$585
,166
58
AZ
$21,
125,
708
1,55
8
MT
$847
,562
77
WY
$518
,965
51
CO$1
0,26
4,97
8 76
7
NM
$1,3
93,6
75
138
TX$1
3,25
3,08
9 1,
070
ND
$383
,350
37 SD
$10,
495,
173
705 NE
$20,
391,
848
1,33
3
KS$4
,547
,093
40
0
OK
$1,6
59,9
20
163
IA$1
,625
,956
,965
10
3,17
5 MO
$19,
501,
141
1,49
0
MN
$16,
289,
422
1,36
1
MI
$2,2
04,9
84
207
WI
$7,8
88,8
16
679
IL$1
9,67
8,62
9 1,
358
IN$1
,410
,432
16
2
OH
$1,4
40,1
6414
9
PA$8
19,7
62
92
NY
$616
,628
60
ME
$348
,772
33
AR
$6,6
64,9
33
502
LA$3
70,1
62
34
AL
$877
,346
93
GA
$1,7
91,2
04
146
MS
$529
,432
42
TN$2
,730
,440
20
0
KY$8
28,1
96
66
WV
$86,
829
11
VA$1
,289
,593
13
6
SC$1
,434
,073
12
2
NC
$3,1
02,0
98
249 VT
$72,
085
7
NH
$128
,533
17
MA
$293
,659
46
RI$6
4,43
5 7
NJ
$434
,829
28
MD
$768
,052
52
FL$2
2,09
6,08
9 1,
393
DC
$202
,976
17
DE
$65,
059
11
CT$2
84,4
06
23
HI
$407
,307
20
AK
$230
,395
20
KEY:
STAT
ETo
tal P
aym
ents
Paye
es
In th
e Un
ited
Stat
es
(not
incl
udin
g Io
wa)
$214
,384
,328
pai
d16
,404
pay
ees*
* Inc
lude
s th
e fo
llow
ing
paye
es:
Arm
ed F
orce
s Eu
rope
......
.3
Arm
ed F
orce
s Pa
cific
......
..3
Arm
ed F
orce
s Am
eric
as
(exc
ept C
anad
a)...
......
......
.1
Nor
ther
n M
aria
na
Isla
nds .
......
......
......
......
.....1
Virg
in Is
land
s....
......
......
....1
Outs
ide
the
Unite
d St
ates
$3
93,3
15 p
aid
46 p
ayee
s
Cana
da ..
......
......
......
......
.17
Germ
any .
......
......
......
......
..7
Indi
a ...
......
......
......
......
......
3 Au
stra
lia ...
......
......
......
......
2 Ire
land
.....
......
......
......
......
.2
Japa
n....
......
......
......
......
....2
Ph
ilipp
ines
......
......
......
......
2 Sw
eden
.....
......
......
......
.....2
Co
sta
Rica
.....
......
......
......
.1
Czec
h Re
publ
ic ...
......
......
..1
Egyp
t.....
......
......
......
......
....1
Fr
ance
......
......
......
......
......
.1
Mal
ta ...
......
......
......
......
.....1
M
exic
o....
......
......
......
......
..1
Nor
way
......
......
......
......
.....1
Sp
ain
......
......
......
......
......
..1
Unite
d Ki
ngdo
m...
......
......
.1
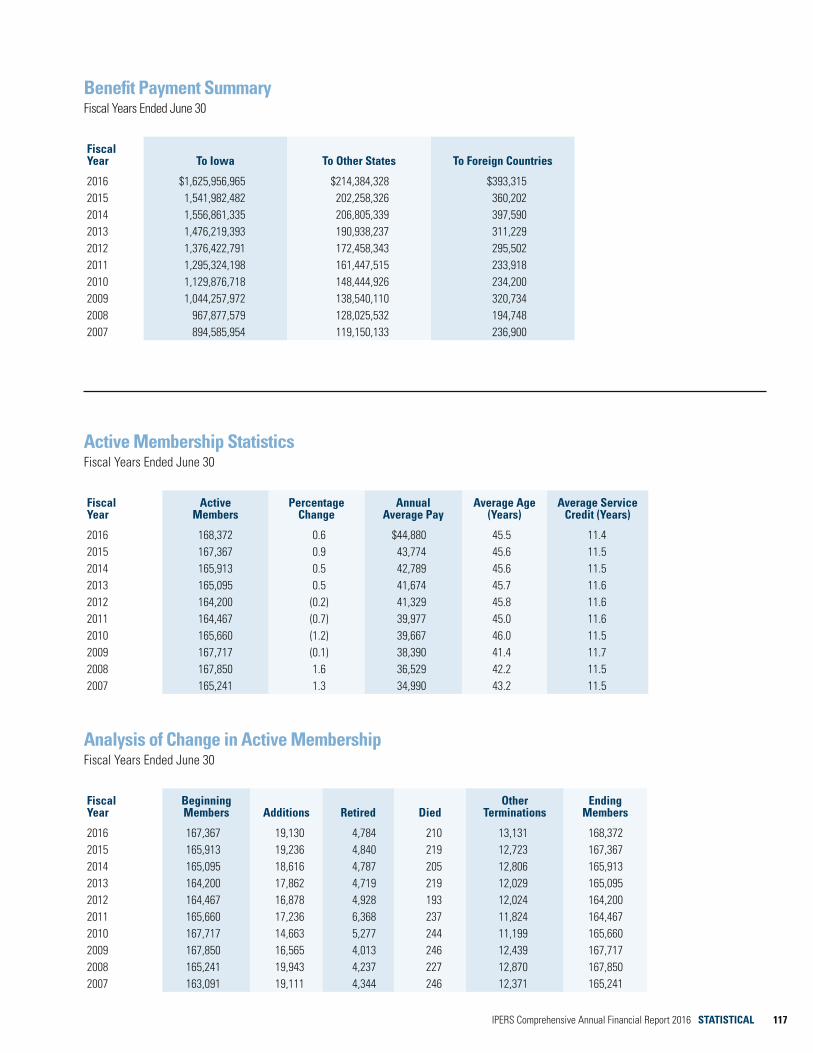
116 STATISTICAL IPERS Comprehensive Annual Financial Report 2016 IPERS Comprehensive Annual Financial Report 2016 STATISTICAL 117
Benefit Payment SummaryFiscal Years Ended June 30
Fiscal Year To Iowa To Other States To Foreign Countries
2016 $1,625,956,965 $214,384,328 $393,315 2015 1,541,982,482 202,258,326 360,202 2014 1,556,861,335 206,805,339 397,590 2013 1,476,219,393 190,938,237 311,229 2012 1,376,422,791 172,458,343 295,502 2011 1,295,324,198 161,447,515 233,918 2010 1,129,876,718 148,444,926 234,200 2009 1,044,257,972 138,540,110 320,734 2008 967,877,579 128,025,532 194,748 2007 894,585,954 119,150,133 236,900
Active Membership StatisticsFiscal Years Ended June 30
Fiscal Year
Active Members
Percentage Change
Annual Average Pay
Average Age (Years)
Average Service Credit (Years)
2016 168,372 0.6 $44,880 45.5 11.42015 167,367 0.9 43,774 45.6 11.5 2014 165,913 0.5 42,789 45.6 11.5 2013 165,095 0.5 41,674 45.7 11.6 2012 164,200 (0.2) 41,329 45.8 11.6 2011 164,467 (0.7) 39,977 45.0 11.6 2010 165,660 (1.2) 39,667 46.0 11.5 2009 167,717 (0.1) 38,390 41.4 11.7 2008 167,850 1.6 36,529 42.2 11.5 2007 165,241 1.3 34,990 43.2 11.5
Analysis of Change in Active MembershipFiscal Years Ended June 30
Fiscal Year
Beginning Members Additions Retired Died
Other Terminations
Ending Members
2016 167,367 19,130 4,784 210 13,131 168,3722015 165,913 19,236 4,840 219 12,723 167,367 2014 165,095 18,616 4,787 205 12,806 165,913 2013 164,200 17,862 4,719 219 12,029 165,095 2012 164,467 16,878 4,928 193 12,024 164,200 2011 165,660 17,236 6,368 237 11,824 164,467 2010 167,717 14,663 5,277 244 11,199 165,660 2009 167,850 16,565 4,013 246 12,439 167,717 2008 165,241 19,943 4,237 227 12,870 167,850 2007 163,091 19,111 4,344 246 12,371 165,241
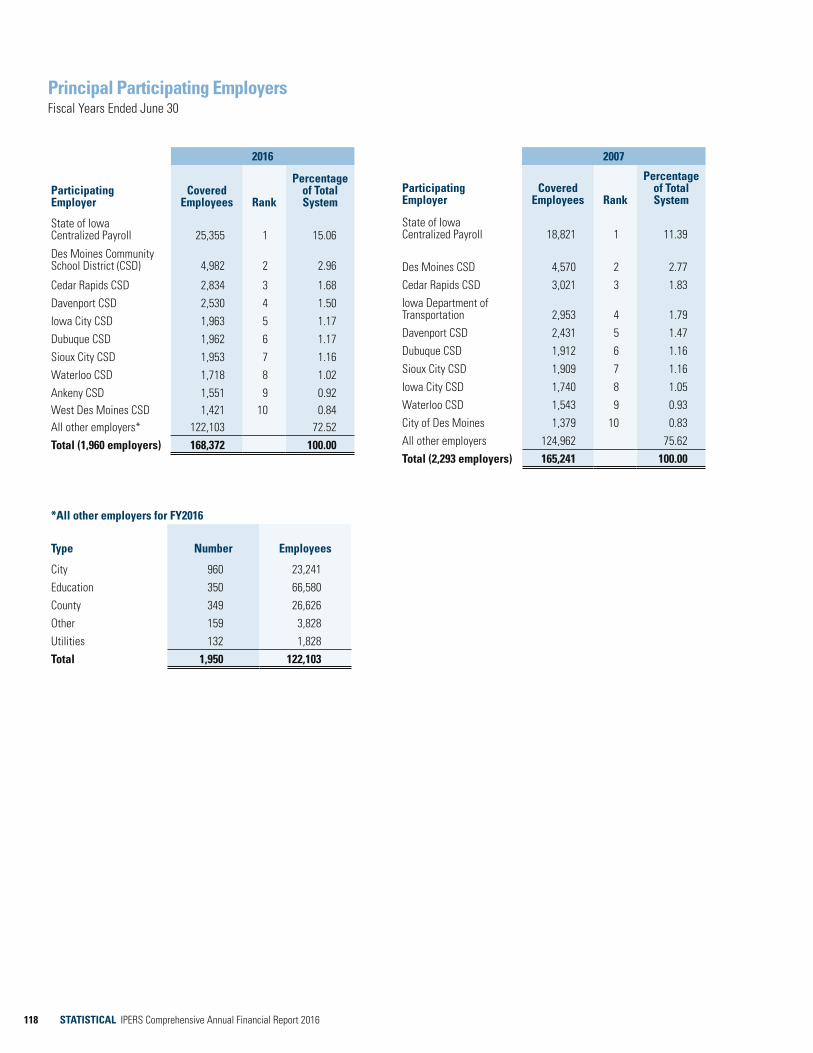
118 STATISTICAL IPERS Comprehensive Annual Financial Report 2016
Principal Participating EmployersFiscal Years Ended June 30
2016
Participating Employer
Covered Employees Rank
Percentage of Total System
State of Iowa Centralized Payroll 25,355 1 15.06
Des Moines Community School District (CSD) 4,982 2 2.96
Cedar Rapids CSD 2,834 3 1.68Davenport CSD 2,530 4 1.50Iowa City CSD 1,963 5 1.17 Dubuque CSD 1,962 6 1.17 Sioux City CSD 1,953 7 1.16Waterloo CSD 1,718 8 1.02 Ankeny CSD 1,551 9 0.92 West Des Moines CSD 1,421 10 0.84 All other employers* 122,103 72.52 Total (1,960 employers) 168,372 100.00
2007
Participating Employer
Covered Employees Rank
Percentage of Total System
State of IowaCentralized Payroll 18,821 1 11.39
Des Moines CSD 4,570 2 2.77Cedar Rapids CSD 3,021 3 1.83Iowa Department of Transportation 2,953 4 1.79Davenport CSD 2,431 5 1.47Dubuque CSD 1,912 6 1.16
Sioux City CSD 1,909 7 1.16
Iowa City CSD 1,740 8 1.05Waterloo CSD 1,543 9 0.93City of Des Moines 1,379 10 0.83 All other employers 124,962 75.62Total (2,293 employers) 165,241 100.00
*All other employers for FY2016
Type Number Employees
City 960 23,241Education 350 66,580County 349 26,626Other 159 3,828Utilities 132 1,828 Total 1,950 122,103

118 STATISTICAL IPERS Comprehensive Annual Financial Report 2016 IPERS Comprehensive Annual Financial Report 2016 STATISTICAL 119
$30
$25
$20
$15
$10
$5
$0
Billi
ons
$28.268 billion
1987
1988
1989
1990
1991
1992
1993
1994
1995
1996
1997
1998
1999
2000
2001
2002
2003
2004
2005
2006
2007
2008
2009
2010
2011
2012
2013
2014
2015
2016
30-year annualized return = 8.64% Current actuarial assumed investment return = 7.50%* 30
25
20
15
10
5
0
–5
–10
–15
–20
Annu
al re
turn
s (%
)
1987
1988
1989
1990
1991
1992
1993
1994
1995
1996
1997
1998
1999
2000
2001
2
002
2003
2004
2005
2006
2007
2008
2
009
2010
2011
2012
2013
2014
2015
2016
*Actuarial assumed investment return:1953–1993: 6.50%1994–1995: 6.75%1996–present: 7.50%
Annualized returns for periods ended June 30, 20161-year return: 2.15%3-year return: 7.17%5-year return: 7.06%10-year return: 6.31%
15-year return: 6.62%20-year return: 7.85%25-year return: 8.43%30-year return: 8.64%
INVESTMENT STATISTICS
Growth of Net Investment Portfolio AssetsFiscal Years Ended June 30
Investment Returns Fiscal Years Ended June 30
2007
Participating Employer
Covered Employees Rank
Percentage of Total System
State of IowaCentralized Payroll 18,821 1 11.39
Des Moines CSD 4,570 2 2.77Cedar Rapids CSD 3,021 3 1.83Iowa Department of Transportation 2,953 4 1.79Davenport CSD 2,431 5 1.47Dubuque CSD 1,912 6 1.16
Sioux City CSD 1,909 7 1.16
Iowa City CSD 1,740 8 1.05Waterloo CSD 1,543 9 0.93City of Des Moines 1,379 10 0.83 All other employers 124,962 75.62Total (2,293 employers) 165,241 100.00

120 STATISTICAL IPERS Comprehensive Annual Financial Report 2016


www.ipers.org
515-281-00201-800-622-3849 (toll-free)Monday–Friday7:30 a.m.–5 p.m. Central Time
Fax: 515-281-0053
MAILING ADDRESSIowa Public Employees’ Retirement System P.O. Box 9117 Des Moines, IA 50306-9117
OFFICE HOURSMonday – Friday 8 a.m.– 4:30 p.m. Central Time 7401 Register Drive Des Moines, IA 50321