compositional response of amazon forests to climate change · 34instituto nacional de pesquisas da...
TRANSCRIPT

P R IMA R Y R E S E A R CH A R T I C L E
Compositional response of Amazon forests to climate change
Adriane Esquivel‐Muelbert1 | Timothy R. Baker1 | Kyle G. Dexter2,3 | Simon L. Lewis1,4 |
Roel J. W. Brienen1 | Ted R. Feldpausch5 | Jon Lloyd6 | Abel Monteagudo‐Mendoza7,8 |
Luzmila Arroyo9 | Esteban Álvarez-Dávila10 | Niro Higuchi11 | Beatriz S. Marimon12 |
Ben Hur Marimon-Junior12 | Marcos Silveira13 | Emilio Vilanova14,15 | Emanuel Gloor1 |
Yadvinder Malhi16 | Jerôme Chave17 | Jos Barlow18,19 | Damien Bonal20 | Nallaret Davila
Cardozo21 | Terry Erwin22 | Sophie Fauset1 | Bruno Hérault23,24 | Susan Laurance25 |
Lourens Poorter26 | Lan Qie6 | Clement Stahl27 | Martin J. P. Sullivan1 | Hans ter
Steege28,29 | Vincent Antoine Vos30,31 | Pieter A. Zuidema26,32 | Everton Almeida33 |
Edmar Almeida de Oliveira12 | Ana Andrade34 | Simone Aparecida Vieira35 |
Luiz Aragão5,36 | Alejandro Araujo‐Murakami37 | Eric Arets38 | Gerardo A. Aymard C39 |
Christopher Baraloto40 | Plínio Barbosa Camargo41 | Jorcely G. Barroso42 | Frans Bongers26 |
Rene Boot43 | José Luís Camargo34 | Wendeson Castro44 | Victor Chama
Moscoso8,45 | James Comiskey22,46 | Fernando Cornejo Valverde47 | Antonio Carlos Lola
da Costa48 | Jhon del Aguila Pasquel49,50 | Anthony Di Fiore51 | Luisa Fernanda Duque10 |
Fernando Elias12 | Julien Engel40,52 | Gerardo Flores Llampazo53 | David Galbraith1 |
Rafael Herrera Fernández54,55 | Eurídice Honorio Coronado50 | Wannes Hubau56 | Eliana
Jimenez‐Rojas57 | Adriano José Nogueira Lima58 | Ricardo Keichi Umetsu12 | William
Laurance59 | Gabriela Lopez‐Gonzalez1 | Thomas Lovejoy60 | Omar Aurelio Melo Cruz61 |
Paulo S. Morandi12 | David Neill62 | Percy Núñez Vargas 8 | Nadir C. Pallqui Camacho8 |
Alexander Parada Gutierrez39 | Guido Pardo31 | Julie Peacock1 | Marielos Peña‐Claros26,32 |
Maria Cristina Peñuela‐Mora63 | Pascal Petronelli64 | Georgia C. Pickavance1 | Nigel
Pitman65 | Adriana Prieto66 | Carlos Quesada58 | Hirma Ramírez‐Angulo14 | Maxime
Réjou‐Méchain67 | Zorayda Restrepo Correa68 | Anand Roopsind69 | Agustín Rudas66 |
Rafael Salomão70,71 | Natalino Silva72 | Javier Silva Espejo73 | James Singh74 | Juliana
Stropp75 | John Terborgh76 | Raquel Thomas69 | Marisol Toledo37 | Armando
Torres‐Lezama77 | Luis Valenzuela Gamarra7 | Peter J. van de Meer78 | Geertje van der
Heijden79 | Peter van der Hout80 | Rodolfo Vasquez Martinez7 | Cesar Vela81 | Ima Célia
Guimarães Vieira82 | Oliver L. Phillips1
- - - - - - - - - - - - - - - - - - - - - - - - - - - - - - - - - - - - - - - - - - - - - - - - - - - - - - - - - - - - - - - - - - - - - - - - - - - - - - - - - - - - - - - - - - - - - - - - - - - - - - - - - - - - - - - - - - - - - - - - - - - - - - - - - - - - - - - - - - - - - - - - - - - - - - - - - - - - - - - - - - - - - -This is an open access article under the terms of the Creative Commons Attribution License, which permits use, distribution and reproduction in any medium,
provided the original work is properly cited.
© 2018 The Authors. Global Change Biology Published by John Wiley & Sons Ltd
Received: 19 February 2018 | Revised: 27 June 2018 | Accepted: 4 July 2018
DOI: 10.1111/gcb.14413
Glob Change Biol. 2019;25:39–56. wileyonlinelibrary.com/journal/gcb | 39
1School of Geography, University of Leeds, Leeds, UK
2Royal Botanic Garden of Edinburgh, Edinburgh, UK
3School of Geosciences, University of Edinburgh, Edinburgh, UK
4Department of Geography, University College London, London, UK
5Geography, College of Life and Environmental Sciences, University of Exeter, Exeter, UK
6Department of Life Sciences, Imperial College London, Ascot, UK
7Jardín Botánico de Missouri, Oxapampa, Peru
8Universidad Nacional de San Antonio Abad del Cusco, Cusco, Peru
9Universidad Autónoma Gabriel Rene Moreno, El Vallecito, Santa Cruz, Bolivia
10Red para la Mitigación y Adaptación al Cambio Climático - Red MiA, Escuela ECAPMA de la Universidad Nacional Abierta y a Distancia, Bogotá, Colombia
11Instituto Nacional de Pesquisas da Amazônia ‐ Coordenação de Pesquisas em Silvicultura Tropical, Manaus, Brazil
12Universidade do Estado de Mato Grosso, Mato Grosso, Nova Xavantina, Brazil
13Universidade Federal do Acre, Museu Universitário, Acre, Brazil
14Universidad de los Andes, Merida, Venezuela
15School of Environmental and Forest Sciences, University of Washington, Seattle, Washington
16Environmental Change Institute, School of Geography and the Environment, University of Oxford, Oxford, UK
17Laboratoire Evolution et Diversité Biologique (EDB), UMR 5174 CNRS/UPS Bâtiment 4R1, Toulouse, France
18Lancaster Environment Centre, Lancaster University, Lancaster, UK
19Museu Paraense Emilio Goeldi, Belém, Brazil
20AgroParisTech, INRA, UMR Silva, Université de Lorraine, Nancy, France
21Facultad de Ciencias Biológicas, Universidad Nacional de la Amazonía Peruana, Iquitos, Peru
22Smithsonian Institution, Washington, District of Columbia
23Cirad, UR Forests & Societies, University of Montpellier, Montpellier, France
24INPHB, Institut National Polytechnique Félix Houphouët‐Boigny, Yamoussoukro, Ivory Coast
25Centre for Tropical Environmental and Sustainability Science (TESS) and College of Marine and Environmental Sciences, James Cook University, Cairns,
Queensland, Australia
26Forest Ecology and Forest Managment group, Wageningen University and Research, Wageningen, The Netherlands
27INRA, UMR EcoFoG, AgroParisTech, CNRS, Cirad, Université des Antilles, Université de Guyane, Kourou, France
28Naturalis Biodiversity Center, Leiden, The Netherlands
29Systems Ecology, Free University, Amsterdam, Netherlands
30Centro de Investigación y Promoción del Campesinado ‐ Norte Amazónico, Riberalta, Bolivia
31Universidad Autónoma del Beni, Riberalta, Bolivia
32Programa Manejo de Bosques de la Amazonía Boliviana, Riberalta, Bolivia
33Instituto de Biodiversidade e Floresta, Universidade Federal do Oeste do Pará, Pará, Brazil
34Instituto Nacional de Pesquisas da Amazônia, Projeto Dinâmica Biológica de Fragmentos Florestais, Manaus, Brazil
35Universidade Estadual de Campinas, Campinas, São Paulo, Brazil
36National Institute for Space Research (INPE), São José dos Campos, São Paulo, Brazil
37Museo de Historia Natural Noel Kempff Mercado, Universidad Autónoma Gabriel René Moreno, Santa Cruz, Bolivia
38Wageningen Environmental Research, Wageningen University and Research, Wageningen, The Netherlands
39UNELLEZ‐Guanare, Programa de Ciencias del Agro y el Mar, Herbario Universitario (PORT), Barinas, Venezuela
40International Center for Tropical Botany, Department of Biological Sciences, Florida International University, Miami, Florida
41Universidade de São Paulo, São Paulo, Brazil
42Universidade Federal do Acre, Rio Branco, Acre, Brazil
4331 Tropenbos International and Group Ecology and Biodiversity, Beta Faculty,Utrecht University, Utrecht, The Netherlands
44Programa de Pós‐Graduação Ecologia e Manejo de Recursos Naturais, Universidade Federal do Acre, Rio Branco, Acre, Brazil
45Jardin Botanico de Missouri, Cusco, Peru
46Inventory and Monitoring Program, National Park Service, Fredericksburg, Virginia
47Andes to Amazon Biodiversity Program, Puerto Maldonado, Peru
48Universidade Federal do Pará, Pará, Brazil
49Instituto de Investigaciones de la Amazonia Peruana, Iquitos, Peru
50Michigan Tech University, Houghton, Michigan
51University of Texas at Austin, Austin, Texas
52AMAP, IRD, CIRAD, CNRS, INRA, Boulevard de la Lironde, Université de Montpellier, Montpellier, France
40 | ESQUIVEL‐MUELBERT ET AL.

53Universidad Nacional Jorge Basadre de Grohmann (UNJBG), Tacna, Peru
54Centro de Ecologia, Instituto Venezolano de Investigaciones Cientificas, Caracas, Venezuela
55ReforeST Group, DIHMA, Universidad Politécnica de Valencia, Valencia, Spain
56Royal Museum for Central Africa, Tervuren, Belgium
57Grupo de Investigación en Temas Agroambientales INTEGRA, Tecnológico de Antioquia Institución Universitaria, Medellin, Colombia
58Instituto Nacional de Pesquisas da Amazônia, Manaus, Brazil
59Centre for Tropical Environmental and Sustainability Science (TESS) and College of Science and Engineering, James Cook University, Cairns, Queensland,
Australia
60Center for Biodiversity and Sustainability at, George Mason University, Fairfax, Virginia
61Universidad de Tolima, Villeta, Colombia
62Universidad Estatal Amazónica, Puyo, Pastaza, Ecuador
63Universidad Regional Amazónica ikiam, Tena, Ecuador
64Cirad UMR Ecofog (AgrosParisTech, CNRS, INRA, Univ Guyane), Kourou, French Guiana
65Science and Education, The Field Museum, Chicago, Illinois
66Instituto de Ciencias Naturales, Universidad Nacional de Colombia, Bogota, Colombia
67UMR 5174 Evolution et Diversité Biologique, Université Paul Sabatier CNRS, Toulouse, France
68Servicios Ecosistémicos y Cambio Climático (SECC), Fundación Con Vida & Corporación COL‐TREE, Medellin, Colombia
69Iwokrama International Centre for Rainforest Conservation and Development, Georgetown, Guyana
70Pós‐Graduação em Botânica Tropical, Universidade Federal Rural da Amazônia/Museu Paraense Emílio Goeldi, Pará, Brazil
71Programa de Pós‐Graduação em Agricultura e Ambiente, Universidade Estadual do Maranhão, São Luís, Maranhão, Brasil
72Serviço Florestal Brasileiro, Santarem, Brazil
73Departamento de Biología, Universidad de La Serena, La Serena, Chile
74Guyana Forestry Commission, Georgetown, Guyana
75Institute of Biological and Health Sciences, Federal University of Alagoas, Maceió, Alagoas, Brazil
76Center for Tropical Conservation, Nicholas School of the Environment, Duke University, Durham, North Carolina
77INDEFOR, Universidad de Los Andes, Mérida, Venezuela
78Forest and Nature Management Group, Van Hall Larenstein University of Applied Sciences, Velp, The Netherland
79University of Nottingham, Nottingham, UK
80van der Hout Forestry Consulting, Rotterdam, The Netherlands
81Escuela Profesional de Ingeniería Forestal, Universidad Nacional de San Antonio Abad del Cusco, Puerto Maldonado, Perú
82Museu Paraense Emílio Goeldi, Pará, Brazil
Correspondence
Adriane Esquivel‐Muelbert, School of
Geography, University of Leeds, Leeds, LS2
9JT, UK.
Email: [email protected]
Funding information
Natural Environment Research Council
(NERC), Grant/Award Number: NE/
N004655/1; NERC Consortium Grants
“AMAZONICA”; BIO‐RED; European
Research Council (ERC); The Gordon and
Betty Moore Foundation; European Union's
Seventh Framework Programme, Grant/
Award Number: 282664; Royal Society,
Grant/Award Number: CH160091; Royal
Society Wolfson Research Merit Award
Abstract
Most of the planet's diversity is concentrated in the tropics, which includes many
regions undergoing rapid climate change. Yet, while climate‐induced biodiversity
changes are widely documented elsewhere, few studies have addressed this issue
for lowland tropical ecosystems. Here we investigate whether the floristic and func-
tional composition of intact lowland Amazonian forests have been changing by eval-
uating records from 106 long‐term inventory plots spanning 30 years. We analyse
three traits that have been hypothesized to respond to different environmental dri-
vers (increase in moisture stress and atmospheric CO2 concentrations): maximum
tree size, biogeographic water‐deficit affiliation and wood density. Tree communities
have become increasingly dominated by large‐statured taxa, but to date there has
been no detectable change in mean wood density or water deficit affiliation at the
community level, despite most forest plots having experienced an intensification of
the dry season. However, among newly recruited trees, dry‐affiliated genera have
become more abundant, while the mortality of wet‐affiliated genera has increased
in those plots where the dry season has intensified most. Thus, a slow shift to a
more dry‐affiliated Amazonia is underway, with changes in compositional dynamics
ESQUIVEL‐MUELBERT ET AL. | 41
(recruits and mortality) consistent with climate‐change drivers, but yet to signifi-
cantly impact whole‐community composition. The Amazon observational record sug-
gests that the increase in atmospheric CO2 is driving a shift within tree
communities to large‐statured species and that climate changes to date will impact
forest composition, but long generation times of tropical trees mean that biodiver-
sity change is lagging behind climate change.
K E YWORD S
bioclimatic niches, climate change, compositional shifts, functional traits, temporal trends,
tropical forests
1 | INTRODUCTION
Tropical forests represent the world's most biodiverse ecosystems,
as well as providing its largest stores of living carbon and contribut-
ing more to biomass productivity than any other biome on the pla-
net. Changes here can therefore have global consequences,
potentially nowhere more so than in Amazonia where between
6,000 and 16,000 tree species exist (Cardoso et al., 2017; Ter
Steege et al., 2013) and as much as 100 Pg of carbon is stored in
biomass (Feldpausch et al., 2012). While the physical, chemical, and
biological environment have all been changing over recent decades,
it is the changes in climate—both documented and projected—which
are widely expected to cause some of the most profound changes in
forest communities and ecosystem processes (Esquivel‐Muelbert,
Baker, et al., 2017; Thomas et al., 2004). For example, higher tem-
peratures and intensifying drought may threaten larger trees due to
hydraulic failure (McDowell & Allen, 2015; Rowland et al., 2015),
which could eventually compromise forest biomass and productivity.
In Amazonia, because forest diversity is concentrated in the wetter,
least seasonal forests (Francis & Currie, 2003; Gentry, 1988), a per-
sistent lengthening of the dry season might threaten a large portion
of tropical biodiversity. Here we aim to better understand how Ama-
zonian trees have responded to the last 30 years of environmental
change, by analysing floristic records from long‐term tree monitoring
in the Neotropics to assess the potential compositional changes to
date.
Changes in biodiversity attributed to climate change have already
been documented in a wide variety of ecosystems (e.g. Bowler et al.,
2017; Chen et al., 2009), including in some tropical locations, but so
far there is remarkably little evidence of widespread impacts of cli-
mate change on the composition of tropical ecosystems which har-
bour much of the planet's diversity (Duque, Stevenson, & Feeley,
2015; Fauset et al., 2012; Van Der Sande et al., 2016). In contrast,
there is evidence for widespread changes in the structure (i.e. above-
ground biomass) and dynamics (e.g. mortality and productivity) of
old‐growth tropical forests. In many forests, apparently undisturbed
by humans, both aboveground biomass and the rate of ecological
processes such as growth and recruitment have increased (e.g. Brie-
nen et al., 2015; Lewis, Lopez‐Gonzalez, et al., 2009; Phillips &
Gentry, 1994; Qie et al., 2017), while in Amazonia increases in mor-
tality have caused a recent weakening of the biomass carbon sink
(Brienen et al., 2015). However, it remains unclear whether these
structural and dynamic changes are also associated with concerted
changes in the species richness and composition of Amazonian for-
ests.
In Amazonia, as elsewhere, climate change is a potential leading
driver of changes to the ecosystem. During the last few decades, the
climate of Amazonia has become more extreme—the length of the
dry season and its intensity have increased, while precipitation has
become more intense during the wet season (Gloor et al., 2015;
Hilker et al., 2014). Extreme climate events in recent years include
the three strong droughts within a decade (Erfanian, Wang, &
Fomenko, 2017; Jiménez‐Muñoz et al., 2016; Lewis, Brando, Phillips,
Van Der Heijden, & Nepstad, 2011; Marengo, Tomasella, Alves,
Soares, & Rodriguez, 2011; Marengo et al., 2008) and several large‐scale episodes of extreme rainfall (Espinoza et al., 2014; Marengo &
Espinoza, 2016). In addition to the repeated drought events, precipi-
tation has declined in the south and south east of the basin (25%
reduction in rainfall between 2000 and 2012) (Hilker et al., 2014)
and higher temperatures are likely to have intensified seasonal evap-
orative stress across the basin (Jiménez‐Muñoz, Sobrino, Mattar, &
Malhi, 2013). These changes are consistent with model‐based predic-
tions (Duffy, Brando, Asner, & Field, 2015), implying that the Ama-
zon may already have entered a new regime of a hotter, more
variable climate. The forest has clearly responded to these recent
fluctuations in climate—for example, tree mortality rates increased
markedly during and after drought events causing at least temporary
losses of standing biomass (Brienen et al., 2015; Feldpausch et al.,
2016; Phillips et al., 2009; Zuleta, Duque, Cardenas, Muller‐Landau,& Davies, 2017). The 2010 drought also impacted on the basin‐wide
exchange of carbon dioxide between the vegetation and the atmo-
sphere, with the vegetation becoming a net source of CO2 during
2010 (Gatti et al., 2014).
In addition to the changes in climate, atmospheric CO2 concen-
trations have increased globally from 320 ppm to over 400 ppm
over the past 50 years (Conway & Tans, 2016). Carbon dioxide is a
fundamental resource for photosynthesis, and higher concentrations
42 | ESQUIVEL‐MUELBERT ET AL.
are expected to stimulate plant growth (Lloyd & Farquhar, 1996).
Indeed, the increase in atmospheric concentrations of CO2 is a
potential driver of the observed increase in aboveground biomass
and turnover rates in tropical forests (Brienen et al., 2015; Lewis,
Lloyd, Sitch, Mitchard, & Laurance, 2009; Pan et al., 2011; Zhu et al.,
2016). Additionally, under higher CO2 concentrations plants may
increase their water‐use efficiency with less water being required
per unit of carbon fixed. Thus, by allowing plants to use less water,
higher CO2 concentrations could alleviate the effect of increasing
aridity (Lloyd & Farquhar, 2008; Van Der Sleen et al., 2015).
Interpreting potential shifts in tropical floristic composition and
linking them with possible drivers is a considerable challenge due to
the very high diversity of tropical forests and their large spatial
extent. However, if sufficient high‐quality, long‐term floristic moni-
toring is available, then the approach of analysing shifts in a suite of
functional traits to describe how communities change over time can
be used to link floristic changes to their drivers (McGill, Enquist,
Weiher, & Westoby, 2006; Violle, Reich, Pacala, Enquist, & Kattge,
2014). For tropical tree species, two largely independent trait axes
may have value in addressing these questions. One axis, the life‐his-tory trade‐off between growth and mortality, can be represented by
wood density as it is negatively correlated to growth and mortality
rates. This is a reflection of slow‐growing trees tending to invest
more in wood structure (Chave et al., 2009; Muller‐Landau, 2004;Nascimento et al., 2005; Poorter et al., 2010). The other axis is
related to the potential size that taxa can attain, representing the
capacity of taxa to compete for light (Falster & Westoby, 2005;
Poorter, Bongers, Sterck, & Wöll, 2005).
Environmental changes could have different impacts along each
of these ecological axes (Chave et al., 2008; Lewis, Lloyd, et al.,
2009). Most notably, with more extended or intense periods of soil
water deficit, large trees and those with low wood density may be
at greatest risk of hydraulic failure due to cavitation (McDowell &
Allen, 2015; Rowland et al., 2015). Large trees have been shown to
be particularly affected by artificially‐imposed drought (McDowell &
Allen, 2015; Nepstad, Tohver, Ray, Moutinho, & Cardinot, 2007;
Rowland et al., 2015) and drought events (Bennett, Mcdowell, Allen,
& Anderson‐Teixeira, 2015; Phillips et al., 2010). On the other hand,
several observations from tropical forests show a decline of small
understory taxa associated with increases in soil water deficit (e.g.
Condit, Hubbell, & Foster, 1996; Enquist & Enquist, 2011; Fauset et
al., 2012; Feeley, Davies, Perez, Hubbell, & Foster, 2011). To explain
these observations, it has been hypothesized that small taxa have
shallower roots and are therefore more vulnerable compared to
large, deep rooted trees to long‐term drying trends (Condit et al.,
1996; Fauset et al., 2012). Although the link between rooting depth
and tree size is still unclear (Stahl et al., 2013), this hypothesis is
consistent with wetter areas tending to have more densely popu-
lated understoreys (Malhi et al., 2002; Pitman et al., 2002) and taller
forests being less sensitive to precipitation variability (Giardina et al.,
2018). The ongoing increase in atmospheric carbon dioxide is also
expected to cause changes in species composition as it is predicted
to favour those trees that have greater competitive capacity to
access light (Coomes, Lines, & Allen, 2011; Laurance, 2004), conse-
quently increasing the mean potential tree size within the commu-
nity (e.g. Laurance et al., 2004) and to favour fast‐growing trees,
potentially leading to communities with lower wood density.
Given the uncertainty about how tree size relates to responses
to a drying climate, the geographic distributions of species over pre-
cipitation gradients offer an alternative source of information with
which to predict and to infer the effects of drought on floristic com-
position. The spatial distribution of tree taxa over precipitation gradi-
ents has been shown to provide a valuable proxy for drought
tolerance in observational studies and experiments (Engelbrecht et
al., 2007; Esquivel‐Muelbert, Galbraith, et al., 2017). If drought is
increasingly affecting Amazonian forests, we might therefore expect
concerted shifts in tree communities towards more dry‐affiliatedcomponents. A compositional shift towards more dry‐tolerant taxa
as a consequence of an increase in moisture stress has been
reported locally for sites in southern Ghana (Fauset et al., 2012),
Central America (Enquist & Enquist, 2011; Feeley, Davies, et al.,
2011), and parts of the Amazon (Butt et al., 2014).
Here, we aim to quantify the shifts in the floristic composition of
Amazonian tree communities, and test the hypothesis that recent cli-
matic drying is already impacting the composition of Amazonian for-
ests. The data set derives from 106 long‐term, tree inventory plots
distributed across intact closed‐canopy moist forests in lowland Boli-
via, Brazil, Colombia, Ecuador, French Guiana, Guyana, Peru and
Venezuela (Supporting Information Appendix S1). We analyse moni-
toring records from as early as 1985 onwards to as recently as
2015, deliberately excluding any possible influence of the 2015–2016 El Niño drought from our analysis. We investigate trends
within the overall community composition, as well as among recruits,
trees that died, and in the growth rate that occurred within each
census interval (Figure 1). We analyse compositional shifts along
these three trait axes, which we demonstrate to be independent:
life‐history (using wood density as a proxy), potential size, and biocli-
matic distribution (Supporting Information S2). Based on predictions
from plant physiology supported by experimental studies, we expect
increases in dry season duration or intensity to shift floristic compo-
sition towards dry‐affiliated and smaller‐statured genera with high
wood density (McDowell & Allen, 2015; Rowland et al., 2015). Addi-
tionally, we examine trends in abundance for individual genera,
which allows us to understand which taxa dominate the changes in
functional composition.
2 | MATERIALS AND METHODS
2.1 | Field observations and forest dynamics
We investigate the trends in functional and floristic composition of
tree communities by analysing long‐term data from permanent tree
inventory plots in the Amazon and adjacent lowland forests (Sup-
porting Information Appendix S1). A total of 106 South American
forest plots from the RAINFOR network (Malhi et al., 2002),
accessed via the ForestPlots.net repository (Lopez‐Gonzalez, Lewis,
ESQUIVEL‐MUELBERT ET AL. | 43

Burkitt, & Phillips, 2011), met our criteria: (a) sampling lowland
(<1,000 m.a.s.l), terra firme, intact, moist forests (i.e. where mean
maximum cumulative water deficit (MCWD) over the last century is
less negative than −300 mm/year); (b) having been monitored
throughout the period of the two intense dry seasons in 2005 and
2010 (see Supplementary material for analyses including plots that
were not monitored during 2005 and 2010); (c) having had regular
monitoring, thus excluding any plots where census interval lengths
differed by more than 10 years; (d) having at least 80% of tree stems
identified at least to genus level. The selected plots have a mean
area of 1.25 ha (95% CI = 1.16, 1.35), and have been re‐censused on
average seven times, with a mean census interval of 2.8 years.
The long‐term plots were monitored following a standardized
protocol (Phillips et al., 2016). Full methodological details are given
elsewhere (Brienen et al., 2015). In brief, all trees and palms ≥10 cm
diameter (D) at 1.3 m (or above‐buttress) are tagged, identified to
the species level (when possible), have their D measured, and the
point of measurement marked and recorded. At every census, trees
previously recorded are re‐measured, and new recruits—that is trees
that have newly attained 10 cm when the plot is revisited—tagged,
measured and identified, and notes are taken about the individuals
that died between censuses. Lianas and nonwoody freestanding
plants (Phenakospermum) are excluded from our analyses.
2.2 | Climate data
To characterize the change in moisture stress, we calculated tempo-
ral trends in maximum cumulative water deficit (MCWD—Aragão et
al., 2007) for each plot. MCWD represents the most negative value
of water deficit (wd), that is, the difference between precipitation (P)
and evapotranspiration (E) within each year, where for each month
(n) wd is quantified as:
If wdn�1 � En þ Pn<0;
then wdn ¼ wdn�1 � En þ Pnelse wdn ¼ 0
: (1)
In other words, MCWD is an annual water deficit metric which
takes into account both the length and intensity of the dry season
based solely on climatic variables, that is, ignoring soil properties.
The calculation of MCWD does not necessarily follow the calendar
year, as for tropical forests in the northern hemisphere the annual
dry season typically spans two calendar years (between October and
March). Thus, the starting point, that is, when n = 1, was defined cli-
matologically as the wettest month in the first year in the time series
(i.e. 1985), rather than the first month of that calendar year.
In addition to estimating annual MCWD, following Feldpausch et
al. (2016), we also estimated the intensity of the most extreme dry
season between two consecutive censuses, hereafter termed
MCWDi. This metric represents a measure of maximum environmen-
tal disruption between two censuses, that is the most negative value
of annual MCWD between each successive pair of censuses. Only
complete years were considered for this calculation. For the first
census of each plot, the MCWDi was calculated as the most nega-
tive MCWD values within the 3‐year period preceding that census.
This time window is equivalent to the mean census interval within
the data (2.8 years).
Climate data were obtained from the Climatic Research Unit
(CRU), at 0.5° spatial resolution from 1985 to 2015 (Harris, Jones,
Osborn, & Lister, 2014) where evapotranspiration is calculated based
on the Penman–Monteith equation (Allen, Smith, Pereira, & Perrier,
1994) using information on temperature, cloud cover and vapour
pressure (Harris et al., 2014). MCWD trends calculated from this
ground‐based precipitation data source were consistent with satel-
lite‐based data from the Tropical Rainfall Measuring Mission (TRMM
– Huffman et al., 2007) at 0.25° spatial resolution between 1998 and
2010 (R2 = 0.87; p < 0.0001—see Supporting Information Appendix
S3 for more detail). Here we opt to use ground‐based data from
CRU as this covers the whole time window of the floristic analyses.
2.3 | Traits
We describe Amazonian tree genera in terms of the three basic
traits shown in previous work and in Supporting Information Appen-
dix S2 for our data to represent largely independent axes of funda-
mental plant characteristics and each potentially responsive to
environmental change: Potential Size (PS; cm): the 95th percentile of
the distribution of trees’ diameter derived from a set of 530
F IGURE 1 Schematic model representing the differentcomponents of forest demography. The box on the left representsan inventory plot of a forest community at the first census (Ct0),while the box on the right shows the community at the secondcensus (Ct1). At Ct1 recruits (R), that is those trees that attained10 cm of diameter within the census interval, will now be part ofthe community analysed. Other trees will have died thus leaving thecommunity, here called losses (L). Those trees from Ct0 that survivethrough the census interval are expected to grow (G). Thus, thebasal area of the whole community at t1 isCt1 = Ct0 + Gt1 + Rt1 − Lt1 and the net flux between t0 andt1 = Gt1 + Rt1 − Lt1. Here we investigate the trends in thecharacteristics and identity of genera within these components offorest demography. This figure represents dynamics in basal areaterms; similar logic can be applied for stem‐based analyses. Notethat in this case we would not be interested in the growth of treessurviving from t0 to t1, and so the net flux would be represented asRt1 − Lt1
44 | ESQUIVEL‐MUELBERT ET AL.
inventory plots across the Amazon Basin (Fauset et al., 2015); Water
deficit affiliation (WDA; mm): derived from relative abundances
across 513 inventory plots distributed along a large gradient of
MCWD across the Western Neotropics (Esquivel‐Muelbert, Baker, et
al., 2017). This metric quantifies the preferred dry season severity
for each taxon and is calculated as the dry season severity (mea-
sured as MCWD) where a taxon occurs weighted by the taxon's rel-
ative abundance in each location (Esquivel‐Muelbert, Baker, et al.,
2017). Taxa affiliated to dry conditions show the most negative val-
ues of WDA, while the most wet‐affiliated ones have values of
WDA equal to zero; Wood density (WD; g/cm3): values were
extracted from the Wood Density Database (Chave et al., 2009;
Zanne et al., 2009). There was no indication of any pairwise relation-
ship among any of the traits: WDA versus PS (R2 = 8 × 10⁻³) WDA
versus WD (R2 = 5 × 10⁻⁴) and WD versus PS (R2 = 2 × 10⁻³).
The diversity of Amazonian flora hinders us from performing
consistent species‐level analyses as comprehensive trait data are still
missing for the large majority of Amazonian tree species. Therefore,
our analyses were performed at the genus level, and the mean trait
value of the genus was assigned to each individual. Our approach is
expected to be adequate to capture the actual functional shifts in
Amazonia as it captures most of the trait variation of Amazonian
trees, which is mostly accounted for at the family and genus level
(see Baker et al., 2004; Coelho de Souza et al., 2016; Fyllas et al.,
2009; Patiño et al., 2009). Although genus‐level analyses still miss
some information on trait variation, analyses at this taxonomic reso-
lution are also potentially more conservative with respect to the
hypothesis of environmental‐driven floristic change than analyses at
the species level, as they use mean genus‐level values instead of
(more extreme) species‐level values. Results of analyses using spe-
cies‐level traits, for those taxa where data are available, do not differ
from genus‐level results (see Supporting Information Appendix S8).
Genus‐level trait data were missing for 6%, 9% and 0.04% of all
stems for PS, WDA and WD, respectively. For these cases, the mean
trait values from the family were used, following established conven-
tions (Baker et al., 2004; Flores & Coomes, 2011) and considering
the phylogenetic conservatism of PS and WD for Amazonian trees
(Coelho de Souza et al., 2016). For the small proportion of individu-
als belonging to families for which no trait information was available,
we used average trait values of the community in the same census
was used. For those stems not identified to family level (3.9%), we
applied the mean trait for all dicot individuals of the plot census dur-
ing which the tree was recorded. Considering the low proportion of
missing data the imputation technique is unlikely to strongly affect
our results (Penone et al., 2014).
Then, to obtain a census‐level value for each of the three traits,
we scaled the genus‐level traits to the community level by calculat-
ing the community‐weighted mean (CWM sensu Diaz et al., 2007)
for each trait in each census. For each of the 743 censuses across
106 plots, the CWM of each of these components was calculated as
the mean trait value across the genera of the community, weighted
by (a) the number of stems; and (b) the total basal area occupied by
each genus. Community‐weighted means were calculated for the
whole community and for each component of forest dynamics, that
is the recruits (new trees that reach the 10 cm D cut‐off after eachcensus interval), losses (those trees that died within each census
interval) and the basal area gain of those trees that survived the cen-
sus interval (Figure 1).
2.4 | Analytical approach
We investigated changes in functional (mean potential size, water
deficit affiliation and wood density) and floristic composition (relative
abundance of individuals within different genera) by assessing trends
over time of these quantities for each plot and their Amazon‐levelmean.
2.4.1 | Trends in functional composition
We investigated functional trends for the different components of
forest demography (i.e. whole tree community, recruits and trees
that died—Figure 1). These functional trends were quantified using
(a) the bootstrapped mean and 95% CI of plot level linear regression
slopes of the community weighted mean (CWM) as a function of
time, averaged across all plots; and (b) linear mixed effect models
(LMM) of CWM as a function of time with plot identified as a ran-
dom effect, using function lmer from the R package lme4 (Bates,
Mächler, Bolker, & Walker, 2015). While the first approach provides
information of the overall mean trend across all plots, in which the
uncertainty estimate is derived using a nonparametric approach, the
second approach gives an estimate of the trend over the whole time
series (1985–2015), accounting for potential changes in which plots
are analysed over different time windows along the 30‐year period.The bootstrapped mean and confidence intervals were calculated
from the linear slopes of CWM (i.e. mean plot level traits) for each
plot where the CWM in each census (j) is a function of the date
when the census took place (time):
CWMj ∼ β1 þ β2 � timej þ ɛj: (2)
Then, an Amazon‐wide weighted mean and the 95% CI were
estimated by randomly resampling values of the plot‐level slopes (β2
from Equation 3) across all plots, 10,000 times. We further estimate
the potential influence of spatial autocorrelation on our results by
testing the correlation between the Euclidean distance in the trends
in CWM and the spatial distance between the plots (Supporting
Information Appendix S7).
The variation in plot area and monitoring period may be
expected to influence plot‐level trends as smaller plots and those
monitored for shorter periods are more likely to be affected by
stochastic phenomena, such as tree falls (Fisher, Hurtt, Thomas, &
Chambers, 2008). An empirical investigation of the impact of sam-
pling effort (i.e. length of monitoring period and plot size) on our
estimate showed that the variance is expected to scale as a function
of the square root of plot area multiplied by the monitoring period
(Supporting Information Appendix S4). Thus, to account for the noise
attributed to sampling effort, we used the square root of plot area
ESQUIVEL‐MUELBERT ET AL. | 45
multiplied by the monitoring period as weights when calculating
Amazon‐level mean and confidence intervals of the CWM slopes.
The LMM follows the same logic of the previous analyses with
CWM as a linear function of time:
CWMij ∼ ðβ1 þ aiÞ þ ðβ2 þ biÞ � timeij þ ɛij: (3)
where CWM in plot i and census j is a function of the date when
the census occurred (time). Here time is used as a fixed effect, and
the random components of the model are the intercept (a) and slope
(b) for each plot and the overall residuals (ε). The slope and intercept
of each plot were included as random effects considering that both
the initial trait value (represented by the plot intercept, ai) and the
intensity of change (represented by the plot slope, bi) may differ
across plots. An exploration of the influence of sampling effort on
the variance of the residuals shows no weighting procedure to be
required for this analytical framework (Supporting Information
Appendix S4).
2.4.2 | The influence of climate on functionalcomposition
To explore the potential impact of climate changes on functional
change, we tested whether changes in the community are related to
changes in climate. First, we calculated the linear trend in MCWD
and MCWDi over the inventory period for each plot. We then used
Kendall's τ coefficient to test for the correlation between linear
slopes of change in CWMs (composition) and MCWD (climate) for
each plot. For the cases where the correlation was significant, we fit
an OLS linear regression with the trends in CWM as a function of
trends in MCWD.
2.4.3 | Trends in floristic composition
We investigated the influence of individual taxonomic groups on any
functional shifts by analysing the relationship between shifts in
abundance and trait values. Trends in relative abundance for each
taxon were calculated following the same procedure applied above
to analyse CWM changes, that is by calculating the bootstrapped
mean of linear trends and applying LMM, but here using the relative
abundance of each genus as a response variable instead of CWM.
The bootstrap means were calculated from a modified version of
Equation 3 applied to every plot:
RAj ∼ β1 þ β2 � timej þ ɛj: (4)
where RA is the relative abundance of a genus at plot i and census j.
We then use the LMM approach by modifying Equation 4 to:
RAij ∼ ðβ1 þ aiÞ þ ðβ2 þ biÞ � timeij þ ɛij: (5)
An Amazon‐wide slope using each of the methods was calculated
for each taxon. The LMM analysis was restricted to genera that
occurred in three or more plots. As for the functional analyses, each
plot in the bootstrap mean following Equation 5 was weighted by
the square root of plot area multiplied by the monitoring period and
no weighting procedure was applied for the LMM approach (Equa-
tion 6). Trends in abundance were also calculated for families and
species (Supporting Information Appendix S12).
Next, we investigated which genera contribute most to the sig-
nificant functional changes that were detected. When trends in func-
tional composition were significantly different from zero (see
Section 7 for details), we estimated Kendall's τ coefficient of correla-
tion between Amazon‐wide slopes (calculated for the whole commu-
nity, for recruits, and for losses) for each genus and their trait values
(WDA, WD or PS). To ensure that abundance trends were estimated
with reasonable levels of uncertainty, we restricted the investigation
of the trends in abundance versus traits relationship to only include
genera within the upper 20% quantile of abundance across the
whole data set.
Finally, we calculated the trends in abundance for four Amazo-
nian functional types defined by Fyllas, Quesada, and Lloyd (2012)
using trait information from a subset of the Amazonian species
included in this study. The four Amazonian functional groups (small
pioneers, small‐statured nonpioneers, tall pioneers and tall non-
pioneers) are based on variety of foliar and structural traits (Support-
ing Information Appendix S10) independent from the traits
considered in our main analyses. This therefore provides comple-
mentary information to our main analyses.
3 | RESULTS
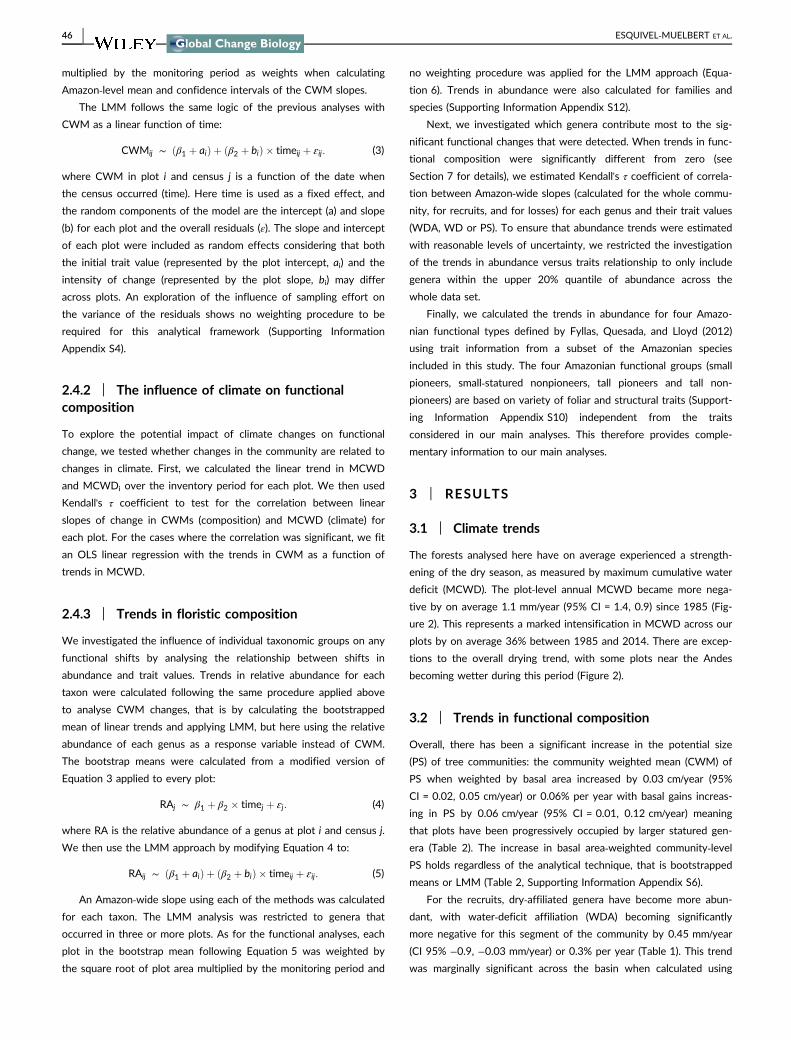
3.1 | Climate trends
The forests analysed here have on average experienced a strength-
ening of the dry season, as measured by maximum cumulative water
deficit (MCWD). The plot‐level annual MCWD became more nega-
tive by on average 1.1 mm/year (95% CI = 1.4, 0.9) since 1985 (Fig-
ure 2). This represents a marked intensification in MCWD across our
plots by on average 36% between 1985 and 2014. There are excep-
tions to the overall drying trend, with some plots near the Andes
becoming wetter during this period (Figure 2).
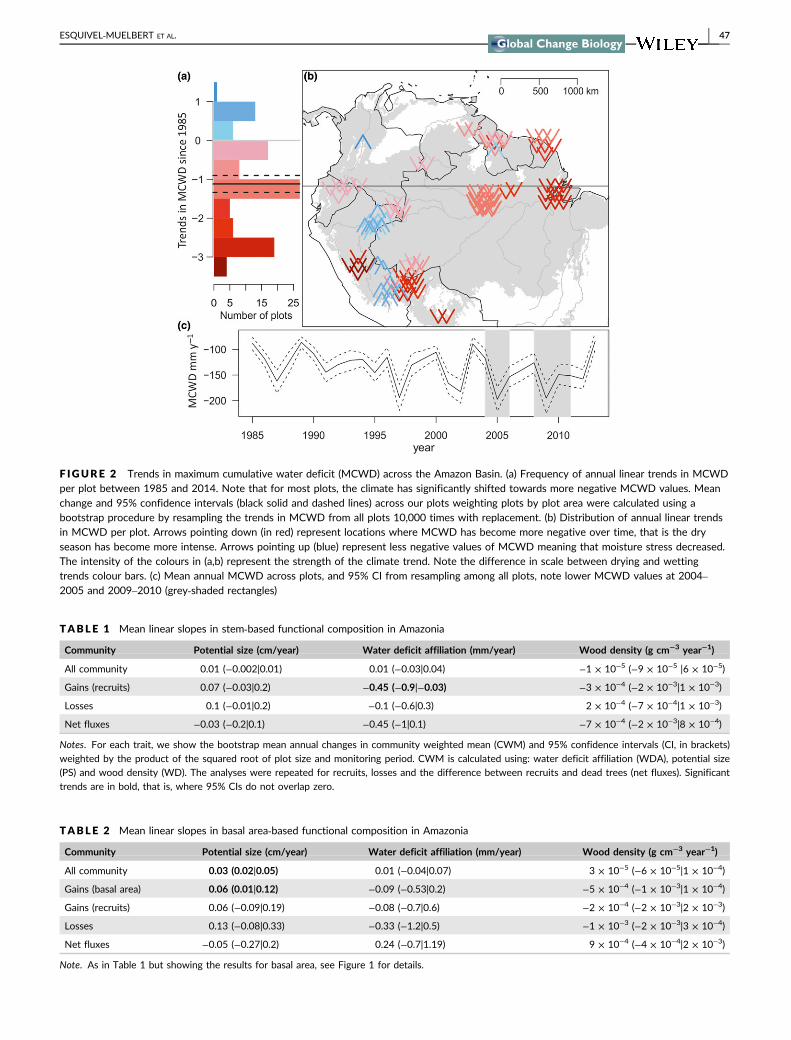
3.2 | Trends in functional composition
Overall, there has been a significant increase in the potential size
(PS) of tree communities: the community weighted mean (CWM) of
PS when weighted by basal area increased by 0.03 cm/year (95%
CI = 0.02, 0.05 cm/year) or 0.06% per year with basal gains increas-
ing in PS by 0.06 cm/year (95% CI = 0.01, 0.12 cm/year) meaning
that plots have been progressively occupied by larger statured gen-
era (Table 2). The increase in basal area‐weighted community‐levelPS holds regardless of the analytical technique, that is bootstrapped
means or LMM (Table 2, Supporting Information Appendix S6).
For the recruits, dry‐affiliated genera have become more abun-
dant, with water‐deficit affiliation (WDA) becoming significantly
more negative for this segment of the community by 0.45 mm/year
(CI 95% −0.9, −0.03 mm/year) or 0.3% per year (Table 1). This trend
was marginally significant across the basin when calculated using
46 | ESQUIVEL‐MUELBERT ET AL.
F IGURE 2 Trends in maximum cumulative water deficit (MCWD) across the Amazon Basin. (a) Frequency of annual linear trends in MCWDper plot between 1985 and 2014. Note that for most plots, the climate has significantly shifted towards more negative MCWD values. Meanchange and 95% confidence intervals (black solid and dashed lines) across our plots weighting plots by plot area were calculated using abootstrap procedure by resampling the trends in MCWD from all plots 10,000 times with replacement. (b) Distribution of annual linear trendsin MCWD per plot. Arrows pointing down (in red) represent locations where MCWD has become more negative over time, that is the dryseason has become more intense. Arrows pointing up (blue) represent less negative values of MCWD meaning that moisture stress decreased.The intensity of the colours in (a,b) represent the strength of the climate trend. Note the difference in scale between drying and wettingtrends colour bars. (c) Mean annual MCWD across plots, and 95% CI from resampling among all plots, note lower MCWD values at 2004–2005 and 2009–2010 (grey‐shaded rectangles)
TABLE 1 Mean linear slopes in stem‐based functional composition in Amazonia
Community Potential size (cm/year) Water deficit affiliation (mm/year) Wood density (g cm−3 year−1)
All community 0.01 (−0.002|0.01) 0.01 (−0.03|0.04) −1 × 10⁻⁵ (−9 × 10⁻⁵ |6 × 10⁻⁵)
Gains (recruits) 0.07 (−0.03|0.2) −0.45 (−0.9|−0.03) −3 × 10⁻⁴ (−2 × 10⁻³|1 × 10⁻³)
Losses 0.1 (−0.01|0.2) −0.1 (−0.6|0.3) 2 × 10⁻⁴ (−7 × 10⁻⁴|1 × 10⁻³)
Net fluxes −0.03 (−0.2|0.1) −0.45 (−1|0.1) −7 × 10⁻⁴ (−2 × 10⁻³|8 × 10⁻⁴)
Notes. For each trait, we show the bootstrap mean annual changes in community weighted mean (CWM) and 95% confidence intervals (CI, in brackets)
weighted by the product of the squared root of plot size and monitoring period. CWM is calculated using: water deficit affiliation (WDA), potential size
(PS) and wood density (WD). The analyses were repeated for recruits, losses and the difference between recruits and dead trees (net fluxes). Significant
trends are in bold, that is, where 95% CIs do not overlap zero.
TABLE 2 Mean linear slopes in basal area‐based functional composition in Amazonia
Community Potential size (cm/year) Water deficit affiliation (mm/year) Wood density (g cm−3 year−1)
All community 0.03 (0.02|0.05) 0.01 (−0.04|0.07) 3 × 10⁻⁵ (−6 × 10⁻⁵|1 × 10⁻⁴)
Gains (basal area) 0.06 (0.01|0.12) −0.09 (−0.53|0.2) −5 × 10⁻⁴ (−1 × 10⁻³|1 × 10⁻⁴)
Gains (recruits) 0.06 (−0.09|0.19) −0.08 (−0.7|0.6) −2 × 10⁻⁴ (−2 × 10⁻³|2 × 10⁻³)
Losses 0.13 (−0.08|0.33) −0.33 (−1.2|0.5) −1 × 10⁻³ (−2 × 10⁻³|3 × 10⁻⁴)
Net fluxes −0.05 (−0.27|0.2) 0.24 (−0.7|1.19) 9 × 10⁻⁴ (−4 × 10⁻⁴|2 × 10⁻³)
Note. As in Table 1 but showing the results for basal area, see Figure 1 for details.
ESQUIVEL‐MUELBERT ET AL. | 47
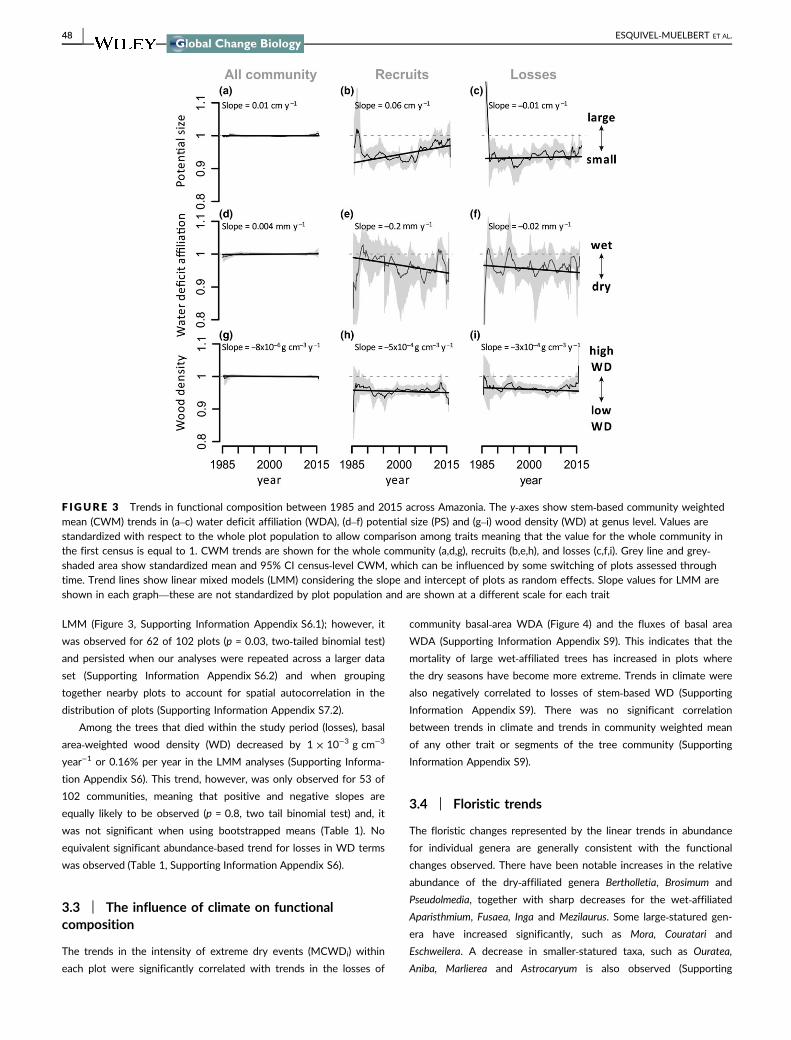
LMM (Figure 3, Supporting Information Appendix S6.1); however, it
was observed for 62 of 102 plots (p = 0.03, two‐tailed binomial test)
and persisted when our analyses were repeated across a larger data
set (Supporting Information Appendix S6.2) and when grouping
together nearby plots to account for spatial autocorrelation in the
distribution of plots (Supporting Information Appendix S7.2).
Among the trees that died within the study period (losses), basal
area‐weighted wood density (WD) decreased by 1 × 10⁻³ g cm−3
year−1 or 0.16% per year in the LMM analyses (Supporting Informa-
tion Appendix S6). This trend, however, was only observed for 53 of
102 communities, meaning that positive and negative slopes are
equally likely to be observed (p = 0.8, two tail binomial test) and, it
was not significant when using bootstrapped means (Table 1). No
equivalent significant abundance‐based trend for losses in WD terms
was observed (Table 1, Supporting Information Appendix S6).
3.3 | The influence of climate on functionalcomposition
The trends in the intensity of extreme dry events (MCWDi) within
each plot were significantly correlated with trends in the losses of
community basal‐area WDA (Figure 4) and the fluxes of basal area
WDA (Supporting Information Appendix S9). This indicates that the
mortality of large wet‐affiliated trees has increased in plots where
the dry seasons have become more extreme. Trends in climate were
also negatively correlated to losses of stem‐based WD (Supporting
Information Appendix S9). There was no significant correlation
between trends in climate and trends in community weighted mean
of any other trait or segments of the tree community (Supporting
Information Appendix S9).
3.4 | Floristic trends
The floristic changes represented by the linear trends in abundance
for individual genera are generally consistent with the functional
changes observed. There have been notable increases in the relative
abundance of the dry‐affiliated genera Bertholletia, Brosimum and
Pseudolmedia, together with sharp decreases for the wet‐affiliatedAparisthmium, Fusaea, Inga and Mezilaurus. Some large‐statured gen-
era have increased significantly, such as Mora, Couratari and
Eschweilera. A decrease in smaller‐statured taxa, such as Ouratea,
Aniba, Marlierea and Astrocaryum is also observed (Supporting
F IGURE 3 Trends in functional composition between 1985 and 2015 across Amazonia. The y‐axes show stem‐based community weightedmean (CWM) trends in (a–c) water deficit affiliation (WDA), (d–f) potential size (PS) and (g–i) wood density (WD) at genus level. Values arestandardized with respect to the whole plot population to allow comparison among traits meaning that the value for the whole community inthe first census is equal to 1. CWM trends are shown for the whole community (a,d,g), recruits (b,e,h), and losses (c,f,i). Grey line and grey‐shaded area show standardized mean and 95% CI census‐level CWM, which can be influenced by some switching of plots assessed throughtime. Trend lines show linear mixed models (LMM) considering the slope and intercept of plots as random effects. Slope values for LMM areshown in each graph—these are not standardized by plot population and are shown at a different scale for each trait
48 | ESQUIVEL‐MUELBERT ET AL.
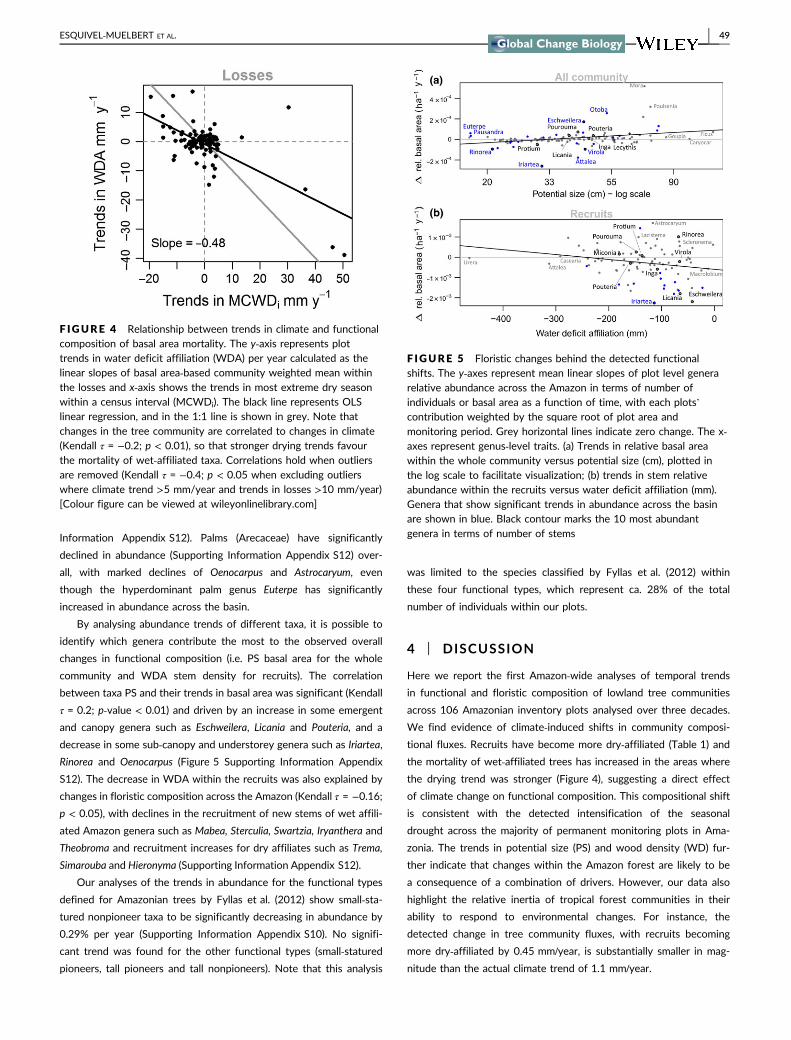
Information Appendix S12). Palms (Arecaceae) have significantly
declined in abundance (Supporting Information Appendix S12) over-
all, with marked declines of Oenocarpus and Astrocaryum, even
though the hyperdominant palm genus Euterpe has significantly
increased in abundance across the basin.
By analysing abundance trends of different taxa, it is possible to
identify which genera contribute the most to the observed overall
changes in functional composition (i.e. PS basal area for the whole
community and WDA stem density for recruits). The correlation
between taxa PS and their trends in basal area was significant (Kendall
τ = 0.2; p‐value < 0.01) and driven by an increase in some emergent
and canopy genera such as Eschweilera, Licania and Pouteria, and a
decrease in some sub‐canopy and understorey genera such as Iriartea,
Rinorea and Oenocarpus (Figure 5 Supporting Information Appendix
S12). The decrease in WDA within the recruits was also explained by
changes in floristic composition across the Amazon (Kendall τ = −0.16;
p < 0.05), with declines in the recruitment of new stems of wet affili-
ated Amazon genera such as Mabea, Sterculia, Swartzia, Iryanthera and
Theobroma and recruitment increases for dry affiliates such as Trema,
Simarouba and Hieronyma (Supporting Information Appendix S12).
Our analyses of the trends in abundance for the functional types
defined for Amazonian trees by Fyllas et al. (2012) show small‐sta-tured nonpioneer taxa to be significantly decreasing in abundance by
0.29% per year (Supporting Information Appendix S10). No signifi-
cant trend was found for the other functional types (small‐staturedpioneers, tall pioneers and tall nonpioneers). Note that this analysis
was limited to the species classified by Fyllas et al. (2012) within
these four functional types, which represent ca. 28% of the total
number of individuals within our plots.
4 | DISCUSSION
Here we report the first Amazon‐wide analyses of temporal trends
in functional and floristic composition of lowland tree communities
across 106 Amazonian inventory plots analysed over three decades.
We find evidence of climate‐induced shifts in community composi-
tional fluxes. Recruits have become more dry‐affiliated (Table 1) and
the mortality of wet‐affiliated trees has increased in the areas where
the drying trend was stronger (Figure 4), suggesting a direct effect
of climate change on functional composition. This compositional shift
is consistent with the detected intensification of the seasonal
drought across the majority of permanent monitoring plots in Ama-
zonia. The trends in potential size (PS) and wood density (WD) fur-
ther indicate that changes within the Amazon forest are likely to be
a consequence of a combination of drivers. However, our data also
highlight the relative inertia of tropical forest communities in their
ability to respond to environmental changes. For instance, the
detected change in tree community fluxes, with recruits becoming
more dry‐affiliated by 0.45 mm/year, is substantially smaller in mag-
nitude than the actual climate trend of 1.1 mm/year.
F IGURE 4 Relationship between trends in climate and functionalcomposition of basal area mortality. The y‐axis represents plottrends in water deficit affiliation (WDA) per year calculated as thelinear slopes of basal area‐based community weighted mean withinthe losses and x‐axis shows the trends in most extreme dry seasonwithin a census interval (MCWDi). The black line represents OLSlinear regression, and in the 1:1 line is shown in grey. Note thatchanges in the tree community are correlated to changes in climate(Kendall τ = −0.2; p < 0.01), so that stronger drying trends favourthe mortality of wet‐affiliated taxa. Correlations hold when outliersare removed (Kendall τ = −0.4; p < 0.05 when excluding outlierswhere climate trend >5 mm/year and trends in losses >10 mm/year)[Colour figure can be viewed at wileyonlinelibrary.com]
F IGURE 5 Floristic changes behind the detected functionalshifts. The y‐axes represent mean linear slopes of plot level generarelative abundance across the Amazon in terms of number ofindividuals or basal area as a function of time, with each plots’contribution weighted by the square root of plot area andmonitoring period. Grey horizontal lines indicate zero change. The x‐axes represent genus‐level traits. (a) Trends in relative basal areawithin the whole community versus potential size (cm), plotted inthe log scale to facilitate visualization; (b) trends in stem relativeabundance within the recruits versus water deficit affiliation (mm).Genera that show significant trends in abundance across the basinare shown in blue. Black contour marks the 10 most abundantgenera in terms of number of stems
ESQUIVEL‐MUELBERT ET AL. | 49

The functional shifts observed here are mirrored by underlying
floristic changes when our data are analysed in terms of discrete tax-
onomic units (Figure 5). The genus‐level floristic shifts behind the
significant changes detected (Tables 1 and 2) illustrates how func-
tional responses result from actual floristic change across Amazonian
communities. However, the relationships between traits and floristic
shifts also show significant scatter, suggesting idiosyncratic
responses of each taxon and the complexity of this highly diverse
system.
4.1 | Climate‐induced changes in floristiccomposition
We detected an increase in the abundance of drought‐tolerant gen-era across Amazonia when analysing the recruitment and mortality
within tree communities (Table 1, Figure 3), consistent with the
hypothesis that tree communities are responding to the changes in
climate. Our large‐scale results are consistent with tree community
shifts towards more drought‐tolerant taxa reported in some neotrop-
ical (Butt et al., 2014; Enquist & Enquist, 2011; Feeley, Silman, et al.,
2011) and west African forest localities (Fauset et al., 2012), and
some temperate localities (McIntyre et al., 2015). Across Amazonia
we find that greater mortality of wet‐affiliated taxa over time is
related to the degree to which water stress has increased within
each community, providing direct evidence of the influence of cli-
mate on community dynamics (Figure 4). This only emerged when
analysing trends in basal area, indicating that it is driven by the
increase in mortality of large wet‐affiliated trees. Indeed, large trees
are expected to suffer the most under drought conditions by being
more vulnerable to embolism, and thus more likely to die from
hydraulic failure under drought stress (McDowell & Allen, 2015;
Rowland et al., 2015). In addition, further supporting the conclusion
that this reflects concerted, widespread changes in Amazon forest
mortality, we also found an increase in the potential size of the dead
trees when analyses were repeated considering each cluster of
neighbouring plots as a single sample unit (Supporting Information
Appendix S7). Somewhat surprisingly we find losses in stem‐basedWD to be negatively correlated to changes in climate (Supporting
Information Appendix S9), which suggests that WD may not be a
good proxy of drought vulnerability.
Our results also suggest that other drivers are causing composi-
tional shifts in Amazon forests. For example, although we did
observe an increase in mortality of large, wet affiliated trees, con-
sistent with the effect of the 2005 drought (Phillips et al., 2009),
our analyses also show a slight increase in the basal area of poten-
tially large tree genera across the basin. These results contradict
the expectations that droughts would preferably impact larger trees
but are in line with the suggestion that smaller‐statured trees are
more vulnerable to droughts as they have shallower roots than lar-
ger‐statured trees (Condit et al., 1996; Fauset et al., 2012; Wright,
1992). Most likely, it appears that the increase in mortality of large
trees in some areas of the basin (Figure 4, Supporting Information
Appendix S9) is a consequence of drought events such as the
2005 drought (cf. Bennett et al., 2015; Phillips et al., 2010), but
that it this mortality has been insufficient to counter a longer‐termtendency towards increased basal area of large‐statured taxa across
Amazonia.
4.2 | Additional drivers of compositional change
Larger trees have greater competitive capacity and are anticipated to
gain disproportionately with additional resources (Coomes et al.,
2011; Enquist, West, & Brown, 2009; Enquist, West, Charnov, &
Brown, 1999). The increase in atmospheric CO2 potentially provides
a parsimonious explanation for the observed relative increase in
large‐tree genera (Table 2). If the increase in atmospheric CO2 of ca.
5% per decade since the 1980s (Conway & Tans, 2016) is stimulat-
ing plant growth or increasing water‐use efficiency, then taxa that
tend to compete better for light, notably larger trees (Poorter et al.,
2005), are likely to gain a greater competitive advantage (Falster &
Westoby, 2003). Although further investigation is needed to confirm
this hypothesis, our results show an increase in basal area of large‐statured taxa (Figure 5; Table 2) and a decrease in abundance of
small‐statured taxa (Supporting Information Appendix S10), both
consistent with the expectations from increased competition. Addi-
tionally, the relative increase of larger genera is also observed in the
broader dataset including the fringes of Amazonia (Extended Amazo-
nia see Supplementary material), which supports the inference of a
ubiquitous driver of compositional change. Our observations are also
in line with a series of stand‐level studies that show increases in
above‐ground biomass, growth, mortality and recruitment across
Amazonia—all trends expected as an outcome from increased atmo-
spheric CO2 (Brienen et al., 2015; Phillips & Gentry, 1994; Phillips et
al., 1998).
While considerable interest has focussed on the atmospheric and
climatic changes, particularly drought, other environmental changes
may be important. Conceivably one or more of these could have
pervasive impacts on mature forests across the basin to rival or
exceed any climate impacts. Amazonian forests have been hypothe-
sized to be recovering from previous disturbances that are either
natural (Chambers et al., 2013; Van Der Sande et al., 2016) or
human‐driven, particularly in pre‐Colombian times (McMichael, Mat-
thews‐Bird, Farfan‐Rios, & Feeley, 2017). If this is the case, we
would expect the forest to be following a successional trajectory
characterized by a shift from pioneers (low wood density) to mature
forest species (high wood density; e.g. Chave et al., 2008; Connell &
Slatyer, 1977; Lewis, Lloyd, et al., 2009). While the observed relative
increase in basal area of larger taxa is consistent with widespread
recovery from disturbance (Chave et al., 2008; Wright, 2005), the
106 Amazonian inventory plots show no significant shift in wood
density (WD) across the whole community, or perhaps more impor-
tantly, among the recruits (Tables 1 and 2). We note that our WD
data (Chave et al., 2009; Zanne et al., 2009) provide a less than per-
fect insight into actual change given that there is likely to be addi-
tional spatial and intra‐generic variation (Baraloto et al., 2010; Patiño
et al., 2009) that we cannot account for. However, WD is
50 | ESQUIVEL‐MUELBERT ET AL.

considerably conserved across the phylogeny, and genus‐level wood
density has been found to be adequate to distinguish between late
successional and pioneer genera (Coelho de Souza et al., 2016).
Moreover, the only functional group that has clearly lost ground over
our monitoring window are the short‐statured nonpioneers—the
best suited trees to late‐successional environments (Supporting
Information Appendix S10). Compositional analyses further suggest
that some pioneers are increasing, most notably an increase of 3.4%
ha−1 year−1 in the relative abundance of Cecropia, a key early suc-
cessional taxon (Supporting Information Appendix S12), which typi-
cally dominates in early stages of succession but declines at later
stages of the successional trajectory (Zalamea et al., 2012). The
increase in the abundance of light‐demanding taxa may be a conse-
quence of an acceleration in the canopy gap dynamics caused by the
increase in baseline mortality rates (Baker et al., 2016; Brienen et al.,
2015). Finally, if these forest plots are recovering from the impact of
Amazonian peoples who favoured especially useful species, then we
might expect domesticated taxa sensu Levis et al. (2017) to now be
decreasing in abundance following the relaxation of this anthro-
pogenic influence. No such trend is observed in our data (Supporting
Information Appendix S11).
There has been considerable concern regarding the ecosystem
impacts of widespread removal of large‐bodied frugivores. In particu-
lar, it has been repeatedly suggested that hunting will or may have
already altered tree composition in tropical forests (e.g. Doughty et
al., 2016; Osuri et al., 2016; Peres, Emilio, Schietti, Desmoulière, &
Levi, 2016; Peres & Palacios, 2007; Terborgh et al., 2008) via disper-
sal failure of zoochoric trees (Chapman & Chapman, 1995). These
tend to have high wood density and large stature, so a recruitment
failure is predicted to lead to a reduction in the prevalence of both
of these traits and thus in Amazonian biomass (Bello et al., 2015;
Peres et al., 2016). This study was designed to understand floristic
dynamics in intact Amazonian forests and not to evaluate the effects
of hunting pressure, which is likely to more strongly affect areas
adjacent to rural communities, roads and rivers (Peres & Lake, 2003).
However, the increase in potential size and the lack of change in
wood density within the recruits (Figure 3) contradict expectations
of the hunting hypothesis as a driver of recent community composi-
tion change in intact forests, which, again, does not rule out the pos-
sibility of hunting pressure causing shifts in composition in particular
locations where this activity is stronger.
4.3 | The pace of change
Changes in tree communities are expected to substantially lag
behind environmental changes as trees are sessile and long‐lived(Blonder et al., 2017; Davis, 1989; Hubbell, 2001; Lenoir, Gegout,
Marquet, De Ruffray, & Brisse, 2008; Svenning & Sandel, 2013). Our
results are consistent with this prediction. In other systems where
climate gradients are almost unidirectional, it is possible to assess
the speed at which communities are expected to be moving across
spaces to follow climate (Devictor et al., 2012), but this is not the
case for precipitation in Amazonia where precipitation regime is
heterogeneous at multiple spatial scales. However, by ensuring that
climate and water‐deficit affiliation are calculated in the same scale
we can compare the degree to which climate and communities are
changing. Across Amazonia, plots have undergone an average drying
trend of −1.1 mm/year MCWD (Figure 2). Notably, change in tree
communities did not keep pace with the change in climate—the
mean trend in water‐deficit affiliation for the whole community is
two orders of magnitude smaller (0.01 mm/year, Table 1), with confi-
dence intervals overlapping zero. However, a much shorter lag is
observed when analysing the net fluxes, that is recruits−deaths
(−0.45 mm/year, Table 1), indicating that although responses are
slow, this system has some dynamic capacity to respond to changes
in climate.
The observed pace of change is a reflection of the nature of
these communities. Recruitment and mortality of trees ≥10 cm D
averaged nine trees per hectare per year between 1985 and 2010
across the basin (Brienen et al., 2015). Considering that in our data
mean stem density is 520 trees ha−1 and mean plot‐monitoring
length is 14 years, we can expect by the final census an accumu-
lated turnover of ≈24% of stems. Thus, we should expect a priori
that whole community‐level composition would not only be
affected by changes over the measurement period but would also
reflect legacy effects of recruitment and mortality processes occur-
ring decades prior to the onset of the monitoring period (Davis,
1989). Our results provide empirical evidence of the inertia within
this system and clearly raise concerns about whether forests here
will be able to track further climate change anticipated over coming
decades.
This study provides the first Amazon‐wide picture of functional
and floristic dynamics over the last 30 years. Models have pre-
dicted a strengthening of the dry season over the Amazon (Boisier,
Ciais, Ducharne, & Guimberteau, 2015; Joetzjer, Douville, Delire, &
Ciais, 2013), and an increase in water‐stress as a consequence of
rising temperature (Pokhrel, Fan, & Miguez‐Macho, 2014). But there
have been few attempts to account for changes in composition,
which may modulate the whole forest ecological impact of eco-
physiological drivers such as increasing vapour pressure deficit
(Levine et al., 2016; Sakschewski et al., 2016). The velocity and the
magnitude of compositional changes presented here should be con-
sidered in attempts to model the dynamics of these forests under
future climate. Our results show that a slow shift towards a more
dry‐affiliated Amazonia is underway. If such a floristic shift is sub-
stantial enough to increase the resilience of Amazon tree communi-
ties to future droughts, it will still come with a price in terms of
tree biodiversity, as wet‐affiliated restricted taxa represent the
majority of Amazonian tree flora (Esquivel‐Muelbert, Baker, et al.,
2017). Furthermore, although our results demonstrate that changes
in composition are possible, the inertia intrinsic to these communi-
ties means that they will substantially lag behind climate change.
Droughts are continuing to impact the basin (Erfanian et al., 2017;
Jiménez‐Muñoz et al., 2016). If this lag persists, intact Amazonian
forests may be increasingly dominated by sub‐optimally adapted
trees in terms of their preferred climate space, potentially
ESQUIVEL‐MUELBERT ET AL. | 51
threatening the ability of these ecosystems to provide key services
such as protecting biodiversity and sequestering and storing
carbon.
ACKNOWLEDGEMENTS
We thank the editor and three anonymous reviewers for their help-
ful comments. This manuscript is a product of the RAINFOR net-
work. It integrates the effort of hundreds of researchers and field
assistants across Amazonia over three decades and has benefited
from the sustained support of rural communities and local institu-
tions. We thank the following individuals in particular: Atila Alves de
Oliveira, Benoit Burban, Bert van Ulft, Eliana Riascos, Foster Brown,
Francisco Gómez, Freddy Ramirez Arevalo, Iêda Leão do Amaral,
Irina Mendoza Polo, Jean Olivier, Joey Talbot, John Lleigue, Marcela
Serna, Michel Baisie, Lilian Blanc, Patricia Alvarez Loayza, Roderick
Zagt, Nazareno Martinez, Olaf Banki, Pétrus Naisso, Samaria Mura-
kami, Samuel Almeida, Timothy Killeen, Tomas Dario Gutierrez, Wal-
ter Huaraca Huasco, Wemo Betian and Vincent Bezard. Support for
RAINFOR has come from the Natural Environment Research Council
(NERC) Urgency Grants and NERC Consortium Grants “AMAZO-
NICA” (NE/F005806/1), “TROBIT” (NE/D005590/1) and “BIO‐RED”(NE/N012542/1), a European Research Council (ERC) grant (T‐FORCES, “Tropical Forests in the Changing Earth System”), the Gor-
don and Betty Moore Foundation, the European Union's Seventh
Framework Programme (282664, “AMAZALERT”) and the Royal
Society (CH160091). OLP was supported by an ERC Advanced Grant
and a Royal Society Wolfson Research Merit Award. KGD was sup-
ported by a Leverhulme Trust International Academic Fellowship.
This paper is part of the PhD of AE‐M, which was funded by the
ERC T‐FORCES grant. AE‐M is currently supported by T‐FORCES
and the NERC project “TREMOR” (NE/N004655/1).
AUTHOR CONTRIBUTIONS
AE‐M, TRB, SLL and OLP designed the study. AE‐M carried out the
analyses with inputs from TRB, KGD, SLL and OLP. AE‐M and OLP
wrote the manuscript with input from TRB, KGD and SLL. OLP, JL
and YM conceived the RAINFOR forest plot network; EG, TRB, GL‐G and GCP contributed to its development. OLP, RJWB, TRF, TRB,
AM‐M, LA, EA, BSM, B‐HM, NH, MS, EV, JC, EG and YM coordi-
nated data collection with the help of many co‐authors. All co‐au-thors collected field data and commented on the manuscript.
ORCID
Adriane Esquivel‐Muelbert http://orcid.org/0000-0001-5335-1259
Roel J. W. Brienen http://orcid.org/0000-0002-5397-5755
Susan Laurance http://orcid.org/0000-0002-2831-2933
Martin J. P. Sullivan http://orcid.org/0000-0002-5955-0483
Eric Arets http://orcid.org/0000-0001-7209-9028
Wendeson Castro http://orcid.org/0000-0002-5592-9891
David Galbraith http://orcid.org/0000-0002-5555-4823
Anand Roopsind http://orcid.org/0000-0002-4682-1774
Oliver L. Phillips http://orcid.org/0000-0002-8993-6168
REFERENCES
Allen, R. G., Smith, M., Pereira, L. S., & Perrier, A. (1994). An update for
the calculation of reference evapotranspiration. ICID Bulletin, 43, 35–92.
Aragão, L., Malhi, Y., Roman‐ Cuesta, R. M., Saatchi, S., Anderson, L. O.,
& Shimabukuro, Y. E. (2007). Spatial patterns and fire response of
recent Ammazonian droughts. Geophysical Research Letters, 34,
L07701.
Baker, T. R., Phillips, O. L., Malhi, Y., Almeida, S., Arroyo, L., Di Fiore, A.,
… Vásquez Martínez, R. (2004). Variation in wood density determines
spatial patterns in Amazonian forest biomass. Global Change Biology,
10, 545–562. https://doi.org/10.1111/j.1365-2486.2004.00751.xBaker, T. R., Vela Díaz, D. M., Chama Moscoso, V., Navarro, H. G., Mon-
teagudo, A., Pinto, R., … Phillips, O. L. (2016). Consistent, small
effects of treefall disturbances on the composition and diversity of
four Amazonian forests. Journal of Ecology, 104, 497–506. https://doi.org/10.1111/1365-2745.12529
Baraloto, C., Paine, C. E. T., Patino, S., Bonal, D., Herault, B., & Chave, J.
(2010). Functional trait variation and sampling strategies in species‐rich plant communities. Functional Ecology, 24, 208–216. https://doi.org/10.1111/j.1365-2435.2009.01600.x
Bates, D., Mächler, M., Bolker, B., & Walker, S. (2015). Fitting linear mixed‐effects models using lme4. Journal of Statistical Software, 67, 48.
Bello, C., Galetti, M., Pizo, M. A., Magnago, L. F., Rocha, M. F., Lima, R.
A., … Jordano, P. (2015). Defaunation affects carbon storage in tropi-
cal forests. Science Advances, 11, e1501105. https://doi.org/10.1126/
sciadv.1501105
Bennett, A. C., Mcdowell, N. G., Allen, C. D., & Anderson‐Teixeira, K. J.(2015). Larger trees suffer most during drought in forests worldwide.
Nature Plants, 1, 15139. https://doi.org/10.1038/nplants.2015.139
Blonder, B., Moulton, D. E., Blois, J., Enquist, B. J., Graae, B. J., Macias‐Fauria, M., … Svenning, J. C. (2017). Predictability in community
dynamics. Ecology Letters, 20, 293–306. https://doi.org/10.1111/ele.12736
Boisier, J. P., Ciais, P., Ducharne, A., & Guimberteau, M. (2015). Projected
strengthening of Amazonian dry season by constrained climate model
simulations. Nature Climate Change, 5, 656–660. https://doi.org/10.
1038/nclimate2658
Bowler, D. E., Hof, C., Haase, P., Kröncke, I., Schweiger, O., Adrian, R., …Böhning‐Gaese, K. (2017). Cross‐realm assessment of climate change
impacts on species’ abundance trends. Nature Ecology and Evolution,
1, 67. https://doi.org/10.1038/s41559-016-0067
Brienen, R. J. W., Phillips, O. L., Feldpausch, T. R., Gloor, E., Baker, T. R.,
Lloyd, J., & Zagt, R. J. (2015). Long‐term decline of the Amazon carbon
sink. Nature, 519, 344–348. https://doi.org/10.1038/nature14283Butt, N., Malhi, Y., New, M., Macía, M. J., Lewis, S. L., Lopez‐Gonzalez,
G., … Phillips, O. L. (2014). Shifting dynamics of climate‐functionalgroups in old‐growth Amazonian forests. Plant Ecology and Diversity,
7, 267–279. https://doi.org/10.1080/17550874.2012.715210Cardoso, D., Särkinen, T., Alexander, S., Amorim, A. M., Bittrich, V., Celis,
M., … Forzza, R. C. (2017). Amazon plant diversity revealed by a tax-
onomically verified species list. Proceedings of the National Academy
of Sciences, 114, 10695–10700. https://doi.org/10.1073/pnas.
1706756114
Chambers, J. Q., Negron‐Juarez, R. I., Marra, D. M., Di Vittorio, A., Tews,
J., Roberts, D., … Higuchi, N. (2013). The steady‐state mosaic of dis-
turbance and succession across an old‐growth Central Amazon forest
landscape. Proceedings of the National Academy of Sciences, 110,
3949–3954. https://doi.org/10.1073/pnas.1202894110
52 | ESQUIVEL‐MUELBERT ET AL.

Chapman, C. A., & Chapman, L. J. (1995). Survival without dispersers:
seedling recruitment under parents. Conservation Biology, 9, 675–678.https://doi.org/10.1046/j.1523-1739.1995.09030675.x
Chave, J., Condit, R., Muller‐Landau, H. C., Thomas, S. C., Ashton, P. S.,
Bunyavejchewin, S., … Losos, E. C. (2008). Assessing evidence for a
pervasive alteration in tropical tree communities. Plos Biology, 6, 455–462.
Chave, J., Coomes, D., Jansen, S., Lewis, S. L., Swenson, N. G., & Zanne,
A. E. (2009). Towards a worldwide wood economics spectrum. Ecol-
ogy Letters, 12, 351–366. https://doi.org/10.1111/j.1461-0248.2009.01285.x
Chen, I.‐C., Shiu, H.‐J., Benedick, S., Holloway, J. D., Chey, V. K., Barlow,
H. S., … Thomas, C. D. (2009). Elevation increases in moth assem-
blages over 42 years on a tropical mountain. Proceedings of the
National Academy of Sciences of the United States of America, 106,
1479–1483. https://doi.org/10.1073/pnas.0809320106Coelho de Souza, F., Dexter, K. G., Phillips, O. L., Brienen, R. J., Chave, J.,
Galbraith, D. R., … Baker, T. R. (2016). Evolutionary heritage influ-
ences Amazon tree ecology. Proceedings of the Royal Society B: Biolog-
ical Sciences, 283, 20161587.
Condit, R., Hubbell, S. P., & Foster, R. B. (1996). Changes in tree species
abundance in a Neotropical forest: Impact of climate change. Journal
of Tropical Ecology, 12, 231–256. https://doi.org/10.1017/
S0266467400009433
Connell, J. H., & Slatyer, R. O. (1977). Mechanisms of succession in natu-
ral communities and their role in community stability and organiza-
tion. American Naturalist, 111, 1119–1144. https://doi.org/10.1086/283241
Conway, T. J., & Tans, P. P. (2016). Trends in atmospheric carbon diox-
ide. Retrieved from https://www.esrl.noaa.gov/gmd/ccgg/trends
Coomes, D. A., Lines, E. R., & Allen, R. B. (2011). Moving on from Meta-
bolic Scaling Theory: Hierarchical models of tree growth and asym-
metric competition for light. Journal of Ecology, 99, 748–756.https://doi.org/10.1111/j.1365-2745.2011.01811.x
Davis, M. B. (1989). Lags in vegetation response to greenhouse warming.
Climatic Change, 15, 75–82. https://doi.org/10.1007/BF00138846Devictor, V., van Swaay, C., Brereton, T., Brotons, L., Chamberlain, D.,
Heliölä, J., … Jiguet, F. (2012). Differences in the climatic debts of
birds and butterflies at a continental scale. Nature Climate Change, 2,
121. https://doi.org/10.1038/nclimate1347
Diaz, S., Lavorel, S., De Bello, F., Quetier, F., Grigulis, K., & Robson, M.
(2007). Incorporating plant functional diversity effects in ecosystem
service assessments. Proceedings of the National Academy of Sciences
of the United States of America, 104, 20684–20689. https://doi.org/10.1073/pnas.0704716104
Doughty, C. E., Wolf, A., Morueta‐Holme, N., Jørgensen, P. M., Sandel,
B., Violle, C., … Galetti, M. (2016). Megafauna extinction, tree species
range reduction, and carbon storage in Amazonian forests. Ecography,
39, 194–203. https://doi.org/10.1111/ecog.01587Duffy, P. B., Brando, P., Asner, G. P., & Field, C. B. (2015). Projections of
future meteorological drought and wet periods in the Amazon. Pro-
ceedings of the National Academy of Sciences of the United States of
America, 112, 13172–13177. https://doi.org/10.1073/pnas.
1421010112
Duque, A., Stevenson, P. R., & Feeley, K. J. (2015). Thermophilization of
adult and juvenile tree communities in the northern tropical Andes.
Proceedings of the National Academy of Sciences, 112, 10744–10749.https://doi.org/10.1073/pnas.1506570112
Engelbrecht, B. M. J., Comita, L. S., Condit, R., Kursar, T. A., Tyree, M. T.,
Turner, B. L., & Hubbell, S. P. (2007). Drought sensitivity shapes spe-
cies distribution patterns in tropical forests. Nature, 447, 80–82.https://doi.org/10.1038/nature05747
Enquist, B. J., & Enquist, C. F. (2011). Long‐term change within a
Neotropical forest: Assessing differential functional and floristic
responses to disturbance and drought. Global Change Biology, 17,
1408–1424. https://doi.org/10.1111/j.1365-2486.2010.02326.xEnquist, B. J., West, G. B., & Brown, J. H. (2009). Extensions and evalua-
tions of a general quantitative theory of forest structure and dynam-
ics. Proceedings of the National Academy of Sciences, 106, 7046–7051.https://doi.org/10.1073/pnas.0812303106
Enquist, B. J., West, G. B., Charnov, E. L., & Brown, J. H. (1999). Allomet-
ric scaling of production and life‐history variation in vascular plants.
Nature, 401, 907–911. https://doi.org/10.1038/44819Erfanian, A., Wang, G., & Fomenko, L. (2017). Unprecedented drought
over tropical South America in 2016: Significantly under‐predicted by
tropical SST. Scientific Reports, 7, 5811. https://doi.org/10.1038/
s41598-017-05373-2
Espinoza, J. C., Marengo, J. A., Ronchail, J., Carpio, J. M., Flores, L. N., &
Guyot, J. L. (2014). The extreme 2014 flood in south‐western Ama-
zon basin: The role of tropical‐subtropical South Atlantic SST gradi-
ent. Environmental Research Letters, 9, 124007. https://doi.org/10.
1088/1748-9326/9/12/124007
Esquivel‐Muelbert, A., Baker, T. R., Dexter, K. G., Lewis, S. L., ter Steege,
H., Lopez‐Gonzalez, G., … Phillips, O. L. (2017). Seasonal drought lim-
its tree species across the Neotropics. Ecography, 40, 618–629.https://doi.org/10.1111/ecog.01904
Esquivel‐Muelbert, A., Galbraith, D., Dexter, K. G., Lewis, S. L., ter Steege,
H., … Phillips, O. L. (2017). Biogeographic distributions of neotropical
trees reflect their directly measured drought tolerances. Scientific
Reports, 7, 8334. https://doi.org/10.1038/s41598-017-08105-8
Falster, D. S., & Westoby, M. (2003). Plant height and evolutionary
games. Trends in Ecology and Evolution, 18, 337–343. https://doi.org/10.1016/S0169-5347(03)00061-2
Falster, D. S., & Westoby, M. (2005). Alternative height strategies among
45 dicot rain forest species from tropical Queensland, Australia. Jour-
nal of Ecology, 93, 521–535. https://doi.org/10.1111/j.0022-0477.
2005.00992.x
Fauset, S., Baker, T. R., Lewis, S. L., Feldpausch, T. R., Affum‐Baffoe, K.,Foli, E. G., … Swaine, M. D. (2012). Drought‐induced shifts in the
floristic and functional composition of tropical forests in Ghana. Ecol-
ogy Letters, 15, 1120–1129. https://doi.org/10.1111/j.1461-0248.
2012.01834.x
Fauset, S., Johnson, M. O., Gloor, M., Baker, T. R., Monteagudo, M. A.,
Brienen, R. J., & , …, O. L. (2015). Hyperdominance in Amazonian
forest carbon cycling. Nature Communications, 6, 6857. https://doi.
org/10.1038/ncomms7857
Feeley, K. J., Davies, S. J., Perez, R., Hubbell, S. P., & Foster, R. B. (2011).
Directional changes in the species composition of a tropical forest.
Ecology, 92, 871–882. https://doi.org/10.1890/10-0724.1Feeley, K. J., Silman, M. R., Bush, M. B., Farfan, W., Cabrera, K. G., Malhi,
Y., … Saatchi, S. (2011). Upslope migration of Andean trees. Journal
of Biogeography, 38, 783–791. https://doi.org/10.1111/j.1365-2699.2010.02444.x
Feldpausch, T. R., Lloyd, J., Lewis, S. L., Brienen, R. J. W., Gloor, M., Mon-
teagudo Mendoza, A., … Phillips, O. L. (2012). Tree height integrated
into pantropical forest biomass estimates. Biogeosciences, 9, 3381–3403. https://doi.org/10.5194/bg-9-3381-2012
Feldpausch, T. R., Phillips, O. L., Brienen, R. J. W., Gloor, E., Lloyd, J.,
Lopez‐Gonzalez, G., … Vos, V. A. (2016). Amazon forest response to
repeated droughts. Global Biogeochemical Cycles, 30, 964–982.https://doi.org/10.1002/2015GB005133
Fisher, J. I., Hurtt, G. C., Thomas, R. Q., & Chambers, J. Q. (2008). Clus-
tered disturbances lead to bias in large‐scale estimates based on for-
est sample plots. Ecology Letters, 11, 554–563. https://doi.org/10.
1111/j.1461-0248.2008.01169.x
Flores, O., & Coomes, D. A. (2011). Estimating the wood density of spe-
cies for carbon stock assessments. Methods in Ecology and Evolution,
2, 214–220. https://doi.org/10.1111/j.2041-210X.2010.00068.x
ESQUIVEL‐MUELBERT ET AL. | 53
Francis, A. P., & Currie, D. J. (2003). A globally consistent richness‐cli-mate relationship for angiosperms. American Naturalist, 161, 523–536. https://doi.org/10.1086/368223
Fyllas, N. M., Patiño, S., Baker, T. R., Bielefeld Nardoto, G., Martinelli, L.
A., Quesada, C. A., … Lloyd, J. (2009). Basin‐wide variations in foliar
properties of Amazonian forest: Phylogeny, soils and climate.
Biogeosciences, 6, 2677–2708. https://doi.org/10.5194/bg-6-2677-
2009
Fyllas, N. M., Quesada, C. A., & Lloyd, J. (2012). Deriving plant functional
types for Amazonian forests for use in vegetation dynamics models.
Perspectives in Plant Ecology, Evolution and Systematics, 14, 97–110.https://doi.org/10.1016/j.ppees.2011.11.001
Gatti, L. V., Gloor, M., Miller, J. B., Doughty, C. E., Malhi, Y., Domingues,
L. G., … Lloyd, J. (2014). Drought sensitivity of Amazonian carbon
balance revealed by atmospheric measurements. Nature, 506, 76–80.https://doi.org/10.1038/nature12957
Gentry, A. H. (1988). Changes in plant community diversity and floristic
composition on environmental and geographical gradients. Annals of
the Missouri Botanical Garden, 75, 1–34. https://doi.org/10.2307/
2399464
Giardina, F., Konings, A. G., Kennedy, D., Alemohammad, S. H., Oliveira,
R. S., Uriarte, M., & Gentine, P. (2018). Tall Amazonian forests are
less sensitive to precipitation variability. Nature Geoscience, 11, 405–409. https://doi.org/10.1038/s41561-018-0133-5
Gloor, M., Barichivich, J., Ziv, G., Brienen, R., Schöngart, J., Peylin, P., …Baker, J. (2015). Recent Amazon climate as background for possible
ongoing and future changes of Amazon humid forests. Global Biogeo-
chemical Cycles, 29, 1384–1399. https://doi.org/10.1002/2014GB
005080
Harris, I., Jones, P. D., Osborn, T. J., & Lister, D. H. (2014). Updated high‐resolution grids of monthly climatic observations – the CRU TS3.10
Dataset. International Journal of Climatology, 34, 623–642. https://doi.org/10.1002/joc.3711
Hilker, T., Lyapustin, A. I., Tucker, C. J., Hall, F. G., Myneni, R. B., Wang,
Y., … Sellers, P. J. (2014). Vegetation dynamics and rainfall sensitivity
of the Amazon. Proceedings of the National Academy of Sciences, 111,
16041–16046. https://doi.org/10.1073/pnas.1404870111Hubbell, S. P. (2001). The unified neutral theory of biodiversity and biogeog-
raphy. Princenton, NJ: Princenton University Press.
Huffman, G. J., Bolvin, D. T., Nelkin, E. J., Wolff, D. B., Adler, R. F., Gu,
G., … Stocker, E. F. (2007). The TRMM Multisatellite Precipitation
Analysis (TMPA): Quasi‐Global, Multiyear, Combined‐Sensor Precipi-
tation Estimates at Fine Scales. Journal of Hydrometeorology, 8, 38–55. https://doi.org/10.1175/JHM560.1
Jiménez‐Muñoz, J. C., Mattar, C., Barichivich, J., Santamaría‐Artigas, A.,Takahashi, K., Malhi, Y., … Schrier, G. (2016). Record‐breaking warm-
ing and extreme drought in the Amazon rainforest during the course
of El Niño 2015–2016. Scientific Reports, 6, 33130. https://doi.org/
10.1038/srep33130
Jiménez‐Muñoz, J. C., Sobrino, J. A., Mattar, C., & Malhi, Y. (2013).
Spatial and temporal patterns of the recent warming of the
Amazon forest. Journal of Geophysical Research: Atmospheres, 118,
5204–5215.Joetzjer, E., Douville, H., Delire, C., & Ciais, P. (2013). Present‐day and
future Amazonian precipitation in global climate models: CMIP5 ver-
sus CMIP3. Climate Dynamics, 41, 2921–2936. https://doi.org/10.
1007/s00382-012-1644-1
Laurance, W. F. (2004). Forest‐climate interactions in fragmented tropical
landscapes. Philosophical Transactions of the Royal Society of London
Series B‐Biological Sciences, 359, 345–352. https://doi.org/10.1098/
rstb.2003.1430
Laurance, W. F., Oliveira, A. A., Laurance, S. G., Condit, R., Nascimento,
H. E. M., Sanchez‐Thorin, A. C., … Dick, C. W. (2004). Pervasive
alteration of tree communities in undisturbed Amazonian forests.
Nature, 428, 171–175. https://doi.org/10.1038/nature02383
Lenoir, J., Gegout, J. C., Marquet, P. A., De Ruffray, P., & Brisse, H.
(2008). A significant upward shift in plant species optimum elevation
during the 20th century. Science, 320, 1768–1771. https://doi.org/10.1126/science.1156831
Levine, N. M., Zhang, K., Longo, M., Baccini, A., Phillips, O. L., Lewis, S.
L., … Moorcroft, P. R. (2016). Ecosystem heterogeneity determines
the ecological resilience of the Amazon to climate change. Proceed-
ings of the National Academy of Sciences, 113, 793–797. https://doi.org/10.1073/pnas.1511344112
Levis, C., Costa, F. R. C., Bongers, F., Peña‐Claros, M., Clement, C. R.,
Junqueira, A. B., … Ter Steege, H. (2017). Persistent effects of pre‐Columbian plant domestication on Amazonian forest composition.
Science, 355, 925–931. https://doi.org/10.1126/science.aal0157Lewis, S. L., Brando, P. M., Phillips, O. L., Van Der Heijden, G. M. F., &
Nepstad, D. (2011). The 2010 Amazon drought. Science, 331, 554.
https://doi.org/10.1126/science.1200807
Lewis, S. L., Lloyd, J., Sitch, S., Mitchard, E. T. A., & Laurance, W. F.
(2009). Changing ecology of tropical forests: evidence and drivers. In:
Annual Review of Ecology Evolution and Systematics. Palo Alto,
Annual Reviews.
Lewis, S. L., Lopez‐Gonzalez, G., Sonke, B., Affum‐Baffoe, K., Baker, T. R.,Ojo, L. O., … Wöll, H. (2009). Increasing carbon storage in intact Afri-
can tropical forests. Nature, 457, 1003–1006. https://doi.org/10.
1038/nature07771
Lloyd, J., & Farquhar, G. D. (1996). The CO2 dependence of photosynthe-
sis, plant growth responses to elevated atmospheric CO2 concentra-
tions and their interaction with soil nutrient status.1. General
principles and forest ecosystems. Functional Ecology, 10, 4–32.https://doi.org/10.2307/2390258
Lloyd, J., & Farquhar, G. D. (2008). Effects of rising temperatures and
CO2 on the physiology of tropical forest trees. Philosophical Transac-
tions of the Royal Society B‐Biological Sciences, 363, 1811–1817.https://doi.org/10.1098/rstb.2007.0032
Lopez‐Gonzalez, G., Lewis, S. L., Burkitt, M., & Phillips, O. L. (2011). For-
estPlots.net: A web application and research tool to manage and
analyse tropical forest plot data. Journal of Vegetation Science, 22,
610–613. https://doi.org/10.1111/j.1654-1103.2011.01312.xMalhi, Y., Phillips, O. L., Lloyd, J., Baker, T., Wright, J., Almeida, S., … Vin-
ceti, B. (2002). An international network to monitor the structure,
composition and dynamics of Amazonian forests (RAINFOR). Journal
of Vegetation Science, 13, 439–450. https://doi.org/10.1111/j.1654-1103.2002.tb02068.x
Marengo, J. A., & Espinoza, J. C. (2016). Extreme seasonal droughts and
floods in Amazonia: Causes, trends and impacts. International Journal
of Climatology, 36, 1033–1050. https://doi.org/10.1002/joc.4420Marengo, J. A., Nobre, C. A., Tomasella, J., Oyama, M. D., de Oliveira, G.
S., de Oliveira, R., … Foster Brown, I. (2008). The drought of Amazo-
nia in 2005. Journal of Climate, 21, 495–516. https://doi.org/10.
1175/2007JCLI1600.1
Marengo, J. A., Tomasella, J., Alves, L. M., Soares, W. R., & Rodriguez, D.
A. (2011). The drought of 2010 in the context of historical droughts
in the Amazon region. Geophysical Research Letters, 38, L12703.
McDowell, N. G., & Allen, C. D. (2015). Darcy's law predicts widespread
forest mortality under climate warming. Nature Climate Change, 5,
669–672. https://doi.org/10.1038/nclimate2641
McGill, B. J., Enquist, B. J., Weiher, E., & Westoby, M. (2006). Rebuilding
community ecology from functional traits. Trends in Ecology and Evo-
lution, 21, 178–185. https://doi.org/10.1016/j.tree.2006.02.002McIntyre, P. J., Thorne, J. H., Dolanc, C. R., Flint, A. L., Flint, L. E., Kelly,
M., & Ackerly, D. D. (2015). Twentieth‐century shifts in forest struc-
ture in California: Denser forests, smaller trees, and increased domi-
nance of oaks. Proceedings of the National Academy of Sciences, 112,
1458–1463. https://doi.org/10.1073/pnas.1410186112McMichael, C. N. H., Matthews‐Bird, F., Farfan‐Rios, W., & Feeley, K. J.
(2017). Ancient human disturbances may be skewing our
54 | ESQUIVEL‐MUELBERT ET AL.

understanding of Amazonian forests. Proceedings of the National
Academy of Sciences, 114, 522–527. https://doi.org/10.1073/pnas.
1614577114
Muller‐Landau, H. C. (2004). Interspecific and inter‐site variation in wood
specific gravity of tropical trees. Biotropica, 36, 20–32.Nascimento, H. E. M., Laurance, W. F., Condit, R., Laurance, S. G., D'an-
gelo, S., & Andrade, A. C. (2005). Demographic and life‐history corre-
lates for Amazonian trees. Journal of Vegetation Science, 16, 625–634.https://doi.org/10.1111/j.1654-1103.2005.tb02405.x
Nepstad, D. C., Tohver, I. M., Ray, D., Moutinho, P., & Cardinot, G.
(2007). Mortality of large trees and lianas following experimental
drought in an amazon forest. Ecology, 88, 2259–2269. https://doi.
org/10.1890/06-1046.1
Osuri, A. M., Ratnam, J., Varma, V., Alvarez‐Loayza, P., Hurtado Astaiza,
J., Bradford, M., … Sankaran, M. (2016). Contrasting effects of defau-
nation on aboveground carbon storage across the global tropics. Nat-
ure Communications, 7, 11351. https://doi.org/10.1038/nc
omms11351
Pan, Y. D., Birdsey, R. A., Fang, J. Y., Houghton, R., Kauppi, P. E., Kurz,
W. A., … Hayes, D. (2011). A large and persistent carbon sink in the
world's forests. Science, 333, 988–993. https://doi.org/10.1126/science.1201609
Patiño, S., Lloyd, J., Paiva, R., Baker, T. R., Quesada, C. A., Mercado, L.
M., … Phillips, O. L. (2009). Branch xylem density variations across
the Amazon Basin. Biogeosciences, 6, 545–568.Penone, C., Davidson, A. D., Shoemaker, K. T., Di Marco, M., Rondinini,
C., Brooks, T. M., … Costa, G. C. (2014). Imputation of missing data
in life‐history trait datasets: Which approach performs the best?
Methods in Ecology and Evolution, 5, 961–970. https://doi.org/10.
1111/2041-210X.12232
Peres, C. A., Emilio, T., Schietti, J., Desmoulière, S. J. M., & Levi, T. (2016).
Dispersal limitation induces long‐term biomass collapse in overhunted
Amazonian forests. Proceedings of the National Academy of Sciences,
113, 892–897. https://doi.org/10.1073/pnas.1516525113Peres, C. A., & Lake, I. R. (2003). Extent of nontimber resource extraction
in tropical forests: Accessibility to game vertebrates by hunters in the
Amazon basin. Conservation Biology, 17, 521–535. https://doi.org/10.1046/j.1523-1739.2003.01413.x
Peres, C. A., & Palacios, E. (2007). Basin‐wide effects of game harvest on
vertebrate population densities in Amazonian forests: Implications for
animal‐mediated seed dispersal. Biotropica, 39, 304–315. https://doi.org/10.1111/j.1744-7429.2007.00272.x
Phillips, O. L., Aragao, L., Lewis, S. L., Fisher, J. B., Lloyd, J., López‐Gonzá-lez, G., … Lezama, A. (2009). Drought sensitivity of the amazon rain-
forest. Science, 323, 1344–1347. https://doi.org/10.1126/science.
1164033
Phillips, O., Baker, T., Feldpausch, T., Brienen, R., Almeida, S., Arroyo, L.,
… Vásquez, R. (2016). RAINFOR field manual for plot establishment
and remeasurement.
Phillips, O. L., & Gentry, A. H. (1994). Increasing turnover through time in
tropical forests. Science, 263, 954–958. https://doi.org/10.1126/science.263.5149.954
Phillips, O. L., Malhi, Y., Higuchi, N., Laurance, W. F., Nunez, P. V., Vas-
quez, R. M., … Grace, J. (1998). Changes in the carbon balance of
tropical forests: Evidence from long‐term plots. Science, 282, 439–442. https://doi.org/10.1126/science.282.5388.439
Phillips, O. L., Van Der Heijden, G., Lewis, S. L., López‐González, G., Ara-gão, L. E., Lloyd, J., … Vilanova, E. (2010). Drought‐mortality relation-
ships for tropical forests. New Phytologist, 187, 631–646. https://doi.org/10.1111/j.1469-8137.2010.03359.x
Pitman, N. C. A., Terborgh, J. W., Silman, M. R., Percy Nùñez, V., Neill, D.
A., Ceron, C. E., … Aulestia, M. (2002). A comparison of tree species
diversity in two upper Amazonian forests. Ecology, 83, 3210–3224.https://doi.org/10.1890/0012-9658(2002)083[3210:ACOTSD]2.0.CO;2
Pokhrel, Y. N., Fan, Y., & Miguez‐Macho, G. (2014). Potential hydrologic
changes in the Amazon by the end of the 21st century and the
groundwater buffer. Environmental Research Letters, 9, 084004.
Poorter, L., Bongers, F., Sterck, F. J., & Wöll, H. (2005). Beyond the
regeneration phase: Differentiation of height–light trajectories among
tropical tree species. Journal of Ecology, 93, 256–267. https://doi.org/10.1111/j.1365-2745.2004.00956.x
Poorter, L., McDonald, I., Alarcón, A., Fichtler, E., Licona, J. C., Peña‐Claros, M., … Sass‐Klaassen, U. (2010). The importance of wood
traits and hydraulic conductance for the performance and life history
strategies of 42 rainforest tree species. New Phytologist, 185, 481–492. https://doi.org/10.1111/j.1469-8137.2009.03092.x
Qie, L., Lewis, S. L., Sullivan, M. J. P., Lopez‐Gonzalez, G., Pickavance, G.C., Sunderland, T., & , …, O. L. (2017). Long‐term carbon sink in Bor-
neo's forests halted by drought and vulnerable to edge effects. Nat-
ure Communications, 8, 1966.
Rowland, L., Da Costa, A. C. L., Galbraith, D. R., Oliveira, R. S., Binks, O.
J., Oliveira, A. A., … Meir, P. (2015). Death from drought in tropical
forests is triggered by hydraulics not carbon starvation. Nature, 528,
119–122.Sakschewski, B., von Bloh, W., Boit, A., Poorter, L., Peña‐Claros, M.,
Heinke, J., … Thonicke, K. (2016). Resilience of Amazon forests
emerges from plant trait diversity. Nature Climate Change, 6, 1032–1036. https://doi.org/10.1038/nclimate3109
Stahl, C., Hérault, B., Rossi, V., Burban, B., Bréchet, C., & Bonal, D.
(2013). Depth of soil water uptake by tropical rainforest trees during
dry periods: Does tree dimension matter? Oecologia, 173, 1191–1201. https://doi.org/10.1007/s00442-013-2724-6
Svenning, J.‐C., & Sandel, B. (2013). Disequilibrium vegetation dynamics
under future climate change. American Journal of Botany, 100, 1266–1286. https://doi.org/10.3732/ajb.1200469
Ter Steege, H., Nigel, C. A., Sabatier, D., Baraloto, C., Salomão, R. P.,
Guevara, J. E., … Silman, M. R. (2013). Hyperdominance in the Ama-
zonian tree flora. Science, 342, 325.
Terborgh, J., Nuñez‐Iturri, G., Pitman, N. C., Valverde, F. H., Alvarez, P.,
Swamy, V., … Paine, C. E. (2008). Tree recruitment in an empty for-
est. Ecology, 89, 1757–1768. https://doi.org/10.1890/07-0479.1Thomas, C. D., Cameron, A., Green, R. E., Bakkenes, M., Beaumont, L.,
Collingham, Y. C., & Williams, S. E. (2004). Extinction risk from cli-
mate change. Nature, 427, 145–148. https://doi.org/10.1038/nature02121
Van Der Sande, M. T., Arets, E. J. M. M., Peña‐Claros, M., Luciana de
Avila, A., Roopsind, A., Mazzei, L., … Poorter, L. (2016). Old‐growth
Neotropical forests are shifting in species and trait composition. Eco-
logical Monographs, 86(2), 228–243. https://doi.org/10.1890/15-
1815.1
Van Der Sleen, P., Groenendijk, P., Vlam, M., Anten, N. P. R., Boom, A.,
Bongers, F., Pons, T. L., Terburg, G., … Zuidema, P. A. (2015). No
growth stimulation of tropical trees by 150 years of CO2 fertilization
but water‐use efficiency increased. Nature Geoscience, 8, 24–28.https://doi.org/10.1038/ngeo2313
Violle, C., Reich, P. B., Pacala, S. W., Enquist, B. J., & Kattge, J. (2014).
The emergence and promise of functional biogeography. Proceedings
of the National Academy of Sciences of the United States of America,
111, 13690–13696. https://doi.org/10.1073/pnas.1415442111Wright, S. J. (1992). Seasonal drought, soil fertility and the species den-
sity of tropical forest plant communities. Trends in Ecology and Evolu-
tion, 7, 260–263. https://doi.org/10.1016/0169-5347(92)90171-7Wright, S. J. (2005). Tropical forests in a changing environment. Trends in
Ecology and Evolution, 20, 553–560. https://doi.org/10.1016/j.tree.
2005.07.009
Zalamea, P. C., Heuret, P., Sarmiento, C., Rodríguez, M., Berthouly, A.,
Guitet, S., … Stevenson, P. R. (2012). The genus cecropia: A biologi-
cal clock to estimate the age of recently disturbed areas in the
ESQUIVEL‐MUELBERT ET AL. | 55

neotropics. PLoS ONE, 7, e42643. https://doi.org/10.1371/journal.
pone.0042643
Zanne, A. E., Lopez‐Gonzalez, G., Coomes, D. A., Ilic, J., Jansen, S., Lewis,
S. L., … Chave, J. (2009). Data from: Towards a worldwide wood
economics spectrum. Dryad Data Repository. https://doi.org/10.5061/
dryad.234
Zhu, Z., Piao, S., Myneni, R. B., Huang, M., Zeng, Z., Canadell, J. G., …Zeng, N. (2016). Greening of the Earth and its drivers. Nature Climate
Change, 6, 791. https://doi.org/10.1038/nclimate3004
Zuleta, D., Duque, A., Cardenas, D., Muller‐Landau, H. C., & Davies, S.
(2017). Drought‐induced mortality patterns and rapid biomass recov-
ery in a terra firme forest in the Colombian Amazon. Ecology, 98,
2538–2546. https://doi.org/10.1002/ecy.1950
SUPPORTING INFORMATION
Additional supporting information may be found online in the
Supporting Information section at the end of the article.
How to cite this article: Esquivel‐Muelbert A, Baker TR,
Dexter KG, et al. Compositional response of Amazon forests
to climate change. Glob Change Biol. 2019;25:39–56.https://doi.org/10.1111/gcb.14413
56 | ESQUIVEL‐MUELBERT ET AL.