composite index for trinidad and tobago jhinkoo...outline of presentation aim and motivation of...
TRANSCRIPT

A PRELIMINARY COMPOSITE ECONOMIC
PERFORMANCE INDEX FOR
TRINIDAD AND TOBAGO
Dr. Dave Seerattan and Ms.Julia Jhinkoo
UWI, St. Augustine Campus, Trinidad

Outline of Presentation
Aim and Motivation of Study
Purpose of a Composite Index
Literature Review
Methodology
Composite Index of Economic Performance for
Trinidad and Tobago
Leading Composite Index and its uses
Conclusion and Proposed Further Research

AIM and MOTIVATION
•To develop a Leading Composite Economic Performance
Index (LCI) for Trinidad and Tobago which is based on
readily available high frequency data and therefore can
be produced on a timely and consistent basis at lower
cost.
•The proposed LCI could act as an early warning system
that signals changes in the macro-economy, as well as
providing insights into how the economy works on a more
frequent basis.

Composite Indices & Desirable Properties • A Composite Index is based on a grouping of
factors combined in a standardized way, providing a
useful statistical measure of overall market or sector
performance over time.
• A well designed composite indicator should be
based on the best available evidence; be designed
with transparent structures and assessed using
appropriate multivariate and sensitivity analysis,
Saisana and Cartwright (2007).
Literature Review
•Internationally there is a wide cross
section of studies done on composite
indices.
•The use of CI’s is used in advanced
economies – USA, EU , China
•CI’s are relatively new to the Caribbean
region – with Barbados being the only
country to have one in current use.
Literature Review
• Jordan and Howard (2005)
•Cotire et al (2007)
•Cragiwell and Moore (2008)

Methodology • Development of the LCI for Trinidad and Tobago was
based on the checklist proposed by the OECD which
proposes ten steps:
1. Theoretical Framework
2. Data Selection
3. Imputation of Missing Data
4. Multivariate Analysis
5. Normalization
6. Weighting and Aggregation
7. Uncertainty and Sensitivity Analysis
8. Back to the data
9. Links to their indicators
10. Visualization of the results
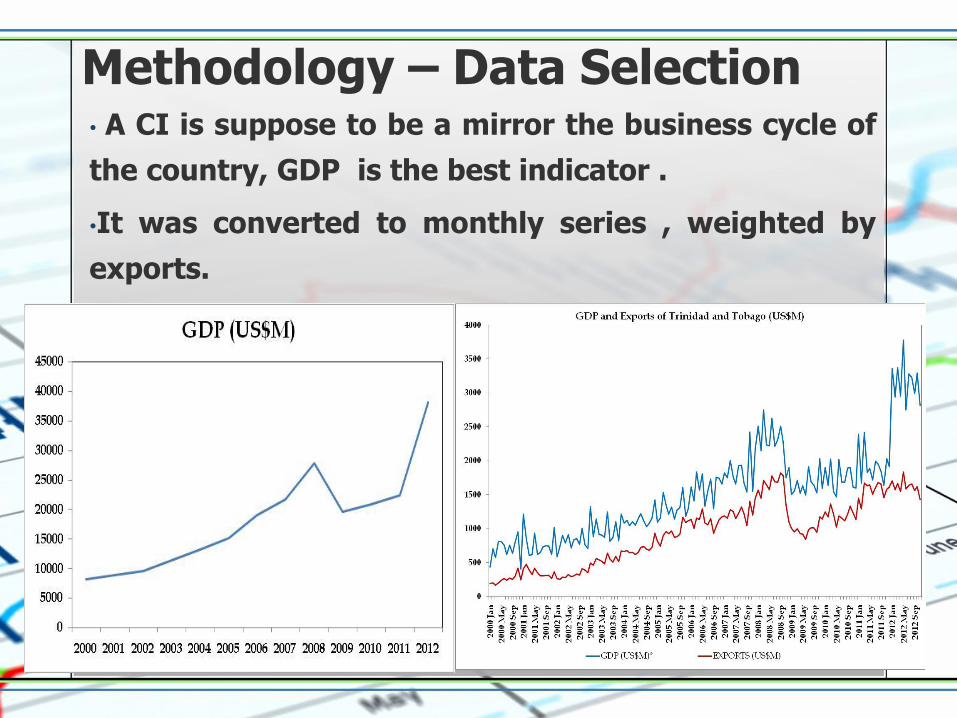
Methodology – Data Selection • A CI is suppose to be a mirror the business cycle of
the country, GDP is the best indicator .
•It was converted to monthly series , weighted by
exports.

Methodology – Data Selection Possible Leading/Coincident Economic Indicators for Trinidad and Tobago
Economic Indicator Frequency Source
Exchange Rate per US dollar Monthly CBTT
Liquefied Natural Gas Production (cu m) Monthly CBTT
Crude Oil Production (000’s Barrels) Monthly CBTT
Crude Oil Refinery Throughput (000’s Barrels) Monthly CBTT
Production of Motor Gasoline (000’s Barrels) Monthly CBTT
Production of Gas and Fuel Oil (000’s Barrels) Monthly CBTT
Future Gas Price (US$ per Million BTU) Monthly EIA
Spot Gas Price – Henry Hub (US$/MMBTU) Monthly EIA
Future Oil Price – WTI (US$ per barrel) Monthly EIA
Spot Oil Prices WTI (US$ per barrel) Monthly EIA
Production of Cement (tonnes) Monthly CBTT
Production of Direct Reduced Iron ( 000’s tonnes) Monthly CBTT
Production of Billets (000’s tonnes) Monthly CBTT
Methanol Production (000’s tones) Monthly CBTT
Inflation (Consumer Price Index per cent change) Monthly CBTT
Net Official Reserves (US$M) Monthly CBTT
Government Debt Outstanding (US$M) Monthly CBTT
Central Government Overall Fiscal Balance (TT$000’s) Monthly CBTT
Financial System: Loans Outstanding Consumers (TT$M) Monthly CBTT
Financial System : Loans Outstanding Incorporated Businesses (TT$M) Monthly CBTT
Commercial Banks : Real Estate Mortgage Loans (TT$M) Monthly CBTT
Commercial Bank Ordinary Savings Deposit Rate (%) Monthly CBTT
Commercial Bank Basic Prime Lending Rate (%) Monthly CBTT
Commercial Bank Real Estate Mortgage Loan Rate (%) Monthly CBTT
Composite Stock price Index Monthly CBTT/ TTSE
Balance of Trade (US$M) Monthly CBTT
Money Supply (M2) (TT$M) Monthly CBTT
Index of Retail Sales Quarterly CBTT
Unemployment Rate (%) Quarterly CBTT
Index of Industrial Production – Brazil, India and USA Monthly IFS
Economic events (local and international) Monthly Author compiled from World News
Methodology – Economic Event • In trying to improve on the reliability of the
proposed composite index , a new variable was
considered.
• Economic events tend to influence the business
cycle of the economy. Dominguez and Panthaki
(2005)
• For this study we classified economic events as
oil and gas discoveries, increases in minimum
wage, budget speeches, elections, decisions of
major Caribbean conglomerates and noteworthy
international events.

Methodology
•Each country is unique and their economies are
driven by different factors.
• Review of studies helped identified the
proposed indicators for this study.
The aim is to develop a composite index that is:
1. Reliable – able to act as a good indicator of economic
activity.
2. Consistent – able to be produced within a timely and
regularly period.
3. Econometrically Sound – to be able to serve as a basis
for short-term predictions of economic activity.
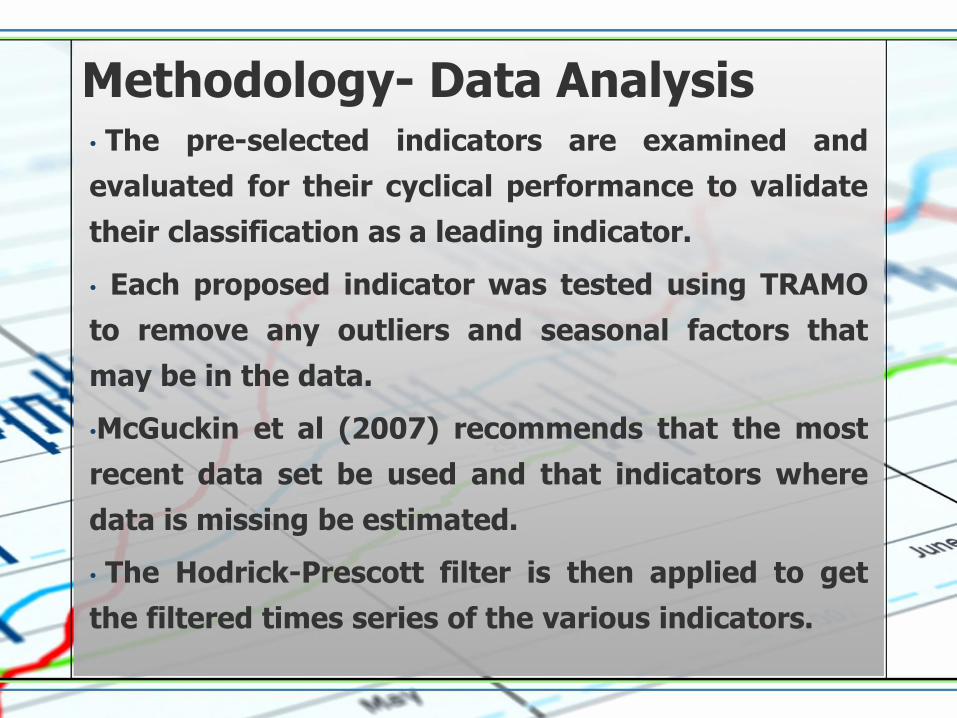
Methodology- Data Analysis • The pre-selected indicators are examined and
evaluated for their cyclical performance to validate
their classification as a leading indicator.
• Each proposed indicator was tested using TRAMO
to remove any outliers and seasonal factors that
may be in the data.
•McGuckin et al (2007) recommends that the most
recent data set be used and that indicators where
data is missing be estimated.
• The Hodrick-Prescott filter is then applied to get
the filtered times series of the various indicators.

Methodology- Composite Index Construction • There are several methods that are used to develop a
composite index:
(1) The NBER Business Cycle Dating Approach
(2) The OECD Methods of Composite Index
(3) GDP Rule of Thumb
(4) Peaks and Through of the Commerce Department business cycle indicators
(5) Stock and Watson’s Business Cycle Indicators
(6) Markov Switching Models
(7) Principal Component Regression
(8) Principal Covariate Index
(9) DI-AR-Lag Model which is based on the diffusion index
(10) Dynamic Factor Model

Methodology- Dynamic Factor Model
• This method was chosen because it is has been
proven to be most suited for data sets with a number
of variables for a short time series, as is the case for
this study.
• Dynamic Factor Models were originally proposed by
Geweke (1977) as a time series extension of factor
models which were developed for cross-sectional
data; the main idea of the model which was proven
was that a few factors can explain a large fraction of
the variance of many macroeconomic series.

Methodology – BUSY • The BUSY program is used on the filtered series , it identifies :
• the turning points
• lagging, coincident and leading indicators
• The BUSY program makes available a selection of statistical
techniques designed for conducting business cycle analysis on a
possibly large set of time series. Two types of statistical
procedures are offered.
• The first is an NBER-type of analysis that is based on descriptive statistics such
as cross-correlations, coherences and phases of the cross spectra and Bry and
Boschan dating procedure (see Bry and Boschan, 1971).
• The second is based on dynamic factor models, following the work by Forni et
al. (1999, 2000).
•Both are aimed at building composite indices that are leading,
coincident or lagging with respect to a reference series.

Methodology – Evaluation phase • Turning Point Identification

Methodology – Relevance
• In determining the relevant variables for
the CI the ratio common component
variance over series variance is examined.
• A value 0.3 and below indicates that there
is not strong a commonalty and the
indicator is idiosyncratic in nature.
• Five variables were removed , and the test
re-done to result in improved ratios.
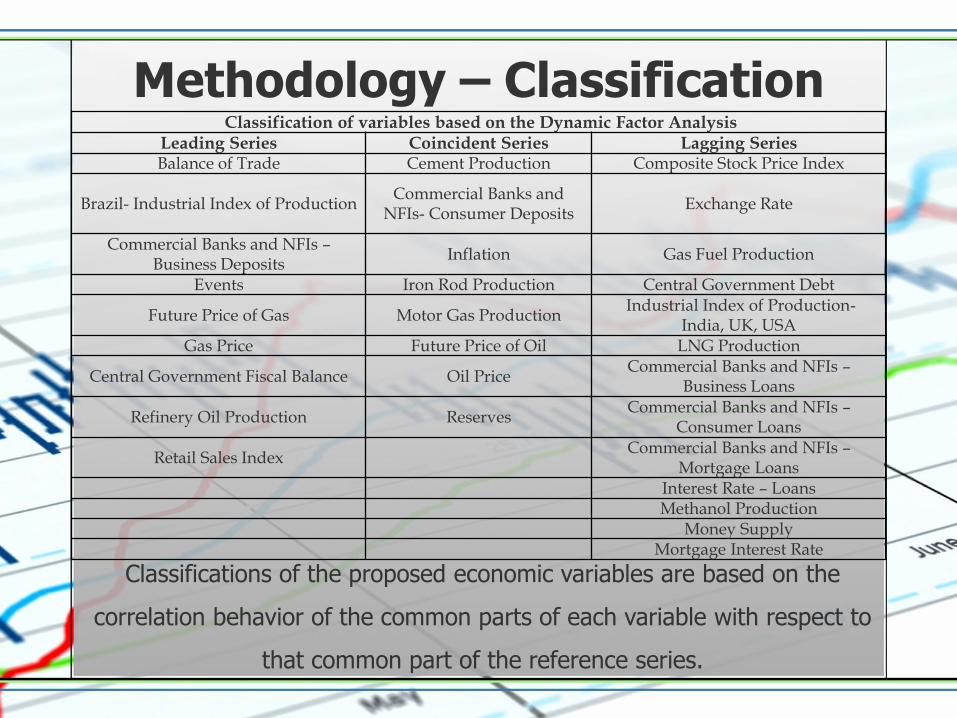
Classifications of the proposed economic variables are based on the
correlation behavior of the common parts of each variable with respect to
that common part of the reference series.
Methodology – Classification Classification of variables based on the Dynamic Factor Analysis
Leading Series Coincident Series Lagging Series
Balance of Trade Cement Production Composite Stock Price Index
Brazil- Industrial Index of Production Commercial Banks and
NFIs- Consumer Deposits Exchange Rate
Commercial Banks and NFIs – Business Deposits
Inflation Gas Fuel Production
Events Iron Rod Production Central Government Debt
Future Price of Gas Motor Gas Production Industrial Index of Production-
India, UK, USA
Gas Price Future Price of Oil LNG Production
Central Government Fiscal Balance Oil Price Commercial Banks and NFIs –
Business Loans
Refinery Oil Production Reserves Commercial Banks and NFIs –
Consumer Loans
Retail Sales Index Commercial Banks and NFIs –
Mortgage Loans
Interest Rate – Loans
Methanol Production
Money Supply
Mortgage Interest Rate
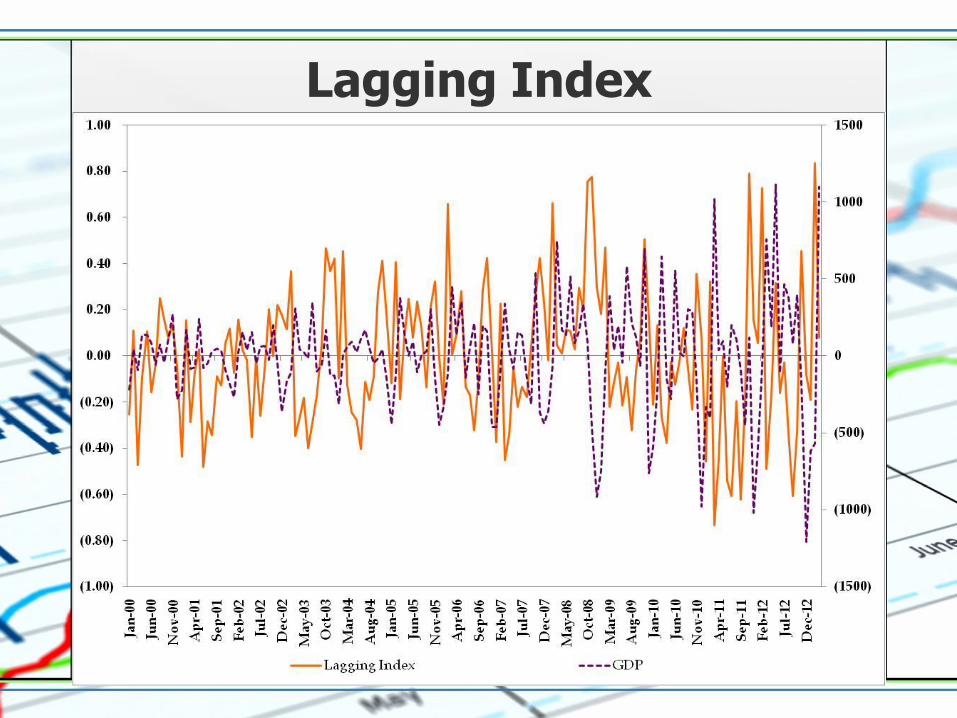
Lagging Index

Coincident Index
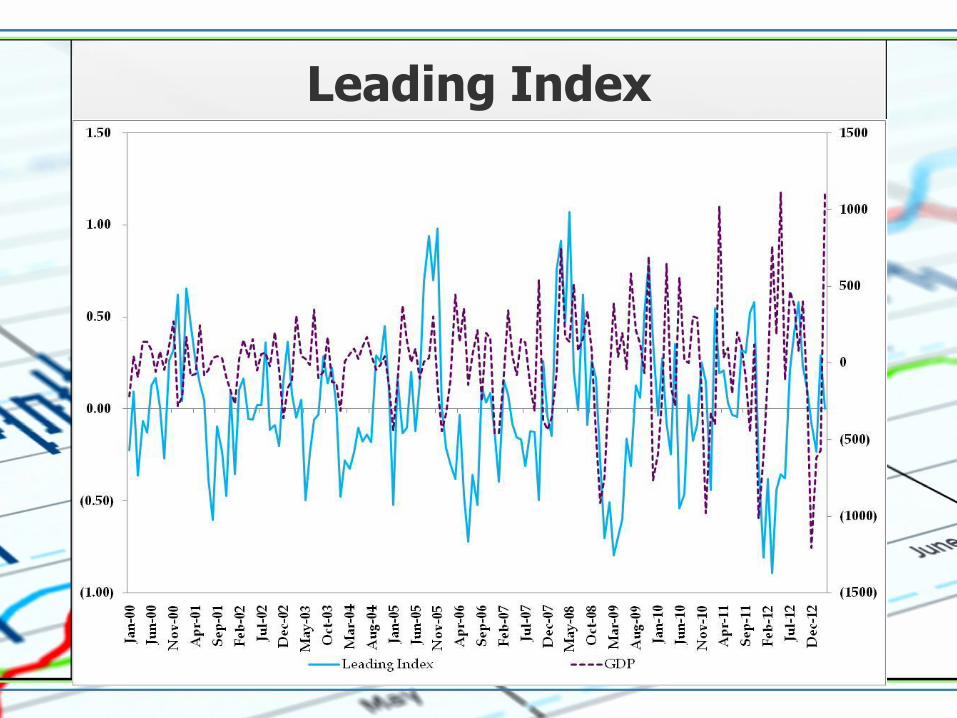
Leading Index
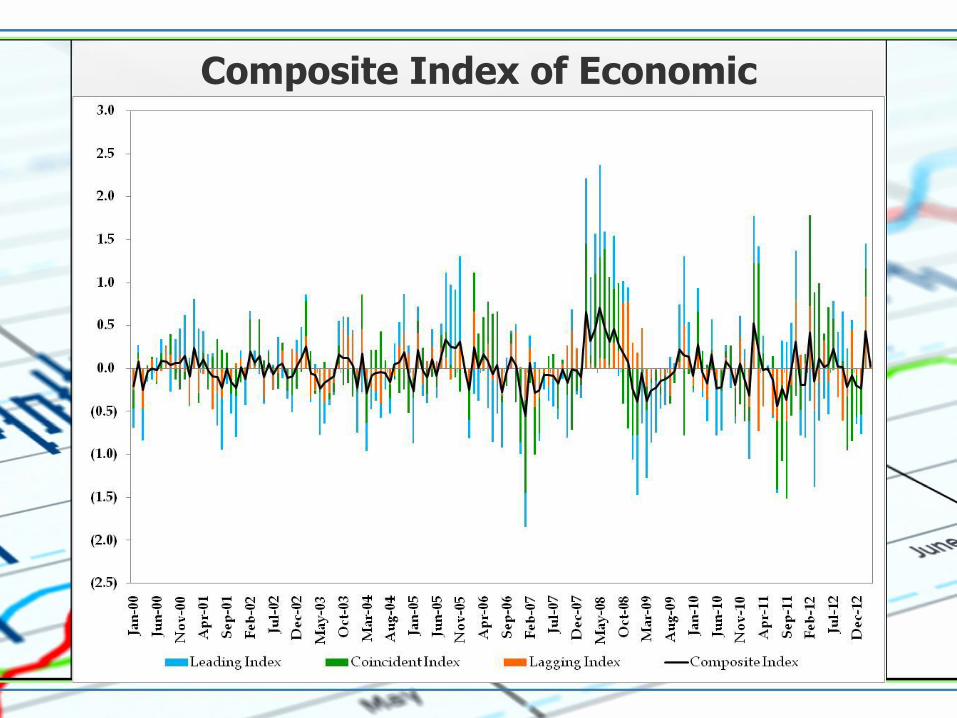
Composite Index of Economic Performance for Trinidad and Tobago

Composite Index
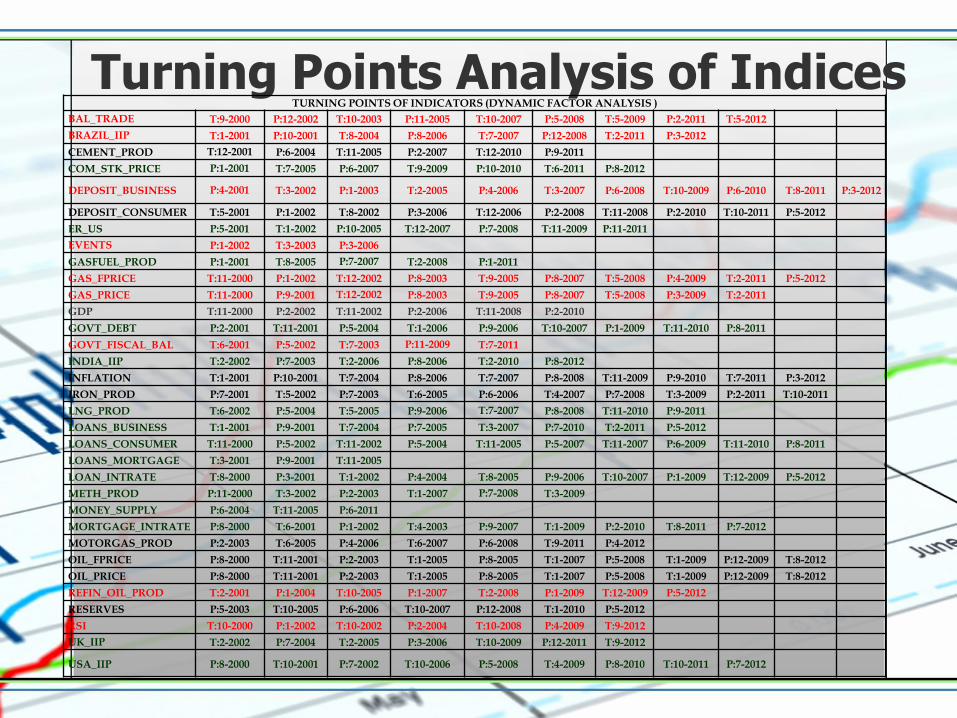
Turning Points Analysis of Indices TURNING POINTS OF INDICATORS (DYNAMIC FACTOR ANALYSIS )
BAL_TRADE T:9-2000 P:12-2002 T:10-2003 P:11-2005 T:10-2007 P:5-2008 T:5-2009 P:2-2011 T:5-2012
BRAZIL_IIP T:1-2001 P:10-2001 T:8-2004 P:8-2006 T:7-2007 P:12-2008 T:2-2011 P:3-2012
CEMENT_PROD T:12-2001 P:6-2004 T:11-2005 P:2-2007 T:12-2010 P:9-2011
COM_STK_PRICE P:1-2001 T:7-2005 P:6-2007 T:9-2009 P:10-2010 T:6-2011 P:8-2012
DEPOSIT_BUSINESS P:4-2001 T:3-2002 P:1-2003 T:2-2005 P:4-2006 T:3-2007 P:6-2008 T:10-2009 P:6-2010 T:8-2011 P:3-2012
DEPOSIT_CONSUMER T:5-2001 P:1-2002 T:8-2002 P:3-2006 T:12-2006 P:2-2008 T:11-2008 P:2-2010 T:10-2011 P:5-2012
ER_US P:5-2001 T:1-2002 P:10-2005 T:12-2007 P:7-2008 T:11-2009 P:11-2011
EVENTS P:1-2002 T:3-2003 P:3-2006
GASFUEL_PROD P:1-2001 T:8-2005 P:7-2007 T:2-2008 P:1-2011
GAS_FPRICE T:11-2000 P:1-2002 T:12-2002 P:8-2003 T:9-2005 P:8-2007 T:5-2008 P:4-2009 T:2-2011 P:5-2012
GAS_PRICE T:11-2000 P:9-2001 T:12-2002 P:8-2003 T:9-2005 P:8-2007 T:5-2008 P:3-2009 T:2-2011
GDP T:11-2000 P:2-2002 T:11-2002 P:2-2006 T:11-2008 P:2-2010
GOVT_DEBT P:2-2001 T:11-2001 P:5-2004 T:1-2006 P:9-2006 T:10-2007 P:1-2009 T:11-2010 P:8-2011
GOVT_FISCAL_BAL T:6-2001 P:5-2002 T:7-2003 P:11-2009 T:7-2011
INDIA_IIP T:2-2002 P:7-2003 T:2-2006 P:8-2006 T:2-2010 P:8-2012
INFLATION T:1-2001 P:10-2001 T:7-2004 P:8-2006 T:7-2007 P:8-2008 T:11-2009 P:9-2010 T:7-2011 P:3-2012
IRON_PROD P:7-2001 T:5-2002 P:7-2003 T:6-2005 P:6-2006 T:4-2007 P:7-2008 T:3-2009 P:2-2011 T:10-2011
LNG_PROD T:6-2002 P:5-2004 T:5-2005 P:9-2006 T:7-2007 P:8-2008 T:11-2010 P:9-2011
LOANS_BUSINESS T:1-2001 P:9-2001 T:7-2004 P:7-2005 T:3-2007 P:7-2010 T:2-2011 P:5-2012
LOANS_CONSUMER T:11-2000 P:5-2002 T:11-2002 P:5-2004 T:11-2005 P:5-2007 T:11-2007 P:6-2009 T:11-2010 P:8-2011
LOANS_MORTGAGE T:3-2001 P:9-2001 T:11-2005
LOAN_INTRATE T:8-2000 P:3-2001 T:1-2002 P:4-2004 T:8-2005 P:9-2006 T:10-2007 P:1-2009 T:12-2009 P:5-2012
METH_PROD P:11-2000 T:3-2002 P:2-2003 T:1-2007 P:7-2008 T:3-2009
MONEY_SUPPLY P:6-2004 T:11-2005 P:6-2011
MORTGAGE_INTRATE P:8-2000 T:6-2001 P:1-2002 T:4-2003 P:9-2007 T:1-2009 P:2-2010 T:8-2011 P:7-2012
MOTORGAS_PROD P:2-2003 T:6-2005 P:4-2006 T:6-2007 P:6-2008 T:9-2011 P:4-2012
OIL_FPRICE P:8-2000 T:11-2001 P:2-2003 T:1-2005 P:8-2005 T:1-2007 P:5-2008 T:1-2009 P:12-2009 T:8-2012
OIL_PRICE P:8-2000 T:11-2001 P:2-2003 T:1-2005 P:8-2005 T:1-2007 P:5-2008 T:1-2009 P:12-2009 T:8-2012
REFIN_OIL_PROD T:2-2001 P:1-2004 T:10-2005 P:1-2007 T:2-2008 P:1-2009 T:12-2009 P:5-2012
RESERVES P:5-2003 T:10-2005 P:6-2006 T:10-2007 P:12-2008 T:1-2010 P:5-2012
RSI T:10-2000 P:1-2002 T:10-2002 P:2-2004 T:10-2008 P:4-2009 T:9-2012
UK_IIP T:2-2002 P:7-2004 T:2-2005 P:3-2006 T:10-2009 P:12-2011 T:9-2012
USA_IIP P:8-2000 T:10-2001 P:7-2002 T:10-2006 P:5-2008 T:4-2009 P:8-2010 T:10-2011 P:7-2012

Out-of Sample Forecast
Conclusions
• We have demonstrated that a high frequency CI based on readily available data can provide accurate up to date information on current aggregate economic performance.
•To date the composite index that we have for Trinidad and Tobago can satisfy two of the three proposed criterion, it is reliable and consistent.

Conclusions cont’d •The preliminary forecast of GDP and the composite index signal a downturn in the economy of Trinidad and Tobago for the first three months of 2013.
• However it is not econometrically significant so it is not yet useful to make accurate predictions for economic activity for Trinidad and Tobago.
Craigwell (2010), “… even it is impossible to utilise these
indices to calculate with precision the influences of the
many economic variables, they contribute nevertheless
to the elaboration of the estimates of the future growth
of the real economy.”

Further Work
•To get generate a composite index that is more stable to within stand the econometric analysis. •Variables to be added are
1. Number of companies registered
2. Number of building permits granted.
3. Tourism measure
•Compute CIs for the rest of the Caribbean economies.

Thank You for your attention.