component-level measurement of molded freeform optics - an
TRANSCRIPT

Component-level Measurement of Molded Freeform Optics an E Concept
G. Gutierrez1, D. Hilbig1, T. Henning1, F. Fleischmann1 1 City University of Applied Sciences Bremen, Bremen, Germany,
Abstract: The concept of component-level performance characterization of optical elements is introduced as an
denominates an assembly of components, usually provided by different suppliers. Quality of such a product will be predicted by modelling according to measured properties of real components. This is demonstrated on manufacturing of marine signal lights, composed of LED source, secondary optical element (SOE), housing and electronics. Molded freeform SOE suffer from irregularities on surface, but also from internal properties like local differences in refractive index. By determining SOE´s angle mapping function, we derive a performance prediction of the signal light. Experimental results clearly show a good correlation between model predictions and signal light´s behavior.
Key words: metrology, freeform, molded optics, experimental ray tracing
Introduction The increased use of LED light sources has risen the demand of beamforming secondary optical elements (SOE) to alter LEDS´s radiation pattern according to the application requirements. Especially for signal lights and hazard beacons, standards regulate tight limits. Beam-shaping optics for LEDs is a major application field for molded optics. SOE are made of a combination of several freeform surfaces suffering from irregularities on the lens surface like pores, glass indentations or scratches that affects quality, but also differences in refractive index due to the cooling stage during fabrication process [1]. Up to now, their correct functionality is verified at system level by determining the resulting light intensity after packaging the optic with light source and fixture. However, the correct functionality of the individual optical component is usually not verified and in a fail case, the actual error source cannot be identified. Furthermore, post production verification wastes resources and precludes optimization by selecting appropriate component combinations.
For this reason, a new optical measurement method based on experimental ray tracing (ERT) is introduced which enables nondestructive performance testing at component level. Combined with measured LED intensity distribution, performance of a specific SOE LED configuration is evaluated.
Methodology Instead of verifying the integrity of the SOE by a series of individual surface topography measurements, we propose to test the optic for its transmission behavior. This ensures full verification of its performance by a single measurement and is suited to identify the optic as the error source in a fail case. The method we propose is a variation of the experimental ray tracing (ERT), which belongs to the group of gradient based measurement techniques for optical inspection. Once introduced by Häusler and Schneider [2] as a modification of the Hartmann test, ERT has recently evolved into a proven method for characterization of various lens types including progressive addition lenses [3] and aspherical lenses with respect to diverse optical performance parameters [4] as well as surface shape [5]. Its principle is strongly rooted in Geometrical Optics and relies on refraction and scattering of light rays incident to the lens under test (LUT) due to its inherent physical properties. This variation of the ERT-method determines the angle mapping function
= f( ), which represents the angle of the deflected ray behind the LUT as a function of the angle of the incident ray. As illustrated in Fig. 1, the incident ray is stationary, whereas the LUT will be rotated around a fixed point S. This establishes an artificial point source in the device coordinates system (x z centered at the rotation point, where all rays emerge from the origin. Placement of the lens with respect to
AMA Conferences 2017 – SENSOR 2017 and IRS2 2017 686
DOI 10.5162/sensor2017/P4.10
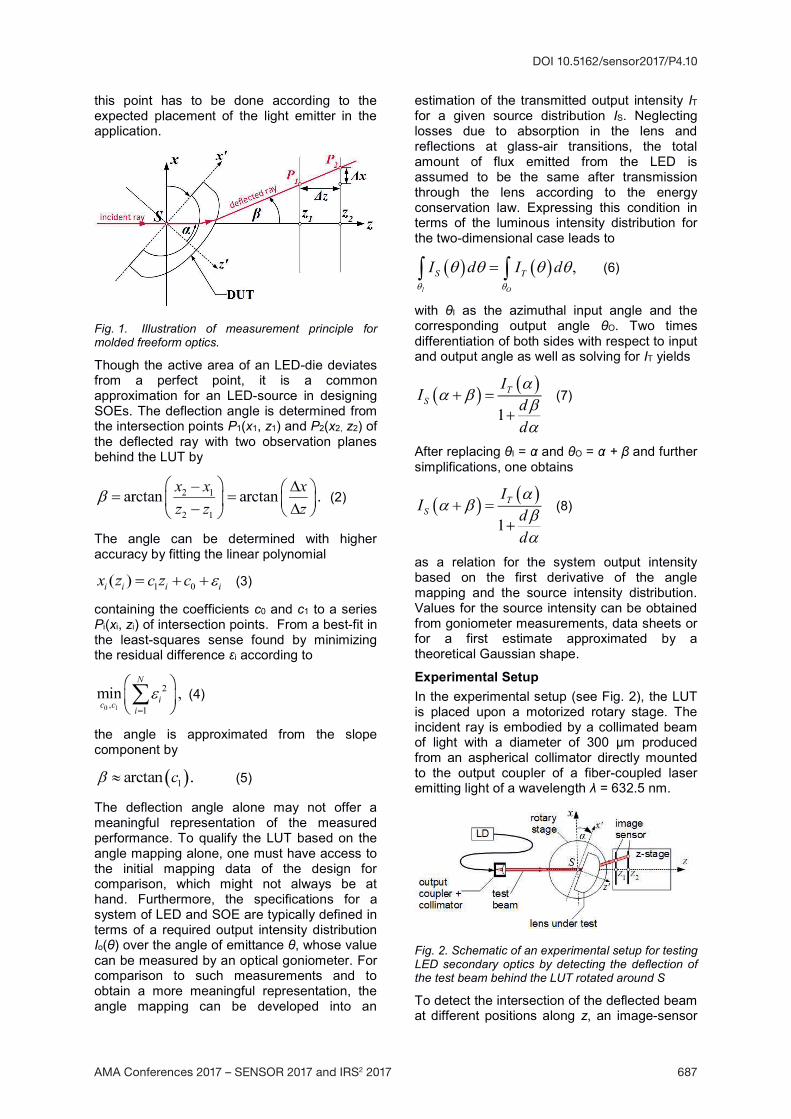
this point has to be done according to the expected placement of the light emitter in the application.
Fig. 1. Illustration of measurement principle for molded freeform optics.
Though the active area of an LED-die deviates from a perfect point, it is a common approximation for an LED-source in designing SOEs. The deflection angle is determined from the intersection points P1(x1, z1) and P2(x2, z2) of the deflected ray with two observation planes behind the LUT by
(2)
The angle can be determined with higher accuracy by fitting the linear polynomial
(3)
containing the coefficients c0 and c1 to a series Pi(xi, zi) of intersection points. From a best-fit in the least-squares sense found by minimizing the residual difference i according to
(4)
the angle is approximated from the slope component by
(5)
The deflection angle alone may not offer a meaningful representation of the measured performance. To qualify the LUT based on the angle mapping alone, one must have access to the initial mapping data of the design for comparison, which might not always be at hand. Furthermore, the specifications for a system of LED and SOE are typically defined in terms of a required output intensity distribution Io( ) over the angle of emittance , whose value can be measured by an optical goniometer. For comparison to such measurements and to obtain a more meaningful representation, the angle mapping can be developed into an
estimation of the transmitted output intensity IT for a given source distribution IS. Neglecting losses due to absorption in the lens and reflections at glass-air transitions, the total amount of flux emitted from the LED is assumed to be the same after transmission through the lens according to the energy conservation law. Expressing this condition in terms of the luminous intensity distribution for the two-dimensional case leads to
(6)
with I as the azimuthal input angle and the corresponding output angle O. Two times differentiation of both sides with respect to input and output angle as well as solving for IT yields
(7)
After replacing I = and O = and further simplifications, one obtains
(8)
as a relation for the system output intensity based on the first derivative of the angle mapping and the source intensity distribution. Values for the source intensity can be obtained from goniometer measurements, data sheets or for a first estimate approximated by a theoretical Gaussian shape.
Experimental Setup In the experimental setup (see Fig. 2), the LUT is placed upon a motorized rotary stage. The incident ray is embodied by a collimated beam of light with a diameter of 300 µm produced from an aspherical collimator directly mounted to the output coupler of a fiber-coupled laser emitting light of a wavelength = 632.5 nm.
Fig. 2. Schematic of an experimental setup for testing LED secondary optics by detecting the deflection of the test beam behind the LUT rotated around S
To detect the intersection of the deflected beam at different positions along z, an image-sensor
AMA Conferences 2017 – SENSOR 2017 and IRS2 2017 687
DOI 10.5162/sensor2017/P4.10

with a resolution of 1312 x 1082 pixel is mounted on a motorized linear stage. Output coupler and the LUT are mounted on additional manual precision stages to enable proper alignment between the components. Great care is taken to ensure that the system is aligned so that the incident beam passes the point of rotation of the rotary axes and intersects the center of the image sensor in line with the translation direction of the z-stage. The coordinates xc, yc of the intersection points of the beam with the image sensor are gathered from centroid calculations on the recorded images using
(9)
where I(x,y) is the intensity in the image at coordinate (x,y). In the automated measurement procedure, the LUT is scanned along the whole azimuthal angle for each fixed position zi of the camera.
Results For experimental verification, we demonstrate measurements of a freeform LED secondary optic manufactured from acrylic glass (PMMA) by injection molding as shown in Fig. 3.
Fig. 3. Image (a) and dimensions (b) of a sample molded freeform optic for marine application fabricated from PMMA.
The lens was designed as part of an LED based stern light for marine vessels, which is supposed to replace less efficient traditional filaments.
Fig.4. Requirements on luminous intensity distribution for marine stern lights according to international naval regulations (COLREGs).
In accordance to international regulations [6], the emitted intensity distribution of stern lights is bound to be within a tight corridor as illustrated by the red area in Fig. 4. This dictates a mostly even distribution over an emission angle of ±67.5° followed by an immediate decline. Therefore, an appropriate lens design must be able to collimate the light along the vertical direction and distribute it homogeneously over the azimuthal plane. For the lens in Fig. 3., collimation in the y z -plane is achieved by a combination of refraction and total internal reflection. The aspherical back surface in combination with the convex front surface produces a homogenization along the azimuthal orientation (x'z'-plane). Inspection of the lens by surface measurement tools as profilometers is impossible due to its small dimensions and steep surface slopes, a problem found to be with most other SOEs on the market.
Fig. 5. Mean value of the angle mapping from 50 repeated measurements with a mean std. dev. of 0.066° in comparison to the design.
A series of 50 repeated measurements were conducted to demonstrate the repeatability of the system yielding a mean standard deviation of 0.066°. Fig.5. shows the mean value of the series for = f( ) in comparison to an angle mapping according to the design. The general trend of the measurement curve is identical but the graph shows distinct overall deviations from the design, clearly indicating that the optical performance of the lens under test is not as intended and the resulting output profile might be out of the specifications.
Fig. 6. Emission pattern of a red and white Luxeon Rebel high power LED from goniometer measurement and datasheet.
As discussed above, a source intensity distribution must be given to generate an
AMA Conferences 2017 – SENSOR 2017 and IRS2 2017 688
DOI 10.5162/sensor2017/P4.10

estimate for the total system output intensity. Fig.6 shows goniometer measurements and data sheet values of a red and a white light Luxeon Rebel high power LED. In case of the red LED, the pattern of the measured diode fits closely to the specifications of the manufacturer. However, the sample of the white LED shows clear deviation from the specifications. Using eq. (8) on the perfect angle mapping of the design in Fig. 5 to generate the intensity output for the four source distributions stated above demonstrates that, even for the case of a perfect lens, the system output will be outside of the specification of the application as can be seen in the example of the measured white LED plotted in Fig.7. At the negative edge of the emission range, the resulting intensity falls below the limit given by the corridor. This clearly demonstrates the dependency of the system performance on the chosen sample LED.
Fig. 7. Estimate of the system output intensity profile based on different LED source distribution in case of the design lens.
An LED of the same type produced closer to the datasheet would have sufficed. The intensity overshoot that leaves the corridor at the edges beyond ±67.5° are of no further concern, as these areas will be covered by the housing of the luminaire.
Fig. 8 Estimate of the system output intensity profile based on different LED source distribution in case of the measured SOE.
Replacing the design lens by the angle mapping of the measured lens draws a more severe plot as shown in Fig. 8. All source distributions, including those from the datasheet, lead to a system output of insufficient intensity for angles beyond 30° and below -45°. With this lens, the system will not perform sufficiently and flaws in the fabrication of the SOE are the source of a system fail.
Conclusion Secondary optical elements (SOE) differ in optical performance due to individual production process influences. Measured intensity distribution of real LED sources also show deviations from datasheet curves. If products have to comply with strong regulations, like safety relevant signal lights, maintaining these requirements in volume production is a challenging task, since impact of these effects may degrade product performance intolerable.
We presented a method of characterizing the optical performance of both components individually. By combining these characteristics according to the model of assembly, performance of integrated signal light is predicted. Measurements are in good agreement with these simulations. Using this method and those component specific characteristics in volume manufacturing, this will not only allow simple performance evaluation, but also to increase yield by combining best pairs of components. In future work, flexible mounting processes will further improve production quality by optimizing alignment of the components.
Acknowledgments This work was supported by German Federal Ministry of Education and Research, BMBF-IngenieurNachwuchs, FKZ: 03FH023lX5.
References [1] Vu A, Kreilkamp H, Dambon O, Klocke F,
Nonisothermal glass molding for the cost-efficient production of precision freeform optics. OE.55.7.071207 (2016); doi: 10.1117/1
[2] Häusler, G. and Schneider, G., Experimental ray tracing with a lateral effect photodiode, Appl. Opt., 27, 5160-5164 (1988).; doi: 10.1364/AO.27.005160
[3] G. Gutierrez, D. Hilbig, F. Fleischmann, T. Henning, Locally resolved characterization of progressive addition lenses by calculation of the modulation transfer function using experimental ray tracing, Proc. SPIE 10110, 10110E (2017); doi: 10.1117/12.2251992
[4] T. Binkele, D. Hilbig, F. Fleischmann, T. Henning, Determination of the paraxial focal length of strong focusing lenses using Zernike polynomials
AMA Conferences 2017 – SENSOR 2017 and IRS2 2017 689
DOI 10.5162/sensor2017/P4.10

in simulation and measurement, Proc. SPIE 9960, 99600N (2016); doi: 10.1117/12.2238059
[5] U. Ceyhan, T. Henning, F. Fleischmann, D. Hilbig, D. Knipp, Measurements of aberrations of aspherical lenses using experimental ray tracing, Proc. SPIE 8082, 80821K (2011); doi: 10.1117/12.895009
[6] International regulations for preventing collision at sea 1972 (COLREGs), International Maritime Organization (IMO) (1972)
AMA Conferences 2017 – SENSOR 2017 and IRS2 2017 690
DOI 10.5162/sensor2017/P4.10