complexity-augmented triage: a tool for improving patient ... · using a combination of analytic...
TRANSCRIPT

This article was downloaded by: [129.219.247.33] On: 16 August 2014, At: 09:39Publisher: Institute for Operations Research and the Management Sciences (INFORMS)INFORMS is located in Maryland, USA
Manufacturing & Service Operations Management
Publication details, including instructions for authors and subscription information:http://pubsonline.informs.org
Complexity-Augmented Triage: A Tool for ImprovingPatient Safety and Operational EfficiencySoroush Saghafian, Wallace J. Hopp, Mark P. Van Oyen, Jeffrey S. Desmond, Steven L.Kronick
To cite this article:Soroush Saghafian, Wallace J. Hopp, Mark P. Van Oyen, Jeffrey S. Desmond, Steven L. Kronick (2014) Complexity-AugmentedTriage: A Tool for Improving Patient Safety and Operational Efficiency. Manufacturing & Service Operations Management16(3):329-345. http://dx.doi.org/10.1287/msom.2014.0487
Full terms and conditions of use: http://pubsonline.informs.org/page/terms-and-conditions
This article may be used only for the purposes of research, teaching, and/or private study. Commercial useor systematic downloading (by robots or other automatic processes) is prohibited without explicit Publisherapproval, unless otherwise noted. For more information, contact [email protected].
The Publisher does not warrant or guarantee the article’s accuracy, completeness, merchantability, fitnessfor a particular purpose, or non-infringement. Descriptions of, or references to, products or publications, orinclusion of an advertisement in this article, neither constitutes nor implies a guarantee, endorsement, orsupport of claims made of that product, publication, or service.
Copyright © 2014, INFORMS
Please scroll down for article—it is on subsequent pages
INFORMS is the largest professional society in the world for professionals in the fields of operations research, managementscience, and analytics.For more information on INFORMS, its publications, membership, or meetings visit http://www.informs.org

MANUFACTURING & SERVICEOPERATIONS MANAGEMENT
Vol. 16, No. 3, Summer 2014, pp. 329–345ISSN 1523-4614 (print) � ISSN 1526-5498 (online) http://dx.doi.org/10.1287/msom.2014.0487
© 2014 INFORMS
Complexity-Augmented Triage: A Tool for ImprovingPatient Safety and Operational Efficiency
Soroush SaghafianIndustrial Engineering, School of Computing, Informatics and Decision Systems Engineering,
Arizona State University, Tempe, Arizona 85281, [email protected]
Wallace J. HoppRoss School of Business, University of Michigan, Ann Arbor, Michigan 48109, [email protected]
Mark P. Van OyenDepartment of Industrial and Operations Engineering, University of Michigan, Ann Arbor, Michigan 48109,
Jeffrey S. Desmond, Steven L. KronickDepartment of Emergency Medicine, University of Michigan Health System, Ann Arbor, Michigan 48109
{[email protected], [email protected]}
Hospital emergency departments (EDs) typically use triage systems that classify and prioritize patients almostexclusively in terms of their need for timely care. Using a combination of analytic and simulation models, we
demonstrate that adding an up-front estimate of patient complexity to conventional urgency-based classificationcan substantially improve both patient safety (by reducing the risk of adverse events) and operational efficiency(by shortening the average length of stay). Moreover, we find that EDs with high resource (physician and/orexamination room) utilization, high heterogeneity in the treatment time between simple and complex patients, anda relatively equal number of simple and complex patients benefit most from complexity-augmented triage. Finally,we find that (1) although misclassification of a complex patient as simple is slightly more harmful than vice versa,complexity-augmented triage is relatively robust to misclassification error rates as high as 25%; (2) streamingpatients based on complexity information and prioritizing them based on urgency is better than doing the reverse;and (3) separating simple and complex patients via streaming facilitates the application of lean methods that canfurther amplify the benefit of complexity-augmented triage.
Keywords : healthcare operations; emergency department; triage; priority queues; patient prioritization; Markovdecision processes
History : Received: October 30, 2012; accepted: January 30, 2014. Published online in Articles in Advance May 9, 2014.
1. IntroductionTriage (a word derived from the French verb “trier,”meaning “to sort”) refers to the process of sorting andprioritizing patients for care. FitzGerald et al. (2010,p. 80) noted that there are two main purposes for triage:“[1] to ensure that the patient receives the level andquality of care appropriate to clinical need (clinicaljustice), and [2] that departmental resources are mostusefully applied (efficiency) to this end.” (See Moskopand Ierson 2007 for further discussion of the underlyingprinciples and goals of triage.)
Most triage systems used around the world consideronly urgency and so only address the clinical justicepurpose of triage. For instance, the Australasian TriageScale (ATS), the Manchester Triage Scale (MTS), andthe Canadian Triage Acuity Scale (CTAS) differ in theirdetails, but all classify patients strictly in terms ofurgency. In the United States, many hospital emergencydepartments (EDs) continue to use a traditional urgency-
based three-level triage scale, which categorizes patientsinto emergent, urgent, and nonurgent classes. But agrowing majority of U.S. hospitals have adopted five-level triage systems (see Fernandes et al. 2005), whichseek to address efficiency by incorporating an estimateof resources (e.g., tests) required. In these systems (atypical version of which is illustrated in Figure 1(a)),urgent patients who cannot wait are classified as level 1or 2, whereas nonurgent patients who can wait areclassified as level 3, 4, or 5. Level 4 and level 5 patientsare usually directed to a fast track (FT) area, whereaslevel 1 patients are almost always moved immediatelyto a resuscitation unit (RU). Level 2 and level 3 patients,who represent the majority of patients at large academichospitals (about 80% at the University of MichiganHealth System ED (UMHSED)), are served in the mainarea of the ED with priority given to level 2 patients.Since five-level systems do not differentiate betweenlevel 2 and level 3 patients in terms of complexity,
329
Dow
nloa
ded
from
info
rms.
org
by [
129.
219.
247.
33]
on 1
6 A
ugus
t 201
4, a
t 09:
39 .
For
pers
onal
use
onl
y, a
ll ri
ghts
res
erve
d.

Saghafian et al.: Complexity-Augmented Triage330 Manufacturing & Service Operations Management 16(3), pp. 329–345, © 2014 INFORMS
Figure 1 (a) Typical Five-Level Triage System (see, e.g., Gilboy et al. 2005); (b) Proposed Complexity-Augmented Triage System
Patient dying?(a) (b)
Patient cannot wait?
How many resources?
None One Many
1
2
5 4 3
Patient dying? RU
Patient cannot wait?
How many resources?
Limited Many
FT No. of interactions?
1 > 1
NC
UC
YN
N
Y
N
Y
Y
No. of interactions?
1 >1
NS
US
FT
RU
N
Note. RU, resuscitation unit; FT, fast track; NS, nonurgent simple; NC, nonurgent complex; US, urgent simple; UC, urgent complex.
patients in the main ED (about 80% of patients) are stillsorted and prioritized purely on the basis of urgency.Hence, although five-level triage systems represent animprovement over traditional three-level triage scales,they remain urgency-based systems for the majority ofpatients.
In this paper, we propose an augmented triagesystem, which we term complexity-augmented triage, thatcan significantly improve performance of the main EDwith respect to both clinical justice and efficiency. Thisposes two challenges: (a) deciding what informationto collect at triage, and (b) determining how to usethe information to improve performance. There aretwo main choices for the latter: prioritization andstreaming. But they can be combined by using someinformation to separate patients into streams and someother information to prioritize them within the streams.This poses an additional question: what information touse to stream patients and what information to use toprioritize them?
Prioritization and streaming are not new. All EDsprioritize patients according to urgency. Many largeEDs stream low acuity patients into fast tracks. Butin recent years new types of streaming have receivedattention from both practitioners and researchers (seeBen-Tovim et al. 2008 and Saghafian et al. 2012). Partic-ularly relevant to this paper is our previous work inSaghafian et al. (2012), which showed that EDs canimprove performance by having triage nurses predictthe final disposition (admit or discharge) of patientsand using this information in a “virtual streaming”patient flow design. That study showed that assigning
patients to separate admit and discharge streams canreduce average time to first treatment for admit patientsand average length of stay for discharge patients. Butit also indicated that the performance of the streamingpolicy improves as the difference between the aver-age treatment times of admit and discharge patientsbecomes larger. Since complexity is a better proxy fortreatment time than is disposition, this suggests thatclassifying patients according to complexity may beeven more useful than classifying them according todisposition.
Referring to procedures, investigations, or consulta-tions as “interactions,” we propose the new complexity-augmented triage process depicted in Figure 1(b).Unlike a conventional five-level system that makesno complexity distinction among the levels 2 and 3patients that make up the majority of ED patients, ourproposed system systematically classifies them in termsof complexity. The additional step required in triage(i.e., predicting whether the patient will need two ormore interactions) can be performed in seconds, andhence, does not add any significant amount of time totriage. However, it is unclear how much this additionalinformation can improve the ED performance in termsof risk of adverse events (clinical justice) and averagelength of stay (efficiency), since it is subject to misclas-sification errors. To clarify this and related issues, wemake use of a combination of analytic and simulationmodels calibrated with hospital data to address thefollowing:
1. Prioritization: How should EDs use complexity-augmented triage information to prioritize patients?
Dow
nloa
ded
from
info
rms.
org
by [
129.
219.
247.
33]
on 1
6 A
ugus
t 201
4, a
t 09:
39 .
For
pers
onal
use
onl
y, a
ll ri
ghts
res
erve
d.

Saghafian et al.: Complexity-Augmented TriageManufacturing & Service Operations Management 16(3), pp. 329–345, © 2014 INFORMS 331
2. Magnitude: How much benefit does complexity-augmented triage (which adds complexity informationto conventional urgency evaluations) offer relative tourgency-based triage?
3. Sensitivity: How sensitive are the benefits ofcomplexity-augmented triage to misclassification errorsand other characteristics that may vary across EDs?
4. (Patient Flow) Design: Is complexity informationmore effective if used to prioritize patients or to sepa-rate patients into streams?
The main contribution of this paper is to provideinsights of value to ED managers by addressing theabove questions. However, the above questions alsorequire addressing some technical challenges: (1) In theED, upfront triage misclassifications are inevitable. Weincorporate misclassifications through a linear trans-formation of control indices so that they represent“error-impacted” rates, which use only informationfrom historical data. This leads to a modified version ofthe well-known c� rule for the case with customer mis-classification (in which control indices are replaced withtheir linearly transformed “error-impacted” counter-parts). Furthermore, although these results are obtainedby modeling the occurrence of adverse events as Pois-son processes, in Online Appendix C,1 we use samplepath arguments and appropriate notions of stochasticordering to demonstrate the robustness of the priorityrules under more general adverse event occurrenceprocesses. (2) To provide guidance for ED physicianson how to prioritize patients within the examinationrooms (when they have a choice of what patient to seenext), we develop a Markov decision process (MDP)model. A challenging feature of this model, which iscommon in many other health delivery settings, is thatpatients are sent for tests (e.g., MRI, CT scan, x-ray, etc.)and are unavailable to the physician during testing.In such a setting, the physician must consider both thecurrent and the future availability of the patients whenmaking decisions. This type of problem usually resultsin complex state-dependent optimal control policies.However, we show how a simple-to-implement rulethat relies only on historical data defines the optimalpolicy for ED physicians. (3) Because of unboundedtransition rates, the continuous MDP model of patientprioritization within examination rooms cannot use theconventional method of uniformization of Lippman(1975). We contribute by showing how one can use asequence of MDPs, each with bounded transition rates,to derive an optimal policy for the original MDP.
The remainder of this paper is organized as follows.Section 2 summarizes previous research relevant toour research questions. Section 3 describes our perfor-mance metrics and analytical modeling approach. Formodeling purposes, we divide the ED experience of the
1 The online appendices are available as supplemental material athttp://dx.doi.org/10.1287/msom.2014.0487.
patient into phase 1 (from arrival until assignment toan examination room) and phase 2 (from assignment toan examination room until discharge/admission to thehospital). Section 4 addresses phase 2 by developingand analyzing a Markov decision process model. Theresult of the phase 2 model is then used in §5, whichfocuses on phase 1 and develops analytical queueingmodels to compare performance under urgency-basedand complexity-augmented triage. Section 6 uses arealistic simulation model of the full ED calibrated withhospital data to validate the insights obtained throughour analytical models and to refine our estimates ofthe magnitude of performance improvement possiblewith complexity-augmented triage. Section 7 concludesthe paper.
2. Literature ReviewThe effect of assigning priorities in queueing systemshas been well studied in the operations research litera-ture. Analyzing a two-priority single-channel system,Cobham (1954, 1955) assumed perfect classificationand van der Zee and Theil (1961) solved the case ofimperfect classification. Under perfect classification, anaverage holding cost objective, Poisson arrivals, and anonpreemptive nonidling single server model, Cox andSmith (1961) showed that the c� rule is optimal amongpriority rules. Kakalik and Little (1971) extended thisresult to show that the c� rule remains optimal evenamong the larger class of state-dependent policies withor without the option of idling the server. The c� rulehas since been shown to be optimal in many otherqueueing frameworks; see, e.g., Buyukkoc et al. (1985),Van Mieghem (1995), Argon and Ziya (2009), Saghafianet al. (2011), and references therein.
For related studies that analyze patient flow in EDs,we refer to Siddharathan et al. (1996), Wang (2004),Huang et al. (2012), and the references therein. Peckand Kim (2010) developed a triage index system, thepark index, that accounts for both urgency and patientflow, and described its use in assigning patients to afast track. Peck et al. (2012) studied possible ways touse the information collected at triage to predict theadmission rate to the hospital and discussed how suchinformation can be used for improving bed manage-ment, patient flow, and discharge processes. Argonand Ziya (2009) used average waiting time as the per-formance metric in a general service system with twoclasses of customers, in which customer classificationis imperfect, and showed that prioritizing customersaccording to the probability of being from the classthat should have a higher priority when classificationis perfect outperforms any finite-class priority policy.Dobson et al. (2013) developed a heavy-traffic modelwith an investigator and server interruptions to studyphysician choice in prioritizing patients.
Dow
nloa
ded
from
info
rms.
org
by [
129.
219.
247.
33]
on 1
6 A
ugus
t 201
4, a
t 09:
39 .
For
pers
onal
use
onl
y, a
ll ri
ghts
res
erve
d.
Saghafian et al.: Complexity-Augmented Triage332 Manufacturing & Service Operations Management 16(3), pp. 329–345, © 2014 INFORMS
In the medical literature, Gilboy et al. (2005),FitzGerald et al. (2010), and Ierson and Moskop (2007)provide excellent reviews of the history of the triageprocess and its development over time. Although triagehas been based mainly on urgency, the idea of consider-ing the complexity of patients goes back to World War Imass-casualty triage recommendations: “A single case,even if it urgently requires attention,—if this will absorba long time,—may have to wait, for in that same timea dozen others, almost equally exigent, but requiringless time, might be cared for. The greatest good of thegreatest number must be the rule.” (Keen 1917, p. 13).Anticipating the potential of complexity-augmentedtriage, Vance and Sprivulis (2005) empirically tested theability of nurses to estimate patient complexity at thetime of triage and found that they are able to do thisreliably. Vance and Sprivulis (2005) suggested that thistype of information could be used to improve patientflow in EDs, although they did not specify how. Finally,it is noteworthy that similar complexity informationis also used in mass-casualty triage settings (see, e.g.,Jacobson et al. 2012 and the references therein).
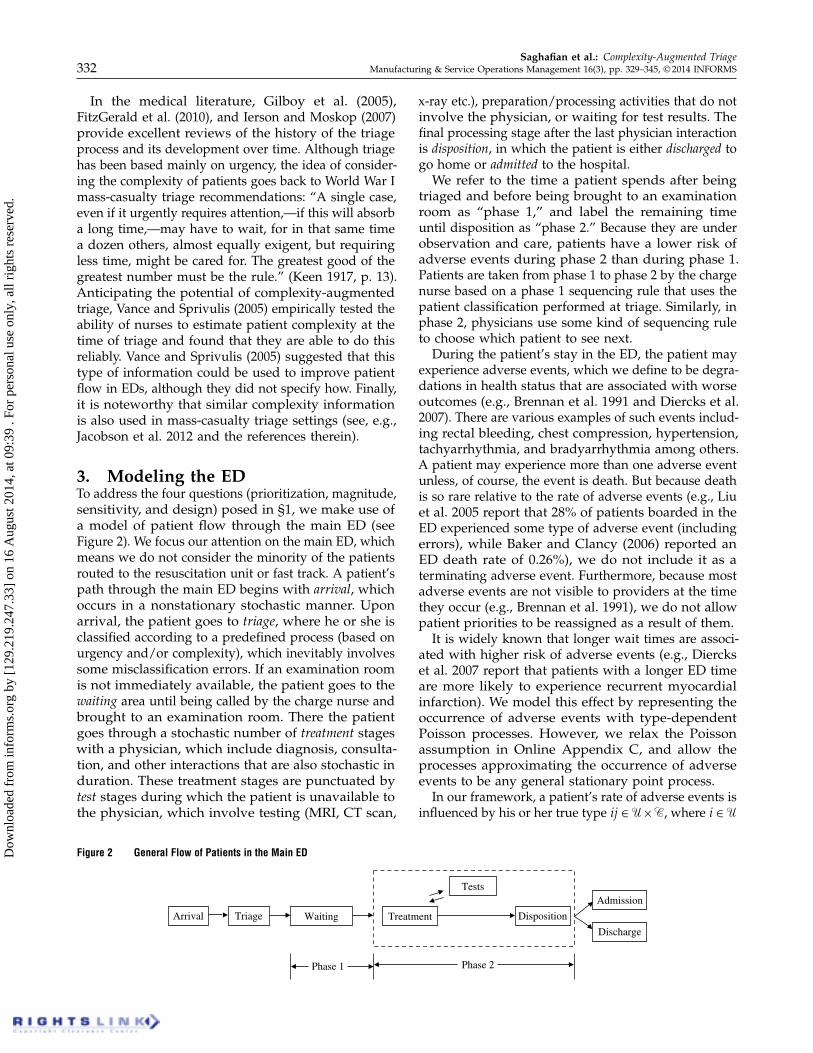
3. Modeling the EDTo address the four questions (prioritization, magnitude,sensitivity, and design) posed in §1, we make use ofa model of patient flow through the main ED (seeFigure 2). We focus our attention on the main ED, whichmeans we do not consider the minority of the patientsrouted to the resuscitation unit or fast track. A patient’spath through the main ED begins with arrival, whichoccurs in a nonstationary stochastic manner. Uponarrival, the patient goes to triage, where he or she isclassified according to a predefined process (based onurgency and/or complexity), which inevitably involvessome misclassification errors. If an examination roomis not immediately available, the patient goes to thewaiting area until being called by the charge nurse andbrought to an examination room. There the patientgoes through a stochastic number of treatment stageswith a physician, which include diagnosis, consulta-tion, and other interactions that are also stochastic induration. These treatment stages are punctuated bytest stages during which the patient is unavailable tothe physician, which involve testing (MRI, CT scan,
Figure 2 General Flow of Patients in the Main ED
Arrival Triage Treatment
Tests
DispositionWaiting
Phase 2Phase 1
Admission
Discharge
x-ray etc.), preparation/processing activities that do notinvolve the physician, or waiting for test results. Thefinal processing stage after the last physician interactionis disposition, in which the patient is either discharged togo home or admitted to the hospital.
We refer to the time a patient spends after beingtriaged and before being brought to an examinationroom as “phase 1,” and label the remaining timeuntil disposition as “phase 2.” Because they are underobservation and care, patients have a lower risk ofadverse events during phase 2 than during phase 1.Patients are taken from phase 1 to phase 2 by the chargenurse based on a phase 1 sequencing rule that uses thepatient classification performed at triage. Similarly, inphase 2, physicians use some kind of sequencing ruleto choose which patient to see next.
During the patient’s stay in the ED, the patient mayexperience adverse events, which we define to be degra-dations in health status that are associated with worseoutcomes (e.g., Brennan et al. 1991 and Diercks et al.2007). There are various examples of such events includ-ing rectal bleeding, chest compression, hypertension,tachyarrhythmia, and bradyarrhythmia among others.A patient may experience more than one adverse eventunless, of course, the event is death. But because deathis so rare relative to the rate of adverse events (e.g., Liuet al. 2005 report that 28% of patients boarded in theED experienced some type of adverse event (includingerrors), while Baker and Clancy (2006) reported anED death rate of 0.26%), we do not include it as aterminating adverse event. Furthermore, because mostadverse events are not visible to providers at the timethey occur (e.g., Brennan et al. 1991), we do not allowpatient priorities to be reassigned as a result of them.
It is widely known that longer wait times are associ-ated with higher risk of adverse events (e.g., Dierckset al. 2007 report that patients with a longer ED timeare more likely to experience recurrent myocardialinfarction). We model this effect by representing theoccurrence of adverse events with type-dependentPoisson processes. However, we relax the Poissonassumption in Online Appendix C, and allow theprocesses approximating the occurrence of adverseevents to be any general stationary point process.
In our framework, a patient’s rate of adverse events isinfluenced by his or her true type ij ∈U×C, where i ∈U
Dow
nloa
ded
from
info
rms.
org
by [
129.
219.
247.
33]
on 1
6 A
ugus
t 201
4, a
t 09:
39 .
For
pers
onal
use
onl
y, a
ll ri
ghts
res
erve
d.

Saghafian et al.: Complexity-Augmented TriageManufacturing & Service Operations Management 16(3), pp. 329–345, © 2014 INFORMS 333
is the patient’s urgency level, j ∈C is the patient’s com-plexity type, U= 8U (Urgent)1N (Nonurgent)9 and C=
8C(Complex)1S(Simple)9. Under urgency-based triagean estimate is made of i, whereas under complexity-augmented triage estimates are made of both i and j .
Since sequencing decisions in phase 1 may dependon patients’ ED service times (the time they spend inphase 2), they may be affected by phase 2 prioritization.Thus, we start by analyzing phase 2 and then use ourphase 2 results to justify a model with which to derivean optimal phase 1 sequencing rule. Finally, we testthe insights gained from our analytic models underrealistic conditions with a simulation model of the fullED calibrated with a year of data from the UMHSEDand time study data from the literature.
4. Phase 2: Sequencing PatientsWithin the ED
To model phase 2, we consider the multistage serviceprocess illustrated in Figure 3. We start by consideringthe system under the assumption of exogenous arrivalsto phase 2. This situation occurs in practice duringperiods when the ED has sufficient bed and physiciancapacity to allow patients to move directly into theexamination rooms without being held in the waitingroom. For tractability, we assume patients classified asij ∈U×C arrive according to a Poisson process withrate �′
ij . Note that we use the superscript prime symbol(“ ′ ”) throughout the paper to indicate error-impactedrates. Such rates can be directly estimated from arrivaldata after patients are classified, but we will alsoprovide in §§5.1 and 5.2 a way to calculate them usingthe raw arrival rates. We assume patients of type ijare subject to adverse events that occur accordingto a Poisson process. We denote the error-impactedintensity of adverse events in phase 2 by the vector�̂
′
= 4�̂′ij5ij∈U×C (which we expect to be less than that
in phase 1, denoted by �′, because of monitoring andtreatment patients receive in the examination rooms).As they enter examination rooms, patients are assignedto physicians who treat them, often with multiplevisits, until their discharge or admission to the hospital.Since an individual physician may be assigned toseveral patients, the physician often has a choice aboutwho to see next among his or her available patients.To construct a simplified analytic model, we aggregate
Figure 3 Patient Flow After a Patient Is Moved to an Examination Room/Bed (Phase 2 Sequencing)
Physician interaction
Disposition
Waiting in a room
Treatment
Tests�
1 – p�ij
p�ij
��ij��
ij∧
preparation time, test time, and waiting time for thetest results. Patients who have completed a test or testsordered by the physician, and have all of the associatedresults ready, are termed “available” for a physicianvisit, and patients being tested, prepared, or waitingfor results are labeled “unavailable.”
Letting Rì� 4t5 represent the counting process that tal-
lies the total number of adverse events (for all patients)until time t under patient classification (triage) policy ìand sequencing rule �, we define Rì
� = limt→� Rì� 4t5/t
(when the limit exists) as our metric and refer to it asthe rate of adverse events (ROAE). However, if �̂ij = 1for all i ∈ U and j ∈ C, then it can be shown thatRì
� /∑
i∈U
∑
j∈C �̂ij�ij =Rì� /∑
i∈U
∑
j∈C �ij reduces to aver-age length of stay (LOS). (Notice that the sample pathcosts of LOS and that of adverse events under unitrisk intensities divided by the total arrival rate will bedifferent, but they are equal in expectation.) Hence, thisobservation allows us to use our metric to characterizeperformance with respect to both safety and efficiency.
For tractability, we assume each interaction withpatients classified as ij takes an exponentially dis-tributed amount of time with rate �̂′
ij . We also assumethat the physician can preempt an interaction to see apatient of a different class. When a physician returns toa preempted interaction, we assume the physician mustrepeat the process (e.g., review vital signs, lab results,etc.), and so we assume a preempt-repeat protocol. Inpractice, emergency physicians can, and sometimesdo, preempt patients to deal with emergencies. Butfor fairness and efficiency reasons, they do this rarely.Hence, we test our conclusions under the assumptionof nonpreemption in phase 2 in §6 using simulation.After each completed interaction, a patient classified asij may be disposed (discharged home or admitted tothe hospital) with probability p′
ij > 0, or with probability1 − p′
ij requires another round of test and treatment. Wenote that in practice the probability of being disposedmay not be constant because it depends on variousfactors (e.g., progression of pain, the number of pastinteractions with the physician, revealed test results,etc.). If data on such factors were collected, they couldbe incorporated into the patient prioritization decision.Since such data do not currently exist, we approximatethe number of interactions with the physician by fittinga geometric distribution with constant probability of
Dow
nloa
ded
from
info
rms.
org
by [
129.
219.
247.
33]
on 1
6 A
ugus
t 201
4, a
t 09:
39 .
For
pers
onal
use
onl
y, a
ll ri
ghts
res
erve
d.

Saghafian et al.: Complexity-Augmented Triage334 Manufacturing & Service Operations Management 16(3), pp. 329–345, © 2014 INFORMS
departure p′ij for patients classified as ij ∈U×C, which
can easily be estimated using the average number ofphysician-patient interactions for that class. Empiricaldata from the literature (Graff et al. 1993) suggest thatthis is a reasonable approximation of reality (see, e.g.,Figure 5 in §6).
We model the aggregated test times (including anypreparation and waits for results) as i.i.d. exponentialrandom variables. The i.i.d. assumption is justifiablebecause (a) most testing facilities are shared with unitsoutside the ED and so have workloads not visible toED personnel, and (b) even if test facility workloadswere known, ED personnel could not incorporate theminto patient sequencing decisions because they donot know which tests, if any, will be required beforeexamining a patient and/or the patient’s prior testresults (which begins an interaction). So, for purposesof patient sequencing at least, test time delays looklike i.i.d. random variables to the physician. Modelingsuch delays as exponential is reasonable because (1) thewaiting time distribution in many queueing systems isexponential or nearly so, and (2) at least in UMHSED,physicians do not make use of the “age” informationthat a delay distribution with nonconstant failure ratewould provide. (The assumptions above give us atractable ·/M/� approximation of test time delaysfrom the perspective of an ED physician. Although thisapproximation is useful to gain insights into phase 2prioritization, it does not facilitate examination of thepotential for coordinating ED decisions with the real-time status of test facilities. Studies of test facilities uponwhich a more detailed model with which to considerthis possibility could be constructed include Green et al.2006a, Patrick et al. 2008, and Batt and Terwiesch 2012.)
To keep our analytical model tractable, the aggregatetest delay times are further assumed to be a generic “test”with mean time �−1 that is the same across differentpatient classes. However, we relax this assumption andallow patient class specific test delays in our simulationmodel of §6. Finally, we note that in most EDs physiciansdo not update patients’ triage classes for various reasonsincluding those related to liability. Hence, consistentwith practice, we assume patient classifications are madeat triage and are not updated during the phase 2 serviceprocess. We refer to the representation of phase 2 of theED service with above assumptions as the simplifiedphase 2 model with dynamic arrivals.
Because each physician is dedicated to his or herown slate of patients, we focus on a single physi-cian’s decision of who to see next. To this end, we letx = 4xij5ij∈U×C (respectively, y = 4yij5ij∈U×C) represent theerror-impacted number of patients of each class avail-able (not available) for the physician visit. With these,we can define the state of the system at any point intime, t, by the vector 4x4t51 y4t55 ∈�4
+�4
+, and model
the process 84x4t51 y4t552 t ≥ 09 as a continuous timeMarkov chain (CTMC). Because here we are considering
an exogenous arrival process that represents underloadconditions (we will consider overload conditions later),the physician’s capacity and the number of beds arenot binding, and hence we do not impose any explicitbounds on 4x4t51 y4t55. As an underloaded system,we may assume the parameters of the system aresuch that the underlying CTMC is stablizable; thatis, there exists at least one policy under which therisk of adverse events is finite. However, because ofthe Poisson arrivals and the pure delay model fortest times, the transition rates are not bounded, andhence we cannot use the uniformization method ofLippman (1975) to formulate a discrete time equivalentof the CTMC in which the times between consecutiveevents are i.i.d. (for all states). So instead, we constructa sequence of controlled CTMC’s (CCTMC’s) withan increasing but bounded sequence of (maximum)transition rates converging to the original CCTMC.We do this by replacing the ·/M/� model of test pro-cess with four parallel ·/M/k systems (one devotedto each patient class), index the underlying CCTMCwith k, and let k→ �. The advantage of having fourparallel ·/M/k queues (instead of one ·/M/k) is thatthe order of jobs in each queue does not need to becaptured in the system’s state. Another novel aspectof our approach is that we truncate the transitionrates instead of truncating the state space, therebyavoiding the artificial boundary effects that usuallydistort the optimal policy. Since the transition ratesin the CTMC indexed by k (for all k) are boundedby �k = maxij∈U×C �̂′
ij + 4k�+∑
ij∈U×C �′ij <�, we can
use the standard uniformization technique to derivethe optimal policy for each CCTMC. We then use aconvergence argument (taking the limit as k → �) toderive the optimal policy for the original problem.
For the system indexed by k, the optimal rate ofadverse events under a patient classification based onboth sets U and C, Rk∗ = inf�∈çRU∪C
� (where ç denotesthe set of all admissible Markovian policies), and theoptimal physician behavior can be derived from thefollowing average cost optimality equation:
J k4x1 y5+Rk∗
=1�k
[
�̂′
4x+ y5T +∑
ij∈U×C
6�′
ij Jk4x+eij1 y5
+4yij ∧k5�J k4x+eij1 y−eij57
+ mina∈A4x5
{
∑
ij∈U×C
�8a=ij9�̂′
ij
[
p′
ij Jk4x−eij1 y5
+41−p′
ij5Jk4x−eij1 y+eij5
]
+
(
�k−∑
ij∈U×C
6�′
ij +4yij ∧k5�+�8a=ij9�̂′
ij 7
)
J k4x1 y5
}]
1
(1)
Dow
nloa
ded
from
info
rms.
org
by [
129.
219.
247.
33]
on 1
6 A
ugus
t 201
4, a
t 09:
39 .
For
pers
onal
use
onl
y, a
ll ri
ghts
res
erve
d.

Saghafian et al.: Complexity-Augmented TriageManufacturing & Service Operations Management 16(3), pp. 329–345, © 2014 INFORMS 335
where J k4x1 y5 is a relative cost function (defined as thedifference between the total expected cost of startingfrom state 4x1 y5 and that from an arbitrary state suchas 40105), a∧ b = min8a1 b9, eij is a vector with the samesize as x with a 1 in position ij and 0 elsewhere, a isan action determining which patient class to serve, andA4x5= 8ij ∈U×C2 xij > 09∪ 809 is the set of feasibleactions (class 0 represents the idling action) when theerror-impacted number of patients of each class in theexamination rooms is x.
Although our model of phase 2 has a complexmultistage structure with feedback (i.e., random patientreturns after each visit), which generally makes theoptimal policy complex (see, e.g., Tcha and Pliska1977), the optimal behavior of the physician can bedescribed by an appealingly simple operational rule.(Proofs of this and all other results are given in OnlineAppendix A.)
Theorem 1 (Phase 2 Prioritization). In the simpli-fied phase 2 model with dynamic arrivals, regardless of thenumber and class of available and unavailable patients, thephysician should prioritize available patients in decreasingorder of p′
ij �̂′ij �̂
′ij . Furthermore, the physician should not
idle when there is a patient available in an exam room.
The prioritization index in Theorem 1 is computed asthe probability that the visit will be the final interactionwith the patient (p′
ij5 times the estimated risk of adverseevents 4�̂′
ij5 divided by the average duration of eachvisit (1/�̂′
ij5. Such a policy is easy to implement, since (a)the physician does not need to consider the number andclass of patients available in the examination rooms orunder tests, and (b) the physician (or decision supportsystem) can easily estimate the required quantities.(For example, the authors have developed a smartphone application that can be used by ED physiciansto facilitate collection of required data and computationof patient priorities.) In most settings, �′
ij is larger wheni is U (urgent) than when i is N (nonurgent), and p′
ij
and �̂′ij are larger when j is S (simple) than when j
is C (complex). Since the relative difference in �′ij is
much larger than the relative difference in p′ij and �̂′
ij , itfollows that US (urgent simple), UC (urgent complex),NS (nonurgent simple), and NC (nonurgent complex)defines the optimal phase 2 priority policy for mosthospitals.
As a further check on the robustness of this prioriti-zation result, we consider an alternate model in whicharrivals to phase 2 are not dynamic. Specifically, weassume that all patients for a given time interval (e.g.,the afternoon rush period) arrive to the ED waitingroom at once and the objective is to clear them outas quickly as possible to minimize LOS and ROAE.We further assume that ED physicians can treat anypatient in the system (i.e., there are no constraints on
the number of beds or the number of patients perphysician). However, we note that because interactionswith patients are time consuming and because physi-cians revisit patients already in phase 2, this modelwill limit the rate of patient flow into phase 2 evenwithout these constraints. We label this the simplifiedphase 2 model with static arrivals. In contrast with thesimplified phase 2 model with dynamic arrivals, whichis representative of the ED under light load conditions,this model is representative of the ED under heavy loadconditions that create a backlog of patients. In OnlineAppendix D, we show that the phase 2 sequencingpolicy of Theorem 1 remains optimal under these verydifferent modeling conditions. The suggestion is thatthe cost/time balance struck by the c�-type rule ofTheorem 1 is robustly effective in phase 2 for variousarrival processes, even ones that may be potentiallyendogenous to the priority rule. Our simulation studiesalso support this observation.
In practice, of course, the ED oscillates betweenunderload and overload conditions. Also, constraintson the number of beds and the number of patientsper physician sometimes prevent idle physicians fromtaking a new patient. Both of these realities make theinterface between phase 1 and phase 2 more complexthan in either of the simplified models considered here.To find an effective way to manage this interface andto see whether the phase 2 sequencing rule remainseffective in realistic settings, we proceed in two steps.First, we examine a simplified model of phase 1 to gaininsights into optimal sequencing of patients into the ED.Second, we use a realistic simulation of the combinedED to determine whether the policies suggested by thesimplified models are effective in the actual system.
5. Phase 1: SequencingPatients Into the ED
To create a simplified model that captures the essen-tial dynamics of sequencing patients into the ED, werepresent the dashed area in Figure 2 (i.e., phase 2)as a single-stage aggregated service node with a sin-gle “super server” that represents the aggregate EDcapacity. Because our phase 2 analysis indicated thatsimple patients with a given urgency level should beprioritized over complex ones within the ED and, bydefinition, complex patients have on average moreinteractions with physicians, it follows that simplepatients should have a higher aggregate/effective ser-vice rate than complex ones. Specifically, we supposepatients of type ij ∈ U×C have i.i.d. service times(i.e., the total time spent in phase 2) that follow a gen-eral distribution, Fij4s5 with first moment 1/�ij , where�iC ≤ �iS for all i ∈ U, and a finite second moment.(Note that that these service rates can be computedusing sojourn times from a simulation or Markov chain
Dow
nloa
ded
from
info
rms.
org
by [
129.
219.
247.
33]
on 1
6 A
ugus
t 201
4, a
t 09:
39 .
For
pers
onal
use
onl
y, a
ll ri
ghts
res
erve
d.

Saghafian et al.: Complexity-Augmented Triage336 Manufacturing & Service Operations Management 16(3), pp. 329–345, © 2014 INFORMS
analysis under the optimal phase 2 service policy.) Fortractability, we model the arrival of patients of typeij ∈U×C to the ED as a Poisson process with rate �ij .As we did in our simplified phase 2 models, we assumepatients of type ij are subject to adverse events, whichoccur according to a Poisson process with intensity �ij ,where �Uj ≥ �Nj for all j ∈C. These assumptions leadto a tractable model of phase 1; however, many ofthem will be relaxed later (see, e.g., Online Appendix Cand §6).
5.1. Urgency-Based TriageWe first consider current practice in most EDs in whichpatients in the main ED (levels 2 and 3) are classifiedsolely based on urgency, and use our simplified phase 1model to examine decisions for sequencing patients intothe ED. We start with the case of perfect classificationand then consider the case of stochastic misclassifi-cation. When patients can be perfectly classified aseither urgent (U) or nonurgent (N), the arrival ratesfor Us and Ns are �U =
∑
j∈C �Uj and �N =∑
j∈C �Nj ,respectively. Similarly, the average service times for Usand Ns are 1/�U =
∑
j∈C4�Uj/�U 541/�Uj5 and 1/�N =∑
j∈C4�Nj/�N 541/�Nj5, respectively. Furthermore, fromknown results for nonpreemptive priority queues (see,e.g., Cobham 1954) the average waiting (queue) timeof the kth priority class is
Wk =� Ɛ4s25
241 −∑
l<k �l541 −∑
l≤k �l51 (2)
where s represents the service time of a randomlychosen patient, and �l = �l/�l for class l. Hence,if Us are prioritized over Ns, then the averagewaiting time is WU = �Ɛ4s25/241 − �U 5 for U ′s andWN = �Ɛ4s25/241 − �U 541 − �5 for N ′s. Furthermore,the average intensity of adverse events for U ′s is�U = 4�US/�U 5�US + 4�UC/�U 5�UC and for N ′s is �N =
4�NS/�N 5�NS + 4�NC/�N 5�NC . With these, the ROAEunder an urgency-based triage policy (i.e., classificationwith respect to set U) that gives priority to U ′s (denotedby RU
U ) or Ns (denoted by RUN ) follows:
RUU = �U�U 4�Ɛ4s
25/241 −�U 55
+ �N�N 4�Ɛ4s25/241 −�U 541 −�551 (3)
RUN = �N�N 4�Ɛ4s
25/241 −�N 55
+ �U�U 4�Ɛ4s25/241 −�N 541 −�550 (4)
Comparing these reveals that, without misclassificationerrors, the best priority rule is to prioritize U ′s (N ′s) if,and only if, �U�U ≥ 4≤5�N�N . Given the criteria usedto classify a patient as urgent, we expect �U and �Nbe such that �U�U >�N�N , meaning that U ′s will begiven priority. However, this simple result may or maynot hold if one considers the effect of stochastic triagemisclassifications.
Therefore, we now formally incorporate stochas-tic misclassification errors into our model. Let �U
and �N denote the misclassification probabilities forurgent and nonurgent patients, respectively. The arrivalrates for patients classified (correctly or erroneously)as U and N are �′
U = �U 41 − �U 5 + �N�N and �′N =
�N 41 −�N 5+�U�U , respectively. Similarly, the meanservice times for patients classified as U and Nare 1/�′
U = 6�U 41 −�U 541/�u5+�N�N 41/�N 57/�′U and
1/�′N = 6�N 41 −�N 541/�N 5+�U�U 41/�U 57/�
′N , respec-
tively. Finally, the intensity of adverse events forpatients classified as U and N are �′
U = 6�U 41−�U 5 �U +
�N �N �N 7/�′U and �′
N = 6�N 41 −�N 5 �N +�U�U �U 7/�′N ,
respectively.Using (3) with these new error-impacted rates shows
that when priority is given to U s, the ROAE underimperfect classification is
RU′
U = �′
U�′
U 4�Ɛ4s25/241 −�′
U 55
+ �′
N�′
N 4�Ɛ4s25/241 −�′
U 541 −�551 (5)
where �′U = �′
U/�′U . Similarly, using (4) shows that
when priority is given to N s,
RU′
N = �′
N�′
N 4�Ɛ4s25/241 −�′
N 55
+ �′
U�′
U 4�Ɛ4s25/241 −�′
N 541 −�551 (6)
where �′N = �′
N/�′N . We summarize the implications
of these results in the following proposition. Notethat part (i) of this proposition coincides with the“expected c�” and highest signal first (HSF) policydiscussed in Argon and Ziya (2009). However, becauseof differences between our setting and theirs (mostimportantly, Argon and Ziya (2009) assume a continu-ous signal from customers that indicates the probabilityof misclassification, whereas our approach uses averagemisclassification error rates that can be estimated fromdata), we provide an independent proof based on theabove results.
Proposition 1 (Phase 1 Prioritization—Urgency-Based Triage). In the simplified phase 1 model withimperfect urgency-based classification, (i) The best (static)priority rule is to prioritize U patients if �′
U �′U ≥ �′
N�′N ;
otherwise, prioritize N patients. (ii) The best (static) priorityrule is the same as that for the case without misclassificationerror if �N + �U ≤ 1; otherwise, the best priority ordering isreversed.
Part (i) of Proposition 1 shows how triage misclassi-fication errors can be incorporated into the optimalpriority rule. Part (ii) of Proposition 1 shows that ifthe misclassification rate is high enough, the optimalpriority rule prioritizes N patients. However, empiricalstudies have observed misclassification levels �N and�U to be in the range 9%–15% depending on the levelof triage nurse experience (Hay et al. 2001). Thus, if,
Dow
nloa
ded
from
info
rms.
org
by [
129.
219.
247.
33]
on 1
6 A
ugus
t 201
4, a
t 09:
39 .
For
pers
onal
use
onl
y, a
ll ri
ghts
res
erve
d.

Saghafian et al.: Complexity-Augmented TriageManufacturing & Service Operations Management 16(3), pp. 329–345, © 2014 INFORMS 337
Figure 4 Class Dependent Arrival Rates to the ED for an Average Day (Obtained from a Year of Data in UMHSED)
0.400
:00–
02:0
0
02:0
0–04
:00
04:0
0–06
:00
06:0
0–08
:00
08:0
0–10
:00
10:0
0–12
:00
12:0
0–14
:00
14:0
0–16
:00
16:0
0–18
:00
18:0
0–20
:00
20:0
0–22
:00
22:0
0–24
:00
0.60.81.01.21.41.61.82.02.2
Arr
ival
rat
e
US UCNS NC
as we expect, prioritizing urgent patients is optimalwhen there is no misclassification error, prioritizingthem remains optimal even under practical levels ofmisclassification errors. This confirms that prioritizinglevel 2 patients over level 3 patients, as is typicallydone in the main ED, is reasonable. However, we notethat there is wide variance of complexity among level 2and level 3 patients (see, e.g., Vance and Sprivulis 2005and Figure 4). Simply prioritizing level 2 patients overlevel 3 patients may be significantly suboptimal relativeto a policy that considers complexity. We investigatethis issue in the next section.
5.2. Complexity-Augmented TriageWe now consider the complexity-augmented triagepolicy shown in Figure 1(b), and compare its perfor-mance to that of conventional urgency-based triage. Bydoing this we address the prioritization, magnitude,and sensitivity questions posed in the introduction.
To evaluate the performance of complexity-augmented triage when classification is imperfect, weagain let �U and �N denote the misclassification errorrates with respect to set U. Similarly, we let �C and �S
denote the misclassification error rates with respectto set C, �C denote the probability that a C patientis classified as an S, and �S denote the probabilitythat an S patient is classified as a C. We assume themisclassification probabilities with respect to U and Care independent because (a) the data show that theassessments themselves are uncorrelated, indicatingthat urgency and complexity are medically separablequestions (e.g., Figure 4 indicates that an urgent patientis almost equal likely to be simple or complex (andvice versa)), and (b) multiple nurses perform triage,thereby limiting the extent of any systematic biases inmisclassifications.
As noted earlier, misclassification error rates in termsof urgency have been observed to be in the range of9%–15% (Hay et al. 2001). Vance and Sprivulis (2005)tested the ability of triage nurses to evaluate patientcomplexity and observed a misclassification rate of17% (see also Kronick and Desmond 2009 for related
empirical work in UMHSED regarding the ability oftriage nurses to classify patients).
Similar to what we did in §5.1, we need to cal-culate the error impacted rates �′
ij , �′ij , and �′
ij . Let�= 4�US1�UC1�NS1�NC5 and �′ = 4�′
US1�′UC1�
′NS1�
′NC5.
Then �′ can be obtained through a linear transformationof �; �′T =A�T , where A is a (known) misclassificationerror matrix, and is defined as
A =
41 −�U 541 −�S5 41 −�U 5�C
41 −�U 5�S 41 −�U 541 −�C5�U 41 −�S5 �U�C
�U�S �U 41 −�C5
�N 41 −�S5 �N�C
�N�S �N 41 −�C541 −�N 541 −�S5 41 −�N 5�C
41 −�N 5�S 41 −�N 541 −�C5
0 (7)
Similarly, if �′ and �′ denote the vector of error-impacted adverse event and service rates, we have �′T =
4A4�×�5T 5/�′ and 41/�′5T = 4A4�/�5T 5/�′, where 1 =
411111115 and operators “×” and “/” are component-wise multiplication and division, respectively. Withthese, the waiting times for each customer class underan imperfect U ∪C classification can be computedusing (2) with rates replaced with their transformederror impacted counterparts. This model permits us toshow the following.
Proposition 2 (Phase 1 Prioritization—Com-plexity-Augmented Triage). In the simplified phase 1model with imperfect urgency and complexity classifications:(i) The best priority rule is to prioritize patients in decreasingorder of �′
ij �′ij values. (ii) RU′∪C′
∗≤RU′
∗. That is, even with
misclassification errors, implementing the best priority rulefor complexity-augmented triage is always (weakly) betterthan the optimal priority rule for urgency-based triage.(iii) The rule of part (i) is optimal even among the largerclass of all nonanticipative (state or history dependent, idlingor nonidling, etc.) policies.
Proposition 2(i) addresses the prioritization ques-tion by suggesting a simple priority rule analogous tothe well-known “c�” rule to incorporate complexity
Dow
nloa
ded
from
info
rms.
org
by [
129.
219.
247.
33]
on 1
6 A
ugus
t 201
4, a
t 09:
39 .
For
pers
onal
use
onl
y, a
ll ri
ghts
res
erve
d.
Saghafian et al.: Complexity-Augmented Triage338 Manufacturing & Service Operations Management 16(3), pp. 329–345, © 2014 INFORMS
information into phase 1 sequencing. However, theindices used are linearly transformed to incorporatemisclassifications. Thus, this result can be viewed as anextension of the c� rule under imperfect information.Furthermore, Proposition 2(i) shows precisely when theoptimal priority rule will be different from the optimalrule without misclassification. For instance, if misclassifi-cation rates are high enough, it can be better to prioritizenonurgent patients over urgent ones. However, at theerror levels observed in the previously cited studies, theimplication of Proposition 2(i) is to prioritize patients inthe order: US, UC, NS, NC, which coincides with thepriority rule we found to be optimal in phase 2. Propo-sition 2(ii) begins to address the magnitude questionraised in the introduction by suggesting that complexity-augmented triage outperforms urgency-based triage,provided that the optimal priority rule is implemented.Although this result may seem intuitive because ofthe additional information collected at triage, we notethat the additional information is subject to errors, sothis conclusion is not obvious. Nevertheless, Proposi-tion 2(ii) shows that, implemented correctly, imperfectcomplexity-augmented information always improvesthe ED performance regardless of the misclassificationlevels. Moreover, it should be noted that informationcollection involves only simple estimations of whethertwo or more interactions are needed with a physician,which adds minimal time to the triage process. Whereaspriority rules are greedy and usually suboptimal, Propo-sition 2(iii) confirms that they are optimal in this setting.The surprise is that it is never optimal to idle in anticipa-tion of a high priority patient when only low prioritypatients are available, even though the model disallowspreemption. Similar results for the c� rule but withoutmisclassifications are presented in Kakalik and Little(1971). Finally, part (iii) of Proposition 2 states that adynamic (i.e., state-dependent) priority policy cannotbeat the greedy and simple state-independent policypresented in part (i).
We can also address the sensitivity question by usingour model to determine the environmental factors thatfavor complexity-augmented triage, as summarized inthe following proposition:
Proposition 3 (Attractiveness of Complexity-Augmented Triage). Under the simplified phase 1 model,the benefit of complexity-augmented triage compared tourgency-based triage (under their respected optimal pri-ority policies), RU′
∗− RU′∪C′
∗, is (i) nondecreasing in �;
(ii) nondecreasing in 1/�C − 1/�S ; (iii) maximized at�= 1/2, when �US = 41 −�5�U , �UC = ��U , �NC = ��N ,and �NS = 41 −�5�N ; and (iv) nonincreasing in �S and �C .
This implies that complexity-augmented triage ismost beneficial in EDs with (i) high utilization, (ii) highheterogeneity in the average service time of simple andcomplex patients, (iii) equal fractions of simple and
complex patients, or (iv) low complexity classificationerror rates.
5.3. Patient Flow Design Using Complexity andUrgency Information
In this section, we address the “design” question fromthe introduction by examining whether complexityinformation obtained at triage is more useful for sepa-rating patients into streams or for prioritizing themwithin streams. Additional insights will be providedin §6.4, where we use hospital data to compare theperformance of different ED patient flow designs.
We consider two patient flow designs. In complexitystreaming, S and C patients are sent to separate streamsin which they are prioritized based on their urgencylevel (U before N). In urgency streaming, U and Npatients are sent to separate streams, within whichS patients are prioritized over C patients (consistentwith the optimal priority rule established in Proposi-tion 2(i)). To make a fair comparison of these designs,we first remove the effect of unbalanced utilizationsand assume that the ED can assign appropriate capacity(physicians, staff, beds, etc.) to streams so that theirutilization becomes equal. We further assume thattwo conditions hold: (1) the (error impacted) effectivemean service rates in each stream are equal, and (2)the variance of service times in each stream are equal.Since ROAE is a function of arrival rate, service rate(and hence utilization), as well as the second momentof service time (see Equation (5)), these assumptionsprovide a fair basis for comparing different streamingdesigns, which we term as perfectly balanced streamingdesigns, because they eliminate obvious differences inutilization-induced congestion that can be removedby appropriate capacity allocation between streams.However, in Online Appendix B, we compare theperformance of partially balanced streaming designsby relaxing these conditions, and we observe thatour conclusions are robust. Finally, in §6.4, we usehospital data and simulation to further examine theperformance of complexity-based streaming.
Proposition 4 (Patient Flow Design). In perfectlybalanced streaming systems, with each stream using itsoptimal policy suggested by Proposition 2(i), using com-plexity information for streaming patients and urgencyinformation for prioritizing them (complexity streaming)is better than using urgency information for streamingand complexity information for prioritizing them (urgencystreaming). Furthermore, the performance advantage of com-plexity streaming (weakly) increases as total ED utilizationincreases.
The intuition behind the above result is that matchingcapacity to workload in the different streams dimin-ishes the effect of different service times among simpleand complex patients. Hence, the difference in the
Dow
nloa
ded
from
info
rms.
org
by [
129.
219.
247.
33]
on 1
6 A
ugus
t 201
4, a
t 09:
39 .
For
pers
onal
use
onl
y, a
ll ri
ghts
res
erve
d.
Saghafian et al.: Complexity-Augmented TriageManufacturing & Service Operations Management 16(3), pp. 329–345, © 2014 INFORMS 339
intensity of adverse events between urgent and nonur-gent patients becomes the dominant factor in selectingthe best streaming design. Because complexity stream-ing prioritizes patients in both streams according tourgency, it is more effective than urgency streaming.Although we have derived this insight using a singleserver model, we note that the single server assumptionis not essential to the comparison. First, it can be easilyseen from the well-known Sakasegawa equation (see,e.g., Hopp and Spearman 2008, pp. 290–291) that withthe same utilization, the queueing time of a G/G/kqueueing system and that of an “equivalent” G/G/1become equal as the system’s utilization approaches 1.Since utilization in the ED is typically high, we expectthe single server assumption to provide a good approx-imation. Second, our numerical comparisons showthat even with utilization as low as 60%, the conclu-sion that complexity-based streaming is superior tourgency-based streaming is not altered by the numberof servers. Finally, in §6.4, we use hospital data anda simulation model with multiple physicians, beds,etc. to further confirm the superiority of complexitystreaming.
6. Simulation Analysis ofComplexity-Augmented Triage
In this section, we test the conjectures suggested byour analytic models and get a better sense of themagnitude of the impact of complexity-augmentedtriage by means of a detailed ED simulation model.This simulation incorporates many features common tomost EDs, including dynamic nonstationary arrivals,multistage service, multiple physicians and exam rooms,inaccuracy in triage classifications (both in terms ofurgency and complexity), and limits on the numberof patients physicians handle simultaneously. We usea year of hospital data from the UMHSED plus timestudy data from the literature to construct a base casethat is representative of EDs in research hospitals.We first describe the main features of our simulationframework, and then describe the test cases and ourconclusions from them.
Patient Classes. At the time of triage, patients are clas-sified according to both urgency (urgent or nonurgent)and complexity (simple or complex). For modelingpurposes, we omit the resuscitation unit (RU) and fasttrack (FT) classifications, shown in Figure 1(b), sincethese patients are typically tracked separately fromthe main ED. We define S (simple) patients as thosewho only require one interaction and C (complex)patients as those requiring two or more interactions.Note that we do not count the short physician visits ator after the disposition state as an interaction for thepurpose of S/C classification. Focusing on the mainarea of the ED, with triage level 1, level 4, and level 5patients omitted, we can equate U (N) patients with
level 2 (level 3) patients. Both urgency and complexityclassifications at the point of triage are subject to errorswith different error rates, so we assume the true typeof a patient is not known until the final dispositiondecision is made. Consistent with the empirical findingsof Hay et al. (2001), Vance and Sprivulis (2005), andKronick and Desmond (2009), we assume urgency andcomplexity classifications are subject to 10% and 17%error rates, respectively. We also assume urgency-basedand complexity-based misclassification rates are inde-pendent and symmetric (i.e., triage nurses are equallylikely to classify U4C5 patients as N4S5 as they are toclassify N4S5 patients as U4C5, respectively), but weconsider asymmetric errors in our sensitivity analysis.
Arrival Process. Class-based patient arrivals are mod-eled using nonstationary Poisson processes that approx-imate our data. The nonstationary arrival rates fordifferent classes are depicted in Figure 4. These arrivalrates were obtained from a year of UMHSED datataken at two-hour intervals. However, since UMHSEDpatients are not currently triaged based on complex-ity, we assume that 49% of patients are complex asobserved empirically by Vance and Sprivulis (2005).The resulting pattern is similar to those reported inother studies (e.g., Green et al. 2006b). A “thinning”mechanism (see Lewis and Shedler 1979) is used tosimulate the nonstationary Poisson process arrivals foreach class of patients. From our data and Figure 4, wealso observe that complexity and urgency classificationsare almost independent (e.g., a complex patient isequally likely to be urgent or nonurgent).
Service Process. The ED service process has multiplestages as depicted in Figure 3. Each patient experiencesone or more patient-physician interactions followedby test/preparation/wait activities during which thephysician cannot have a direct interaction with thepatient (all such stages are labeled as “test” in Figure 3).We also consider the initial and final preparations bya nurse. The initial preparation happens when thepatient is moved to an exam room for the first time(before the first interaction with the physician) and thefinal preparation happens after the final interactionwith the physician and before the patient is dischargedhome or admitted to the hospital. The duration ofeach physician interaction is random and is modeledwith an exponential distribution with a parameterthat depends on the class of the patient as well as thenumber of previous interactions. Our data suggestthat the first and last interactions are typically longerthan the intermediate interactions, so we model themas such in the simulation. While S patients have oneinteraction, for C patients we simulate the distributionof the number of physician interactions using thedata shown in Figure 5, which are derived from adetailed time study (see Table 3 of Graff et al. 1993)with normalization to represent our NC and UC patient
Dow
nloa
ded
from
info
rms.
org
by [
129.
219.
247.
33]
on 1
6 A
ugus
t 201
4, a
t 09:
39 .
For
pers
onal
use
onl
y, a
ll ri
ghts
res
erve
d.
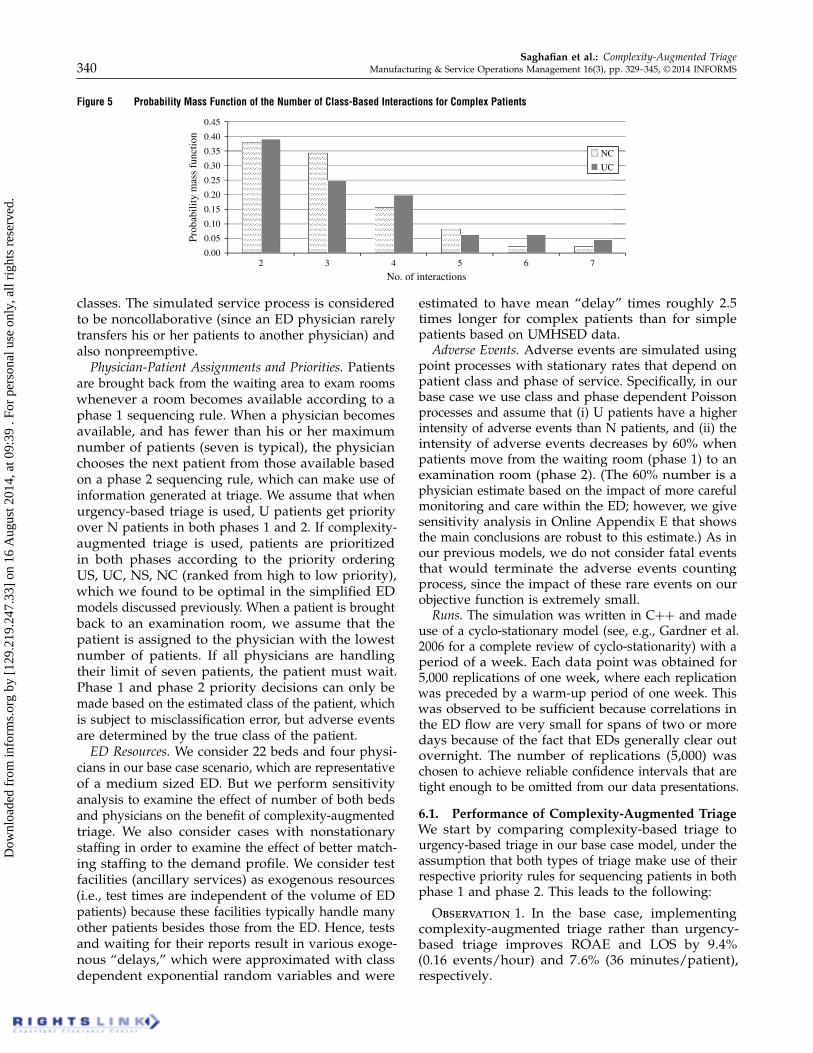
Saghafian et al.: Complexity-Augmented Triage340 Manufacturing & Service Operations Management 16(3), pp. 329–345, © 2014 INFORMS
Figure 5 Probability Mass Function of the Number of Class-Based Interactions for Complex Patients
0.00
0.05
0.10
0.15
0.20
0.25
0.30
0.35
0.40
0.45
2 3 4 5 6 7
Prob
abili
ty m
ass
func
tion
No. of interactions
NC
UC
classes. The simulated service process is consideredto be noncollaborative (since an ED physician rarelytransfers his or her patients to another physician) andalso nonpreemptive.
Physician-Patient Assignments and Priorities. Patientsare brought back from the waiting area to exam roomswhenever a room becomes available according to aphase 1 sequencing rule. When a physician becomesavailable, and has fewer than his or her maximumnumber of patients (seven is typical), the physicianchooses the next patient from those available basedon a phase 2 sequencing rule, which can make use ofinformation generated at triage. We assume that whenurgency-based triage is used, U patients get priorityover N patients in both phases 1 and 2. If complexity-augmented triage is used, patients are prioritizedin both phases according to the priority orderingUS, UC, NS, NC (ranked from high to low priority),which we found to be optimal in the simplified EDmodels discussed previously. When a patient is broughtback to an examination room, we assume that thepatient is assigned to the physician with the lowestnumber of patients. If all physicians are handlingtheir limit of seven patients, the patient must wait.Phase 1 and phase 2 priority decisions can only bemade based on the estimated class of the patient, whichis subject to misclassification error, but adverse eventsare determined by the true class of the patient.
ED Resources. We consider 22 beds and four physi-cians in our base case scenario, which are representativeof a medium sized ED. But we perform sensitivityanalysis to examine the effect of number of both bedsand physicians on the benefit of complexity-augmentedtriage. We also consider cases with nonstationarystaffing in order to examine the effect of better match-ing staffing to the demand profile. We consider testfacilities (ancillary services) as exogenous resources(i.e., test times are independent of the volume of EDpatients) because these facilities typically handle manyother patients besides those from the ED. Hence, testsand waiting for their reports result in various exoge-nous “delays,” which were approximated with classdependent exponential random variables and were
estimated to have mean “delay” times roughly 2.5times longer for complex patients than for simplepatients based on UMHSED data.
Adverse Events. Adverse events are simulated usingpoint processes with stationary rates that depend onpatient class and phase of service. Specifically, in ourbase case we use class and phase dependent Poissonprocesses and assume that (i) U patients have a higherintensity of adverse events than N patients, and (ii) theintensity of adverse events decreases by 60% whenpatients move from the waiting room (phase 1) to anexamination room (phase 2). (The 60% number is aphysician estimate based on the impact of more carefulmonitoring and care within the ED; however, we givesensitivity analysis in Online Appendix E that showsthe main conclusions are robust to this estimate.) As inour previous models, we do not consider fatal eventsthat would terminate the adverse events countingprocess, since the impact of these rare events on ourobjective function is extremely small.
Runs. The simulation was written in C++ and madeuse of a cyclo-stationary model (see, e.g., Gardner et al.2006 for a complete review of cyclo-stationarity) with aperiod of a week. Each data point was obtained for5,000 replications of one week, where each replicationwas preceded by a warm-up period of one week. Thiswas observed to be sufficient because correlations inthe ED flow are very small for spans of two or moredays because of the fact that EDs generally clear outovernight. The number of replications (5,000) waschosen to achieve reliable confidence intervals that aretight enough to be omitted from our data presentations.
6.1. Performance of Complexity-Augmented TriageWe start by comparing complexity-based triage tourgency-based triage in our base case model, under theassumption that both types of triage make use of theirrespective priority rules for sequencing patients in bothphase 1 and phase 2. This leads to the following:
Observation 1. In the base case, implementingcomplexity-augmented triage rather than urgency-based triage improves ROAE and LOS by 904%(0.16 events/hour) and 706% (36 minutes/patient),respectively.
Dow
nloa
ded
from
info
rms.
org
by [
129.
219.
247.
33]
on 1
6 A
ugus
t 201
4, a
t 09:
39 .
For
pers
onal
use
onl
y, a
ll ri
ghts
res
erve
d.

Saghafian et al.: Complexity-Augmented TriageManufacturing & Service Operations Management 16(3), pp. 329–345, © 2014 INFORMS 341
To consider the case where phase 2 sequencingcannot follow the optimal rule because of a lack ofdata, patient discomfort, or other factors, we alsocompare complexity-augmented triage with urgency-based triage when phase 2 sequencing in both systemsuses a service-in-random-order (SIRO) rule. This leadsto improvements of 7.9% and 7.0% in ROAE and LOS,respectively. Hence, it appears that the benefits ofcomplexity-augmented triage are quite robust to thepolicy used in phase 2. At least in our base case, it is therefined sequencing in phase 1 that drives the majorityof the improvement. Furthermore, this conclusion isnot significantly affected by many assumptions in thebase case. For instance, in Online Appendix E, we givesensitivity analyses on the 60% drop in phase 2 intensityof adverse events and show that this conclusion isrobust. We have also observed similar results regardingthe 2.5 ratio of test times of complex patients to simplepatients.
The smaller effect of phase 2 sequencing compared tothat of phase 1 prioritization is mainly due to the factthat, under the conditions of our base case, physiciansin phase 2 often do not have many available patientsfrom which to choose. This is because (a) patients areunavailable for considerable amounts of time whilebeing tested and waiting for test results, and (b) eachphysician handles only a limited number of patientssimultaneously (with an upper bound of seven). How-ever, in EDs with shorter test times (e.g., more testfacilities dedicated to the ED, or more responsive centraltest facilities), larger case loads (patients per physician),and enough examination rooms/beds to accommodatepatients, there will be more choices among in-processpatients, and hence more improvement from an effec-tive phase 2 sequencing policy. To test this, we consideran ED with test rates 70% faster than the base casevalues, 40 beds, three physicians, and a maximumnumber of 10 patients per physician. Under theseconditions, if phase 2 sequencing is done accordingto SIRO for both the urgency-based and complexity-augmented triage systems, then complexity-augmentedtriage achieves improvements of 8.6% and 6.2% in
Figure 6 The Effect of Resources (Beds and Physicians) on the Benefit of Complexity-Augmented Triage over the Current Practice of Urgency-Based Triage
0
2
4
6
8
10
12
14
16
18 20 22 24 26
Red
uctio
n (%
) du
e to
com
plex
ity-a
ugm
ente
d tr
iage
Red
uctio
n (%
) du
e to
com
plex
ity-a
ugm
ente
d tr
iage
No. of beds/examination rooms (physicians = 4)
(a) Effect of beds (four physicians) (b) Effect of physicians (22 beds)
LOSROAE
4
6
8
10
12
14
16
3 4 5
No. of physicians (beds = 22)
ROAE and LOS, respectively, relative to urgency-basedtriage. In contrast, if the urgency-based triage systemprioritizes patients in phase 2 by urgency (U > N )and the complexity-augmented triage system priori-tizes patients in phase 2 by complexity and urgency(US >UC >NS >NC), then complexity-augmentedtriage achieves improvements of 13.1% and 9.10% inROAE and LOS, respectively, relative to urgency-basedtriage. This leads us to the following:
Observation 2. In EDs where physicians have morechoice about what patient to see next, using complexityinformation to prioritize patients in phase 2 becomesmore valuable.
6.2. The Effect of ED Resource LevelsProposition 3 predicts that increased utilization ofresources (i.e., either physicians or examination rooms)should favor complexity-augmented triage. Figure 6illustrates the percentage improvement in terms ofROAE and LOS from using complexity-augmentedtriage over urgency-based triage for varying numbersof examination rooms and physicians. From this figurewe observe the following:
Observation 3. The benefit of complexity-aug-mented triage is greater in EDs with higher bed and/orphysician utilization.
As we observed in the introduction, most EDs areovercrowded, so high utilization is commonplace.Hence, results from our analytic and simulation mod-els suggest that complexity-augmented triage is mosteffective precisely in EDs most in need of improvement.
Nonstationary Staffing. Because EDs typically adjuststaffing to follow workload, at least to some extent,we now consider two cases of nonstationary staffing:(i) reducing the staffing level during off-peak hours,and (ii) reducing the staffing level during off-peakhours while increasing staffing during peak hours(redistributing the current workforce). To examine thesecases, we consider two alternate scenarios that modifyour base case assumption of four physicians at all times:(i) four physicians during peak demand times (12-hourshifts) and three physicians otherwise, and (ii) six
Dow
nloa
ded
from
info
rms.
org
by [
129.
219.
247.
33]
on 1
6 A
ugus
t 201
4, a
t 09:
39 .
For
pers
onal
use
onl
y, a
ll ri
ghts
res
erve
d.
Saghafian et al.: Complexity-Augmented Triage342 Manufacturing & Service Operations Management 16(3), pp. 329–345, © 2014 INFORMS
physicians during peak times (12-hour shifts) and twootherwise, so there is no net change in labor hours.Under scenario (i), the complexity-augmented triageachieves 1105% and 1100% improvements in ROAE andLOS, respectively, compared to urgency-based triage.Under scenario (ii), these numbers are 8.8% and 6.9%.Hence, the improvements relative to the 9.4% and 7.4%improvements of the base case shown in Figure 6(b)are larger under scenario (i) but not under scenario (ii).The reason is that scenario (i) increases utilizationduring off peak hours, which we have already shownenhances the benefits of complexity-augmented triage.But scenario 2 increases utilization during peak hourswhile decreasing it during off peak hours. Since overallperformance is dominated by the peak hours, duringwhich most congestion occurs, this results in a netdecrease in the benefits of complexity-augmented triage.Nevertheless, since it is not economical to entirelyeliminate high utilization periods in the ED, the benefitsof complexity-augmented triage will be reduced butnot eliminated with staffing that better matches thedemand profile.
Bed-Block Phenomenon. We can use the results ofFigure 6 to predict the effect of the ED bed-block phe-nomenon, in which ED patients admitted to the hospitalcannot be transferred to their inpatient unit becauseof unavailability of beds. By tying up beds in theED to board admitted patients, bed-block reduces theeffective number of ED beds, and hence, increases theirutilization. Therefore, from Figure 6 and Observation 3,we can expect complexity-augmented triage to yieldgreater benefits in EDs with higher bed-block/boardingtimes. For more detailed discussion of the effect ofED bed-block on patient flow design, we refer inter-ested readers to Saghafian et al. (2012) and the relatedreferences therein.
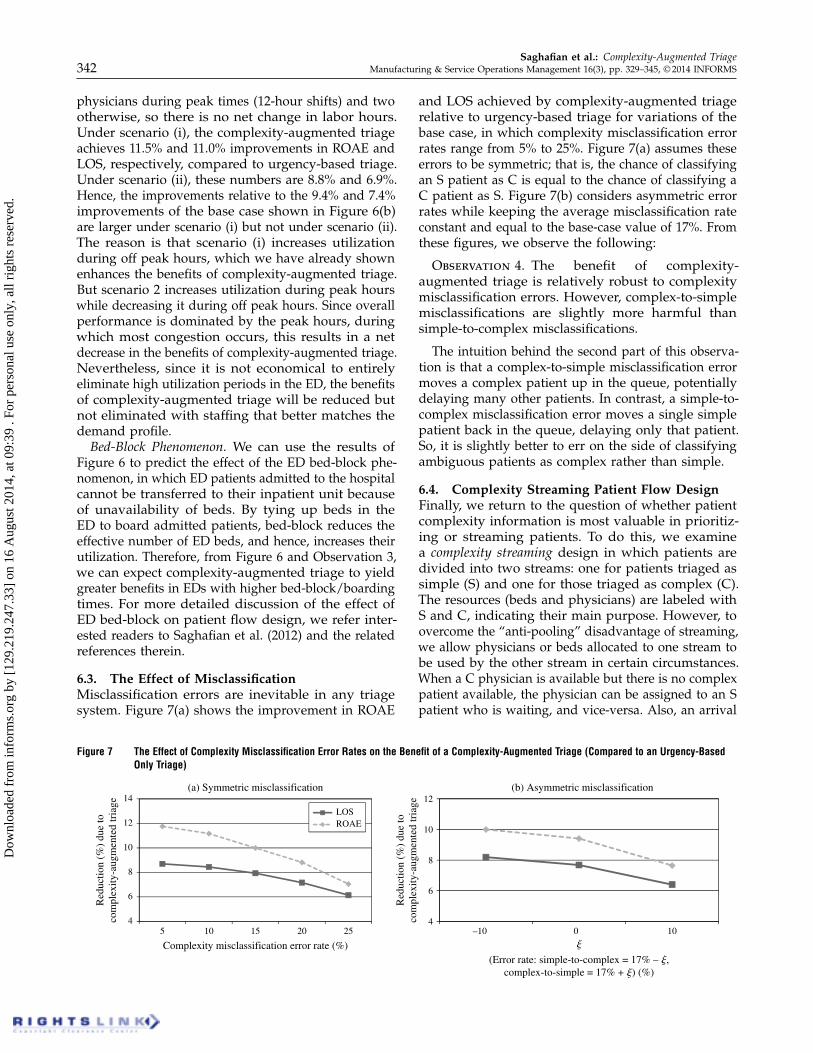
6.3. The Effect of MisclassificationMisclassification errors are inevitable in any triagesystem. Figure 7(a) shows the improvement in ROAE
Figure 7 The Effect of Complexity Misclassification Error Rates on the Benefit of a Complexity-Augmented Triage (Compared to an Urgency-BasedOnly Triage)
4
6
8
10
12
14
5 10 15 20 25
Complexity misclassification error rate (%)
(a) Symmetric misclassification (b) Asymmetric misclassification
4
6
8
10
12
–10 0 10
(Error rate: simple-to-complex = 17% – �,complex-to-simple = 17% + �) (%)
Red
uctio
n (%
) du
e to
com
plex
ity-a
ugm
ente
d tr
iage
Red
uctio
n (%
) du
e to
com
plex
ity-a
ugm
ente
d tr
iage
�
LOSROAE
and LOS achieved by complexity-augmented triagerelative to urgency-based triage for variations of thebase case, in which complexity misclassification errorrates range from 5% to 25%. Figure 7(a) assumes theseerrors to be symmetric; that is, the chance of classifyingan S patient as C is equal to the chance of classifying aC patient as S. Figure 7(b) considers asymmetric errorrates while keeping the average misclassification rateconstant and equal to the base-case value of 17%. Fromthese figures, we observe the following:
Observation 4. The benefit of complexity-augmented triage is relatively robust to complexitymisclassification errors. However, complex-to-simplemisclassifications are slightly more harmful thansimple-to-complex misclassifications.
The intuition behind the second part of this observa-tion is that a complex-to-simple misclassification errormoves a complex patient up in the queue, potentiallydelaying many other patients. In contrast, a simple-to-complex misclassification error moves a single simplepatient back in the queue, delaying only that patient.So, it is slightly better to err on the side of classifyingambiguous patients as complex rather than simple.
6.4. Complexity Streaming Patient Flow DesignFinally, we return to the question of whether patientcomplexity information is most valuable in prioritiz-ing or streaming patients. To do this, we examinea complexity streaming design in which patients aredivided into two streams: one for patients triaged assimple (S) and one for those triaged as complex (C).The resources (beds and physicians) are labeled withS and C, indicating their main purpose. However, toovercome the “anti-pooling” disadvantage of streaming,we allow physicians or beds allocated to one stream tobe used by the other stream in certain circumstances.When a C physician is available but there is no complexpatient available, the physician can be assigned to an Spatient who is waiting, and vice-versa. Also, an arrival
Dow
nloa
ded
from
info
rms.
org
by [
129.
219.
247.
33]
on 1
6 A
ugus
t 201
4, a
t 09:
39 .
For
pers
onal
use
onl
y, a
ll ri
ghts
res
erve
d.

Saghafian et al.: Complexity-Augmented TriageManufacturing & Service Operations Management 16(3), pp. 329–345, © 2014 INFORMS 343
Figure 8 Performance of Different Patient Flow Designs Compared to the Current Practice (Urgency Prioritization)
02468
1012141618
(15, 7) (16, 6) (17, 5) (18, 4) (19, 3) (20, 2)
Impr
ovem
ent (
%)
in L
OS
No. of beds/examination rooms assigned to streams (S, C) [No. of physicians assigned to streams = (1, 3)]
Improved/lean complexitystreaming
Complexity-augmentedprioritization
Complexity streaming
of type S may enter a C bed if no other C patients arewaiting, and vice-versa. This type of flexible allocationmechanism is referred to as “virtual streaming” inSaghafian et al. (2012), which demonstrates it to beimportant in disposition-based streaming protocols.Finally, we assume that patients in both streams and inboth phases 1 and 2 are prioritized according to theirurgency level.
Separating simple and complex patients makes it eas-ier to implement lean process improvement techniquesto improve and standardize service, particularly on thesimple side for which the repetitive treatment processescan be organized in a clear flow-shop manner (seealso Clark and Huckman 2012 and KC and Terwiesch2011 for related discussions on performance benefits offocused operations). Without separating simple patientsfrom complex ones, lean process improvements aremuch more difficult to implement because many taskswill not be amenable to standardized procedures.
We first exclude the effect of lean improvements andcompare the performance of complexity streaming, inwhich complexity information is used for streamingand urgency information is used for prioritizing, withurgency streaming, where urgency information is usedfor streaming and complexity information is used forprioritizing. We perform this comparison after opti-mizing the assignment of resources (physicians andbeds) to each stream for each patient flow design. Weobserve that, even without lean improvements, usingthe complexity information for streaming and urgencyinformation for prioritizing is better than using theurgency information for streaming and complexityinformation for prioritizing. This confirms our ear-lier result of §5.3 in a more realistic setting. We alsocompare, in Figure 8, the performance of complex-ity streaming, with and without lean improvements,against that of urgency prioritization (i.e., current practicein which patients in the main ED are not streamedbut are prioritized based on urgency) and complexity-augmented prioritization (i.e., a design in which patientsare not streamed but are prioritized in phase 1 andphase 2 according to the optimal priority rule usingcomplexity-augmented triage information). The systemwith lean improvements assumes that these increase
the service rate for interactions with simple patients by10%, but that no change occurs for complex patients.Based on results in other industries, this is a conserva-tive estimate of the impact of a lean transformation.Figure 8 compares performance in terms of LOS (resultsfor the ROAE criterion are similar). These comparisonslead to the following observations:
Observation 5. It is better to use complexity infor-mation for streaming and urgency information for pri-oritizing than using urgency information for streamingand complexity information for prioritizing (5.7% and4.8% improvements in ROAE and LOS, respectively).
Observation 6. Without lean improvements, com-plexity streaming is better than the current practice(urgency prioritization), but worse than complexity-augmented prioritization. With lean improvements(made only to the simple stream), complexity streamingcan achieve a substantial advantage over complexity-augmented prioritization.
7. ConclusionIn this paper, we propose a new triage system forED practice in which patients are classified on thebasis of complexity, as well as urgency. Our resultssuggest that, compared to current urgency-based triagesystems, complexity-augmented triage can significantlyimprove ED performance in terms of both patient safety(ROAE) and operational efficiency (LOS), even if patientclassification is subject to error. We find that a simpleand fast classification scheme, which defines patientsto be simple if they require only a single interaction(and complex otherwise) works very well as the basisfor complexity-augmented triage because it results in(1) a nearly even split between simple and complexpatients and (2) a substantial difference between averagetreatment time of complex and simple patients.
Our analyses indicate that complexity-augmentedtriage can yield substantial safety and efficiencyimprovements even if complexity information is onlyused to prioritize patients up to entry into the exami-nation rooms (phase 1). Furthermore, in EDs wherephysicians have a significant amount of choice about
Dow
nloa
ded
from
info
rms.
org
by [
129.
219.
247.
33]
on 1
6 A
ugus
t 201
4, a
t 09:
39 .
For
pers
onal
use
onl
y, a
ll ri
ghts
res
erve
d.

Saghafian et al.: Complexity-Augmented Triage344 Manufacturing & Service Operations Management 16(3), pp. 329–345, © 2014 INFORMS
what patient to see next within examination rooms(phase 2), we find that complexity information gatheredat triage can yield additional benefits by facilitatinginternal sequencing decisions. For both phase 1 andphase 2, the benefit of complexity-augmented triage isgreatest in EDs with high physician and/or examinationroom utilization. Since EDs are widely overcrowded,our results suggest that complexity-augmented triageis an effective way for EDs to improve safety andreduce congestion without adding expensive human orphysical capacity.
We also investigate a new patient flow design, inwhich complexity-augmented triage information isused to separate simple and complex patients into twostreams. Our results suggest that it is more effective tostream patients based on their complexity and thenprioritize them within each based on their urgencythan it is to stream them according to urgency andprioritize them according to complexity. Streamingbased on complexity also facilitates implementation oflean methods in the “simple” patient stream, whichcan take advantage of complexity-augmented triageinformation to achieve even greater gains. If these gainsare substantial enough, such complexity streaming canyield significant additional benefits.
Three future streams of research that could build onour insights to achieve even better performance are(1) finding data driven rules, which correlate patientcharacteristics, symptoms and evaluations to treatmenttime and resource requirements, and can serve as thebasis of even more effective prioritization and stream-ing policies than those suggested here; (2) developingstatistical tools for tracking patient class dependentdelays in test facilities and analytic models for incorpo-rating these into phase 1 and phase 2 sequencing rules;and (3) constructing dynamic patient prioritizationsystems that make use of real-time information onpatient and resource status to sequence patients intoand through the ED. All of these enhancements couldbe used in the context of a single ED or within streamsset up to facilitate standardization efficiencies. Whetherand how the performance improvements from thesesystems can justify their implementational complexityrelative to the simple system we have proposed here isan open research question.
Supplemental MaterialSupplemental material to this paper is available at http://dx.doi.org/10.1287/msom.2014.0487.
AcknowledgmentsPartial support was provided by the National Science Foun-dation [Grants CMMI-1068638 and CMMI-1233095], andthe National Institutes of Health Clinical and TranslationalScience Award (CTSA) [Grant UL1TR000433]. The fundingorganizations had no role in the design or conduct of thisresearch.
ReferencesArgon NT, Ziya S (2009) Priority assignment under imperfect
information on customer type identities. Manufacturing ServiceOper. Management 11(4):674–693.
Baker M, Clancy M (2006) Can mortality rates for patients who diewithin the emergency department, within 30 days of dischargefrom the emergency department, or within 30 days of admissionfrom the emergency department be easily measured? EmergencyMedical J. 23(8):601–603.
Batt RJ, Terwiesch C (2012) Doctors under load: An empirical study ofstate-dependent service times in emergency care. Working paper,The Wharton School, University of Pennsylvania, Philadelphia.
Ben-Tovim DI, Bassham JE, Bennett DM, Dougherty ML, MartinMA, O’Neill JL, Sincock JL, Szwarcboard MG (2008) Redesign-ing care at the Flinders Medical Centre: Clinical processredesign using “lean thinking.” Medical J. Australia 188(6):27–31.
Brennan TA, Leape LL, Laird NM, Hebert L, Localio AR, LawthersAG, Newhouse JP, Weiler PC, Hiatt HH (1991) Incidence ofadverse events and negligence in hospitalized patients. NewEngland J. Medicine 324(6):370–376.
Buyukkoc C, Varaiya P, Walrand J (1985) The c� rule revisited. Adv.Appl. Prob. 17:237–238.
Clark JR, Huckman RS (2012) Broadening focus: Spillovers, comple-mentarities, and specialization in the hospital industry. Manage-ment Sci. 58(4):708–722.
Cobham A (1954) Priority assignment in waiting line problems. J.Oper. Res. Soc. Amer. 2:70–76.
Cobham A (1955) Priority assignment—A correction. J. Oper. Res. Soc.Amer. 3:547.
Cox DR, Smith WL (1961) Queues (Methuen & Co., London).Diercks DB, Roe MT, Chen AY, Peacock WF, Kirk JD, Pollack CV Jr,
Gibler WB, Smith SC Jr, Ohman M, Peterson ED (2007) Pro-longed emergency department stays of non-ST-segment-elevationmyocardial infarction patients are associated with worse adher-ence to the American College of Cardiology/American HeartAssociation guidelines for management and increased adverseevents. Ann. Emergency Medicine 50(5):489–496.
Dobson G, Tezcan T, Tilson V (2013) Optimal workflow desicionsfor inestigators in systems with interruptions. Management Sci.59(5):1125–1141.
Fernandes CM, Tanabe P, Gilboy N, Johnson LA, McNair RS, RosenauAM, Sawchuk P, et al. (2005) Five-level triage: A report fromthe ACEP/ ENA five-level task force. J. Emergency Nursing31(1):39–50.
FitzGerald G, Jelinek GA, Scott D, Gerdtz MF (2010) Emer-gency department triage revisited. Emergency Medicine J. 27(2):86–92.
Gardner WA, Napolitanob A, Paura L (2006) Cyclostationarity: Halfa century of research. Signal Processing 86(4):639–697.
Gilboy N, Tanabe P, Travers DA, Rosenau AM, Eitel DR (2005)Emergency Severity Index, Version 4: Implementation Handbook(Agency for Healthcare Research and Quality, Rockville, MD).
Graff LG, Wolf S, Dinwoodie R, Buono D, Mucci D (1993) Emergencyphysician workload: A time study. Ann. Emergency Medicine22(7):1156–1163.
Green L, Savin S, Wang B (2006a) Managing patient service in adiagnostic medical facility. Oper. Res. 54(1):11–25.
Green LV, Soares J, Giglio JF, Green RA (2006b) Using queuing theoryto increase the effectiveness of emergency department providerstaffing. Acad. Emergency Medicine 13(1):61–68.
Hay E, Bekerman L, Rosenberg G, Peled R (2001) Quality assuranceof nurse triage: Consistency of results over three years. Amer. J.Emergency Medicine 19(2):113–117.
Hopp WJ, Spearman ML (2008) Factory Physics, 3rd ed. (McGraw-Hill,Burr Ridge, IL).
Huang J, Carmeli B, Mandelbaum A (2012) Control of patient flowin emergency departments, or multiclass queues with deadlinesand feedback. Working paper, National University of Singapore,Singapore.
Dow
nloa
ded
from
info
rms.
org
by [
129.
219.
247.
33]
on 1
6 A
ugus
t 201
4, a
t 09:
39 .
For
pers
onal
use
onl
y, a
ll ri
ghts
res
erve
d.
Saghafian et al.: Complexity-Augmented TriageManufacturing & Service Operations Management 16(3), pp. 329–345, © 2014 INFORMS 345
Ierson KV, Moskop JC (2007) Triage in medicine, part I: Concept,history, and types. Ann. Emergency Medicine 49(3):275–281.
Jacobson EU, Argon NT, Ziya S (2012) Priority assignment inemergency response. Oper. Res. 60(4):813–832.
Kakalik JS, Little JDC (1971) Optimal service policy for the M/G/1queue with multiple classes of arrival. Report, RAND Corpora-tion, Santa Monica, CA.
KC DS, Terwiesch C (2011) The effects of focus on performance:Evidence from California hospitals. Management Sci. 57(11):1897–1912.
Keen WW (1917) The Treatment of War Wounds (W.B. Saunders,Philadelphia).
Kronick SL, Desmond JS (2009) Blink: Accuracy of physician estimatesof patient disposition at the time of ED triage. SAEM MidwestRegional Meeting, Ann Arbor, MI.
Lewis PAW, Shedler GS (1979) Simulation of nonhomogenous Poissonprocesses by thinning. Naval Res. Log. Quart. 26(3):403–413.
Lippman S (1975) Applying a new device in the optimization ofexponential queueing system. Oper. Res. 23(4):687–710.
Liu SW, Thomas SH, Gordon JA, Weissman J (2005) Frequencyof adverse events and errors among patients boarding in theemergency department. Acad. Emergency Medicine 12:49–50.
Moskop JC, Ierson KV (2007) Triage in medicine, part II: Under-lying values and principles. Ann. Emergency Medicine 49(3):282–287.
Patrick J, Putterman ML, Queyranne M (2008) Dynamic multiprioritypatient scheduling for a diagnostic resource. Oper. Res. 56(6):1507–1525.
Peck JS, Benneyan JC, Nightingale DJ, Gaehde SA (2012) Predictingemergency department inpatient admissions to improve same-day patient flow. Acad. Emergency Medicine 19(9):1045–1052.
Peck JS, Kim S-G (2010) Improving patient flow through axiomaticdesign of hospital emergency departments. CIRP J. ManufacturingSci. Tech. 2(4):255–260.
Saghafian S, Hopp WJ, Van Oyen MP, Desmond JS, Kronick SL (2012)Patient streaming as a mechanism for improving responsivenessin emergency departments. Oper. Res. 60(5):1080–1097.
Saghafian S, Van Oyen MP, Kolfal B (2011) The “W” network andthe dynamic control of unreliable flexible servers. IIE Trans.43(12):893–907.
Siddharathan K, Jones WJ, Johnson JA (1996) A priority queueingmodel to reduce waiting times in emergency care. Internat. J.Health Care Quality Assurance 9(5):10–16.
Tcha D-W, Pliska SR (1977) Optimal control of single-server queuingnetworks and multi-class M/G/1 queues with feedback. Oper.Res. 27(2):248–258.
van der Zee SP, Theil H (1961) Priority assignment in waiting-line problems under conditions of misclassification. Oper. Res.9(6):875–885.
Van Mieghem JA (1995) Dynamic scheduling with convex delaycosts: The generalized c� rule. Ann. Appl. Prob. 5(3):809–833.
Vance J, Sprivulis P (2005) Triage nurses validly and reliably estimateemergency department patient complexity. Emergency MedicineAustralasia 17:382–386.
Wang Q (2004) Modeling and analysis of high risk patient queues.Eur. J. Oper. Res. 155(2):502–515.
Dow
nloa
ded
from
info
rms.
org
by [
129.
219.
247.
33]
on 1
6 A
ugus
t 201
4, a
t 09:
39 .
For
pers
onal
use
onl
y, a
ll ri
ghts
res
erve
d.