complementary solutions for peptide mapping
TRANSCRIPT
IntroductionPeptide mapping is commonly used to identify or characterize the protein of interest. Monitoring peptide mapping is a critical part of regulatory guidelines for the characterization of biopharmaceuticals. Peptide mapping serves as a primary QC step in pharmaceutical development. It involves chemical or enzymatic treatment of protein to obtain peptide fragments, followed by separation and detection using mass spectrometry (MS). Both chromatographic and electrophoretic-separation techniques have to be employed to study peptide mapping in coupling to MS. Even though LC/MS is the most commonly used method for peptide mapping, CE/MS is an alternate method that offers additional information on peptide separation and different selectivity. This Application Note used both CE/MS and LC/MS methods to monitor peptide separation and provide the orthogonal solutions.
CE/MS and LC/MS SynergyComplementary Solutions for Peptide Mapping
Application Note
AuthorSuresh Babu CV,Agilent Technologies, Inc.Bangalore, India

2
ExperimentalCE/MSThe CE/MS analysis was performed using the Agilent 7100 CE system coupled to the Agilent 6520 Accurate-Mass Q-TOF LC/MS equipped with an electrospray source and an orthogonal coaxial sheath liquid interface (G1607B). Separations and spray stability were optimized using the blank buffers and a standard. A sheath-liquid CE/MS interface with a low fl ow rate (4 µL/min) was maintained to preserve the high effi ciency separation of CE and to provide the stable fl ow and spray conditions essential for electrospray ionization. Q-TOF parameters were optimized automatically through MS tuning programs, and the MS system was calibrated using an ESI tuning mixture.
LC/MSThe Agilent 1260 Infi nity HPLC-Chip/MS system was coupled with the Agilent 6520 Accurate-Mass Q-TOF LC/MS platform for LC/MS analyses. The HPLC-Chip/MS interface enables automatic chip loading, sample and solvent delivery to the chip, high pressure switching of fl ows, and automated and reproducible chip positioning to the MS source for accurate mass measurement.
Table 1. CE/MS and LC/MS parameters.
CE conditionsCE Agilent 7100 CESample BSA digestInjection Different injection times at 50 mbarCapillary Bare fused silica, total length 60 cm, 65 cm, 85 cm, 50 μm idBuffer 10 mM acetic acidVoltage 27 kV (0.3 minutes ramp)Temperature 20 °CPreconditioning 15 minutes fl ush with buffer at 1 barMS conditionsMS Agilent 6520 Accurate-Mass Q-TOF LC/MSIonization mode ESIAcquisition mode MS (mass range 100–3,200 m/z)Sheath liquid 0.5 % acetic acid in 50 % methanol, 4 μL/minuteDrying gas fl ow 5 L/minNebulizer 10 psiDrying gas temperature 175 °CFragmentor 175 VVcap 3,500 VLC conditionsLC Agilent 1260 Infi nity Nanofl ow LC System and an Agilent 1260 Infi nity
Capillary LC SystemSample BSA digestInjection 2 μLHPLC-Chip G4240-62005 , 5 μm, Agilent ZORBAX 300SB-C18, 40 nL enrichment column,
a 75 µm × 43 mm analytical columnFlow rate 3 μL/min (Cap pump), 0.6 μL/min (Nano pump)Solvents A) 0.1 % formic acid (FA) in water; B) 90 % ACN in water with 0.1 % FAGradient Time (min) B (%)
Initial 330 5032 9534 9534.10 3
MS conditionsMS Agilent 6540 Accurate-Mass Q-TOF LC/MSIonization mode ESIAcquisition mode MS (mass range 100–3,200 m/z)Drying gas fl ow 5 L/minNebulizer 10 psiDrying gas temperature 325 °CFragmentor 175 VVcap 3,500 V
3
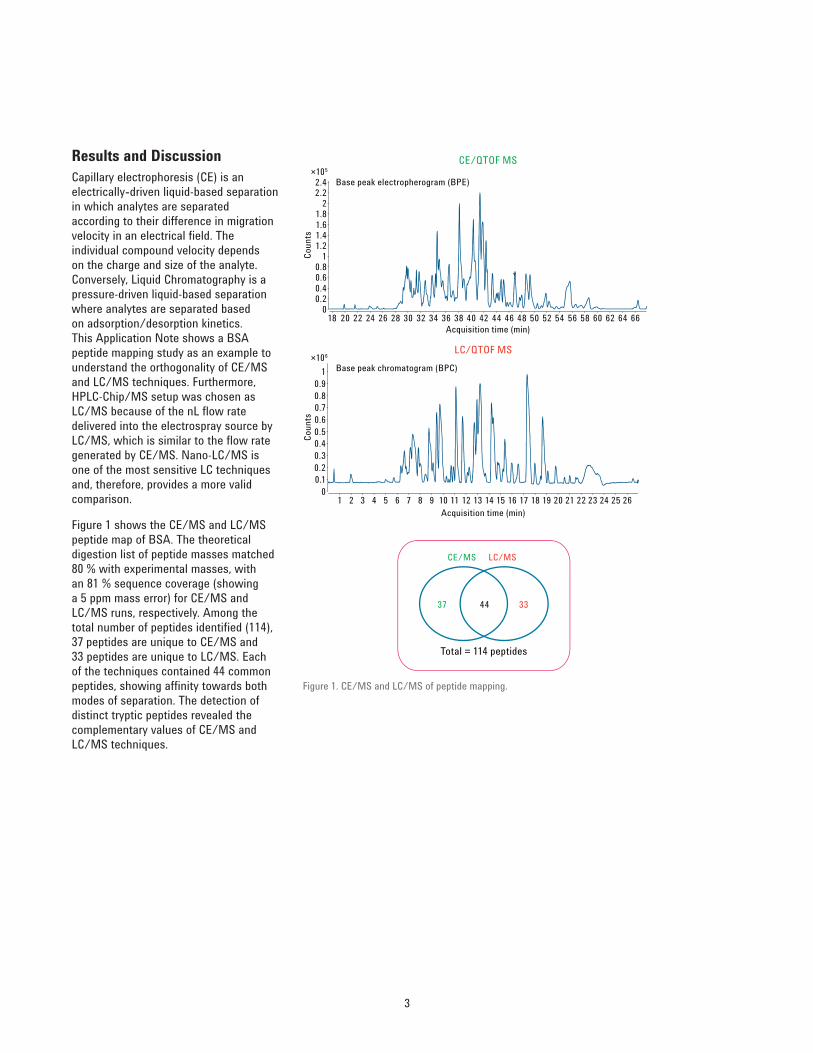
Results and DiscussionCapillary electrophoresis (CE) is an electrically-driven liquid-based separation in which analytes are separated according to their difference in migration velocity in an electrical fi eld. The individual compound velocity depends on the charge and size of the analyte. Conversely, Liquid Chromatography is a pressure-driven liquid-based separation where analytes are separated based on adsorption/desorption kinetics. This Application Note shows a BSA peptide mapping study as an example to understand the orthogonality of CE/MS and LC/MS techniques. Furthermore, HPLC-Chip/MS setup was chosen as LC/MS because of the nL fl ow rate delivered into the electrospray source by LC/MS, which is similar to the fl ow rate generated by CE/MS. Nano-LC/MS is one of the most sensitive LC techniques and, therefore, provides a more valid comparison.
Figure 1 shows the CE/MS and LC/MS peptide map of BSA. The theoretical digestion list of peptide masses matched 80 % with experimental masses, with an 81 % sequence coverage (showing a 5 ppm mass error) for CE/MS and LC/MS runs, respectively. Among the total number of peptides identifi ed (114), 37 peptides are unique to CE/MS and 33 peptides are unique to LC/MS. Each of the techniques contained 44 common peptides, showing affi nity towards both modes of separation. The detection of distinct tryptic peptides revealed the complementary values of CE/MS and LC/MS techniques.
Figure 1. CE/MS and LC/MS of peptide mapping.
37 3344
CE/MS LC/MS
Total = 114 peptides
×105
00.20.40.60.8
11.21.41.61.8
22.22.4
Acquisition time (min)
Coun
ts18 20 22 24 26 28 30 32 34 36 38 40 42 44 46 48 50 52 54 56 58 60 62 64 66
Base peak electropherogram (BPE)
CE/QTOF MS
Acquisition time (min)
Coun
ts
×106
00.10.20.30.40.50.60.70.80.9
1
1 2 3 4 5 6 7 8 9 10 11 12 13 14 15 16 17 18 19 20 21 22 23 24 25 26
Base peak chromatogram (BPC)
LC/QTOF MS

4
Given the different separation mechanisms of both techniques, the analytes elution order of the CE/MS profi le will be different than the LC/MS profi le. Elution orders are dictated by hydrophobicity and mobility. Figure 2 depicts the change in elution order for the same set of BSA peptides. Different selectivity is the reason for the altered elution order for both techniques, which is caused by their different physical separation principles. In CE, the change in selectivity can be obtained by simply switching to a different pH of the background electrolyte (run buffer). However, different column chemistry and solvent set are required in LC to make major selectivity changes.
Usually, hydrophilic compounds do not retain well, and elute quickly, on reverse-phase materials such as a C18 column. Figure 3 shows the CE/MS and LC/MS results for two hydrophilic peptides. The ATEEQLK peptide was hardly detected in LC/MS, whereas CE/MS produced better signals for all the hydrophilic peptides shown. CE/MS also produced a better peak shape for TCVADESHAGCEK peptide.
×105
×105
00.40.81.21.6
22.42.83.23.6
*
19 21 23 25 27 29 31 33 35 37 39 41 43 45 47 49 51 53 55 57 59 61 63 65
6311
1212
4
5
79
10
8
0123456789
*
1 2 3 4 5 6 7 8 9 10 11 12 13 14 15 16 17 18 19 20 21 22 23 24 25 26
1
12
3
7
109
5
2
116
8
4
A CE/QTOF MS
LC/QTOF MSBAcquisition time (min)
Acquisition time (min)
Coun
tsCo
unts
Figure 2. (A) CE/QTOF MS and (B) LC/QTOF MS separation comparison of same set of BSA tryptic peptides. Peptides: 1. LCVLHEK, 2. HLVDEPQNLIK, 3. NYQEAK, 4. QTALVELLK, 5. YLYEIAR, 6. ECCHGDLLECADDR, 7. LVTDLTK, 8. LVNELTEFAK, 9. AEFVEVTK, 10. LCVLHEKTPVSEK, 11. LVVSTQTA, 12. DDSPDLPK.
Figure 3. CE/MS and LC/MS comparison of hydrophilic peptide behavior.
00.40.81.2
5 10 15 20 25 30 35 40 45 50 55 60 65 70
01234
5 10 15 20 25 30 35 40 45 50 55 60 65 70
01234
2 4 6 8 10 12 14 16 18 20 22 24 26 28 30 32 34
00.40.81.21.6
2 4 6 8 10 12 14 16 18 20 22 24 26 28 30 32 34
EIE 409.7127 (2+)Time 40.19 minutes
EIC 409.7127 (2+)Time 1.31 minutes
EIC 732.2940 (2+)Time 1.97 minutesEIE 732.2940 (2+)
Time 38.04 minutes
ATEEQLK
TCVADESHAGCEK
CE/QTOF MS LC/QTOF MS
×105
×105×104
×103
Acquisition time (min) Acquisition time (min)
Coun
tsCo
unts
Coun
tsCo
unts
5
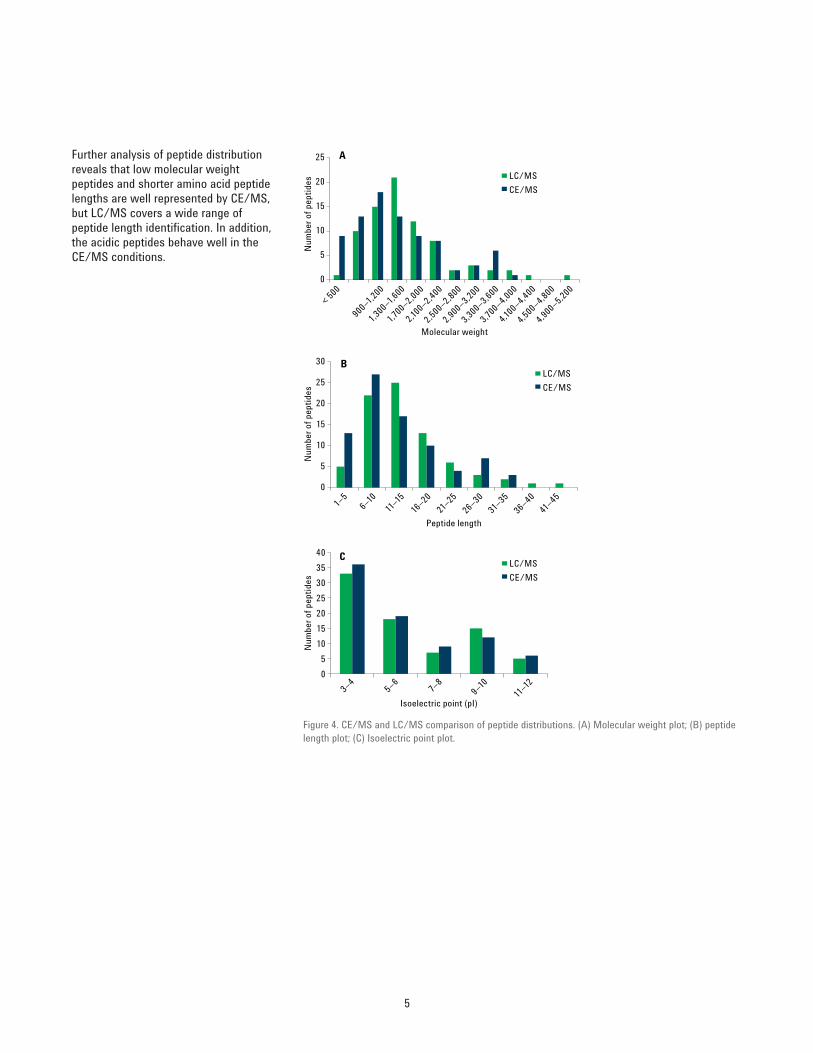
Further analysis of peptide distribution reveals that low molecular weight peptides and shorter amino acid peptide lengths are well represented by CE/MS, but LC/MS covers a wide range of peptide length identifi cation. In addition, the acidic peptides behave well in the CE/MS conditions.
0
5
10
15
20
25
Num
ber o
f pep
tides
Molecular weight
LC/MSCE/MS
< 500
900–1,
200
1,300
–1,60
0
1,700
–2,000
2,100
–2,400
2,500
–2,800
2,900
–3,200
3,300
–3,600
3,700
–4,000
4,100
–4,400
4,500
–4,800
4,900
–5,200
A
1–5
6–10 11–15
16–2021–
2526
–3031–
3536
–4041–
45
LC/MSCE/MS
0
5
10
15
20
25
30
Num
ber o
f pep
tides
Peptide length
B
3–45–6
7–8
9–10 11–12
LC/MSCE/MS
05
10152025303540
Num
ber o
f pep
tides
Isoelectric point (pI)
C
Figure 4. CE/MS and LC/MS comparison of peptide distributions. (A) Molecular weight plot; (B) peptide length plot; (C) Isoelectric point plot.

www.agilent.com/chem
This information is subject to change without notice.
© Agilent Technologies, Inc., 2013Published in the USA, September 1, 20135991-2583EN
CE/QTOF MS (Agilent 6520 Accurate-Mass Q-TOF LC/MS)
LC/QTOF MS (Chipcube-Agilent 6540 Accurate-Mass Q-TOF LC/MS)
Sample injected 44 nL (0.34 pmole) 2 µL (15 pmole)Peptide elution window 30 minutes 16 minutesSequence coverage 80 % 81 %Total peptides identifi ed 82 78Distinct peptides identifi ed 37 33Selectivity and resolution Change in the elution order of peptide shows the complementary value
of the two techniquesSelectivity CE/MS shows the best separation/ionization for hydrophilic peptidesPeptide distribution Shorter peptides are represented
(1–5 amino acid peptide length) Shorter peptides are less represented (1–5 amino acid peptide length) and also cover a wide range of peptide length
Identifi ed peptides starting with three amino acid length
Identifi ed peptides starting with four amino acid length
Low MW peptides are well represented (< 500 Da)
Low MW peptides are less represented (< 500 Da)
Acidic peptides (pI 3-4) are well represented
ConclusionThe comparison study done in this Application Note shows the advantages of both CE/MS and LC/MS techniques (Table 2). It is demonstrated that both CE/MS and LC/MS techniques provide additional information and, thereby, serve as an orthogonal and complementary approach for separating peptides.
Table 2. Advantages of CE/MS and LC/MS techniques.