complementary and alternative medicine in canada: · pdf filecomplementary and alternative...
TRANSCRIPT
SOURCESPUBLIC POLICY
Complementary and AlternativeMedicine in Canada: Trends in Useand Public Attitudes, 1997-2006
by Nadeem Esmail, The Fraser Institute
ContentsExecutive Summary . . . . . . . . . . . . . . . . . . . . . . . . . . . . . . . . . . . . . . . . . . . . . . . . . 3Introduction . . . . . . . . . . . . . . . . . . . . . . . . . . . . . . . . . . . . . . . . . . . . . . . . . . . . . . . 6Methodology in Brief . . . . . . . . . . . . . . . . . . . . . . . . . . . . . . . . . . . . . . . . . . . . . . . . . 7Results . . . . . . . . . . . . . . . . . . . . . . . . . . . . . . . . . . . . . . . . . . . . . . . . . . . . . . . . . . . . . 9Discussion . . . . . . . . . . . . . . . . . . . . . . . . . . . . . . . . . . . . . . . . . . . . . . . . . . . . . . . . . 38Appendix A: Detailed Survey Methodology . . . . . . . . . . . . . . . . . . . . . . . . . . . . . 40Appendix B: Descriptions of Select Complementary andAlternative Medicines and Therapies . . . . . . . . . . . . . . . . . . . . . . . . . . . . . . . . . . 45Acknowledgements . . . . . . . . . . . . . . . . . . . . . . . . . . . . . . . . . . . . . . . . . . . . . . . . . . 52References . . . . . . . . . . . . . . . . . . . . . . . . . . . . . . . . . . . . . . . . . . . . . . . . . . . . . . . . . . 53About the Author . . . . . . . . . . . . . . . . . . . . . . . . . . . . . . . . . . . . . . . . . . . . . . . . . . . 53
NUMBER 87 / MAY 2007
A FRASER INSTITUTE OCCASIONAL PAPER
Public Policy Sources is published periodically throughout the year by The Fraser Institute, Vancouver, B.C.,Canada.
The Fraser Institute’s vision is a free and prosperous world where individuals benefit from greater choice,competitive markets, and personal responsibility. Our mission is to measure, study, and communicate theimpact of competitive markets and government interventions on the welfare of individuals. Founded in 1974,we are an independent research and educational organization with offices in Vancouver, Calgary, and Toronto,and international partners in over 70 countries. Our work is financed by tax-deductible contributions fromthousands of individuals, organizations, and foundations. In order to protect its independence, the Institutedoes not accept grants from government or contracts for research.
For additional copies, or to become a supporter, write or callThe Fraser Institute, 4th Floor, 1770 Burrard Street, Vancouver, BC, Canada V6J 3G7Telephone: (604) 688-0221; Fax: (604) 688-8539Toll-free order line: 1-800-665-3558 (ext. 580—book orders; ext. 586—development).
Visit our web site at www.fraserinstitute.ca
Editor & Designer: Kristin McCahon
For media information, please contact Dean Pelkey, Associate Director of Communications, (604) 714-4582 ore-mail [email protected]
To order additional copies, write or callThe Fraser Institute, 4th Floor, 1770 Burrard Street, Vancouver, B.C., V6J 3G7Toll-free order line: 1-800-665-3558; Telephone: (604) 688-0221, ext. 580; Fax: (604) 688-8539In Toronto, call (416) 363-6575, ext. 580; Fax: (416) 601-7322In Calgary, call (403) 216-7175; Fax: (403) 234-9010
Copyright82007 The Fraser Institute. All rights reserved. No part of this monograph may be reproduced in anymanner whatsoever without written permission except in the case of brief quotations embodied in critical arti-cles and reviews.
The author of this study has worked independently and opinions expressed by him are, therefore, his own, anddo not necessarily reflect the opinions of the supporters or trustees of The Fraser Institute.
Printed and bound in Canada. ISSN 1206-6257
Date of issue: May 2007
Executive Summary
Background
In 1999, The Fraser Institute published the first evercomprehensive study of Canadians’ use of and publicattitudes towards complementary and alternativemedicine (CAM) (Ramsay et al., 1999). In the yearssince that survey, the health care world has changedsignificantly. These changes led to the question ofwhether or not, and to what degree Canadians’ use ofand public attitudes towards CAM, such aschiropractic, naturopathic, and herbal therapies,had changed since 1997. To answer this question,The Fraser Institute commissioned Ipsos Reid toconduct a second Canadian national survey to de-termine the prevalence, costs, and patterns of CAMuse in 2006.
Methodology
The methodology used in the 2006 survey was inmost cases similar to that used in the first survey(1997). In 2006, a total of 2,000 interviews were con-ducted with a randomly selected sample of adults 18years of age and older. This increase of 500 interviewsfrom the 1,500 completed in 1997 was implementedto allow greater statistical accuracy in examiningchanges between 1997 and 2006.1 In order to mini-mize any potential seasonal bias in responses, the2006 survey was completed at the same time of yearas the 1997 survey. In 2006, the response rate was 18.8percent, compared to a response rate of 25.7 percentin 1997. The drop in the response rate from 1997 islargely driven by a secular trend in lower survey re-sponses.
Respondents were asked to report any healthconditions, details of their use of conventional medi-cal services in treating their conditions, and whetherthey had tried any alternative therapies as treatmentfor these conditions. With respect to alternativemedicine use, respondents were asked to indicatewhether they had used any of 22 commonly usedcomplementary and alternative medicines and ther-apies. Lastly, respondents were also asked abouttheir attitudes toward health, health care, medicalcare, and public policy.
Results
With respect to self-reported health, little haschanged between 1997 and 2006. In both cases, morethan 60 percent of respondents reported their healthto be very good or excellent, and 11 percent of re-spondents reported their health to be fair or poor.Less than one fifth (18% in 2006 and 19% in 1997) felttheir daily activities were limited by their health. Themost common health conditions reported in the 12months prior to both the 2006 and 1997 surveys wereallergies (29% each time), back or neck problems (28%and 30%) and arthritis or rheumatism (21% and 20%).
With respect to the use of conventional healthcare services, 87 percent of respondents in 2006“usually” sought medical care from a particular doc-tor’s office, clinic or health centre, compared to 88percent in 1997. On the other hand, only 80 percentof respondents in 2006 “usually” saw a particulardoctor, a 2 percentage point decrease from 1997(82%). As Canadians’ confidence in their physiciansincreases, so does the likelihood that they will seek
The Fraser Institute 3 Complementary and Alternative Medicine
1 With regard to the accuracy of the findings, there is a 95 percent chance that the average values for the entire Canadian populationare within 2.2 percentage points of the survey percentages in 2006. In 1997, the margin of error was 2.5 percentage points. In addi-tion, the increase in the number of interviews completed in 2006 allows for 95 percent statistical confidence in detecting a 3 percent-age point change in the percent of Canadians who have used complementary and alternative medical therapies sometime in theirlives (73% in 1997).
care from a particular doctor’s office or clinic—a pat-tern similar to that in 1997. In both 2006 and 1997,73 percent of respondents had “total” or “a lot” ofconfidence that their doctor could help them man-age their overall health. On average, 73 percent ofrespondents suffering from one of the conditionslisted sought medical attention for their health prob-lems during the previous year in 2006, as was the casein 1997. Those people who received care for theircondition in the year prior to the survey in both 2006and 1997 often felt that care was very or somewhathelpful (81% and 77%, on average, respectively).With respect to prescription medicine use, nearlyhalf of respondents (47%) said they’re taking pre-scription medication in 2006, a significant increase of8 percentage points since 1997, when 39 percentanswered “yes” to the same question.
In 2006, nearly three-quarters of Canadians(74%) had used at least one alternative therapy some-time in their lives. This is very similar to the propor-tion of Canadians in 1997 (73%), suggesting thatthere has been no change in the overall usage of com-plementary and alternative medicine or therapiesover the past nine years. In 2006, Albertans (84%)were most likely to have used an alternative therapyduring their lifetime, followed closely by BritishColumbians (83%), while Quebecers (67%) andAtlantic Canadians (63%) were least likely to havedone so. Similar patterns were observed in 1997,though in that year British Columbians were mostlikely (84%) and Quebecers least likely (66%) to haveused an alternative therapy during their lifetime.
In 2006, chiropractic care was the most commontype of therapy used by Canadians over their lifetime,with 40 percent having tried it—a significant 4 per-centage point increase over 1997. Thirty-five percentof Canadians had tried massage by 2006, a significantincrease of 12 percentage points from 1997. Relax-ation techniques (20%) and prayer (18%) came nexton the list of most commonly tried alternative thera-
pies in 2006, and, in both cases, the percentage ofCanadians who had tried these therapies had fallensince 1997, though the decreases were not statisti-cally significant. Acupuncture rounded out the fivemost common therapies used by Canadians overtheir lifetime, with 17 percent of Canadians havingused acupuncture (a statistically significant increaseof 5 percentage points from 1997).
In 2006, more than one-half (54%) of Canadiansreported using at least one alternative therapy in theyear prior to the survey, which was a statistically sig-nificant 4 percentage point increase over the rate ofuse in 1997 (50%). In the 12 months prior to the 2006survey, the most commonly used complementaryand alternative medicines and therapies were massage(19%), prayer (16%), chiropractic care (15%), relax-ation techniques (14%), and herbal therapies (10%).Though the top 5 list was the same in 1997, the orderwas different.
Canadians used alternative therapies an averageof 8.6 times during the year previous to the 2006 sur-vey, which was similar to their use in 1996/97 (8.7times). Most people choosing to use alternative ther-apies in the 12 months preceding the survey did so toprevent future illness from occurring or to maintainhealth and vitality. Of those who used alternativemedicine in the 12 months prior, 53 percent ofrespondents in 2006 (down slightly from 56 percentin 1997) had not discussed their use of alternativemedicine with their doctor.
The average amount paid out of pocket per userto an alternative health care provider in the yearprior to the survey in 2006 was $173, which was a siz-able increase from the $93 paid out of pocket onaverage in 1997.2 Extrapolation for the Canadianpopulation suggests that during the latter half of2005 and first half of 2006, Canadians spent morethan $5.6 billion out of pocket on visits to providersof alternative medicine, compared to nearly $2.8 bil-lion in 1997. If the additional money spent on books,
Complementary and Alternative Medicine 4 The Fraser Institute
PUBLIC POLICY SOURCES, NUMBER 87
2 Spending figures for 1997 are shown in 2006 dollars (adjusted from 1997 to 2006 dollars using Statistics Canada’s CPI).
medical equipment, herbs, vitamins, and special dietprograms is included, the estimated total out ofpocket spending on alternative medicine in Canadaincreases to an estimated $7.84 billion in the latterhalf of 2005 and first half of 2006. This is a consider-able increase over the $5.37 billion estimated to havebeen spent in the 12 months prior to the 1997 survey.
Despite the large out-of-pocket expenses thatCanadians are incurring to use complementary andalternative medicine, the majority believe that itshould be covered privately and not be included inprovincial health plans (59% in 2006 and 58% in1997).3 With respect to what is covered in provincialhealth plans, 39 percent of respondents in 2006 feltthat these decisions should be made by all health careproviders, both alternative and conventional (upslightly from 37 percent in 1997). Rarely was theappropriate decision maker seen to be the provincialministry of health (16%, up from 13% in 1997), thefederal ministry of health (11%, up from 9% in 1997),the regional health authorities (9% in both years), orthe general public (1%, down from 3% in 1997).
Conclusions
The majority of Canadians have tried complemen-tary and alternative medicines and therapies at somepoint during their life, despite the fact that coverageof such treatments by government health insuranceplans is usually restricted. However, doctors are stillthe main providers of health care in Canada. Almosthalf of the respondents in 2006 saw a doctor beforeturning to a provider of alternative therapy. In addi-
tion, a higher proportion of respondents saw a medi-cal doctor in comparison with the proportion ofrespondents seeing a provider of alternative therapyfor their condition regarding treatment of 8 of the 10most common medical conditions (some saw both).
Private, out of pocket expenditures on comple-mentary and alternative medicines and therapies arenot insubstantial, which helps explain why there hasbeen so much discussion about government policyand insurance coverage regarding alternative thera-pies in Canada. Before considering adding alterna-tive medicines to publicly funded insuranceprograms, however, governments should note thatdespite incurring large out of pocket expenses, themajority of Canadians believe that alternative thera-pies should be covered privately, and not by provin-cial health plans. Most importantly, the highest levelof support for private payment came from the groupthat used alternative therapy the most: 58 percent of18- to 34-year-olds used alternative therapies in the12 months prior to the 2006 survey, and 62 percentof them preferred that individuals pay for it privately.
The regional variations in attitudes towardhealth care (both conventional and alternative)revealed by this survey suggest that any effort tocreate national alternative medicine programs willnot likely succeed. For example, British Columbiansand Albertans were more likely to perceive value inalternative therapies than residents of other prov-inces, while Atlantic Canadians were mostsceptical. National consensus on such issues seemsimprobable.
The Fraser Institute 5 Complementary and Alternative Medicine
PUBLIC POLICY SOURCES, NUMBER 87
3 The interesting results in this data could be, to some extent, a function of sequencing. In other words, the fact that respondents wereasked about how these services should be paid for if funded by provincial governments before they were asked about whether or notsuch services should be privately or publicly funded could have had an effect on how they answered this question.
Introduction
In 1999, The Fraser Institute published the first evercomprehensive study of Canadians’ use of and publicattitudes towards complementary and alternativemedicine (CAM) (Ramsay et al., 1999). The term“complementary and alternative medicines” is usu-ally used to describe medical therapies, practices, andproducts that are not typically seen as a part of con-ventional medicine, or that are not taught widely inmedical schools or commonly available in NorthAmerican hospitals.4 Broadly, the 1999 study foundthat the majority of Canadians had used at least onecomplementary or alternative therapy in their life-time (73%). The study also discovered that the major-ity of Canadians (58%) felt that CAM should becovered privately and not be included in provincialhealth plans.
In the years since that survey, the health careworld has changed significantly. In addition toimprovements in conventional medicine’s ability todeal with and treat pain and disease there has alsobeen a growth in the public’s knowledge about whathealth care can do, partly fuelled by improved accessto vast quantities of information via the Internet.These changes led to the question of whether or not,and to what degree, Canadians’ use of and public atti-tudes towards CAM had changed since 1997.5
To answer this question, Ipsos Reid was onceagain commissioned to re-examine the issue in a fol-low-up survey in 2006. The objectives of the 2006survey were essentially unchanged from 1997:
• Examine patterns of general use of health careservices
• Examine the prevalence and patterns of use ofcomplementary and alternative therapies
• Examine the use of specific CAM therapies andconditions for which these therapies are em-ployed
• Examine expenditures on CAM
• Examine views on health care policy optionswith respect to CAM, including desires for policyaction in this area and attitudes about resourceallocation within the health care system
• Examine attitudes and perceptions of CAM
This paper begins with a brief presentation ofthe methodology employed for the survey includ-ing important changes in the methodologybetween 1997 and 2006. An analysis of the surveyresults follows, beginning with a description of thesample. Survey results are then given by section inthe following order: general use of health care ser-vices, use of conventional medical treatments forhealth conditions, use of complementary andalternative therapies, children’s use of alternativetherapies, use of conventional and alternative pro-viders of care, attitudes towards complementaryand alternative therapies, national projections ofuse and expenditures, and views on health policyvariables. The paper closes with a brief discussionof the survey findings.
Complementary and Alternative Medicine 6 The Fraser Institute
4 The National Center for Complementary and Alternative Medicine in the United States, which is a component of the National Insti-tutes of Health, defines complementary and alternative medicine as: “a group of diverse medical and health care systems, practices,and products that are not presently considered to be part of conventional medicine. While some scientific evidence exists regardingsome CAM therapies, for most there are key questions that are yet to be answered through well-designed scientific studies—ques-tions such as whether these therapies are safe and whether they work for the diseases or medical conditions for which they are used”(NCCAM, 2002). Eisenberg et al. (1998), upon whose work The Fraser Institute’s survey is based, use the functional definition: “in-terventions neither taught widely in medical schools nor generally available in US hospitals.”
5 This paper does not make any judgments about the value of alternative and/or complementary medicine. The use of these termsdoes not mean in any way that the author is suggesting that the health treatments surveyed are either safe or unsafe, effective or inef-fective substitutes or complements for conventional medicine and medical treatments.
Methodology in Brief
The methodology used in the 2006 follow-up surveywas in most cases similar to that used in the first sur-vey (1997). The methodology used in both the 1997and 2006 surveys is described below with the differ-ences between the two highlighted in the text. (For amore complete description of the methodology, see“Appendix A: Detailed Survey Methodology.”)
As in 1997, The Fraser Institute commissionedIpsos Reid (then Angus Reid Group) to conduct atelephone survey of Canadians about their healthstatus and their attitudes towards, and patterns ofuse of, conventional and alternative health care.Respondents were informed that Ipsos Reid, a pro-fessional opinion research company, was conductinga survey of Canadians “to learn more about theirhealth care practices and the types of therapies andtreatments they use.”6 In the selection of respon-dents there was no mention of complementary,alternative, or unconventional therapies.
In 2006, a total of 2,000 interviews were con-ducted with a randomly selected sample of adults 18years of age and older. This increase of 500 inter-views from the 1,500 completed in 1997 was imple-mented to allow greater statistical accuracy inexamining changes between 1997 and 2006. In orderto minimize any potential seasonal bias in responses,the 2006 survey was completed at the same time ofyear as the 1997 survey.
With regard to the accuracy of the findings, thereis a 95 percent chance that the average values for theentire Canadian population are within 2.2 percent-age points of the survey percentages in 2006. In 1997,the margin of error was 2.5 percentage points. Inaddition, the increase in the number of interviewscompleted in 2006 allows for 95 percent statisticalconfidence in detecting a 3 percentage point change
in the percent of Canadians who have used comple-mentary and alternative medical therapies sometimein their lives (it was 73 percent in 1997).
The original survey questionnaire used in 1997was based on a survey used by the Center for Alter-native Medicine Research (based at Harvard Medi-cal School and Beth Israel Hospital) in itspioneering work on alternative medicine use andcosts in the United States. This work was publishedin the New England Journal of Medicine in 1993,and followed up with a survey published in the Jour-nal of the American Medical Association in 1998(Eisenberg et al., 1993; Eisenberg et al., 1998). TheFraser Institute and Ipsos Reid (then Angus ReidGroup) made several modifications in order tomake the survey appropriate for Canada in 1997,given that the health insurance systems of the twocountries differ substantially. The 2006 follow-upsurvey used essentially the same survey question-naire employed in the 1997 survey. However, due toa secular trend in lower survey response resultingfrom the changing environment within which pub-lic opinion polling is being conducted, some adjust-ments were made to keep questionnaire length at orbelow 20 minutes.
The most significant change made to the surveywas a split-sampling of the sections on beliefs andperceptions and health care policy options. Ques-tions in both of these sections were asked to 200 ofthe respondents, while 900 respondents answeredonly questions on beliefs and perceptions, and theremaining 900 answered only questions on healthcare policy options. This change allowed for a signifi-cant reduction in interviewing time and had only asmall impact on the statistical power of the follow-upsurvey.7 In addition, having 200 respondents answer
The Fraser Institute 7 Complementary and Alternative Medicine
6 There may be some unknown bias in the responses to this survey, as respondents to the questionnaire may be more interested inhealth and health issues than the general population.
questions in both sections made allowances for test-ing and controlling for any potential bias that wasintroduced by the split sampling. Ipsos Reid con-cluded that there were no systematic differences inthe responses that would indicate any bias.
Two additional less-significant changes weremade in 2006: in the section on policy variables, thequestion on support for a government-fundedhealth savings account was dropped, and demo-graphic questions on ethnicity and religious prefer-ence were dropped.
Following these changes, the 2006 questionnairetook an average of 18.4 minutes to complete. The1997 survey questionnaire took an average of 28minutes to complete.
In 2006, the response rate was 18.8 percent(2,000 out of 10,624). This compares to a responserate of 25.7 percent (1,500 out of 5,827) in 1997. Thedrop in the response rate from 1997 is largely drivenby the secular trend in lower survey responses men-tioned above.8
The final sample was weighted by age and genderto ensure that the proportions of Canadians in eachage and gender category accurately reflect the actualproportions in the Canadian population.9 Because thequestionnaire inquired about the use of alternativemedicine during the 12 months preceding the inter-view, 1997 results correspond to the latter half of1996 and first half of 1997 while 2006 results corre-spond to the latter half of 2005 and first half of 2006.
Complementary and Alternative Medicine 8 The Fraser Institute
PUBLIC POLICY SOURCES, NUMBER 87
7 For example, had the sample size for the full survey been reduced from 2,000 respondents to 1,100 respondents, the observed changerequired in the share of Canadians who had ever used complementary and alternative therapies for 95 percent statistical confidencewould have grown from 3 percentage points to 4.
8 According to Ipsos Reid, response rates in a general population survey 8 to 10 years ago were normally in the 25 to 30 percent range,compared to the 18 to 20 percent range today.
9 Due to improvements in the sampling preparation methodology, the survey responses for 1997 have been updated and restated inthis publication.
Results
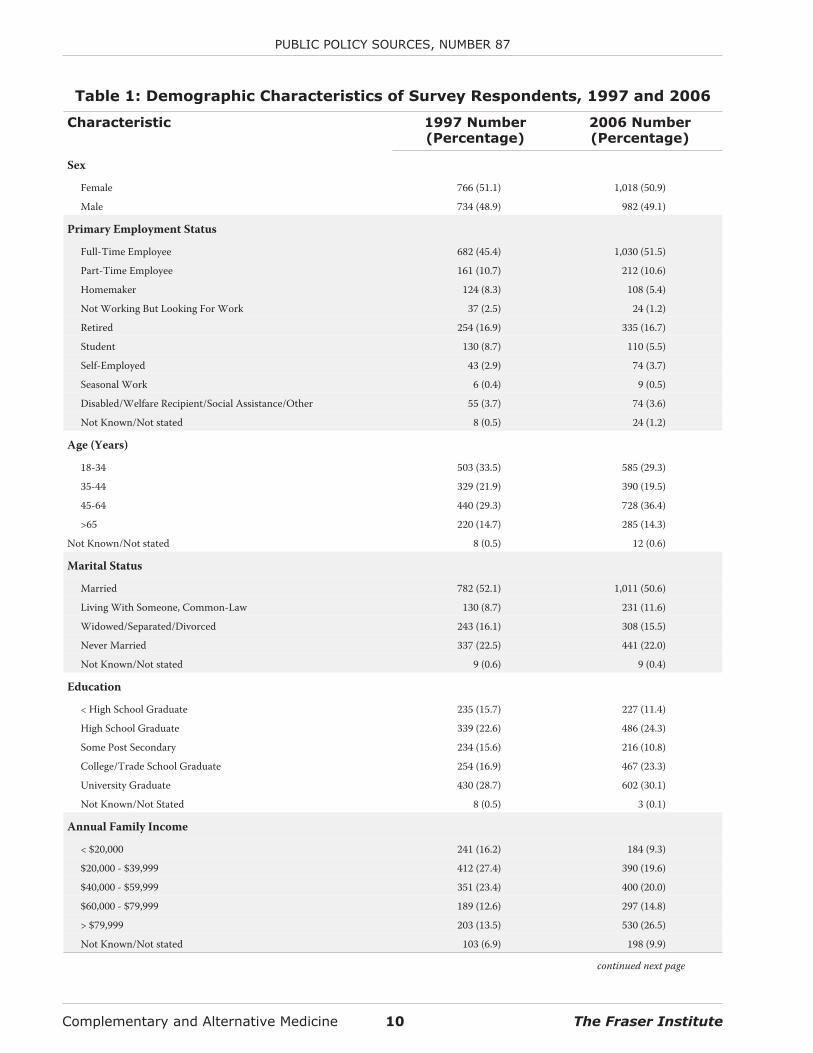
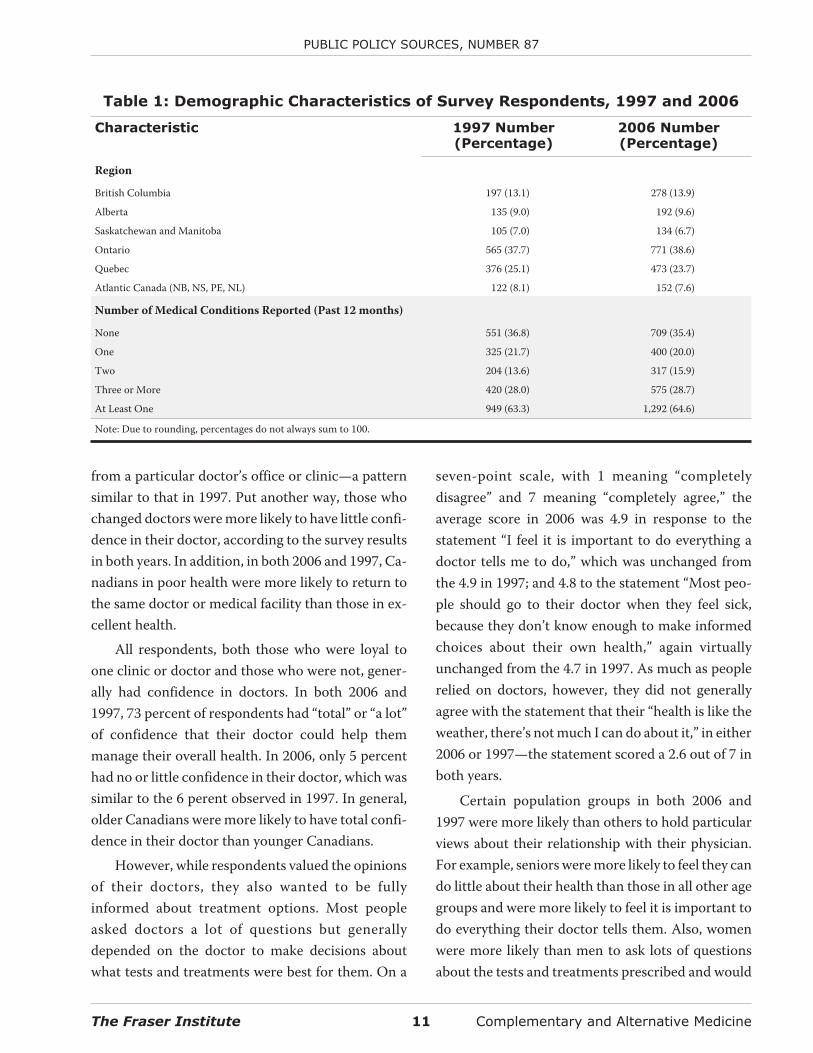
Table 1 summarizes the demographic characteristicsof the survey respondents. In general, the sample de-mographics are little changed from those in 1997.There is, however, a notable difference in the averageage of respondents, which broadly reflects the ageingof the Canadian population as a whole. In addition, re-spondents in 2006 were more likely to have reached ahigher level of education and more likely to have afamily income over $60,000 than respondents in 1997.
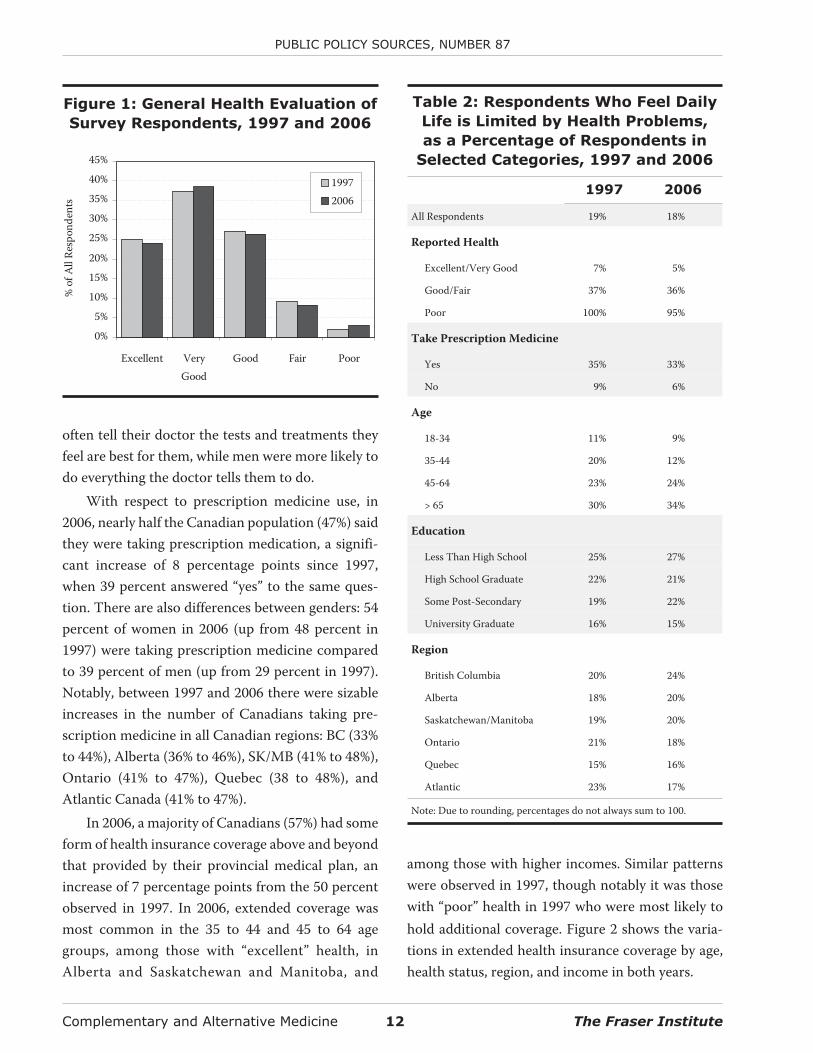
With respect to self-reported health (shown infigure 1), little has changed between 1997 and 2006.In both cases, more than 60 percent of respondentsreported their health to be very good or excellent,and 11 percent of respondents reported their healthto be fair or poor.
Table 2 gives the proportion of respondents whofelt their daily activities were limited by their health.In 2006, 18 percent of respondents said they haveproblems that limit them in some way in their dailylife. This proportion was almost unchanged from the19 percent of respondents in 1997. As was the case in1997, the data show that, in 2006, limitations on dailylife due to health problems increase with age anddecrease with level of education. Significantly fewerCanadians aged 35 to 44 felt limited by their health in2006 than in 1997. Also interesting to note is that, in2006, British Columbians were more likely to feellimited by their health than residents of the otherprovinces.
In 2006, there was a statistically significant 4 per-centage point increase in the number of Canadianswho had not spent a single day in bed—at home or inhospital—in the 12 months prior to the survey due toillness or injury (53 percent in 2006 versus 49 percentin 1997). In both years, 22 percent of respondentsspent one or two days in bed. In 2006, 14 percentwere bedridden for three to nine days compared to18 percent in 1997. Finally, 10 percent of respon-dents in both 2006 and 1997 spent ten or more days
in bed during the previous year. In 2006, respondentsreported an average of 6 days in bed during the previ-ous 12 months due to illness or injury compared to 7days in 1997. Interestingly, among those who spentat least one day in bed, there was an increase in theaverage number of days women spent in bed (13.5 in1997 to 15.1 in 2006) while there was a decrease (12.4to 9.1) for men, though it should be noted that neitherchange was statistically significant.
In the 30 days prior to the 2006 survey, 26 percentof respondents reported having to cut down on theiractivity levels because of illness, a proportion largelyunchanged from that in 1997 (24%). However, theproportion of respondents who had to cut down onwhat they did because of illness for 10 or more days in2006 increased a statistically significant 2 percentagepoints from the 10 percent observed in 1997.
In both 1997 and 2006, the number of days dur-ing which activity was reduced due to illness rose asreported health status decreased, rose for those tak-ing prescription medicines, rose for those reportinglimits on daily living due to their health, andincreased with age. In 2006, women had to reducetheir activities more frequently than men (3.9 dayson average versus 2.9 for men), a difference that wasstatistically significant. In 1997, there was no statisti-cally significant difference between the genders.
General use of
health care services
Eighty-seven percent of respondents in 2006 “usu-ally” sought medical care from a particular doctor’soffice, clinic, or health centre, compared to 88 per-cent in 1997. On the other hand, only 80 percent ofrespondents in 2006 “usually” saw a particular doc-tor, a 2 percentage point decrease from 1997 (82%).As Canadians’ confidence in their physicians in-creases, so does the likelihood that they will seek care
The Fraser Institute 9 Complementary and Alternative Medicine
Complementary and Alternative Medicine 10 The Fraser Institute
PUBLIC POLICY SOURCES, NUMBER 87
Table 1: Demographic Characteristics of Survey Respondents, 1997 and 2006
Characteristic 1997 Number(Percentage)
2006 Number(Percentage)
Sex
Female 766 (51.1) 1,018 (50.9)
Male 734 (48.9) 982 (49.1)
Primary Employment Status
Full-Time Employee 682 (45.4) 1,030 (51.5)
Part-Time Employee 161 (10.7) 212 (10.6)
Homemaker 124 (8.3) 108 (5.4)
Not Working But Looking For Work 37 (2.5) 24 (1.2)
Retired 254 (16.9) 335 (16.7)
Student 130 (8.7) 110 (5.5)
Self-Employed 43 (2.9) 74 (3.7)
Seasonal Work 6 (0.4) 9 (0.5)
Disabled/Welfare Recipient/Social Assistance/Other 55 (3.7) 74 (3.6)
Not Known/Not stated 8 (0.5) 24 (1.2)
Age (Years)
18-34 503 (33.5) 585 (29.3)
35-44 329 (21.9) 390 (19.5)
45-64 440 (29.3) 728 (36.4)
>65 220 (14.7) 285 (14.3)
Not Known/Not stated 8 (0.5) 12 (0.6)
Marital Status
Married 782 (52.1) 1,011 (50.6)
Living With Someone, Common-Law 130 (8.7) 231 (11.6)
Widowed/Separated/Divorced 243 (16.1) 308 (15.5)
Never Married 337 (22.5) 441 (22.0)
Not Known/Not stated 9 (0.6) 9 (0.4)
Education
< High School Graduate 235 (15.7) 227 (11.4)
High School Graduate 339 (22.6) 486 (24.3)
Some Post Secondary 234 (15.6) 216 (10.8)
College/Trade School Graduate 254 (16.9) 467 (23.3)
University Graduate 430 (28.7) 602 (30.1)
Not Known/Not Stated 8 (0.5) 3 (0.1)
Annual Family Income
< $20,000 241 (16.2) 184 (9.3)
$20,000 - $39,999 412 (27.4) 390 (19.6)
$40,000 - $59,999 351 (23.4) 400 (20.0)
$60,000 - $79,999 189 (12.6) 297 (14.8)
> $79,999 203 (13.5) 530 (26.5)
Not Known/Not stated 103 (6.9) 198 (9.9)
continued next page
from a particular doctor’s office or clinic—a patternsimilar to that in 1997. Put another way, those whochanged doctors were more likely to have little confi-dence in their doctor, according to the survey resultsin both years. In addition, in both 2006 and 1997, Ca-nadians in poor health were more likely to return tothe same doctor or medical facility than those in ex-cellent health.
All respondents, both those who were loyal toone clinic or doctor and those who were not, gener-ally had confidence in doctors. In both 2006 and1997, 73 percent of respondents had “total” or “a lot”of confidence that their doctor could help themmanage their overall health. In 2006, only 5 percenthad no or little confidence in their doctor, which wassimilar to the 6 perent observed in 1997. In general,older Canadians were more likely to have total confi-dence in their doctor than younger Canadians.
However, while respondents valued the opinionsof their doctors, they also wanted to be fullyinformed about treatment options. Most peopleasked doctors a lot of questions but generallydepended on the doctor to make decisions aboutwhat tests and treatments were best for them. On a
seven-point scale, with 1 meaning “completelydisagree” and 7 meaning “completely agree,” theaverage score in 2006 was 4.9 in response to thestatement “I feel it is important to do everything adoctor tells me to do,” which was unchanged fromthe 4.9 in 1997; and 4.8 to the statement “Most peo-ple should go to their doctor when they feel sick,because they don’t know enough to make informedchoices about their own health,” again virtuallyunchanged from the 4.7 in 1997. As much as peoplerelied on doctors, however, they did not generallyagree with the statement that their “health is like theweather, there’s not much I can do about it,” in either2006 or 1997—the statement scored a 2.6 out of 7 inboth years.
Certain population groups in both 2006 and1997 were more likely than others to hold particularviews about their relationship with their physician.For example, seniors were more likely to feel they cando little about their health than those in all other agegroups and were more likely to feel it is important todo everything their doctor tells them. Also, womenwere more likely than men to ask lots of questionsabout the tests and treatments prescribed and would
The Fraser Institute 11 Complementary and Alternative Medicine
PUBLIC POLICY SOURCES, NUMBER 87
Table 1: Demographic Characteristics of Survey Respondents, 1997 and 2006
Characteristic 1997 Number(Percentage)
2006 Number(Percentage)
Region
British Columbia 197 (13.1) 278 (13.9)
Alberta 135 (9.0) 192 (9.6)
Saskatchewan and Manitoba 105 (7.0) 134 (6.7)
Ontario 565 (37.7) 771 (38.6)
Quebec 376 (25.1) 473 (23.7)
Atlantic Canada (NB, NS, PE, NL) 122 (8.1) 152 (7.6)
Number of Medical Conditions Reported (Past 12 months)
None 551 (36.8) 709 (35.4)
One 325 (21.7) 400 (20.0)
Two 204 (13.6) 317 (15.9)
Three or More 420 (28.0) 575 (28.7)
At Least One 949 (63.3) 1,292 (64.6)
Note: Due to rounding, percentages do not always sum to 100.
often tell their doctor the tests and treatments theyfeel are best for them, while men were more likely todo everything the doctor tells them to do.
With respect to prescription medicine use, in2006, nearly half the Canadian population (47%) saidthey were taking prescription medication, a signifi-cant increase of 8 percentage points since 1997,when 39 percent answered “yes” to the same ques-tion. There are also differences between genders: 54percent of women in 2006 (up from 48 percent in1997) were taking prescription medicine comparedto 39 percent of men (up from 29 percent in 1997).Notably, between 1997 and 2006 there were sizableincreases in the number of Canadians taking pre-scription medicine in all Canadian regions: BC (33%to 44%), Alberta (36% to 46%), SK/MB (41% to 48%),Ontario (41% to 47%), Quebec (38 to 48%), andAtlantic Canada (41% to 47%).
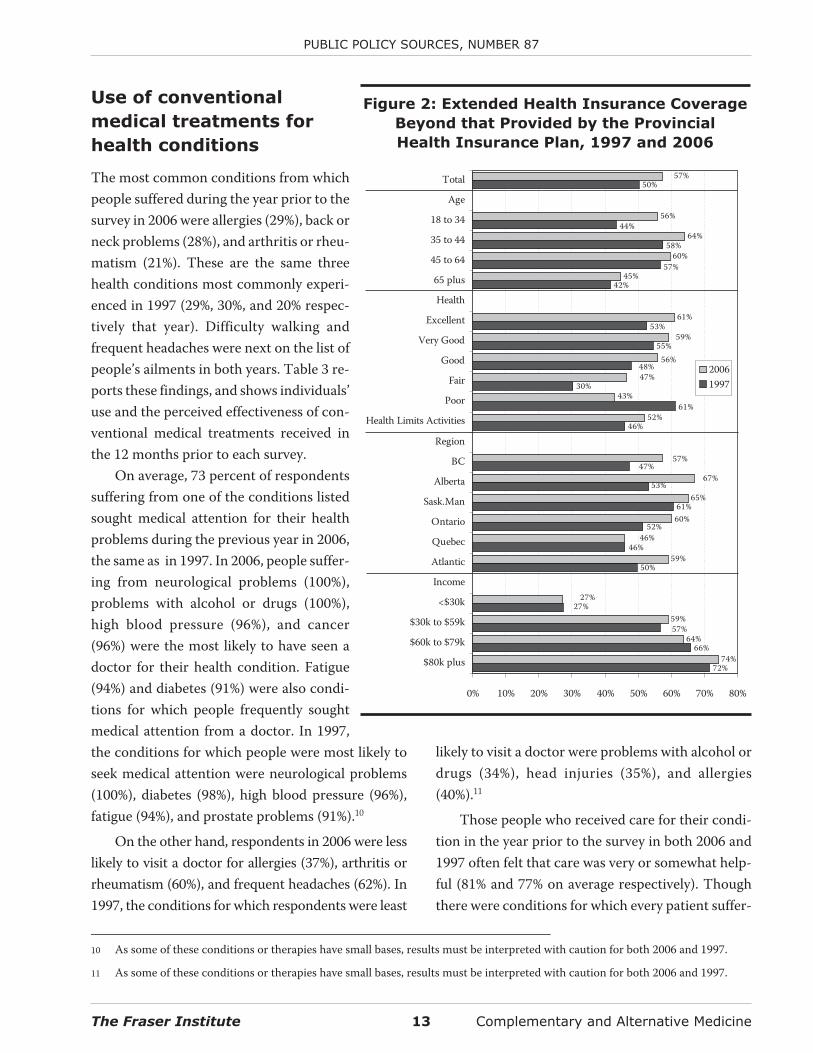
In 2006, a majority of Canadians (57%) had someform of health insurance coverage above and beyondthat provided by their provincial medical plan, anincrease of 7 percentage points from the 50 percentobserved in 1997. In 2006, extended coverage wasmost common in the 35 to 44 and 45 to 64 agegroups, among those with “excellent” health, inAlberta and Saskatchewan and Manitoba, and
among those with higher incomes. Similar patternswere observed in 1997, though notably it was thosewith “poor” health in 1997 who were most likely tohold additional coverage. Figure 2 shows the varia-tions in extended health insurance coverage by age,health status, region, and income in both years.
Complementary and Alternative Medicine 12 The Fraser Institute
PUBLIC POLICY SOURCES, NUMBER 87
0%
5%
10%
15%
20%
25%
30%
35%
40%
45%
Excellent VeryGood
Good Fair Poor
%of
All
Resp
onde
nts
19972006
Figure 1: General Health Evaluation of
Survey Respondents, 1997 and 2006
Table 2: Respondents Who Feel Daily
Life is Limited by Health Problems,
as a Percentage of Respondents in
Selected Categories, 1997 and 2006
1997 2006
All Respondents 19% 18%
Reported Health
Excellent/Very Good 7% 5%
Good/Fair 37% 36%
Poor 100% 95%
Take Prescription Medicine
Yes 35% 33%
No 9% 6%
Age
18-34 11% 9%
35-44 20% 12%
45-64 23% 24%
> 65 30% 34%
Education
Less Than High School 25% 27%
High School Graduate 22% 21%
Some Post-Secondary 19% 22%
University Graduate 16% 15%
Region
British Columbia 20% 24%
Alberta 18% 20%
Saskatchewan/Manitoba 19% 20%
Ontario 21% 18%
Quebec 15% 16%
Atlantic 23% 17%
Note: Due to rounding, percentages do not always sum to 100.
Use of conventional
medical treatments for
health conditions
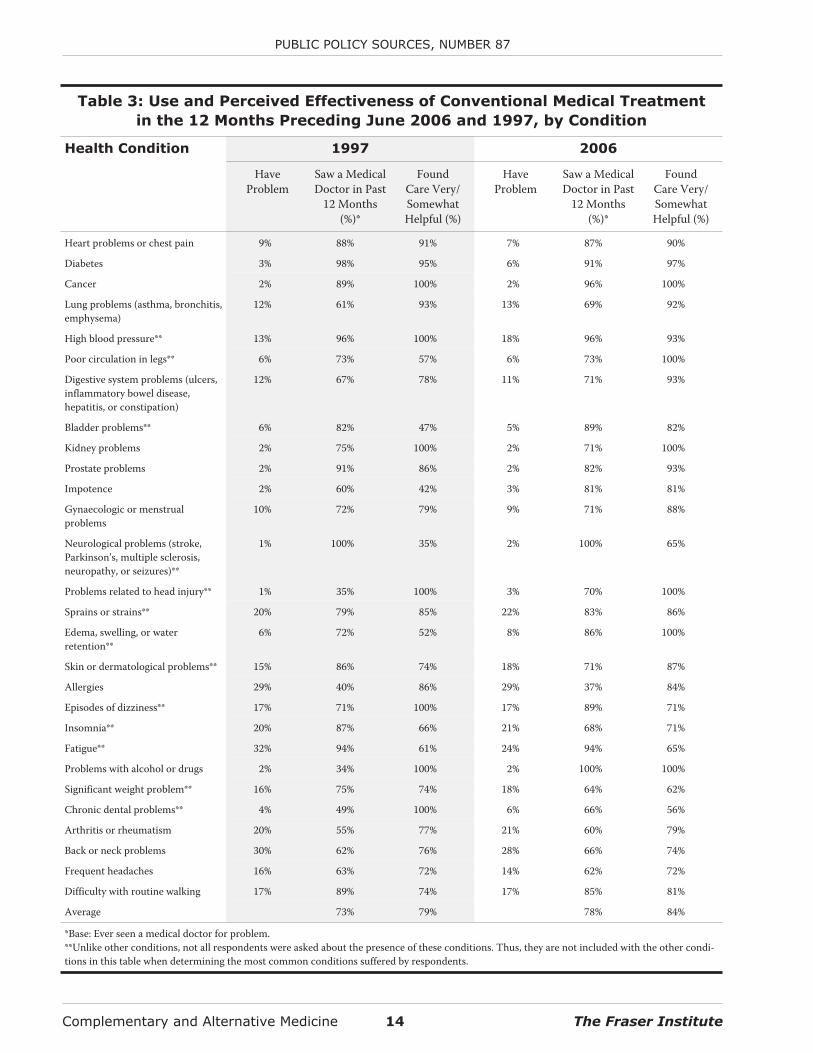
The most common conditions from whichpeople suffered during the year prior to thesurvey in 2006 were allergies (29%), back orneck problems (28%), and arthritis or rheu-matism (21%). These are the same threehealth conditions most commonly experi-enced in 1997 (29%, 30%, and 20% respec-tively that year). Difficulty walking andfrequent headaches were next on the list ofpeople’s ailments in both years. Table 3 re-ports these findings, and shows individuals’use and the perceived effectiveness of con-ventional medical treatments received inthe 12 months prior to each survey.
On average, 73 percent of respondentssuffering from one of the conditions listedsought medical attention for their healthproblems during the previous year in 2006,the same as in 1997. In 2006, people suffer-ing from neurological problems (100%),problems with alcohol or drugs (100%),high blood pressure (96%), and cancer(96%) were the most likely to have seen adoctor for their health condition. Fatigue(94%) and diabetes (91%) were also condi-tions for which people frequently soughtmedical attention from a doctor. In 1997,the conditions for which people were most likely toseek medical attention were neurological problems(100%), diabetes (98%), high blood pressure (96%),fatigue (94%), and prostate problems (91%).10
On the other hand, respondents in 2006 were lesslikely to visit a doctor for allergies (37%), arthritis orrheumatism (60%), and frequent headaches (62%). In1997, the conditions for which respondents were least
likely to visit a doctor were problems with alcohol ordrugs (34%), head injuries (35%), and allergies(40%).11
Those people who received care for their condi-tion in the year prior to the survey in both 2006 and1997 often felt that care was very or somewhat help-ful (81% and 77% on average respectively). Thoughthere were conditions for which every patient suffer-
The Fraser Institute 13 Complementary and Alternative Medicine
PUBLIC POLICY SOURCES, NUMBER 87
Figure 2: Extended Health Insurance Coverage
Beyond that Provided by the Provincial
Health Insurance Plan, 1997 and 2006
53%
74%
64%
59%
59%
65%
52%
61%
45%
60%
64%
56%
42%
58%
57%
30%
53%
55%
48%
61%
46%
47%
61%
27%
46%
52%
50%
57%
72%
66%
44%
50%57%
47%
56%
59%
43%
57%
67%
60%
46%
27%
0% 10% 20% 30% 40% 50% 60% 70% 80%
$80k plus
$60k to $79k
$30k to $59k
<$30k
Income
Atlantic
Quebec
Ontario
Sask.Man
Alberta
BC
Region
Health Limits Activities
Poor
Fair
Good
Very Good
Excellent
Health
65 plus
45 to 64
35 to 44
18 to 34
Age
Total
20061997
10 As some of these conditions or therapies have small bases, results must be interpreted with caution for both 2006 and 1997.
11 As some of these conditions or therapies have small bases, results must be interpreted with caution for both 2006 and 1997.
Complementary and Alternative Medicine 14 The Fraser Institute
PUBLIC POLICY SOURCES, NUMBER 87
Table 3: Use and Perceived Effectiveness of Conventional Medical Treatment
in the 12 Months Preceding June 2006 and 1997, by Condition
Health Condition 1997 2006
HaveProblem
Saw a MedicalDoctor in Past
12 Months(%)*
FoundCare Very/SomewhatHelpful (%)
HaveProblem
Saw a MedicalDoctor in Past
12 Months(%)*
FoundCare Very/SomewhatHelpful (%)
Heart problems or chest pain 9% 88% 91% 7% 87% 90%
Diabetes 3% 98% 95% 6% 91% 97%
Cancer 2% 89% 100% 2% 96% 100%
Lung problems (asthma, bronchitis,emphysema)
12% 61% 93% 13% 69% 92%
High blood pressure** 13% 96% 100% 18% 96% 93%
Poor circulation in legs** 6% 73% 57% 6% 73% 100%
Digestive system problems (ulcers,inflammatory bowel disease,hepatitis, or constipation)
12% 67% 78% 11% 71% 93%
Bladder problems** 6% 82% 47% 5% 89% 82%
Kidney problems 2% 75% 100% 2% 71% 100%
Prostate problems 2% 91% 86% 2% 82% 93%
Impotence 2% 60% 42% 3% 81% 81%
Gynaecologic or menstrualproblems
10% 72% 79% 9% 71% 88%
Neurological problems (stroke,Parkinson’s, multiple sclerosis,neuropathy, or seizures)**
1% 100% 35% 2% 100% 65%
Problems related to head injury** 1% 35% 100% 3% 70% 100%
Sprains or strains** 20% 79% 85% 22% 83% 86%
Edema, swelling, or waterretention**
6% 72% 52% 8% 86% 100%
Skin or dermatological problems** 15% 86% 74% 18% 71% 87%
Allergies 29% 40% 86% 29% 37% 84%
Episodes of dizziness** 17% 71% 100% 17% 89% 71%
Insomnia** 20% 87% 66% 21% 68% 71%
Fatigue** 32% 94% 61% 24% 94% 65%
Problems with alcohol or drugs 2% 34% 100% 2% 100% 100%
Significant weight problem** 16% 75% 74% 18% 64% 62%
Chronic dental problems** 4% 49% 100% 6% 66% 56%
Arthritis or rheumatism 20% 55% 77% 21% 60% 79%
Back or neck problems 30% 62% 76% 28% 66% 74%
Frequent headaches 16% 63% 72% 14% 62% 72%
Difficulty with routine walking 17% 89% 74% 17% 85% 81%
Average 73% 79% 78% 84%
*Base: Ever seen a medical doctor for problem.**Unlike other conditions, not all respondents were asked about the presence of these conditions. Thus, they are not included with the other condi-tions in this table when determining the most common conditions suffered by respondents.
ing from a given condition who sought help was sat-ing from a given condition who sought help was sat-isfied, in 2006 those seeking care for chronic dentalproblems (56%), significant weight problems (62%),or fatigue or neurological problems (65%) were leastlikely to be happy with the care provided by a doctor.In 1997, those suffering from neurological problems(35%), impotence (42%), or bladder problems (47%)were least likely to be happy.12
In both 2006 and 1997, most of those sufferingfrom anxiety attacks and/or severe depression didseek medical treatment from their condition.13 In2006, they did so most often from a psychiatrist,which was also the case in 1997. The majority of peo-ple who sought care from a psychiatrist, psycholo-gist, social worker, or other medical doctor found thetreatment helpful in 2006. This was also the case in1997, with the exception of those suffering fromsevere depression who saw a psychologist, in whichcase, only 37 percent of respondents found the treat-ment helpful.
Use of complementary and
alternative therapies
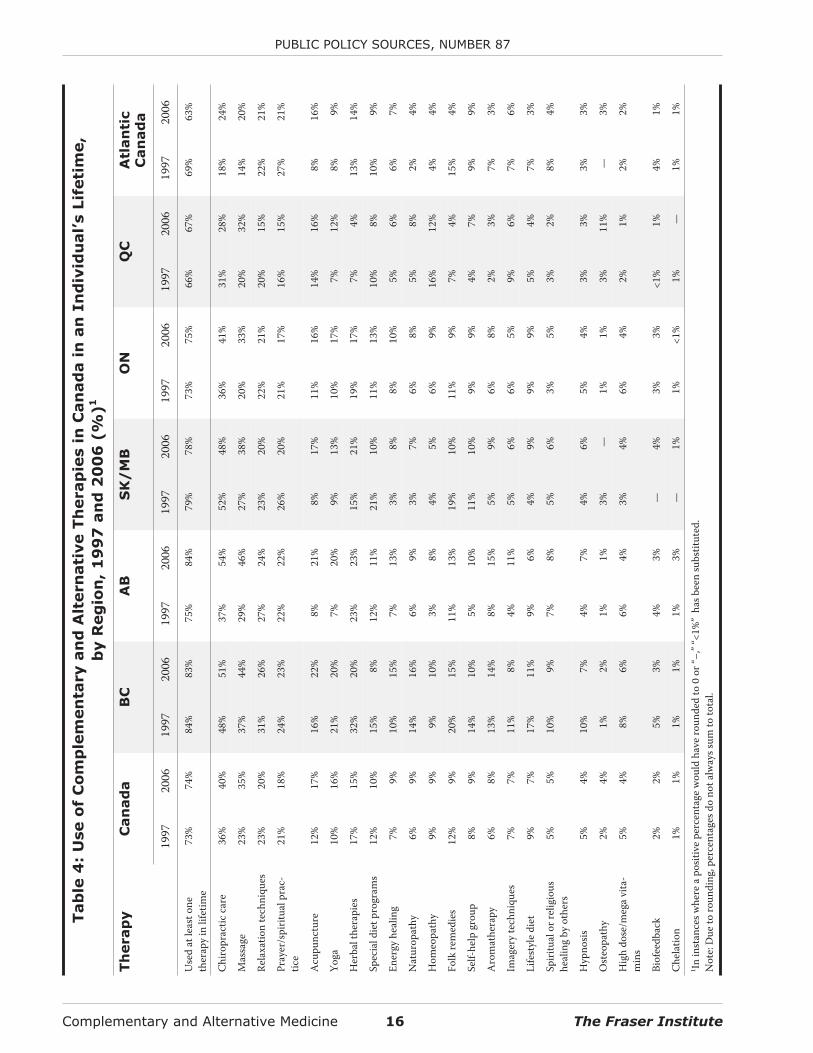
In 2006, nearly three-quarters of Canadians (74%)had used at least one alternative therapy sometime intheir lives.14 (For a description of various comple-mentary and alternative medicines and therapies, see“Appendix B: Descriptions of Select Complementaryand Alternative Medicines and Therapies.”) Thisproportion of Canadians is very similar to that in1997 (73%), suggesting that there has been no changein the overall usage of complementary and alterna-
tive medicine or therapies over the past nine years. In2006, Albertans (84%) were most likely to have usedan alternative therapy during their lifetime, followedclosely by British Columbians (83%), whileQuebecers (67%) and Atlantic Canadians (63%) wereleast likely to have done so. It is interesting to note thepronounced increase in the usage of alternative med-icine or therapies in Alberta since 1997, when it wasjust 75 percent. In general, in 2006, the usage of alter-native therapies decreases moving eastward acrossthe country. Similar patterns were observed in 1997,though in that year British Columbians were mostlikely (84%) and Quebecers least likely (66%) to haveused an alternative therapy during their lifetime. Ta-ble 4 gives the proportion of Canadians who haveever used an alternative therapy in their lifetime bytype of therapy and region.
In 2006, chiropractic care was the most commontype of therapy that Canadians used over their life-time, with 40 percent having tried it. This was a sig-nificant 4 percentage point increase over 1997.Thirty-five percent of Canadians had tried massageby 2006, a significant increase of 12 percentagepoints from 1997. Relaxation techniques (20%) andprayer (18%) came next on the most commonly triedalternative therapies. However, in both cases, thepercentage of Canadians who had tried these thera-pies had fallen since 1997, though the decreases werenot statistically significant. Acupuncture roundedout the five most common therapies used by Canadi-ans over their lifetime, with 17 percent of Canadianshaving used acupuncture (a statistically significantincrease of 5 percentage points from 1997).
The Fraser Institute 15 Complementary and Alternative Medicine
PUBLIC POLICY SOURCES, NUMBER 87
12 As some of these conditions or therapies have small bases, results must be interpreted with caution for both 2006 and 1997.
13 Due to differences in the medical services discussed, responses to questions on anxiety attacks and severe depression are not re-ported in table 3.
14 While differences in the general acceptance of various therapies may mean that some therapies are viewed as less conventional thanothers (for example, massage therapy is more generally accepted than energy healing), the discussions of complementary and alter-native medicine use below do not distinguish between therapies based on how generally they are accepted. Rather, the discussiononly presents the results of the survey. The questionnaire used for the survey (originally designed by researchers based at HarvardMedical School and Beth Israel Hospital for use in their pioneering work on alternative medicine use in the United States) did notdistinguish between various types of complementary and alternative medicine based on general acceptance.
Complementary and Alternative Medicine 16 The Fraser Institute
PUBLIC POLICY SOURCES, NUMBER 87
Tab
le4
:U
se
of
Co
mp
lem
en
tary
an
dA
ltern
ati
ve
Th
erap
ies
inC
an
ad
ain
an
In
div
idu
al’s
Lif
eti
me,
by
Reg
ion
,1
99
7an
d2
00
6(%
)1
Th
erap
yC
an
ad
aB
CA
BS
K/
MB
ON
QC
Atl
an
tic
Can
ad
a
1997
2006
1997
2006
1997
2006
1997
2006
1997
2006
1997
2006
1997
2006
Use
dat
leas
tone
ther
apy
inlif
etim
e73
%74
%84
%83
%75
%84
%79
%78
%73
%75
%66
%67
%69
%63
%
Chi
ropr
actic
care
36%
40%
48%
51%
37%
54%
52%
48%
36%
41%
31%
28%
18%
24%
Mas
sage
23%
35%
37%
44%
29%
46%
27%
38%
20%
33%
20%
32%
14%
20%
Rela
xatio
nte
chni
ques
23%
20%
31%
26%
27%
24%
23%
20%
22%
21%
20%
15%
22%
21%
Pray
er/s
pirit
ualp
rac-
tice
21%
18%
24%
23%
22%
22%
26%
20%
21%
17%
16%
15%
27%
21%
Acu
punc
ture
12%
17%
16%
22%
8%21
%8%
17%
11%
16%
14%
16%
8%16
%
Yoga
10%
16%
21%
20%
7%20
%9%
13%
10%
17%
7%12
%8%
9%
Her
balt
hera
pies
17%
15%
32%
20%
23%
23%
15%
21%
19%
17%
7%4%
13%
14%
Spec
iald
ietp
rogr
ams
12%
10%
15%
8%12
%11
%21
%10
%11
%13
%10
%8%
10%
9%
Ener
gyhe
alin
g7%
9%10
%15
%7%
13%
3%8%
8%10
%5%
6%6%
7%
Nat
urop
athy
6%9%
14%
16%
6%9%
3%7%
6%8%
5%8%
2%4%
Hom
eopa
thy
9%9%
9%10
%3%
8%4%
5%6%
9%16
%12
%4%
4%
Folk
rem
edie
s12
%9%
20%
15%
11%
13%
19%
10%
11%
9%7%
4%15
%4%
Self-
help
grou
p8%
9%14
%10
%5%
10%
11%
10%
9%9%
4%7%
9%9%
Aro
mat
hera
py6%
8%13
%14
%8%
15%
5%9%
6%8%
2%3%
7%3%
Imag
ery
tech
niqu
es7%
7%11
%8%
4%11
%5%
6%6%
5%9%
6%7%
6%
Life
styl
edi
et9%
7%17
%11
%9%
6%4%
9%9%
9%5%
4%7%
3%
Spiri
tual
orre
ligio
ushe
alin
gby
othe
rs5%
5%10
%9%
7%8%
5%6%
3%5%
3%2%
8%4%
Hyp
nosis
5%4%
10%
7%4%
7%4%
6%5%
4%3%
3%3%
3%
Ost
eopa
thy
2%4%
1%2%
1%1%
3%—
1%1%
3%11
%—
3%
Hig
hdo
se/m
ega
vita
-m
ins
5%4%
8%6%
6%4%
3%4%
6%4%
2%1%
2%2%
Biof
eedb
ack
2%2%
5%3%
4%3%
—4%
3%3%
<1%
1%4%
1%
Che
latio
n1%
1%1%
1%1%
3%—
1%1%
<1%
1%—
1%1%
1 Inin
stan
cesw
here
apo
sitiv
epe
rcen
tage
wou
ldha
vero
unde
dto
0or
“–,”
“<1%
”ha
sbee
nsu
bstit
uted
.N
ote:
Due
toro
undi
ng,p
erce
ntag
esdo
nota
lway
ssum
toto
tal.
On the other hand, spiritual or religious healingby others (5%), hypnosis (4%), osteopathy (4%), highdose/mega vitamins (4%), biofeedback (2%), andchelation (1%) were therapies least tried by Canadi-ans, according to the 2006 survey. This was also thecase in 1997.15
As was the case in 1997, there were regional vari-ations in the use of complementary and alternativetherapies. For example, more than half of Albertansand British Columbians had used chiropractic careversus fewer than one-quarter of Atlantic Canadians.Among other regional variations in 2006 that can beseen in table 4 are that Quebecers were more likely tohave used massage than chiropractic care, whileCanadians in other regions were more likely to haveused chiropractic care; that Quebecers were themost likely to have tried homeopathy (12%); and thatQuebecers were far and away the most likely to havetried osteopathy (11%).16
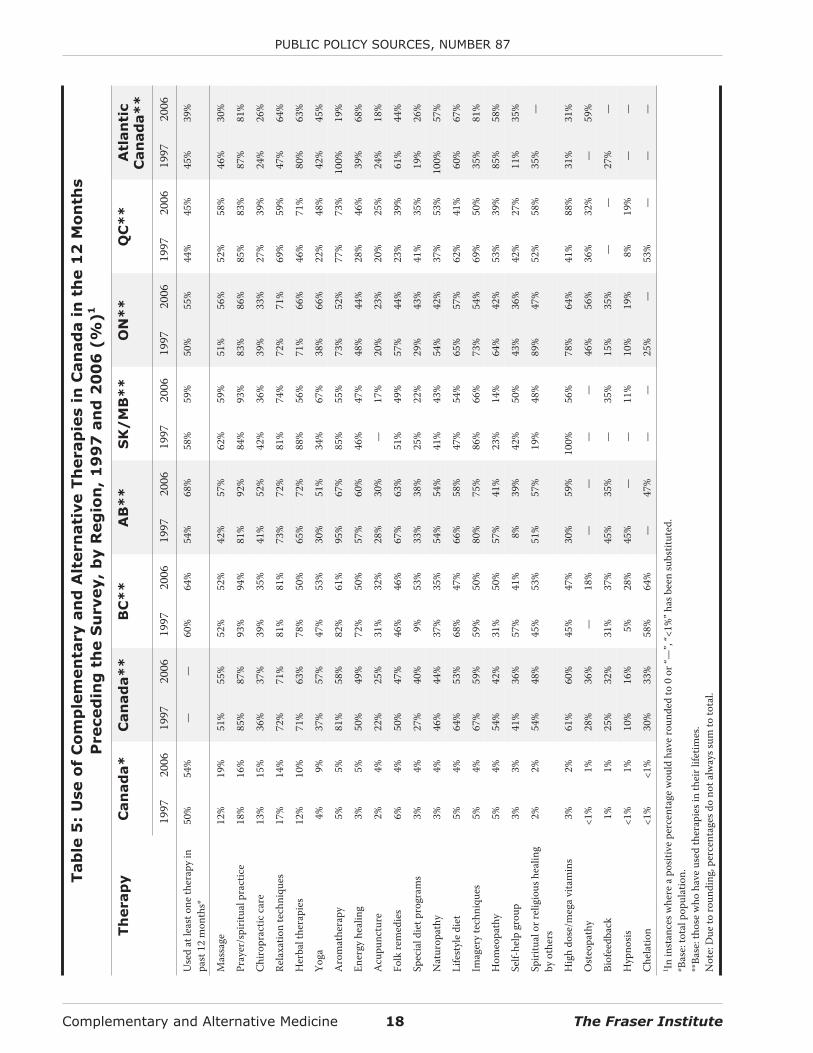
Table 5 shows the types of therapies used acrossCanada in the past 12 months. An examination of theuse of alternative therapies over the past year, ratherthan over Canadians’ lifetimes, paints a different pic-ture of the use of complementary and alternativemedicine. In 2006, more than one-half (54%) ofCanadians used at least one alternative therapy in theyear prior to the survey, which was a statistically sig-nificant 4 percentage point increase over the rate ofuse in 1997 (50%).
Focusing on those respondents who have triedvarious therapies during their lifetime, the use oftherapies over the past 12 months was more preva-lent in the west, with 68 percent of Albertans (a largeincrease from 54 percent in 1997) and 64 percent of
British Columbians having used such medicines andtherapies, compared to 45 percent of Quebecers and39 percent of Atlantic Canadians. In the 12 monthsprior to the 2006 survey, the most commonly usedcomplementary and alternative medicines and ther-apies were massage (19%), prayer (16%), chiropracticcare (15%), relaxation techniques (14%), and herbaltherapies (10%). Though the top 5 list was the samein 1997, the order was different. As seen in the life-time use of alternative therapies, there was a sizableincrease in the use of yoga in the previous 12 months:from 4 percent in 1997 to 9 percent in 2006.
In the 12 months prior to the 2006 survey, theuse of yoga among those who had used it in their life-times also increased significantly—from 37 percentin 1997 to 57 percent in 2006. The use of special dietprograms in the past 12 months among those whohad used diet programs in their lifetimes increasedsignificantly as well, from 27 percent in 1997 to 40percent in 2006. Use of a given alternative or comple-mentary medicine or therapy among those who hadused that therapy in their lifetimes in 2006 was high-est for prayer (87%) and relaxation techniques (71%),and lowest for biofeedback (32%) and hypnosis(16%). Past-year use of aromatherapy by those whohad used it in their lifetime fell significantly between1997 (81%) and 2006 (58%). Again, as in 1997, note-worthy differences in use existed among the prov-inces in 2006 (table 5).17
The most likely alternative therapy users overthe previous 12 months in 2006 were from the 18 to34 year old age group (58%). The use of alternativetreatments diminished with age, with 49 percent ofseniors (65 years and older) having used them duringthe year prior to the survey. The use of alternative
The Fraser Institute 17 Complementary and Alternative Medicine
PUBLIC POLICY SOURCES, NUMBER 87
15 As some of these conditions/therapies have small bases, results must be interpreted with caution for both 2006 and 1997.
16 As some of these conditions/therapies have small bases, results must be interpreted with caution for both 2006 and 1997. Further,differences in the patterns of use between therapies and provinces may not relate solely to the preferences of individuals. Rather, thedifferences might also be related to differences in insurance coverage of these services. Put simply, it is possible that the differencesobserved in the use of therapies (both between therapies and between provinces) are at least partly being driven by differences in themarginal cost of services to users as a result of provincial and private insurance coverage decisions.
17 As some of these conditions/therapies have small bases, results must be interpreted with caution for both 2006 and 1997.
Complementary and Alternative Medicine 18 The Fraser Institute
PUBLIC POLICY SOURCES, NUMBER 87
Tab
le5
:U
se
of
Co
mp
lem
en
tary
an
dA
ltern
ati
ve
Th
erap
ies
inC
an
ad
ain
the
12
Mo
nth
s
Preced
ing
the
Su
rvey,
by
Reg
ion
,1
99
7an
d2
00
6(%
)1
Th
erap
yC
an
ad
a*
Can
ad
a*
*B
C*
*A
B*
*S
K/
MB
**
ON
**
QC
**
Atl
an
tic
Can
ad
a*
*
1997
2006
1997
2006
1997
2006
1997
2006
1997
2006
1997
2006
1997
2006
1997
2006
Use
dat
leas
tone
ther
apy
inpa
st12
mon
ths*
50%
54%
——
60%
64%
54%
68%
58%
59%
50%
55%
44%
45%
45%
39%
Mas
sage
12%
19%
51%
55%
52%
52%
42%
57%
62%
59%
51%
56%
52%
58%
46%
30%
Pray
er/s
pirit
ualp
ract
ice
18%
16%
85%
87%
93%
94%
81%
92%
84%
93%
83%
86%
85%
83%
87%
81%
Chi
ropr
actic
care
13%
15%
36%
37%
39%
35%
41%
52%
42%
36%
39%
33%
27%
39%
24%
26%
Rela
xatio
nte
chni
ques
17%
14%
72%
71%
81%
81%
73%
72%
81%
74%
72%
71%
69%
59%
47%
64%
Her
balt
hera
pies
12%
10%
71%
63%
78%
50%
65%
72%
88%
56%
71%
66%
46%
71%
80%
63%
Yoga
4%9%
37%
57%
47%
53%
30%
51%
34%
67%
38%
66%
22%
48%
42%
45%
Aro
mat
hera
py5%
5%81
%58
%82
%61
%95
%67
%85
%55
%73
%52
%77
%73
%10
0%19
%
Ener
gyhe
alin
g3%
5%50
%49
%72
%50
%57
%60
%46
%47
%48
%44
%28
%46
%39
%68
%
Acu
punc
ture
2%4%
22%
25%
31%
32%
28%
30%
—17
%20
%23
%20
%25
%24
%18
%
Folk
rem
edie
s6%
4%50
%47
%46
%46
%67
%63
%51
%49
%57
%44
%23
%39
%61
%44
%
Spec
iald
ietp
rogr
ams
3%4%
27%
40%
9%53
%33
%38
%25
%22
%29
%43
%41
%35
%19
%26
%
Nat
urop
athy
3%4%
46%
44%
37%
35%
54%
54%
41%
43%
54%
42%
37%
53%
100%
57%
Life
styl
edi
et5%
4%64
%53
%68
%47
%66
%58
%47
%54
%65
%57
%62
%41
%60
%67
%
Imag
ery
tech
niqu
es5%
4%67
%59
%59
%50
%80
%75
%86
%66
%73
%54
%69
%50
%35
%81
%
Hom
eopa
thy
5%4%
54%
42%
31%
50%
57%
41%
23%
14%
64%
42%
53%
39%
85%
58%
Self-
help
grou
p3%
3%41
%36
%57
%41
%8%
39%
42%
50%
43%
36%
42%
27%
11%
35%
Spiri
tual
orre
ligio
ushe
alin
gby
othe
rs2%
2%54
%48
%45
%53
%51
%57
%19
%48
%89
%47
%52
%58
%35
%—
Hig
hdo
se/m
ega
vita
min
s3%
2%61
%60
%45
%47
%30
%59
%10
0%56
%78
%64
%41
%88
%31
%31
%
Ost
eopa
thy
<1%
1%28
%36
%—
18%
——
——
46%
56%
36%
32%
—59
%
Biof
eedb
ack
1%1%
25%
32%
31%
37%
45%
35%
—35
%15
%35
%—
—27
%—
Hyp
nosis
<1%
1%10
%16
%5%
28%
45%
——
11%
10%
19%
8%19
%—
—
Che
latio
n<1
%<1
%30
%33
%58
%64
%—
47%
——
25%
—53
%—
——
1 Inin
stan
cesw
here
apo
sitiv
epe
rcen
tage
wou
ldha
vero
unde
dto
0or
“—”,
“<1%
”has
been
subs
titut
ed.
*Bas
e:to
talp
opul
atio
n.**
Base
:tho
sew
hoha
veus
edth
erap
iesi
nth
eirl
ifetim
es.
Not
e:D
ueto
roun
ding
,per
cent
ages
dono
talw
ayss
umto
tota
l.
therapies rose with income: 52 percent of those inthe less-than-$20,000-a-year income group usedalternative therapies in the 12 months prior to thesurvey compared to 55 percent of those in the$40,000-to-$59,000 income group, 56 percent ofthose in the $60,000-to-$79,000 income group, and61 percent of those in the $80,000+ group. Interest-ingly, in 2006, alternative therapy use was lower inthe $20,000-to-$40,000 income group (47%) than inthe less-than-$20,000-a-year group. Alternativetherapy use also rose with education: 62 percent ofuniversity graduates had used alternative medicinesin the year prior to the survey, while 37 percent ofthose who had not completed high school had doneso. The age and education trends are similar to thoseseen in 1997, while there was no income trend foundin the use of therapies in 1997.
Canadians used alternative therapies an averageof 8.6 times during the year previous to the 2006 sur-vey, which was similar to their use in 1996/97 (8.7times). In 2006, British Columbians visited a pro-vider of alternative therapy most often (10.9 times onaverage), compared to 9.9 in Ontario, 8.8 in Alberta,6.1 in Quebec, 5.5 in Saskatchewan/Manitoba, and5.4 in Atlantic Canada. While those aged 18 to 34were most likely to have used alternative medicine(58%), those aged 35 to 54 were most likely to haveseen an alternative therapy provider for their treat-ment (60 percent compared with 57 percent of 18 to34 year olds). The use of alternative therapy provid-ers increased with income and with education. Theage, income, and education trends are all similar tothose seen in the 1997 survey, though in that yearOntarians made the most visits to practitioners, fol-lowed by Saskatchewan/Manitoba, BC, Alberta,Quebec, and Atlantic Canada.
Prayer18 was the most frequently used therapy in2006, with Canadians making an average of 31.1 vis-its in the 12 months prior to the survey, followed byyoga (30.0) and relaxation techniques (16.8). Themost notable change in frequency of use between1997 and 2006 occurred in spiritual or religious heal-ing by others, which fell from 71.7 visits in the 12months prior to the 1997 survey to an average of 9.6visits in the 12 months prior to the 2006 survey,though this result should be treated with cautiongiven the small base sizes in both years. More reli-ably, the frequency of visits for prayer (44.8 to 31.1)and yoga (51.6 to 30.0) also fell between 1997 and2006. The frequency of visits in the past 12 months isshown in table 6.
Table 6 also shows that 90 percent of Canadianswho used acupuncture in the past 12 months in 2006,86 percent of those who received chiropractic care,and 85 percent of those who received osteopathy sawa professional for treatment. (In this context, a pro-fessional is defined as someone who is paid for his orher services.) Users of chelation always saw a profes-sional for care in 2006, while slightly less than 2
3 didso in 1997.19 While the percentage of Canadians see-ing a professional for chiropractic care and massagetherapy was relatively unchanged from 1997 (88%and 76% respectively), the percentage seeing a pro-fessional for acupuncture increased to 90 percentfrom the 75 percent seen in 1997. Canadians in2005/06 were also more likely to see a professionalfor yoga than in 1996/97, despite the fact that theymade fewer visits on average. On the other hand,Canadians were least likely to visit a professional forfolk remedies (7%), aromatherapy (8%—a sizeabledecrease from the 20% seen in 1997), and prayer(9%). The percentage of Canadians seeing a profes-
The Fraser Institute 19 Complementary and Alternative Medicine
PUBLIC POLICY SOURCES, NUMBER 87
18 While there is some discussion about whether or not prayer should be included in studies of alternative therapy use, the use of prayeras an alternative therapy was included in the studies published by Eisenberg et al., and thus is included in the list of alternative thera-pies examined in this study.
19 As some of these conditions/therapies have small bases, results must be interpreted with caution for both 2006 and 1997.
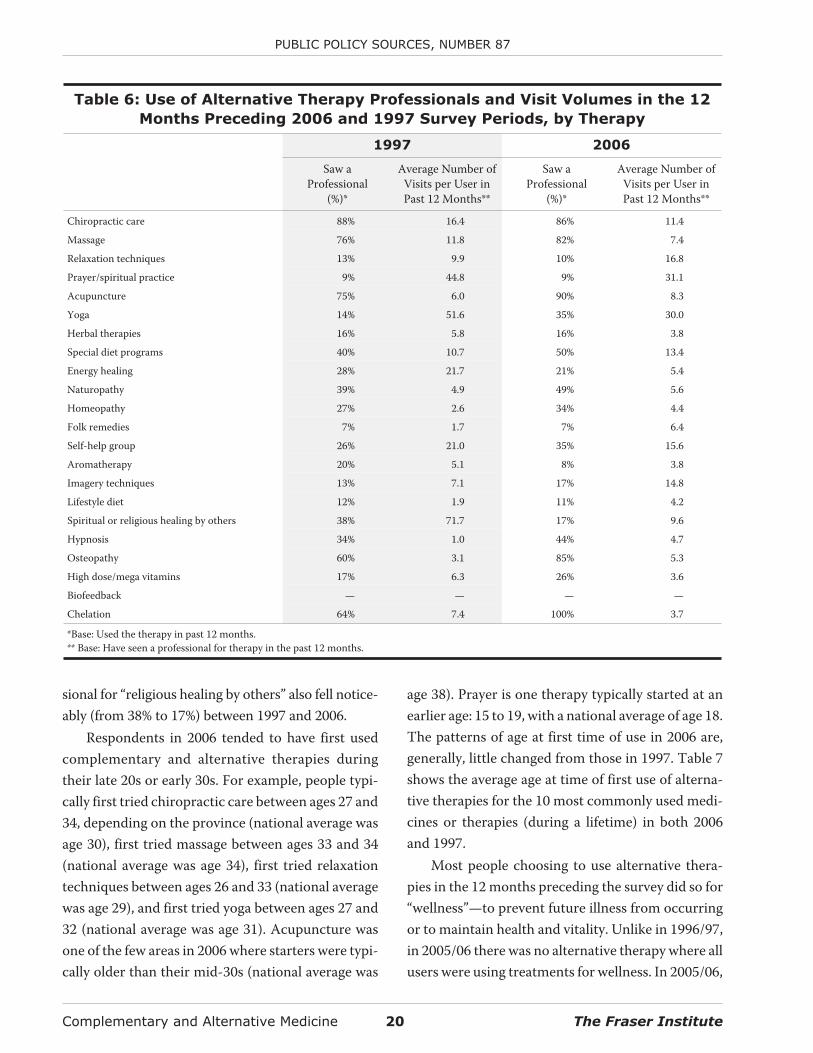
sional for “religious healing by others” also fell notice-ably (from 38% to 17%) between 1997 and 2006.
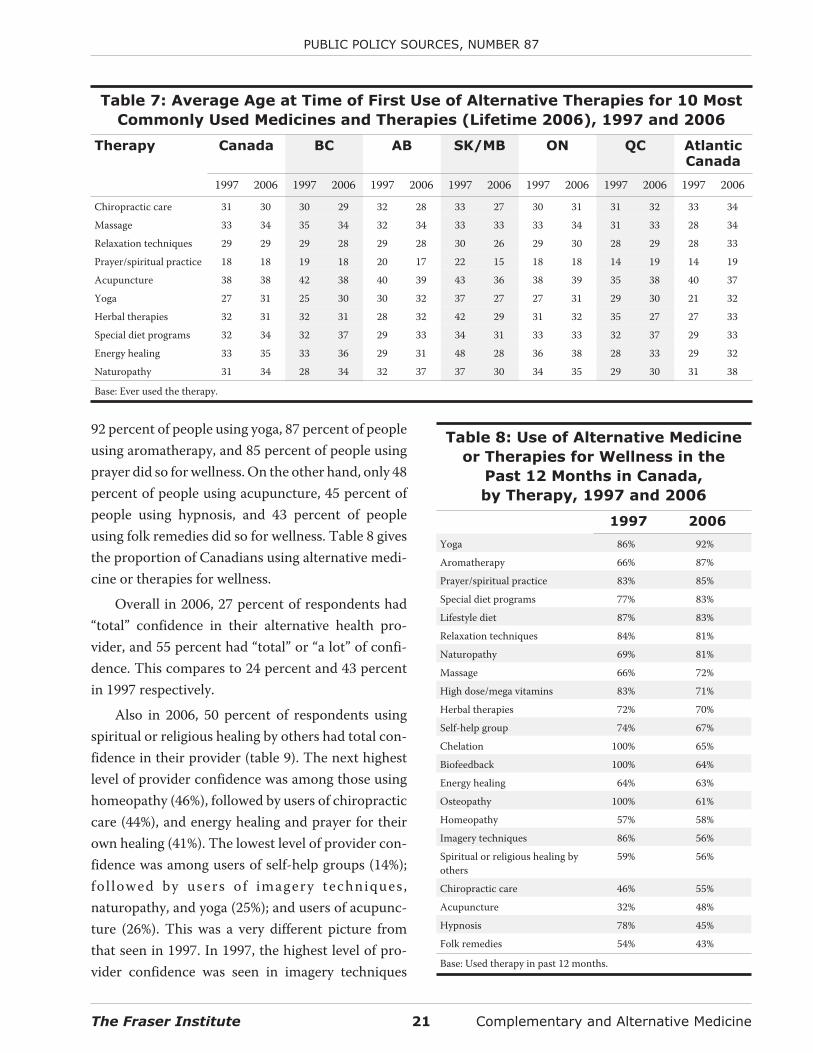
Respondents in 2006 tended to have first usedcomplementary and alternative therapies duringtheir late 20s or early 30s. For example, people typi-cally first tried chiropractic care between ages 27 and34, depending on the province (national average wasage 30), first tried massage between ages 33 and 34(national average was age 34), first tried relaxationtechniques between ages 26 and 33 (national averagewas age 29), and first tried yoga between ages 27 and32 (national average was age 31). Acupuncture wasone of the few areas in 2006 where starters were typi-cally older than their mid-30s (national average was
age 38). Prayer is one therapy typically started at anearlier age: 15 to 19, with a national average of age 18.The patterns of age at first time of use in 2006 are,generally, little changed from those in 1997. Table 7shows the average age at time of first use of alterna-tive therapies for the 10 most commonly used medi-cines or therapies (during a lifetime) in both 2006and 1997.
Most people choosing to use alternative thera-pies in the 12 months preceding the survey did so for“wellness”—to prevent future illness from occurringor to maintain health and vitality. Unlike in 1996/97,in 2005/06 there was no alternative therapy where allusers were using treatments for wellness. In 2005/06,
Complementary and Alternative Medicine 20 The Fraser Institute
PUBLIC POLICY SOURCES, NUMBER 87
Table 6: Use of Alternative Therapy Professionals and Visit Volumes in the 12
Months Preceding 2006 and 1997 Survey Periods, by Therapy
1997 2006
Saw aProfessional
(%)*
Average Number ofVisits per User inPast 12 Months**
Saw aProfessional
(%)*
Average Number ofVisits per User inPast 12 Months**
Chiropractic care 88% 16.4 86% 11.4
Massage 76% 11.8 82% 7.4
Relaxation techniques 13% 9.9 10% 16.8
Prayer/spiritual practice 9% 44.8 9% 31.1
Acupuncture 75% 6.0 90% 8.3
Yoga 14% 51.6 35% 30.0
Herbal therapies 16% 5.8 16% 3.8
Special diet programs 40% 10.7 50% 13.4
Energy healing 28% 21.7 21% 5.4
Naturopathy 39% 4.9 49% 5.6
Homeopathy 27% 2.6 34% 4.4
Folk remedies 7% 1.7 7% 6.4
Self-help group 26% 21.0 35% 15.6
Aromatherapy 20% 5.1 8% 3.8
Imagery techniques 13% 7.1 17% 14.8
Lifestyle diet 12% 1.9 11% 4.2
Spiritual or religious healing by others 38% 71.7 17% 9.6
Hypnosis 34% 1.0 44% 4.7
Osteopathy 60% 3.1 85% 5.3
High dose/mega vitamins 17% 6.3 26% 3.6
Biofeedback — — — —
Chelation 64% 7.4 100% 3.7
*Base: Used the therapy in past 12 months.** Base: Have seen a professional for therapy in the past 12 months.
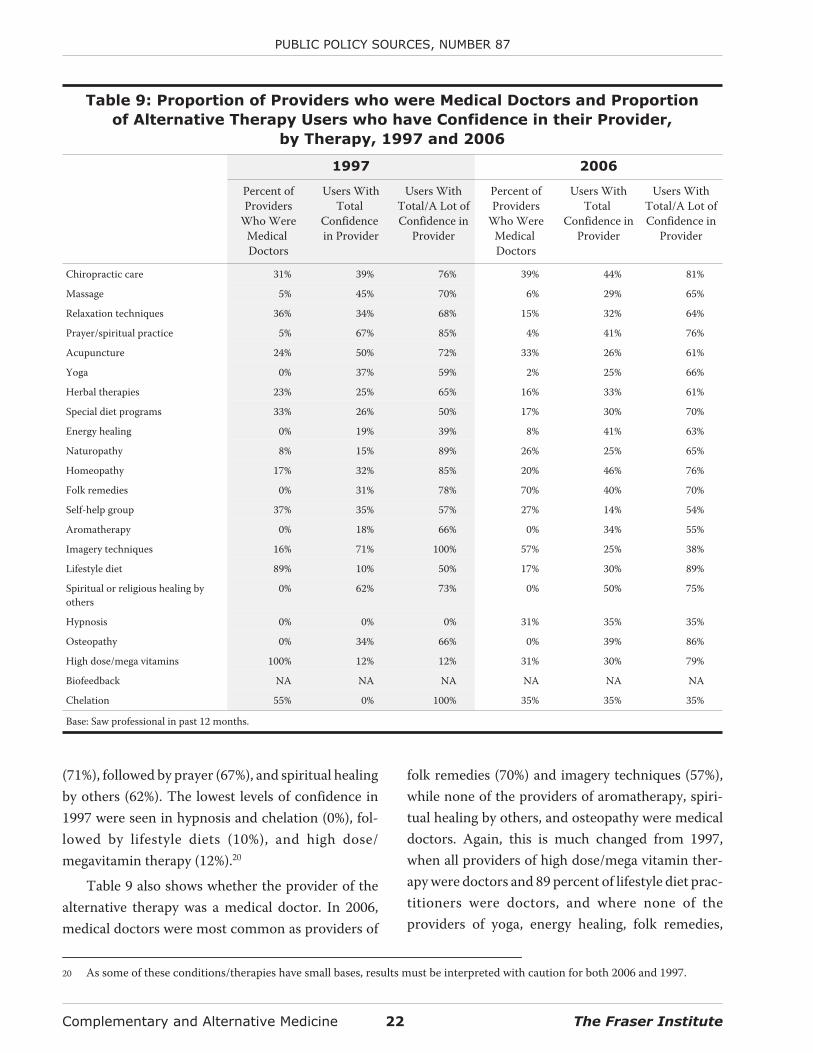
92 percent of people using yoga, 87 percent of peopleusing aromatherapy, and 85 percent of people usingprayer did so for wellness. On the other hand, only 48percent of people using acupuncture, 45 percent ofpeople using hypnosis, and 43 percent of peopleusing folk remedies did so for wellness. Table 8 givesthe proportion of Canadians using alternative medi-cine or therapies for wellness.
Overall in 2006, 27 percent of respondents had“total” confidence in their alternative health pro-vider, and 55 percent had “total” or “a lot” of confi-dence. This compares to 24 percent and 43 percentin 1997 respectively.
Also in 2006, 50 percent of respondents usingspiritual or religious healing by others had total con-fidence in their provider (table 9). The next highestlevel of provider confidence was among those usinghomeopathy (46%), followed by users of chiropracticcare (44%), and energy healing and prayer for theirown healing (41%). The lowest level of provider con-fidence was among users of self-help groups (14%);fol lowed by users of imagery techniques ,naturopathy, and yoga (25%); and users of acupunc-ture (26%). This was a very different picture fromthat seen in 1997. In 1997, the highest level of pro-vider confidence was seen in imagery techniques
The Fraser Institute 21 Complementary and Alternative Medicine
PUBLIC POLICY SOURCES, NUMBER 87
Table 7: Average Age at Time of First Use of Alternative Therapies for 10 Most
Commonly Used Medicines and Therapies (Lifetime 2006), 1997 and 2006
Therapy Canada BC AB SK/MB ON QC AtlanticCanada
1997 2006 1997 2006 1997 2006 1997 2006 1997 2006 1997 2006 1997 2006
Chiropractic care 31 30 30 29 32 28 33 27 30 31 31 32 33 34
Massage 33 34 35 34 32 34 33 33 33 34 31 33 28 34
Relaxation techniques 29 29 29 28 29 28 30 26 29 30 28 29 28 33
Prayer/spiritual practice 18 18 19 18 20 17 22 15 18 18 14 19 14 19
Acupuncture 38 38 42 38 40 39 43 36 38 39 35 38 40 37
Yoga 27 31 25 30 30 32 37 27 27 31 29 30 21 32
Herbal therapies 32 31 32 31 28 32 42 29 31 32 35 27 27 33
Special diet programs 32 34 32 37 29 33 34 31 33 33 32 37 29 33
Energy healing 33 35 33 36 29 31 48 28 36 38 28 33 29 32
Naturopathy 31 34 28 34 32 37 37 30 34 35 29 30 31 38
Base: Ever used the therapy.
Table 8: Use of Alternative Medicine
or Therapies for Wellness in the
Past 12 Months in Canada,
by Therapy, 1997 and 2006
1997 2006
Yoga 86% 92%
Aromatherapy 66% 87%
Prayer/spiritual practice 83% 85%
Special diet programs 77% 83%
Lifestyle diet 87% 83%
Relaxation techniques 84% 81%
Naturopathy 69% 81%
Massage 66% 72%
High dose/mega vitamins 83% 71%
Herbal therapies 72% 70%
Self-help group 74% 67%
Chelation 100% 65%
Biofeedback 100% 64%
Energy healing 64% 63%
Osteopathy 100% 61%
Homeopathy 57% 58%
Imagery techniques 86% 56%
Spiritual or religious healing byothers
59% 56%
Chiropractic care 46% 55%
Acupuncture 32% 48%
Hypnosis 78% 45%
Folk remedies 54% 43%
Base: Used therapy in past 12 months.
(71%), followed by prayer (67%), and spiritual healingby others (62%). The lowest levels of confidence in1997 were seen in hypnosis and chelation (0%), fol-lowed by lifestyle diets (10%), and high dose/megavitamin therapy (12%).20
Table 9 also shows whether the provider of thealternative therapy was a medical doctor. In 2006,medical doctors were most common as providers of
folk remedies (70%) and imagery techniques (57%),while none of the providers of aromatherapy, spiri-tual healing by others, and osteopathy were medicaldoctors. Again, this is much changed from 1997,when all providers of high dose/mega vitamin ther-apy were doctors and 89 percent of lifestyle diet prac-titioners were doctors, and where none of theproviders of yoga, energy healing, folk remedies,
Complementary and Alternative Medicine 22 The Fraser Institute
PUBLIC POLICY SOURCES, NUMBER 87
Table 9: Proportion of Providers who were Medical Doctors and Proportion
of Alternative Therapy Users who have Confidence in their Provider,
by Therapy, 1997 and 2006
1997 2006
Percent ofProviders
Who WereMedicalDoctors
Users WithTotal
Confidencein Provider
Users WithTotal/A Lot ofConfidence in
Provider
Percent ofProviders
Who WereMedicalDoctors
Users WithTotal
Confidence inProvider
Users WithTotal/A Lot ofConfidence in
Provider
Chiropractic care 31% 39% 76% 39% 44% 81%
Massage 5% 45% 70% 6% 29% 65%
Relaxation techniques 36% 34% 68% 15% 32% 64%
Prayer/spiritual practice 5% 67% 85% 4% 41% 76%
Acupuncture 24% 50% 72% 33% 26% 61%
Yoga 0% 37% 59% 2% 25% 66%
Herbal therapies 23% 25% 65% 16% 33% 61%
Special diet programs 33% 26% 50% 17% 30% 70%
Energy healing 0% 19% 39% 8% 41% 63%
Naturopathy 8% 15% 89% 26% 25% 65%
Homeopathy 17% 32% 85% 20% 46% 76%
Folk remedies 0% 31% 78% 70% 40% 70%
Self-help group 37% 35% 57% 27% 14% 54%
Aromatherapy 0% 18% 66% 0% 34% 55%
Imagery techniques 16% 71% 100% 57% 25% 38%
Lifestyle diet 89% 10% 50% 17% 30% 89%
Spiritual or religious healing byothers
0% 62% 73% 0% 50% 75%
Hypnosis 0% 0% 0% 31% 35% 35%
Osteopathy 0% 34% 66% 0% 39% 86%
High dose/mega vitamins 100% 12% 12% 31% 30% 79%
Biofeedback NA NA NA NA NA NA
Chelation 55% 0% 100% 35% 35% 35%
Base: Saw professional in past 12 months.
20 As some of these conditions/therapies have small bases, results must be interpreted with caution for both 2006 and 1997.
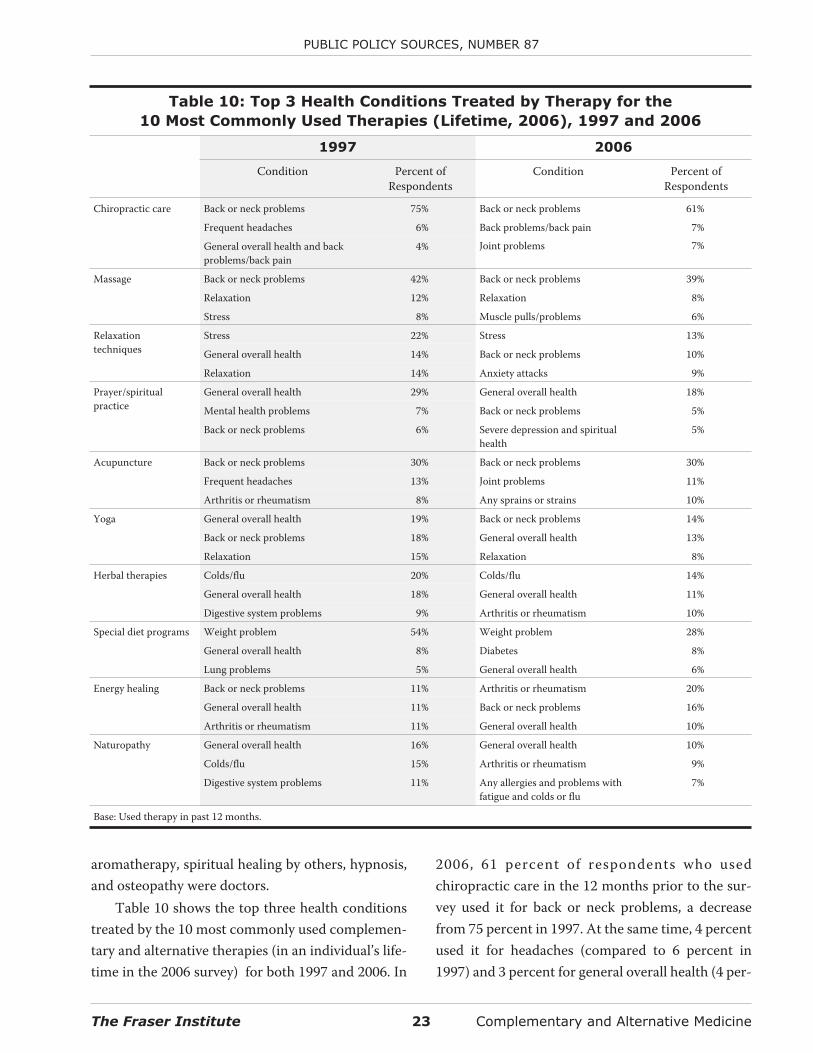
aromatherapy, spiritual healing by others, hypnosis,and osteopathy were doctors.
Table 10 shows the top three health conditionstreated by the 10 most commonly used complemen-tary and alternative therapies (in an individual’s life-time in the 2006 survey) for both 1997 and 2006. In
2006, 61 percent of respondents who usedchiropractic care in the 12 months prior to the sur-vey used it for back or neck problems, a decreasefrom 75 percent in 1997. At the same time, 4 percentused it for headaches (compared to 6 percent in1997) and 3 percent for general overall health (4 per-
The Fraser Institute 23 Complementary and Alternative Medicine
PUBLIC POLICY SOURCES, NUMBER 87
Table 10: Top 3 Health Conditions Treated by Therapy for the
10 Most Commonly Used Therapies (Lifetime, 2006), 1997 and 2006
1997 2006
Condition Percent ofRespondents
Condition Percent ofRespondents
Chiropractic care Back or neck problems 75% Back or neck problems 61%
Frequent headaches 6% Back problems/back pain
Joint problems
7%
7%General overall health and backproblems/back pain
4%
Massage Back or neck problems 42% Back or neck problems 39%
Relaxation 12% Relaxation 8%
Stress 8% Muscle pulls/problems 6%
Relaxationtechniques
Stress 22% Stress 13%
General overall health 14% Back or neck problems 10%
Relaxation 14% Anxiety attacks 9%
Prayer/spiritualpractice
General overall health 29% General overall health 18%
Mental health problems 7% Back or neck problems 5%
Back or neck problems 6% Severe depression and spiritualhealth
5%
Acupuncture Back or neck problems 30% Back or neck problems 30%
Frequent headaches 13% Joint problems 11%
Arthritis or rheumatism 8% Any sprains or strains 10%
Yoga General overall health 19% Back or neck problems 14%
Back or neck problems 18% General overall health 13%
Relaxation 15% Relaxation 8%
Herbal therapies Colds/flu 20% Colds/flu 14%
General overall health 18% General overall health 11%
Digestive system problems 9% Arthritis or rheumatism 10%
Special diet programs Weight problem 54% Weight problem 28%
General overall health 8% Diabetes 8%
Lung problems 5% General overall health 6%
Energy healing Back or neck problems 11% Arthritis or rheumatism 20%
General overall health 11% Back or neck problems 16%
Arthritis or rheumatism 11% General overall health 10%
Naturopathy General overall health 16% General overall health 10%
Colds/flu 15% Arthritis or rheumatism 9%
Digestive system problems 11% Any allergies and problems withfatigue and colds or flu
7%
Base: Used therapy in past 12 months.
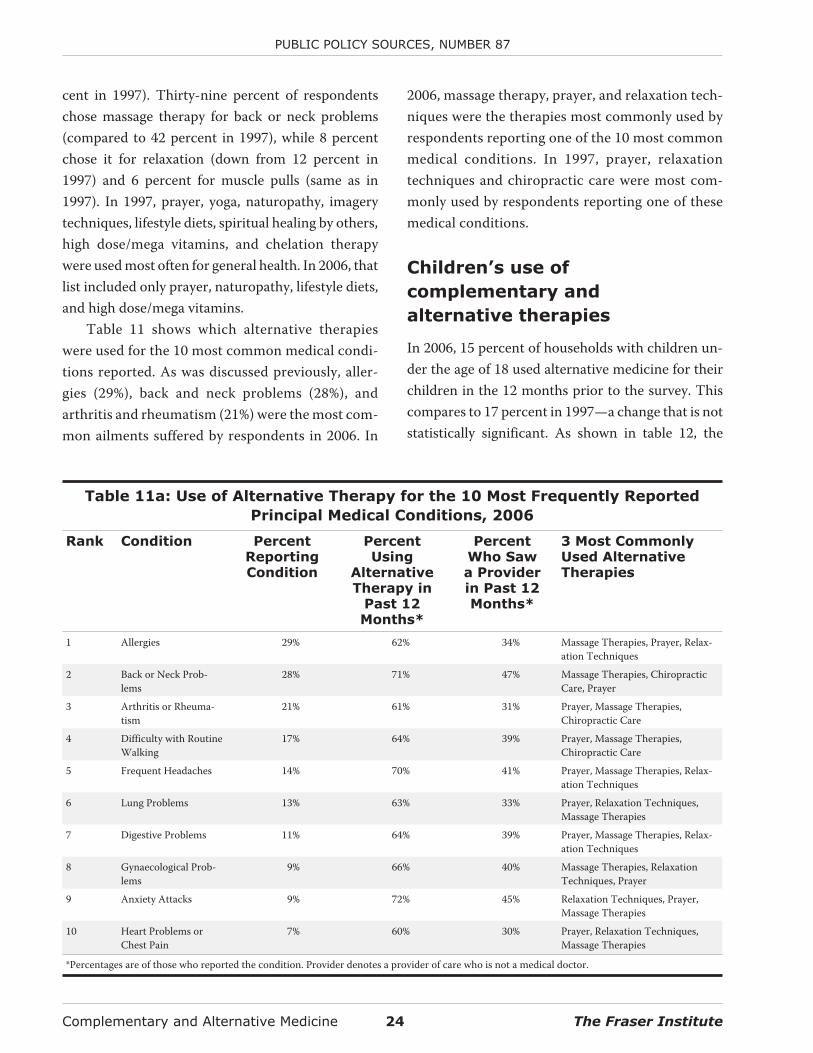
cent in 1997). Thirty-nine percent of respondentschose massage therapy for back or neck problems(compared to 42 percent in 1997), while 8 percentchose it for relaxation (down from 12 percent in1997) and 6 percent for muscle pulls (same as in1997). In 1997, prayer, yoga, naturopathy, imagerytechniques, lifestyle diets, spiritual healing by others,high dose/mega vitamins, and chelation therapywere used most often for general health. In 2006, thatlist included only prayer, naturopathy, lifestyle diets,and high dose/mega vitamins.
Table 11 shows which alternative therapieswere used for the 10 most common medical condi-tions reported. As was discussed previously, aller-gies (29%), back and neck problems (28%), andarthritis and rheumatism (21%) were the most com-mon ailments suffered by respondents in 2006. In
2006, massage therapy, prayer, and relaxation tech-niques were the therapies most commonly used byrespondents reporting one of the 10 most commonmedical conditions. In 1997, prayer, relaxationtechniques and chiropractic care were most com-monly used by respondents reporting one of thesemedical conditions.
Children’s use of
complementary and
alternative therapies
In 2006, 15 percent of households with children un-der the age of 18 used alternative medicine for theirchildren in the 12 months prior to the survey. Thiscompares to 17 percent in 1997—a change that is notstatistically significant. As shown in table 12, the
Complementary and Alternative Medicine 24 The Fraser Institute
PUBLIC POLICY SOURCES, NUMBER 87
Table 11a: Use of Alternative Therapy for the 10 Most Frequently Reported
Principal Medical Conditions, 2006
Rank Condition PercentReportingCondition
PercentUsing
AlternativeTherapy in
Past 12Months*
PercentWho Sawa Providerin Past 12Months*
3 Most CommonlyUsed AlternativeTherapies
1 Allergies 29% 62% 34% Massage Therapies, Prayer, Relax-ation Techniques
2 Back or Neck Prob-lems
28% 71% 47% Massage Therapies, ChiropracticCare, Prayer
3 Arthritis or Rheuma-tism
21% 61% 31% Prayer, Massage Therapies,Chiropractic Care
4 Difficulty with RoutineWalking
17% 64% 39% Prayer, Massage Therapies,Chiropractic Care
5 Frequent Headaches 14% 70% 41% Prayer, Massage Therapies, Relax-ation Techniques
6 Lung Problems 13% 63% 33% Prayer, Relaxation Techniques,Massage Therapies
7 Digestive Problems 11% 64% 39% Prayer, Massage Therapies, Relax-ation Techniques
8 Gynaecological Prob-lems
9% 66% 40% Massage Therapies, RelaxationTechniques, Prayer
9 Anxiety Attacks 9% 72% 45% Relaxation Techniques, Prayer,Massage Therapies
10 Heart Problems orChest Pain
7% 60% 30% Prayer, Relaxation Techniques,Massage Therapies
*Percentages are of those who reported the condition. Provider denotes a provider of care who is not a medical doctor.
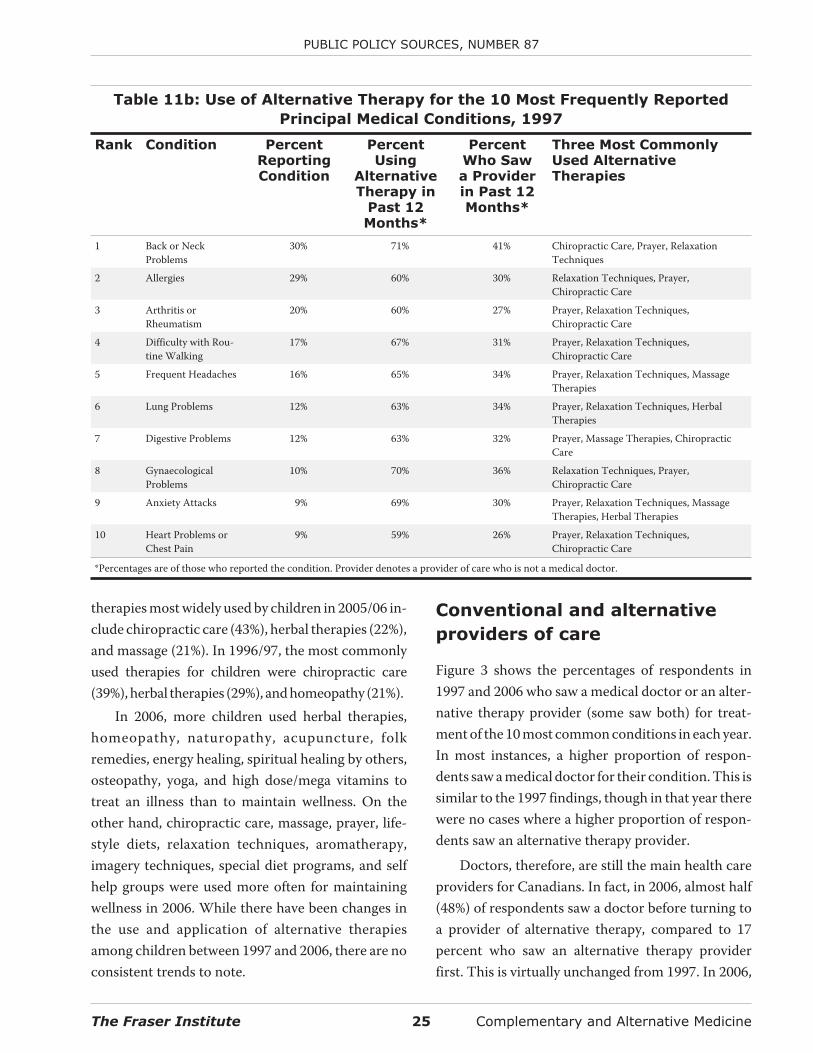
therapies most widely used by children in 2005/06 in-clude chiropractic care (43%), herbal therapies (22%),and massage (21%). In 1996/97, the most commonlyused therapies for children were chiropractic care(39%), herbal therapies (29%), and homeopathy (21%).
In 2006, more children used herbal therapies,homeopathy, naturopathy, acupuncture, folkremedies, energy healing, spiritual healing by others,osteopathy, yoga, and high dose/mega vitamins totreat an illness than to maintain wellness. On theother hand, chiropractic care, massage, prayer, life-style diets, relaxation techniques, aromatherapy,imagery techniques, special diet programs, and selfhelp groups were used more often for maintainingwellness in 2006. While there have been changes inthe use and application of alternative therapiesamong children between 1997 and 2006, there are noconsistent trends to note.
Conventional and alternative
providers of care
Figure 3 shows the percentages of respondents in1997 and 2006 who saw a medical doctor or an alter-native therapy provider (some saw both) for treat-ment of the 10 most common conditions in each year.In most instances, a higher proportion of respon-dents saw a medical doctor for their condition. This issimilar to the 1997 findings, though in that year therewere no cases where a higher proportion of respon-dents saw an alternative therapy provider.
Doctors, therefore, are still the main health careproviders for Canadians. In fact, in 2006, almost half(48%) of respondents saw a doctor before turning toa provider of alternative therapy, compared to 17percent who saw an alternative therapy providerfirst. This is virtually unchanged from 1997. In 2006,
The Fraser Institute 25 Complementary and Alternative Medicine
PUBLIC POLICY SOURCES, NUMBER 87
Table 11b: Use of Alternative Therapy for the 10 Most Frequently Reported
Principal Medical Conditions, 1997
Rank Condition PercentReportingCondition
PercentUsing
AlternativeTherapy in
Past 12Months*
PercentWho Sawa Providerin Past 12Months*
Three Most CommonlyUsed AlternativeTherapies
1 Back or NeckProblems
30% 71% 41% Chiropractic Care, Prayer, RelaxationTechniques
2 Allergies 29% 60% 30% Relaxation Techniques, Prayer,Chiropractic Care
3 Arthritis orRheumatism
20% 60% 27% Prayer, Relaxation Techniques,Chiropractic Care
4 Difficulty with Rou-tine Walking
17% 67% 31% Prayer, Relaxation Techniques,Chiropractic Care
5 Frequent Headaches 16% 65% 34% Prayer, Relaxation Techniques, MassageTherapies
6 Lung Problems 12% 63% 34% Prayer, Relaxation Techniques, HerbalTherapies
7 Digestive Problems 12% 63% 32% Prayer, Massage Therapies, ChiropracticCare
8 GynaecologicalProblems
10% 70% 36% Relaxation Techniques, Prayer,Chiropractic Care
9 Anxiety Attacks 9% 69% 30% Prayer, Relaxation Techniques, MassageTherapies, Herbal Therapies
10 Heart Problems orChest Pain
9% 59% 26% Prayer, Relaxation Techniques,Chiropractic Care
*Percentages are of those who reported the condition. Provider denotes a provider of care who is not a medical doctor.
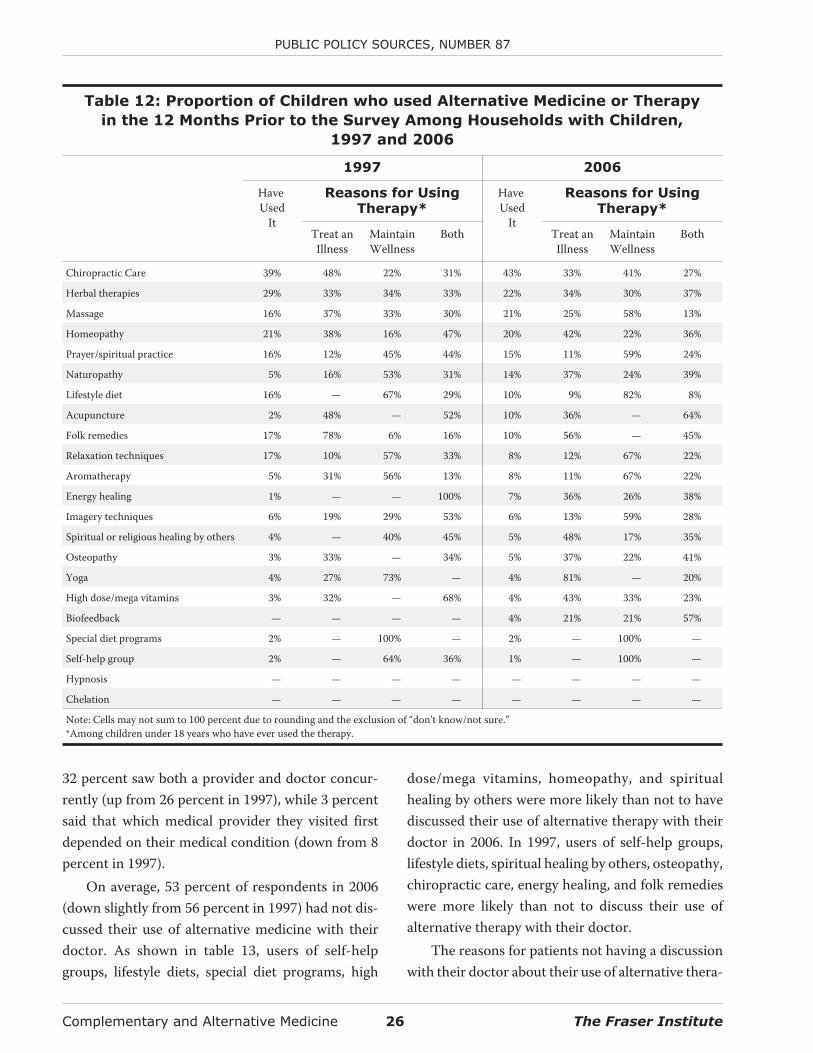
32 percent saw both a provider and doctor concur-rently (up from 26 percent in 1997), while 3 percentsaid that which medical provider they visited firstdepended on their medical condition (down from 8percent in 1997).
On average, 53 percent of respondents in 2006(down slightly from 56 percent in 1997) had not dis-cussed their use of alternative medicine with theirdoctor. As shown in table 13, users of self-helpgroups, lifestyle diets, special diet programs, high
dose/mega vitamins, homeopathy, and spiritualhealing by others were more likely than not to havediscussed their use of alternative therapy with theirdoctor in 2006. In 1997, users of self-help groups,lifestyle diets, spiritual healing by others, osteopathy,chiropractic care, energy healing, and folk remedieswere more likely than not to discuss their use ofalternative therapy with their doctor.
The reasons for patients not having a discussionwith their doctor about their use of alternative thera-
Complementary and Alternative Medicine 26 The Fraser Institute
PUBLIC POLICY SOURCES, NUMBER 87
Table 12: Proportion of Children who used Alternative Medicine or Therapy
in the 12 Months Prior to the Survey Among Households with Children,
1997 and 2006
1997 2006
HaveUsed
It
Reasons for UsingTherapy*
HaveUsed
It
Reasons for UsingTherapy*
Treat anIllness
MaintainWellness
Both Treat anIllness
MaintainWellness
Both
Chiropractic Care 39% 48% 22% 31% 43% 33% 41% 27%
Herbal therapies 29% 33% 34% 33% 22% 34% 30% 37%
Massage 16% 37% 33% 30% 21% 25% 58% 13%
Homeopathy 21% 38% 16% 47% 20% 42% 22% 36%
Prayer/spiritual practice 16% 12% 45% 44% 15% 11% 59% 24%
Naturopathy 5% 16% 53% 31% 14% 37% 24% 39%
Lifestyle diet 16% — 67% 29% 10% 9% 82% 8%
Acupuncture 2% 48% — 52% 10% 36% — 64%
Folk remedies 17% 78% 6% 16% 10% 56% — 45%
Relaxation techniques 17% 10% 57% 33% 8% 12% 67% 22%
Aromatherapy 5% 31% 56% 13% 8% 11% 67% 22%
Energy healing 1% — — 100% 7% 36% 26% 38%
Imagery techniques 6% 19% 29% 53% 6% 13% 59% 28%
Spiritual or religious healing by others 4% — 40% 45% 5% 48% 17% 35%
Osteopathy 3% 33% — 34% 5% 37% 22% 41%
Yoga 4% 27% 73% — 4% 81% — 20%
High dose/mega vitamins 3% 32% — 68% 4% 43% 33% 23%
Biofeedback — — — — 4% 21% 21% 57%
Special diet programs 2% — 100% — 2% — 100% —
Self-help group 2% — 64% 36% 1% — 100% —
Hypnosis — — — — — — — —
Chelation — — — — — — — —
Note: Cells may not sum to 100 percent due to rounding and the exclusion of “don’t know/not sure.”*Among children under 18 years who have ever used the therapy.
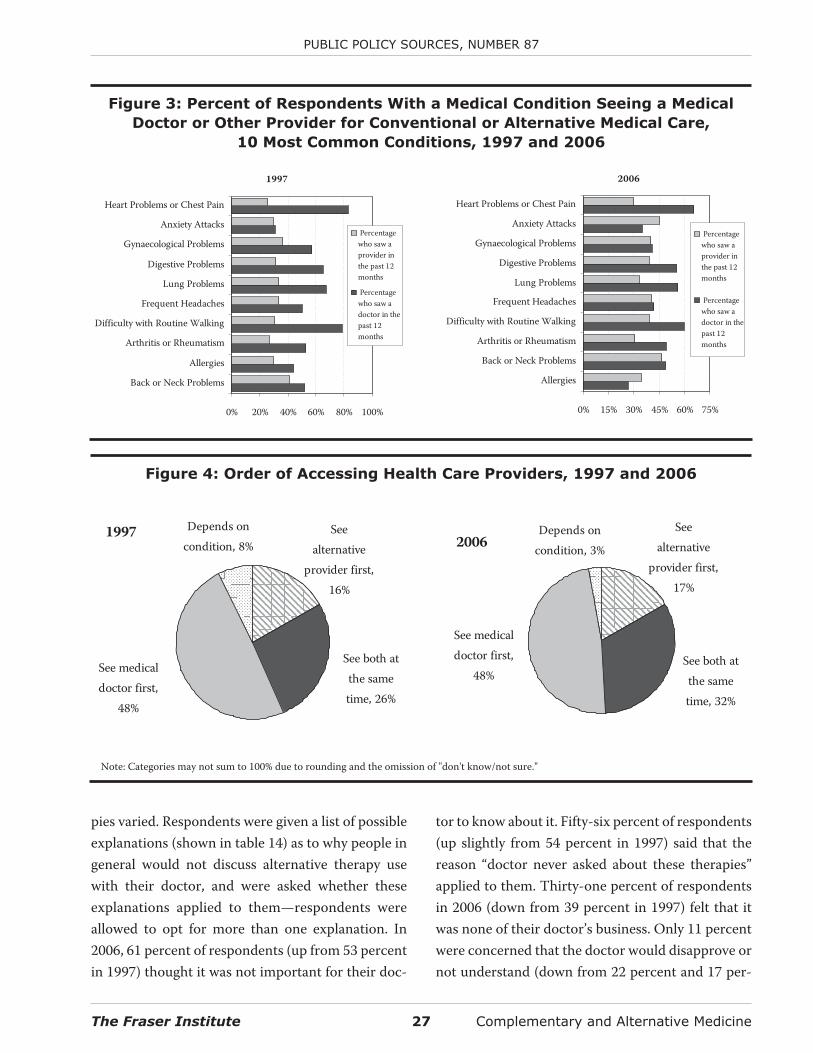
pies varied. Respondents were given a list of possibleexplanations (shown in table 14) as to why people ingeneral would not discuss alternative therapy usewith their doctor, and were asked whether theseexplanations applied to them—respondents wereallowed to opt for more than one explanation. In2006, 61 percent of respondents (up from 53 percentin 1997) thought it was not important for their doc-
tor to know about it. Fifty-six percent of respondents(up slightly from 54 percent in 1997) said that thereason “doctor never asked about these therapies”applied to them. Thirty-one percent of respondentsin 2006 (down from 39 percent in 1997) felt that itwas none of their doctor’s business. Only 11 percentwere concerned that the doctor would disapprove ornot understand (down from 22 percent and 17 per-
The Fraser Institute 27 Complementary and Alternative Medicine
PUBLIC POLICY SOURCES, NUMBER 87
Figure 4: Order of Accessing Health Care Providers, 1997 and 2006
1997 Depends oncondition, 8%
See medicaldoctor first,
48%
See both atthe sametime, 26%
Seealternative
provider first,16%
2006Depends on
condition, 3%
Seealternative
provider first,17%
See both atthe sametime, 32%
See medicaldoctor first,
48%
Note: Categories may not sum to 100% due to rounding and the omission of "don't know/not sure."
Figure 3: Percent of Respondents With a Medical Condition Seeing a Medical
Doctor or Other Provider for Conventional or Alternative Medical Care,
10 Most Common Conditions, 1997 and 2006
1997
0% 20% 40% 60% 80% 100%
Back or Neck Problems
Allergies
Arthritis or Rheumatism
Difficulty with Routine Walking
Frequent Headaches
Lung Problems
Digestive Problems
Gynaecological Problems
Anxiety Attacks
Heart Problems or Chest Pain
Percentagewho saw aprovider inthe past 12months
Percentagewho saw adoctor in thepast 12months
2006
0% 15% 30% 45% 60% 75%
Allergies
Back or Neck Problems
Arthritis or Rheumatism
Difficulty with Routine Walking
Frequent Headaches
Lung Problems
Digestive Problems
Gynaecological Problems
Anxiety Attacks
Heart Problems or Chest Pain
Percentagewho saw aprovider inthe past 12months
Percentagewho saw adoctor in thepast 12months
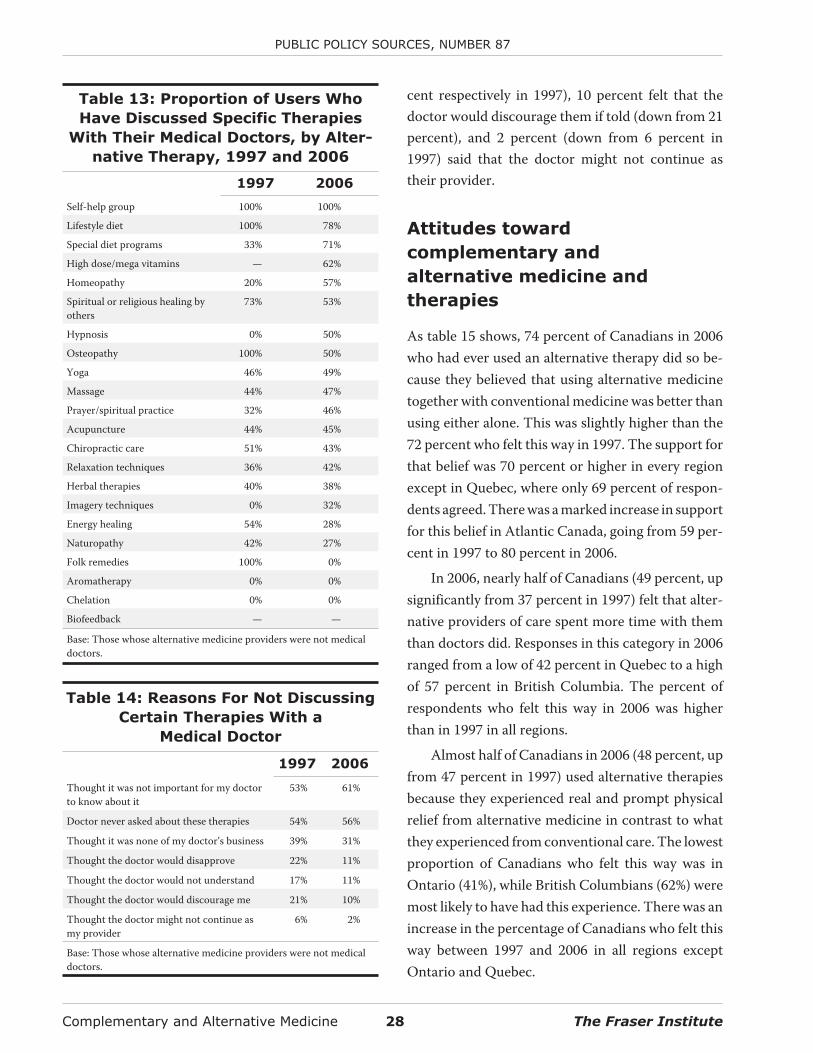
cent respectively in 1997), 10 percent felt that thedoctor would discourage them if told (down from 21percent), and 2 percent (down from 6 percent in1997) said that the doctor might not continue astheir provider.
Attitudes toward
complementary and
alternative medicine and
therapies
As table 15 shows, 74 percent of Canadians in 2006who had ever used an alternative therapy did so be-cause they believed that using alternative medicinetogether with conventional medicine was better thanusing either alone. This was slightly higher than the72 percent who felt this way in 1997. The support forthat belief was 70 percent or higher in every regionexcept in Quebec, where only 69 percent of respon-dents agreed. There was a marked increase in supportfor this belief in Atlantic Canada, going from 59 per-cent in 1997 to 80 percent in 2006.
In 2006, nearly half of Canadians (49 percent, upsignificantly from 37 percent in 1997) felt that alter-native providers of care spent more time with themthan doctors did. Responses in this category in 2006ranged from a low of 42 percent in Quebec to a highof 57 percent in British Columbia. The percent ofrespondents who felt this way in 2006 was higherthan in 1997 in all regions.
Almost half of Canadians in 2006 (48 percent, upfrom 47 percent in 1997) used alternative therapiesbecause they experienced real and prompt physicalrelief from alternative medicine in contrast to whatthey experienced from conventional care. The lowestproportion of Canadians who felt this way was inOntario (41%), while British Columbians (62%) weremost likely to have had this experience. There was anincrease in the percentage of Canadians who felt thisway between 1997 and 2006 in all regions exceptOntario and Quebec.
Complementary and Alternative Medicine 28 The Fraser Institute
PUBLIC POLICY SOURCES, NUMBER 87
Table 13: Proportion of Users Who
Have Discussed Specific Therapies
With Their Medical Doctors, by Alter-
native Therapy, 1997 and 2006
1997 2006
Self-help group 100% 100%
Lifestyle diet 100% 78%
Special diet programs 33% 71%
High dose/mega vitamins — 62%
Homeopathy 20% 57%
Spiritual or religious healing byothers
73% 53%
Hypnosis 0% 50%
Osteopathy 100% 50%
Yoga 46% 49%
Massage 44% 47%
Prayer/spiritual practice 32% 46%
Acupuncture 44% 45%
Chiropractic care 51% 43%
Relaxation techniques 36% 42%
Herbal therapies 40% 38%
Imagery techniques 0% 32%
Energy healing 54% 28%
Naturopathy 42% 27%
Folk remedies 100% 0%
Aromatherapy 0% 0%
Chelation 0% 0%
Biofeedback — —
Base: Those whose alternative medicine providers were not medicaldoctors.
Table 14: Reasons For Not Discussing
Certain Therapies With a
Medical Doctor
1997 2006
Thought it was not important for my doctorto know about it
53% 61%
Doctor never asked about these therapies 54% 56%
Thought it was none of my doctor’s business 39% 31%
Thought the doctor would disapprove 22% 11%
Thought the doctor would not understand 17% 11%
Thought the doctor would discourage me 21% 10%
Thought the doctor might not continue asmy provider
6% 2%
Base: Those whose alternative medicine providers were not medicaldoctors.
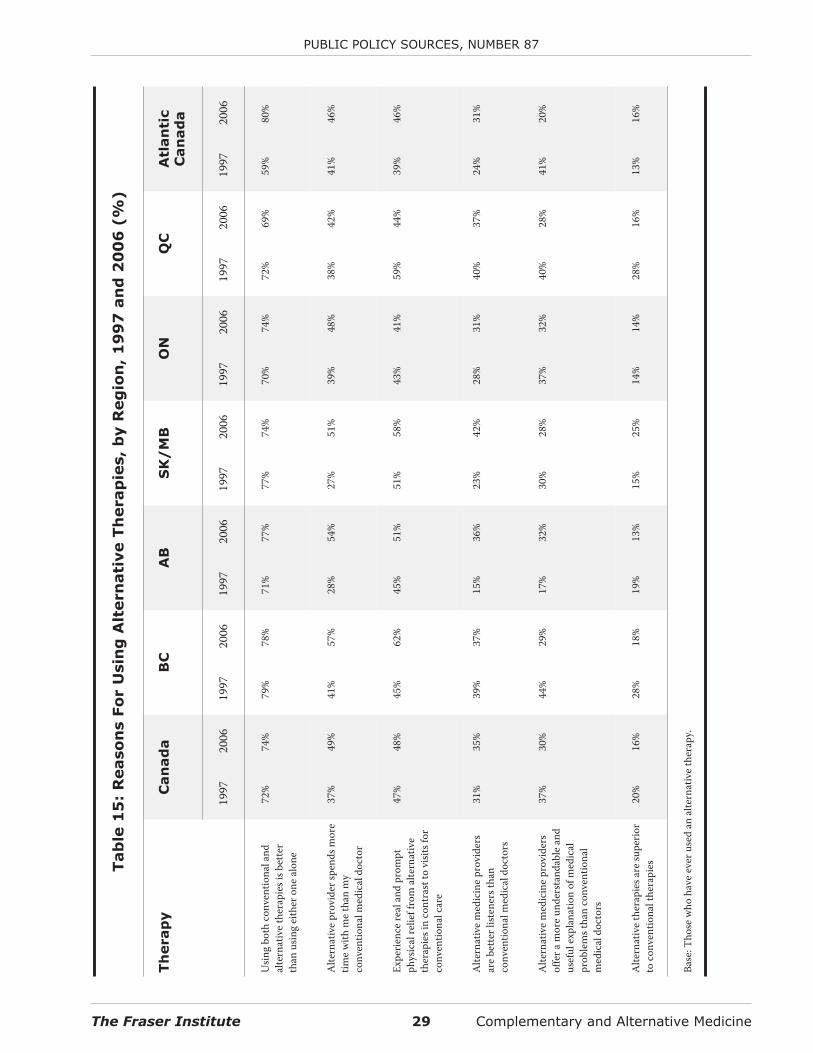
The Fraser Institute 29 Complementary and Alternative Medicine
PUBLIC POLICY SOURCES, NUMBER 87
Tab
le1
5:
Reaso
ns
Fo
rU
sin
gA
ltern
ati
ve
Th
erap
ies,
by
Reg
ion
,1
99
7an
d2
00
6(%
)
Th
erap
yC
an
ad
aB
CA
BS
K/
MB
ON
QC
Atl
an
tic
Can
ad
a
1997
2006
1997
2006
1997
2006
1997
2006
1997
2006
1997
2006
1997
2006
Usin
gbo
thco
nven
tiona
land
alte
rnat
ive
ther
apie
sisb
ette
rth
anus
ing
eith
eron
eal
one
72%
74%
79%
78%
71%
77%
77%
74%
70%
74%
72%
69%
59%
80%
Alte
rnat
ive
prov
ider
spen
dsm
ore
time
with
me
than
my
conv
entio
nalm
edic
aldo
ctor
37%
49%
41%
57%
28%
54%
27%
51%
39%
48%
38%
42%
41%
46%
Expe
rienc
ere
alan
dpr
ompt
phys
ical
relie
ffro
mal
tern
ativ
eth
erap
iesi
nco
ntra
stto
visit
sfor
conv
entio
nalc
are
47%
48%
45%
62%
45%
51%
51%
58%
43%
41%
59%
44%
39%
46%
Alte
rnat
ive
med
icin
epr
ovid
ers
are
bette
rlist
ener
stha
nco
nven
tiona
lmed
ical
doct
ors
31%
35%
39%
37%
15%
36%
23%
42%
28%
31%
40%
37%
24%
31%
Alte
rnat
ive
med
icin
epr
ovid
ers
offe
ram
ore
unde
rsta
ndab
lean
dus
eful
expl
anat
ion
ofm
edic
alpr
oble
mst
han
conv
entio
nal
med
ical
doct
ors
37%
30%
44%
29%
17%
32%
30%
28%
37%
32%
40%
28%
41%
20%
Alte
rnat
ive
ther
apie
sare
supe
rior
toco
nven
tiona
lthe
rapi
es20
%16
%28
%18
%19
%13
%15
%25
%14
%14
%28
%16
%13
%16
%
Base
:Tho
sew
hoha
veev
erus
edan
alte
rnat
ive
ther
apy.
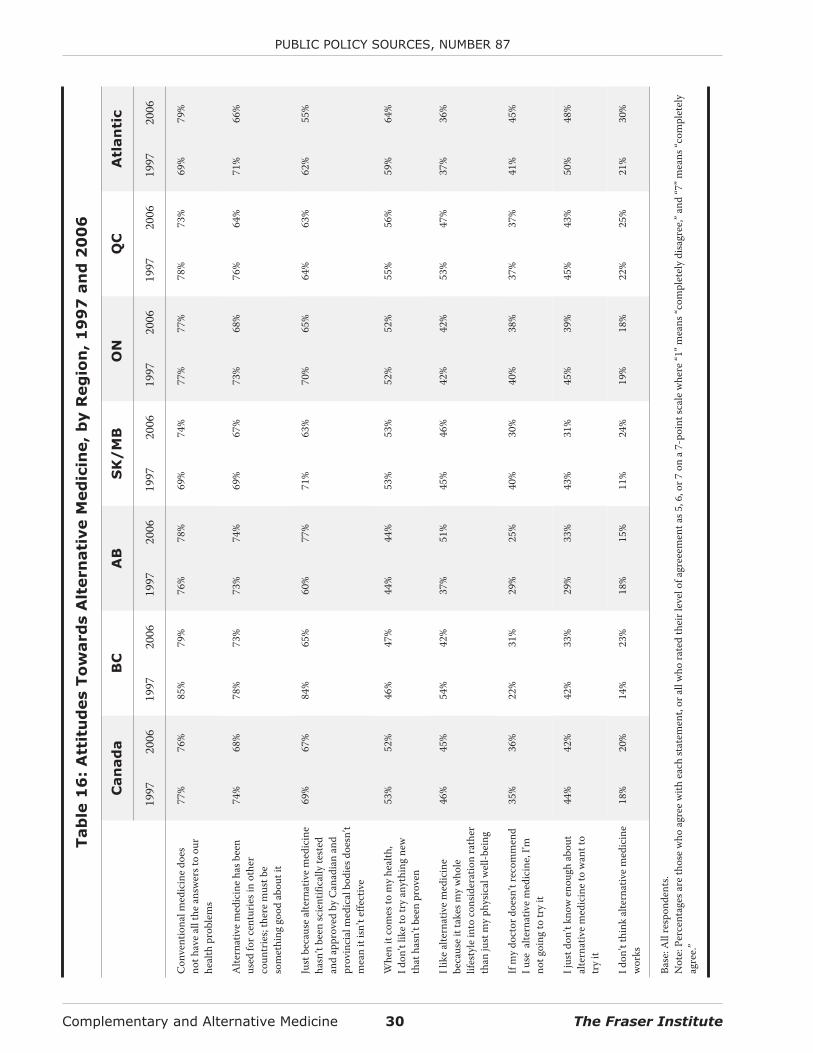
Complementary and Alternative Medicine 30 The Fraser Institute
PUBLIC POLICY SOURCES, NUMBER 87
Tab
le1
6:
Att
itu
des
To
ward
sA
ltern
ati
ve
Med
icin
e,
by
Reg
ion
,1
99
7an
d2
00
6
Can
ad
aB
CA
BS
K/
MB
ON
QC
Atl
an
tic
1997
2006
1997
2006
1997
2006
1997
2006
1997
2006
1997
2006
1997
2006
Con
vent
iona
lmed
icin
edo
esno
thav
eal
lthe
answ
erst
oou
rhe
alth
prob
lem
s
77%
76%
85%
79%
76%
78%
69%
74%
77%
77%
78%
73%
69%
79%
Alte
rnat
ive
med
icin
eha
sbee
nus
edfo
rcen
turie
sin
othe
rco
untr
ies;
ther
em
ustb
eso
met
hing
good
abou
tit
74%
68%
78%
73%
73%
74%
69%
67%
73%
68%
76%
64%
71%
66%
Just
beca
use
alte
rnat
ive
med
icin
eha
sn’t
been
scie
ntifi
cally
test
edan
dap
prov
edby
Can
adia
nan
dpr
ovin
cial
med
ical
bodi
esdo
esn’
tm
ean
itisn
’tef
fect
ive
69%
67%
84%
65%
60%
77%
71%
63%
70%
65%
64%
63%
62%
55%
Whe
nit
com
esto
my
heal
th,
Idon
’tlik
eto
try
anyt
hing
new
that
hasn
’tbe
enpr
oven
53%
52%
46%
47%
44%
44%
53%
53%
52%
52%
55%
56%
59%
64%
Ilik
eal
tern
ativ
em
edic
ine
beca
use
itta
kesm
yw
hole
lifes
tyle
into
cons
ider
atio
nra
ther
than
just
my
phys
ical
wel
l-bei
ng
46%
45%
54%
42%
37%
51%
45%
46%
42%
42%
53%
47%
37%
36%
Ifm
ydo
ctor
does
n’tr
ecom
men
dIu
seal
tern
ativ
em
edic
ine,
I’mno
tgoi
ngto
try
it
35%
36%
22%
31%
29%
25%
40%
30%
40%
38%
37%
37%
41%
45%
Ijus
tdon
’tkn
owen
ough
abou
tal
tern
ativ
em
edic
ine
tow
antt
otr
yit
44%
42%
42%
33%
29%
33%
43%
31%
45%
39%
45%
43%
50%
48%
Idon
’tth
ink
alte
rnat
ive
med
icin
ew
orks
18%
20%
14%
23%
18%
15%
11%
24%
19%
18%
22%
25%
21%
30%
Base
:All
resp
onde
nts.
Not
e:Pe
rcen
tage
sare
thos
ew
hoag
ree
with
each
stat
emen
t,or
allw
hora
ted
thei
rlev
elof
agre
eem
enta
s5,6
,or7
ona
7-po
ints
cale
whe
re“1
”mea
ns“c
ompl
etel
ydi
sagr
ee,”
and
“7”m
eans
“com
plet
ely
agre
e.”
Thirty-five percent of Canadians, ranging from31 percent in Ontario and Atlantic Canada to 42 per-cent in Saskatchewan/Manitoba, felt that providersof alternative medicine are better listeners than med-ical doctors. This was an increase in the nationalaverage, which was 31 percent in 1997. Thirty per-cent of Canadians felt that alternative providersoffered a more understandable and useful explana-tion of medical problems than conventional doctors,ranging from a high of 32 percent in Alberta andOntario to a low of 20 percent in Atlantic Canada.There were large shifts in this category between 1997and 2006.
Finally, 16 percent of Canadians (down from 20percent in 1997) felt that alternative therapies aresuperior to conventional therapies. As was the casewith the comprehensiveness of explanations, therewere significant shifts between 2006 and 1997 in thiscategory as well.
Despite only 16 percent of users feeling thatalternative therapies are superior to conventionaltherapies in 2006, 76 percent of Canadians agreedthat conventional medicine does not have “all of theanswers” to health problems, and 68 percent agreedthat since alternative medicine has been used forcenturies in other countries “there must be some-thing good about it.” Sixty-seven percent also agreedin 2006 that just because alternative medicines havenot been scientifically tested and approved by Cana-dian and provincial medical bodies does not meanthat they are not effective. These results are shown intable 16. Similar trends were seen in 1997.
Generally, British Columbians and Albertanswere the most receptive and open towards alterna-tive medicine while residents of Atlantic Canadatended to be the most sceptical or cautious in 2006.Importantly, this latter result could be the result ofattitudes about health in general: 64 percent ofAtlantic Canadians agreed with the statement “whenit comes to my health, I don’t like to try anything thathasn’t been proven,” as compared to 56 percent ofQuebecers, 52 percent of Ontarians, 53 percent of
residents of Saskatchewan/Manitoba, 44 percent ofAlbertans, and 47 percent of British Columbians.Atlantic Canadians were also the most likely to agreewith the statement that “if my doctor doesn’t recom-mend I use alternative medicine, I’m not going to tryit.” Forty-five percent of Atlantic Canadians agreedwith this statement, compared with 25 percent ofAlbertans, 31 percent of British Columbians, and aCanadian average of 36 percent. These trends are allsimilar to those seen in 1997, with the notableexception of a seemingly greater acceptance of andopenness towards alternative therapies in Alberta(table 16).
National projections of use
and expenditures
The survey data indicate that 54 percent of Canadi-ans used alternative medicine in 2005/06. This com-pares to 50 percent of Canadians in 1996/97. Putanother way, in 2005/06 there were more than 17.6million people spending their own money, in addi-tion to their taxes (which mainly go toward conven-tional modes of health care), on complementary andalternative medicine. This is in addition to the mon-ies spent both privately and through tax-fundedsources on conventional medicine, includingpharmaceuticals, dental care, and conventional med-ical treatment by physicians and hospitals.
While respondents who used chiropractic carereported that about 72 percent of the costs were cov-ered by health insurance in 2006 (down slightly from75 percent in 1997), insurance coverage was below10 percent for respondents using high dose/megavitamins (8% versus 12% in 1997), relaxation (8% ver-sus 9% in 1997), folk remedy (7% versus 4% in 1997),lifestyle diet (7% versus 11% in 1997), herbal thera-pies (5% versus 2% in 1997), energy healing (3% ver-sus 7% in 1997), yoga (2% versus 0% in 1997),aromatherapy (0% versus 5% in 1997), biofeedback(0% versus 0% in 1997), and chelation (0% versus 35%in 1997). Between 1997 and 2006, the costs of mas-
The Fraser Institute 31 Complementary and Alternative Medicine
PUBLIC POLICY SOURCES, NUMBER 87
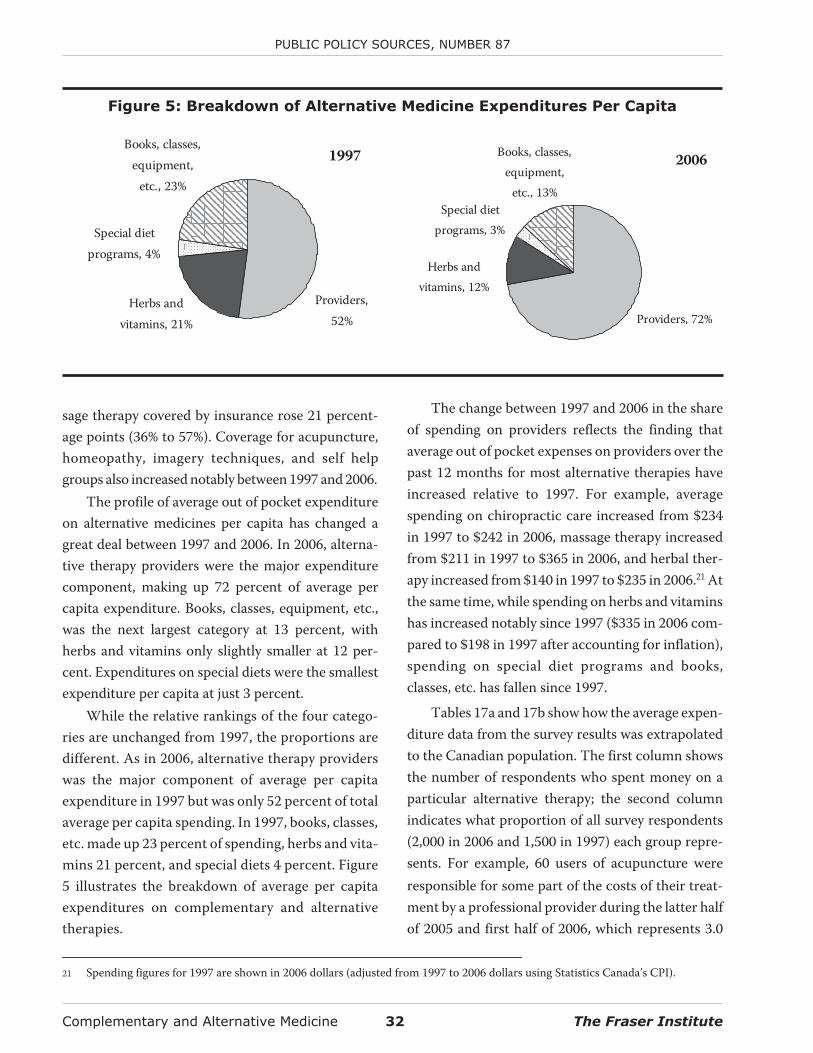
sage therapy covered by insurance rose 21 percent-age points (36% to 57%). Coverage for acupuncture,homeopathy, imagery techniques, and self helpgroups also increased notably between 1997 and 2006.
The profile of average out of pocket expenditureon alternative medicines per capita has changed agreat deal between 1997 and 2006. In 2006, alterna-tive therapy providers were the major expenditurecomponent, making up 72 percent of average percapita expenditure. Books, classes, equipment, etc.,was the next largest category at 13 percent, withherbs and vitamins only slightly smaller at 12 per-cent. Expenditures on special diets were the smallestexpenditure per capita at just 3 percent.
While the relative rankings of the four catego-ries are unchanged from 1997, the proportions aredifferent. As in 2006, alternative therapy providerswas the major component of average per capitaexpenditure in 1997 but was only 52 percent of totalaverage per capita spending. In 1997, books, classes,etc. made up 23 percent of spending, herbs and vita-mins 21 percent, and special diets 4 percent. Figure5 illustrates the breakdown of average per capitaexpenditures on complementary and alternativetherapies.
The change between 1997 and 2006 in the shareof spending on providers reflects the finding thataverage out of pocket expenses on providers over thepast 12 months for most alternative therapies haveincreased relative to 1997. For example, averagespending on chiropractic care increased from $234in 1997 to $242 in 2006, massage therapy increasedfrom $211 in 1997 to $365 in 2006, and herbal ther-apy increased from $140 in 1997 to $235 in 2006.21 Atthe same time, while spending on herbs and vitaminshas increased notably since 1997 ($335 in 2006 com-pared to $198 in 1997 after accounting for inflation),spending on special diet programs and books,classes, etc. has fallen since 1997.
Tables 17a and 17b show how the average expen-diture data from the survey results was extrapolatedto the Canadian population. The first column showsthe number of respondents who spent money on aparticular alternative therapy; the second columnindicates what proportion of all survey respondents(2,000 in 2006 and 1,500 in 1997) each group repre-sents. For example, 60 users of acupuncture wereresponsible for some part of the costs of their treat-ment by a professional provider during the latter halfof 2005 and first half of 2006, which represents 3.0
Complementary and Alternative Medicine 32 The Fraser Institute
PUBLIC POLICY SOURCES, NUMBER 87
Figure 5: Breakdown of Alternative Medicine Expenditures Per Capita
1997
Providers,52%
Herbs andvitamins, 21%
Special dietprograms, 4%
Books, classes,equipment,
etc., 23%
2006
Providers, 72%
Special dietprograms, 3%
Herbs andvitamins, 12%
Books, classes,equipment,
etc., 13%
21 Spending figures for 1997 are shown in 2006 dollars (adjusted from 1997 to 2006 dollars using Statistics Canada’s CPI).
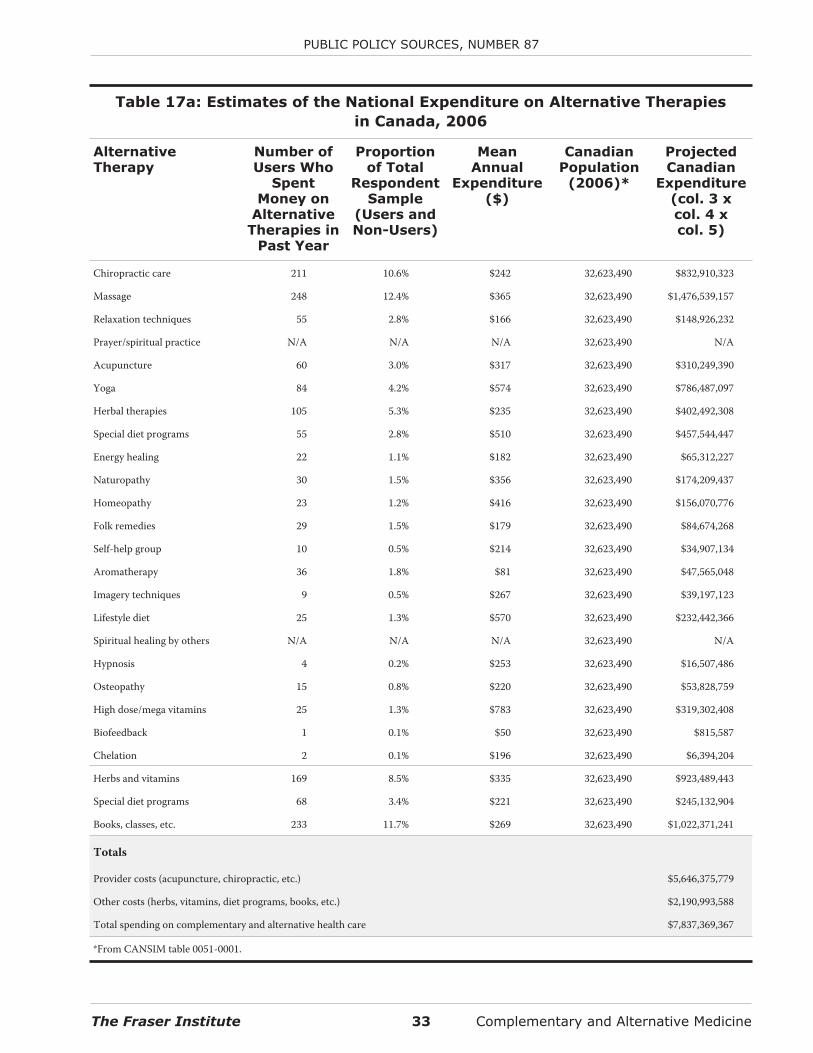
The Fraser Institute 33 Complementary and Alternative Medicine
PUBLIC POLICY SOURCES, NUMBER 87
Table 17a: Estimates of the National Expenditure on Alternative Therapies
in Canada, 2006
AlternativeTherapy
Number ofUsers Who
SpentMoney on
AlternativeTherapies in
Past Year
Proportionof Total
RespondentSample
(Users andNon-Users)
MeanAnnual
Expenditure($)
CanadianPopulation
(2006)*
ProjectedCanadian
Expenditure(col. 3 xcol. 4 xcol. 5)
Chiropractic care 211 10.6% $242 32,623,490 $832,910,323
Massage 248 12.4% $365 32,623,490 $1,476,539,157
Relaxation techniques 55 2.8% $166 32,623,490 $148,926,232
Prayer/spiritual practice N/A N/A N/A 32,623,490 N/A
Acupuncture 60 3.0% $317 32,623,490 $310,249,390
Yoga 84 4.2% $574 32,623,490 $786,487,097
Herbal therapies 105 5.3% $235 32,623,490 $402,492,308
Special diet programs 55 2.8% $510 32,623,490 $457,544,447
Energy healing 22 1.1% $182 32,623,490 $65,312,227
Naturopathy 30 1.5% $356 32,623,490 $174,209,437
Homeopathy 23 1.2% $416 32,623,490 $156,070,776
Folk remedies 29 1.5% $179 32,623,490 $84,674,268
Self-help group 10 0.5% $214 32,623,490 $34,907,134
Aromatherapy 36 1.8% $81 32,623,490 $47,565,048
Imagery techniques 9 0.5% $267 32,623,490 $39,197,123
Lifestyle diet 25 1.3% $570 32,623,490 $232,442,366
Spiritual healing by others N/A N/A N/A 32,623,490 N/A
Hypnosis 4 0.2% $253 32,623,490 $16,507,486
Osteopathy 15 0.8% $220 32,623,490 $53,828,759
High dose/mega vitamins 25 1.3% $783 32,623,490 $319,302,408
Biofeedback 1 0.1% $50 32,623,490 $815,587
Chelation 2 0.1% $196 32,623,490 $6,394,204
Herbs and vitamins 169 8.5% $335 32,623,490 $923,489,443
Special diet programs 68 3.4% $221 32,623,490 $245,132,904
Books, classes, etc. 233 11.7% $269 32,623,490 $1,022,371,241
Totals
Provider costs (acupuncture, chiropractic, etc.) $5,646,375,779
Other costs (herbs, vitamins, diet programs, books, etc.) $2,190,993,588
Total spending on complementary and alternative health care $7,837,369,367
*From CANSIM table 0051-0001.
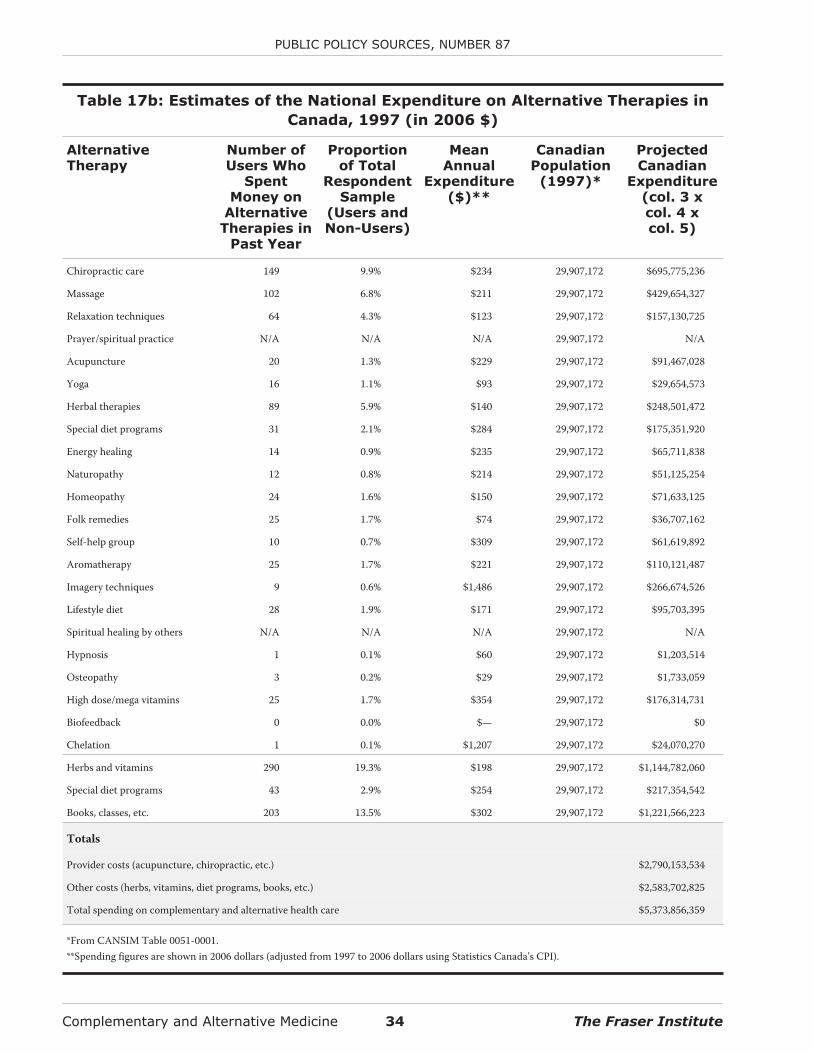
Complementary and Alternative Medicine 34 The Fraser Institute
PUBLIC POLICY SOURCES, NUMBER 87
Table 17b: Estimates of the National Expenditure on Alternative Therapies in
Canada, 1997 (in 2006 $)
AlternativeTherapy
Number ofUsers Who
SpentMoney on
AlternativeTherapies in
Past Year
Proportionof Total
RespondentSample
(Users andNon-Users)
MeanAnnual
Expenditure($)**
CanadianPopulation
(1997)*
ProjectedCanadian
Expenditure(col. 3 xcol. 4 xcol. 5)
Chiropractic care 149 9.9% $234 29,907,172 $695,775,236
Massage 102 6.8% $211 29,907,172 $429,654,327
Relaxation techniques 64 4.3% $123 29,907,172 $157,130,725
Prayer/spiritual practice N/A N/A N/A 29,907,172 N/A
Acupuncture 20 1.3% $229 29,907,172 $91,467,028
Yoga 16 1.1% $93 29,907,172 $29,654,573
Herbal therapies 89 5.9% $140 29,907,172 $248,501,472
Special diet programs 31 2.1% $284 29,907,172 $175,351,920
Energy healing 14 0.9% $235 29,907,172 $65,711,838
Naturopathy 12 0.8% $214 29,907,172 $51,125,254
Homeopathy 24 1.6% $150 29,907,172 $71,633,125
Folk remedies 25 1.7% $74 29,907,172 $36,707,162
Self-help group 10 0.7% $309 29,907,172 $61,619,892
Aromatherapy 25 1.7% $221 29,907,172 $110,121,487
Imagery techniques 9 0.6% $1,486 29,907,172 $266,674,526
Lifestyle diet 28 1.9% $171 29,907,172 $95,703,395
Spiritual healing by others N/A N/A N/A 29,907,172 N/A
Hypnosis 1 0.1% $60 29,907,172 $1,203,514
Osteopathy 3 0.2% $29 29,907,172 $1,733,059
High dose/mega vitamins 25 1.7% $354 29,907,172 $176,314,731
Biofeedback 0 0.0% $— 29,907,172 $0
Chelation 1 0.1% $1,207 29,907,172 $24,070,270
Herbs and vitamins 290 19.3% $198 29,907,172 $1,144,782,060
Special diet programs 43 2.9% $254 29,907,172 $217,354,542
Books, classes, etc. 203 13.5% $302 29,907,172 $1,221,566,223
Totals
Provider costs (acupuncture, chiropractic, etc.) $2,790,153,534
Other costs (herbs, vitamins, diet programs, books, etc.) $2,583,702,825
Total spending on complementary and alternative health care $5,373,856,359
*From CANSIM Table 0051-0001.**Spending figures are shown in 2006 dollars (adjusted from 1997 to 2006 dollars using Statistics Canada’s CPI).
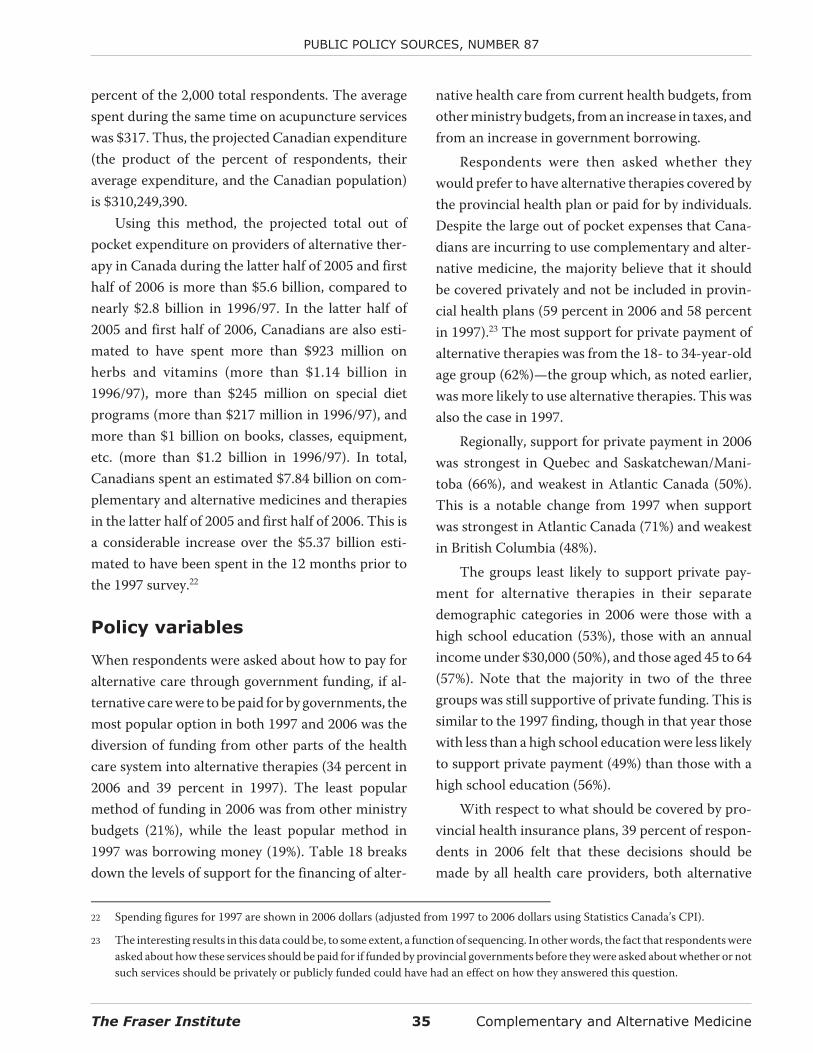
percent of the 2,000 total respondents. The averagespent during the same time on acupuncture serviceswas $317. Thus, the projected Canadian expenditure(the product of the percent of respondents, theiraverage expenditure, and the Canadian population)is $310,249,390.
Using this method, the projected total out ofpocket expenditure on providers of alternative ther-apy in Canada during the latter half of 2005 and firsthalf of 2006 is more than $5.6 billion, compared tonearly $2.8 billion in 1996/97. In the latter half of2005 and first half of 2006, Canadians are also esti-mated to have spent more than $923 million onherbs and vitamins (more than $1.14 billion in1996/97), more than $245 million on special dietprograms (more than $217 million in 1996/97), andmore than $1 billion on books, classes, equipment,etc. (more than $1.2 billion in 1996/97). In total,Canadians spent an estimated $7.84 billion on com-plementary and alternative medicines and therapiesin the latter half of 2005 and first half of 2006. This isa considerable increase over the $5.37 billion esti-mated to have been spent in the 12 months prior tothe 1997 survey.22
Policy variables
When respondents were asked about how to pay foralternative care through government funding, if al-ternative care were to be paid for by governments, themost popular option in both 1997 and 2006 was thediversion of funding from other parts of the healthcare system into alternative therapies (34 percent in2006 and 39 percent in 1997). The least popularmethod of funding in 2006 was from other ministrybudgets (21%), while the least popular method in1997 was borrowing money (19%). Table 18 breaksdown the levels of support for the financing of alter-
native health care from current health budgets, fromother ministry budgets, from an increase in taxes, andfrom an increase in government borrowing.
Respondents were then asked whether theywould prefer to have alternative therapies covered bythe provincial health plan or paid for by individuals.Despite the large out of pocket expenses that Cana-dians are incurring to use complementary and alter-native medicine, the majority believe that it shouldbe covered privately and not be included in provin-cial health plans (59 percent in 2006 and 58 percentin 1997).23 The most support for private payment ofalternative therapies was from the 18- to 34-year-oldage group (62%)—the group which, as noted earlier,was more likely to use alternative therapies. This wasalso the case in 1997.
Regionally, support for private payment in 2006was strongest in Quebec and Saskatchewan/Mani-toba (66%), and weakest in Atlantic Canada (50%).This is a notable change from 1997 when supportwas strongest in Atlantic Canada (71%) and weakestin British Columbia (48%).
The groups least likely to support private pay-ment for alternative therapies in their separatedemographic categories in 2006 were those with ahigh school education (53%), those with an annualincome under $30,000 (50%), and those aged 45 to 64(57%). Note that the majority in two of the threegroups was still supportive of private funding. This issimilar to the 1997 finding, though in that year thosewith less than a high school education were less likelyto support private payment (49%) than those with ahigh school education (56%).
With respect to what should be covered by pro-vincial health insurance plans, 39 percent of respon-dents in 2006 felt that these decisions should bemade by all health care providers, both alternative
The Fraser Institute 35 Complementary and Alternative Medicine
PUBLIC POLICY SOURCES, NUMBER 87
22 Spending figures for 1997 are shown in 2006 dollars (adjusted from 1997 to 2006 dollars using Statistics Canada’s CPI).
23 The interesting results in this data could be, to some extent, a function of sequencing. In other words, the fact that respondents wereasked about how these services should be paid for if funded by provincial governments before they were asked about whether or notsuch services should be privately or publicly funded could have had an effect on how they answered this question.
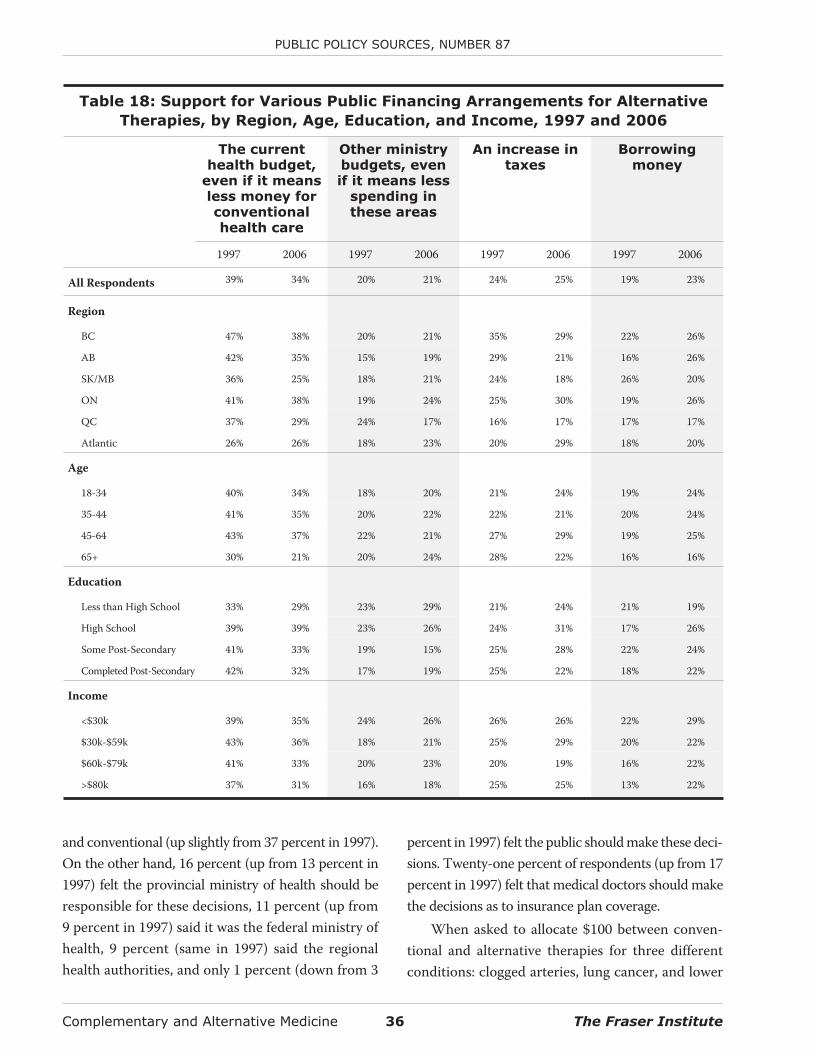
and conventional (up slightly from 37 percent in 1997).On the other hand, 16 percent (up from 13 percent in1997) felt the provincial ministry of health should beresponsible for these decisions, 11 percent (up from9 percent in 1997) said it was the federal ministry ofhealth, 9 percent (same in 1997) said the regionalhealth authorities, and only 1 percent (down from 3
percent in 1997) felt the public should make these deci-sions. Twenty-one percent of respondents (up from 17percent in 1997) felt that medical doctors should makethe decisions as to insurance plan coverage.
When asked to allocate $100 between conven-tional and alternative therapies for three differentconditions: clogged arteries, lung cancer, and lower
Complementary and Alternative Medicine 36 The Fraser Institute
PUBLIC POLICY SOURCES, NUMBER 87
Table 18: Support for Various Public Financing Arrangements for Alternative
Therapies, by Region, Age, Education, and Income, 1997 and 2006
The currenthealth budget,
even if it meansless money forconventionalhealth care
Other ministrybudgets, evenif it means less
spending inthese areas
An increase intaxes
Borrowingmoney
1997 2006 1997 2006 1997 2006 1997 2006
All Respondents 39% 34% 20% 21% 24% 25% 19% 23%
Region
BC 47% 38% 20% 21% 35% 29% 22% 26%
AB 42% 35% 15% 19% 29% 21% 16% 26%
SK/MB 36% 25% 18% 21% 24% 18% 26% 20%
ON 41% 38% 19% 24% 25% 30% 19% 26%
QC 37% 29% 24% 17% 16% 17% 17% 17%
Atlantic 26% 26% 18% 23% 20% 29% 18% 20%
Age
18-34 40% 34% 18% 20% 21% 24% 19% 24%
35-44 41% 35% 20% 22% 22% 21% 20% 24%
45-64 43% 37% 22% 21% 27% 29% 19% 25%
65+ 30% 21% 20% 24% 28% 22% 16% 16%
Education
Less than High School 33% 29% 23% 29% 21% 24% 21% 19%
High School 39% 39% 23% 26% 24% 31% 17% 26%
Some Post-Secondary 41% 33% 19% 15% 25% 28% 22% 24%
Completed Post-Secondary 42% 32% 17% 19% 25% 22% 18% 22%
Income
<$30k 39% 35% 24% 26% 26% 26% 22% 29%
$30k-$59k 43% 36% 18% 21% 25% 29% 20% 22%
$60k-$79k 41% 33% 20% 23% 20% 19% 16% 22%
>$80k 37% 31% 16% 18% 25% 25% 13% 22%
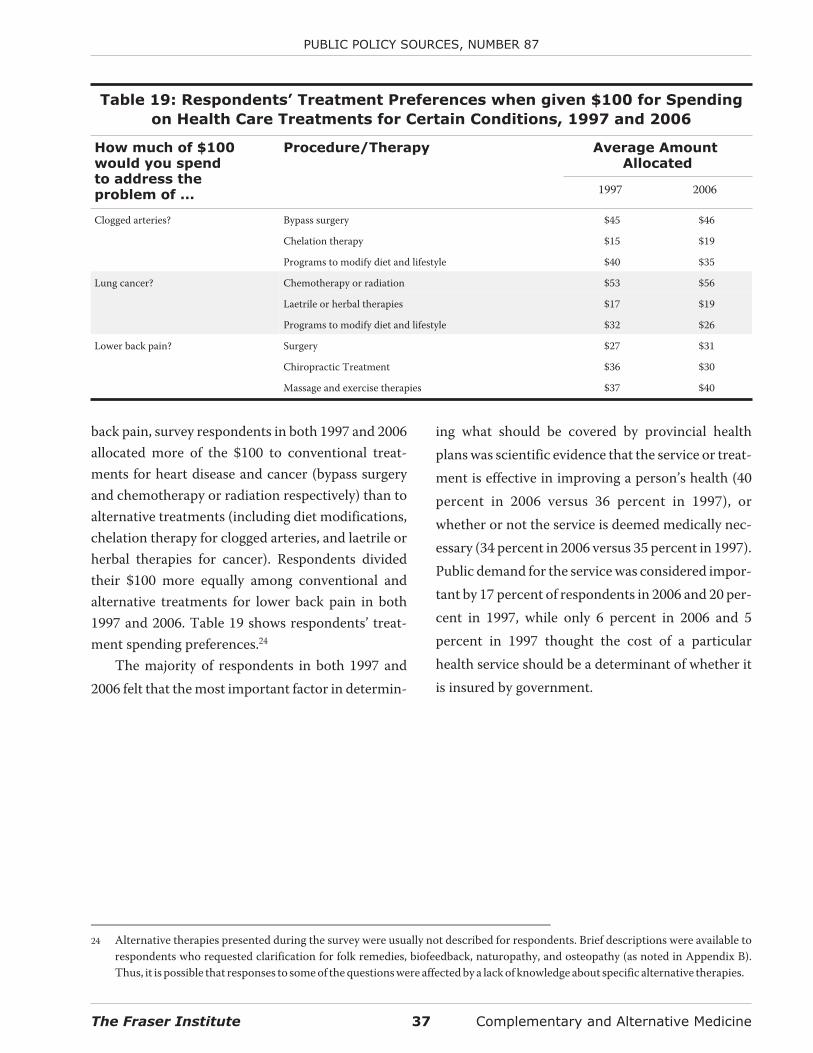
back pain, survey respondents in both 1997 and 2006allocated more of the $100 to conventional treat-ments for heart disease and cancer (bypass surgeryand chemotherapy or radiation respectively) than toalternative treatments (including diet modifications,chelation therapy for clogged arteries, and laetrile orherbal therapies for cancer). Respondents dividedtheir $100 more equally among conventional andalternative treatments for lower back pain in both1997 and 2006. Table 19 shows respondents’ treat-ment spending preferences.24
The majority of respondents in both 1997 and2006 felt that the most important factor in determin-
ing what should be covered by provincial healthplans was scientific evidence that the service or treat-ment is effective in improving a person’s health (40percent in 2006 versus 36 percent in 1997), orwhether or not the service is deemed medically nec-essary (34 percent in 2006 versus 35 percent in 1997).Public demand for the service was considered impor-tant by 17 percent of respondents in 2006 and 20 per-cent in 1997, while only 6 percent in 2006 and 5percent in 1997 thought the cost of a particularhealth service should be a determinant of whether itis insured by government.
The Fraser Institute 37 Complementary and Alternative Medicine
PUBLIC POLICY SOURCES, NUMBER 87
Table 19: Respondents’ Treatment Preferences when given $100 for Spending
on Health Care Treatments for Certain Conditions, 1997 and 2006
How much of $100would you spendto address theproblem of ...
Procedure/Therapy Average AmountAllocated
1997 2006
Clogged arteries? Bypass surgery $45 $46
Chelation therapy $15 $19
Programs to modify diet and lifestyle $40 $35
Lung cancer? Chemotherapy or radiation $53 $56
Laetrile or herbal therapies $17 $19
Programs to modify diet and lifestyle $32 $26
Lower back pain? Surgery $27 $31
Chiropractic Treatment $36 $30
Massage and exercise therapies $37 $40
24 Alternative therapies presented during the survey were usually not described for respondents. Brief descriptions were available torespondents who requested clarification for folk remedies, biofeedback, naturopathy, and osteopathy (as noted in Appendix B).Thus, it is possible that responses to some of the questions were affected by a lack of knowledge about specific alternative therapies.
Discussion
The most common problems from which Canadiansare suffering in 2006 are chronic: allergies, back orneck problems, and arthritis and rheumatism. Theseconditions are more likely to require wellness care,not just symptomatic treatment. It is not surprising,then, to find that the majority of Canadians have triedcomplementary and alternative medicines and thera-pies at some point during their life despite the factthat coverage of such treatments by governmenthealth insurance plans is usually restricted. Even inprivate group benefit insurance plans, coverage ofsuch alternative therapies as chiropractic and mas-sage is only partial. However, it should be noted thatthe private supplementary insurance marketplace inCanada is now increasingly moving away fromone-size-fits-all models to flexible benefits plansand health care spending accounts, both of whichprovide greater individual choice with respect towhich services individuals are able to have covered bytheir insurance.
Despite the increasing desire by Canadians formore control over their health care deci-sions—which is partially manifested in their interestin alternative medicine—doctors are still the mainproviders of health care in Canada. Almost half ofrespondents in 2006 saw a doctor before turning to aprovider of alternative therapy. In addition, a higherproportion of respondents saw a medical doctor fortheir condition regarding treatment of 8 of the 10most common medical conditions.
Canadians spent an estimated approximately$7.8 billion out of pocket on alternative medicine inthe latter half of 2005 and first half of 2006, which is asignificant increase from the nearly $5.4 billion(inflation-adjusted) estimated to have been spent inthe latter half of 1996 and first half of 1997. In 2006,more than $5.6 billion was spent on providers ofalternative therapy, while another $2.2 billion wasspent on herbs, vitamins, special diet programs,
books, classes, and equipment. These are not insub-stantial amounts, which helps explain why there hasbeen so much discussion about government policyand insurance coverage regarding alternative thera-pies in Canada.
Before considering adding alternative medicinesto publicly funded insurance programs however,governments should note that despite incurringlarge out of pocket expenses, the majority of Canadi-ans believe that alternative therapies should be paidfor privately and not by provincial health plans. Mostimportantly, the highest level of support for privatepayment came from the group that used alternativetherapy the most: 58 percent of 18- to 34-year-oldsused alternative therapies in the 12 months prior tothe 2006 survey, and 62 percent of them preferredthat individuals pay for it privately.
With respect to what should be covered by pro-vincial health insurance plans, most respondents feltthat these decisions should be made by all health careproviders (39%) and less often by provincial govern-ments (16%), the federal government (11%), orregional health authorities (9%). This suggests thatneglecting to include doctors, nurses, and otherhealth professionals, as governments have oftendone in the past, is not a successful tactic to elicitpublic support for health care reforms. Similarlymisguided is spending a lot of time and effort in pub-lic consultations—only 1 percent of respondents feltthat the public should make coverage decisions.
The regional variations in attitudes toward healthcare (both conventional and alternative) revealed bythis survey suggest that any effort to create nationalalternative medicine programs will not likely succeed.For example, British Columbians and Albertans weremore likely to perceive value in alternative therapiesthan residents of other provinces, while AtlanticCanadians were most sceptical. As well, 64 percent ofAtlantic Canadians “did not like to try anything newthat hasn’t been proven” when it comes to their
Complementary and Alternative Medicine 38 The Fraser Institute
health, compared to 47 percent of BritishColumbians and 44 percent of Albertans. Finally, 45percent of Atlantic Canadians versus 25 percent of
Albertans would only use alternative medicine if itwere recommended by their doctor. National con-sensus on such issues seems improbable.
The Fraser Institute 39 Complementary and Alternative Medicine
PUBLIC POLICY SOURCES, NUMBER 87
Appendix A: Detailed Survey Methodology
The methodology used in the 2006 follow-up surveywas in most cases similar to that used in the first sur-vey (1997). The complete methodology used in boththe 1997 and 2006 surveys is described below with thedifferences between the two highlighted in the text.
As in 1997, The Fraser Institute commissionedIpsos Reid (then Angus Reid Group) to conduct atelephone survey of Canadians about their healthstatus and their attitudes towards, and patterns ofuse of, conventional and complementary and alter-native health care. In 2006, a total of 2,000 interviewswere conducted in English and French with a ran-domly selected sample of adults 18 years of age andolder. This increase of 500 interviews from the 1,500completed in 1997 was implemented to allow greaterstatistical power in examining changes between 1997and 2006.
With regard to the accuracy of the findings, thereis a 95 percent chance that the average values for theentire Canadian population are within 2.2 percent-age points of the survey percentages in 2006. In 1997,the margin of error was 2.5 percentage points. Inaddition, the increase in the number of interviewscompleted in 2006 allows for 95 percent statisticalconfidence in detecting a 3 percentage point changein the percent of Canadians who have used comple-mentary and alternative medical therapies sometimein their lives.
The original survey questionnaire used in 1997was based on a survey used by the Center for Alter-native Medicine Research (based at Harvard MedicalSchool and Beth Israel Hospital) in its pioneeringwork on alternative medicine use and costs in theUnited States. This work was published in the NewEngland Journal of Medicine in 1993, and followedup with a survey published in the Journal of the
American Medical Association in 1998 (Eisenberg etal., 1993; Eisenberg et al., 1998). Several modifica-tions were made by The Fraser Institute and IpsosReid (then Angus Reid Group) in order to make thesurvey appropriate for Canada in 1997, given that thehealth insurance systems of the two countries differsubstantially. The 2006 follow-up survey used essen-tially the same survey questionnaire employed in the1997 survey. However, due to a secular trend inlower survey response resulting from the changingenvironment within which public opinion polling isbeing conducted, some adjustments were made tokeep questionnaire length at or below 20 minutes.
The most significant change made to the surveywas a split-sampling of the sections on beliefs andperceptions and health care policy options. Ques-tions in both of these sections were asked to only 200of the respondents, while 900 respondents answeredonly questions on beliefs and perceptions, and theremaining 900 answered only questions on healthcare policy options. This change allowed for a signifi-cant reduction in interviewing time and had only asmall impact on the statistical power of the follow-upsurvey.25 In addition, having 200 respondents answerquestions in both sections made allowances for test-ing and controlling for any potential bias that wasintroduced by the split sampling (discussed below).
Two additional less-significant changes weremade in 2006: in the section on policy variables, thequestion on support for a government-funded healthsavings account was dropped, and demographicquestions on ethnicity and religious preference weredropped.
In order to minimize any potential seasonal biasin responses, the 2006 survey was completed at thesame time of year as the 1997 survey. The question-
Complementary and Alternative Medicine 40 The Fraser Institute
25 For example, had the sample size for the full survey been reduced from 2,000 respondents to 1,100 respondents, the observed changerequired in the share of Canadians who had ever used complementary and alternative therapies for 95 percent statistical confidencewould have grown from 3 percentage points to 4.
naire pre-test for 2006 took place on June 15. IpsosReid completed 51 initial pre-test interviews (6 inBC, 5 in Alberta, 4 in Saskatchewan and Manitoba,20 in Ontario, 12 in Quebec, and 4 in Atlantic Can-ada). This compares to 50 pre-test interviews (25 inVancouver and 25 in Toronto) completed from May16 to 18, 1997. No changes were made to the 2006survey following the pre-test. The remaining surveyrespondents were contacted between June 19 andJuly 7, 2006. This compares to a survey period of May29 to June 16, 1997.
The 2006 questionnaire took an average of 18.4minutes to complete. The 1997 survey questionnairetook an average of 28 minutes to complete.
The sample
Ipsos Reid has developed an annually updated data-base of so-called “100-banks” used by telephonecompanies across the country. A 100-bank containsthe first five digits of a telephone number, sorted byarea code. Once a 100-bank is selected for an area, acomputer randomly generates the last 2 digits to cre-ate a potential phone number. This random diallingprocedure ensures that all listed and non-listed tele-phone numbers are contacted. Once any specifica-tions—such as making the sample representative ofthe population—are included, the final sample is se-lected, generated, formatted, and sent electronicallyto Ipsos Reid’s field centres. For the 2006 survey, callswere made from field centres in Vancouver, Winni-peg, Ottawa, and Montreal.
For each telephone number called, the surveyorverified that a residence and not a business wasreached. Following this initial screening, the “birth-day” method was used to ensure that the interview-ees were randomly selected: the person interviewedwas the one 18 years of age or older who mostrecently had his or her birthday. If this individual was
not at home at the time of the call, an appointmentwas made for a call-back interview. Up to fiveattempts were made to reach potential respondentsbefore disqualification. When eligible respondentswere reached on the fifth call but not available to beinterviewed at that time, arrangements were madefor a sixth or seventh call to complete the interview.Calls for the 2006 survey were generally madebetween 4:30 p.m. and 10:00 p.m. during the week-days, between 11:00 a.m. and 6:00 p.m. on Saturdays,and between 3:00 p.m. and 10:00 p.m. on Sundays.
In 2006, a total of 36,799 numbers were availablefor calling. There were 8,926 for which there was noanswer even after five call-backs and 13,744 numberswere rejected because they were businesses, discon-nected, or out of service. Thus, the valid sample ofnumbers remaining was 14,109. Among the eligiblerespondents, 2,000 completed the interview, 8,154refused to participate in the survey, 470 ended theinterview before the survey was complete, 739 inter-views were discontinued because of language diffi-culties, and 717 were discontinued because therespondent failed to meet the screening criteria atthe beginning of the survey. In the end, there were10,624 valid numbers: those who responded, thosewho refused, and those who ended the interviewbefore it was completed. Therefore, the response ratewas 18.8 percent (2,000 out of 10,624). This comparesto a response rate of 25.7 percent (1,500 out of 5,827)in 1997. The drop in the response rate from 1997 islargely driven by a secular trend in lower surveyresponses resulting from the changing environmentwithin which public opinion polling is conducted.26
The interview
The questionnaire was divided into 10 sections andtook, as noted, an average of 18.4 minutes to com-plete (versus an average of 28 minutes in 1997). Re-
The Fraser Institute 41 Complementary and Alternative Medicine
PUBLIC POLICY SOURCES, NUMBER 87
26 According to Ipsos Reid, response rates in a general population survey 8 to 10 years ago were normally in the 25 to 30 percent range,compared to the 18 to 20 percent range today.
spondents were informed that Ipsos Reid, aprofessional opinion research company, was con-ducting a survey of Canadians “to learn more abouttheir health care practices and the types of therapiesand treatments they use.” In the selection of respon-dents there was no mention of complementary, alter-native, or unconventional therapies.
The first sections of the questionnaire dealt withrespondents’ general health and their use of healthcare services. Some of the questions from this por-tion of the survey asked whether there was a particu-lar doctor or clinic usually visited for care, how oftena medical doctor had been seen in the previous 12months, and whether any extended medical insur-ance coverage was held above and beyond the pro-vincial health care plan.
The questionnaire then delved into more detailabout respondents’ medical conditions. More than30 medical conditions were surveyed, includingheart problems or chest pain, cancer, lung problemssuch as asthma, digestive problems, sprains or strains,depression, back or neck problems, and headaches.
Respondents were then asked about the types ofmedical care they had obtained for the three mostbothersome or serious medical conditions they hadexperienced in the previous 12 months. They wereasked whether they had seen a medical doctor andhow helpful they felt the treatment had been, where amedical doctor was defined as an “MD or an osteopath,not a chiropractor or other non-medical doctor.”
Once these data were collected, respondentswere asked about their “use of some other kinds oftherapies and treatments for [their] health condi-tions.” A randomized list of 22 alternative therapieswas offered. It included more common treatmentssuch as chiropractic, acupuncture, and massage, aswell as less common treatments such as biofeedback,megavitamin therapies, and imagery techniques.Respondents were asked to identify the three thera-pies they most frequently used in the prior 12months, whether they used these therapies forwellness or for illness care, whether the care was pro-
vided by a professional (someone who was paid toprovide these services), how many visits they madeto receive these treatments, and whether the treat-ments were helpful or not. If the provider was not amedical doctor, respondents were asked if they haddiscussed their use of alternative treatments withtheir doctor.
The questionnaire then focused on the costs ofalternative health care. As many alternative thera-pies are not, or are only partially, covered by provin-cial medical insurance plans, respondents wereasked whether any part of the visit they made to analternative medicine provider was covered by insur-ance, and whether they were responsible for any partof the cost of these visits. Respondents were asked toestimate how much they paid out of pocket to theiralternative therapy providers. As well, they wereasked separately about any additional expendituresthey may have made on herbs and/or vitamins, spe-cial diet programs for losing weight, and on books,classes, equipment, or any other items related totheir use of alternative therapy.
The survey’s next questions diverged fromrespondents’ personal use and feelings towardsalternative therapies to whether their children—ifthey had any children under the age of 18 currentlyliving in their household—had ever used alternativetherapies. It was also determined which therapiestheir children had used and whether the use of thesetherapies had been discussed with the children’spaediatrician.
The questionnaire then concentrated on respon-dents’ beliefs and perceptions regarding alternativetherapies. As noted above, 1,100 of the 2,000 respon-dents answered questions in this section, while theremaining 900 did not. Respondents were asked tocomment on why they chose to use alternative thera-pies. For example, was it because they were moreeffective or because their provider was more atten-tive than their medical doctor? They were also askedthe extent of their doctors’ involvement in healthcare decisions. Specifically, they were queried
Complementary and Alternative Medicine 42 The Fraser Institute
PUBLIC POLICY SOURCES, NUMBER 87
regarding the degree to which they agreed with sev-eral statements. For example, they were askedwhether they agreed with the statement “I will oftentell doctors what kind of tests and treatment I thinkare best for me,” with answers corresponding to aseven-point scale where 1 meant “completely dis-agree” and 7 meant “completely agree.”
The next section concerned health care policy:whether alternative therapies should be funded pub-licly or privately, how the set of alternative therapiesto be government-funded should be determined, andby whom. Respondents were also asked to allocate$100 between specific conventional and non-con-ventional treatments for heart problems, cancer, andback problems.27 Again, 1,100 respondents answeredquestions in this section (including the 900 who didnot answer questions in the section on beliefs andperceptions plus 200 who did) while the remaining900 did not.
The final survey questions gathered the demo-graphic data required for analysis of the survey results.
Testing for selection bias in
the split-sample
As noted above, 900 respondents to the 2006 surveyanswered questions on beliefs and perceptions, 900respondents answered questions on health policy op-tions, and 200 respondents were asked questions inboth of these sections. Ipsos-Reid compared the datafindings from these separate groups of respondentsto determine if there were any systematic differences
in their responses that would indicate a bias createdby the split-sampling methodology. 28 Ipsos Reid’s an-alysts concluded that there were no systematic differ-ences that would indicate any bias.29
However, some differences were worth noting.
Because of the skip patterns built into the sectionon beliefs and perceptions (of the list of questions inthis section, some respondents may not be asked cer-tain questions based on their responses to priorquestions in the survey), there were differences in theproportions of respondents who answered somequestions between the group who answered onlyquestions in this section and the group thatanswered questions in this section and the section onhealth policy. However, in the vast majority of cases,these differences were found not to be statisticallysignificant.
Nonetheless, Ipsos Reid’s analysts found the fol-lowing statistically significant differences betweenrespondents in the combined 200 sample and thosewho only answered questions in either the section onbeliefs and perceptions or health policy options:
1. Forty-four percent of respondents answeringonly questions on beliefs and perceptions dis-agreed strongly with the statement “I will oftentell doctors what kind of tests and treatments Ithink are best for me,” compared to 36 percent ofrespondents answering questions in both sec-tions. The mean score on the 7-point gradingscale was also slightly higher for the group an-swering questions in both the split-sample sec-tions (3.6 versus 3.3—a statistically significant
The Fraser Institute 43 Complementary and Alternative Medicine
PUBLIC POLICY SOURCES, NUMBER 87
27 Alternative therapies presented during the survey were usually not described for respondents. Brief descriptions were available torespondents who requested clarification for folk remedies, biofeedback, naturopathy, and osteopathy (as noted in “Appendix B”).Thus, it is possible that responses to some of the questions were affected by a lack of knowledge about specific alternative therapies.
28 Note that, more generally, there may be some unknown bias in the responses to this survey, as respondents to the questionnaire maybe more interested in health and health issues than the general population.
29 Specifically, Ipsos Reid’s analysts found no systematic differences between the data findings from the separate responses to the sec-tions on beliefs and perceptions and health policy options, and the findings from the 200 respondents who answered questions inboth sections in either the weighted or unweighted data. They note: “Essentially, respondents who answered only questions in Sec-tion H (beliefs and perceptions) or I (policy options) were not fundamentally different enough in their responses to those who an-swered questions in both sections to warrant any concern about bias.”
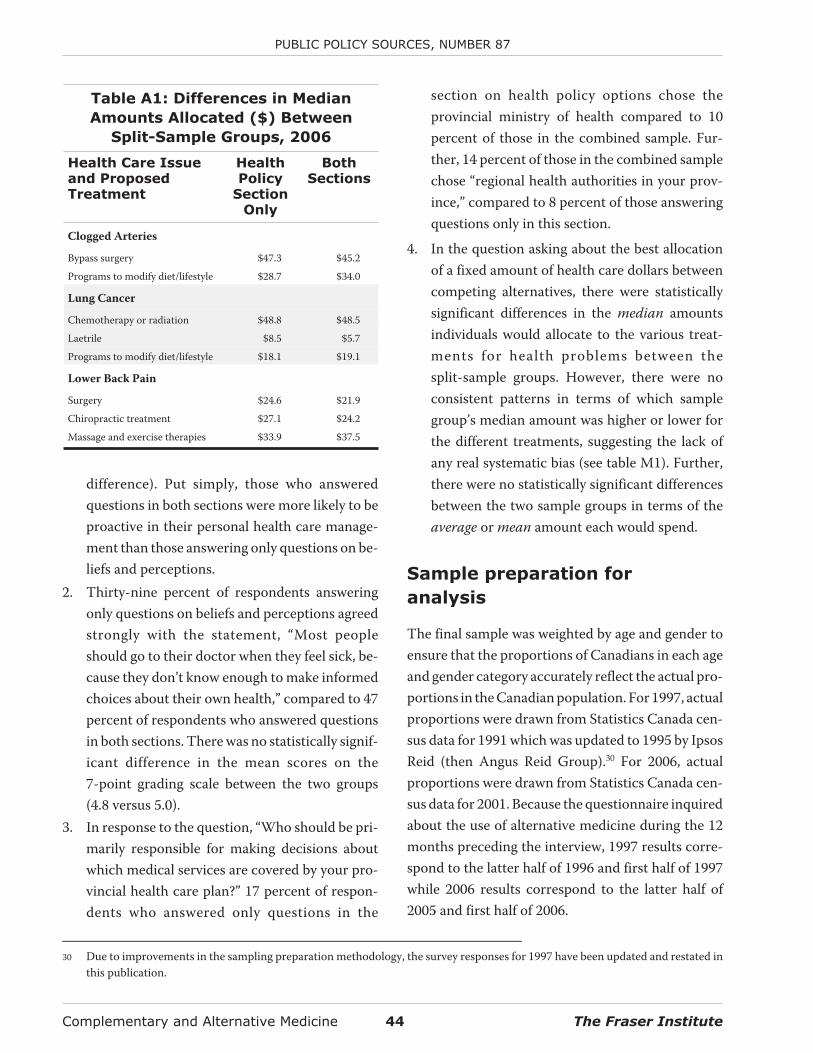
difference). Put simply, those who answeredquestions in both sections were more likely to beproactive in their personal health care manage-ment than those answering only questions on be-liefs and perceptions.
2. Thirty-nine percent of respondents answeringonly questions on beliefs and perceptions agreedstrongly with the statement, “Most peopleshould go to their doctor when they feel sick, be-cause they don’t know enough to make informedchoices about their own health,” compared to 47percent of respondents who answered questionsin both sections. There was no statistically signif-icant difference in the mean scores on the7-point grading scale between the two groups(4.8 versus 5.0).
3. In response to the question, “Who should be pri-marily responsible for making decisions aboutwhich medical services are covered by your pro-vincial health care plan?” 17 percent of respon-dents who answered only questions in the
section on health policy options chose theprovincial ministry of health compared to 10percent of those in the combined sample. Fur-ther, 14 percent of those in the combined samplechose “regional health authorities in your prov-ince,” compared to 8 percent of those answeringquestions only in this section.
4. In the question asking about the best allocationof a fixed amount of health care dollars betweencompeting alternatives, there were statisticallysignificant differences in the median amountsindividuals would allocate to the various treat-ments for health problems between thesplit-sample groups. However, there were noconsistent patterns in terms of which samplegroup’s median amount was higher or lower forthe different treatments, suggesting the lack ofany real systematic bias (see table M1). Further,there were no statistically significant differencesbetween the two sample groups in terms of theaverage or mean amount each would spend.
Sample preparation for
analysis
The final sample was weighted by age and gender toensure that the proportions of Canadians in each ageand gender category accurately reflect the actual pro-portions in the Canadian population. For 1997, actualproportions were drawn from Statistics Canada cen-sus data for 1991 which was updated to 1995 by IpsosReid (then Angus Reid Group).30 For 2006, actualproportions were drawn from Statistics Canada cen-sus data for 2001. Because the questionnaire inquiredabout the use of alternative medicine during the 12months preceding the interview, 1997 results corre-spond to the latter half of 1996 and first half of 1997while 2006 results correspond to the latter half of2005 and first half of 2006.
Complementary and Alternative Medicine 44 The Fraser Institute
PUBLIC POLICY SOURCES, NUMBER 87
Table A1: Differences in Median
Amounts Allocated ($) Between
Split-Sample Groups, 2006
Health Care Issueand ProposedTreatment
HealthPolicy
SectionOnly
BothSections
Clogged Arteries
Bypass surgery $47.3 $45.2
Programs to modify diet/lifestyle $28.7 $34.0
Lung Cancer
Chemotherapy or radiation $48.8 $48.5
Laetrile $8.5 $5.7
Programs to modify diet/lifestyle $18.1 $19.1
Lower Back Pain
Surgery $24.6 $21.9
Chiropractic treatment $27.1 $24.2
Massage and exercise therapies $33.9 $37.5
30 Due to improvements in the sampling preparation methodology, the survey responses for 1997 have been updated and restated inthis publication.
Appendix B: Descriptions of Select Complementary and
Alternative Medicines and Therapies
Readers should note that the definitions below aresourced from either the National Center for Comple-mentary and Alternative Medicine website(NCCAM, 2007) or from the Aetna InteliHealthwebsite (Aetna InteliHealth, 2005).31 Therapies arelisted in alphabetical order, and are presented in themanner that they were read to survey respondents. Itshould also be noted that definitions were not avail-able from these two sources for all of the therapies ex-amined in this study, and that these are by no meansstandard definitions.
Acupuncture
Acupuncture is one of the oldest, most com-monly used medical procedures in the world.Originating in China more than 2,000 yearsago, acupuncture began to become betterknown in the United States in 1971, whenNew York Times reporter James Reston wroteabout how doctors in China used needles toease his pain after surgery.
The term acupuncture describes a family ofprocedures involving stimulation of anatom-ical points on the body by a variety of tech-niques. American practices of acupunctureincorporate medical traditions from China,Japan, Korea, and other countries. The acu-puncture technique that has been most stud-ied scientifically involves penetrating theskin with thin, solid, metallic needles that aremanipulated by the hands or by electricalstimulation. (NCCAM, 2007)
Aromatherapy
For thousands of years, oils from plants havebeen used to lubricate the skin, purify air andrepel insects. Essential oils were used in an-cient Egypt for bathing and massage and inancient Greece and Rome for treating infec-tions. The origin of modern aromatherapy isoften traced to the French chemistRene-Maurice Gattefosse, who is said to havepoured lavender oil onto his hand after acci-dentally burning himself. He believed thatthe pain, redness and skin damage healedmore quickly than expected, and he began tostudy the effects of oils on the body.
Essential oils are extracted from a plant’sflowers, leaves, needles, branches, bark, ber-ries, seeds, fruits, rind or roots. These oils areoften mixed with a milder “carrier” oil (usu-ally a vegetable oil) or are weakened (diluted)in alcohol. Essential oils are used in many dif-ferent ways, including directly on the skin, asa part of massage, in bathwater, via steam in-halation or in mouthwashes.
Aromatherapy sessions often begin with aninterview, after which the therapist selects ablend of oils that he or she feels is appropriatefor the client. Appointments may last up to90 minutes. Clients may be asked not toshower for several hours afterwards, to allowmore time for oils to sink into the skin. Man-made compounds are usually not used.Commonly sold products such as scentedcandles, pomanders or potpourri are usuallynot as strong as the oils typically used byaromatherapists. (Aetna InteliHealth, 2005)
The Fraser Institute 45 Complementary and Alternative Medicine
31 Alternative therapies presented during the survey were usually not described for respondents. Brief descriptions were available torespondents who requested clarification for folk remedies, biofeedback, naturopathy, and osteopathy (as noted below). Descrip-tions are presented here to assist readers of this study in understanding precisely what treatments these various medicines and ther-apies might include.
Biofeedback32
Biofeedback tries to teach you to control au-tomatic body functions such as heart rate,muscle tension, breathing, perspiration, skintemperature, blood pressure and even brainwaves. By learning to control these functions,you may be able to improve your medicalcondition, relieve chronic pain, reduce stress,or improve your physical or mental perfor-mance (sometimes called peak performancetraining).
During biofeedback training, sensors at-tached to your body detect changes in yourpulse, skin temperature, muscle tone,brain-wave pattern or some other physiolog-ical function. These changes trigger a signal—a sound, a flashing light, a change in patternon a video screen—that tells you that thephysiological change has occurred. Grad-ually, with the help of your biofeedback ther-apist, you can learn to alter the signal bytaking conscious control of your body’s auto-matic body functions. (Aetna InteliHealth,2005)
Chelation therapy
Chelation therapy was developed during the1950s as a way to cleanse the blood and bloodvessel walls of toxins and minerals. Therapyinvolves infusions into the bloodstream ofthe chemical edetic acid (EDTA). Sometimesthe therapy may be given by mouth, whichoccasionally uses other chemicals.
Chelation was initially used as a treatment forheavy metal poisoning, but some observersbelieved that people receiving chelation ther-apy were benefiting in other ways. In modern
times, chelation practitioners may recom-mend this therapy for atherosclerosis(clogged arteries), heart disease, peripheralvascular disease (claudication), diabetes andmany other health problems. Chelation prac-titioners often recommend 20 or moretreatments, which may cost several thou-sand dollars.
The term “chelation” is also sometimes usedin medicine as a general term to refer to theuse of chemicals in the blood to remove spe-cific toxins or contaminants (for example,deferoxamine is a chelating agent used totreat excessive amounts of iron in the body).This type of chelation should not be confusedwith EDTA chelation therapy. (AetnaInteliHealth, 2005)
Chiropractic care
The word “chiropractic” combines the Greekwords cheir (hand) and praxis (action) andmeans “done by hand.” Chiropractic is an al-ternative medical system and takes a differ-ent approach from conventional medicine indiagnosing, classifying, and treating medicalproblems.
The basic concepts of chiropractic can be de-scribed as follows:
• The body has a powerful self-healing ability
• The body’s structure (primarily that ofthe spine) and its function are closely re-lated, and this relationship affects health
• Chiropractic therapy is given with thegoals of normalizing this relationship be-tween structure and function and assist-ing the body as it heals (NCCAM, 2007)
Complementary and Alternative Medicine 46 The Fraser Institute
PUBLIC POLICY SOURCES, NUMBER 87
32 If necessary, respondents were given the following definition: Biofeedback involves teaching you to control automatic body func-tions such as heart rate, muscle tension, and breathing to improve your medical condition, relieve chronic pain, reduce stress, or im-prove your physical or mental performance.
Energy healing
Energy medicine is a domain in CAM thatdeals with energy fields of two types:
• Veritable, which can be measured• Putative, which have yet to be measured
The veritable energies employ mechanicalvibrations (such as sound) and electromag-netic forces, including visible light, magne-tism, monochromatic radiation (such as laserbeams), and rays from other parts of the elec-tromagnetic spectrum. They involve the useof specific, measurable wavelengths and fre-quencies to treat patients.
In contrast, putative energy fields (also calledbiofields) have defied measurement to dateby reproducible methods. Therapies involv-ing putative energy fields are based on theconcept that human beings are infused with asubtle form of energy. This vital energy or lifeforce is known under different names in dif-ferent cultures, such as qi in traditional Chi-nese medicine (TCM), ki in the JapaneseKampo system, doshas in Ayurvedic medi-cine, and elsewhere as prana, etheric energy,fohat, orgone, odic force, mana, and homeo-pathic resonance. Vital energy is believed toflow throughout the material human body,but it has not been unequivocally measuredby means of conventional instrumentation.Nonetheless, therapists claim that they canwork with this subtle energy, see it with theirown eyes, and use it to effect changes in thephysical body and influence health.
Practitioners of energy medicine believe thatillness results from disturbances of these
subtle energies (the biofield). For example,more than 2,000 years ago, Asian practitio-ners postulated that the flow and balance oflife energies are necessary for maintaininghealth and described tools to restore them.Herbal medicine, acupuncture, acupressure,moxibustion,33 and cupping,34 for example,are all believed to act by correcting imbal-ances in the internal biofield, such as by re-storing the flow of qi through meridians toreinstate health. Some therapists are believedto emit or transmit the vital energy (externalqi) to a recipient to restore health.
Examples of practices involving putative en-ergy fields include:
• Reiki and Johrei, both of Japanese origin
• Qi gong, a Chinese practice
• Healing touch, in which the therapist ispurported to identify imbalances andcorrect a client’s energy by passing his orher hands over the patient
• Intercessory prayer, in which a personintercedes through prayer on behalf ofanother (NCCAM, 2007)
Folk remedy of any kind35
No definition is available from the sources.
Herbal therapies of any kind
No definition is available from the sources.
High dose or mega-vitamin therapies36
No definition is available from sources.
The Fraser Institute 47 Complementary and Alternative Medicine
PUBLIC POLICY SOURCES, NUMBER 87
33 “Moxibustion is the application of heat from the burning of the herb moxa at the acupuncture point” (NCCAM, 2007).
34 Cupping is the application of vacuum-filled cups (the vacuum created either by fire or by suction) against the skin.
35 If necessary, respondents were given the following definition :Traditional medicine as practised by non-professional healers or em-bodied in local custom or lore, generally involving the use of natural and especially herbal remedies.
36 Respondents were informed that this form of therapy does not include taking a daily vitamin or vitamins prescribed by your physician.
Homeopathy
The term homeopathy comes from theGreek words homeo, meaning similar, andpathos, meaning suffering or disease. Home-opathy is an alternative medical system. Al-ternative medical systems are built uponcomplete systems of theory and practice, andoften have evolved apart from and earlierthan the conventional medical approachused in the United States. Homeopathy takesa different approach from conventional med-icine in diagnosing, classifying, and treatingmedical problems.
Key concepts of homeopathy include:
• Homeopathy seeks to stimulate thebody’s defense mechanisms and pro-cesses so as to prevent or treat illness.
• Treatment involves giving very smalldoses of substances called remedies that,according to homeopathy, would pro-duce the same or similar symptoms of ill-ness in healthy people if they were givenin larger doses.
• Treatment in homeopathy is individual-ized (tailored to each person). Homeo-pathic practitioners select remediesaccording to a total picture of the patient,including not only symptoms but life-style, emotional and mental states, andother factors. (NCCAM, 2007)
Homeopathy is a system of medicine that isbased on the Law of Similars, sometimes de-scribed as “like cures like.” For example, asubstance that causes vomiting when usedfull strength may be thought to prevent vom-iting when used in a very low concentration.The German doctor Samuel Hahnemann de-veloped the main theories of homeopathy inthe early 1800s based on this idea and on re-lated principles. (Aetna InteliHealth, 2005)
Hypnosis
Hypnotherapy-like practices were used inancient Egypt, Babylon, Greece, Persia, Brit-ain, Scandinavia, America, Africa, India andChina. The Bible, Talmud, and Hindu Vedasmention hypnotherapy, and some NativeAmerican and African ceremonies includetrance states similar to hypnotherapy.Hypnotherapy (also called hypnosis) comesfrom the Greek word hypnos, meaning sleep.
Modern Western hypnotherapy can betraced to the Austrian physician Franz AntonMesmer (1734-1815); the word “mesmerize”is based on his name. Mesmer suggested thatillness is caused by an imbalance of magneticfluids in the body and can be corrected by“animal magnetism.” He believed that ahypnotherapist’s personal magnetism can betransferred to a patient. His beliefs were ini-tially questioned but were revived by19th-century English physicians. In themid-20th century, the British and AmericanMedical Associations and the AmericanPsychological Associat ion endorsedhypnotherapy as a medical procedure. In1995, the U.S. National Institutes of Healthissued a consensus statement noting the sci-entific evidence in favor of the use ofhypnotherapy for chronic pain, particularlypain associated with cancer.
There are three main phases of hypnother-apy: presuggest ion, suggest ion, andpostsuggestion.
• The presuggestion phase involves focus-ing one’s attention using distraction, im-agery, relaxation or a combination oftechniques. The aim is to reach an alteredstate of consciousness in which the mindis relaxed and susceptible to suggestion.
• The suggestion phase introduces spe-cific goals, questions or memories to beexplored.
Complementary and Alternative Medicine 48 The Fraser Institute
PUBLIC POLICY SOURCES, NUMBER 87
• The postsuggestion phase occurs afterthe return to a normal state of conscious-ness, when new behaviors introduced inthe suggestion phase may be practiced.(Aetna InteliHealth, 2005)
Imagery techniques, includingguided imagery
With respect to guided imagery specifically:
Historically, imagery has been used by manycultural groups, including the Navajos, an-cient Egyptians, Greeks and Chinese. Imageryhas also been used in religions such as Hindu-ism and Judaism. The term “guided imagery”refers to a number of different techniques, in-cluding visualization; direct suggestion usingimagery, metaphor and storytelling; fantasyand game playing; dream interpretation;drawing; and active imagination.
Therapeutic guided imagery is believed to al-low patients to enter a relaxed state and focusattention on images associated with issuesthey are confronting. Experienced guidedimagery practitioners may use an interactive,objective guiding style with the aim to en-courage patients to tap into latent inner re-sources and find solutions to problems.Guided imagery is a meditative relaxationtechnique sometimes used with biofeedback.Books and audiotapes are available as well asinteractive guided imagery groups, classes,workshops and seminars. (Aetna InteliHealth,2005)
Lifestyle diet such as vegetarianism ormacrobiotics
No definition available from the sources.
Massage therapies of any kind
The term massage therapy (also called mas-sage, for short; massage also refers to an indi-
vidual treatment session) covers a group ofpractices and techniques. There are over 80types of massage therapy. In all of them, ther-apists press, rub, and otherwise manipulatethe muscles and other soft tissues of thebody, often varying pressure and movement.They most often use their hands and fingers,but may use their forearms, elbows, or feet.Typically, the intent is to relax the soft tis-sues, increase delivery of blood and oxygen tothe massaged areas, warm them, and de-crease pain.
A few popular examples of this therapy are asfollows:
• In Swedish massage, the therapist useslong strokes, kneading, and friction onthe muscles and moves the joints to aidflexibility.
• A therapist giving a deep tissue massageuses patterns of strokes and deep fingerpressure on parts of the body wheremuscles are tight or knotted, focusing onlayers of muscle deep under the skin.
• In trigger point massage (also calledpressure point massage), the therapistuses a variety of strokes but appliesdeeper, more focused pressure onmyofascial trigger points—“knots” thatcan form in the muscles, are painfulwhen pressed, and cause symptoms else-where in the body as well.
• In shiatsu massage, the therapist appliesvarying, rhythmic pressure from the fin-gers on parts of the body that are be-lieved to be important for the flow of avital energy called qi.
Massage therapy (and, in general, the layingon of hands for health purposes) dates backthousands of years. References to massagehave been found in ancient writings frommany cultures, including those of Ancient
The Fraser Institute 49 Complementary and Alternative Medicine
PUBLIC POLICY SOURCES, NUMBER 87
Greece, Ancient Rome, Japan, China, Egypt,and the Indian subcontinent. (NCCAM,2007)
Naturopathy37
No definition is available from the sources.
Osteopathy38
Andrew Taylor Still, who was originallytrained as a doctor of medicine, founded thediscipline of osteopathy in 1874. Dr. Stillstarted the first college of osteopathy in 1892in Kirksville, Missouri. He sought an holisticapproach to treating illness and promotinghealth by enhancing the body’s natural heal-ing powers. His approach emphasized the re-lationship between body structure andfunction, and it aimed to focus on the wholepatient (mind, body and soul), rather than onsymptoms.
Today, osteopathy in the United Statescombines conventional medical practiceswith osteopathic manipulation, physicaltherapy and education about healthful pos-ture and body positioning. With osteopathicmanipulation, osteopaths, or doctors of os-teopathy (D.O.s), use their hands to diag-nose injury and illness and to administermanual treatments. Osteopaths receivesimilar training as medical doctors (M.D.s),with additional training in osteopathic andholistic medicine. Osteopathic doctors per-form all aspects of medicine, surgery andemergency medicine, and they can prescribedrugs. Many osteopaths belong to theAmerican Medical Association, as well as tothe American Osteopathic Association. Os-teopathy is sometimes confused with
chiropractic, as both use spinal manipulationto treat patients.
Osteopaths often focus on the neuro-musculoskeletal system and perform manip-ulations to treat a wide range of problems.Doctors of osteopathy are trained to evaluatethe body by taking a patient’s health history,focusing not only on health problems but onlifestyle issues as well. The practice of osteo-pathic medicine may involve massage, mobi-lization and spinal manipulation. Osteopathstraditionally believe that the primary role ofthe health care provider is to facilitate thebody’s inherent ability to heal itself, that thestructure and function of the body are closelyrelated and that problems in one organ affectother parts of the body. The traditional os-teopathic view is that perfect alignment ofthe musculoskeletal system eliminates ob-structions in blood and lymphatic flow,which in turn maximizes health. To ensureperfect alignment, a range of manipulativetechniques have been developed. Examplesinclude high-velocity thrusts, myofascial(muscle tissue) release, muscle energy tech-niques, counter strain, craniosacral therapiesand lymphatic drainage stimulation. (AetnaInteliHealth, 2005)
Prayer or spiritual practice foryour own health concern
Prayer may be defined as the act of asking forsomething while aiming to connect with Godor another object of worship. Praying for thesick or dying has been a common practicethroughout history. Individuals or groupsmay practice prayer with or without theframework of an organized religion.
Complementary and Alternative Medicine 50 The Fraser Institute
PUBLIC POLICY SOURCES, NUMBER 87
37 If necessary, respondents were given the following definition: A system of treatment of disease that avoids drugs and surgery andinstead emphasizes the use of natural agents.
38 If necessary, respondents were given the following definition: A therapy based on the assumption that restoring health can be ac-complished by manipulating the skeleton and muscles using various methods including massage and chiropractic like adjustments.
People may pray for themselves or for others.“Intercessory prayer” refers to prayers saidon behalf of people who are ill or in need. In-tercessors may have specific objectives ormay wish for general well-being or improvedhealth. The person being prayed for may beaware or unaware of the process. In somecases, prayers involve direct content usingthe hands. Intercessory prayer may also beperformed from a distance.
Clergy, chaplains and pastoral counselors aretrained by their respective institutions to ad-dress the spiritual and emotional needs ofphysically and mentally ill patients, theirfamilies and loved ones. (Aetna InteliHealth,2005)
Relaxation techniques like meditation orthe relaxation response
Numerous relaxation techniques and behav-ioral therapeutic approaches exist, with arange of philosophies and styles of practice.Most techniques involve repetition (of a spe-cific word, sound, prayer, phrase, body sensa-tion or muscular activity) and encourage apassive attitude toward intruding thoughts.
Methods may be deep or brief:
• Deep relaxation methods include auto-genic training, meditation and progres-sive muscle relaxation.
• Brief relaxation methods include self-controlled relaxation, paced respirationand deep breathing.
Other related techniques include guided im-agery, passive muscle relaxation and refocus-ing. Applied relaxation often involvesimagining situations to cause muscular andmental relaxation. Progressive muscle relax-
ation aims to teach people what it feels like torelax by comparing relaxation with muscletension. (Aetna InteliHealth, 2005)
Self-help group of any kind
No definition is available from the sources.
Special diet programs for losing orgaining weight39
No definition is available from the sources.
Spiritual or religious healing by others
Many therapeutic techniques and medicaltraditions involve spiritual aspects. Spiritualhealers use numerous approaches and styles.Spiritual healers may practice at healing cen-ters, in medical settings, in hospice programsor in homes. Spiritual healers may also workwith patients over the Internet.
There are schools that offer certification inspiritual healing, although there are nowidely accepted or official licensure require-ments. Some of the therapies used in theUnited States that involve spiritual healing ormind/body medicine include distance heal-ing, therapeutic touch, Ayurveda, prayer, pas-toral counseling, supernatural healing sources,metaphysical healing and Reiki. These thera-pies may be grouped under the concept of ho-listic care. There is a difference betweenEastern spiritual healing traditions and psy-choanalysis. The Eastern traditions claimthat the healer’s meditative practices andcommunication to the patient are throughchannels other than verbal communication.
In early history, physical healing was inti-mately tied to religious salvation, spiritualhealing and the civilizing process. Various
The Fraser Institute 51 Complementary and Alternative Medicine
PUBLIC POLICY SOURCES, NUMBER 87
39 Respondents were informed that special diet programs are ones people must pay for, but do not include trying to lose or gainweight on your own.
studies of Native American culture suggestthat shamanism may be considered effectivecare, irrespective of age, gender or degree ofacculturation. The shaman may also usemineral, animal and industrial-derived mate-rials (ethnopharmacy) for specific condi-tions. (Aetna InteliHealth, 2005)
Yoga
Yoga is an ancient system of relaxation, exer-cise and healing with origins in Indian philos-ophy. Yoga has been described as “the unionof mind, body, and spirit,” which addressesphysical, mental, intellectual, emotional andspiritual dimensions toward an overall har-monious state of being. The philosophy ofyoga is sometimes pictured as a tree witheight branches:
• Pranayama (breathing exercises)• Asana (physical postures)• Yama (moral behavior)• Niyama (healthy habit)• Dharana (concentration)• Pratyahara (sense withdrawal)• Dhyana (contemplation)• Samadhi (higher consciousness)
There are several types of yoga, includinghatha yoga, karma yoga, bhakti yoga and rajayoga. These types vary in the proportions ofthe eight branches. In the United States andEurope, hatha yoga is commonly practiced,including pranayama and asana. (AetnaInteliHealth, 2005)
PUBLIC POLICY SOURCES, NUMBER 87
Complementary and Alternative Medicine 52 The Fraser Institute
Acknowledgements
The author wishes to express his sincerest thanks toJason Clemens, Director of Fiscal Studies and theCentre for Entrepreneurship and Markets at The Fra-ser Institute; Brett Skinner, Director of Health andPharmaceutical Policy Research and Insurance Pol-icy Research at The Fraser Institute; Cynthia Ramsay,independent health economist; and Professor GaryMauser at the Faculty of Business Administration atSimon Fraser University for providing peer review ofthis study. Thanks are due as well to all those involvedin the production and release of this study.
This edition of Alternative Medicine in Canadadraws extensively on the 1999 edition. The authorwishes to express his thanks and is pleased to
acknowledge the important contributions ofCynthia Ramsay, Michael Walker, and Jared Alex-ander in the completion of the 1999 study and inbuilding the base of knowledge incorporated intothis publication.
The author would also like to thank the Lotteand John Hecht Memorial Foundation for theirsupport.
The author, of course, takes full and completeresponsibility for any remaining errors or omis-sions. As he has worked independently, the viewsexpressed in this study do not necessarily representthe views of the trustees, donors, or staff of The Fra-ser Institute.
References
Aetna InteliHealth (2005). Complementary & Alterna-tive Medicine: Index of Alternative Therapies andM o d a l i t i e s . Digita l document avai lable atwww.intellihealth.com/IH/ihtIH/WSIHW000/8513/34968.html.
Canadian Health Reference Guide (2005). New Study Re-veals Canadians Spend $2.5 Billion Annually on Nat-ural Health Products. Digital document available atwww.chrgonline.com/news_detail.asp?ID=41954 (ac-cessed December 4, 2006).
Eisenberg, David M., Ronald C. Kessler, Cindy Foster,Frances E. Norlock, David R. Calkins, and Thomas L.Delbanco (1993). “Unconventional Medicine in theUnited States–Prevalence, Costs, and Patterns of Use.”The New England Journal of Medicine, 328: 246-52.
Eisenberg, David M., Roger B. Davis, Susan L. Ettner, ScottAppel, Sonja Wilkey, Maria Van Rompay, and RonaldC. Kessler (1998). “Trends in Alternative MedicineUse in the United States, 1990-1997.” Journal of theAmerican Medical Association, 280(18): 1569-75.
Esmail, Nadeem and Michael Walker with Dominika Wrona(2006). Waiting Your Turn: Hospital Waiting Lists inCanada. 16th ed. Vancouver: The Fraser Institute.
Florete, Orlando G. Jr. (2000). “Complementary Medi-cine—An Overview.” Jacksonville Medicine, 51(1).Digital document available at www.dcmsonline.org/jax-medicine/2000journals/January2000/over-view.htm.
Millar, Wayne J. (2001). “Patterns of Use—AlternativeHealth Care Practitioners.” Health Reports, 13(1): 9-22.Cat. No. 82-0103-XIE. Ottawa: Statistics Canada.
National Center for Complementary and AlternativeMedicine [NCCAM] (2007). Treatment Information
by Treatment or Therapy. Digital document availableat www.nccam.nih.gov/health/bytreatment.htm.
National Center for Complementary and AlternativeMedicine [NCCAM] (2002). Get the Facts: What isComplementary and Alternative Medicine? Digitaldocument available at nccam.nih.gov/health/whatiscam/.
Organisation for Economic Cooperation and Develop-ment [OECD] (2006). OECD Health Data 2006. Ver-sion 10/17/2006. CD-ROM. Paris: OECD.
Park, Jungwee (2005). “Use of alternative health care.”Health Reports, 16(2): 39-42. Cat. No. 82-0103-XIE.Ottawa: Statistics Canada.
Ramsay, Cynthia (2002). “A Cure Worse than the Illness.”Public Policy Sources, no. 55. Vancouver: The FraserInstitute.
Ramsay, Cynthia, Michael Walker, and Jared Alexander(1999). “Alternative Medicine in Canada: Use andPublic Attitudes.” Public Policy Sources, Number 21.Vancouver: The Fraser Institute.
Statistics Canada (2001). “How Healthy are Canadians?2001 Annual Report.” Health Reports, 12(3). Cat. No.82-0103-XIE. Ottawa: Statistics Canada.
Tindle, Hilary A., Roger B. Davis, Russell S. Phillips, andDavid M. Eisenberg (2005). “Trends in Use of Com-plementary and Alternative Medicine by US Adults:1997-2002.” Alternative Therapies 11(1): 42-9.
Tousey, Phyllis M., and Joseph A. DeNucci (2000). “Com-plementary/Alternative Medicine Use In NortheastFlorida.” Jacksonville Medicine, 51(1): 25-27.
Zollman, Catherine, and Andrew Vickers (1999). “ClinicalReview: ABC of Complementary Medicine.” BritishMedical Journal (11 September): 693-6.
The Fraser Institute 53 Complementary and Alternative Medicine
About the Author
Nadeem Esmail is the Director of Health SystemPerformance Studies and Manager of the AlbertaPolicy Research Centre at The Fraser Institute. Hecompleted his BA (Honours) in Economics at theUniversity of Calgary, and received an MA in Eco-nomics from the University of British Columbia. Hisrecent publications and co-publications for The Fra-
ser Institute include the series Waiting Your Turn:Hospital Waiting Lists in Canada, the How Good isCanadian Health Care? series and The Alberta HealthCare Advantage: An Accessible, High Quality, andSustainable System. His articles have appeared innewspapers across Canada and he has been a guest onnumerous radio and TV programs across the country.