complaints handling polict - dpir.nt.gov.au€¦ · web viewroper district. roper district. roper...
TRANSCRIPT
DEPARTMENT OF PRIMARY INDUSTRY AND FISHERIES
NT Pastoral Feed Outlook
December 2014The purpose of this quarterly outlook is to summarise information relevant to the pastoral industry such as current feed supplies, seasonal conditions, the development of drought conditions in central Australia and fire risk.
You can see the entire document and all districts by continuing to scroll through this file. If you are interested in selected sections, you can click on the links below.
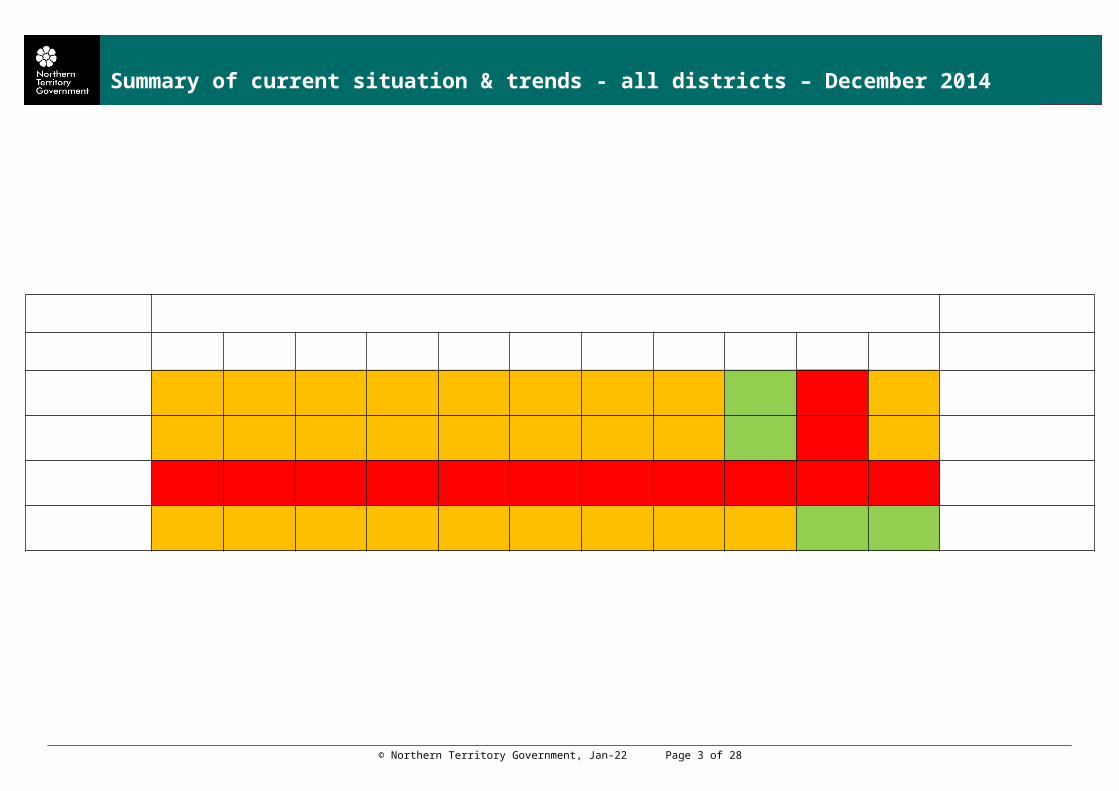
Summary of current situation & trends - all districts
Northern Territory Seasonal Outlook – as at December 2014
Individual District Summaries:
Darwin District
Katherine District
Victoria River District
Sturt Plateau District
Roper District
Gulf District
Barkly District
Tennant Creek District
Northern Alice Springs District
Plenty District
Southern Alice Springs District
Summary of current situation & trends - all districts – December 2014
© Northern Territory Government, May-23 Page 2 of 16
Northern Territory Seasonal Outlook – as at December 2014
Sourced from the Australian Bureau of Meteorologyhttp://www.bom.gov.au/climate/outlooks/
The national outlook for December 2014 to February 2015 indicates that: Drier than normal across the NT Warmer than normal days and nights more likely across the NT
Climate influences include El Niño-like conditions in the tropical Pacific Ocean, and average to cooler than average waters surrounding northern Australia.
Indian Ocean Dipole (IOD)
http://www.bom.gov.au/climate/enso/#tabs=Indian-Ocean
Current outlook:
Neutral
The IOD index remains neutral.
The latest weekly index value to 30 November is +0.2 °C. Climate models surveyed in the model outlooks favour a continuation of neutral IOD values for the remainder of the year.The IOD typically has little influence on the Australian climate from December to April.
A negative IOD pattern typically brings wetter conditions to inland southern Australia during winter and spring.
© Northern Territory Government, May-23 Page 3 of 16
Darwin District
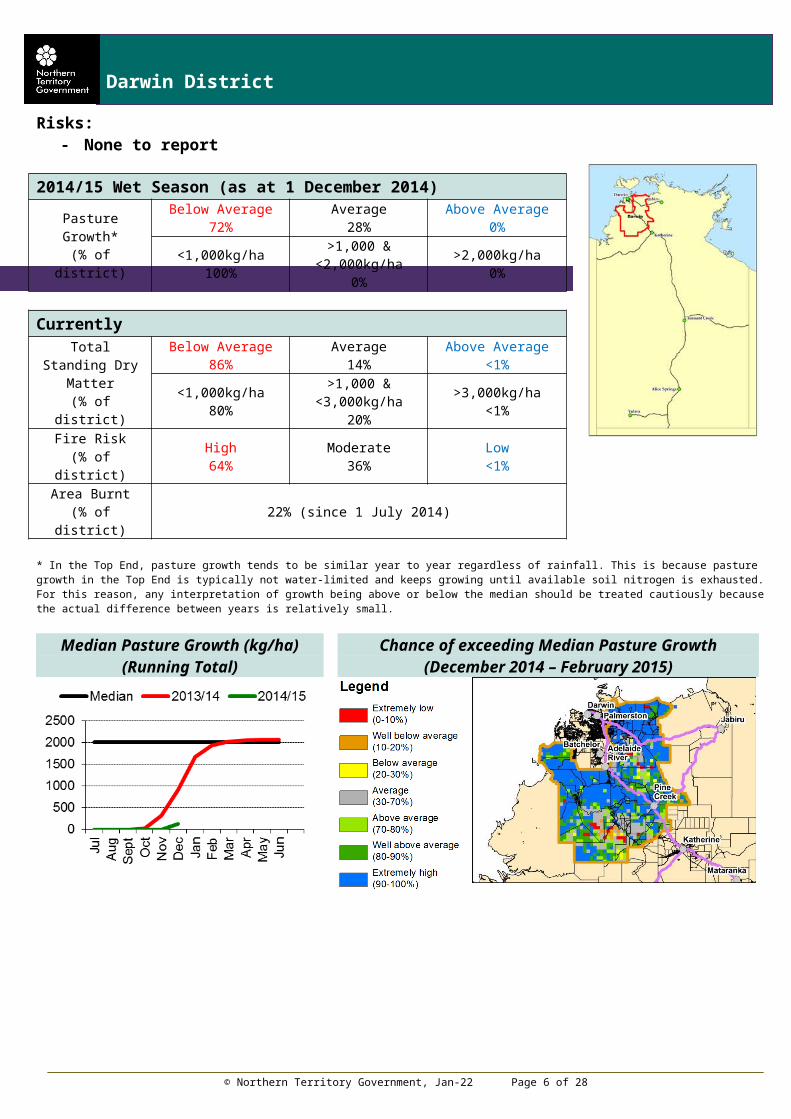
Risks:- None to report
2014/15 Wet Season (as at 1 December 2014)
Pasture Growth*(% of district)
Below Average72%
Average28%
Above Average0%
<1,000kg/ha100%
>1,000 & <2,000kg/ha0%
>2,000kg/ha0%
Currently
Total Standing Dry Matter
(% of district)
Below Average86%
Average14%
Above Average<1%
<1,000kg/ha80%
>1,000 & <3,000kg/ha20%
>3,000kg/ha<1%
Fire Risk(% of district)
High64%
Moderate36%
Low<1%
Area Burnt(% of district) 22% (since 1 July 2014)
* In the Top End, pasture growth tends to be similar year to year regardless of rainfall. This is because pasture growth in the Top End is typically not water-limited and keeps growing until available soil nitrogen is exhausted. For this reason, any interpretation of growth being above or below the median should be treated cautiously because the actual difference between years is relatively small.
Median Pasture Growth (kg/ha)(Running Total)
Chance of exceeding Median Pasture Growth(December 2014 – February 2015)
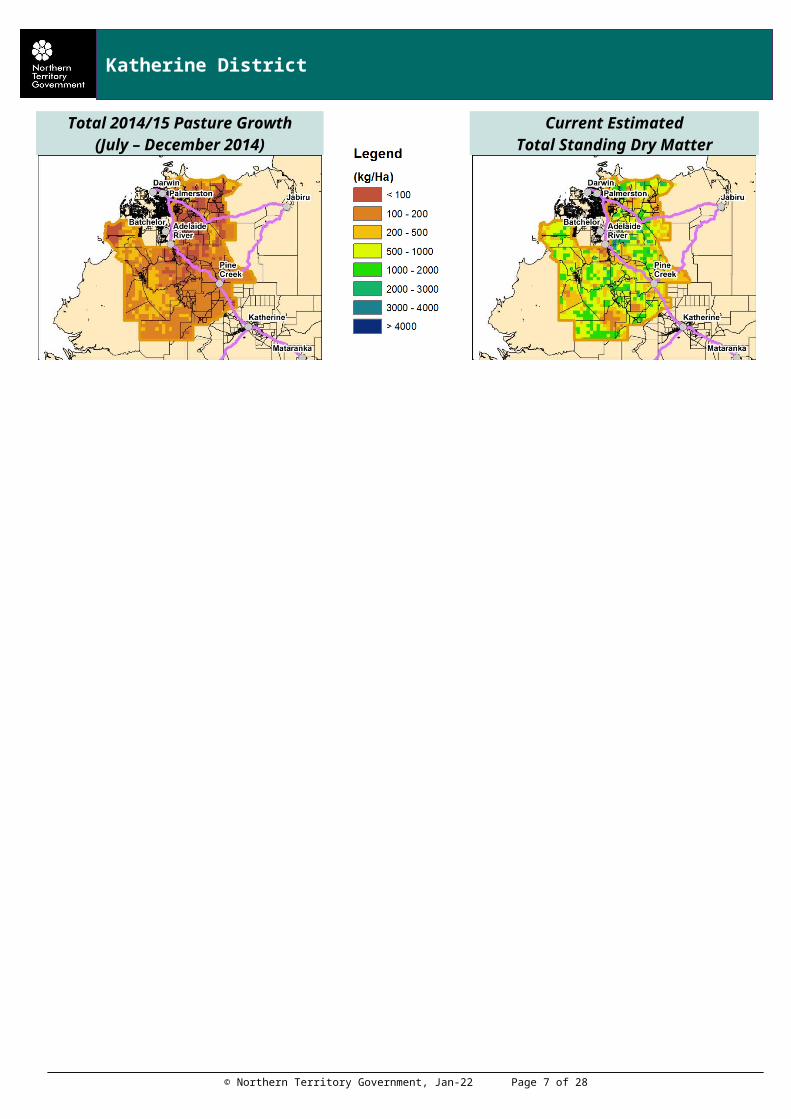
Total 2014/15 Pasture Growth(July – December 2014)
Current EstimatedTotal Standing Dry Matter
© Northern Territory Government, May-23 Page 4 of 16
Katherine District
© Northern Territory Government, May-23 Page 5 of 16
Katherine District
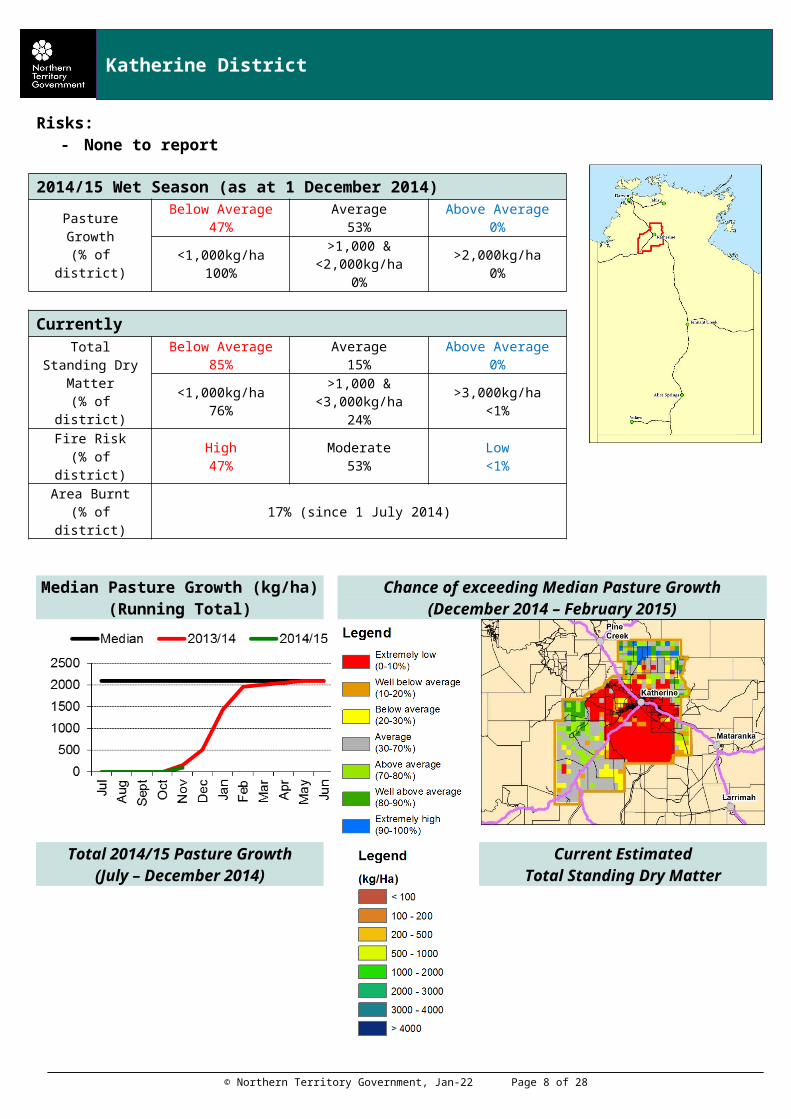
Risks:- None to report
2014/15 Wet Season (as at 1 December 2014)
Pasture Growth(% of district)
Below Average47%
Average53%
Above Average0%
<1,000kg/ha100%
>1,000 & <2,000kg/ha0%
>2,000kg/ha0%
Currently
Total Standing Dry Matter
(% of district)
Below Average85%
Average15%
Above Average0%
<1,000kg/ha76%
>1,000 & <3,000kg/ha24%
>3,000kg/ha<1%
Fire Risk(% of district)
High47%
Moderate53%
Low<1%
Area Burnt(% of district) 17% (since 1 July 2014)
Median Pasture Growth (kg/ha)(Running Total)
Chance of exceeding Median Pasture Growth(December 2014 – February 2015)
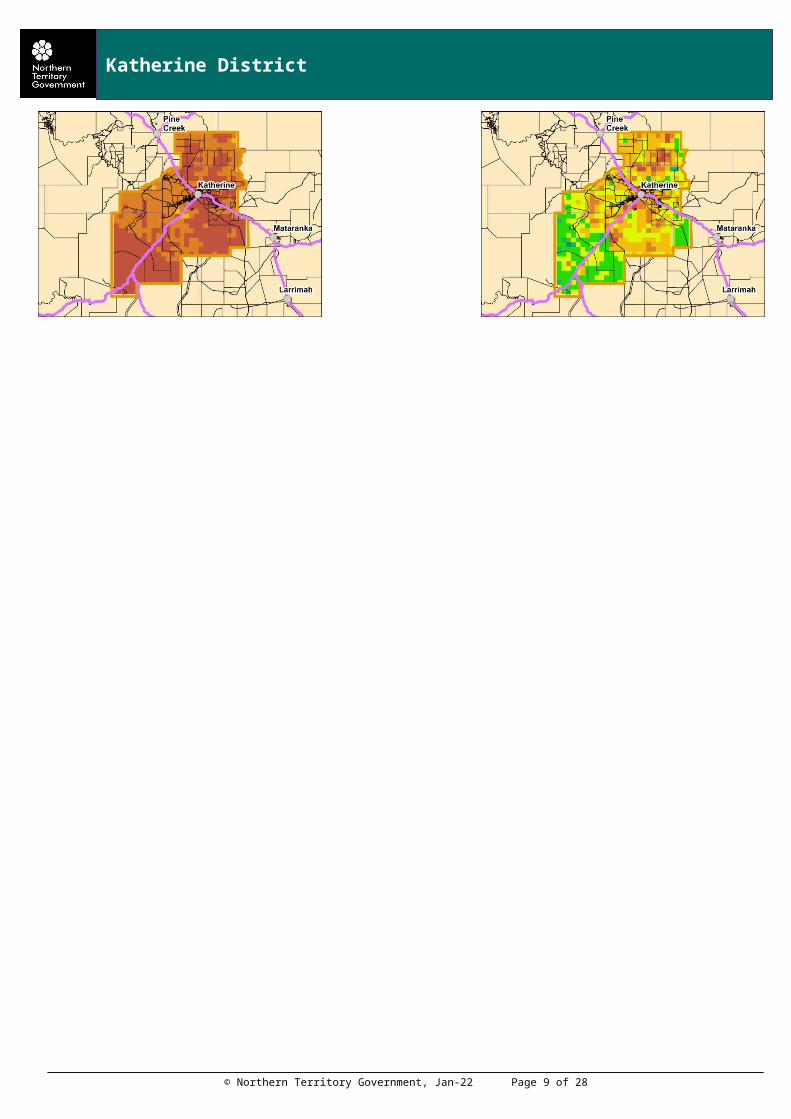
Total 2014/15 Pasture Growth(July – December 2014)
Current EstimatedTotal Standing Dry Matter
© Northern Territory Government, May-23 Page 6 of 16
Victoria River District
Risks:- None to report
2014/15 Wet Season (as at 1 December 2014)
Pasture Growth(% of district)
Below Average37%
Average61%
Above Average2%
<1,000kg/ha100%
>1,000 & <2,000kg/ha0%
>2,000kg/ha0%
Currently
Total Standing Dry Matter
(% of district)
Below Average39%
Average46%
Above Average15%
<1,000kg/ha25%
>1,000 & <3,000kg/ha65%
>3,000kg/ha11%
Fire Risk(% of district)
High92%
Moderate7%
Low1%
Area Burnt(% of district) 20% (since 1 July 2014)
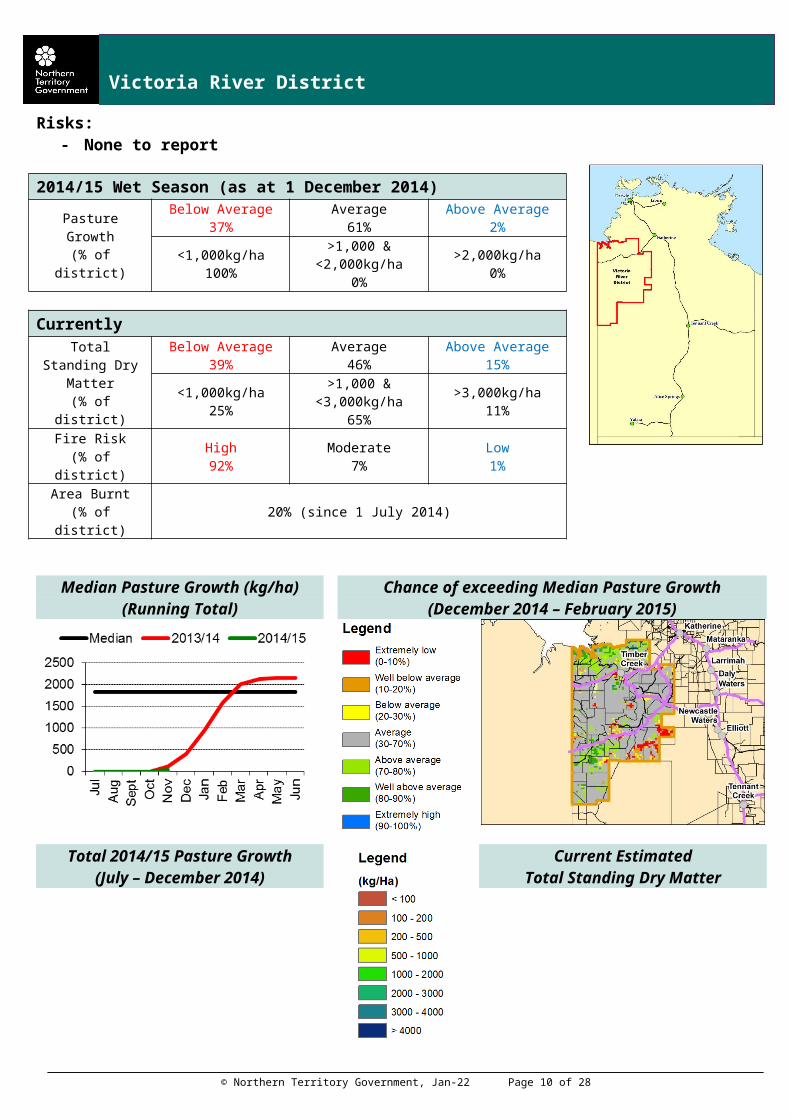
Median Pasture Growth (kg/ha)(Running Total)
Chance of exceeding Median Pasture Growth(December 2014 – February 2015)
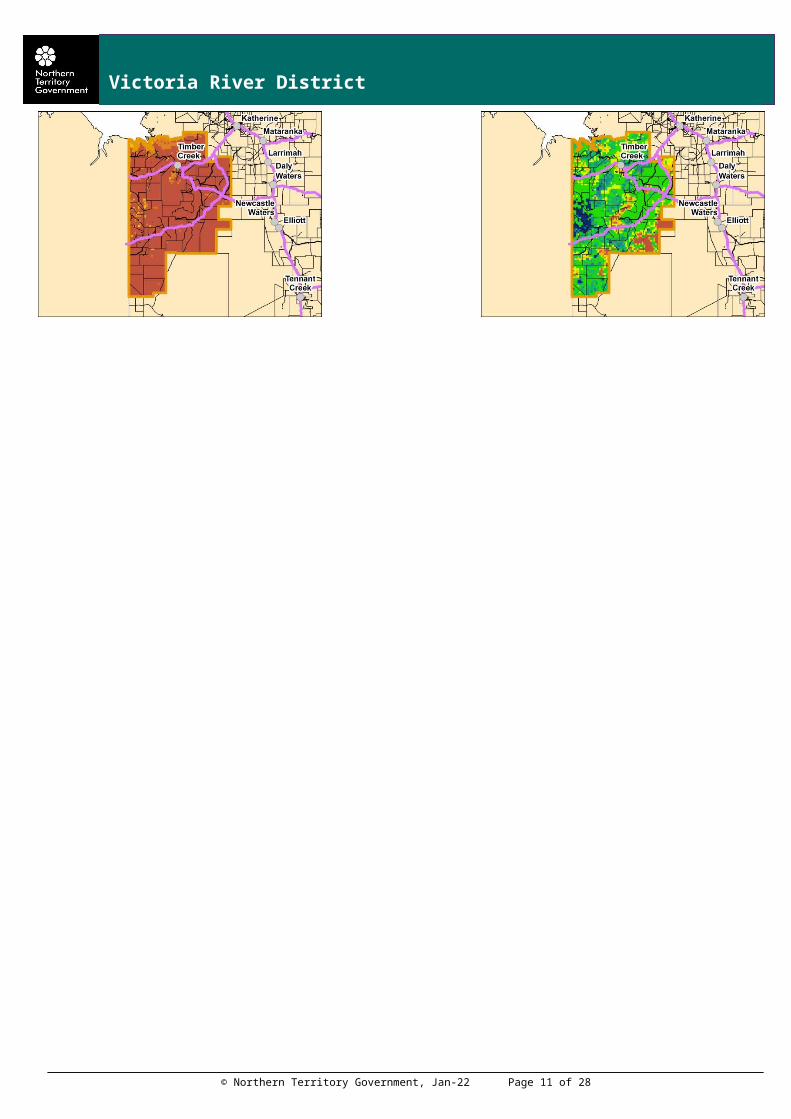
Total 2014/15 Pasture Growth(July – December 2014)
Current EstimatedTotal Standing Dry Matter
© Northern Territory Government, May-23 Page 7 of 16
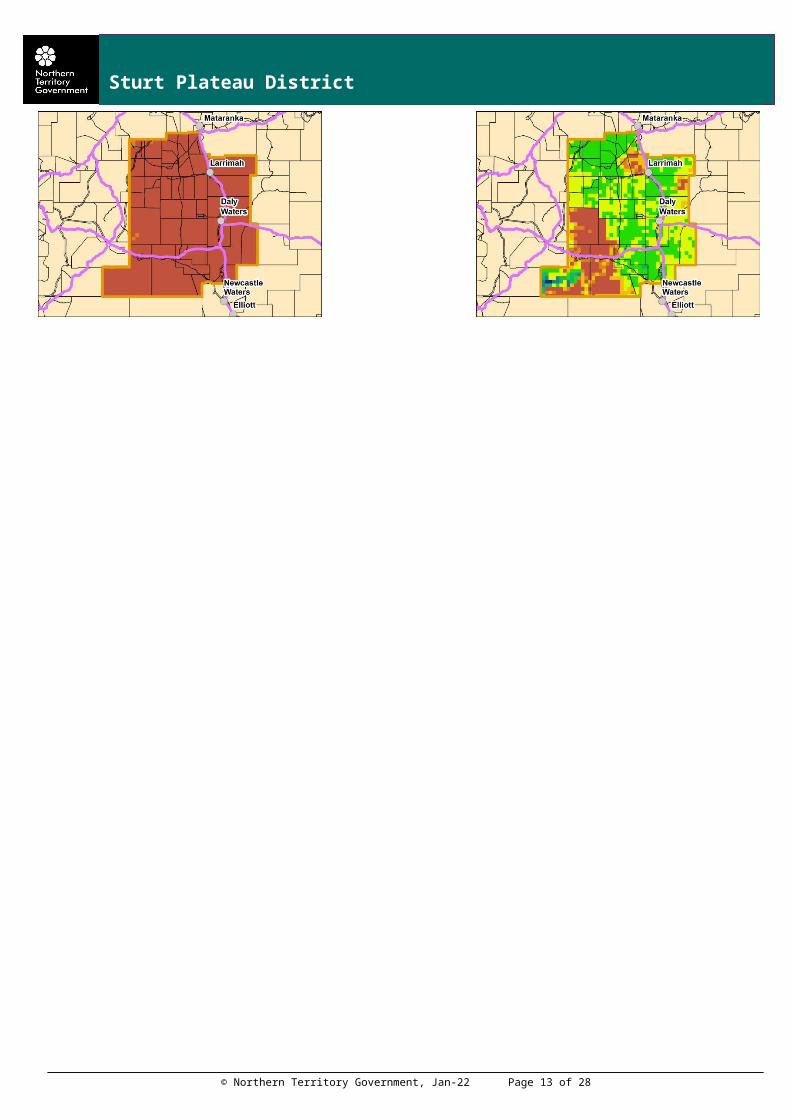
Sturt Plateau District
Risks:- As at 1 December 2014, 36% of the district had been burnt
2014/15 Wet Season (as at 1 December 2014)
Pasture Growth(% of district)
Below Average19%
Average81%
Above Average0%
<1,000kg/ha100%
>1,000 & <2,000kg/ha0%
>2,000kg/ha0%
Currently
Total Standing Dry Matter
(% of district)
Below Average49%
Average50%
Above Average1%
<1,000kg/ha60%
>1,000 & <3,000kg/ha39%
>3,000kg/ha1%
Fire Risk(% of district)
High69%
Moderate23%
Low8%
Area Burnt(% of district) 36% (since 1 July 2014)
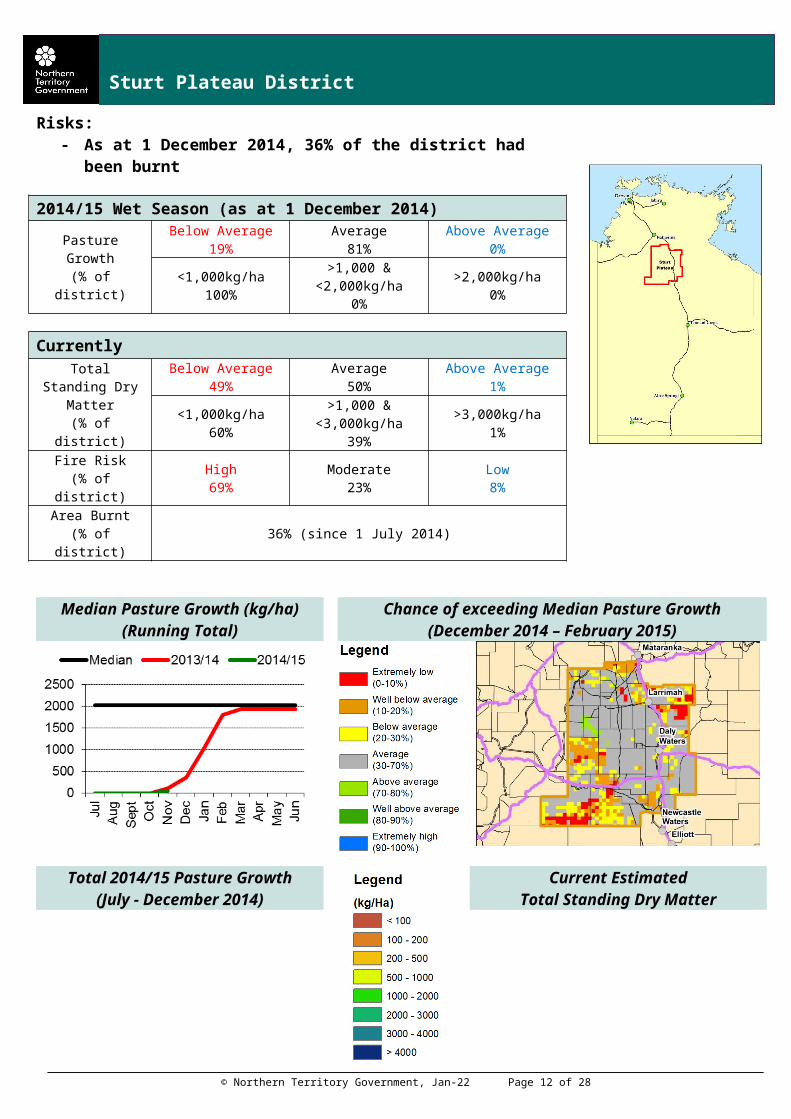
Median Pasture Growth (kg/ha)(Running Total)
Chance of exceeding Median Pasture Growth(December 2014 – February 2015)
Total 2014/15 Pasture Growth(July - December 2014)
Current EstimatedTotal Standing Dry Matter
© Northern Territory Government, May-23 Page 8 of 16
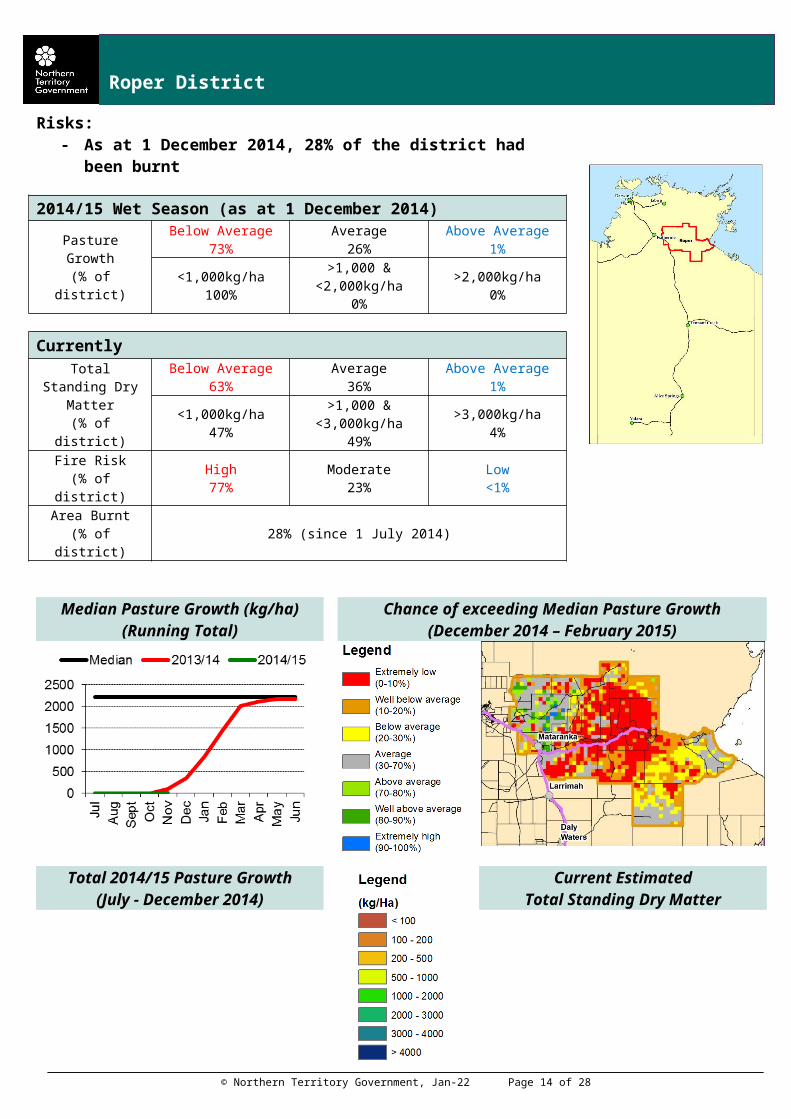
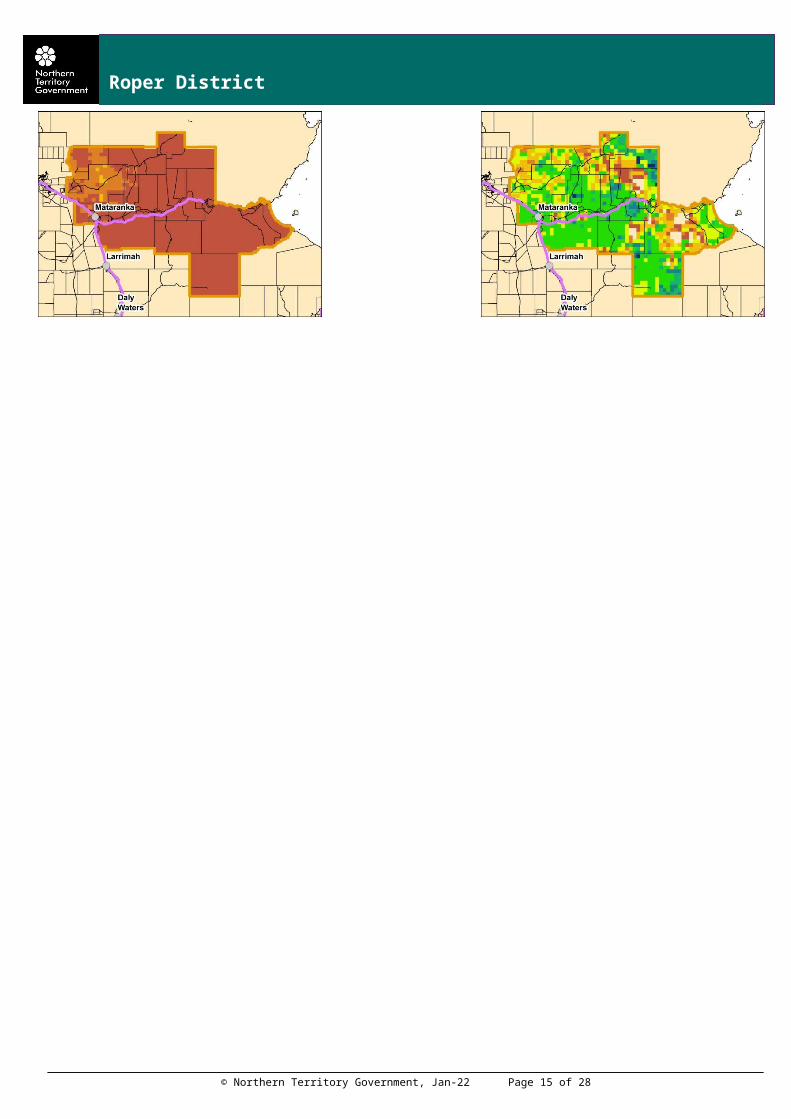
Roper District
Risks:- As at 1 December 2014, 28% of the district had been burnt
2014/15 Wet Season (as at 1 December 2014)
Pasture Growth(% of district)
Below Average73%
Average26%
Above Average1%
<1,000kg/ha100%
>1,000 & <2,000kg/ha0%
>2,000kg/ha0%
Currently
Total Standing Dry Matter
(% of district)
Below Average63%
Average36%
Above Average1%
<1,000kg/ha47%
>1,000 & <3,000kg/ha49%
>3,000kg/ha4%
Fire Risk(% of district)
High77%
Moderate23%
Low<1%
Area Burnt(% of district) 28% (since 1 July 2014)
Median Pasture Growth (kg/ha)(Running Total)
Chance of exceeding Median Pasture Growth(December 2014 – February 2015)
Total 2014/15 Pasture Growth(July - December 2014)
Current EstimatedTotal Standing Dry Matter
© Northern Territory Government, May-23 Page 9 of 16
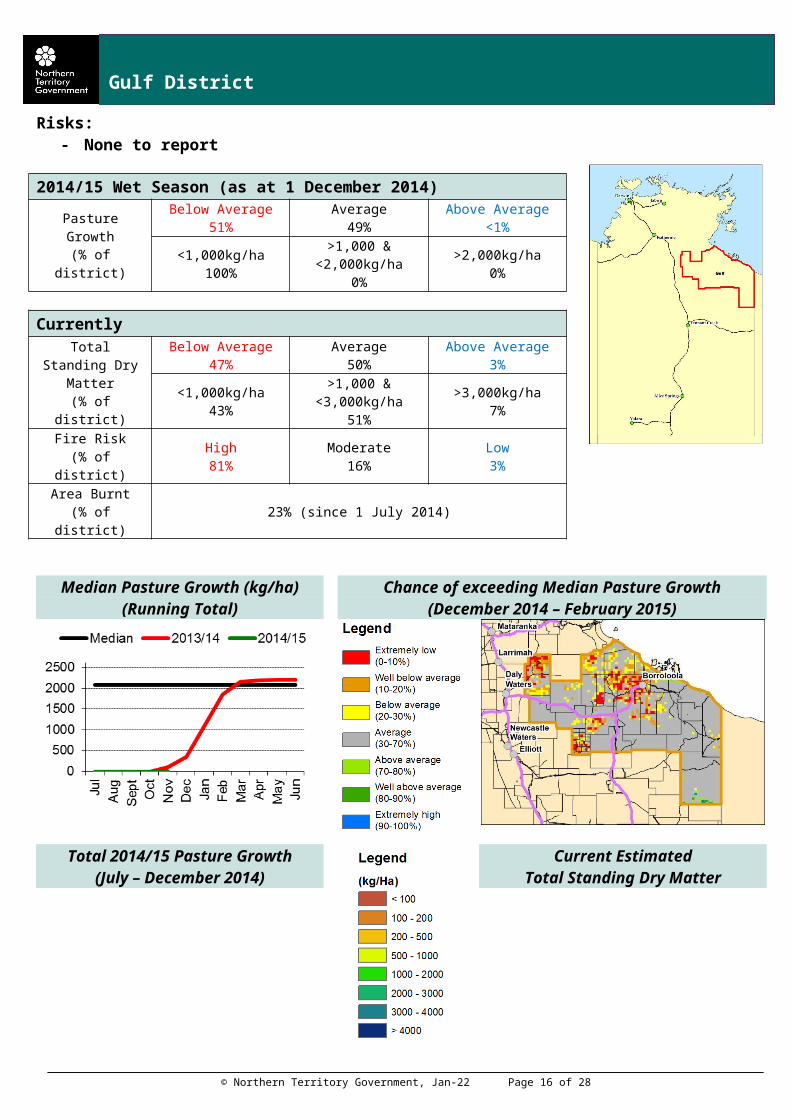
Gulf District
Risks:- None to report
2014/15 Wet Season (as at 1 December 2014)
Pasture Growth(% of district)
Below Average51%
Average49%
Above Average<1%
<1,000kg/ha100%
>1,000 & <2,000kg/ha0%
>2,000kg/ha0%
Currently
Total Standing Dry Matter
(% of district)
Below Average47%
Average50%
Above Average3%
<1,000kg/ha43%
>1,000 & <3,000kg/ha51%
>3,000kg/ha7%
Fire Risk(% of district)
High81%
Moderate16%
Low3%
Area Burnt(% of district) 23% (since 1 July 2014)
Median Pasture Growth (kg/ha)(Running Total)
Chance of exceeding Median Pasture Growth(December 2014 – February 2015)
Total 2014/15 Pasture Growth(July – December 2014)
Current EstimatedTotal Standing Dry Matter
© Northern Territory Government, May-23 Page 10 of 16
Barkly District
Risks:- None to report
2014/15 Wet Season (as at 1 December 2014)
Pasture Growth(% of district)
Below Average35%
Average57%
Above Average8%
<500kg/ha100%
>500 & <1,000kg/ha0%
>1,000kg/ha0%
Currently
Total Standing Dry Matter
(% of district)
Below Average19%
Average73%
Above Average8%
<500kg/ha45%
>500 & <1,000kg/ha30%
>1,000kg/ha25%
Fire Risk(% of district)
High47%
Moderate40%
Low13%
Area Burnt(% of district) 2% (since 1 July 2014)
Median Pasture Growth (kg/ha)(Running Total)
Chance of exceeding Median Pasture Growth(December 2014 – February 2015)
Total 2014/15 Pasture Growth(July - December 2014)
Current EstimatedTotal Standing Dry Matter
© Northern Territory Government, May-23 Page 11 of 16
Tennant Creek District
Risks:- None to report
2014/15 Wet Season (as at 1 December 2014)
Pasture Growth(% of district)
Below Average89%
Average11%
Above Average0%
<250kg/ha100%
>250 & <500kg/ha0%
>500kg/ha0%
Currently
Total Standing Dry Matter
(% of district)
Below Average27%
Average67%
Above Average6%
<500kg/ha26%
>500 & <1,000kg/ha35%
>1,000kg/ha38%
Fire Risk(% of district)
High79%
Moderate19%
Low2%
Area Burnt(% of district) <1% (since 1 July 2014)
Median Pasture Growth (kg/ha)(Running Total)
Chance of exceeding Median Pasture Growth(December 2014 – February 2015)
Total 2014/15 Pasture Growth(July - December 2014)
Current EstimatedTotal Standing Dry Matter
© Northern Territory Government, May-23 Page 12 of 16
Northern Alice Springs District
Risks:- None to report
2014/15 Season (as at 1 December 2014)
Pasture Growth(% of district)
Below Average34%
Average53%
Above Average13%
<250kg/ha83%
>250 & <500kg/ha13%
>500kg/ha4%
Currently
Total Standing Dry Matter
(% of district)
Below Average12%
Average75%
Above Average13%
<250kg/ha8%
>250 & <1,000kg/ha39%
>1,000kg/ha53%
Fire Risk(% of district)
High77%
Moderate20%
Low4%
Area Burnt(% of district) <1% (since 1 July 2014)
Median Pasture Growth (kg/ha)(Running Total)
Chance of exceeding Median Pasture Growth(December 2014 – February 2015)
Total 2014/15 Pasture Growth(July - December 2014)
Current EstimatedTotal Standing Dry Matter
© Northern Territory Government, May-23 Page 13 of 16
Plenty District
Risks:- The district has experienced consecutive poor seasons. Both the 2012/13
and the 2013/14 seasons were well below average. As at 1 December 2014, 49% of the district had below average total standing dry matter and 29% had extremely low levels (<250kg/ha).
2014/15 Season (as at 1 December 2014)
Pasture Growth(% of district)
Below Average100%
Average<1%
Above Average0%
<250kg/ha100%
>250 & <500kg/ha0%
>500kg/ha0%
Currently
Total Standing Dry Matter
(% of district)
Below Average49%
Average47%
Above Average5%
<250kg/ha29%
>250 & <1,000kg/ha56%
>1,000kg/ha15%
Fire Risk(% of district)
High21%
Moderate68%
Low12%
Area Burnt(% of district) 0% (since 1 July 2014)
Median Pasture Growth (kg/ha)(Running Total)
Chance of exceeding Median Pasture Growth(December 2014 – February 2015)
Total 2014/15 Pasture Growth(July – December 2014)
Current EstimatedTotal Standing Dry Matter
© Northern Territory Government, May-23 Page 14 of 16
Southern Alice Springs District
Risks:- None to report
2014/15 Season (as at 1 December 2014)
Pasture Growth(% of district)
Below Average49%
Average45%
Above Average5%
<250kg/ha99%
>250 & <500kg/ha1%
>500kg/ha0%
Currently
Total Standing Dry Matter
(% of district)
Below Average21%
Average68%
Above Average11%
<250kg/ha8%
>250 & <1,000kg/ha63%
>1,000kg/ha29%
Fire Risk(% of district)
High72%
Moderate26%
Low2%
Area Burnt(% of district) <1% (since 1 July 2014)
Median Pasture Growth (kg/ha)(Running Total)
Chance of exceeding Median Pasture Growth(December 2014 – February 2015)
Total 2014/15 Pasture Growth(July - December 2014)
Current EstimatedTotal Standing Dry Matter
© Northern Territory Government, May-23 Page 15 of 16
DEPARTMENT OF PRIMARY INDUSTRY AND FISHERIES
Pasture Information
The pasture and fire risk information in this document is derived from AussieGRASS. AussieGRASS is a model that simulates pasture growth and standing biomass using climate data, vegetation mapping, fire history and regional estimates of grazing pressure. The model can be used to track simulated pasture growth and total standing pasture biomass at the landscape scale.
Note that the model does not use stocking rate data for individual properties. Where stock numbers are significantly higher or lower than typical for a district, model estimates of total standing dry matter may be erroneous.
Disclaimer
While all care has been taken to ensure that information contained in this document is true and correct at the time of production, changes in circumstances after the time of distribution may impact on the accuracy of its information. The Northern Territory of Australia gives no warranty or assurance, and makes no representation as to the accuracy of any information or advice contained herein, or that it is suitable for your intended use.
You should not rely upon information in this document for the purpose of making any business or investment decisions without obtaining independent and/or professional advice in relation to your particular situation.
The Northern Territory of Australia disclaims any liability or responsibility or duty of care towards any person for loss of damage caused by any use of or reliance on this information.