compilation of statistics of ict-enabled services...
TRANSCRIPT
Compilation of Statistics of
Exports of ICT-enabled
services: Experiences from
a survey
AMITAVA SAHA, INDIA
E-mail: [email protected]

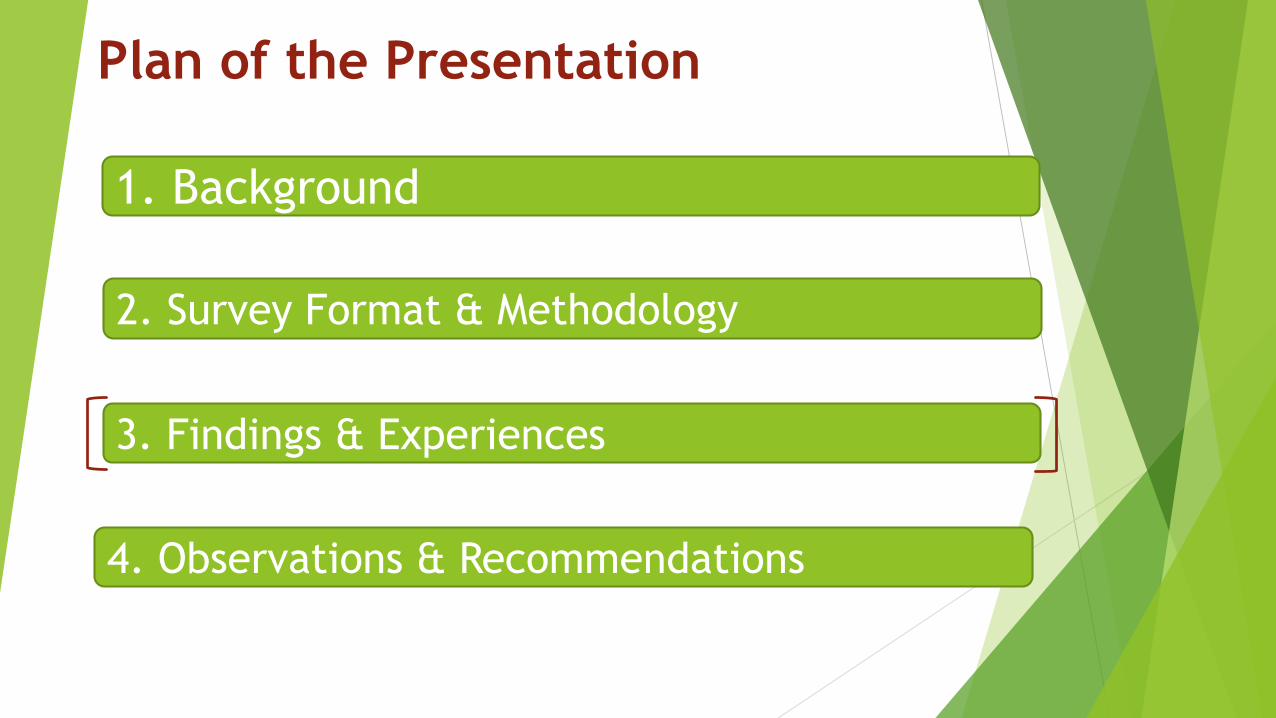
Plan of the Presentation
1. Background
2. Survey Format & Methodology
3. Findings & Experiences
4. Observations & Recommendations

Background
Services trade statistics in India is at present generated from the
International Transaction Reporting System (ITRS) implemented under the
Foreign Exchange Management Act (FEMA) and few other surveys (annual)
conducted by the Reserve Bank of India.
The Reserve Bank of India provides aggregate level statistics on services
trade following the standard classification as stipulated under the IMF’s
Balance of Payment Manual, Version 6 (BPM 6).
RBI does not compile and publish disaggregate level services trade
statistics – by partner country and mode of delivery.

Background Services exports has a significant contribution in Indian economy and there is a need
to generate disaggregate level services trade data.
‘Potential ICT-enabled’ services currently consists of around 70% of India’s total
exports of services.
Growth in exports of potential ICT-enabled services has surpassed that of services
exports.
Directorate General of Commercial Intelligence & Statistics (DGCIS), the nodal agency
responsible for compilation of services trade statistics decided to adopt the UNCTAD
classification of ‘potential ICT-enabled’ services in an all India survey for collection of
disaggregate level data on exports of these services.
According to the definition followed, services delivered through Mode 1 are
essentially ‘ICT-enabled’ services while those delivered through Mode1, Mode 2 & 4
are ‘potential ICT-enabled’ services.

India’s total exports of services vis-à-vis exports of
potential ICT-enabled services
Source: WTO Services Trade Database; *: Computed on the basis of 10 services identified by UNCTAD
0.00
20.00
40.00
60.00
80.00
100.00
120.00
140.00
160.00
180.00
2005 2006 2007 2008 2009 2010 2011 2012 2013 2014 2015 2016
Valu
e (
in B
illion U
S $
)
Commercial services ICT-enabled services*

Plan of the Presentation
1. Background
2. Survey Format & Methodology
3. Findings & Experiences
4. Observations & Recommendations
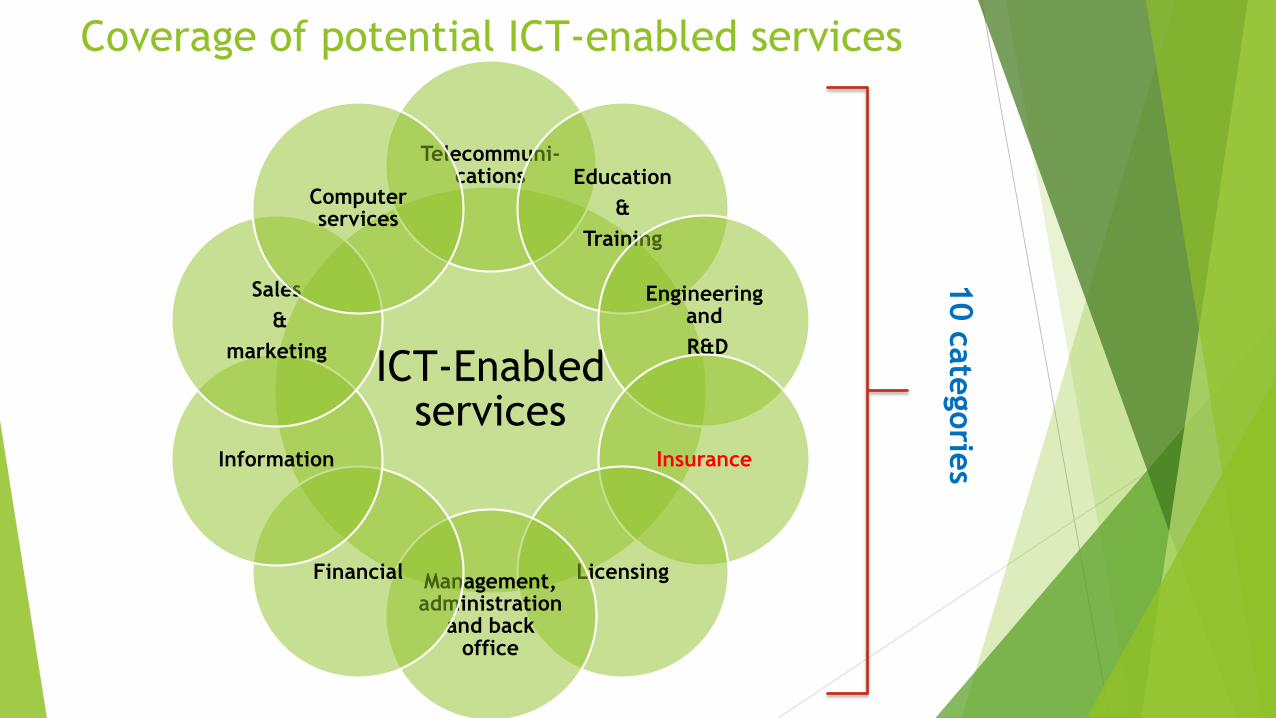
Coverage of potential ICT-enabled services
ICT-Enabled services
Telecommuni-cations Education
&
Training
Engineering and
R&D
Insurance
LicensingManagement, administration
and back office
Financial
Information
Sales
&
marketing
Computer services
10 c
ate
gorie
s

Coverage of potential ICT-enabled services
In view of the complexity involved in collection of information for insurance
sector and also because of the fact that the usual concept of mode of
supply does not appropriately apply to this sector, it has been decided to
develop a separate questionnaire to collect information for insurance
services.
The questionnaire, prepared by UNCTAD on the basis of model questionnaire
(questionnaire 12) as suggested in the BPM6 compilers’ guide, has been
modified to make provision for collection of information on :
Exports of services for a group of pre-defined trading partners that are important for
India
Exports of services by Mode 2 and Mode 4 in addition to Mode 1
An excel format of the questionnaire has also been designed and the same
has been made available though the website of DGCIS.
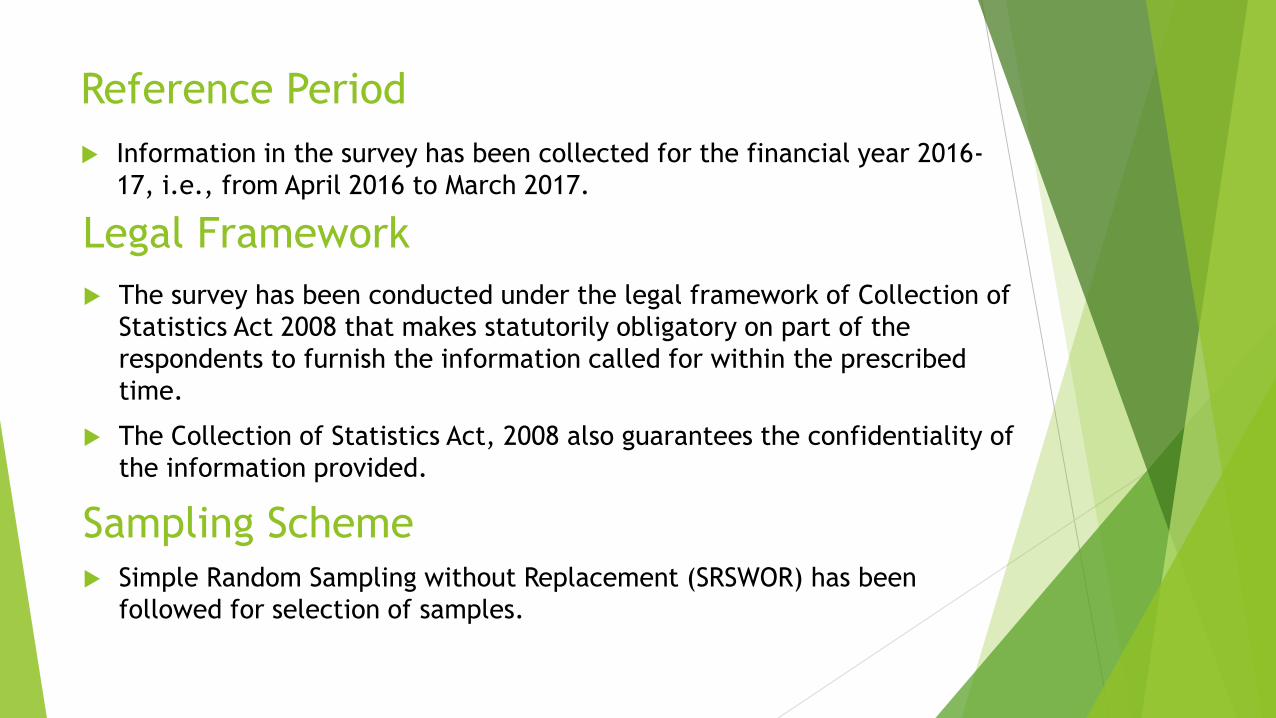
Reference Period
Information in the survey has been collected for the financial year 2016-
17, i.e., from April 2016 to March 2017.
Legal Framework
The survey has been conducted under the legal framework of Collection of
Statistics Act 2008 that makes statutorily obligatory on part of the
respondents to furnish the information called for within the prescribed
time.
The Collection of Statistics Act, 2008 also guarantees the confidentiality of
the information provided.
Sampling Scheme Simple Random Sampling without Replacement (SRSWOR) has been
followed for selection of samples.
Plan of the Presentation
1. Background
2. Survey Format & Methodology
3. Findings & Experiences
4. Observations & Recommendations
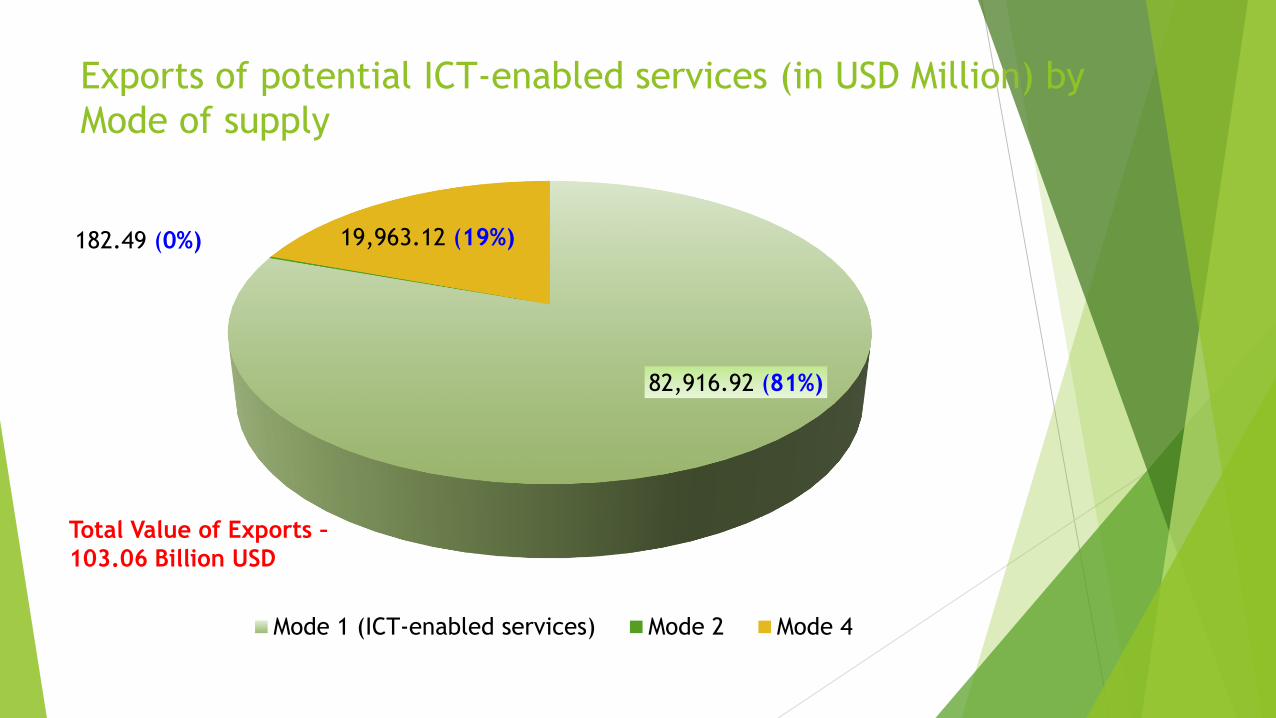
Exports of potential ICT-enabled services (in USD Million) by
Mode of supply
82,916.92 (81%)
182.49 (0%) 19,963.12 (19%)
Mode 1 (ICT-enabled services) Mode 2 Mode 4
Total Value of Exports –
103.06 Billion USD
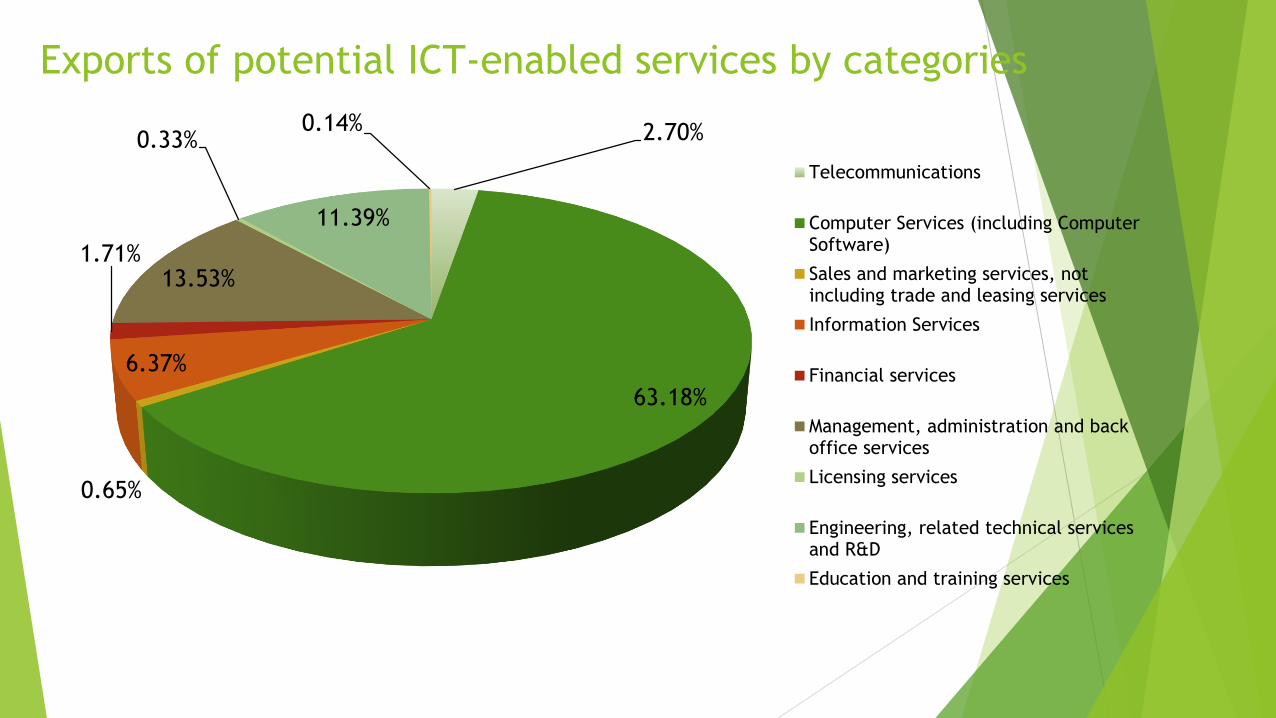
Exports of potential ICT-enabled services by categories
2.70%
63.18%
0.65%
6.37%
1.71%13.53%
0.33%
11.39%
0.14%
Telecommunications
Computer Services (including ComputerSoftware)
Sales and marketing services, notincluding trade and leasing services
Information Services
Financial services
Management, administration and backoffice services
Licensing services
Engineering, related technical servicesand R&D
Education and training services

Exports of potential ICT-enabled services by mode of supply
0% 20% 40% 60% 80% 100%
Telecommunications
Computer Services (including ComputerSoftware)
Sales and Marketing Services
Information Services
Financial services
Management, administration and back officeservices
Licensing services
Engineering, related technical services andR&D
Education and training services
Mode 1
Mode 2 &Mode 4

Exports of potential ICT-enabled services by mode of supply
Category of serviceValue of Exports (in USD Million)
Mode 1 Mode 2 Mode 4 Total
Telecommunications 2,762.70 0.00 20.15 2,782.85
Computer Services (including Computer Software) 47,704.29 5.77 17,407.05 65,117.11
Sales and marketing services, not including trade and
leasing services 665.66 4.08 0.00 669.73
Information Services 6,519.88 0.97 42.97 6,563.82
Financial services 1,699.33 7.06 55.72 1,762.11
Management, administration and back office services 13,502.75 1.69 436.06 13,940.50
Licensing services 343.71 0.00 0.00 343.71
Engineering, related technical services and R&D 9,644.40 97.10 1,995.13 11,736.63
Education and training services 74.21 65.82 6.04 146.07
All 82,916.92 182.49 19,963.12 103,062.52

Top Destinations of Exports of potential ICT-enabled services
56.7
12.3
7.75.3
3.6 2.8 2.4 2.1 2.0 1.6
45.5
9.96.7
4.72.3 1.8 2.1 1.7 1.8 1.4
0.0
10.0
20.0
30.0
40.0
50.0
60.0
UnitedStates
UnitedKingdom
OtherEuropeanCountries
Singapore West Asia Australia Germany Switzerland Other EastAsian
Countries
Netherlands
valu
e o
f export
s (B
illion $
)
All Mode 1

Potential ICT-enabled services exporting enterprises by
size0% 10% 20% 30% 40% 50% 60% 70% 80% 90% 100%
Telecommunications
Computer Services
Sales and marketing services
Information Services
Financial services
Management, administration and back office
Licensing services
Engineering, related technical services and R&D
Education and training
All
0 - 9
10 - 49
50 - 249
≥ 250

Contribution to total exports of potential ICT-enabled
services by enterprise size
0.0
10.0
20.0
30.0
40.0
50.0
60.0
70.0
80.0
90.0
0 - 9 10 - 49 50 - 249 250+
5.4
21.131.2
42.3
0.1 0.7 3.5
95.7
% no. of enterprises
% contribution to total exports of potential ICT-enabled services
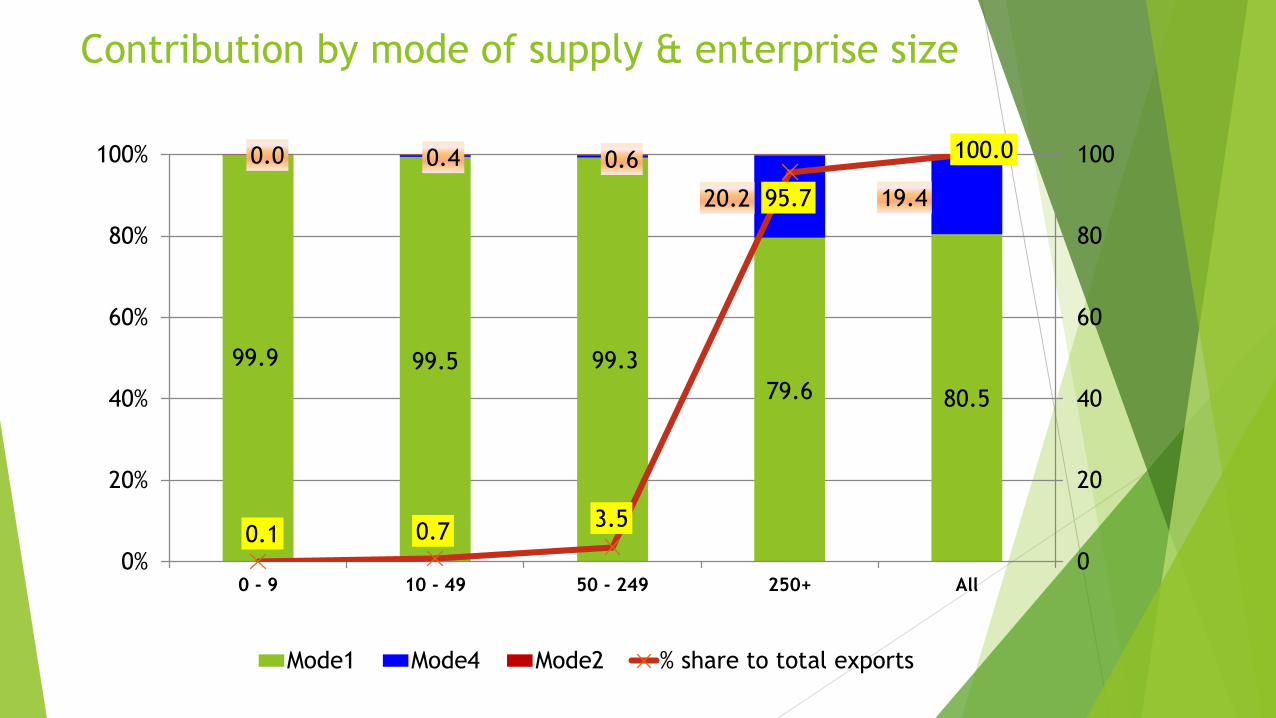
Contribution by mode of supply & enterprise size
99.9 99.5 99.3
79.6 80.5
0.0 0.4 0.6
20.2 19.4
0.1 0.73.5
95.7
100.0
0
20
40
60
80
100
0%
20%
40%
60%
80%
100%
0 - 9 10 - 49 50 - 249 250+ All
Mode1 Mode4 Mode2 % share to total exports

Export intensity of different types of enterprises
0.0
10.0
20.0
30.0
40.0
50.0
60.0
70.0
0 - 9 10 - 49 50-249 250+
5.4
21.1
31.2
42.3
0.1 0.73.5
95.7
66.557.5
62.8
33.1
% no. of enterprises
% contribution to total exports of potential ICT-enabled services
export intensity (= exports/all modes turnover)
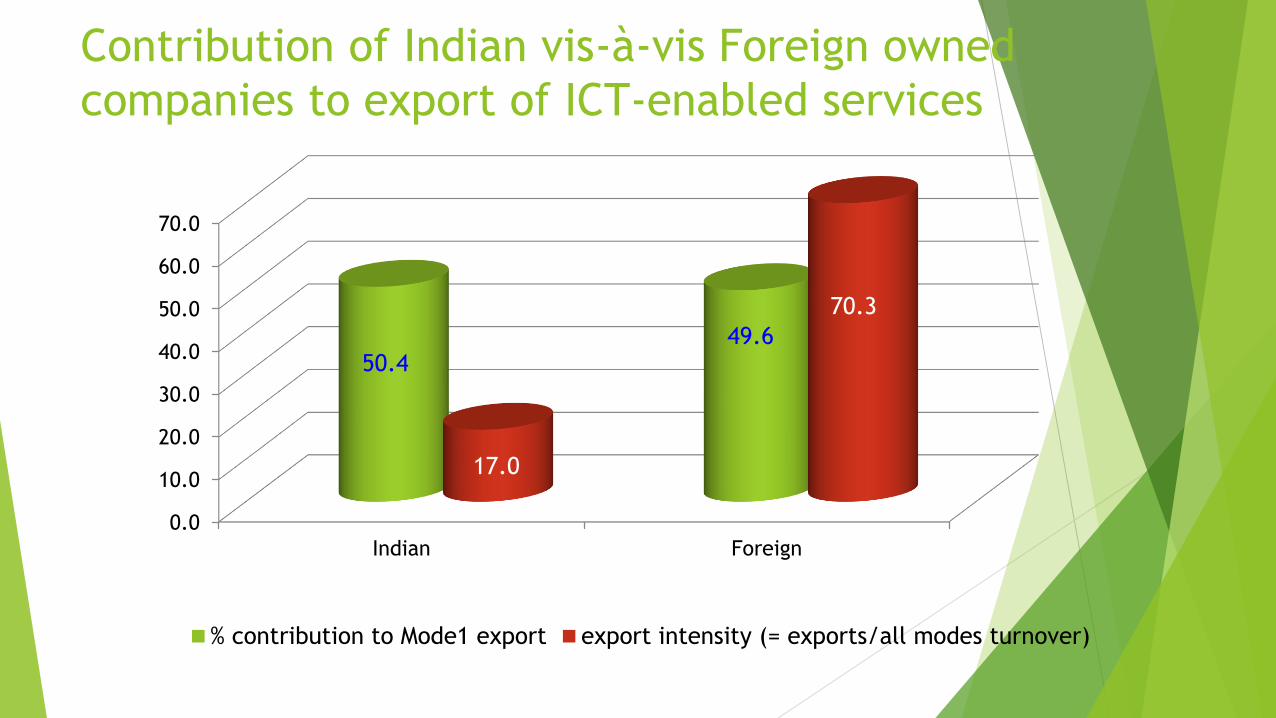
Contribution of Indian vis-à-vis Foreign owned
companies to export of ICT-enabled services
0.0
10.0
20.0
30.0
40.0
50.0
60.0
70.0
Indian Foreign
50.449.6
17.0
70.3
% contribution to Mode1 export export intensity (= exports/all modes turnover)
Plan of the Presentation
1. Background
2. Survey Format & Methodology
3. Findings & Experiences
4. Observations & Recommendations
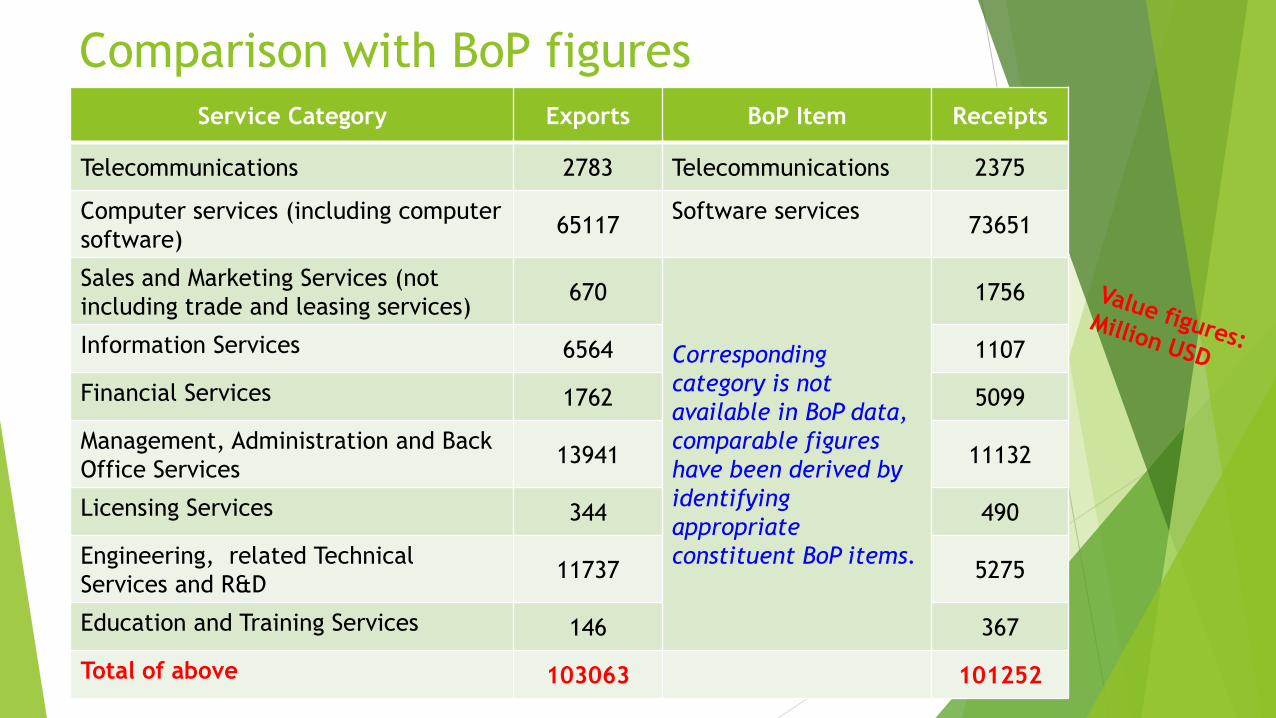
Comparison with BoP figures
Service Category Exports BoP Item Receipts
Telecommunications 2783 Telecommunications 2375
Computer services (including computer
software)65117
Software services 73651
Sales and Marketing Services (not
including trade and leasing services) 670
Corresponding
category is not
available in BoP data,
comparable figures
have been derived by
identifying
appropriate
constituent BoP items.
1756
Information Services 6564 1107
Financial Services 1762 5099
Management, Administration and Back
Office Services 13941 11132
Licensing Services 344 490
Engineering, related Technical
Services and R&D 11737 5275
Education and Training Services 146 367
Total of above 103063 101252

Observations
Information in this survey has been collected through self-compilation only.
No field visit was made.
Clarifications as well as assistance for compilation and submission of
information has also been provided through e-mail and telephone.
The excel format of the questionnaire designed in consultation with
UNCTAD has been found to be simple and easy to use by the respondents.
An overwhelming majority (77%) of the units preferred electronic mode for
submission of data.
This has resulted to a large extent in speedy processing and compilation of
collected information.
Enterprise-based approach has been adopted and information has been
collected from the corporate headquarters of the establishments.
Observations
This has resulted in significant savings in cost of survey as well the time
needed for collection of information.
The gender distribution of the employees engaged in potential ICT-enabled
services exporting enterprises resembles that of other major sectors of the
economy.
The overall response rate in the survey has been 74% (76% for census and
70% for sample sector units).
The response rates for census units of telecommunications, computer
services and management & back office services have been more than 90%.

Limitations
The estimates presented here are subject to the conventional sampling as well
as non-sampling errors attributable to any survey sampling exercise.
In the absence of a Business Register (BR), although best effort has been made
to prepare an exhaustive sampling frame (complete list of units) of enterprises
for selection of samples, it has not been possible to ensure completeness of
coverage for all categories of services.
This may induce some non-sampling error in estimation.
Non-availability of auxiliary information for the enterprises restrained us from
adopting any sophisticated sampling procedure (other than SRSWOR) for
enhancement of precision of the estimates.
However, comparison of the survey estimates with BoP figures shows that the
methodology followed is capable of producing reasonably consistent estimates.

Recommendations The approach followed in India for generation of disaggregated level estimates
of exports of potential ICT-enabled services is a simple one and can be
replicated in other countries as well.
In countries with updated BR, the precision of the estimates can be enhanced
further by adopting advanced sampling designs through scientific utilization of
available auxiliary information in the BR.
On the basis of the experiences gained in the pilot studies conducted and in
consultation with stakeholders, a comprehensive compilers manual with the
following components may be prepared under the guidance and leadership of
UNCTAD:
(i) Definitions with examples, (ii) A model questionnaire along with electronic format for
collection of information, (iii) Sampling strategy for selection of units, (iv) Suggested
tabulation of data.

Thank You