competitiveness and business environment in finland...
TRANSCRIPT

Competitiveness and Business
Environment in Finland –
An International Benchmarking
MTI Publications
7/2004
Industries Department


Series title and number of the publication Aleksanterinkatu 4
P.O. Box 32 Tel. +358 9 16001 MTI Publications FIN-00170 Helsinki FINLAND
FIN-00023 GOVERNMENT Helsinki FINLAND
Telefax +358 9 1606 3666 7/2004
Date March 2004
Commissioned by Ministry of Trade and Industry
Authors Industries Department Hannu Lipponen Esa Viitamo
Date of appointment
Title Competitiveness and Business Environment in Finland - An International Benchmarking
Abstract Competitiveness and Business Environment in Finland - An International Benchmarking reviews the interaction between competitiveness, production structures, and the business environment. The survey sets out to analyse Finnish competitiveness in an international context. The economic performance is outlined thorough an analysis of standard of living, productivity and industrial structures. The analysis of business environment is narrowed down to innovation environment and labour and product markets. These are areas that have been highlighted in recent international competitiveness analyses, too. Finnish competitiveness is of a high standard. In recent years, productivity has increased rapidly and production has been developing towards knowledge-intensive structures. Finnish innovation environment is globally advanced and the innovation activities and support systems are efficient. Maintaining competitiveness requires that the base of productivity growth be extended to include more industrial activities. The percentages of gross domestic product are rather high in the sectors with lower growth rates in productivity. Moreover, their output is heavily dependent upon demand in the domestic market. These sectors include construction, transport, real estate, business-related services, social and health services, as well as education. To foster productivity growth and to further open up the economy, it is important to increase deregulation in product and labour markets. Moreover, there is a need to strengthen research and development inputs in the services sector. Finally, a great potential for improvement is found within public welfare services, where productivity can be raised through utilising the services of private enterprises. MTI contact: Industries Department/Senior Researcher Hannu Lipponen, tel. +358 9 1606 3606
Key words Industrial policy, competitiveness, markets, structural change, business environment, productivity, employment
ISSN 1459-9376
ISBN 951-739-764-X
Pages 82
Language English
Price € 17
Published by Ministry of Trade and Industry
Sold by Edita Publishing Ltd


Foreword
Competitiveness and Business Environment in Finland – An International
Benchmarking is a review drawn up by the Ministry of Trade and Industry. It aims
to outline the interaction between competitiveness, industrial structure and the
business environment of enterprises in Finland.
The review is a tool for the Ministry, to support the design and implementation of
Finland’s business environment policy. Our objective is also to discuss competi-
tiveness and its determinants. For this purpose, a section has been added to the Min-
istry’s website at the address www.ktm.fi/competitiveness. This section monitors
the development of competitiveness and the business environment in Finland.
The starting point of this review is benchmarking Finnish competitiveness in an in-
ternational context. Economic performance is examined through an analysis of the
standard of living, productivity and industrial structure. As for the business envi-
ronment, the focus is on the innovation environment, as well as on the labour and
commodity markets. The role of these factors has been emphasised in recent inter-
national studies, too. Taxation and macroeconomic factors are excluded from this
review. The purpose of the forthcoming reviews is to deepen and expand the analy-
sis of the business environment.
This review, compiled by the Industrial Policy Division of the Ministry’s Industries
Department, is also available at the web address mentioned above.
Erkki Virtanen
Permanent Secretary

Contents
Foreword . . . . . . . . . . . . . . . . . . . . . . . . . . . . . . . . . . 5
Contents . . . . . . . . . . . . . . . . . . . . . . . . . . . . . . . . . . 7
Summary and Conclusions . . . . . . . . . . . . . . . . . . . . . . . 9
1 National competitiveness . . . . . . . . . . . . . . . . . . . . . 12
1.1 Competitiveness consists of several levels . . . . . . . . . . . . 12
1.2 Finland ranks well in international evaluations . . . . . . . . . . 13
2 Well-being . . . . . . . . . . . . . . . . . . . . . . . . . . . . . . 16
2.1 Finnish well-being is among the highest in the world . . . . . . 16
2.2 Economic growth has been among the fastest in the world. . . . 20
2.3 The structure of productivity growth has changed . . . . . . . . 24
3 Industrial structure . . . . . . . . . . . . . . . . . . . . . . . . 27
3.1 The market sector is expanding . . . . . . . . . . . . . . . . . . 27
3.2 Productivity growth is driven by manufacturing . . . . . . . . . 28
3.3 Information and communications technology shows the way . . 32
3.4 Technology- and knowledge-intensity is increasing . . . . . . . 37
3.5 Industry restructuring reflects the dynamics of company
demography . . . . . . . . . . . . . . . . . . . . . . . . . . . . . . . 43
4 Innovation environment . . . . . . . . . . . . . . . . . . . . . 48
4.1 High educational level of population . . . . . . . . . . . . . . . 48
4.2 Many top-skilled workers . . . . . . . . . . . . . . . . . . . . . 52
4.3 R&D investment is top-class . . . . . . . . . . . . . . . . . . . 57
4.4 Availability of risk financing is good . . . . . . . . . . . . . . . 62
4.5 Innovation activities are fruitful . . . . . . . . . . . . . . . . . 64

5 Functioning of the market . . . . . . . . . . . . . . . . . . . . 68
5.1 Unemployment turning into lack of labour . . . . . . . . . . . . 68
5.2 The educational attainment level and demand for labour are ill
matched . . . . . . . . . . . . . . . . . . . . . . . . . . . . . . . . . 70
5.3 Deficiencies in the flexibility of the labour market . . . . . . . . 73
5.4 The openness of economy is relatively low. . . . . . . . . . . . 74
5.5 Regulation restricts competition on the home market . . . . . . 76
Sources . . . . . . . . . . . . . . . . . . . . . . . . . . . . . . . . . . . 80

Summary and Conclusions
Business environment is excellent, whereas the standard of living is only
average
Finland is doing well in the global competition. Productivity has grown rapidly and
the industrial structure has been upgraded. Welfare, measured by economic, social
and environmental indicators, is among the highest in the world, as in the other
Nordic countries.
Finland places remarkably high in international rankings of competitiveness, too.
The results of these rankings are, however, mixed from the Finnish point of view.
The competitiveness of the business environment gets an excellent score, whereas
for the standard of living the position has remained around the 15th for years. This
contradiction needs an explanation.
This explanation has been sought for by assessing competitiveness on three interde-
pendent levels. Standard of living depicts economic performance, with labour in-
puts and labour productivity as its components. Performance is influenced by the
industrial structure, which is a key determinant for the growth potential of econ-
omy. The third level is the business environment, which determines the industrial
structure and which business environment policy directs.
Restructuring of industry has been prominent
The growth of labour productivity has been strong for more than two decades. This
has mainly been attributed to the manufacturing sector, with productivity growth
second fastest after Ireland. For the service sector and construction in particular,
productivity growth has been markedly slower, at times even negative. By the inter-
national standard, however, productivity has grown rapidly in the service sector,
too. In general, industries producing information and communication technologies
and utilising them extensively show the highest productivity growth.
There has been a marked shift in the sources of the productivity growth towards the
end of the 1990s. Total factor productivity, reflecting technological development
and improvement in skills and know-how, has increasingly replaced productivity
growth based on capital deepening. This indicates a growing knowledge-intensity
of the industrial structure.
9

The change in the industrial structure has been profound and one of the fastest in the
world. Increase in technology-intensity of the manufacturing sector has been
strong, driven mainly by the manufacture of communications equipment. For the
service sector the structural change has been slower, though in international com-
parison the GDP share of the knowledge-intensive services has been growing rap-
idly as well. The enterprise volatility rate has also been high, boosting productivity
growth in several industries.
The growth rate of labour input and the standard of living have a strong interdepen-
dence. During the past ten years, employment has picked up dynamically, but there
are still some 130,000 jobs less than before the depression at the beginning of the
1990s.
Innovation environment is favourable, while the functioning of the markets
is deficient
Numerous indicators show that the Finnish innovation environment is excellent;
the level of educational attainment of the workforce is high and the research re-
sources are top-class, cooperation between businesses and research institutions is
intensive and innovation activities are productive and internationally oriented.
Moreover, the financial market functions efficiently, and the availability of venture
capital is good by the international standard.
The causality between the quality of the innovation environment and the rapid
growth of labour productivity is straightforward. Favourable innovation environ-
ment has promoted restructuring of the economy and the growth of the technol-
ogy-intensity of production processes as well.
Competition encourages firms to maintain and improve efficiency and develop new
products. The openness of economy, i.e. the extent it is internationally integrated,
determines the functioning of competition. The openness of the Finnish economy is
lower compared to that of the other small EU Member States. The share of foreign
trade of GDP and the number of foreign investments channelled to Finland are rela-
tively low, and the price level is one of the highest in the world.
The gradual deregulation of the product market, initiated in the 1980s, has pro-
moted the growth of productivity and restructuring. Still, in OECD estimates, Fin-
land figures among the countries where regulation has been proved to hinder com-
petition. Construction, water and natural gas resources management, retail trade
and transportation are among the sectors subjected to detrimental regulation. The
exposure of these industries to international competition has been low, too. The ris-
10
ing price level and weak productivity growth are characteristic of industries pro-
tected from international competition.
There is evidence of malfunctioning of the labour market, too. Problems occur in
matching the educational structure and the demand for labour, although the educa-
tional level, labour participation rate and participation in adult training are the high-
est in the world. The long duration of academic studies weakens the employment
rate. The greatest problem of the labour market is, however, high unemployment,
which results e.g. from the rapid industrial restructuring and ageing of the popula-
tion. Within the next few years, the ageing of the population and the increasing lack
of qualified labour will be factors that restrict economic growth.
The greatest potential for productivity growth lies in the service sector
Maintaining competitiveness calls for strengthening productivity growth and ex-
tending the growth base. Except for the manufacture of communications equip-
ment, the industries with the highest growth of productivity are relatively narrow.
Conversely, productivity growth is lowest in industries with considerable GDP
shares. Among these are construction and specific service industries: transporta-
tion, real-estate activities, business services, health care and social services, as well
as education and training.
The greatest potential for productivity growth is in the service sectors and in con-
struction. Productivity growth and increased openness of the economy necessitate
abolishing the detrimental regulation of the product and labour markets. R&D ac-
tivities in the service sectors should also be boosted. The greatest potential lies in
raising the productivity of public health care services by fostering market-based ac-
tivities in particular. Provision of services has been gradually opened to private en-
terprises. Still, lack of procurement skills is one of the factors putting the brakes on
the change.
11

1 National competitiveness
Starting point
Improvement of economic performance and recognition of the factors explaining it
have been raised as the core of business environment policy. This is influenced by
two development trends in particular, which became increasingly stronger in the
1990s.
The integration of world economy and deregulation of the markets have strength-
ened competition between firms and countries and subjected new, previously pro-
tected economic sectors to competition. Globalisation and the related rapid techno-
logical change have at the same time added to the volatility of international eco-
nomic development. Unanticipated changes in the business environment may
change, even rapidly, the relative competitive positions of countries.
1.1 Competitiveness consists of several levels
By definition, national competitiveness refers to a country’s economic perfor-
mance in relation to other countries or groups of countries1. On the methodological
side, the internal dynamics of economy is increasingly stressed. The characteristics
of the business environment and the resource base of a country pave the way for the
growth of production and productivity. This is further reflected in the development
of the standard of living and welfare, respectively.
In this review, too, analysis follows the successive stages mentioned above. The
competitiveness of the business environment is primarily determined by microeco-
nomic factors, of which the most important ones are the innovation environment
and functioning of markets. These factors are examined here, too. The purpose of
business environment policy is to improve the microeconomic environment2.
12
1 Competitiveness is related to a narrower concept, competitive advantage, which refers to resources or
assets that competitiveness of countries is based on (most often a factor of the business environment).
This resource is not freely available to other countries.
2 The other component of the business environment, macroeconomic factors, are excluded from this
review.

Figure 1. Levels and dynamics of competitiveness
The business environment provides the preconditions for the competitiveness of
firms, industries and production activities, which is measured by productivity and
change in the industrial structure. The competitiveness of the industrial structure
further determines the overall performance, i.e. the standard of living (GDP/popu-
lation). The standard of living again is an integral element of welfare, which is mea-
sured by such qualitative factors as education and training, health and the state of
the environment.
In Figure 1, the competitiveness effects are mainly directed from below upwards. In
reality, firms and industries also influence their business environment and its com-
petitiveness in many ways. This also applies to welfare, which through social capi-
tal affects labour productivity. However, examination of these feedbacks is ex-
cluded from the scope of this review.
1.2 Finland ranks well in international evaluations
The Swiss institutes, World Economic Forum (WEF) and International Institute for
Management Development (IMD), draw up annually evaluations of the competi-
tiveness of developed and less developed economies. Competitiveness is measured
by composite indexes that are derived from statistics describing the state of econo-
mies and the views of business executives of various countries. In the evaluations
of both institutes, Finland has ranked high in recent years.
13
Competitiveness of
the business environment
• Innovation environment
• Labour market
• Commodities market
Competitiveness of
the industrial structure
• Productivity of sectors
• Change in the industrial structure
• Enterprise turnover rate
Business
environment
policy
Welfare and standard of living
• Human and environmental well-being
• Labour input
• Productivity
Competitiveness of
the business environment
• Innovation environment
• Labour market
• Commodities market
Competitiveness of
the industrial structure
• Productivity of sectors
• Change in the industrial structure
• Enterprise turnover rate
Business
environment
policy
Welfare and standard of living
• Human and environmental well-being
• Labour input
• Productivity

However, Finland’s overall performance is mixed. In the latest ranking of IMD,
Finland tops the comparison in terms of the business environment depicting the fu-
ture competitiveness potential, but as to performance realised it is ranked at 18
only. The business environment indexes are based on questionnaire material,
whereas performance has mainly been measured by statistics.
WEF’s Growth Competitiveness Index, which in 2001 was the second highest in
Finland after the United States, measures the growth potential of economy and
thereby future competitiveness potential, too. Finland is well placed by indicators
of technological development and functioning of public institutions, but our macro-
economic competitiveness is relatively low, respectively3. As in the results of IMD,
Finland is ranked high by indexes based on the views of business executives.
The Finnish paradox
WEF’s growth competitiveness analysis is complemented with a comparison of the
microeconomic business environment, which aims to map out the factors explain-
ing the differences in the standard of living. Here the analytical framework is a clus-
ter model by Michael Porter4, in which the competitiveness of the various industries
is created as a joint effect of the strategies and business environment of firms. The
total microeconomic index is obtained as a weighted average of the indicators mea-
suring these determinants.
Based on this cluster approach, too, the Finnish business environment turns out to
be excellent. The competitiveness of the microeconomic business environment cor-
relates positively with the standard of living, i.e. countries with high competitive-
ness also have a high GDP per capita. Deviations are, however, big, and Finland, to-
gether with the UK, belongs to countries where the standard of living is clearly
lower than what the quality of the business environment statistically predicts.
In general, there are two explanations for this performance deficit. According to
WEF, Finland’s competitiveness lies on a solid ground, and the deficit can be attrib-
14
3 The Global Competitiveness Report 2002–2003, WEF. According to the latest report by WEF, Fin-
land also ranks on the top in terms of macroeconomy as well: at the second position. The main ex-
planation for this leap is that the index depicting public expenditure has been replaced by indexes
measuring the efficiency of the public sector.
4 Cf. Porter, 1990.
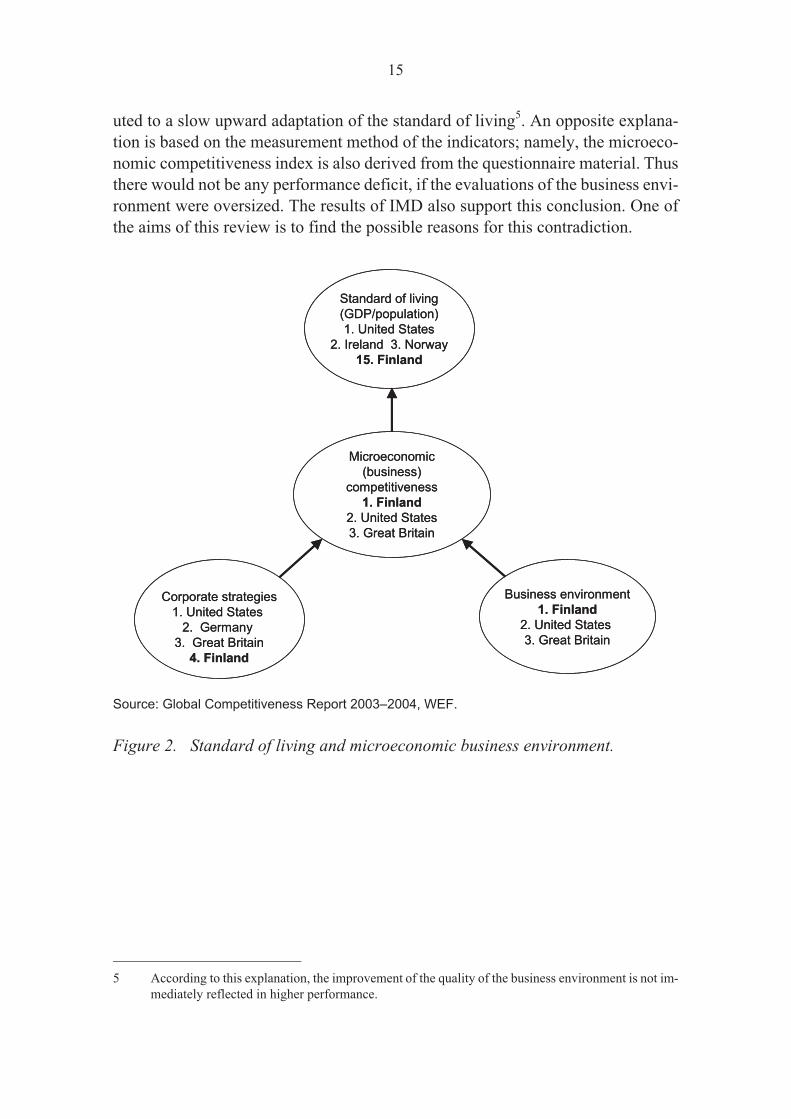
uted to a slow upward adaptation of the standard of living5. An opposite explana-
tion is based on the measurement method of the indicators; namely, the microeco-
nomic competitiveness index is also derived from the questionnaire material. Thus
there would not be any performance deficit, if the evaluations of the business envi-
ronment were oversized. The results of IMD also support this conclusion. One of
the aims of this review is to find the possible reasons for this contradiction.
Source: Global Competitiveness Report 2003–2004, WEF.
Figure 2. Standard of living and microeconomic business environment.
15
Standard of living
(GDP/population)
1. United States
2. Ireland 3. Norway
15. Finland
Business environment
1. Finland
2. United States
3. Great Britain
Corporate strategies
1. United States
2. Germany
3. Great Britain
4. Finland
Microeconomic
(business)
competitiveness
1. Finland
2. United States
3. Great Britain
5 According to this explanation, the improvement of the quality of the business environment is not im-
mediately reflected in higher performance.
2 Well-being
Interrelation between well-being, the environment and technology
Well-being can be divided into human and environmental well-being, which are
mutually dependent. Economic growth and the state of the environment have tradi-
tionally had a negative interdependence: if one is to be increased, the other has to be
cut. Technological change is, however, reducing this juxtaposition. The growth of
production based on research and intangibles allows increasing material well-being
without impairing the state of the environment6.
2.1 Finnish well-being is among the highest in the
world
According to a narrower definition, Finnish well-being is at 11th place in the
global ranking. Our educational level tops the rankings, but health and the stan-
dard of living represent the average level of the most developed countries.
With a broader definition (quality of living), Finland belongs to the top ten rank-
ing together with the other Nordic countries. The same applies to the well-being of
the environment and eco-competitiveness.
Health and the standard of living drop Finland off the leading scores
The Human Development Report, published annually by the United Nations, eval-
uates the socio-economic development of countries with a combined indicator HDI
(Human Development Index). The index is calculated as an average of life expec-
tancy, educational level and the standard of living (GDP/population). According to
the UN definition, human development is about creating an environment in which
people can develop their full potential and lead productive, creative lives in accord
with their needs and interests.
16
6 The state of the environment may even improve, if the production share of industries that heavily
strain the environment decreases at the same time.

Norway, Iceland and Sweden of the Nordic countries are countries with the highest
human development, which, except for Sweden, rank on top by all the three indica-
tors. In relation to the overall ranking, Sweden scores relatively low by the GDP per
capita. In the 2001 human development comparison, Finland shared the 11th place
together with Denmark, Ireland, the UK and Luxembourg. In terms of educational
attainment, Finland heads the world rankings (shared first place), but our overall
score declines owing to lower standard of living (15th position) and life expectancy
(16th position).
Quality of living and sustainable development are the world’s best
Despite its usability, the UN’s human development indicator omits some central
sub-sectors of well-being. The World Conservation Union (IUCN) uses a well-be-
ing index that is broader than HDI7. This index measuring sustainable development
distinguishes between human well-being (HWI8) and environmental well-being
(EWI9).
Table 1. Sustainable Development Index
Human Well-being Index (HWI) Ecosystem Well-being Index (EWI)
Health and stability of family size Biodiversity, state of the eco-system
Income level, nutrition, hygiene and national
economy
Quality of waterways and potable water
Educational level, communications system Air protection and quality of urban atmo-
sphere
Society, freedom, administration, crime Animal protection, diversity of species
Distribution of income and equality between
the genders
Consumption of natural resources and bur-
dens on the environment
Source: Wellbeing of Nations (2001).
The countries with the highest score in sustainable development are Sweden, Fin-
land, Norway and Iceland of the Nordic countries, together with Austria (cf. Figure
3). Thus Finland’s ranking is considerably higher, as well-being is expanded to in-
stitutional factors and when indicators of basic human needs are included in the
standard of living (prosperity). HWI, too, clearly favours the Nordic well-being
17
7 Wellbeing of Nations (2001).
8 HWI = Human Well-being Index.
9 EWI = Ecosystem Well-being Index.

model. In contrast, the ranking of many of the countries with a high standard of liv-
ing is declining. Luxembourg is at 14th place, the United States at 19 and Ireland at
15.
Source: World Conservation Union, http://www.iucn.org/themes/ssc.
Figure 3. Countries with the highest Sustainable Development Index
The differences between countries in the overall ranking are mainly attributed to
the differences in environmental well-being. In this regard, however, the countries
with the highest sustainable development are far from the world’s top. Finland
ranks at 85, Norway and Iceland at 94 and Sweden at 6210. If the other industrialised
18
0 20 40 60 80 100 120 140 160
Spain
Netherlands
Luxembourg
Greece
Portugal
UK
Belgium
USA
Italy
France
Japan
Ireland
Denmark
Germany
Canada
Switzerland
Austria
Iceland
Finland
Norway
Sweden
Human well-being
index
Environmental well-
being index
10 The non-industrialised countries with low utilisation of natural resources head the ranking.
countries are taken as points of reference, the Nordic countries retake the leading
positions11.
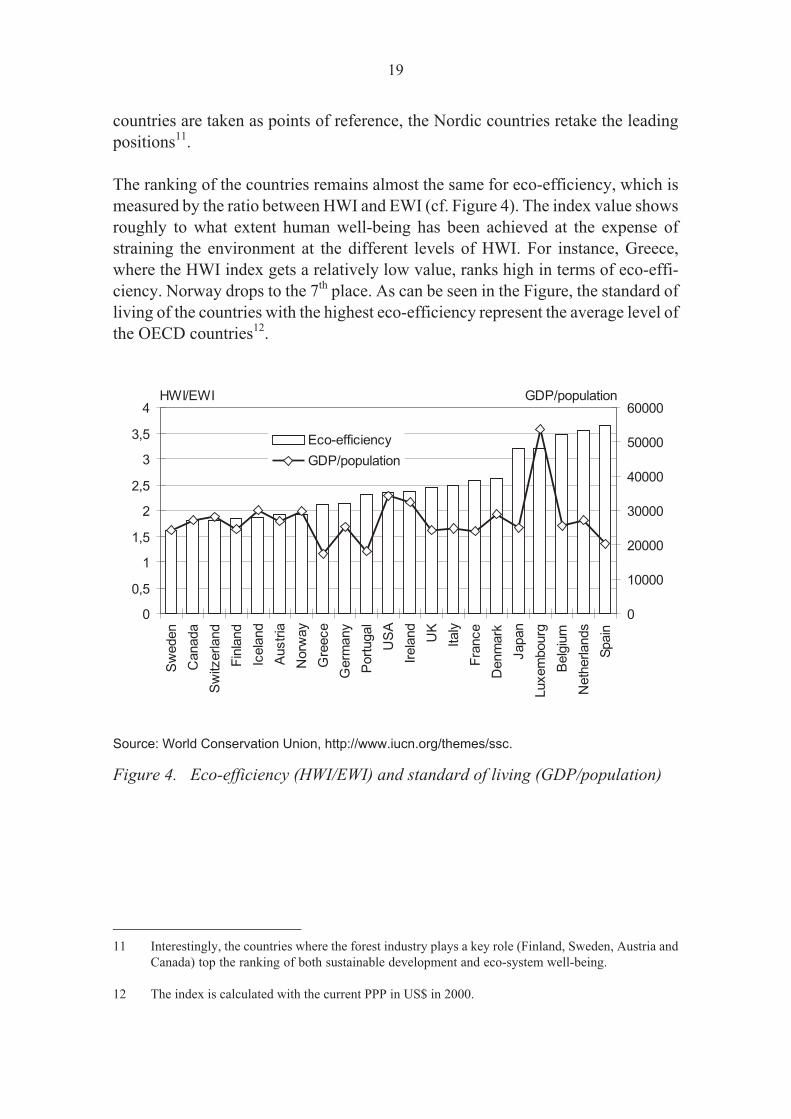
The ranking of the countries remains almost the same for eco-efficiency, which is
measured by the ratio between HWI and EWI (cf. Figure 4). The index value shows
roughly to what extent human well-being has been achieved at the expense of
straining the environment at the different levels of HWI. For instance, Greece,
where the HWI index gets a relatively low value, ranks high in terms of eco-effi-
ciency. Norway drops to the 7th place. As can be seen in the Figure, the standard of
living of the countries with the highest eco-efficiency represent the average level of
the OECD countries12.
Source: World Conservation Union, http://www.iucn.org/themes/ssc.
Figure 4. Eco-efficiency (HWI/EWI) and standard of living (GDP/population)
19
0
0,5
1
1,5
2
2,5
3
3,5
4
Sw
eden
Canada
Sw
itzerland
Fin
land
Icela
nd
Austr
ia
Norw
ay
Gre
ece
Germ
any
Port
ugal
US
A
Irela
nd
UK
Italy
Fra
nce
Denm
ark
Japan
Luxem
bourg
Belg
ium
Neth
erlands
Spain
0
10000
20000
30000
40000
50000
60000
Eco-efficiency
GDP/population
HWI/EWI GDP/population
11 Interestingly, the countries where the forest industry plays a key role (Finland, Sweden, Austria and
Canada) top the ranking of both sustainable development and eco-system well-being.
12 The index is calculated with the current PPP in US$ in 2000.
2.2 Economic growth has been among the fastest in
the world
Finland’s standard of living has for long occupied the 15th position. Of the factors
constituting the standard of living, productivity and labour participation rate are
the most important ones.
Economic growth in Finland has been among the fastest in the world. This has re-
sulted mainly from the dynamic growth of productivity and the relatively rapid
growth of employment.
The standard of living, which measures the performance of national economy, is
determined by the number of production inputs and the output yielded by the in-
puts. In its simplest form, the standard of living can be expressed by the identity be-
low:
The first term at the right hand side of the identity, labour productivity, depicts the
efficiency of total production. The second term denotes the average annual working
time, and the third one labour participation. Thus growth in labour productivity, an
increase in the number of working hours and an increase in the number of the em-
ployed in relation to the population affect the standard of living.
Labour participation is more important than working time
As for the standard-of-living, Finland’s ranking at the 15th position is about the
same as the score for its components. Compared e.g. to Ireland, the share of the em-
ployed population is higher in Finland, but Ireland has more working hours per em-
ployee, and productivity is also clearly higher. Similarly, in comparison to the sec-
ond ranking, Norway, Finland has clearly more working hours, but in Norway pro-
ductivity, as well as the proportion of the employed of the population, is higher. In
Finland the employment rate is higher than in the EU on average, but distinctly
lower than in the other Nordic countries. (cf. Figure 5).
20
population
employment
employment
rsworkinghou
rsworkinghou
GDP
population
GDP���

Source: Database of the University of Groningen.
Figure 5. Main components of the standard of living, 2002 (USA = 100)13
Looking at the OECD countries as a whole, there seems to be a negative interdepen-
dence between the standard of living and working hours, i.e. in the countries with a
high standard of living the number of working hours is low on the average. Except
for Finland, this is typical of the Nordic countries in particular. Instead, in most of
the Anglo-Saxon countries and in Japan, a high standard of living is associated with
a high number of working hours.
Conversely, the dependence of the standard of living on productivity and the em-
ployment rate is positive. The higher productivity and the employment rate are, the
higher standard of living can be attained. Therefore it can be concluded that produc-
tivity and the standard of living could be increased by reorganising work and rais-
21
60 70 80 90 100 110 120
UK
France
Finland
Japan
Italy
Germany
Belgium
Sweden
Austria
Australia
Netherlands
Canada
Denmark
Switzerland
Ireland
Norway
Employment/population
Hours/employment
GDP/hours
13 The countries are listed in the order of the quality of the standard of living.

ing the labour participation rate. These effects are transmitted through an increased
and more efficient use of labour inputs. Figure 6 illustrating an increase in the stan-
dard of living 614 also supports this conclusion.
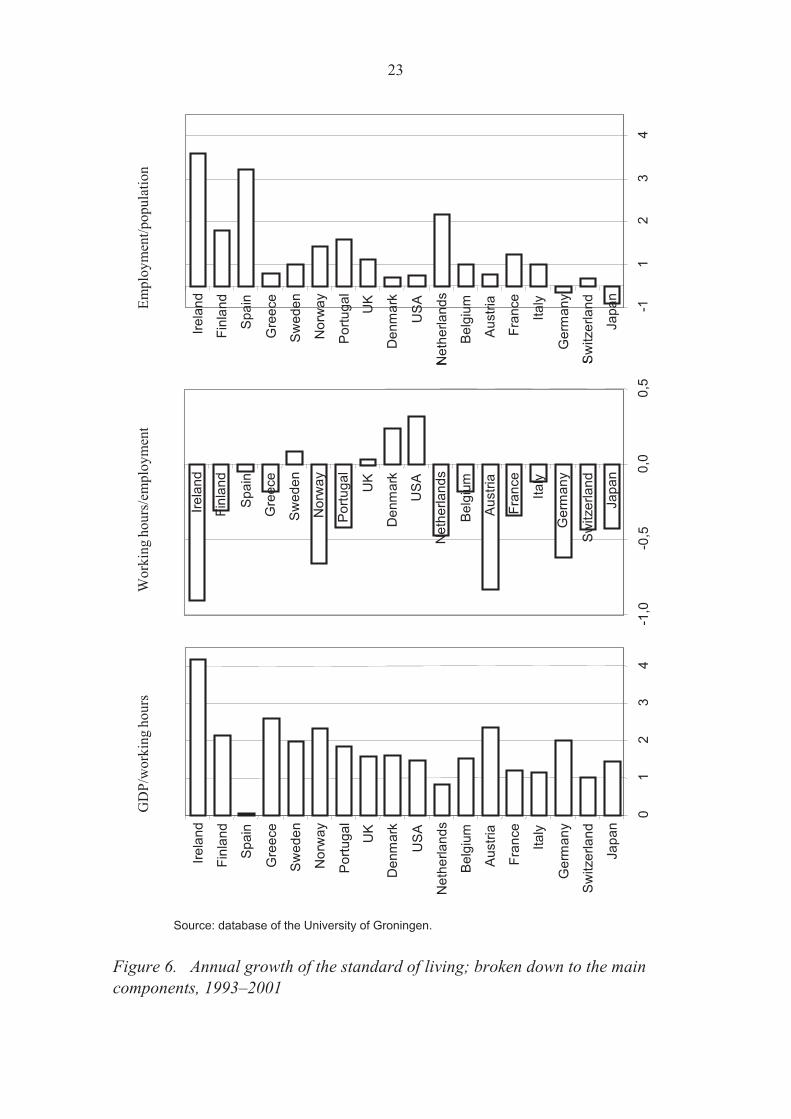
Growth of the standard of living is based on labour productivity
Of the OECD countries, growth of the standard of living has been clearly fastest in
Ireland – 6.4% on average – followed by Finland with a growth rate of over 3%. As
in most industrialised countries, the most important factor of economic growth in
Finland has been labour productivity. The growth of the employment rate has also
played a significant role. In this respect Ireland, Spain and the Netherlands stand as
the best examples. In the countries with the fastest growth of employment, how-
ever, the number of working hours per employee has fallen. This has occurred in
Finland, too, especially towards the latter half of the 1990s. In contrast, in countries
like the United States and Denmark, where the number of working hours has risen,
growth of employment and also of the standard of living has been slower.
22
14 The countries are organised by the growth rate of the standard of living.
Source: database of the University of Groningen.
Figure 6. Annual growth of the standard of living; broken down to the main
components, 1993–2001
23
01
23
4
Ja
pa
n
Sw
itze
rla
nd
Ge
rma
ny
Ita
ly
Fra
nce
Au
str
ia
Be
lgiu
m
Ne
the
rla
nd
s
US
A
De
nm
ark
UK
Po
rtu
ga
l
No
rwa
y
Sw
ed
en
Gre
ece
Sp
ain
Fin
lan
d
Ire
lan
d
-11
23
4
Ja
pa
n
Sw
itze
rla
nd
Ge
rma
ny
Ita
ly
Fra
nce
Au
str
ia
Be
lgiu
m
Ne
the
rla
nd
s
US
A
De
nm
ark
UK
Po
rtu
ga
l
No
rwa
y
Sw
ed
en
Gre
ece
Sp
ain
Fin
lan
d
Ire
lan
d
-1,0
-0,5
0,0
0,5
Ja
pa
n
Sw
itze
rla
nd
Ge
rma
ny
Ita
ly
Fra
nce
Au
str
ia
Be
lgiu
m
Ne
the
rla
nd
s
US
A
De
nm
ark
UK
Po
rtu
ga
l
No
rwa
y
Sw
ed
en
Gre
ece
Sp
ain
Fin
lan
d
Ire
lan
d
01
23
4
Ja
pa
n
Sw
itze
rla
nd
Ge
rma
ny
Ita
ly
Fra
nce
Au
str
ia
Be
lgiu
m
Ne
the
rla
nd
s
US
A
De
nm
ark
UK
Po
rtu
ga
l
No
rwa
y
Sw
ed
en
Gre
ece
Sp
ain
Fin
lan
d
Ire
lan
d
-11
23
4
Ja
pa
n
Sw
itze
rla
nd
Ge
rma
ny
Ita
ly
Fra
nce
Au
str
ia
Be
lgiu
m
Ne
the
rla
nd
s
US
A
De
nm
ark
UK
Po
rtu
ga
l
No
rwa
y
Sw
ed
en
Gre
ece
Sp
ain
Fin
lan
d
Ire
lan
d
-1,0
-0,5
0,0
0,5
Ja
pa
n
Sw
itze
rla
nd
Ge
rma
ny
Ita
ly
Fra
nce
Au
str
ia
Be
lgiu
m
Ne
the
rla
nd
s
US
A
De
nm
ark
UK
Po
rtu
ga
l
No
rwa
y
Sw
ed
en
Gre
ece
Sp
ain
Fin
lan
d
Ire
lan
d
GD
P/w
ork
ing
ho
urs
Wo
rkin
gh
ou
rs/e
mp
loy
men
tE
mp
loy
men
t/p
op
ula
tio
n

2.3 The structure of productivity growth has
changed
The basis of labour productivity growth has shifted over to total factor productiv-
ity. This has been connected with a decreased impact of capital deepening arising
from the decline in the investment rate. This change reflects a decline in the invest-
ment rate and improved efficiency in use of production resources.
Labour productivity depends on two factors, total factor productivity (TFP15) and
capital deepening16. Total factor productivity refers to all residual effects of pro-
ductivity growth outside the increase in labour and capital. Among these are tech-
nological development, organisational innovations, dissemination of technological
information, and improved skills of the workforce. Total factor productivity is con-
sidered to be the most important indicator of growth, because it depicts the overall
efficiency of the use of production resources of economy.
Capital deepening of production refers to a growing substitution of capital for la-
bour. In the Western industrialised countries, and Finland in particular, capital
deepening has been boosted by favourable macroeconomic factors and labour
costs, which are considered high.
In Finland the main long-term source of growth of labour productivity has been to-
tal factor productivity with the average growth effect of around 1.8 percentage
points per year. The effect of capital deepening has varied between 1.2% and 1.8%,
respectively. In the early 1990s – before the fastest stage of the restructuring – Fin-
land showed one of the highest growth rates in total factor productivity (cf. Figure
7).
24
Labour
CapitalTFP
Labour
GDP�����
15 TFP = Total Factor Productivity.
16 The analysis of the components of labour productivity based on the hypotheses of the standard pro-
duction theory on the production possibilities and substitutability of inputs. The basic assumption is
constant returns to scale, i.e. an increase of inputs by one unit, increases the ouput by one unit. Then
growth of labour production can be expressed as a sum of total factor productivity and capital dee-
pening as follows:.
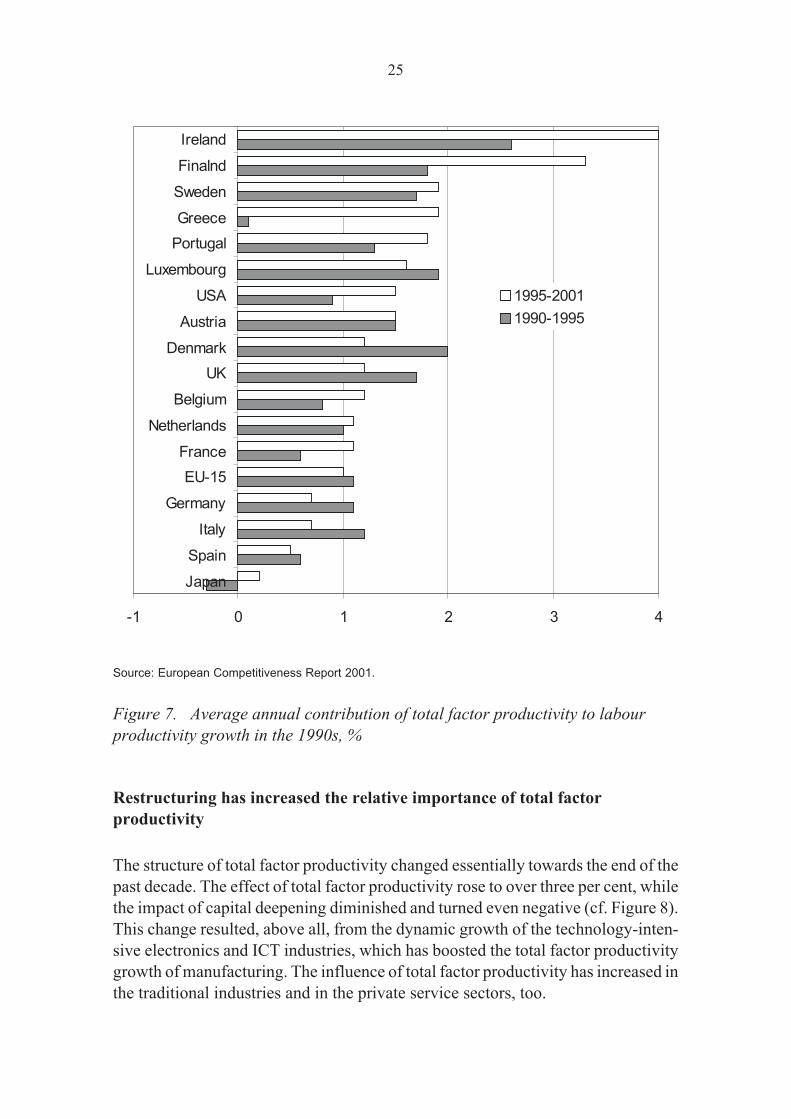
Source: European Competitiveness Report 2001.
Figure 7. Average annual contribution of total factor productivity to labour
productivity growth in the 1990s, %
Restructuring has increased the relative importance of total factor
productivity
The structure of total factor productivity changed essentially towards the end of the
past decade. The effect of total factor productivity rose to over three per cent, while
the impact of capital deepening diminished and turned even negative (cf. Figure 8).
This change resulted, above all, from the dynamic growth of the technology-inten-
sive electronics and ICT industries, which has boosted the total factor productivity
growth of manufacturing. The influence of total factor productivity has increased in
the traditional industries and in the private service sectors, too.
25
-1 0 1 2 3 4
Japan
Spain
Italy
Germany
EU-15
France
Netherlands
Belgium
UK
Denmark
Austria
USA
Luxembourg
Portugal
Greece
Sweden
Finalnd
Ireland
1995-2001
1990-1995

Along with the change in the industrial structure, the decrease in the investment rate
in the traditional manufacturing in particular has brought down the relative impor-
tance of physical capital17. Although developments in the majority of industrialised
countries have gone in the same direction, in Finland the change has been excep-
tionally drastic.
Source: European Competitiveness Report 2001.
Figure 8. Average annual contribution of capital deepening to labour produc-
tivity growth in the 1990s, %
26
-0,5 0 0,5 1 1,5
Finland
Ireland
Netherlands
Sweden
Italy
Spain
France
Belgium
UK
Luxembourg
Denmark
EU-15
Germany
Austria
USA
Greece
Japan
Portugal
1995-2001
1990-1995
17 Physical capital is increasingly being replaced by immaterial capital.

3 Industrial structure
Regeneration is the driving force of competitiveness
Renewal of production activities enhances productivity in three different ways.
Development of business activities and innovativeness within companies are re-
flected in industry-specific efficiency and thereby in productivity of economy. A
change in the industrial structure strengthens this effect, if the proportion of indus-
tries with rapid productivity growth increases. The third effect is brought about
through the transaction relations between industries18. The innovativeness of the
subcontracted industries, such as services, may raise the productivity of economy,
even if their productivity remained unchanged.
3.1 The market sector is expanding
The industrial structure in Finland resembles in broad outline the average of the
OECD countries and the EU Member States. The share of the service sector is
around two thirds, that of industry and construction less than one third, and the
share of primary production close to 5%. Compared with the United States and the
leading European countries, the share of the service sector of total production is,
however, about 10% lower in Finland, and the share has even decreased in recent
years.
As in the other Nordic countries, the public sector in Finland is mainly responsible
for the provision of welfare services. Consequently, the share of the public sector of
service production is internationally high. A look at the share of the so-called busi-
ness services19 in the whole service sector reveals that Finland and the other Nordic
countries are, nevertheless, going their separate ways. With the growing share of
business services, Finland is converging the USA and the leading European coun-
tries (cf. Figure 9).
27
18 Viitamo (2003).
19 This ratio also broadly illustrates the size of the public sector, as the services outside the business ser-
vice sector mainly consist of welfare services.
Source: OECD, STAN database.
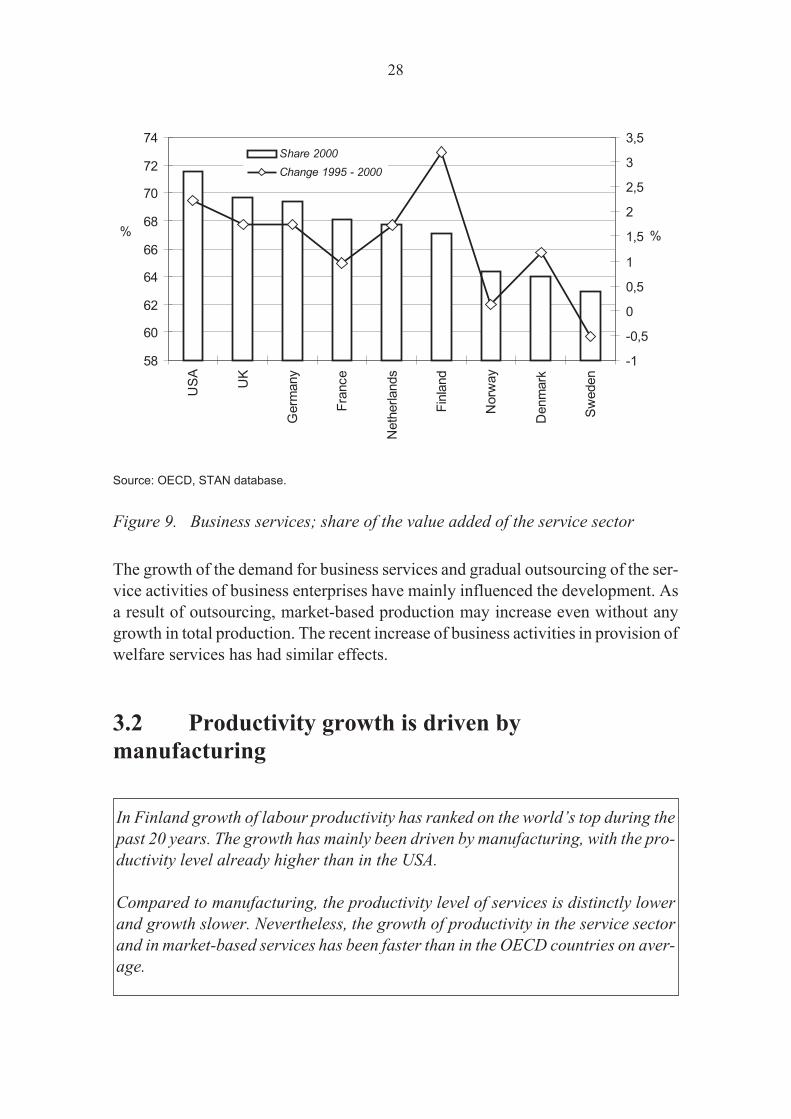
Figure 9. Business services; share of the value added of the service sector
The growth of the demand for business services and gradual outsourcing of the ser-
vice activities of business enterprises have mainly influenced the development. As
a result of outsourcing, market-based production may increase even without any
growth in total production. The recent increase of business activities in provision of
welfare services has had similar effects.
3.2 Productivity growth is driven by
manufacturing
In Finland growth of labour productivity has ranked on the world’s top during the
past 20 years. The growth has mainly been driven by manufacturing, with the pro-
ductivity level already higher than in the USA.
Compared to manufacturing, the productivity level of services is distinctly lower
and growth slower. Nevertheless, the growth of productivity in the service sector
and in market-based services has been faster than in the OECD countries on aver-
age.
28
58
60
62
64
66
68
70
72
74
US
A
UK
Germ
any
Fra
nce
Neth
erlands
Fin
land
Norw
ay
Denm
ark
Sw
eden
-1
-0,5
0
0,5
1
1,5
2
2,5
3
3,5Share 2000
Change 1995 - 2000
% %
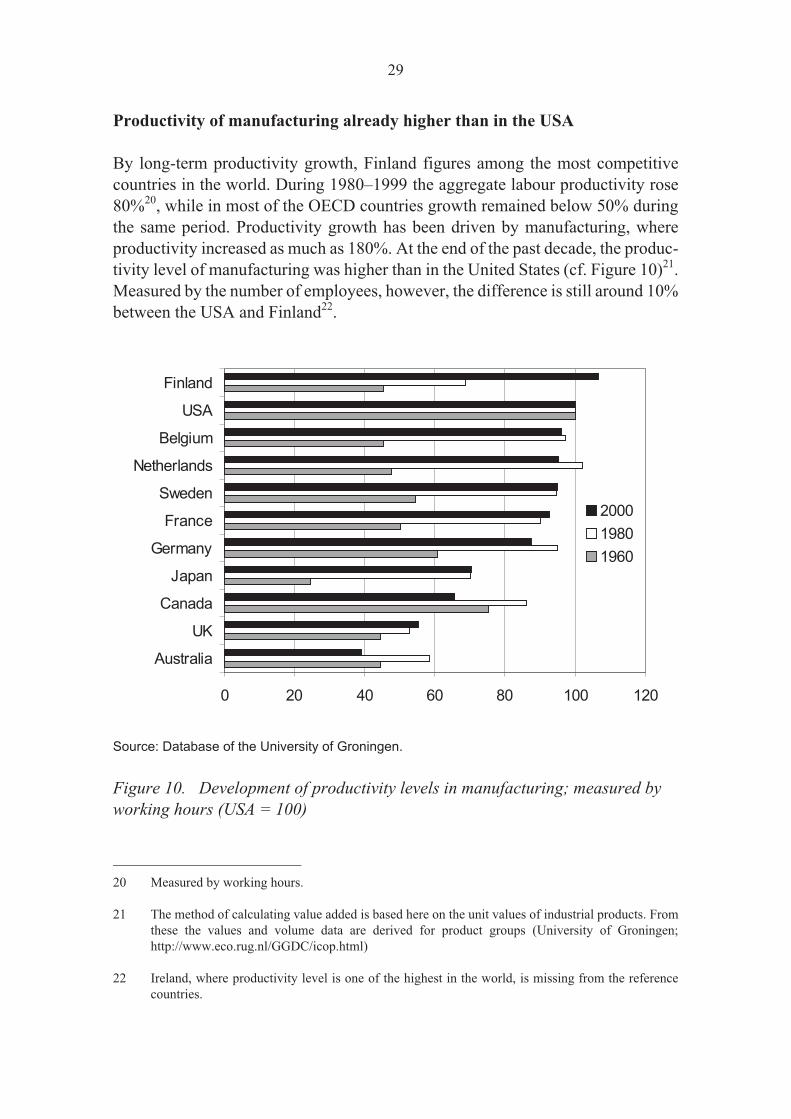
Productivity of manufacturing already higher than in the USA
By long-term productivity growth, Finland figures among the most competitive
countries in the world. During 1980–1999 the aggregate labour productivity rose
80%20, while in most of the OECD countries growth remained below 50% during
the same period. Productivity growth has been driven by manufacturing, where
productivity increased as much as 180%. At the end of the past decade, the produc-
tivity level of manufacturing was higher than in the United States (cf. Figure 10)21.
Measured by the number of employees, however, the difference is still around 10%
between the USA and Finland22.
Source: Database of the University of Groningen.
Figure 10. Development of productivity levels in manufacturing; measured by
working hours (USA = 100)
29
0 20 40 60 80 100 120
Australia
UK
Canada
Japan
Germany
France
Sweden
Netherlands
Belgium
USA
Finland
2000
1980
1960
20 Measured by working hours.
21 The method of calculating value added is based here on the unit values of industrial products. From
these the values and volume data are derived for product groups (University of Groningen;
http://www.eco.rug.nl/GGDC/icop.html)
22 Ireland, where productivity level is one of the highest in the world, is missing from the reference
countries.
While productivity of services and construction has increased slower than in manu-
facturing, the long-term growth of private services in particular ranks on the
world’s top. Of the most developed countries, Japan has experienced the fastest
productivity growth, around 70% during 1980–1999, but Finland is placed second
with the growth rate of 60%23.
This is also reflected in the narrowing down of Finland’s productivity gap with re-
spect to the USA. In 1980 the productivity level of private services was 40% lower
than the U.S. level, but in 1999 the difference was no more than about 20%. Al-
though Finland has during the same period outstripped e.g. Sweden and Denmark,
productivity level of services as a whole represents the average level of the indus-
trialised countries.
Ireland dominates in manufacturing, the USA in services; Finland is well
placed in both
The effect of manufacturing on the aggregate productivity growth is significant in
most countries, especially in countries with highest productivity growth rates (cf.
Figure 11). Of the EU Member States, Finland ranks second after Ireland, where
productivity growth in the service sector has been modest. Productivity growth
rates in services that are lower than the average are typical of many Central Euro-
pean countries as well, whereas in the Anglo-Saxon countries productivity growth
has been rapid.
In most developed countries productivity of business services has increased faster
than productivity in the service sector as a whole. This implies that productivity of
welfare services has increased slowly, if at all. While productivity of the service
sector in Finland has increased faster than in the OECD countries on average, the
difference with respect to the leading USA still remains considerable.
30
23 Mankinen, Rouvinen, Ylä-Anttila (2002)
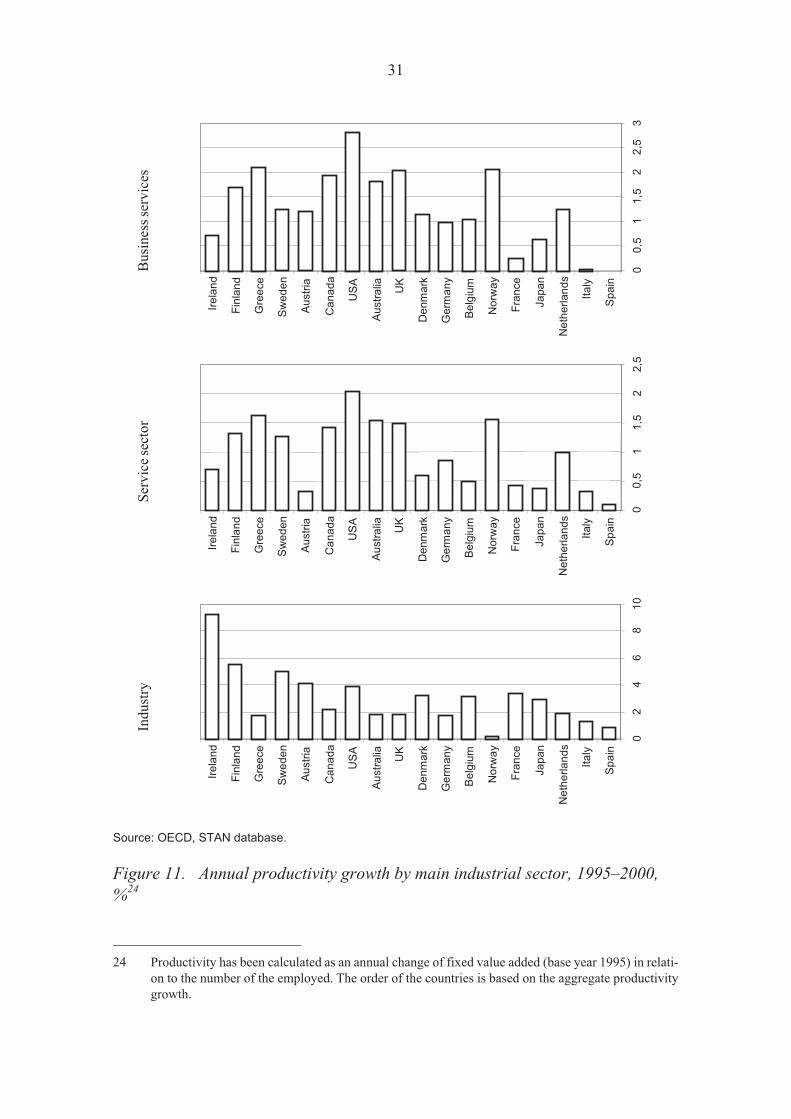
Source: OECD, STAN database.
Figure 11. Annual productivity growth by main industrial sector, 1995–2000,
%24
31
Ind
ust
ryS
erv
ice
sect
or
Bu
sin
ess
serv
ices
00
,51
1,5
22
,5
Sp
ain
Ita
ly
Ne
the
rla
nd
s
Ja
pa
n
Fra
nce
No
rwa
y
Be
lgiu
m
Ge
rma
ny
De
nm
ark
UK
Au
str
alia
US
A
Ca
na
da
Au
str
ia
Sw
ed
en
Gre
ece
Fin
lan
d
Ire
lan
d
02
46
81
0
Sp
ain
Ita
ly
Ne
the
rla
nd
s
Ja
pa
n
Fra
nce
No
rwa
y
Be
lgiu
m
Ge
rma
ny
De
nm
ark
UK
Au
str
alia
US
A
Ca
na
da
Au
str
ia
Sw
ed
en
Gre
ece
Fin
lan
d
Ire
lan
d
00
,51
1,5
22
,53
Sp
ain
Ita
ly
Ne
the
rla
nd
s
Ja
pa
n
Fra
nce
No
rwa
y
Be
lgiu
m
Ge
rma
ny
De
nm
ark
UK
Au
str
alia
US
A
Ca
na
da
Au
str
ia
Sw
ed
en
Gre
ece
Fin
lan
d
Ire
lan
d
00
,51
1,5
22
,5
Sp
ain
Ita
ly
Ne
the
rla
nd
s
Ja
pa
n
Fra
nce
No
rwa
y
Be
lgiu
m
Ge
rma
ny
De
nm
ark
UK
Au
str
alia
US
A
Ca
na
da
Au
str
ia
Sw
ed
en
Gre
ece
Fin
lan
d
Ire
lan
d
02
46
81
0
Sp
ain
Ita
ly
Ne
the
rla
nd
s
Ja
pa
n
Fra
nce
No
rwa
y
Be
lgiu
m
Ge
rma
ny
De
nm
ark
UK
Au
str
alia
US
A
Ca
na
da
Au
str
ia
Sw
ed
en
Gre
ece
Fin
lan
d
Ire
lan
d
00
,51
1,5
22
,53
Sp
ain
Ita
ly
Ne
the
rla
nd
s
Ja
pa
n
Fra
nce
No
rwa
y
Be
lgiu
m
Ge
rma
ny
De
nm
ark
UK
Au
str
alia
US
A
Ca
na
da
Au
str
ia
Sw
ed
en
Gre
ece
Fin
lan
d
Ire
lan
d
24 Productivity has been calculated as an annual change of fixed value added (base year 1995) in relati-
on to the number of the employed. The order of the countries is based on the aggregate productivity
growth.
3.3 Information and communications technology
shows the way
Productivity growth has been fastest in the industries producing ICT, in which the
growth is among the highest in the world. Of the industries utilising ICT exten-
sively, productivity growth has been strong in financing and in manufacturing of
electrical machinery. In general, there remains much to improve in utilisation of
ICT across industries.
Except for manufacture of communications equipment, high productivity growth
is concentrated on relatively narrow groups of industries. In contrast, productivity
growth in the industries with the highest GDP share has been slack. Among these
are construction, public services and some of the central private services. This im-
balance partly explains the Finnish paradox of why the aggregate productivity
and standard of living are only of the international average.
As conveyed by the recent studies, information and communications technology
(ICT) has become one of the major factors explaining the productivity differences
across industries. In its international benchmarking studies on productivity, the
University of Groningen applies an ICT-based industry taxonomy. It divides indus-
tries into those producing and utilising ICT extensively and into industries that uti-
lise ICT only little or not at all (other sectors)25. The classification is based on an
empirical finding that productivity growth in the ICT industries is faster on average
than in other sectors.
32
25 The classification is based on the ICT investments statistics by industry in the USA, which reflects
the utilisation potential of ICT in other developed countries (Bart van Ark & al. 2002). Note that there
may be sector-specific differences across countries. For instance, in Finland transportation and logis-
tic services utilise extensively ICT-based applications (Viitamo, 2003).
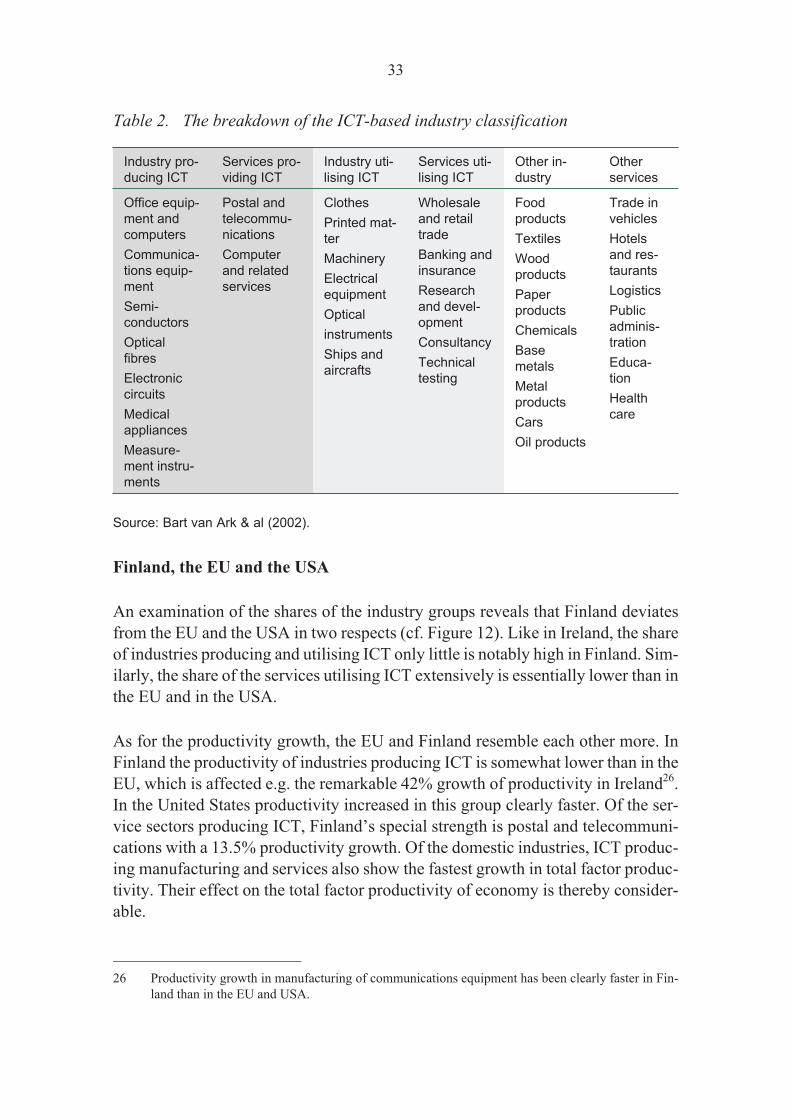
Table 2. The breakdown of the ICT-based industry classification
Industry pro-
ducing ICT
Services pro-
viding ICT
Industry uti-
lising ICT
Services uti-
lising ICT
Other in-
dustry
Other
services
Office equip-
ment and
computers
Communica-
tions equip-
ment
Semi-
conductors
Optical
fibres
Electronic
circuits
Medical
appliances
Measure-
ment instru-
ments
Postal and
telecommu-
nications
Computer
and related
services
Clothes
Printed mat-
ter
Machinery
Electrical
equipment
Optical
instruments
Ships and
aircrafts
Wholesale
and retail
trade
Banking and
insurance
Research
and devel-
opment
Consultancy
Technical
testing
Food
products
Textiles
Wood
products
Paper
products
Chemicals
Base
metals
Metal
products
Cars
Oil products
Trade in
vehicles
Hotels
and res-
taurants
Logistics
Public
adminis-
tration
Educa-
tion
Health
care
Source: Bart van Ark & al (2002).
Finland, the EU and the USA
An examination of the shares of the industry groups reveals that Finland deviates
from the EU and the USA in two respects (cf. Figure 12). Like in Ireland, the share
of industries producing and utilising ICT only little is notably high in Finland. Sim-
ilarly, the share of the services utilising ICT extensively is essentially lower than in
the EU and in the USA.
As for the productivity growth, the EU and Finland resemble each other more. In
Finland the productivity of industries producing ICT is somewhat lower than in the
EU, which is affected e.g. the remarkable 42% growth of productivity in Ireland26.
In the United States productivity increased in this group clearly faster. Of the ser-
vice sectors producing ICT, Finland’s special strength is postal and telecommuni-
cations with a 13.5% productivity growth. Of the domestic industries, ICT produc-
ing manufacturing and services also show the fastest growth in total factor produc-
tivity. Their effect on the total factor productivity of economy is thereby consider-
able.
33
26 Productivity growth in manufacturing of communications equipment has been clearly faster in Fin-
land than in the EU and USA.

Source: Bart van Ark & al (2002).
Figure 12. ICT industries; size and annual productivity growth, 1995–2000
34
010
20
30
40
50
ICT
pro
du
cin
g
ma
nu
factu
rin
g
ICT
pro
du
cin
g
se
rvic
es
ICT
usin
g
ma
nu
factu
rin
g
ICT
usin
g
se
rvic
es
Oth
er
ma
nu
factu
rin
g
Oth
er
se
rvic
es
Fin
lan
d
US
A
EU
05
10
15
20
25
ICT
pro
du
cin
g
ma
nu
factu
rin
g
ICT
pro
du
cin
g
se
rvic
es
ICT
usin
g
ma
nu
factu
rin
g
ICT
usin
g
se
rvic
es
Oth
er
ma
nu
factu
rin
g
Oth
er
se
rvic
es
Fin
lan
d
US
A
EU
Sh
are
of
the
GD
Pin
20
00
%P
rod
uct
ivit
yg
row
th%

Although in Finland, too, the productivity of sectors utilising ICT extensively is
higher than in the other sectors, the case of manufacturing is the opposite. For in-
stance, the forest industries, belonging to the non-ICT group, a faster productivity
growth than in the EU and USA. In terms of services utilising ICT, the ranking of
Finland is good, with only the USA, Norway and Sweden ahead of us. Here the
spearhead industries are financial intermediation and other activities auxiliary to fi-
nancing.
The spear is sharp but thin-pointed
A more detailed examination confirms that the ICT industries are on top of produc-
tivity development in Finland. Table 3 presents a compilation of the industries with
productivity growth during 1995–2000 at least as rapid as in economy as a whole
(2.4%). In 1998 the share of this group of total production was 41%, productivity
growth 5.1% and production growth 7.1%.
Table 3. Sectors with fastest production growth, 1993–2001
Industry Percentage
(GDP)
1998
Annual growth of
productivity %
(working hours)
Annual growth
of production %
(value added)
ICT producer Radio- and communications equip-
ment
3.5 15.3 35.1
ICT user Activities auxiliary to financing 0.2 10.5 22.0
ICT producer Postal and telecommunications 2.7 9.6 10.9
ICT user Financial intermediation 2.7 6.1 1.8
Electricity, gas and water supply 2.3 5.2 1.7
ICT user/
producer
Electrical machinery and equip-
ment
0.9 4.7 7.7
Agriculture and forestry 3.7 4.7 1.7
Chemicals 1.5 4.2 4.8
Base metals 1.1 4.1 5.0
Other vehicles 0.3 3.7 8.9
ICT user Publishing and printing business 1.5 3.4 3.2
Wood products 1.2 3.3 5.9
Food products 1.9 3.1 1.5
Pulp and paper 4.1 3.1 3.9
ICT user Other machinery and equipment 2.9 3.0 6.4
ICT user Wholesale and retail trade 10.5 3.0 4.8
Mining 0.2 2.8 2.8
Total 41.4 5.1 7.1
Source: OECD, STAN database.
35

The share of the ICT industries of the productivity growth of the industries listed
under Table 3 is around 70 % and over 80 % of production growth. The impact of
the ICT sectors on the growth of the entire economy is also high on average, with
the most significant exception financial intermediation, in which productivity
growth is based on capital deepening.
Large sectors and services utilising ICT only little are the weak points
In a similar way, the most problematic areas of productivity growth can be illus-
trated by examining the development of the largest industries (cf. Table 427). In
1998 the GDP share of this sector of was 48%, total productivity growth 0.5% and
production growth 2.5% during 1993–2001.
The largest industries consist of public services, real-estate services, transportation
and construction. The proportion of public services of GDP is nearly 18% and their
productivity and growth is among the lowest of this group. Other industries with
low performance are construction, business services and other societal and personal
services. Thus Finland’s average ranking in productivity and standard of living
can be explained by the high GDP share of sectors with low productivity growth.
Table 4. Development of the productivity and production of the largest indust-
ries, 1993–2001
Sector Percentage
(GDP)
1998
Annual
productivity
growth %
(working hours)
Annual
production
growth %
(value added)
Real-estate services 11.0 2.1 3.0
Health care and social services 7.8 -0.5 1.1
Transportation and storage 7.3 1.7 3.6
Construction 5.0 -2.2 1.5
Public administration and defence 5.0 0.7 1.0
Education and training 4.9 -0.6 1.7
ICT user Business services 3.7 0.1 6.4
Other societal and personal services 3.5 0.3 2.9
Total 48.2 0.5 2.5
Source: OECD, STAN database.
36
27 Of the largest sectors, retail and wholesale trade (2.), pulp and paper industry (8.) and agriculture and
forestry (10.) have been excluded here.

3.4 Technology- and knowledge-intensity is
increasing
In Finland the change in the industrial structure has been biggest in manufactur-
ing, where the share of technology-intensive sectors of total production is one of
the highest in the world. This restructuring has, above all, resulted from the dy-
namic growth of the ICT manufacturing. Restructuring has, at the same time,
strongly contributed to the aggregate productivity growth.
The restructuring of manufacturing is also reflected in the rapid increase in the
technology-intensity of goods exports. The technology-intensity of exports has
reached the average level of the OECD countries.
In Finland the GDP share of knowledge-intensive services is lower than in indus-
trialised countries on average. The growth of their GDP has, however, been
among the fastest in the OECD countries.
The growth of the technology-intensiveness of manufacturing has been
among the fastest in the world
Measured by the production structure of the manufacturing sector, Finland is one of
world’s most technology-intensive countries. After the leading countries, Ireland
and Korea, the differences between Hungary, Germany and Finland are small. This
can be seen when examining the proportion of high and medium-high technology
industries of total production (cf. Figure 13). In Finland the impact of high technol-
ogy, mainly communications technology, is remarkable, and its relative share is the
highest of the OECD countries. In Finland the share of medium-high technology
sectors is lower than on average. This is influenced e.g. by the high GDP share of
the forest industry, which belongs to low technology industries.
37

Source: OECD, STAN database.
Figure 13. Technology-intensive manufacturing; the share of the GDP, %
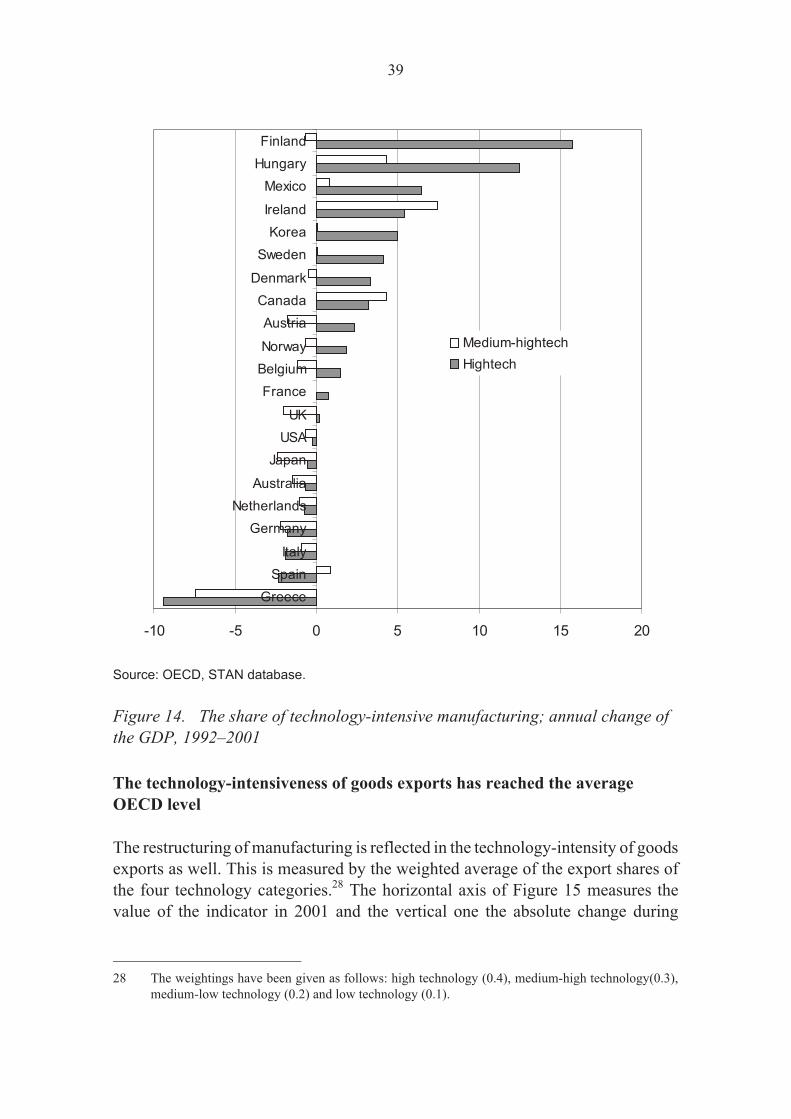
Restructuring has boosted productivity growth
In regard to the restructuring of manufacturing and growth of technology-intensity
(cf. Figure 14), the OECD countries can be divided into three groups; countries
where the overall change has been negative, countries where the increase in the
shares of technology groups have balanced, and countries where the change has
been driven by high-tech manufacturing. Finland, which belongs to the latter
group, ranks first in terms of the growth of the share of high-tech manufacturing
and thereby specialisation.
When Figure 14 is compared with Figure 11 illustrating productivity growth, the
dependence between restructuring and productivity growth becomes obvious.
Countries where the share of high-tech industries has increased the most are also
positioned high with regard to productivity growth in manufacturing. The most ob-
vious exception is the USA, where technology-intensiveness has, in fact, de-
creased. Nonetheless, productivity has increased in the USA, too, and faster than on
average. For the USA productivity growth is more induced by internal renewal of
industries and wide-scoped utilisation of ICT.
38
0
5
10
15
20
25
Irela
nd
Kore
a
Hungary
Germ
any
Fin
land
Japan
Sw
eden
Belg
ium
Canada
Mexic
o
US
A
Fra
nce
Italy
Austr
ia
UK
Denm
ark
Spain
Neth
erl
ands
Austr
alia
Norw
ay
Gre
ece
Medium-hightech
Hightech
Source: OECD, STAN database.
Figure 14. The share of technology-intensive manufacturing; annual change of
the GDP, 1992–2001
The technology-intensiveness of goods exports has reached the average
OECD level
The restructuring of manufacturing is reflected in the technology-intensity of goods
exports as well. This is measured by the weighted average of the export shares of
the four technology categories.28 The horizontal axis of Figure 15 measures the
value of the indicator in 2001 and the vertical one the absolute change during
39
-10 -5 0 5 10 15 20
Greece
Spain
Italy
Germany
Netherlands
Australia
Japan
USA
UK
France
Belgium
Norway
Austria
Canada
Denmark
Sweden
Korea
Ireland
Mexico
Hungary
Finland
Medium-hightech
Hightech
28 The weightings have been given as follows: high technology (0.4), medium-high technology(0.3),
medium-low technology (0.2) and low technology (0.1).

1992–2001. The average of the OECD countries, which divides the countries into
four categories of competitiveness, is also highlighted.
The growth of technology intensity of Finnish exports has been among the fastest in
the world, but the present structure has just reached the OECD average only. The
main factor explaining the relatively low level is the high export share of the forest
products29. In Finland the growth of technology intensity attributes mostly to the
exports of telecommunications equipment, whereas e.g. in Ireland and Hungary the
medium-high technology industries have also contributed to the change. In the
leading industrialised countries the share of medium-high technology industries is
higher than in Finland, too, but in most countries the restructuring has been slower
than the OECD average.
Source: OECD, Bilateral trade statistics.
Figure 15. Technology intensity of the exports of the manufacturing sector in
the OECD countries
40
0
1
2
3
4
5
6
7
8
14 19 24 29 34
IreHun
FinGre
Por
NedCzeUK
Ice Tur
Den OECD
Bel-Lux
Kor
Fra
Swe
Swi
NzlAul
Nor
GerPol
USA
JpnSpa
Aus
ItaCan
Slo Mex
Fast growth/Low level Fast growth/High level
Slow growth/Low level Slow growth/High level
Share 2001 %
Growth %
29 Although in the OECD classification the forest industry belongs to the low-technology industries, se-
veral studies show that the forest industry in Finland is one of the most technology-intensive in the
world (Viitamo, 2003). The OECD classification is based on the input-output statistics of a few key
countries, in which Finland is not included.
The growth of the knowledge-intensiveness in the service sector ranks on the
world’s top
The so-called knowledge-intensive business services30, which belong to business
services, play a central role with respect to growth of competitiveness. According
to an ICT-based industry classification, the knowledge-intensive service sector in-
cludes services producing ICT, i.e. postal and telecommunications, computer ser-
vices and services utilising ICT (excluding the sectors of trade).
High knowledge-intensity of services or extensive use of ICT are not necessarily
associated with high growth of productivity. For instance, in many business service
sectors value added has increased on a par with the labour input (cf. Table 3). More
often, the competitiveness effects of knowledge-intensive services manifest them-
selves in indirect productivity impacts in client industries.
In most of the OECD countries, the proportion of knowledge-intensive services of
total production and the service sector is increasing (cf. Figure 16). A positive dif-
ference between these indicators implies that the proportion of the service sector of
total production is increasing. As indicated by Figure 16, the trend in Finland, Can-
ada, Norway and Ireland have been the opposite in recent years. That is, the GDP
share of the service sector is diminishing31.
In Finland the growth of the share of the knowledge-intensive services has been
rapid by the international standard, and fastest, if the change in this share is viewed
within the service sector. The fastest-growing industries in Finland are computer
services and postal and telecommunications. Among the factors that have contrib-
uted to this are the dynamic growth of the ICT manufacturing, outsourcing of ser-
vice activities and liberalisation of the telecommunications market at the beginning
of the 1990s.
41
30 KIBS = Knowledge Intensive Business Services.
31 Unlike the GDP share, the proportion of the service sector of total employment has been on a con-
tinuous increase in Finland, which partly reflects the relative decline in productivity in the service
sector with respect to other sectors. However, this is not characteristic of Finland only. In many
OECD countries employment has increased faster than the GDP share.
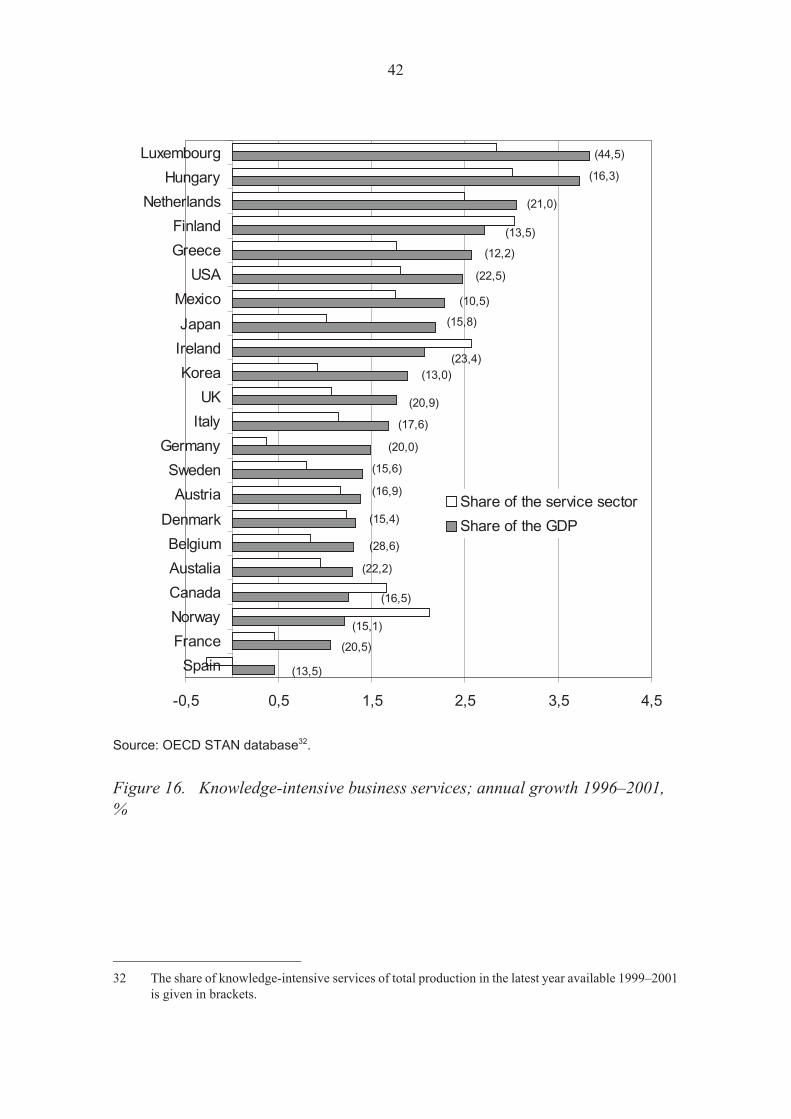
Source: OECD STAN database32.
Figure 16. Knowledge-intensive business services; annual growth 1996–2001,
%
42
-0,5 0,5 1,5 2,5 3,5 4,5
Spain
France
Norway
Canada
Austalia
Belgium
Denmark
Austria
Sweden
Germany
Italy
UK
Korea
Ireland
Japan
Mexico
USA
Greece
Finland
Netherlands
Hungary
Luxembourg
Share of the service sector
Share of the GDP
(44,5)
(16,3)
(21,0)
(10,5)
(22,5)
(15,1)
(13,5)
(13,5)
(15,4)
(20,5)
(16,5)
(16,9)
(20,0)
(15,6)
(17,6)
(20,9)
(12,2)
(15,8)
(23,4)
(13,0)
(28,6)
(22,2)
32 The share of knowledge-intensive services of total production in the latest year available 1999–2001
is given in brackets.

3.5 Industry restructuring reflects the dynamics of
company demography
In contrast to the EU, production and employment in manufacturing have centred
on large companies in Finland. The majority of new firms are enterprises with one
employee only. Therefore the employment effect of new firms is among the lowest
of the developed countries.
In Finland the enterprise volatility rate has been of the international average, but
the growth of the number of enterprises is slow. In manufacturing the enterprise
volatility rate is lower than in the service sectors, where the costs of entries and ex-
its are lower. The volatility rate is also influenced by the rapidity of technological
change and the knowledge-intensity of industries. The enterprise volatility has in-
creased productivity of industries.
Enterprise volatility is restructuring on the micro level
Change in the industrial structure is ultimately determined by the differences in the
growth rates of companies and the enterprise volatility. Enterprise volatility refers
to market entries of new enterprises and exits of operating firms from the market.
For the competitiveness of the countries, the enterprise volatility rate and removal
of the obstacles to it are important; as companies with low profitability are replaced
by profitable businesses, the resources of an economy are allocated to new growth
sectors. Besides this creative destruction, renewal of the company stock as such re-
flects the capacity to regenerate and innovativeness of economies, which are the
cornerstones of competitiveness.
Production and employment have centred on large companies
In Finland, as in most OECD countries, the majority of companies are micro enter-
prises – with less than 10 employees. At the end of the 1990s, their share of all Finn-
ish companies was around 85%, while their share of production in the manufactur-
ing sector being only 5% and 10% of employment33. In this respect, Finland, to-
gether with Germany, the USA and Sweden, can be counted among the countries
43
33 In the service sector, the production and employment shares are higher.

with large-company dominance34. The size structure of the company stock can be
largely explained by the country’s industrial structure and technological character-
istics of industries, such as economies of scale of production. Economies of scale
also partly explain why productivity is in general higher in large companies in par-
ticular35. In terms of differences in productivity, Finland is close to the EU average
(cf. Figure 17).
Source: Observatory of European SMEs 2002 / No 2.
Figure 17. Labour productivity by company size in 2000
The enterprise volatility rate has decreased
In regard to the average enterprise volatility rate, Finland is ranked high in an inter-
national comparison (cf. Figure 18). Due to the equality of entry and exit rates, the
growth of the company stock (difference between the entry rate and the exit rate)
has been slow, however. In Sweden, for example, the rapid growth of the company
stock has resulted from a low exit rate.
44
0
50
100
150
200
250
Luxem
bourg
Germ
any
Gre
ece
Belg
ium
Neth
erlands
Lie
chte
nste
in
Italy
Denm
ark
Port
ugal
Sw
eden
Austr
ia
EU
Fin
land
Norw
ay
Sw
itzerland
Spain
UK
Fra
nce
Irela
nd
Icela
nd
SMEs Big enterprises
Country average = 100
34 OECD (2002), Small and Medium Enterprise Outlook
35 These are companies with 250 employees or more.

Source: Observatory of European SMEs 2002 / No 2.
Figure 18. Enterprise volatility rate; the average during 1995–2000, %
In Finland the volatility rate has decreased since the mid-1990s, partly due to the
rapid growth of the company stock after the recession at the beginning of the de-
cade. Sectoral differences remain, however, considerable. In the service sectors and
construction the volatility rate is distinctly higher than in manufacturing, which is
characteristic of the other developed countries, too.
The scale factors and the entry and exit costs also explain why the enterprise volatil-
ity is typical of small enterprises. In Finland the share of entrepreneurs (one-man
enterprises) of start-ups is close to 88%, which is one of the highest figures in the
world. Consequently, the employment effect of new Finnish enterprises is also
among the lowest in the developed countries, less than one per cent of total employ-
ment.
Enterprise volatility has improved productivity of industries
Besides start-up costs and growth prospects, the dynamics of competition influ-
ences the sectoral volatility differences. In knowledge-intensive industries, charac-
terised by rapid technological change and product differentiation, enterprise vola-
tility is also high. Business services in particular represent such sectors (cf. Figure
45
0 5 10 15 20 25 30
Sweden
Iceland
Ausrtia
Switzerland
Italy
Netherlands
Belgium
Greece
UK
Portugal
Iceland
Finland
Spain
Germany
Birth rate Death rate
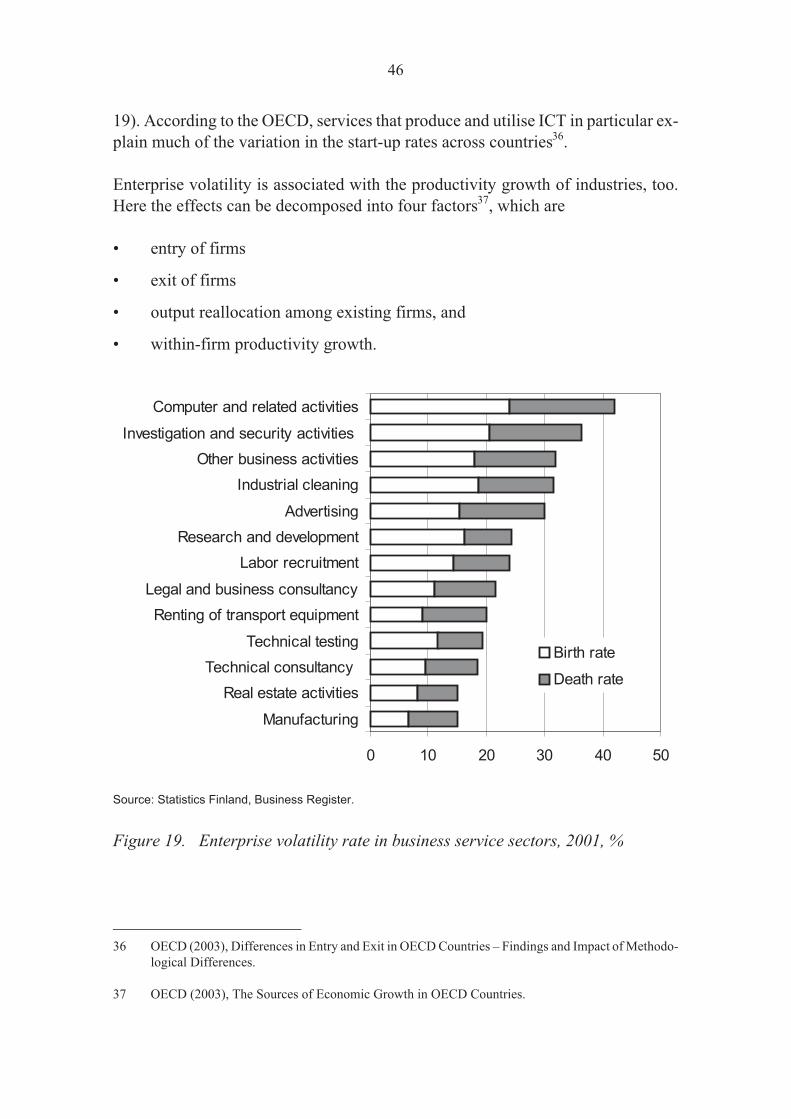
19). According to the OECD, services that produce and utilise ICT in particular ex-
plain much of the variation in the start-up rates across countries36.
Enterprise volatility is associated with the productivity growth of industries, too.
Here the effects can be decomposed into four factors37, which are
• entry of firms
• exit of firms
• output reallocation among existing firms, and
• within-firm productivity growth.
Source: Statistics Finland, Business Register.
Figure 19. Enterprise volatility rate in business service sectors, 2001, %
46
0 10 20 30 40 50
Manufacturing
Real estate activities
Technical consultancy
Technical testing
Renting of transport equipment
Legal and business consultancy
Labor recruitment
Research and development
Advertising
Industrial cleaning
Other business activities
Investigation and security activities
Computer and related activities
Birth rate
Death rate
36 OECD (2003), Differences in Entry and Exit in OECD Countries – Findings and Impact of Methodo-
logical Differences.
37 OECD (2003), The Sources of Economic Growth in OECD Countries.
According to a survey by the OECD, within-firm productivity growth and exit
components had the most substantial effect on the growth of labour productivity in
manufacturing in the 1990s. In Finland the depression at the beginning of the 1990s
is the primary reason for this. Market exits of inefficient firms made room for
growth of viable enterprises and restructuring of industries.
While the relative importance of business start-ups has been minor in Finland, it,
too, has contributed to productivity growth in manufacturing. The same applies to
business services, too. In the services producing ICT in particular (e.g. telecommu-
nications), company entries and exits have distinctly enhanced the growth of labour
productivity.
In summary, the knowledge intensity of industries and the dynamics of competition
explain the effectiveness of enterprise volatility on productivity in economy. In this
respect, total factor productivity is a more appropriate indicator. In Finland, for in-
stance, enterprise volatility has clearly increased total factor productivity in manu-
facturing38.
47
38 OECD (2003), The Sources of Economic Growth in OECD Countries.

4 Innovation environment
Innovations and functioning of the market are highlighted in the business
environment
Successful business activities form the basis for competitiveness. In addition to
companies’ own measures, the business environment influences their success in
many ways. Transport connections and other infrastructure, legislation and safety
are the basic elements of the business environment. The renewing industrial struc-
ture and strengthening of international competition emphasise the importance of in-
novations in developing business and competitive framework conditions. Full ex-
ploitation of the innovation capacity also calls for well functioning markets, which
provide the necessary spurs for commercialisation of innovations.
4.1 High educational level of population
The educational level of Finnish population ranks on the world’s top. However,
the shares of graduates with at least secondary level qualification should be raised
by encouraging transition from the primary level to the secondary level. Measured
by student performance, the quality of teaching is of high level and it is attained in
a cost-efficient manner. Participation in adult training is wide-scoped.
Investment in education and training has increased in real terms and the share of
training costs of public expenditure has been on a constant increase.
Competitiveness from education
Education is part of the well-being of citizens, and it has multiple societal objec-
tives. Education is also a basic element of productivity and competitiveness. Suc-
ceeding in international competition requires maintaining the level of educational
inputs and diversification of education even in countries with high-level education.
In working life the know-how requirements of personnel, especially in communica-
tive and social skills, are rising all the time. The rapid ageing of the population,
however, reduces labour and hampers updating of know-how.
48

High educational level and excellent student performance
The educational level of Finnish population is good. As for tertiary graduates, Fin-
land is one of the leading countries in the world. On the other hand, the share of citi-
zens with primary education only is relatively high. To improve this situation, mea-
sures have been launched to make the transition to the secondary level education
more efficient and to reduce the number of drop-outs.
Finnish 15-year old students rank on the world’s top in their reading and writing
proficiency and their mathematical and scientific literacy is also top-class39. More-
over, these rankings are achieved cost-efficiently. One explanation for the success
of the leading countries may be the comprehensive school, where a high level and
equality can be reached at the same time.
Source: http://www.pisa.oecd.org/Docs/Download/PISA2001(english).pdf, s. 264.
Figure 20. Student performance and expenditure per student (PISA 2000)
49
Sweden
Germany
Greece
Spain
Portugal
Hungary
Czech Republic
Ireland
Australia
USA
FranceBelgiumSwitzerland
Italy
Denmark
United
Kingdom
Poland
Austria
Norway
JapanFinlandKorea
460
470
480
490
500
510
520
530
540
550
10 000 20 000 30 000 40 000 50 000 60 000 70 000 80 000
Cumulative expenditure on educational institutions per student up to the age of 15
years, USD (PPP) 1998
Stu
dent
perf
orm
ance
on
the
com
bin
ed
readin
g,
scie
ntific
and
math
em
aticallite
racy
scale
s,
2000
39 OECD, PISA 2000, http://www.pisa.oecd.org

Investment in education on a good level
The share of public expenditure on education of GDP has decreased since the
mid-1990s. This has been a general tendency on the international arena, and the op-
posite trend can be seen in Denmark, Sweden, Portugal and the Netherlands only.
The main reason for the declining share has been the rapid growth of GDP. In Fin-
land financing of education is primarily public. The proportion of the private sector
remained under two per cent in 2000.
In Finland the share of education of public expenditure was 12.2 per cent in 2000,
which is 0.5 percentage units more than in 1995. Furthermore, public expenditure
on education was in real terms 11 per cent higher in 2000 than in 1995.
Source: OECD Education at a glance 2003.
Figure 21. Public expenditure on education as a percentage of total public ex-
penditure
50
0
2
4
6
8
10
12
14
16
18
20
Nor
way
Den
mar
kS
witz
erla
ndIr
elan
dS
wed
enP
ortu
gal
Fin
land UK
Fra
nce
Spa
inA
ustr
iaN
ethe
rlan
dsB
elgi
um
Japa
n
Ital
yG
erm
any
Gre
ece
Levels below tertiary education 2000
All levels of education combined 2000
All levels of education combined 1995

Wide participation in adult training
In international comparisons Finland is ranked high in terms of participation in
adult training. Of the active population, nearly 19 per cent participates in training
annually. The corresponding average of the EU Member States is a little more than
eight per cent (cf. Figure 22). However, participation in training is biased, so that
highly educated women and employees of large companies mainly apply for further
training.
Source: Eurostat, Structural Indicators
Figure 22. Percentage of the population aged 25–64 participating in education
and training, 2002
51
19
8
0 5 10 15 20
United Kingdom
Finland
Sweden
Denmark
Netherlands
Norway
EU15
Ireland
Luxembourg
Austria
Belgium
Germany
Spain
Italy
Portugal
France
Greece
4.2 Many top-skilled workers
Measured by tertiary education, Finland has top-level resources for innovation
activities. The top-skilled are heavily focused on technology and the health care
and welfare sectors, whereas the share of business and law and social sciences re-
mains low.
Expenditure during post-secondary studies and its annual share of the GDP are
high in Finland. The proportion of the private sector of the expenditure is low.
High relative expenditure produces many graduates and researchers.
High educational level is a prerequisite for innovations
Highly educated personnel are the most important resource of innovation activities.
Researchers are responsible for producing innovations and utilisation of novel
knowledge in research and development. In addition, higher education provides ca-
pacity for commercialisation of innovations and their utilisation in society on a
wider scale.
A high number of researchers
In Finland the share of R&D personnel and researchers of the employed is the high-
est of all the EU Member States and also higher than in the USA and in Japan. Fin-
land heads the statistics in regard to the growth of the number of researchers. Con-
versely, in Finland and in the EU the share of the private sector of researchers is
lower than in the USA and in Japan.
52
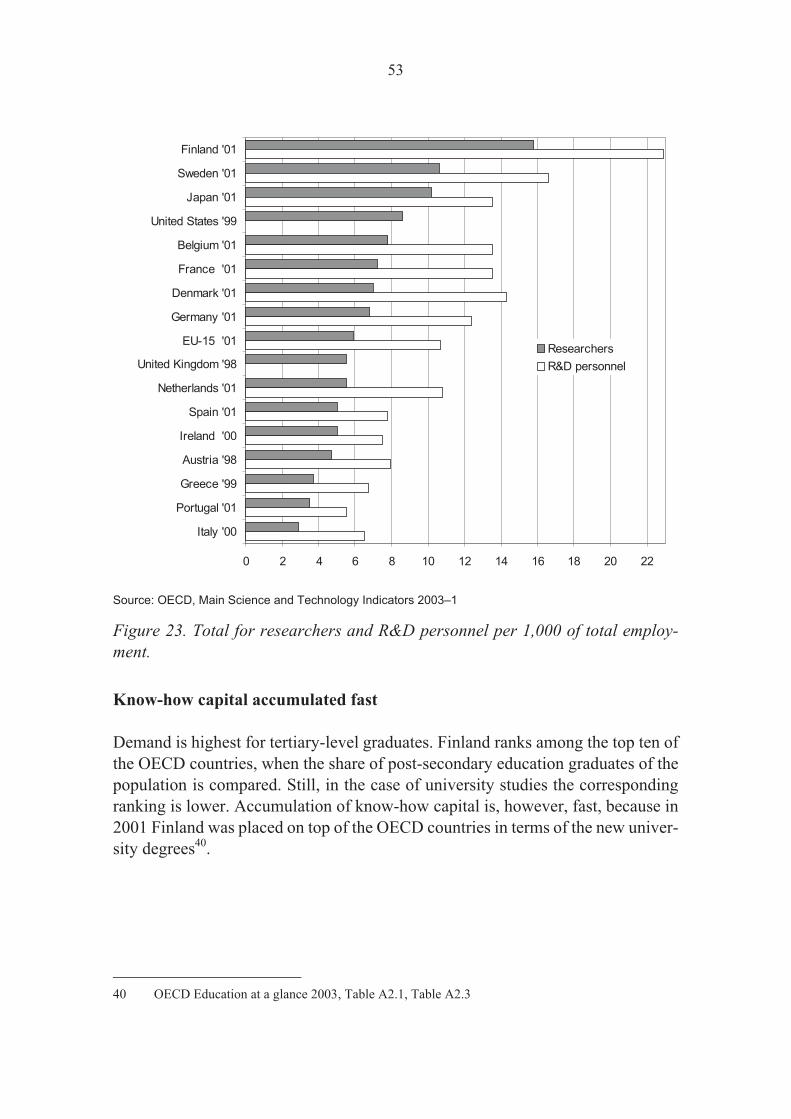
Source: OECD, Main Science and Technology Indicators 2003–1
Figure 23. Total for researchers and R&D personnel per 1,000 of total employ-
ment.
Know-how capital accumulated fast
Demand is highest for tertiary-level graduates. Finland ranks among the top ten of
the OECD countries, when the share of post-secondary education graduates of the
population is compared. Still, in the case of university studies the corresponding
ranking is lower. Accumulation of know-how capital is, however, fast, because in
2001 Finland was placed on top of the OECD countries in terms of the new univer-
sity degrees40.
53
0 2 4 6 8 10 12 14 16 18 20 22
Finland '01
Sweden '01
Japan '01
United States '99
Belgium '01
France '01
Denmark '01
Germany '01
EU-15 '01
United Kingdom '98
Netherlands '01
Spain '01
Ireland '00
Austria '98
Greece '99
Portugal '01
Italy '00
Researchers
R&D personnel
40 OECD Education at a glance 2003, Table A2.1, Table A2.3

The share of technology of degrees is considerable
In 2001 the share of degrees in technology and in the health care and welfare sectors
was clearly higher in Finland than in the EU Member States on average. Corre-
spondingly, the shares of the social sciences, mathematics and computing were the
lowest. In the United States the degree structure is focused on business and law and
social sciences41.
Finland is placed high in the comparison, when the degrees in social sciences (incl.
mathematics and computing) and in technology are proportioned to the
20–29-year-olds. Ireland, however, stands in a class of its own.
Source: Eurostat, Structural Indicators.
Figure 24. Total for tertiary graduates in science and technology per 1,000 of
population aged 20–29, ‰
54
2
4
6
8
10
12
14
16
18
20
22
24
1993 1994 1995 1996 1997 1998 1999 2000 2001
Ireland
France
United Kingdom
Finland
Sweden
Denmark
US
Spain
Belgium
Germany
Norway
Austria
Netherlands
41 OECD Education at a glance 2003
Of the EU Member States, Finland ranked second after Sweden in terms of the
number of qualified doctors in science and technology (in relation to population
aged 25–34) in 2000. The USA and Japan placed lower than the EU average42.
Costs are high during studies
In Finland the annual expenditure on tertiary-level educational institutions per stu-
dent remained clearly lower than the average international level in 200043. The
growth of the costs has represented the average level of the developed countries.
However, due to long student periods total expenditure on the tertiary level during
the student period is higher than the average in Finland (cf. Figure 25). Further-
more, the annual expenditure of post-secondary studies in relation to GDP is high
by the international standard44. One reason for this is the reform of the polytechnics,
which resulted in a situation where a considerable number of degrees were trans-
ferred from the secondary level to the tertiary level.
The internationally high expenditure on tertiary-level educational institutions
(costs during studies and GDP share) renders, however, many graduates and re-
searchers.
In Finland and in most of the other EU Member States the public sector is responsi-
ble almost entirely for the financing of tertiary-level education. In the USA and in
Japan the share of the private sector of the expenditure is clearly higher.
55
42 Towards a European Research Area; Science, Technology and Innovation; Key Figures 2002
43 OECD Education at a glance 2003, Table B6.2
44 OECD Education at a glance 2003, Table B2.1b

Source: OECD Education at a glance 2003. Table B1.3
Figure 25. Cumulative expenditure on educational institutions per student over
the average duration of tertiary studies, 2000 (USD PPS)
56
0 10 000 20 000 30 000 40 000 50 000 60 000 70 000
Sweden
Austria
Switzerland
Germany
Finland
Denmark
Netherlands
Italy
France
Ireland
United Kingdom
Spain
Greece
4.3 R&D investment is top-class
Finland has rapidly risen to the world’s top in R&D investment. The share of the
corporate sector of R&D financing is among the highest in the world. The propor-
tion of public financing has continued to decrease in the past few years. The
growth of public financing stopped in 2000. In Finland public financing is aimed
at dynamically promoting the R&D activities of SMEs.
Like the industrial structure, the R&D expenditure of manufacturing has been fo-
cused on the high- and low-technology sectors. Correspondingly, the share of me-
dium-high-tech sectors is low.
The share of the service sectors of the R&D expenditure of enterprises has in-
creased, but still remains low by the international standard.
Growth derived from utilisation of technology
Research and product development are the pillars of innovations. Technological
development is a central factor explaining the growth of productivity and the stan-
dard of living. Utilisation of international research results and technological devel-
opment is a particularly important source of growth for small countries. The Finn-
ish contribution to global research and development is 0.6 per cent only.
R&D investment has risen at a record pace
In research and development Finland has rapidly achieved the top level in the
world. Correspondingly, the real growth of the R&D expenditure of the large EU
Member States has been slow particularly towards the end of the 1990s. In Finland
the real growth of expenditure was rapid up to the year 2000, but since then the
growth rate has slackened45.
57
45 OECD, Main Science and Technology Indicators 2003/1
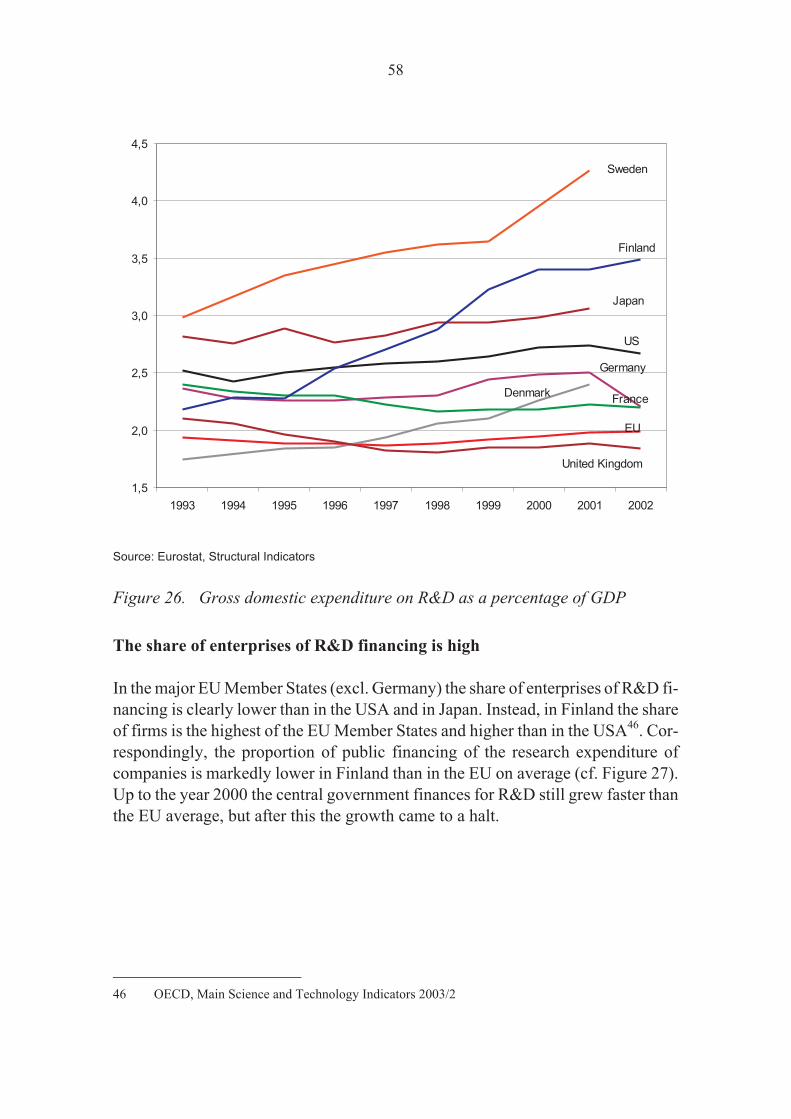
Source: Eurostat, Structural Indicators
Figure 26. Gross domestic expenditure on R&D as a percentage of GDP
The share of enterprises of R&D financing is high
In the major EU Member States (excl. Germany) the share of enterprises of R&D fi-
nancing is clearly lower than in the USA and in Japan. Instead, in Finland the share
of firms is the highest of the EU Member States and higher than in the USA46. Cor-
respondingly, the proportion of public financing of the research expenditure of
companies is markedly lower in Finland than in the EU on average (cf. Figure 27).
Up to the year 2000 the central government finances for R&D still grew faster than
the EU average, but after this the growth came to a halt.
58
1,5
2,0
2,5
3,0
3,5
4,0
4,5
1993 1994 1995 1996 1997 1998 1999 2000 2001 2002
Finland
Sweden
Japan
US
Germany
United Kingdom
EU
FranceDenmark
46 OECD, Main Science and Technology Indicators 2003/2

Source: OECD, Main Science and Technology Indicators 2003-2
Figure 27. Percentage of expenditure on R&D in the business enterprise sector
financed by government
The share of high technology is considerable
In Finland the share of the high-tech sectors of R&D expenditure of manufacturing
is the highest of the EU Member States and higher than in the USA and in Japan.
The share of the medium-high-tech sectors is relatively low, and, correspondingly,
that of low technology is higher than in the EU Member States on average.
59
0
5
10
15
20
1991 1997 1998 1999 2000 2001 2002
Finland
Sweden
Japan
US
Germany
UK
EU
Ireland

Source: Towards a European Research Area; Science, Technology and Innovation; Key Figures 2002.
Figure 28. Share of manufacturing R&D by industry type, 2000
Service sectors’ share of expenditure on R&D is low
In Finland the share of the service sectors of the R&D expenditure of enterprises is
low. This results partly from the industry-intensive industrial structure, but also
from the low product development activity of the service sectors. On the other
hand, in recent years the share of the service sector has increased to some extent.
60
0 % 20 % 40 % 60 % 80 % 100 %
Spain '99
Belgium
Netherlands '99
Ireland '99
Finland
Denmark '99
Japan
France '99
EU-11 '99
United Kingdom
US
Italy
Sweden '99
Germany
High-Tech Medium-High-Tech Medium-Low-Tech and Low-Tech
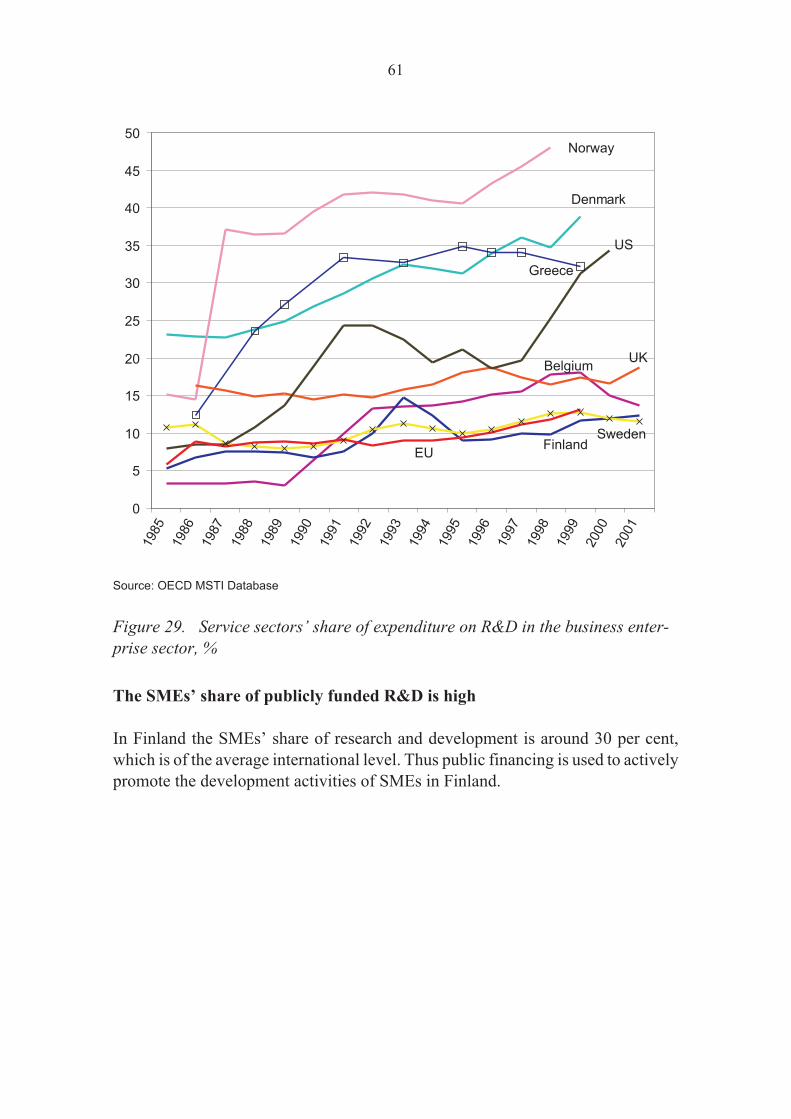
Source: OECD MSTI Database
Figure 29. Service sectors’ share of expenditure on R&D in the business enter-
prise sector, %
The SMEs’ share of publicly funded R&D is high
In Finland the SMEs’ share of research and development is around 30 per cent,
which is of the average international level. Thus public financing is used to actively
promote the development activities of SMEs in Finland.
61
0
5
10
15
20
25
30
35
40
45
501985
1986
1987
1988
1989
1990
1991
1992
1993
1994
1995
1996
1997
1998
1999
2000
2001
Norway
Denmark
Greece
US
BelgiumUK
SwedenFinland
EU

Source: OECD Science, Technology and Industry Outlook 2002
Figure 30. SMEs’ share of national R&D performance, 2001, %
4.4 Availability of risk financing is good
The equity ratio of companies is one of the best in the world and especially good
with small enterprises. The relative size of Finland’s venture capital investment
and securities markets is among the world’s biggest. Moreover, the availability of
venture capital is good in the view of business executives.
Innovation activities require that a company is capable of risk-taking. Sufficient
self-financing is the basic condition for innovations. Start-up companies and firms
that develop their operations dynamically also need venture capital from the mar-
ket for their projects.
62
29
58
0
10
20
30
40
50
60
70
80
90
100P
ortugal
Norw
ay
Spain
Denm
ark
Belg
ium
Sw
itzerland
Fin
land
Neth
erlands
Unite
dK
ingdom
Italy
Fra
nce
Unite
dSta
tes
Sew
den
Germ
any
Japan
Total R&D Government-funded R&D

Good equity ratio of companies
In Finland the equity ratio of companies was one of the best in Europe in 2000 and
the dispersion of self-sufficiency low in relation to company size. In Europe the
self-sufficiency of small enterprises was lower than in the USA, but in Finland it is
at the same level as in the USA47. Finnish SMEs do not consider the availability of
bank credits to restrict business as much as SMEs in most of the other EU Member
States do.
Venture capital market placed high in international comparisons
Venture capital investments in relation to GDP were the second highest in Finland,
after Sweden and before the USA and the other EU Member States in 2002. In Fin-
land venture capital investments have focused on the so-called early stage, i.e. on
seed and start-up financing48. Heavy investments in high technology are also typi-
cal of the Finnish venture capital investment market.
Source: European Innovation Scoreboard 2002
Figure 31. High-tech venture capital investment as a percentage of GDP, 2001
63
0,57
0,24
0,0 0,1 0,2 0,3 0,4 0,5 0,6
Finland
Denmark
Belgium
Sweden
Norway
Ireland
EU
Switzerland
France
UK
Netherlands
Italy
Spain
Greece
Austria
Germany
Portugal
Venture capital is the sum of early stage capital
(seed and start-up) plus expansion capital
High technology firms active in the following sectors:
computer related fields, electronics, biotechnology,
medical/health, industrial automation, financial services
47 Enterprise Policy Scoreboard 2002
48 Towards a European Research Area; Science, Technology and Innovation; Key Figures 2002
The relative size of the Finnish securities market is the third largest of the EU Mem-
ber States (market value of shares of domestic companies in relation to GDP aver-
age during 2000–2003)49.
In the interviewing material of IMD50 and WEF51, Finland is ranked on top, when
the availability of financing from the securities and venture capital markets is con-
cerned.
4.5 Innovation activities are fruitful
R&D activities have yielded good results. The number of scientific publications is
one of the world’s highest, but in terms of references made to these publications
our ranking remains average. In patents Finland is one of the leading countries at
the European level, and in high-tech patents it is heading the scores.
Commercialisation of innovations has been successful. The share of high technol-
ogy of goods exports has risen rapidly, but it is still only slightly higher than the
EU average. Exports of immaterial knowledge and imports reflecting its utilisa-
tion are on a good level, globally speaking. The high proportion of the high-tech
sectors of employment and production is also an example of Finland’s good com-
petitive position.
In SMEs the profitability of innovation activities represents the top level of the EU
Member States, while the inputs represent the average.
Measuring the results of innovations is difficult
The results of R&D are compared internationally e.g. by the number of scientific
publications and patents. Research results do not improve competitiveness until
they can be realised in new products and methods. At the level of national economy,
commercialisation of innovations is measured in general with trade in high technol-
64
49 Enterprise Policy Scoreboard 2003
50 World Competitiveness Yearbook 2003
51 The Global Competitiveness Report 2002–2003

ogy and immaterial knowledge. The majority of innovation activities of firms are
improvements in production processes, planning and organisation, not so much
new products created by research. The effects of innovation activities on business
are usually assessed by means of interviews.
Scientific publications are drawn up in great numbers
In 2000 Finland was placed second of the EU Member States in terms of the num-
ber of scientific publications, when the publications are proportioned to population.
In countries with a low number of publications, the number has increased faster
than in Finland and the other leading countries during 1995–2001. As for the scien-
tific importance of research, Finland is ranked at 8th, when the references to the pub-
lications are examined52. In Finland the focus of scientific publications is on life
sciences, the computer science and on technology.
In patents Finland heads the scores
In 2001, in terms of the number of patents in relation to population, Finland was
second after Sweden of the EU Member States both in Europe (applications) and in
the USA (awarded)53. The high ranking of both Finland and Sweden partly derives
from the situation in which production is focused on such sectors as electronics,
where patents are used for protecting industrial rights more than in many other in-
dustries.
Exports of high technology have increased rapidly
In the 1990s the high-tech share of goods exports increased rapidly in Finland. Ow-
ing to a global standstill of the growth of the data communications equipment mar-
ket, the share sank in 2001 down to little more than 20 per cent, which is slightly
higher than the average of the EU Member States54. The fact that the Finnish pro-
portion of the global high-tech export market grew by c. six percent is an example
of the good developments of the years 1995–2000. In 2000 the share was 0.9%.
65
52 Towards a European Research Area; Science, Technology and Innovation; Key Figures 2002
53 Eurostat, Structural Indicators
54 Tekes, http://www.tekes.fi/tekes/tilastot.html
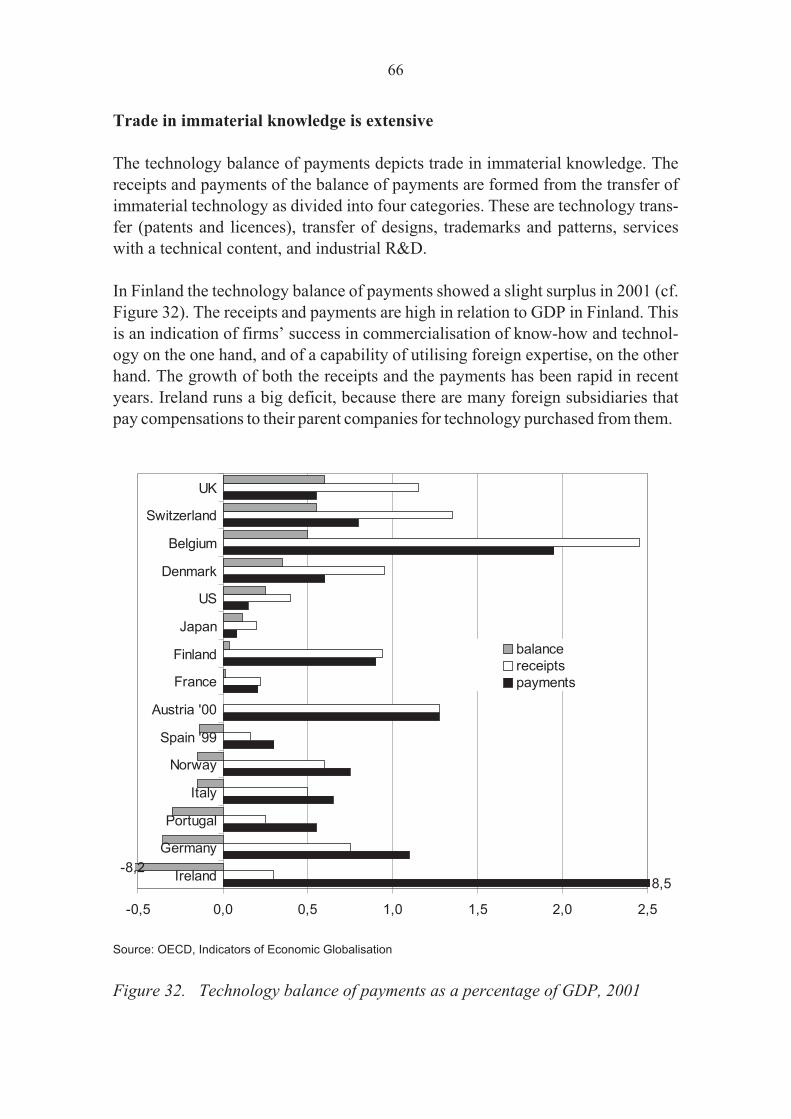
Trade in immaterial knowledge is extensive
The technology balance of payments depicts trade in immaterial knowledge. The
receipts and payments of the balance of payments are formed from the transfer of
immaterial technology as divided into four categories. These are technology trans-
fer (patents and licences), transfer of designs, trademarks and patterns, services
with a technical content, and industrial R&D.
In Finland the technology balance of payments showed a slight surplus in 2001 (cf.
Figure 32). The receipts and payments are high in relation to GDP in Finland. This
is an indication of firms’ success in commercialisation of know-how and technol-
ogy on the one hand, and of a capability of utilising foreign expertise, on the other
hand. The growth of both the receipts and the payments has been rapid in recent
years. Ireland runs a big deficit, because there are many foreign subsidiaries that
pay compensations to their parent companies for technology purchased from them.
Source: OECD, Indicators of Economic Globalisation
Figure 32. Technology balance of payments as a percentage of GDP, 2001
66
8,5-8,2
-0,5 0,0 0,5 1,0 1,5 2,0 2,5
Ireland
Germany
Portugal
Italy
Norway
Spain '99
Austria '00
France
Finland
Japan
US
Denmark
Belgium
Switzerland
UK
balance
receipts
payments

Profitability of innovation activities in SMEs is good
Finland’s ranking in the profitability of innovation activities is good, because in
Finnish small and medium-sized enterprises, in terms of the market, the share of
new products of their net sales is among the highest of the EU Member States. In in-
dustry the ranking is better than in the services. In innovation activities, the ranking
of Finnish enterprises is average, when measured by the share of enterprises prac-
tising innovation activities of their own of all SMEs. Instead, in regard to the share
of SMEs engaged in innovation cooperation, Finland is one of the leading countries
in the EU, both in industry and in the service industries. The share of innovation ex-
penditure of the turnover is higher in industrial SMEs than the EU average, but it
does not reach the top level. In the service industries, however, that share is clearly
lower than the EU average (3rd Community Innovation Survey55).
Finland was at 9th place of 58 countries in regard to firms’ innovation-orientedness
in the interview material of WEF56.
67
55 EU, Innovation Scoreboard 2003
56 The Global Competitiveness Report 2002–2003

5 Functioning of the market
Competition brings innovations
Functioning of the market is a central factor for the productivity of innovation ac-
tivities and competitiveness in any country. The labour market, where the
know-how requirements are on a constant increase, a balance of demand and sup-
ply is a prerequisite for improvement of employment and promotion of innovation.
The functioning of the commodities market and competitiveness have a close inter-
action. Open economy and deregulation subject enterprises to international compe-
tition and make globalisation of business possible. Competition that functions well
forces firms to improve the efficiency of their operations and to innovate. Re-
sources allocated for research and development produce the more, the better the
market is functioning.
5.1 Unemployment turning into lack of labour
The employment rate and retiring age are higher in Finland than in the EU on av-
erage. The relation of persons of pensionable age to working age population is
still good at present, but it is expected to rise faster than in our competitor coun-
tries.
In Finland the regional differences of employment are among the biggest in the
EU Member States. Unemployment is still a significant problem: it is among the
highest in the EU countries at both ends of the age distribution.
Labour supply is still good, but the dependency ratio is declining rapidly
In 2001 the average retiring age was 62 years in Finland and 60 years in the EU
Member States. The employment rate is over three percentage units higher than in
the EU, which particularly derives from the high employment rate of women in Fin-
land. Of the EU countries, Finland has the fourth highest regional differences in
employment.57. In Finland the full-time equivalent employment rate is higher than
68
57 Eurostat, Structural indicators
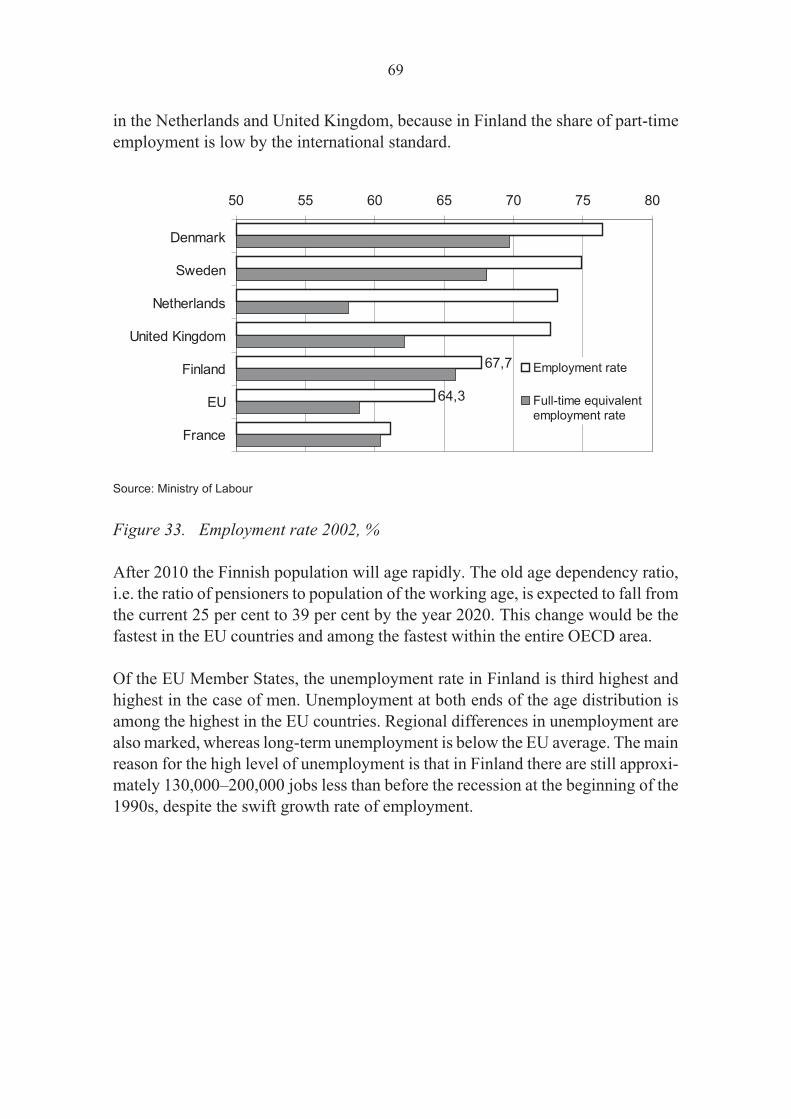
in the Netherlands and United Kingdom, because in Finland the share of part-time
employment is low by the international standard.
Source: Ministry of Labour
Figure 33. Employment rate 2002, %
After 2010 the Finnish population will age rapidly. The old age dependency ratio,
i.e. the ratio of pensioners to population of the working age, is expected to fall from
the current 25 per cent to 39 per cent by the year 2020. This change would be the
fastest in the EU countries and among the fastest within the entire OECD area.
Of the EU Member States, the unemployment rate in Finland is third highest and
highest in the case of men. Unemployment at both ends of the age distribution is
among the highest in the EU countries. Regional differences in unemployment are
also marked, whereas long-term unemployment is below the EU average. The main
reason for the high level of unemployment is that in Finland there are still approxi-
mately 130,000–200,000 jobs less than before the recession at the beginning of the
1990s, despite the swift growth rate of employment.
69
67,7
64,3
50 55 60 65 70 75 80
Denmark
Sweden
Netherlands
United Kingdom
Finland
EU
France
Employment rate
Full-time equivalentemployment rate

Source: European Commission
Figure 34. Old age dependency: ratio of people of 65 to population aged 15 to
64
5.2 The educational attainment level and demand
for labour are ill matched
The employment rate is higher than the EU average at all educational levels. Un-
employment is higher than in the EU at the low and medium educational attain-
ment level. Although employment of the highly educated population is good and
match up to the level of the best Member States, unemployment is still of the aver-
age EU level.
In Finland the educational level of population does not meet the demand on the la-
bour market as well as in the EU Member States on average. The situation is par-
ticularly worrying in the case of the unemployed and the population that is not
part of the workforce.
70
0 % 5 % 10 % 15 % 20 % 25 % 30 % 35 % 40 %
Italy
Finland
Sweden
Germany
France
Greece
Belgium
EU-15
Denmark
Spain
Netherlands
Austria
UK
Luxembourg
Portugal
Ireland
2000 2010 2020

Unemployment of the highly educated is on the average EU level
In Finland the employment rate is higher at all educational attainment levels (high,
medium and low) than in the European Union on average. The proportion of the
highly educated population is the highest of the EU Member States. Employment of
this group is on the level of the best EU Member States, but unemployment, how-
ever, represents the EU average.
Employment of persons with medium-level education is higher than the EU aver-
age, and unemployment among the highest. Employment of persons with low-level
education corresponds to the EU average, but unemployment is the highest of the
EU countries.
There is room for improvement in the match of population and the
educational attainment levels of the employed
In Finland the distribution of the educational attainment level of population (low,
medium, high) became closer to the corresponding distribution of the employed
during the latter half of the 1990s. However, education still does not meet the labour
market as well as in the EU Member States on average58. In Finland the educational
attainment levels of the unemployed and the part of population outside the
workforce clearly deviate from the distribution of the educational attainment levels
of the employed. The deviations are among the biggest of the EU countries. In Fin-
land there are exceptionally marked differences in the educational levels of the age-
ing and the young. There is a gap between the demand for labour, whose growth is
based on know-how, and the unemployed, aged labour.
71
58 European Competitiveness Report 2002, Chapter II.4.2

Source: Employment in Europe 2003
Figure 35. Employed and unemployed persons according to educational attain-
ment level, 2002, %
72
88
87
87
86
86
86
84
84
83
83
81
80
79
76
83
3
2 3
2 2 1
4
1 3 4
3 5
4 6
9
4
90
70
80
90
10
0
Po
rtu
ga
l
Un
ite
d
Kin
gd
om
De
nm
ark
Ne
the
rla
nd
s
Sw
ed
en
Fin
lan
d
Au
str
ia
Ire
lan
d
Lu
xe
mb
ou
rg
Ge
rma
ny
Be
lgiu
m
Ita
ly
Gre
ece
Fra
nce
Sp
ain
EU
–1
5
80
78
77
73
73
71
70
70
70
66
65
63
56
55
70
3 1 5 4
3
9
6 6
1
4 7
3
9 9
6
80
2
50
60
70
80
90
10
0
De
nm
ark
Ne
the
rla
nd
s
Sw
ed
en
Un
ite
d
Kin
gd
om
Au
str
ia
Fin
lan
d
Ire
lan
d
Fra
nce
Ge
rma
ny
Lu
xe
mb
ou
rg
Be
lgiu
m
Ita
ly
Po
rtu
ga
l
Sp
ain
Gre
ece
EU
–1
5
61
59
56
52
51
51
49
49
48
47
47
45
45
41 4
9
3
2 4
5
5 9 11
3 5 4 7 6 6
5
6
68 1
30
40
50
60
70
80
90
10
0
Po
rtu
ga
l
Ne
the
rla
nd
s
De
nm
ark
Sw
ed
en
Sp
ain
Un
ite
d
Kin
gd
om
Lu
xe
mb
ou
rg
Gre
ece
Fin
lan
d
Au
str
ia
Ire
lan
d
Fra
nce
Ita
ly
Ge
rma
ny
Be
lgiu
m
EU
–1
5
88
87
87
86
86
86
84
84
83
83
81
80
79
76
83
32
32
21
41
34
35
46
94
90
70
75
80
85
90
95
10
0
Po
rtu
ga
lU
nit
ed
De
nm
ar
Ne
the
rla
Sw
ed
eF
inla
nd
Au
stri
aIr
ela
nd
Lu
xe
mb
Ge
rma
nyB
elg
ium
Ita
lyG
ree
ce
Fra
nc
eS
pa
inE
U–
15
Em
plo
yed/P
eople
15
to65,
%U
nem
loyed/p
eople
15
to65,
%
88
87
87
86
86
86
84
84
83
83
81
80
79
76
83
3
2 3
2 2 1
4
1 3 4
3 5
4 6
9
4
90
70
80
90
10
0
Po
rtu
ga
l
Un
ite
d
Kin
gd
om
De
nm
ark
Ne
the
rla
nd
s
Sw
ed
en
Fin
lan
d
Au
str
ia
Ire
lan
d
Lu
xe
mb
ou
rg
Ge
rma
ny
Be
lgiu
m
Ita
ly
Gre
ece
Fra
nce
Sp
ain
EU
–1
5
80
78
77
73
73
71
70
70
70
66
65
63
56
55
70
3 1 5 4
3
9
6 6
1
4 7
3
9 9
6
80
2
50
60
70
80
90
10
0
De
nm
ark
Ne
the
rla
nd
s
Sw
ed
en
Un
ite
d
Kin
gd
om
Au
str
ia
Fin
lan
d
Ire
lan
d
Fra
nce
Ge
rma
ny
Lu
xe
mb
ou
rg
Be
lgiu
m
Ita
ly
Po
rtu
ga
l
Sp
ain
Gre
ece
EU
–1
5
61
59
56
52
51
51
49
49
48
47
47
45
45
41 4
9
3
2 4
5
5 9 11
3 5 4 7 6 6
5
6
68 1
30
40
50
60
70
80
90
10
0
Po
rtu
ga
l
Ne
the
rla
nd
s
De
nm
ark
Sw
ed
en
Sp
ain
Un
ite
d
Kin
gd
om
Lu
xe
mb
ou
rg
Gre
ece
Fin
lan
d
Au
str
ia
Ire
lan
d
Fra
nce
Ita
ly
Ge
rma
ny
Be
lgiu
m
EU
–1
5
88
87
87
86
86
86
84
84
83
83
81
80
79
76
83
32
32
21
41
34
35
46
94
90
70
75
80
85
90
95
10
0
Po
rtu
ga
lU
nit
ed
De
nm
ar
Ne
the
rla
Sw
ed
eF
inla
nd
Au
stri
aIr
ela
nd
Lu
xe
mb
Ge
rma
nyB
elg
ium
Ita
lyG
ree
ce
Fra
nc
eS
pa
inE
U–
15
Em
plo
yed/P
eople
15
to65,
%U
nem
loyed/p
eople
15
to65,
%
Hig
hed
uca
tio
nal
atta
inm
ent
Med
ium
edu
cati
on
alat
tain
men
tL
ow
edu
cati
on
alat
tain
men
t
5.3 Deficiencies in the flexibility of the labour
market
In the OECD evaluation, regulation of the Finnish labour market is of the average
level of the developed countries, but in the surveys by IMD and WEF clearly stron-
ger than the average. According to the OECD report, employment in Finland can
be improved by increasing the flexibility of the labour market system and encour-
agement for working.
Regulation can be eased
On the basis of the material of IMD and WEF that maps out the labour market, it can
be stated that there are features that restrict competitiveness in the functioning of
the labour market. In the comparison of 59 countries by IMD59, Finland is placed at
20 in regulation of labour (hiring/firing practices, minimum wages, etc.) and at 41
in how unemployment legislation provides an incentive to look for work. In the
comparison of 80 countries by WEF,60 Finland is ranked at 38 in hiring and firing
practices, at 78 in flexibility of wage determination and at 30 in the relation of pay
to worker productivity. Both materials are based on interviews of business execu-
tives of these countries.
In terms of legislation on employment protection, Finland was placed around the
average in a comparison of 17 OECD countries in 199861.
OECD recommends structural reforms
The OECD’s country review62 makes the following observations on the Finnish la-
bour market:
• Structural problems can be linked to the Finnish governance model and
value system, which promote equity and solidarity, with decisions based
on consensus between the social partners.
73
59 World Competitiveness Yearbook 2003
60 The Global Competitiveness Report 2002–2003
61 ICT and Economic Growth, OECD 2003, p. 32
62 OECD Reviews of Regulatory Reform: Finland – A New Consensus for Change, SG/SGR(2003)2
• Productivity suffers indirectly from a centralised process of determining
wages and salaries, which leads to reductions in wage differentiation.
Therefore the spurs of the system to improve the efficiency of the shelte-
red sectors of economy are insufficient.
• The regulatory regime for the labour market includes features that do not
encourage people to seek employment again. Among these are the long
maximum duration of the unemployment benefits, high levels of sup-
port for long-term recipients of benefit and the short waiting period be-
fore benefits can be claimed.
According to the report, the functioning of the Finnish labour market can be im-
proved with the following measures:
• reform of the pension system and reduction of the incentives for early re-
tirement,
• reform of the unemployment and the related benefits,
• improvement of the efficiency of active employment schemes,
• increase in the flexibility of employment and labour costs,
• improvement of the skills and competencies of labour force, and
• increase in the flexibility of centralised wage negotiations.
5.4 The openness of economy is relatively low
The other small EU Member States are more open than Finland when measured
by the shares of foreign trade, direct investments from abroad and of foreign sub-
sidiaries. The Finnish price level is also high compared to other countries.
The share of foreign trade of economy is relatively low
The size of the market, economic and industrial structure and geography affect the
transparency of economy. Small countries are usually more open than the large
ones. Of the small EU Member States, Finland ranks last in the integration of for-
eign trade (the share of exports and imports of GDP). In recent years the advance-
ment of integration has not been any faster than in other countries.
74
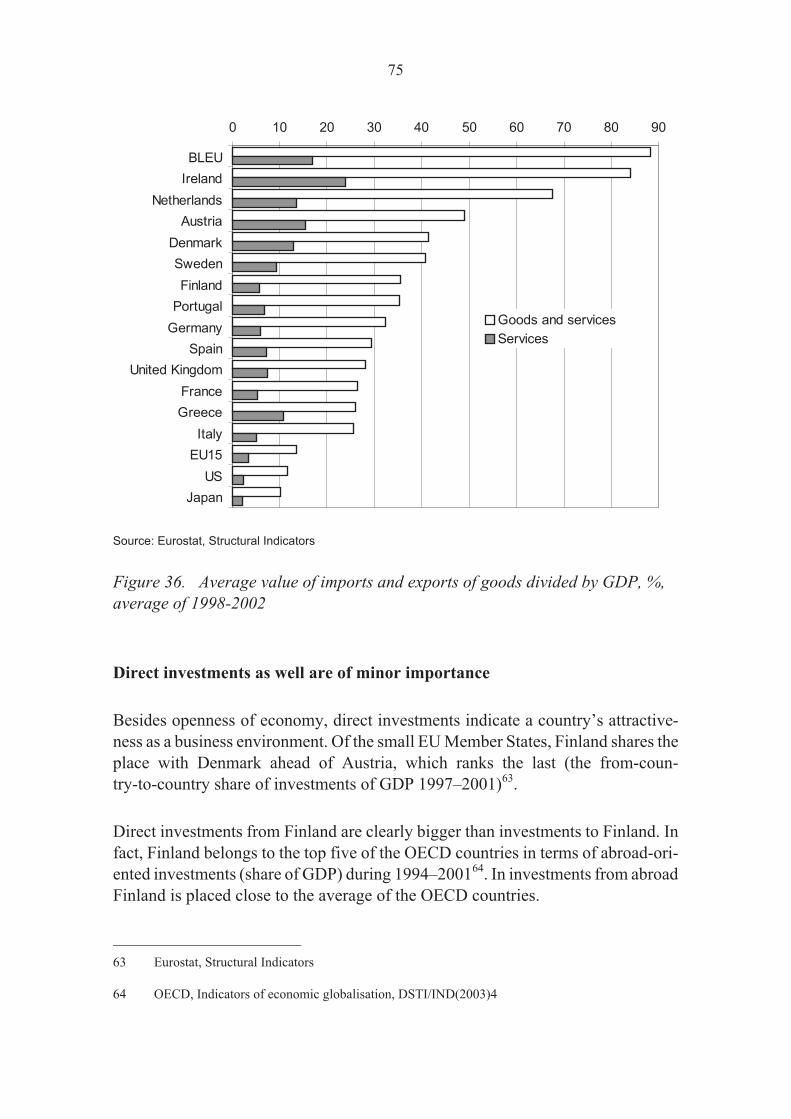
Source: Eurostat, Structural Indicators
Figure 36. Average value of imports and exports of goods divided by GDP, %,
average of 1998-2002
Direct investments as well are of minor importance
Besides openness of economy, direct investments indicate a country’s attractive-
ness as a business environment. Of the small EU Member States, Finland shares the
place with Denmark ahead of Austria, which ranks the last (the from-coun-
try-to-country share of investments of GDP 1997–2001)63.
Direct investments from Finland are clearly bigger than investments to Finland. In
fact, Finland belongs to the top five of the OECD countries in terms of abroad-ori-
ented investments (share of GDP) during 1994–200164. In investments from abroad
Finland is placed close to the average of the OECD countries.
75
0 10 20 30 40 50 60 70 80 90
BLEU
Ireland
Netherlands
Austria
Denmark
Sweden
Finland
Portugal
Germany
Spain
United Kingdom
France
Greece
Italy
EU15
US
Japan
Goods and services
Services
63 Eurostat, Structural Indicators
64 OECD, Indicators of economic globalisation, DSTI/IND(2003)4

The price level is high
In 1991 Finland ranked third in terms of the price level of households’ consump-
tion, after Denmark and Sweden. There are indications of the Finnish price level’s
being in a downward trend in relation to the other EU Member States.
Source: Eurostat, Structural Indicators
Figure 37. Comparative price levels of final consumption by private households
(incl. indirect taxes), EU-15=100, 2002
5.5 Regulation restricts competition on the home
market
In Finland there are still regulation obstructing market operations and insuffi-
cient competition in many sectors of the home market. OECD encourages Finland
to continue market openings, to improve the efficiency of the public sector and to
remove the obstacles to market access.
76
0 50 100 150
Japan
Norway
Denmark
Finland
Ireland
Sweden
US
UK
Germany
Netherlands
Austria
EU15
France
Luxembourg
Belgium
Italy
Spain
Greece
Portugal
Estonia

More regulation than on average
An OECD report, whose material mainly dates back to 1998, examines the degree
of regulation on the commodities market. The following observations can be made
of the report65:
• Finland has more regulation than on average, when the regulatory envi-
ronment is examined as a whole.
• Of the developed countries, Finland is ranked second after Norway in
regard to the share of publicly owned companies of the production of the
enterprise sector.
• Finland represents the average in liberalisation of the trade in manufac-
tured products.
• Of the service sectors, Finnish regulation exceeds the OECD average in
retail trade only.
Competition law is still efficient
In the comparison of 59 countries in the report by IMD66, Finland heads the scores
in terms of competition legislation and the functioning of product and service legis-
lation. In the WEF report67 Finland ranks second in the effectiveness of antitrust
policy of 80 countries. The results of both reports are based on interviews of busi-
ness executives of the countries.
OECD country review: competition policy is to be made more efficient
The OECD country review68 examines the regulation and functioning of the Finn-
ish commodities market. According to the report, the measures implemented in
Finland in the 1990s to reduce regulation have had a positive effect on economic
growth and productivity. Nevertheless, there is still regulation that obstructs com-
petition in Finland. The OECD categorises Finland into countries where market
regulation is especially detrimental (of the 21 OECD countries, Finland is placed
within the higher 25 per cent in terms of detrimental regulation).
77
65 Regulation, Productivity and Growth: OECD Evidence, ECO/WKP(2003)1
66 World Competitiveness Yearbook 2003
67 The Global Competitiveness Report 2002-2003
68 OECD Reviews of Regulatory Reform: Finland – A New Consensus for Change, SG/SGR(2003)2

OECD justifies its evaluation as follows:
• In Finland the share of the subsidiaries of foreign companies is low in
both industry and the service sectors.
• The State has considerable shareholdings and the public sector is large
in Finland compared to the OECD average.
• There is detrimental regulation mainly in water and gas resources mana-
gement, construction, retail trade (incl. pharmacies), sectors of transpor-
tation (railway and air traffic, taxis), postal services, professional servi-
ces, as well as in community, social and personal services.
The conclusions by the OECD is supported by the observation that in sectors that
have been open to international competition the growth of labour productivity has
been rapid and prices have been cut. Instead, prices have risen and productivity has
decreased in sectors where detrimental regulation and lack of competition occur
(cf. Figure 38).
Source: OECD Reviews of Regulatory Reform: Finland – A New Consensus for Change, SG/SGR(2003)2
Figure 38. Difference between average growth rates per industry and total econ-
omy 1990–2000, %
78
-9 -4 1 6 11 16
Communication equipment
Electrical and optical equipment
Post and telecommunications
Manufacturing
Electricity, gas, water
Primary production
Financial intermediation
Total
Transport and storage
Mining and quarrying
Trade, restaurants and hotels
Real estate and business services
Construction
Community, social and personal services
Labour productivity
Output price

The OECD urges Finland to continue the market deregulation and strong competi-
tion policy e.g. by earmarking sufficient resources for the Finnish Competition Au-
thority. The OECD recommends that Finland should improve the efficiency of the
public sector, to promote competition in the fields of the domestic market, to make
cartel sanctions more severe and to remove the constraints of the labour market.
Service provision at the local level, where productivity is to be raised, without com-
promising the quality of services, places a great challenge to competition policy.
79

Sources
European Commission:
European Commission (2002), Employment in Europe 2002 – Recent Trends and
Prospects
http://europa.eu.int/comm/employment_social/news/2002/sep/employment_in_eu
rope2002.pdf
European Commission (2002), Enterprise Policy Scoreboard 2002
http://europa.eu.int/comm/enterprise/enterprise_policy/better_environment/doc/e
nterprise_policy_scoreboard_2002_en.pdf
European Commission (2002), European Competitiveness Report 2002,
(SEC(2002)528)
European Commission, European Innovation Scoreboard 2002
http://trendchart.cordis.lu/Scoreboard2002/index.html
European Commission (2002), Innobarometer 2002, Innovation papers No 33
http://www.cordis.lu/innovation-smes/src/innobarometer2002.htm
European Commission (2002), Towards a European Research Area; Science,
Technology and Innovation; Key Figures 2002
OECD:
OECD, Bilateral trade statistics
OECD (2003), Differences in Entry and Exit in OECD Countries – Findings and
Impact of Methodological Differences, JT00148582
OECD (2003), Education at a Glance 2003 http://www.oecd.org/document/52
OECD (2002), Education at a Glance 2002
http://www.oecd.org/els/education/eag2002
OECD (2003), ICT and Economic Growth, Evidence from OECD Countries,
Industries and Firms.
OECD (2003), Indicators of Economic Globalization, DSTI/IND(2003) 4
OECD (2003), Main Science and Technology Indicators, Volume 2003/1
80

OECD, MSTI Database
OECD (2003), OECD Reviews of Regulatory Reform: Finland – A New
Consensus for Change, SG/SGR (2003) 2
OECD (2002), OECD Science, Technology and Industry Outlook 2002
OECD (2001), OECD Science, Technology and Industry Scoreboard 2001 -
Towards a Knowledge-Based Economy
http://www1.oecd.org/publications/e-book/92-2001-04-1-2987/
OECD (2001), PISA 2000
http://www.pisa.oecd.org/
http://www.pisa.oecd.org/Docs/Download/PISA2001(english).pdf
OECD (2003), Regulation, Productivity and Growth: OECD Evidence, ECO/WKP
(2003) 1
OECD (2003), The Sources of Economic Growth in OECD Countries
OECD, STAN database
Others:
Eurostat, Observatory of European SMEs 2002 / No 2
Eurostat, Structural Indicators
http://europa.eu.int/comm/eurostat/Public/datashop/print-product/EN?catalogue=
Eurostat&product=1-structur-EN&mode=download
Database of the University of Groningen
Institute for Management Development, IMD (2003), IMD World
Competitiveness Yearbook 2003. Lausanne, Switzerland
Mankinen Reijo, Rouvinen Petri and Ylä-Anttila Pekka (2002), Palveluiden
tuottavuus – Kilpailu ja teknologia muuttavat rakenteita, Keskusteluaiheita No.
829. ETLA, the Research Institute of the Finnish Economy
Porter Michael (1990), The Competitive Advantage of Nations, The Macmillan
Press LTD
Statistics Finland, Business Register
81
United Nations Development Programme, UNDP (2003), Human Development
Report 2003, Oxford University Press
Van Ark Bart, Inklaar Robert, McGuckin Robert (2002), “Changing Gear”,
Productivity, ICT and Services: Europe and the United States, Research
Memorandum GD-60. University of Groningen
Viitamo Esa (2003), Knowledge-intensive Services and Competitiveness of the
Forest Cluster: The Case of Finland, Interim Report, IR-03-057, International
Institute for Applied Systems Analysis, IIASA
The World Conservation Union IUCN (2001), Wellbeing of Nations, Gland,
Switzerland
World Economic Forum, WEF (2003), The Global Competitiveness Report
2002–2003, Oxford University Press
82
Julkaisusarjan nimi ja tunnus Käyntiosoite
Postiosoite KTM Julkaisuja Aleksanterinkatu 4 00170 HELSINKI
PL 32 00023 VALTIONEUVOSTO
Puhelin (09) 16001 Telekopio (09) 1606 3666 7/2004
Julkaisuaika Maaliskuu 2004
Toimeksiantaja(t) Kauppa- ja teollisuusministeriö
Tekijät (toimielimestä: nimi, puheenjohtaja, sihteeri) Elinkeino-osasto Hannu Lipponen Esa Viitamo
Toimielimen asettamispäivä
Julkaisun nimi Suomen kilpailukyky ja toimintaympäristö – kansainvälinen vertailu
Tiivistelmä Suomen kilpailukyky ja toimintaympäristö – kansainvälinen vertailu on katsaus, joka hahmottaa kilpailu-kyvyn, tuotantorakenteen ja yritysten toimintaympäristön välistä vuorovaikutusta. Lähtökohtana on Suomen kilpailukyvyn kansainvälinen vertailu. Talouden suorituskykyä tarkastellaan elintason, tuottavuuden ja tuotantorakenteen avulla. Toimintaympäristön tarkastelu on rajattu innovaatio-ympäristöön ja työ- ja hyödykemarkkinoihin, joiden merkitystä on korostettu myös uusimmissa kansain-välisissä kilpailukykyarvioissa. Suomen kilpailukyky on hyvä. Tuottavuus on jo pitkään kasvanut nopeasti, ja tuotantorakenne on uudis-tunut osaamisintensiiviseen suuntaan. Suomen innovaatioympäristö on maailman korkeatasoisimpia, ja innovaatiotoiminta on ollut tuloksellista. Kilpailukyvyn ylläpitäminen edellyttää tuottavuuden kasvun perustan laajentamista. Heikon tuottavuus-kasvun toimialojen BKT-osuudet ovat huomattavia, ja niillä tuotanto nojaa pääosin kotimaiseen kysyn-tään. Näitä toimialoja ovat rakentaminen ja palvelualoista kuljetus, kiinteistöala, liike-elämän palvelut, sekä terveys- ja sosiaalipalvelut ja koulutus. Tuottavuuden kasvun ja talouden avoimuuden lisäämisen kannalta keskeisintä on haitallisen hyödyke- ja työmarkkinoiden sääntelyn purkaminen. Palvelualojen t&k-toimintaa on tarpeen vauhdittaa. Suurimmat mahdollisuudet liittyvät kuitenkin julkisten hyvinvointipalveluiden tuottavuuden nostamiseen erityisesti yritystoimintaa lisäämällä. KTM:n yhdyshenkilö: Elinkeino-osasto/Hannu Lipponen, puh. (09) 1606 3606
Asiasanat elinkeinopolitiikka, kilpailukyky, markkinat, rakennemuutos, toimintaympäristö, tuottavuus, työllisyys
ISSN 1459-9376
ISBN 951-739-746-X
Kokonaissivumäärä 82
Kieli Englanti
Hinta 17 €
Julkaisija Kauppa- ja teollisuusministeriö
Kustantaja Edita Publishing Oy

Publikationsseriens namn och kod Besöksadress
Postadress HIM Publikationer Alexandersgatan 4 00170 HELSINGFORS
PB 32 00023 STATSRÅDET
Telefon (09) 16001 Telefax (09) 1606 3666 7/2004
Publiceringstid Mars 2004
Uppdragsgivare Handels- och industriministeriet
Författare Näringsavdelningen Hannu Lipponen Esa Viitamo
Organets tillsättningsdatum
Titel Finsk konkurrenskraft och finska förhållanden – en internationell jämförelse
Referat Finsk konkurrenskraft och finska förhållanden – en internationell jämförelse är en översikt vars syfte är att gestalta växelverkan mellan konkurrenskraften, produktionsstrukturen och företagens verksamhets-betingelser. Utgångspunkt är en internationell jämförelse av den finska konkurrenskraften. Ekonomins prestations-förmåga granskas med hjälp av levnadsstandarden, produktiviteten och produktionsstrukturen. Gransk-ningen av förhållandena har avgränsats till innovationsomgivningen och arbets- och nyttighetsmarknaden, vilkas betydelse har framhävts under den senaste tiden inom konkurrenskraften på mikronivå. Den finska konkurrenskraften är i gott skick. Produktiviteten har redan länge ökat snabbt och produktions-strukturen har förnyats i kunskapsintensiv riktning. De finska innovationsförhållandena är bland de hög-klassigaste i världen och den innovativa verksamheten har varit framgångsrik. För att konkurrenskraften skall kunna upprätthållas förutsätts att grunden för produktivitetstillväxten breddas. Branscher med svag produktivitetstillväxt står för ansenliga delar av BNP och deras produktion stöder sig huvudsakligen på inhemsk efterfrågan. Dessa branscher är byggandet och av servicesektorerna transporterna, fastighetsbranschen, affärslivets tjänster samt hälso- och socialtjänsterna och utbildningen. Med tanke på produktivitetstillväxten är det viktigaste att undanröja skadlig reglering av nyttighets- och arbetsmarknaden för att ekonomin skall bli öppnare. Det är nödvändigt att få fart på FoU-verksamheten inom servicebranscherna. De största möjligheterna är dock förknippade med en höjning av produktiviteten inom de offentliga välfärdstjänsterna i synnerhet genom ökad företagsverksamhet. Kontaktperson på HIM: Näringsavdelningen/Hannu Lipponen, tfn (09) 1606 3606
Nyckelord näringspolitik, konkurrenskraft, marknad, strukturomvandling, verksamhetsomgivning, produktivitet, sysselsättning
ISSN 1459-9376
ISBN 951-739-764-X
Sidoantal 82
Språk Engelska
Pris 17 €
Utgivare Handels- och industriministeriet
Förläggare Edita Publishing Ab