competitive_advantage of a firm through supply chain responsiveness and scm practices
TRANSCRIPT
8/13/2019 Competitive_advantage of a Firm Through Supply Chain Responsiveness and SCM Practices
http://slidepdf.com/reader/full/competitiveadvantage-of-a-firm-through-supply-chain-responsiveness-and-scm 1/294
A Dissertation
Entitled
Competitive Advantage of a Firm through Supply Chain Responsiveness and SCM
Practices
by
Ashish A. Thatte
Submitted as partial fulfillment of the requirements for
the Doctor of Philosophy Degree in
Manufacturing Management
Co-Chair: Dr. S. Subba Rao
Co-Chair: Dr. T.S. Ragu-Nathan
Graduate School
The University of Toledo
May 2007

8/13/2019 Competitive_advantage of a Firm Through Supply Chain Responsiveness and SCM Practices
http://slidepdf.com/reader/full/competitiveadvantage-of-a-firm-through-supply-chain-responsiveness-and-scm 2/294
UMI Number: 3264621
3264621
2007
Copyright 2007 by
Thatte, Ashish A.
UMI Microform
Copyright
All rights reserved. This microform edition is protected against
unauthorized copying under Title 17, United States Code.
ProQuest Information and Learning Company300 North Zeeb Road
P.O. Box 1346
Ann Arbor, MI 48106-1346
All rights reserved.
by ProQuest Information and Learning Company.

8/13/2019 Competitive_advantage of a Firm Through Supply Chain Responsiveness and SCM Practices
http://slidepdf.com/reader/full/competitiveadvantage-of-a-firm-through-supply-chain-responsiveness-and-scm 3/294
COPYRIGHT @ 2007
This document is copyrighted material. Under copyright law, no parts of the document
may be produced without the expressed permission of the author

8/13/2019 Competitive_advantage of a Firm Through Supply Chain Responsiveness and SCM Practices
http://slidepdf.com/reader/full/competitiveadvantage-of-a-firm-through-supply-chain-responsiveness-and-scm 4/294
Committee Members,
Signature Date of Signature
Dr. Anthony C. Koh
Associate Professor of Marketing
and International BusinessCollege of Business Administration
The University of Toledo
Dr. Robert A. Bennett
Professor of Mechanical,Industrial and Manufacturing Engineering
The University of Toledo
iii
8/13/2019 Competitive_advantage of a Firm Through Supply Chain Responsiveness and SCM Practices
http://slidepdf.com/reader/full/competitiveadvantage-of-a-firm-through-supply-chain-responsiveness-and-scm 5/294
An Abstract of
Competitive Advantage of a Firm through Supply Chain Responsiveness and SCM
Practices
Ashish A. Thatte
Submitted as partial fulfillment of the requirements for
the Doctor of Philosophy degree in
Manufacturing Management
The University of Toledo
May 2007
Today’s business environment is more global and competitive than it has been in
the past. The modern business is characterized with shorter product life cycles, rapid new
product introductions, increasingly knowledgeable, well informed, and sophisticated
customers. This forces supply chains to be more responsive. The modern supply chains
are thus expected to respond rapidly, effectively, and efficiently to changes in the
marketplace so as to sustain, and furthermore create competitive advantage. Most studies
so far have focused on the organizational level manufacturing flexibility or agility. It is
therefore of interest to study the responsiveness of supply chains.
This research studies the impact of various supply chain management (SCM)
practices - external to the organization - and modularity based manufacturing practices -
within the organization - on supply chain responsiveness. The study, further investigates
the dimensions of supply chain responsiveness through an extensive literature review. It
iv
8/13/2019 Competitive_advantage of a Firm Through Supply Chain Responsiveness and SCM Practices
http://slidepdf.com/reader/full/competitiveadvantage-of-a-firm-through-supply-chain-responsiveness-and-scm 6/294
develops a reliable and valid instrument for the supply chain responsiveness construct,
which will be beneficial for both practitioners and academicians. The study also assesses
the impact of supply chain responsiveness on the outcome variable - competitive
advantage - of the firm.
The large scale web-based survey yielded 294 responses from industry
professionals in the manufacturing and supply chain area. The data collected was put
through rigorous statistical analysis to test for content, construct, and criterion-related
validity, as well as reliability analyses. Further a structural equation model was developed
to test the relationships between SCM practices, modularity based manufacturing
practices, supply chain responsiveness, and competitive advantage. In addition, rigorous
regression analyses and MANOVA were performed to analyze the effects of various
relationships at the sub-construct level as well as item level.
The research findings supported the hypotheses that SCM practices positively
impact supply chain responsiveness, modularity based manufacturing practices are
positively associated with supply chain responsiveness, supply chain responsiveness
positively impacts competitive advantage of a firm, and SCM practices are positively
associated with competitive advantage of a firm.
The research also found that ‘dynamic teaming’ and ‘process modularity’
practices were most influential in increasing operations system responsiveness, supplier
network responsiveness, and the overall supply chain responsiveness. Further, effective
relationships with customers and suppliers were found to positively influence a firm’s
ability to be operationally responsive. In addition, effective relations with suppliers, and
information sharing with trading partners in a supply chain were found to directly and
v
8/13/2019 Competitive_advantage of a Firm Through Supply Chain Responsiveness and SCM Practices
http://slidepdf.com/reader/full/competitiveadvantage-of-a-firm-through-supply-chain-responsiveness-and-scm 7/294
positively lead to increased supplier network responsiveness. Furthermore, customer
relationship and strategic supplier partnership practices, and operations system
responsiveness and supplier network responsiveness were most influential in increasing
the overall competitive advantage of a firm. The study found that higher level of
operations system responsiveness creates higher level of competitive advantage for a
firm, collectively based on low price, high delivery dependability, high product
innovation, and low time to market, as well as individually on each of the said
dimensions. Also, it was uncovered that higher level of supplier network responsiveness
creates higher level of competitive advantage for a firm, collectively based low price and
high delivery dependability as well as individually on each of the said dimensions.
The research also uncovered the critical and specific practices (at the item level)
that increase supply chain responsiveness. Furthermore, the study uncovered the specific
SCM practices and supply chain responsiveness criteria that increase competitive
advantage of a firm.
This research has some important implications for practitioners. This research
provides suitable recommendations on the scope for improvement based on current levels
of various specific SCM and modularity based manufacturing practices that directly
impact supply chain responsiveness and its dimensions. Also the study provides suitable
recommendations on the scope for improvement based on current levels of various
predominant SCM practices and supply chain responsiveness criteria that directly impact
competitive advantage of a firm, so as to make the organizations more competitive.
vi

8/13/2019 Competitive_advantage of a Firm Through Supply Chain Responsiveness and SCM Practices
http://slidepdf.com/reader/full/competitiveadvantage-of-a-firm-through-supply-chain-responsiveness-and-scm 8/294
ACKNOWLEDGEMENTS
Through the entire process of completing my dissertation, I had incredible support
and help from many people, and to whom I would like to express my deep gratitude.
First, I would like to express my whole hearted and sincere gratitude to Dr. S.
Subba Rao and Dr. T.S. Ragu-Nathan, the co-chairs of my dissertation committee, for
their guidance, time, and patience for supporting me and this dissertation during every
stage of its development. They have helped me to shape the research model and improve
my ability in conducting empirical research. They showed concern for my academic
success and personal well-being as a person. Working with them has been a pleasant and
fruitful experience. I hope to continue our long-term relationship. I would also like to
thank Dr. Anthony Koh and Dr. Robert Bennett for their timely feedback and valuable
comments they provided by serving on my committee.
I am thankful to my colleagues Dr. Shahnawaz Muhammed, Parag Dhumal, and
Dr. Vikas Agrawal for their invaluable and timely help during various stages of this
dissertation, and my doctoral studies. I am grateful to Margaret Diehl (Maggie) for her
immense help with setting up the web-survey, and also Dr. Thawatchai Jitpaiboon (Chai)
for his assistance in showing me how to use the AMOS software.
I am grateful to the 294 respondents who responded to my survey and made the
process of data collection speedier. I also want to thank Dr. Udayan Nandkeolyar, Dr.
William Doll, Dr. Mark Vonderembse, and other faculty members who were very
supportive and valuable sources of knowledge and experience throughout the PhD
program.
vii

8/13/2019 Competitive_advantage of a Firm Through Supply Chain Responsiveness and SCM Practices
http://slidepdf.com/reader/full/competitiveadvantage-of-a-firm-through-supply-chain-responsiveness-and-scm 9/294
My deep appreciation is extended to Dr. Dothang Truong, Dr. Gioconda Quesada,
Dr. Suhong Li, Dr. Ying Liao, Dr. Charles Apigian and others for sharing with me their
valuable experiences and information on conducting research.
I am especially grateful to Preeti – my wife – for being supportive and considerate
in all the stages of this dissertation; and my mother (aai), my father (pappa), and my sister
(Aarti) for their love, encouragement, and support.
Lastly and equally importantly I am deeply obliged, grateful, and indebted to my
guru (Limaye Kaka) for his constant support, guidance, belief, and vision. It was his
constant direction during difficult and uncertain times that has got me this far. I dedicate
this dissertation to Limaye Kaka, my wife Preeti, my parents, and my sister.
viii

8/13/2019 Competitive_advantage of a Firm Through Supply Chain Responsiveness and SCM Practices
http://slidepdf.com/reader/full/competitiveadvantage-of-a-firm-through-supply-chain-responsiveness-and-scm 10/294
TABLE OF CONTENTS
ABSTRACT..............................................................................................................iv
ACKNOWLEDGEMENTS ...................................................................................vii
TABLE OF CONTENTS ........................................................................................ix
LIST OF TABLES...................................................................................................xiii
LIST OF FIGURES .................................................................................................xvi
LIST OF APPENDICES .........................................................................................xvii
CHAPTER 1: INTRODUCTION........................................................................1
CHAPTER 2: LITERATURE REVIEW ...........................................................7
2.1 Supply Chain Management.........................................................................7
2.2 SCM Practices.............................................................................................14
2.3 Modularity-Based Manufacturing Practices ...............................................222.4 Supply Chain Responsiveness ....................................................................32
2.5 Competitive Advantage ..............................................................................42
CHAPTER 3: THEORETICAL FRAMEWORK AND HYPOTHESISDEVELOPMENT.........................................................................47
3.1 Theoretical Framework...............................................................................473.2 Research Hypothesis 1 (SCM Practices and
Supply Chain Responsiveness) ..................................................................49
3.3 Research Hypothesis 2 (Modularity Based Manufacturing Practicesand Supply Chain Responsiveness) ............................................................55
3.4 Research Hypothesis 3 (Supply Chain Responsiveness and
Competitive Advantage) .............................................................................613.5 Research Hypothesis 4 (SCM Practices and Competitive Advantage) ......63
3.6 Research Hypothesis 5 (Modularity Based Manufacturing Practicesand Competitive Advantage) ......................................................................65
CHAPTER 4: INSTRUMENT DEVELOPMENT – ITEM
GENERATION AND PILOT TEST...........................................67
4.1 Item Generation and Structured Interview..................................................68
4.2 Scale Development: the Q-Sort Method.....................................................70
ix
8/13/2019 Competitive_advantage of a Firm Through Supply Chain Responsiveness and SCM Practices
http://slidepdf.com/reader/full/competitiveadvantage-of-a-firm-through-supply-chain-responsiveness-and-scm 11/294
4.2.1 Sorting Procedures ..........................................................................70
4.2.2 Inter-Rater Reliabilities...................................................................714.2.3 Results of First Sorting Round........................................................72
4.2.4 Results of Second Sorting Round ...................................................76
CHAPTER 5: LARGE-SCALE SURVEY ANDINSTRUMENT VALIDATION ..................................................79
5.1 Large-scale Data Collection Methodology .................................................795.2 Sample Characteristics of the Respondents and Organizations .................81
5.2.1 Sample Characteristics of Respondents ..........................................81
5.2.2 Sample Characteristics of Surveyed Organizations........................855.3 Between-Response Comparison .................................................................90
5.4 Structural Equation Modeling Methodology ..............................................93
5.5 Large-scale Instrument Assessment Methodology .....................................975.6 Large-scale Measurement Results ..............................................................103
5.6.1 Supply Chain Responsiveness ........................................................1045.6.2 SCM Practices – Reliability Analysis.............................................114
5.6.3 Modularity Based Manufacturing Practices – ReliabilityAnalysis...........................................................................................115
5.6.4 Competitive Advantage – Reliability Analysis...............................116
5.7 Validation of Second Order Construct........................................................1185.8 Construct-Level Correlation Analysis ........................................................121
CHAPTER 6: CAUSAL MODEL AND HYPOTHESES TESTING ...............123
6.1 Proposed Structural Model .........................................................................1246.2 Structural Model Testing Results................................................................125
6.2.1 Initial Structural Modeling Results................................................125
6.3 Discussion of Structural Modeling and HypothesesTesting Results............................................................................................130
6.4 Revised Structural Model ...........................................................................134
6.5 Summary of Results....................................................................................137
CHAPTER 7: DIMENSION LEVEL ANALYSIS .............................................138
7.1 Regression Analysis Results .......................................................................1407.1.1 Dimension-Level Analysis for Supply Chain Responsiveness.......140
7.1.1.1 MBMP (dimension level) – Supply Chain
Responsiveness (composite score)...................................1407.1.1.2 SCM Practices (dimension level) – Supply Chain
Responsiveness (composite score)...................................142
7.1.1.3 MBMP (dimension level) – Supply Chain
Responsiveness (dimension level) ...................................1437.1.1.4 SCM Practices (dimension level) – Supply Chain
Responsiveness (dimension level) ...................................146
x
8/13/2019 Competitive_advantage of a Firm Through Supply Chain Responsiveness and SCM Practices
http://slidepdf.com/reader/full/competitiveadvantage-of-a-firm-through-supply-chain-responsiveness-and-scm 12/294
7.1.2 Item-Level Analysis for Supply Chain Responsiveness.................1497.1.2.1 MBMP (item level) – Supply Chain
Responsiveness (composite score)...................................149
7.1.2.2 SCM Practices (item level) – Supply Chain
Responsiveness (composite score)...................................1517.1.2.3 MBMP (item level) – Supply Chain
Responsiveness (dimension level) ...................................155
7.1.2.4 SCM Practices (item level) – Supply ChainResponsiveness (dimension level) ...................................158
7.1.3 Dimension-Level Analysis for Competitive Advantage.................162
7.1.3.1 SCM Practices (dimension level) –Competitive Advantage (composite score)......................162
7.1.3.2 Supply Chain Responsiveness (dimension level) –
Competitive Advantage (composite score)......................1647.1.3.3 SCM Practices (dimension level) –
Competitive Advantage (dimension level) ......................1657.1.3.4 Supply Chain Responsiveness (dimension level) –
Competitive Advantage (dimension level) ......................1687.1.4 Item-Level Analysis for Competitive Advantage ...........................172
7.1.4.1 SCM Practices (item level) – Competitive Advantage
(composite score)............................................................1727.1.4.2 Supply Chain Responsiveness (item level) –
Competitive Advantage (composite score)......................174
7.1.4.3 SCM Practices (item level) – Competitive Advantage(dimension level) .............................................................176
7.1.4.4 Supply Chain Responsiveness (item level) –Competitive Advantage (dimension level) ......................177
7.2 Summary of Regression Analysis Results ..................................................179
7.2.1 Summary of Results for Supply Chain Responsiveness .................1797.2.2 Summary of Results for Competitive Advantage ...........................186
7.3 MANOVA Results......................................................................................191
7.3.1 Effect of Operations System Responsiveness on
Competitive Advantage ..................................................................1977.3.2 Effect of Supplier Network Responsiveness on
Competitive Advantage ..................................................................204
7.4 Summary of MANOVA Results.................................................................210
CHAPTER 8: SUMMARY AND RECOMMENDATIONS
FOR FUTURE RESEARCH .......................................................211
8.1 Summary of Findings..................................................................................211
8.1.1 Valid and Reliable Instrument for Supply Chain
Responsiveness Measurement ........................................................2128.1.2 Theoretical Framework...................................................................213
8.1.3 Tested Relationships at Construct Level.........................................213
xi

8/13/2019 Competitive_advantage of a Firm Through Supply Chain Responsiveness and SCM Practices
http://slidepdf.com/reader/full/competitiveadvantage-of-a-firm-through-supply-chain-responsiveness-and-scm 13/294
8.1.4 Tested Relationships between Practices and
Supply Chain Responsiveness at Dimension Level........................2148.1.5 Tested Relationships between Practices and
Supply Chain Responsiveness at Item Level..................................215
8.1.6 Tested Relationships between Practices / SCR and
Competitive Advantage at Dimension Level..................................2168.1.7 Tested Relationships between Practices / SCR and
Competitive Advantage at Item Level ............................................217
8.1.8 Dimension Level Analyses for Competitive Advantage forHigh and Low Levels of Supply Chain Responsiveness ................218
8.2 Implication for Practitioners .......................................................................219
8.3 Implication for Researchers ........................................................................2248.4 Limitations of the Research ........................................................................225
8.5 Recommendations for Future Research ......................................................227
REFERENCES.........................................................................................................230
xii

8/13/2019 Competitive_advantage of a Firm Through Supply Chain Responsiveness and SCM Practices
http://slidepdf.com/reader/full/competitiveadvantage-of-a-firm-through-supply-chain-responsiveness-and-scm 14/294
LIST OF TABLES
Table 2.1.1 Construct Definitions and Literature Support....................................13
Table 2.2.1 List of Sub-constructs for SCM Practices..........................................16
Table 2.3.1 List of Sub-constructs for Modularity Based Manufacturing Practices ...................................................................27
Table 2.4.1 List of Sub-constructs for Supply Chain Responsiveness .................37
Table 2.5.1 List of Sub-constructs for Competitive Advantage ...........................45Table 4.2.3.1 Inter-Judge Raw Agreement Scores: First Sorting Round.................73
Table 4.2.3.2 Items Placement Ratios: First Sorting Round....................................74
Table 4.2.3.3 Inter-Judge Agreements .....................................................................74Table 4.2.4.1 Inter-Judge Raw Agreement Scores: Second Sorting Round ............76
Table 4.2.4.2 Items Placement Ratios: Second Sorting Round ...............................77
Table 5.2.1.1 Characteristics of the Respondents ....................................................83Table 5.2.2.1 Characteristics of the Surveyed Organizations ..................................87
Table 5.3.1 Comparison between First Wave and Second/Third Wave ...............91Table 5.3.2 Comparison between First, Second, and Third Wave........................92
Table 5.4.1 Standardized Structural Coefficient and % Variation Explained ......97Table 5.6.1.1 Model Fit Indices for Supply Chain Responsiveness ........................110
Table 5.6.1.2 Discriminant Validity for Supply Chain Responsiveness..................111
Table 5.6.1.3 Reliability Analysis for Supply Chain Responsiveness.....................112Table 5.6.1.4 Supply Chain Responsiveness – Final Construct
Measurement Items............................................................................113
Table 5.6.2.1 Reliability Analysis for SCM Practices .............................................114Table 5.6.3.1 Reliability Analysis for Modularity Based
Manufacturing Practices ....................................................................116Table 5.6.4.1 Reliability Analysis for Competitive Advantage...............................117
Table 5.7.1 Goodness of Fit Indices for First and Second Order Model for
Supply Chain Responsiveness ...........................................................120Table 5.8.1 Construct Level Correlation Analysis................................................122
Table 6.2.1 Initial AMOS Structural Modeling Results .......................................129
Table 6.4.1 Revised Structural Modeling Results.................................................135
Table 7.1.1.1 Model Summary for MBMP Dimensions on SCR ............................141Table 7.1.1.2 Coefficients for MBMP Dimensions (DT and PRM) on SCR ..........141
Table 7.1.1.3 Model Summary for SCMP Dimensions on SCR .............................142
Table 7.1.1.4 Coefficients for SCMP Dimensions (IS, SSP, and CR) on SCR.......142Table 7.1.1.5 Model Summary for MBMP Dimensions on OSR............................143
Table 7.1.1.6 Coefficients for MBMP Dimensions (DT and PRM) on OSR..........143
Table 7.1.1.7 Model Summary for MBMP Dimensions on LPR ............................144Table 7.1.1.8 Model Summary for MBMP Dimensions on SNR............................145
Table 7.1.1.9 Coefficients for MBMP Dimensions (PRM and DT) on SNR..........145
Table 7.1.1.10 Model Summary for SCMP Dimensions on OSR .............................147
Table 7.1.1.11 Coefficients for SCMP Dimensions (CR and SSP) on OSR .............147Table 7.1.1.12 Model Summary for SCMP Dimensions on LPR..............................147
xiii
8/13/2019 Competitive_advantage of a Firm Through Supply Chain Responsiveness and SCM Practices
http://slidepdf.com/reader/full/competitiveadvantage-of-a-firm-through-supply-chain-responsiveness-and-scm 15/294
Table 7.1.1.13 Model Summary for SCMP Dimensions on SNR .............................148
Table 7.1.1.14 Coefficients for SCMP Dimensions (SSP and IS) on SNR ...............148Table 7.1.2.1 Model Summary for DT Items on SCR .............................................149
Table 7.1.2.2 Coefficients for DT Items (DT3 and DT1) on SCR ..........................150
Table 7.1.2.3 Model Summary for PRM Items on SCR..........................................150
Table 7.1.2.4 Coefficients for PRM Items (PRM2 and PRM5) on SCR.................151Table 7.1.2.5 Model Summary for IS Items on SCR...............................................151
Table 7.1.2.6 Coefficients for IS Items (IS1 and IS3) on SCR................................152
Table 7.1.2.7 Model Summary for SSP Items on SCR............................................152Table 7.1.2.8 Coefficients for SSP Items (SSP4, SSP2, and SSP6) on SCR...........153
Table 7.1.2.9 Model Summary for CR Items on SCR .............................................153
Table 7.1.2.10 Coefficients for CR Items (CR4 and CR2) on SCR ..........................154Table 7.1.2.11 Model Summary for DT Items on OSR.............................................155
Table 7.1.2.12 Coefficients for DT Items (DT3 and DT5) on OSR ..........................155
Table 7.1.2.13 Model Summary for PRM Items on OSR..........................................156Table 7.1.2.14 Coefficients for PRM Items (PRM3 and PRM1) on OSR.................156
Table 7.1.2.15 Model Summary for PRM Items on SNR..........................................157Table 7.1.2.16 Coefficients for PRM Items (PRM5 and PRM2) on SNR.................157
Table 7.1.2.17 Model Summary for DT Items on SNR.............................................158Table 7.1.2.18 Model Summary for CR Items on OSR.............................................159
Table 7.1.2.19 Model Summary for SSP Items on OSR ...........................................159
Table 7.1.2.20 Model Summary for SSP Items on SNR ...........................................160Table 7.1.2.21 Coefficients for SSP Items (SSP2 and SSP6) on SNR ......................160
Table 7.1.2.22 Model Summary for IS Items on SNR...............................................161
Table 7.1.2.23 Coefficients for IS Items (IS1 and IS3) on SNR................................161Table 7.1.3.1 Model Summary for SCMP Dimensions on CA ...............................163
Table 7.1.3.2 Coefficients for SCMP Dimensions (CR and SSP) on CA ...............163Table 7.1.3.3 Model Summary for SCR Dimensions on CA...................................164
Table 7.1.3.4 Coefficients for SCR Dimensions (OSR and SNR) on CA ...............165
Table 7.1.3.5 Model Summary for SCMP Dimensions on Price.............................166Table 7.1.3.6 Model Summary for SCMP Dimensions on Quality .........................166
Table 7.1.3.7 Model Summary for SCMP Dimensions on
Delivery Dependability......................................................................167
Table 7.1.3.8 Model Summary for SCMP Dimensions on Product Innovation ......167Table 7.1.3.9 Model Summary for SCMP Dimensions on Time to Market ............168
Table 7.1.3.10 Model Summary for SCR Dimensions on Price................................169
Table 7.1.3.11 Model Summary for SCR Dimensions on Quality............................169Table 7.1.3.12 Model Summary for SCR Dimensions on
Delivery Dependability......................................................................170
Table 7.1.3.13 Coefficients for SCR Dimensions (SNR and OSR) onDelivery Dependability......................................................................170
Table 7.1.3.14 Model Summary for SCR Dimensions on Product Innovation .........171
Table 7.1.3.15 Model Summary for SCR Dimensions on Time to Market ...............171
Table 7.1.4.1 Model Summary for CR Items on CA ...............................................173Table 7.1.4.2 Coefficients for CR Items (CR5, CR4, and CR1) on CA..................173
Table 7.1.4.3 Model Summary for SSP Items on CA..............................................174
xiv

8/13/2019 Competitive_advantage of a Firm Through Supply Chain Responsiveness and SCM Practices
http://slidepdf.com/reader/full/competitiveadvantage-of-a-firm-through-supply-chain-responsiveness-and-scm 16/294
Table 7.1.4.4 Coefficients for SSP Items (SSP2 and SSP4) on CA ........................174
Table 7.1.4.5 Model Summary for OSR Items on CA.............................................175Table 7.1.4.6 Coefficients for OSR Items (OSR1) on CA.......................................175
Table 7.1.4.7 Model Summary for SNR Items on CA.............................................176
Table 7.1.4.8 Model Summary for SNR Items on Delivery Dependability.............177
Table 7.1.4.9 Coefficients for SNR Items (SNR6) on Delivery Dependability.......177Table 7.1.4.10 Model Summary for OSR Items on Delivery Dependability.............178
Table 7.1.4.11 Coefficients for OSR Items (OSR1) on Delivery Dependability.......178
Table 7.2.1.1 Summary of Regression Analyses Results for Supply ChainResponsiveness and its Dimensions...................................................179
Table 7.2.2.1 Summary of Regression Analyses Results for
Competitive Advantage and its Dimensions......................................187Table 7.3.1.1 Pearson Correlations for Competitive Advantage Dimensions .........198
Table 7.3.1.2 Box’s Test Operations System Responsiveness ................................199
Table 7.3.1.3 Multivariate Test of Significance forOperations System Responsiveness...................................................199
Table 7.3.1.4 ANOVA Summary Table forOperations Systems Responsiveness .................................................200
Table 7.3.1.5 Roy-Bargman Stepdown F Tests forOperations System Responsiveness...................................................202
Table 7.3.1.6 Means and Standard Deviations for Competitive Advantage
Dimensions by Operations System Responsiveness..........................204Table 7.3.2.1 Box’s Test of Equality of Covariance Matrices for
Supplier Network Responsiveness.....................................................205
Table 7.3.2.2 Multivariate Test of Significance forSupplier Network Responsiveness.....................................................206
Table 7.3.2.3 ANOVA Summary Table for Supplier Network Responsiveness.....207Table 7.3.2.4 Roy-Bargman Stepdown F Tests for
Supplier Network Responsiveness.....................................................208
Table 7.3.2.5 Means and Standard Deviations for Competitive AdvantageDimensions by Supplier Network Responsiveness ...........................209
Table 8.2.1 Scope for Improvement on Practice Levels Based on Means............221
Table 8.2.2 Scope for Improvement on Practice / Supply Chain
Responsiveness Criterion Levels Based on Means............................223
xv
8/13/2019 Competitive_advantage of a Firm Through Supply Chain Responsiveness and SCM Practices
http://slidepdf.com/reader/full/competitiveadvantage-of-a-firm-through-supply-chain-responsiveness-and-scm 17/294
LIST OF FIGURES
Figure 3.1 Theoretical Model..............................................................................49
Figure 5.2.1.1 Respondents by Job Title...................................................................83
Figure 5.2.1.2 Respondents by Job Function ............................................................84Figure 5.2.1.3 Respondents by Years Worked at the Organization ..........................84
Figure 5.2.2.1 Organizations by Primary Production System...................................88
Figure 5.2.2.2 Organizations by Industry (SIC Codes).............................................88Figure 5.2.2.3 Organizations by Number of Employees...........................................89
Figure 5.2.2.4 Organizations by Annual Sales .........................................................89
Figure 5.5.1 Sample First Order Model for T-coefficient Calculation ..................102Figure 5.5.2 Sample Second Order Model for T-coefficient Calculation ..............102
Figure 5.6.1.1 Initial Measurement Model for Operations System Responsiveness 105
Figure 5.6.1.2 Final Measurement Model for Operations System Responsiveness..106Figure 5.6.1.3 Initial Measurement Model for Logistics Process Responsiveness...107
Figure 5.6.1.4 Final Measurement Model for Logistics Process Responsiveness ....107Figure 5.6.1.5 Initial Measurement Model for Supplier Network Responsiveness ..108
Figure 5.6.1.6 Final Measurement Model for Supplier Network Responsiveness....109Figure 5.7.1 First-Order Measurement Model for Supply Chain Responsiveness 119
Figure 5.7.2 Second-Order Measurement Model for
Supply Chain Responsiveness ...........................................................120Figure 6.1 Theoretical Framework......................................................................125
Figure 6.2 Structural Model ................................................................................127
Figure 6.3 Path Analysis Results.........................................................................128Figure 6.4 Revised Path Analysis Results...........................................................136
xvi
8/13/2019 Competitive_advantage of a Firm Through Supply Chain Responsiveness and SCM Practices
http://slidepdf.com/reader/full/competitiveadvantage-of-a-firm-through-supply-chain-responsiveness-and-scm 18/294
LIST OF APPENDICES
APPENDIX A: MEASUREMENT ITEMS ENTERING Q-SORT.........................259
APPENDIX B: COHEN’S KAPPA AND MOORE AND BENBASATCOEFFICIENT...............................................................................260
APPENDIX C: MEASUREMENT ITEMS AFTER Q-SORT................................264
APPENDIX D: SAMPLE EMAILS FOR DATA COLLECTION
(COVER LETTER) ........................................................................265(FOLLOW-UP EMAIL) .................................................................266
APPENDIX E: LARGE-SCALE MAIL SURVEY QUESTIONNAIRE................267
APPENDIX F: ACRONYMS USED FOR CODING OF ITEMS .........................275
APPENDIX G: IRB FROM UNIVERSITY OF TOLEDO .....................................276
xvii

8/13/2019 Competitive_advantage of a Firm Through Supply Chain Responsiveness and SCM Practices
http://slidepdf.com/reader/full/competitiveadvantage-of-a-firm-through-supply-chain-responsiveness-and-scm 19/294
CHAPTER 1: INTRODUCTION
In the new global era successful firms are those that accurately anticipate market
trends and quickly respond to changing customer needs (Stalk et al., 1992). According to
Towill and Christopher (2002), the end customer in the marketplace determines the
success or failure of supply chains. They further state that “getting the right product, at
the right price, at the right time to the consumer is not only the linchpin to competitive
success but also the key to survival” (p. 299). Chase et al. (2000) contend that in the new
global era companies are forced to find flexible ways to meet customer demand. The
companies these days focus on optimizing their core activities so as to maximize the
speed of response to customer demand. With increasingly sophisticated customer demand
(product variety and customization) (Yang and Burns, 2003), and recent events of supply
disruptions (Lee, 2004; Christopher and Peck, 2004; Gosain et al., 2004), supply chains
have to be responsive to constantly changing market and business environment. It is thus
incumbent on managers and researchers to strive for a better understanding of the
responsiveness construct.
Today’s highly competitive environment in which the manufacturing firms
operate is characterized by growing world competition and increasingly demanding
customers (Rich and Hines, 1997). Sparks and Fernie (1998) and Jones (2002) state that
these dynamics are especially observed in the fashion and clothing retail industry (as
cited in Storey et al., 2005, p. 242). Further, as the new competitive environment changes
1

8/13/2019 Competitive_advantage of a Firm Through Supply Chain Responsiveness and SCM Practices
http://slidepdf.com/reader/full/competitiveadvantage-of-a-firm-through-supply-chain-responsiveness-and-scm 20/294
to more global, technologically oriented and customer driven, as product life cycles
shrink and new products get introduced rapidly, as customers continually demand higher
quality, faster response, and greater reliability of products and services (D’ Souza, 2002),
the new world market demands a more customer responsive behavior by companies.
Womack and Jones (1996) argue that these pressures have fueled a continuous change
process within organizations, impacting all the areas of a business, from rapid
technological changes, to a much shortened product life cycle. They further state that
since the late 1990s change and uncertainty surrounding manufacturing organizations and
their supply chains grew. Firms have responded with innovative products and improved
manufacturing processes to manufacture products. Sabath (1998) argues that supply
chains need to be managed in a way that enables quick response, so as to cope with
volatile demand. The underlying factor is the need to focus on time, flexibility, and speed
of response of the supply chain to succeed in this increasingly global marketplace thereby
creating competitive advantage for the firm (Stalk and Hout, 1990; Vokurka and
O’Leary-Kelly, 2000; D’ Souza and Williams, 2000; Suarez et al., 1995; Duclos et al.,
2003; Gattorna, 1998; Pine, 1993; Goldman et al., 1995; Christopher, 1998). Vokurka
and Fliedner (1998) suggest that this new environment calls for organizations to be more
responsive to customer needs. Supply chain flexibility refers to the ability of the supply
chain to adapt to internal or external influences, whereas supply chain responsiveness is
the ability of the supply chain to rapidly address (speed combined with flexibility)
changes and requests in the marketplace. Thus modern supply chains are expected to
respond rapidly, effectively, and efficiently to customer demand (Towill, 1996; Duclos et
al., 2003) so as to create competitive advantage in terms of increased quality, lower costs,
2

8/13/2019 Competitive_advantage of a Firm Through Supply Chain Responsiveness and SCM Practices
http://slidepdf.com/reader/full/competitiveadvantage-of-a-firm-through-supply-chain-responsiveness-and-scm 21/294
reduced time to market, and product innovation (Henke et al., 1993; Aquilano et al.,
1995). Narasimhan and Das (1999) concur by proposing that in the late 20th
century,
firms in the pursuit of competitive differentiation consider cost and quality as market
entry qualifiers, whereas responsiveness and lean manufacturing are considered as order
winners.
Most studies so far have focused on the organizational level manufacturing
flexibility or agility. It is widely argued that competition is no longer between individual
organizations but between supply chains (Christopher, 1992; Li et al., 2005; Vastag et al.,
1994; Christopher and Peck, 2004; Academic Alliance Forum, 1999; Pelton et al., 1997).
Lummus and Vokurka (1999) state that successful companies are those that manage
across all nodes of the supply chain from their supplier’s supplier to their customer’s
customer. It is therefore of interest to study the responsiveness of a group of
organizations working together or widely called as supply chain.
Supply chain responsiveness literature is highly normative and conceptual with
research studies primarily being based on case studies (Holweg, 2005; Storey et al.,
2005), with little empirical research in the field of supply chain responsiveness. With this
said the empirical study of supply chain responsiveness is very much called for. Since the
significance of supply chain responsiveness in today’s business world is presented, it is
now of interest to understand what kinds of practices are called for within and between
organizations in order to achieve supply chain responsiveness. Numerous studies
emphasize the importance of integrating suppliers, manufacturers and customers
(Frohlich and Westbrook, 2001; Clinton and Closs, 1997) (i.e. supply chain management)
so as to attain flexibility and speed. It is expected that the current research, by addressing
3
8/13/2019 Competitive_advantage of a Firm Through Supply Chain Responsiveness and SCM Practices
http://slidepdf.com/reader/full/competitiveadvantage-of-a-firm-through-supply-chain-responsiveness-and-scm 22/294
SCM practices that contribute towards responsiveness, will help researchers better
understand the scope and activities associated with SCM that create enhanced levels of
supply chain responsiveness in today’s competitive marketplace, and which has not been
empirically tested in past studies. Further, as uncertainty in markets and technology
intensifies, more companies are adopting modular product and process architectures (i.e.
modularity based manufacturing practices) to cope with increasing demand uncertainty
(Tu et al., 2004). Modularity based manufacturing practices is defined as the application
of unit standardization or substitution principles to product design, production process
design and organizational design (Tu et al., 2004; Ulrich, 1995; Tu, 1999). Many
empirical questions regarding the managerial and organization implications of
modularity-based manufacturing are left unanswered (Ulrich, 1995). Thus it is of interest
to explore the influence of modularity-based manufacturing practices on a supply chain’s
ability to be responsive. Again, this has not been empirically tested before and would be
interesting to study.
This study thus aims at studying the effect of various supply chain management
(SCM) practices - external to the organization - and modularity based manufacturing
practices - within the organization – on supply chain responsiveness. This study therefore
aims at filling the gap in the literature on supply chain responsiveness by empirically
testing the effect of various practices between and within organizations, on the supply
chain responsiveness.
As it is of interest to study various factors on an outcome variable that is of
practical importance to businesses, competitive advantage is the one that is of prime
importance to survive and thrive in today’s high paced business environment. The study
4

8/13/2019 Competitive_advantage of a Firm Through Supply Chain Responsiveness and SCM Practices
http://slidepdf.com/reader/full/competitiveadvantage-of-a-firm-through-supply-chain-responsiveness-and-scm 23/294
thus also assesses the impact of supply chain responsiveness on the outcome variable -
competitive advantage - of the firm. The purpose of this study is therefore to empirically
test a framework identifying the relationships among SCM practices, modularity based
manufacturing practices, supply chain responsiveness, and competitive advantage.
This study builds the construct supply chain responsiveness based on prior
literature in: manufacturing and supply chain flexibility, manufacturing and supply chain
agility, and customer responsiveness. As in any empirical study, it will not be possible to
test a relationship without valid and reliable measurement instruments for the constructs
involved in the relationships. Therefore a contribution of the current research is the
development of a valid and reliable instrument for the supply chain responsiveness
construct. The measurement instruments for the SCM practices (Li et al., 2005, Li et al.,
2006), modularity based manufacturing practices (Tu et al., 2004), and competitive
advantage (Koufteros et al., 1997; Koufteros, 1995) in the proposed model are adopted
with modifications from earlier studies. The newly developed instruments are then tested
empirically, using data collected from respondents to a survey questionnaire. Structural
equation modeling is used to test the hypothesized relationships.
Further, by offering a validated instrument to measure supply chain
responsiveness, and by providing empirical evidence of the impact of SCM and
modularity based manufacturing practices on supply chain responsiveness and
competitive advantage, it is expected that this research will offer a useful guideline for
measuring and improving supply chain responsiveness and competitive advantage, thus
facilitating further research in this area.
5
8/13/2019 Competitive_advantage of a Firm Through Supply Chain Responsiveness and SCM Practices
http://slidepdf.com/reader/full/competitiveadvantage-of-a-firm-through-supply-chain-responsiveness-and-scm 24/294
The study is driven by the following research questions:
1. How do the SCM practices of a firm influence supply chain responsiveness?
2. How do modularity based manufacturing practices of a firm impact supply
chain responsiveness? and
3. How does supply chain responsiveness affect competitive advantage of a
firm?
The structure of this study is as follows: Chapter 2 is the literature review on the
theoretical foundation and various constructs of the study. The overall framework that
depicts the relationships between the constructs and the development of hypotheses are
presented in Chapter 3. The research methodology for generating items for measurement
instruments appears in Chapter 4. This methodology includes pre-testing with
practitioners and academicians, a pilot study using the Q sort method. Large-scale survey,
reliability, and validity results are reported in Chapter 5. In Chapter 6, the results of
hypotheses testing are shown, using structural equation modeling methodology. Chapter
7 includes detailed dimension level analyses (at sub-construct and item levels) to gain
ample insight into relationships between various practices, supply chain responsiveness,
and competitive advantage components. Finally, Chapter 8 concludes with the summary
of research findings and major contributions, implications for managers and researchers,
limitations of the research, and recommendations for future research.
6
8/13/2019 Competitive_advantage of a Firm Through Supply Chain Responsiveness and SCM Practices
http://slidepdf.com/reader/full/competitiveadvantage-of-a-firm-through-supply-chain-responsiveness-and-scm 25/294
CHAPTER 2: LITERATURE REVIEW
2.1 Supply Chain Management
The Council of Supply Chain Management Professionals (CSCMP) (2004),
(formerly The Council of Logistics Management (CLM)), a leading professional
organization promoting SCM practice, education, and development, defines SCM as:
“SCM encompasses the planning and management of all activities involved in sourcing
and procurement, conversion, and all logistics management activities, including
coordination and collaboration with suppliers, intermediaries, third-party service
providers, and customers” (Thus the supply chain encompasses all activities involved in
the production and delivery of a final product or service, from the supplier’s supplier to
the customer’s customer). In essence, supply chain management integrates supply and
demand management within and across companies (www.cscmp.org). CSCMP
emphasizes that SCM encompasses the management of supply and demand, sourcing of
raw materials and parts, manufacturing and assembly, warehousing and inventory
tracking, order entry and order management, and distribution and delivery to the
customer. Cooper et al. (1997) define SCM as the management and integration of the
entire set of business processes that provides products, services and information that add
value for customers.
Several authors have defined supply chain management. Christopher (1998), New
and Payne (1995), and Simchi-Levi et al. (2000) define supply chain
7
8/13/2019 Competitive_advantage of a Firm Through Supply Chain Responsiveness and SCM Practices
http://slidepdf.com/reader/full/competitiveadvantage-of-a-firm-through-supply-chain-responsiveness-and-scm 26/294
management as “the integration of key business processes among a network of
interdependent suppliers, manufacturers, distribution centers, and retailers in order to
improve the flow of goods, services, and information from original suppliers to final
customers, with the objectives of reducing system-wide costs while maintaining required
service levels” (as cited in Stapleton et al., 2006, p. 108). The Global Supply Chain
Forum (GSCF) defines supply chain management as “the integration of key business
processes from end user through original suppliers, that provides products, services, and
information that adds value for customers and other stakeholders” (as cited in Lambert et
al., 1998, p. 1). The APICS dictionary (1995) describes SCM as – “the processes from
initial raw materials to the ultimate consumption of the finished product, linking across
supplier-user companies”.
A supply chain is a network of organizations performing various processes and
activities to produce value in the form of products and services for the end customer
(Christopher, 1992). SCM concerns the integrated and process-oriented approach to the
design, management and control of the supply chain, with the aim of producing value for
the end customer, by both improving customer service and lowering cost (Bowersox and
Closs, 1996; Giannoccaro and Pontrandolfo, 2002).
Lummus and Vokurka (1999) summarize SCM as “all the activities involved in
delivering a product from raw material through to the customer, including sourcing raw
materials and parts, manufacturing and assembly, warehousing and inventory tracking,
order entry and order management, distribution across all channels, delivery to the
customer, and the information systems necessary to monitor all of these activities” (p.
11).
8

8/13/2019 Competitive_advantage of a Firm Through Supply Chain Responsiveness and SCM Practices
http://slidepdf.com/reader/full/competitiveadvantage-of-a-firm-through-supply-chain-responsiveness-and-scm 27/294
According to Li et al. (2006) the dual purpose of SCM is to improve the
performance of an individual organization as well as that of the entire supply chain. CLM
definitions clearly establish that SCM is more broadly conceived than merely "logistics
outside the firm" (Lambert, 2004; Lambert et al., 1998, p. 2). Recent research supports
this conception, portraying SCM as a strategic level concept (Stank et al., 2005). Mentzer
et al. (2001) consider SCM as a systemic, strategic coordination of business functions
within an organization and between organizations within the supply chain, for improving
the long-term performance of individual companies and the supply chain as a whole. The
emphasis of each of these definitions is on the objective of SCM to create a distinctive
advantage by maximizing the total value of products and services (Stank et al., 2005).
SCM is a discipline in the early stages of evolution (Gibson et al., 2005). SCM
gives a concrete form to the so called “business ecosystem idea” and provides a
framework of processes for firms to engage in co-existence rather than competition
(Bechtel and Jayaram, 1997). Consultants proposed the term and educators proposed the
structure and theory for executing SCM. The term "supply chain management" first
appeared in 1982. Around 1990, academics first described SCM from a theoretical point
of view to clarify the difference from more traditional approaches and names (such as
logistics), to managing material flow and the associated information flow (Cooper et al.,
1997). Cooper et al. (1997) provide a valuable review of 13 early SCM definitions: a
solid argument that SCM and logistics are not identical. The term supply chain
management has grown in popularity over the past two decades, with much research
being done on the topic. SCM is widely being talked about in various journals and
9
8/13/2019 Competitive_advantage of a Firm Through Supply Chain Responsiveness and SCM Practices
http://slidepdf.com/reader/full/competitiveadvantage-of-a-firm-through-supply-chain-responsiveness-and-scm 28/294
magazines related to manufacturing, distribution, marketing, customer management, or
transportation (Ross, 1998).
Furthermore, Lummus and Vokurka (1999) add that SCM links all the
departments within an organization as well as all its trading partners (viz: suppliers,
customers, 3PL providers, and information systems providers). There is mutual
collaboration and companies work together to make the whole supply chain competitive.
Information technology is widely used to share information and generate demand
forecasts. The underlying idea in SCM is that the entire process must be viewed as a
single system. The core competencies of individual organizations are determined and are
cashed on, to create enhanced competitive advantage for the supply chain.
By the 1990s, firms recognized the necessity of collaboration with suppliers and
customers in order to create superior customer value. This movement titled supply chain
management or value chain management shifted a company’s focus from within an
enterprise to managing across firm boundaries.
Boddy et al. (1998) found that more than half of the respondents to their survey
considered that their organizations had not been successful in implementing supply chain
partnering; Spekman et al. (1998), noted that 60% of supply chain alliances tended to fail.
Deloitte Consulting survey reported that only 2% of North American manufacturers
ranked their supply chains as world class although 91% of them ranked SCM as
important to their firm’s success (Thomas, 1999). Thus, while it is clear that SCM is
important to organizations, effective management of the supply chain does not appear to
have been realized.
10

8/13/2019 Competitive_advantage of a Firm Through Supply Chain Responsiveness and SCM Practices
http://slidepdf.com/reader/full/competitiveadvantage-of-a-firm-through-supply-chain-responsiveness-and-scm 29/294
Bowersox and Closs (1996) argued that to be fully effective in today's
competitive environment, firms must expand their integrated behavior to incorporate
customers and suppliers. This extension of integrated behaviors, through external
integration, is referred to by Bowersox and Closs (1996) as supply chain management. In
this context, the philosophy of SCM turns into the implementation of supply chain
management: a set of activities that carries out the philosophy. This set of activities is a
coordinated effort called SCM between the supply chain partners, such as suppliers,
carriers, and manufacturers, to dynamically respond to the needs of the end customer
(Greene, 1991).
Thus SCM integrates both information flow and the flow of goods seamlessly
between trading partners as an effective competitive weapon (Childhouse and Towill,
2003; Feldmann and Muller, 2003). SCM has been receiving increased attention from all
fronts, namely academicians, consultants, and business managers (Tan et al., 2002;
Croom et al., 2000; Van Hoek, 1998) since the early 1990s. Organizations have
recognized that SCM is the key to building sustainable competitive edge (Jones, 1998) in
the 21st century. SCM has been widely talked about in prior literature from various
viewpoints (Croom et al., 2000) such as purchasing, logistics/distribution/transportation,
operations and manufacturing management, organizational behavior, and management
information systems. Industrial organization and transaction cost analysis (Ellram, 1990;
Williamson, 1975), resource-based and resource-dependency theory (Rungtusanatham et
al., 2003), competitive strategy (Porter, 1985), and social–political perspective (Stern and
Reve, 1980) are some of the aspects of SCM that have been discussed in past literature.
However, in spite of the increased attention paid to SCM, the literature has not made a
11
8/13/2019 Competitive_advantage of a Firm Through Supply Chain Responsiveness and SCM Practices
http://slidepdf.com/reader/full/competitiveadvantage-of-a-firm-through-supply-chain-responsiveness-and-scm 30/294
significant contribution to aid the practice of SCM (Cigolini et al., 2004) and to respond
to environmental uncertainty on supply and demand sides of the supply chain. Due to its
interdisciplinary origin and evolutionary nature, there is no generally accepted definition
of SCM in literature (Feldmann and Muller, 2003).
The concept of SCM has been studied from two perspectives, namely purchasing
(supply management), and logistics (transportation, distribution, warehousing, and
inventory management) (Tan et al., 1998). According to the purchasing perspective, SCM
is synonymous with supplier integration and has evolved from traditional purchasing and
materials functions (Banfield, 1999; Lamming, 1993). From the logistics management
perspective, SCM is synonymous with distribution, logistics, inventory management, and
customer relationships (Alvarado and Kotzab, 2001; Bechtel and Jayaram, 1997; Romano
and Vinelli, 2001; Rudberg and Olhager, 2003; Van Hoek, 1998). In due course, these
two perspectives evolved into one single philosophy of SCM with integrated systems,
processes, and practices between trading partners.
To better understand the influence of SCM practices and modularity based
manufacturing practices on supply chain responsiveness, and the effect of supply chain
responsiveness on competitive advantage, four constructs have been identified through a
comprehensive literature review. A research framework is then developed that depicts the
various causal relationships between these constructs.
The four proposed constructs in the model include: 1) SCM Practices: “A set of
activities undertaken by an organization to promote effective management of its supply
chain” (Li et al., 2006, p. 108); 2) Modularity Based Manufacturing Practices: The
application of unit standardization or substitution principles to product design, production
12
8/13/2019 Competitive_advantage of a Firm Through Supply Chain Responsiveness and SCM Practices
http://slidepdf.com/reader/full/competitiveadvantage-of-a-firm-through-supply-chain-responsiveness-and-scm 31/294
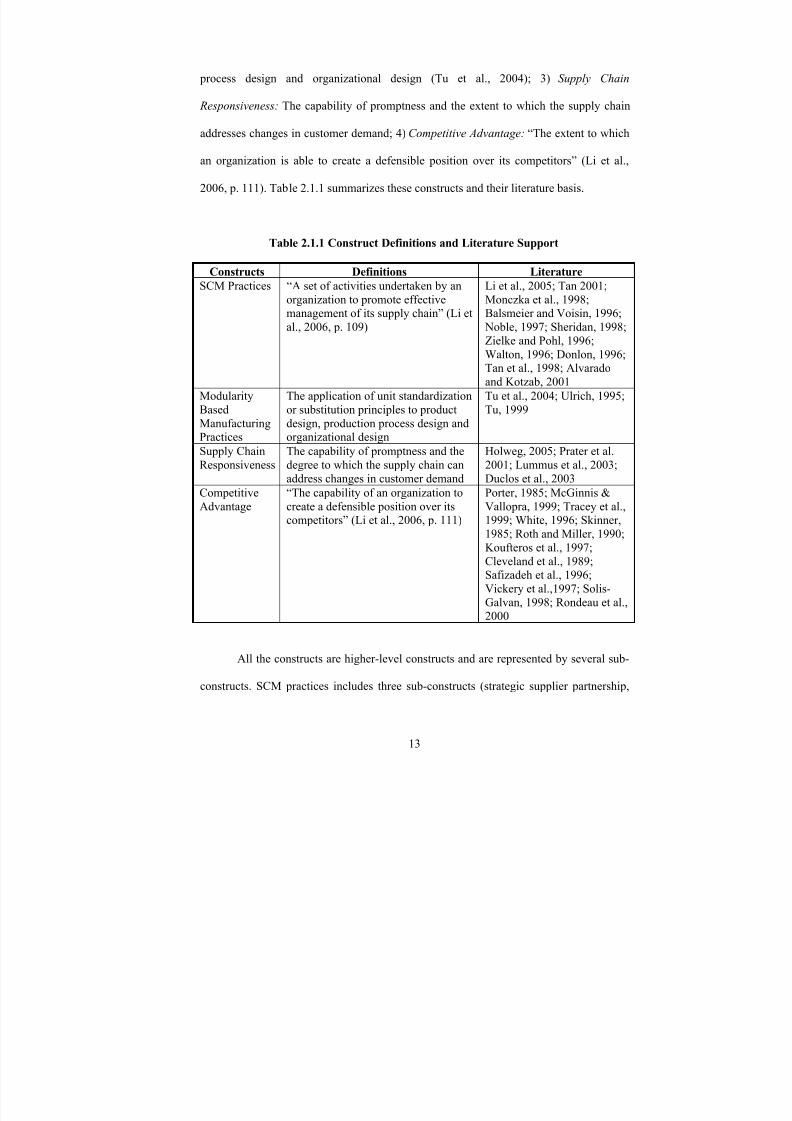
process design and organizational design (Tu et al., 2004); 3) Supply Chain
Responsiveness: The capability of promptness and the extent to which the supply chain
addresses changes in customer demand; 4) Competitive Advantage: “The extent to which
an organization is able to create a defensible position over its competitors” (Li et al.,
2006, p. 111). Table 2.1.1 summarizes these constructs and their literature basis.
Table 2.1.1 Construct Definitions and Literature Support
Constructs Definitions Literature
SCM Practices “A set of activities undertaken by an
organization to promote effectivemanagement of its supply chain” (Li et
al., 2006, p. 109)
Li et al., 2005; Tan 2001;
Monczka et al., 1998;Balsmeier and Voisin, 1996;
Noble, 1997; Sheridan, 1998;
Zielke and Pohl, 1996;
Walton, 1996; Donlon, 1996;Tan et al., 1998; Alvarado
and Kotzab, 2001
Modularity
Based
ManufacturingPractices
The application of unit standardization
or substitution principles to product
design, production process design andorganizational design
Tu et al., 2004; Ulrich, 1995;
Tu, 1999
Supply ChainResponsiveness
The capability of promptness and thedegree to which the supply chain can
address changes in customer demand
Holweg, 2005; Prater et al.2001; Lummus et al., 2003;
Duclos et al., 2003
Competitive
Advantage
“The capability of an organization to
create a defensible position over itscompetitors” (Li et al., 2006, p. 111)
Porter, 1985; McGinnis &
Vallopra, 1999; Tracey et al.,1999; White, 1996; Skinner,
1985; Roth and Miller, 1990;
Koufteros et al., 1997;
Cleveland et al., 1989;Safizadeh et al., 1996;
Vickery et al.,1997; Solis-
Galvan, 1998; Rondeau et al.,2000
All the constructs are higher-level constructs and are represented by several sub-
constructs. SCM practices includes three sub-constructs (strategic supplier partnership,
13
8/13/2019 Competitive_advantage of a Firm Through Supply Chain Responsiveness and SCM Practices
http://slidepdf.com/reader/full/competitiveadvantage-of-a-firm-through-supply-chain-responsiveness-and-scm 32/294
customer relationship, and information sharing; modularity based manufacturing
practices contains three sub-constructs (product modularity, process modularity, and
dynamic teaming); supply chain responsiveness comprises of (operations system
responsiveness, logistics process responsiveness, and supplier network responsiveness);
competitive advantage is represented by five sub-constructs (price, quality, delivery
dependability, time-to-market, and product innovation). For descriptive purpose, all of
them, including high-level constructs and sub constructs, are called constructs in later
discussion.
We first define and discuss these constructs. The following section will present a
detailed review of existing literature concerning each of the four constructs proposed
above. In the next chapter, five research hypotheses are then developed based on this
review.
2.2 SCM Practices
‘SCM practices’ is defined as “the set of activities undertaken by an organization
to promote effective management of its supply chain” (Li et al., 2006, p. 109).
Li et al. (2005, 2006) proposed ‘SCM practices’ as a multi-dimensional construct
that includes both upstream and downstream sides of the supply chain. Donlon (1996)
considered outsourcing, supplier partnership, information sharing, cycle time
compression, and continuous process flow, as SCM practices. Tan et al. (1998) used
quality, purchasing, and customer relations to represent SCM practices, in their empirical
study. Alvarado and Kotzab (2001) focused on inter-organizational system use, core
competencies, and elimination of excess inventory through postponement, as SCM
practices. Using factor analysis, Tan et al. (2002) identified: supply chain integration,
14
8/13/2019 Competitive_advantage of a Firm Through Supply Chain Responsiveness and SCM Practices
http://slidepdf.com/reader/full/competitiveadvantage-of-a-firm-through-supply-chain-responsiveness-and-scm 33/294
information sharing, customer service management, geographic proximity, and JIT
capability, as the key aspects of SCM practice. Lee (2004) in his case study based
research identified five practices at the supply chain level that are a key to creating
supply chain responsiveness. They are: outsourcing, strategic supplier partnerships,
customer relationships, information sharing, and product modularity. Chen and Paulraj
(2004) used long-term relationship, cross-functional teams, supplier base reduction, and
supplier involvement. Min and Mentzer (2004) identified long-term relationship,
information sharing, vision and goals, risk and award sharing, cooperation, process
integration, and supply chain leadership underlying the concept of SCM. Li et al. (2005,
2006) identified strategic supplier partnership, customer relationship, and information
sharing as key SCM practices. This study adopts the same practices (viz: strategic
supplier partnership, customer relationship, and information sharing) as sub-constructs
for the SCM practices construct. Li et al. (2005) developed a valid and reliable instrument
to measure SCM practices. The same instrument has been adopted in this study. Thus the
literature depicts SCM practices from different perspectives with a common goal of
improving organizational performance. In reviewing and consolidating the literature,
three distinct dimensions of SCM practice that are perceived to lead to supply chain
responsiveness, have been identified. These are strategic supplier partnership, customer
relationship, and information sharing.
This study aims at studying the effect of supply chain responsiveness on
competitive advantage of a firm by the implementation of a set of SCM practices - by an
organization.
15

8/13/2019 Competitive_advantage of a Firm Through Supply Chain Responsiveness and SCM Practices
http://slidepdf.com/reader/full/competitiveadvantage-of-a-firm-through-supply-chain-responsiveness-and-scm 34/294
SCM has been supported as a strategic level concept in prior literature (Bowersox
et al., 1999; Cooper et al., 1997; Mentzer, 2001), with a “multi-firm focus” on creating
competitive advantage “by maximizing the total value delivered to end-customers”
(Defee and Stank, 2005, p. 30). Supply chain responsiveness focuses on not just creating
value but maintaining the value or customer service level by being responsive to any
turbulence or uncertainty on both sides of the value chain (i.e. supply as well as demand).
This study focuses only on the customer side turbulence.
Table 2.2.1 lists the three dimensions of SCM practices along with their
definitions and supporting literature.
Table 2.2.1 List of Sub-Constructs for SCM Practices
Constructs Definitions Literature
StrategicSupplier
Partnership
“The long-term relationship betweenthe organization and its suppliers. It is
designed to leverage the strategic andoperational capabilities of individual
participating organizations to helpthem achieve significant ongoing benefits” (Li et al., 2006, p. 109)
Li et al., 2005; Gunasekaran et al.,2001; Balsmeier and Voisin,
1996; Monczka et al., 1998; Noble, 1997; Stuart, 1997;
Lamming, 1993; Sheridan, 1998;Tan et al., 2002
CustomerRelationship
“The entire array of practices that areemployed for the purpose of
managing customer complaints,
building long-term relationships withcustomers, and improving customer
satisfaction” (Li et al., 2006, p. 109)
Li et al., 2005; Moberg et al.,2002; Aggarwal, 1997; Claycomb
et al., 1999; Tan et al., 1998;
Wines, 1996; Noble, 1997;Magretta, 1998, Day, 2000
Information
Sharing
“The extent to which critical and
proprietary information iscommunicated to one’s supply chain
partner” (Li et al., 2006, p. 110)
Li et al., 2005; Monczka et al.,
1998; Mentzer et al., 2000b, Steinand Sweat, 1998, Yu et al., 2001;
Towill, 1997; Balsmeier andVoisin, 1996; Jones, 1998;
Lalonde, 1998; Vokurka and
Lummus, 2000; Lancioni et al.,2000; Ballou et al., 2000.
16
8/13/2019 Competitive_advantage of a Firm Through Supply Chain Responsiveness and SCM Practices
http://slidepdf.com/reader/full/competitiveadvantage-of-a-firm-through-supply-chain-responsiveness-and-scm 35/294
Strategic supplier partnership is defined as “the long term relationship between
the organization and its suppliers. It is designed to leverage the strategic and operational
capabilities of individual participating organizations to help them achieve significant
ongoing benefits” (Li et al., 2006, p. 109). Gunasekaran et al. (2001) assert that a
strategic partnership emphasizes long-term relationship between trading partners and
“promotes mutual planning and problem solving efforts” (as cited in Li et al., 2006, p.
109). Strategic partnerships between organizations promote shared benefits and ongoing
collaboration in key strategic areas like technology, products, and markets (Yoshino and
Rangan, 1995). Strategic partnerships with suppliers facilitate organizations to work
closely and effectively with a few suppliers rather than many suppliers that have been
selected solely on the basis of cost. Some of the advantages of including suppliers early
in the product-design process as mentioned by Tan et al. (2002) are that suppliers can
offer cost effective design alternatives, assist in selecting better components and
technologies, and aid in design assessment.
Porter (1980) suggested that co-operation can enable partners to achieve a
stronger position together than they can alone.
Globalization (includes global sourcing) has forced companies to manage their
supply, manufacturing, and logistics more effectively. Mentzer et al. (2001) suggests that
the key to effective management in the global environment is to have closer relationships
with suppliers. Cooperation among the supply chain members is required for effective
SCM (Tyndall et al., 1998; Boddy et al., 2000; Ellram and Cooper, 1990).
The past two decades have seen an increasing trend in long term, collaborative
relationships by organizations with a few trusted suppliers (Anderson et al., 1994;
17
8/13/2019 Competitive_advantage of a Firm Through Supply Chain Responsiveness and SCM Practices
http://slidepdf.com/reader/full/competitiveadvantage-of-a-firm-through-supply-chain-responsiveness-and-scm 36/294
Wilkinson and Young, 1995; Ford, 1990; Sheth, 1996; Sheth and Sharma, 1997).
Kalwani and Narayandas, (1995) add that firms are moving from the traditional approach
of a one time cost based relationship with many suppliers to long term relationships with
a few good suppliers. Dwyer et al. (1987) and Spekman (1988) concur with the above
argument. Tomkins (2001) explored the role of trust and information-sharing in inter-
organizational relationships.
The role of “commitment” and “trust” in relationship marketing and inter-
organizational collaboration has been widely talked about since the late 80s (Morgan and
Hunt, 1994; Dwyer et al., 1987; Young and Wilkinson, 1989). The purpose of strategic
partnerships is to enable enhanced coordination in operations, R & D, product launching,
and the like, between partners (Fulconis and Paché, 2005). There has been abundant
literature since the 1990s on strategic supplier partnership in strategy literature.
In some industries, startups and partnership changes are expensive and time
consuming and long-term contracts are preferred (Mason et al., 2002). Vonderembse &
Tracey (1999) conducted a research study on the impact of supplier selection and
involvement on manufacturing performance. They concluded that the level of supplier
involvement in continuous improvement activities and in product development efforts is
low in North American supply chains. Although many managers acknowledge the need
for enhanced relationships in the channel, it is not being implemented consistently in the
manufacturing sector. They also conclude that increased company/supplier involvement
may have significant impact on supply chain performance.
Immediate supplier relationship activities play a vital role in developing effective
SCM strategies (Wisner, 2003). Long-term relationship does not refer to any specific
18
8/13/2019 Competitive_advantage of a Firm Through Supply Chain Responsiveness and SCM Practices
http://slidepdf.com/reader/full/competitiveadvantage-of-a-firm-through-supply-chain-responsiveness-and-scm 37/294
period of time, but rather, to the intention that the arrangement is not going to be
temporary (Chen and Paulraj, 2004). Through close relationships supply chain partners
are willing to (1) share risks and reward and (2) maintain the relationship on a long term
basis (Landeros and Monczka, 1989; Cooper and Ellram, 1993; Stuart, 1993).
Furthermore, a considerable amount has been written documenting the integration
of suppliers in the new product development process (Burt and Soukup, 1985; Clark and
Fujimoto, 1991; Helper, 1991; Hakansson and Eriksson, 1993; Lamming, 1993; Hines,
1994; Ragatz et al., 1997; Dowlatshahi, 1998; 2000; Swink, 1999; Shin et al., 2000). De
Toni and Nassimbeni (1999) found that a long-term perspective between the buyer and
supplier increases the intensity of buyer–supplier coordination.
The Japanese supplier partnership system is widely discussed in the literature
(Webster, et al., 2000; Gilbert, et al., 1994; Nishiguchi, 1994; Morris and Imrie, 1993;
Schoenberger, 1982). Japanese companies in electronics, automobiles, and machinery
industries began involving their suppliers in joint design with their customers (Nishiguchi
and Brookfield, 1997).
To create a competitive advantage, SCM is increasingly emphasizing
Interorganizational co-ordination of activities (Sheth and Sharma, 1997; Ballou et al.,
2000).
Customer relationship is defined as “the entire array of practices that are
employed for the purpose of managing customer complaints, building long-term
relationships with customers, and improving customer satisfaction” (Li et al., 2006, p.
109). Noble (1997) and Tan et al. (1998) consider customer relationship management as
19
8/13/2019 Competitive_advantage of a Firm Through Supply Chain Responsiveness and SCM Practices
http://slidepdf.com/reader/full/competitiveadvantage-of-a-firm-through-supply-chain-responsiveness-and-scm 38/294
an important component of SCM practices. Croxton et al. (2001) consider customer
relationship and supplier partnership practices as key SCM practices.
An organization’s customer relationship practices can affect its success in SCM
efforts as well as its performance (Scott and Westbrook, 1991; Ellram, 1991; Turner,
1993). Successful SCM involves customer integration at the downstream and supplier
integration at the upstream, considering that each entity in a supply chain is a supplier as
well as a customer (Tan et al., 1999).
In this global competition and mass customization era, personalized attention and
better relationship management with individual customers is of utmost importance for
organizational success (Wines, 1996). Good relationships with trading partners, including
customers are a key to successful SCM efforts by organizations (Moberg et al., 2002).
Customer relationship has long been recognized as an internal component of an
organization’s marketing strategy to increase sales and profits (Bommer et al., 2001).
Close customer relationship allows product differentiation from competitors, helps
sustain customer loyalty, and elevates the value provided to customers (Magretta, 1998).
Immediate customer relationship activities have played a crucial role in
developing effective SCM strategies (Wisner, 2003).
Information sharing refers to “the extent to which critical and proprietary
information is communicated to one’s supply chain partner” (Li et al., 2006, p. 110).
Mentzer et al. (2000) mention that shared information can vary from strategic to tactical
in nature. It could be pertaining to logistics, customer orders, forecasts, schedules,
markets, or more.
20
8/13/2019 Competitive_advantage of a Firm Through Supply Chain Responsiveness and SCM Practices
http://slidepdf.com/reader/full/competitiveadvantage-of-a-firm-through-supply-chain-responsiveness-and-scm 39/294
Information sharing refers to the access to private data between trading partners
thus enabling them to monitor the progress of products and orders as they pass through
various processes in the supply chain (Simatupang and Sridharan, 2002). Simatupang and
Sridharan (2005) bring forth some of the elements that comprise information sharing,
including data acquisition, processing, storage, presentation, retrieval, and broadcasting
of demand and forecast data, inventory status and locations, order status, cost-related
data, and performance status. They further add that information sharing pertaining to key
performance metrics and process data improves the supply chain visibility thus enabling
effective decision making. Information shared in a supply chain is of use only if it is
relevant, accurate, timely, and reliable (Simatupang and Sridharan, 2005). Information
sharing with trading partners enables organizations to make better decisions and to take
actions on the basis of greater visibility (Davenport et al., 2001).
In recent years, uncertainties have become a greater concern in supply chains. The
direct consequences are increased inventories and the distortion of demand forecasts.
Moreover, the distortion propagates through the supply chain and is amplified at each
stage—the well known bullwhip effect (Lee et al., 1997). Through information sharing,
the demand information flows upstream from the point of sales, while product
availability information flows downstream (Lee and Whang, 2001; Yu et al., 2001) in a
systematic manner. Moreover, information sharing ensures that the right information is
available for the right trading partner in the right place and at the right time (Liu and
Kumar, 2003).
21

8/13/2019 Competitive_advantage of a Firm Through Supply Chain Responsiveness and SCM Practices
http://slidepdf.com/reader/full/competitiveadvantage-of-a-firm-through-supply-chain-responsiveness-and-scm 40/294
According to Lummus and Vokurka (1999), in order to make the supply chain
competitive, a necessary first step is to acquire a clear understanding of supply chain
concepts and be willing to openly share information with supply chain partners.
Availability of accurate and up-to-date marketing data at every node within the
supply chain is a key to create a seamless supply chain (Childhouse and Towill, 2003;
Balsmeier and Voisin, 1996; Towill, 1997; Turner, 1993). Lalonde (1998) regards
information sharing as one of key element that characterizes a strong supply chain
relationship. Yu et al. (2001) point out that the negative impact of the bullwhip effect on
a supply chain can be reduced or eliminated by sharing information with trading partners.
Lalonde (1998) regards information sharing as a key to creating strong supply chain
relationships.
Lau and Lee (2000) maintain that creating an environment for controlled sharing
of business data and processes, improves information sharing effectiveness among
trading partners. However, there is the reluctance on the part of organizations in the
supply chain to share information with each other. Information is generally viewed as
providing an advantage over competitors, and organizations resist sharing with their
partners (Vokurka & Lummus, 2000) due to the fear of giving away competitive and
sensitive information such as inventory levels, production schedules (Lancioni et al.,
2000; Ballou et al., 2000; Croom et al., 2000).
2.3 Modularity-Based Manufacturing Practices
Modularity based manufacturing practices is defined as the application of unit
standardization or substitution principles to product design, production process design
22
8/13/2019 Competitive_advantage of a Firm Through Supply Chain Responsiveness and SCM Practices
http://slidepdf.com/reader/full/competitiveadvantage-of-a-firm-through-supply-chain-responsiveness-and-scm 41/294
and organizational design (Tu et al., 2004; Ulrich, 1995; Tu, 1999). Baldwin and Clark
(2000) defined modules as units in a large system that are structurally independent of one
another, but functionally integrated. Modularity-based manufacturing practices are a set
of actions that enable firms to achieve modularity in product design, production process
design, and organizational design (Tu et al., 2004). In general, modularity refers to “the
degree to which a system’s components can be separated and recombined” (Schilling,
2000, p. 12). Schilling and Steensma (2001) suggested that systems will have higher
degrees of modularity when their components can be disaggregated and recombined into
new configurations with little loss of functionality. A complex system can be easily
managed by dividing it into smaller modules and examining each piece separately. Tu et
al. (2004) defined the construct modularity-based manufacturing practices, and developed
a valid and reliable instrument to measure modularity based manufacturing practices. The
same instrument has been adopted in this study. Modularization involves organizing
complex products and processes efficiently (Baldwin and Clark, 1997), by breaking down
large jobs into simpler parts so they can be “managed independently and yet operate
together as a whole” (Mikkola and Larsen, 2004, p. 441).
The potential benefits of modularity include economies of scale, increased
feasibility of product/components change, increased product variety and reduced lead
time, decoupling tasks and ease of product upgrade, maintenance, repair, and disposal
(Coronado et al., 2004).
The concept of modularity is commanding increasing attention from researchers
because of its capability to cope with a turbulent manufacturing environment. Drucker
(1990) predicted that the factory of the year 1999 would be determined by four
23

8/13/2019 Competitive_advantage of a Firm Through Supply Chain Responsiveness and SCM Practices
http://slidepdf.com/reader/full/competitiveadvantage-of-a-firm-through-supply-chain-responsiveness-and-scm 42/294
principles. One of those principles is the modular organization of the manufacturing
process (other three being statistical quality control, systems approach, and effective
manufacturing accounting), which promises to combine the advantages of standardization
and flexibility.
Operations management/management science research has treated modularity as a
means to increase commonality across different product variants within a product family,
i.e. to allow for the same component(s) to be used in multiple product variants, and when
feasible, in all product variants (Evans, 1963).
Research in operations management/ management science has highlighted that
modularity in product design may allow for the design of a loosely coupled production
system in which different subassemblies can be made independently, and then rapidly
assembled together in different ways, to build the final product configurations (Ernst and
Kamrad, 2000; Novak and Eppinger, 2001). This reduces the order lead times.
Similarly, Schilling and Steensma (2001) suggested that systems will have higher
degrees of modularity when their components can be disaggregated and recombined into
new configurations with little loss of functionality. A complex system can be easily
managed by dividing it into smaller modules and examining each piece separately.
Given the importance of modularity based manufacturing practices for
responsiveness of organizations, a limited amount of empirical research has been done in
this field. A careful literature review indicates that research on modularity-based
manufacturing is scattered and mostly descriptive (Tu et al., 2004). Furthermore only a
few existing empirical studies focus on product modularity and overlook the implications
24

8/13/2019 Competitive_advantage of a Firm Through Supply Chain Responsiveness and SCM Practices
http://slidepdf.com/reader/full/competitiveadvantage-of-a-firm-through-supply-chain-responsiveness-and-scm 43/294
of modularity on production process design (i.e. process modularity) and organizational
design (Tu et al., 2004)
The concept of modularity has drawn attention since about a decade now, due to
its definitive advantage in coping with the environmental uncertainty (Tu, 1999).
Professor Carliss Baldwin and Kim Clark of Harvard Business School are among the
many proponents of modularity. Their article during the late 90’s in Harvard Business
Review cited the computer industry as the pioneer in promoting modularity. The
computer industry has dramatically increased its rate of innovation through the use of
modular designs. Baldwin and Clark (1997) regard modularity as a “strategy for
organizing complex products and processes efficiently” (p. 86). They argue that it is
modularity, more than any other technology that makes the rapid developments in
computer industry possible. For manufacturers, modularity enables them to handle
increasingly complex technology (Tu, 1999) and respond faster to changing customer
demand by creating more variety of products from a set of common modules or
subassemblies.
Several powerful forces are behind modularization: (1) the rate of technological
change is accelerating, (2) customers, empowered by advanced computing and
networking technologies, are demanding greater product variety at lower prices, and (3)
technology-intensive products are becoming more complex (O’Grady, 1999).
Many companies have found that modularity has the potential to revolutionize
their entire operation (O’Grady, 1999). The computer industry has been the leader in
successful application of modularity principles. Software developers such as Oracle and
SAP deliver a wide selection of software modules or “cartridges” that make it easier for
25

8/13/2019 Competitive_advantage of a Firm Through Supply Chain Responsiveness and SCM Practices
http://slidepdf.com/reader/full/competitiveadvantage-of-a-firm-through-supply-chain-responsiveness-and-scm 44/294
companies to create custom applications (Marshall, 1996). IBM prototyped a modular
storage system called “Collective Intelligent Brick” that is easily scalable by stacking
storage cubes (Zimmerman, 2003).
There has been wide support in prior literature (Fisher, 1997, Lee, 2002) on the
fact that product modularity enables the supply chain to be more responsive, by assisting
in product postponement for as long as possible, and as close to the customer as possible.
The application of modularity principles in the manufacturing setting has
traditionally focused mainly on designing modular products to satisfy customer needs.
However, a careful review of the literature reveals a clear trend of taking a more
systematic view, and applying modularity practices to every aspect of manufacturing
system design. Tu et al. (2004) developed three dimensions of modularity based
manufacturing practices, namely product modularity, process modularity, and dynamic
teaming. Table 2.3.1 lists the three dimensions along with their definitions and supporting
literature.
26
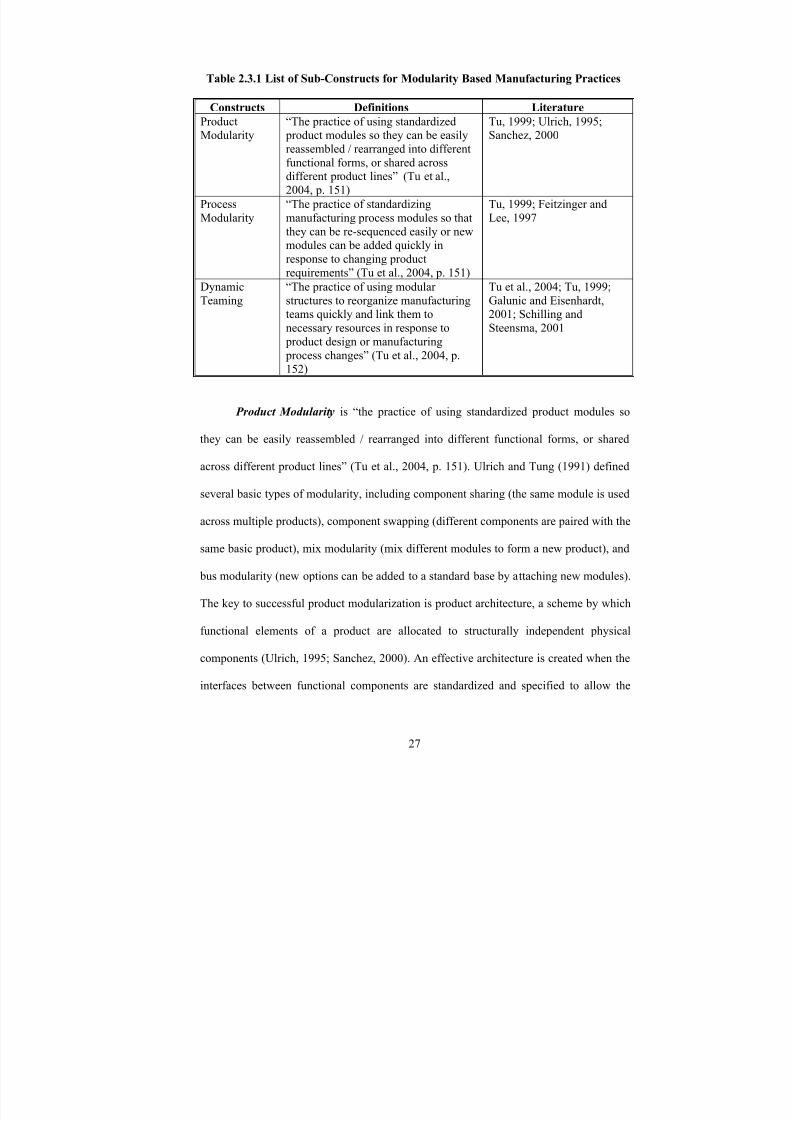
8/13/2019 Competitive_advantage of a Firm Through Supply Chain Responsiveness and SCM Practices
http://slidepdf.com/reader/full/competitiveadvantage-of-a-firm-through-supply-chain-responsiveness-and-scm 45/294
Table 2.3.1 List of Sub-Constructs for Modularity Based Manufacturing Practices
Constructs Definitions Literature
ProductModularity
“The practice of using standardized product modules so they can be easily
reassembled / rearranged into differentfunctional forms, or shared acrossdifferent product lines” (Tu et al.,
2004, p. 151)
Tu, 1999; Ulrich, 1995;Sanchez, 2000
Process
Modularity
“The practice of standardizing
manufacturing process modules so that
they can be re-sequenced easily or newmodules can be added quickly in
response to changing product
requirements” (Tu et al., 2004, p. 151)
Tu, 1999; Feitzinger and
Lee, 1997
Dynamic
Teaming
“The practice of using modular
structures to reorganize manufacturingteams quickly and link them to
necessary resources in response to
product design or manufacturing
process changes” (Tu et al., 2004, p.152)
Tu et al., 2004; Tu, 1999;
Galunic and Eisenhardt,2001; Schilling and
Steensma, 2001
Product Modularity is “the practice of using standardized product modules so
they can be easily reassembled / rearranged into different functional forms, or shared
across different product lines” (Tu et al., 2004, p. 151). Ulrich and Tung (1991) defined
several basic types of modularity, including component sharing (the same module is used
across multiple products), component swapping (different components are paired with the
same basic product), mix modularity (mix different modules to form a new product), and
bus modularity (new options can be added to a standard base by attaching new modules).
The key to successful product modularization is product architecture, a scheme by which
functional elements of a product are allocated to structurally independent physical
components (Ulrich, 1995; Sanchez, 2000). An effective architecture is created when the
interfaces between functional components are standardized and specified to allow the
27
8/13/2019 Competitive_advantage of a Firm Through Supply Chain Responsiveness and SCM Practices
http://slidepdf.com/reader/full/competitiveadvantage-of-a-firm-through-supply-chain-responsiveness-and-scm 46/294
substitution of a range of components without requiring changes in the designs of other
components (Garud & Kumaraswamy, 1995; Sanchez & Mahoney, 1996; Sanchez &
Collins, 2001). For example, NeoSystems launched a new computer architecture called
Modular Digital Architecture (MDA). For each hardware installation or upgrade,
modules that include new features and accessories can be stacked on a base MDA
module, just like stacking a home stereo system. General Motors announced the
Yellowstone program, which is an attempt to build small cars profitably by using
modularity and co-design with suppliers. Baldwin and Clark (1997) regard modularity as
an emerging revolution as complex products can be built from “smaller subsystems” (p.
84) that are designed and manufactured independently and yet can “function together as a
whole” (p. 84). Through modularization, modules will not only be shared across product
lines, the number of different parts delivered to the assembly plants will also be greatly
reduced. “The results are better-integrated designs with more value to the customer, an
integrated quality focus, and reduced piece cost and investment” (Suzik, 1999).
Swaminathan (2001), however adds that too much part commonality can reduce
product differentiation in the eyes of the customer leading to a cannibalization effect.
Robertson and Ulrich (1998) differentiate external use standard parts from internal use
and emphasize that an increase in the internal commonality does not contribute as much
toward the cannibalization effect. For example, if commonality is introduced in the wire
harness of different car models of a manufacturer, it is not easily noticed by customers
(since these wires are hidden under the upholstery) and thus cannibalization effects are
minimal. On the other hand, if the dashboards themselves (of these two car models) are
28

8/13/2019 Competitive_advantage of a Firm Through Supply Chain Responsiveness and SCM Practices
http://slidepdf.com/reader/full/competitiveadvantage-of-a-firm-through-supply-chain-responsiveness-and-scm 47/294
standardized, then there is a greater amount of cannibalization taking place, adds
Swaminathan (2001).
Process Modularity is defined as “the practice of standardizing manufacturing
process modules so that they can be re-sequenced easily or new modules can be added
quickly in response to changing product requirements” (Tu et al., 2004, p. 151).
Feitzinger and Lee (1997) suggested that process modularity is based on three principles:
(1) Process standardization: break down the process into standard sub-processes that
produce standard base units and customization sub-processes that further customize the
base units; (2) Process re-sequencing: reorder the sub-processes so that standard sub-
processes occur first while customization sub-processes occur last (ex: Benetton case of
re-sequencing knitting and dyeing of sweaters); (3) Process postponement: postponing
customization sub-processes until a customer order is received or place those sub-
processes in distribution centers to achieve maximum flexibility. Sanchez (1999) echoed
similar thoughts of “late-point differentiation of products” using modular architecture.
According to Pine (1993), the traditional tightly coupled production processes should be
broken apart and modularized. An increasing number of manufacturers are starting to use
modular assembly lines where workstations and conveyor units can be added, removed,
or rearranged to create different process capabilities (Cooper, 1999).
According to Swaminathan (2001), a modular process is one where each product
can be processed differently and stored in a semi-finished form. These products differ
from each other based on the subset of operations that are performed on them. Any
assemble to order process would classify as modular. Swaminathan (2001) further
exemplifies that a semiconductor wafer fabrication (particularly application-specific
29
8/13/2019 Competitive_advantage of a Firm Through Supply Chain Responsiveness and SCM Practices
http://slidepdf.com/reader/full/competitiveadvantage-of-a-firm-through-supply-chain-responsiveness-and-scm 48/294
integrated circuits) is modular in nature, “since the type of chip produced depends on the
unique subset of operations performed on it” (p. 128). He further adds that Oil refining, is
a non-modular process as it is a continuous process and inventory cannot be stored in a
semi-finished form once the refining process starts. According to Swaminathan (2001),
modular products are not necessarily always made by modular processes. The example of
the biotech and pharmaceutical industry that make modular products, but use non-
modular processes, is further illustrated in Swaminathan (2001). Many products in these
industries can be derived by varying the mix of a small number of ingredients, which
makes them modular. They are made, however, in continuous flow processes and thus
inventory cannot be stored in semi-finished forms”. Process modularity has the potential
for reengineering entire supply chains to enhance customization. Van Hoek and Weken
(1998) specifically studied the effects of process postponement (postponed purchasing
and postponed manufacturing) in the supply chain. Postponed purchasing requires that
suppliers manage part of the inbound complexity associated with material flows by
providing standardized modules. Postponed manufacturing extends the final modular
assembly into distribution centers and even customer sites. The result is a more
responsive supply chain that can satisfy individual customer needs without incurring
higher production and inventory costs.
Dynamic Teaming is “the practice of using modular structures to reorganize
manufacturing teams quickly and link them to necessary resources in response to product
design or manufacturing process changes” (Tu et al., 2004, p. 152). This is an application
of modularity principles to human resource management in manufacturing and to
organizational process design.
30

8/13/2019 Competitive_advantage of a Firm Through Supply Chain Responsiveness and SCM Practices
http://slidepdf.com/reader/full/competitiveadvantage-of-a-firm-through-supply-chain-responsiveness-and-scm 49/294
Today’s rapidly changing manufacturing environment requires a dynamic team
structure that is different from traditional cross-functional teams. Pine et al. (1993) argue
that cross-functional teams are usually tightly integrated to improve efficiency but lack
flexibility. To achieve flexibility, companies should break apart tightly coupled teams
and form loosely coupled networks of modular, flexible working units, so that these
groups of people, processes, and technology can be easily reconfigured within the
organization to meet the ever changing customer needs.
Galunic and Eisenhardt (2001) investigated a similar concept of modular
organizational form, termed “dynamic community.” They envisage corporate divisions
and project teams as dynamic modules with distinctive capabilities, responsibilities, and
resources that can be reconfigured to create new productive entities with shared culture
and values that can adapt quickly to changing environments. Schilling and Steensma
(2001) studied the adoption of modular organizational forms at the industry level. Their
study included contract manufacturing (quickly adding temporary manufacturing capacity
modules by contract), alternative work arrangements (employing workers on a short-term
contract basis), and alliances (accessing critical capabilities the company lacks in-house
through partnership with other firms). These practices are expected to generate more
flexibility in the manufacturing system. Hoogeweegen et al. (1999) introduced the
modular network design (MND) concept to explain how computer information
technology enables virtual organizations to effectively reallocate production tasks and
resources among modular virtual teams to cut costs and throughput time. While similar
researches on dynamic teaming are scattered and may be at different levels of analysis, a
theory of modular organizational form is clearly emerging.
31
8/13/2019 Competitive_advantage of a Firm Through Supply Chain Responsiveness and SCM Practices
http://slidepdf.com/reader/full/competitiveadvantage-of-a-firm-through-supply-chain-responsiveness-and-scm 50/294
Ketchen and Hult (2002) add that today's managers face an array of complex
challenges, which requires them to keep pace with technological progress and cope with
global competition. They further maintain that a modular form of organization is one tool
to deal with these challenges. The authors compare modular organizational form with
home building. A traditional home is a stable, cohesive object. Homes take a long time to
build and once in place, adding to or otherwise modifying the home's basic structure
requires a major effort. In contrast, modular homes can be readily assembled, broken
apart, and reassembled to meet owner needs.
Daft and Lewin (1993) assert that there is an increasing trend of moving away
from achieving mass production efficiencies, hierarchical and bureaucratic organizations
that provided centralized control over activities. They further add that the shift is towards
more flexible, learning organizations that continuously change and adapt to changes.
They further add that these organizations “solve problems through interconnected
coordinated self-organizing processes” (p. i) and teams, and which has been termed as
‘dynamic teams’ in this study. The dynamic teams are characterized by the ability to
adapt and create change (i.e. highly flexible to adapt to change), that more fully use both
human and technology resources, and that are global in scope (Daft and Lewin, 1993).
2.4 Supply Chain Responsiveness
Supply chain responsiveness is defined as the capability of promptness and the
degree to which the supply chain can address changes in customer demand (Holweg,
2005; Prater et al., 2001; Lummus et al., 2003; Duclos et al., 2003).
32

8/13/2019 Competitive_advantage of a Firm Through Supply Chain Responsiveness and SCM Practices
http://slidepdf.com/reader/full/competitiveadvantage-of-a-firm-through-supply-chain-responsiveness-and-scm 51/294
In a rapidly changing competitive world, there is a need to develop organizations
and supply chains that are significantly more flexible and responsive than the existing
ones (Gould 1997, James-Moore, 1996). Firms need to aptly respond to changing
customer needs so as to succeed in today’s uncertain environment (Gerwin, 1987; Huber,
1984; Narasimhan and Das, 1999; Ward et al., 1998) as well as any disruptions in supply
(Germain, 1989; Lee, 2004; Christopher and Peck, 2004). Although it would be
interesting to study supply chain responsiveness from supply disruption perspective also,
the current study focuses mainly on customer demand perspective.
To review the concept of supply chain responsiveness, we first need to review the
supply chain flexibility concept. The supply chain flexibility has its roots in
manufacturing flexibility of an organization. So we begin by a brief review of the
manufacturing flexibility literature. Manufacturing flexibility is defined as the ability of
the manufacturing system of an organization to adapt to change (Upton, 1994; Parker and
Wirth, 1999; Lau, 1999). Manufacturing flexibility has been considered as a major
competitive weapon for manufacturing organizations due to its ability to help cope with
uncertain environments and turbulent markets. It has been argued in past literature that
manufacturing flexibility is capable of providing organizations with the ability to change
volume and mix of production, to rapidly and frequently develop new products, and to
better respond to competition (Oke, 2005). Manufacturing flexibility has also been said to
focus on the ability to adjust to changes in uncertainty with least penalties in time.
There has been extensive literature on the manufacturing flexibility concept and
the survey reported by Sethi and Sethi (1990) lists more than 200 references. Some of the
basic dimensions of manufacturing flexibility in the prior literature are - volume
33

8/13/2019 Competitive_advantage of a Firm Through Supply Chain Responsiveness and SCM Practices
http://slidepdf.com/reader/full/competitiveadvantage-of-a-firm-through-supply-chain-responsiveness-and-scm 52/294
flexibility (the ability of the manufacturing system to vary aggregate production volume
economically) (Slack, 1983; Browne et al., 1984; Sethi and Sethi, 1990; Gerwin, 1993),
mix flexibility (the ability of the manufacturing system to switch between different
products in the product mix) (Browne et al., 1984; Gerwin, 1993; Gupta and Somers,
1996), new product flexibility (the ability of the manufacturing system to introduce and
manufacture new parts and products) (Browne et al., 1984; Gerwin, 1987; 1993; Taymaz,
1989; Gupta and Somers, 1996), process flexibility (the ability to change between the
production of different products with minimal delay) (Parker and Wirth, 1999), and
material handling flexibility (the ability of the material handling system to move material
through the plant effectively) (Sethi and Sethi, 1990; Gupta and Somers, 1992). Slack
(1983, 1987), Browne et al. (1984), Hyun and Ahn (1992), Suarez et al. (1996), Zhang et
al. (2003), and Koste et al. (2004) are some of the studies on taxonomies of
manufacturing flexibility. There is considerable disagreement among researchers on the
definition of manufacturing flexibility.
The fact that a large amount of literature is available on flexibility and
responsiveness of manufacturing systems, yet there been very little discussion on the
relationship between these two concepts has been criticized in literature (Kritchanchai
and MacCarthy, 1999; Matson and McFarlane, 1999). Some questions such as is a
flexible manufacturing system also by default responsive, and what types of flexibility
are needed for responsiveness have not been clearly addresses in prior literature (Holweg,
2005). This argument is also true for the distinction between supply chain responsiveness
and supply chain flexibility. In this study we extend the definition of responsiveness to
the supply chain level.
34

8/13/2019 Competitive_advantage of a Firm Through Supply Chain Responsiveness and SCM Practices
http://slidepdf.com/reader/full/competitiveadvantage-of-a-firm-through-supply-chain-responsiveness-and-scm 53/294
The supply chain flexibility concept focuses on the ability of the firm / supply
chain to adapt to changes in business conditions (Gosain et al., 2004). Although the
literature in the flexibility area (at logistics and supply chain levels) is accumulating over
the past decade, including case study based research (Ferrin, 1994; Cunningham, 1996;
Juga, 1996; Van Hoek et al., 1998), conceptual contributions (Lummus et al., 2003;
Duclos et al., 2003; Andries and Gelders, 1995; Van Hoek, 2001), mathematical models
(Garg and Tang, 1997; Waller et al., 2000), and survey research (Sanchez and Perez,
2005; Zhang et al., 2005; Daugherty et al., 1996; Emerson and Grimm, 1998), more work
is required.
Supply chain flexibility refers to the ability of the supply chain to adapt to internal
or external influences, whereas supply chain responsiveness is the ability of the supply
chain to rapidly address changes and requests in the marketplace (Holweg, 2005). Supply
chain flexibility extends the concept of flexibility of manufacturing systems to the entire
supply chain. It encompasses not only the manufacturing (operations) flexibility, but also
the flexibility of the different supply chain functions and processes, ex: supply,
distribution and transportation (Lummus et al., 2003). Where “flexibility is the ability to
switch between tasks” (Vokurka et al., 2002, p. 21), responsiveness is the ability to
rapidly respond to unanticipated market changes (Goldman et al., 1994; Vokurka and
Fliedner, 1998). Supply chain flexibility is a complex and multi-dimensional concept
difficult to summarize (De Groote, 1994; Sarker et al., 1994; Upton, 1994; Gupta and
Buzacott, 1996). The current study focuses on the – speed of response – in addition to the
flexibility which is widely known as supply chain responsiveness (Holweg, 2005).
35

8/13/2019 Competitive_advantage of a Firm Through Supply Chain Responsiveness and SCM Practices
http://slidepdf.com/reader/full/competitiveadvantage-of-a-firm-through-supply-chain-responsiveness-and-scm 54/294
As obvious from the above discussion responsive comprises of both flexibility as
well as speed. This fact has been strongly supported in prior literature (Fisher, 1997; Lee,
2002; Olhager, 1993, D’ Souza and Williams, 2000, Holweg 2005; Holweg and Pil,
2001; Meehan and Dawson, 2002; Williamson, 1991; Prater et al., 2001; Towill and
Christopher, 2002; Christopher and Peck, 2004; Gunasekaran and Yusuf, 2002;
Christopher, 2000). Prater et al. (2001) further maintain that as the level of speed and
more importantly flexibility increase, the level of supply chain responsiveness increases.
Based on Prater et al. (2001), Duclos et al. (2003), and Lummus et al. (2003) who have
identified the various components of supply chain flexibility and agility, we extend and
modify those components to develop the construct supply chain responsiveness. We
identify operations system responsiveness, logistics process responsiveness, and supplier
network responsiveness as the three main components of supply chain responsiveness.
Literature (ex: Christopher, 2000), emphasizes the need for supply chains (instead of
individual organizations) to be responsive in order to attain competitive advantage. This
was the prime motivation behind this study of supply chain responsiveness.
Aquilano et al. (1995) contend that “low cost, high quality and improved
responsiveness (both delivery time and flexibility of product delivery)” (p. 447) are the
three main strategic imperatives to stay competitive in this century (as cited in Duclos et
al., 2003). Gupta and Goyal (1989), contend that being responsive is normally considered
as an adaptive response to the environmental uncertainty. Bowersox et al. (1999)
advocate the need for organizations to be responsive when the penalties associated with
uncertainty are higher. These penalties for an organization could include costs of stocking
36
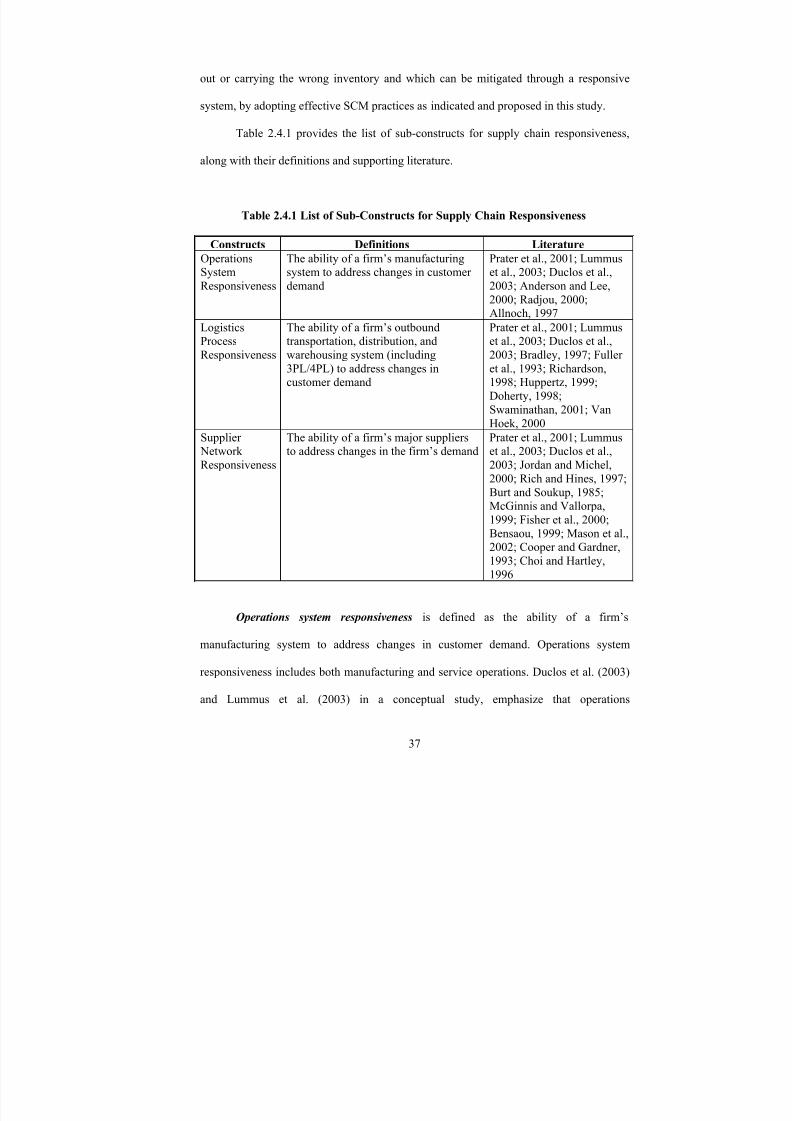
8/13/2019 Competitive_advantage of a Firm Through Supply Chain Responsiveness and SCM Practices
http://slidepdf.com/reader/full/competitiveadvantage-of-a-firm-through-supply-chain-responsiveness-and-scm 55/294
out or carrying the wrong inventory and which can be mitigated through a responsive
system, by adopting effective SCM practices as indicated and proposed in this study.
Table 2.4.1 provides the list of sub-constructs for supply chain responsiveness,
along with their definitions and supporting literature.
Table 2.4.1 List of Sub-Constructs for Supply Chain Responsiveness
Constructs Definitions Literature
OperationsSystem
Responsiveness
The ability of a firm’s manufacturingsystem to address changes in customer
demand
Prater et al., 2001; Lummuset al., 2003; Duclos et al.,
2003; Anderson and Lee,
2000; Radjou, 2000;Allnoch, 1997
LogisticsProcess
Responsiveness
The ability of a firm’s outboundtransportation, distribution, and
warehousing system (including
3PL/4PL) to address changes incustomer demand
Prater et al., 2001; Lummuset al., 2003; Duclos et al.,
2003; Bradley, 1997; Fuller
et al., 1993; Richardson,1998; Huppertz, 1999;
Doherty, 1998;
Swaminathan, 2001; Van
Hoek, 2000
Supplier
NetworkResponsiveness
The ability of a firm’s major suppliers
to address changes in the firm’s demand
Prater et al., 2001; Lummus
et al., 2003; Duclos et al.,2003; Jordan and Michel,
2000; Rich and Hines, 1997;
Burt and Soukup, 1985;McGinnis and Vallorpa,
1999; Fisher et al., 2000;
Bensaou, 1999; Mason et al.,2002; Cooper and Gardner,
1993; Choi and Hartley,
1996
Operations system responsiveness is defined as the ability of a firm’s
manufacturing system to address changes in customer demand. Operations system
responsiveness includes both manufacturing and service operations. Duclos et al. (2003)
and Lummus et al. (2003) in a conceptual study, emphasize that operations
37

8/13/2019 Competitive_advantage of a Firm Through Supply Chain Responsiveness and SCM Practices
http://slidepdf.com/reader/full/competitiveadvantage-of-a-firm-through-supply-chain-responsiveness-and-scm 56/294
responsiveness at each node of the chain is an integral component of supply chain
responsiveness. They further argue that in order to meet the end customer’s needs, each
entity in the supply chain must deliver the product or service in a timely and reliable
manner.
The dimensions under this category would measure the responsiveness associated
with a specific node (company) in the supply chain (Duclos et al., 2003; Lummus et al.,
2003). This could be a supplier, a manufacturer, or a customer (or distributor). Anderson
and Lee (2000) identified - the ability to be operationally responsive - as one of the
components of successful supply chain strategy that add value to a firm. This includes the
ability to rapidly configure or reconfigure assets and operations of the manufacturing
system to react to consumer trends (Wu, 2001; Lummus et al., 2003), respond rapidly to
changes in product volume and product mix demanded by customers, and effectively
expedite emergency customer orders. As the supply chain responds to customer demand,
supply chain member companies may be required to move quickly from the production of
one product to another, or quickly change production levels for a given product. The
responsiveness of the operations system would be the ability of the manufacturing and
production to rapidly respond to unexpected events, and ability to rapidly accommodate
special or non-routine customer requests. In doing so the vital ingredients needed are
flexibility and speed of response (Holweg 2005; Holweg and Pil, 2001; Meehan and
Dawson, 2002; Williamson, 1991) of the manufacturing system of each of the
organizations operating within a supply chain. Some of the operations system
responsiveness measures that have been identified to operationalize the construct include:
operations system’s ability to - rapidly adjust capacity to address demand changes,
38
8/13/2019 Competitive_advantage of a Firm Through Supply Chain Responsiveness and SCM Practices
http://slidepdf.com/reader/full/competitiveadvantage-of-a-firm-through-supply-chain-responsiveness-and-scm 57/294
rapidly change manufacturing processes to address demand changes, rapidly reallocate
people to address demand changes, rapidly reconfigure equipment to address demand
changes, effectively expedites emergency customer orders, make rapid changes in
product mix demanded by customers, and respond rapidly to changes in product volume
demanded by customers.
Logistics process responsiveness is defined as the ability of a firm’s outbound
transportation, distribution, and warehousing system (including 3PL/4PL) to address
changes in customer demand. The responsiveness in the logistic processes is a vital
component in the success of a responsive supply chain strategy (Fawcett, 1992). Logistics
and distribution management includes the activities of transportation of goods from
suppliers to manufacturer to distribution centers to final point of consumption (Ricker
and Kalakota, 1999; Duclos et al., 2003; Lummus et al., 2003). These activities include
warehousing, packing and shipping, transportation planning and management, inventory
management, reverse logistics, and order tracking and delivery. This study focuses on the
outbound logistics of the focal firm. Fuller et al. (1993) suggest that a firm’s logistics
system is instrumental in creating value for its customers. This value creation for a firm’s
customers implies ensuring logistics flexibility (Duclos et al., 2003; Lummus et al., 2003)
and speed within the supply chain to serve each distinct customer’s needs. A typical
response to uncertainty is to build flexibility into the supply chain. However being
flexible needs to be supplemented by being apt in responding too. Responsiveness
components in the logistics system include selecting logistics components that
accommodate and respond to wide swings in demand over short periods, adjust
warehouse capacity to address demand changes, handle a wide range of products, vary
39

8/13/2019 Competitive_advantage of a Firm Through Supply Chain Responsiveness and SCM Practices
http://slidepdf.com/reader/full/competitiveadvantage-of-a-firm-through-supply-chain-responsiveness-and-scm 58/294
transportation carriers, have the ability to pack product-in-transit to suit discreet
customers’ requirements, and have the ability to customize products close to the customer
(i.e. postponement); and do all of these speedily in order to gain a competitive advantage.
It is vital that the firm has easy access to and is able to utilize different modes of
transportation to be logistically flexible and thus responsive (Prater et al., 2001). Hise
(1995) argues that flexibility is the key component of any logistics system configured to
achieve responsiveness. He further states that companies need the capability to adjust
logistic systems quickly to respond to changes in market needs and the necessitated
product assortment. Prater et al. (2001) in his case study research presents the case study
of Hewlett Packard, which reduced the uncertainty by designing the product
appropriately so as to customize it only when individual orders arrive. Lummus et al.
(2003) put forth some of the critical logistics process flexibility aspects of a supply chain,
which are vital for supply chain responsiveness. These aspects have been adapted for
logistics process responsiveness and are as follows: logistics system’s ability to - rapidly
respond to unexpected demand change, rapidly adjust warehouse capacity to address
demand changes, rapidly vary transportation carriers to address demand changes,
accommodate special or non-routine customer requests, and effectively delivers
expedited shipments.
Supplier network responsiveness is defined as the ability of a firm’s major
suppliers to address changes in the firm’s demand. A key to responsiveness is the
presence of responsive and flexible partners upstream and downstream of the focal firm
(Christopher and Peck, 2004). The ability of firms to react quickly to customer demand is
dependent on the reaction time of suppliers to make volume changes.
40
8/13/2019 Competitive_advantage of a Firm Through Supply Chain Responsiveness and SCM Practices
http://slidepdf.com/reader/full/competitiveadvantage-of-a-firm-through-supply-chain-responsiveness-and-scm 59/294
Whenever disruptive causes such new technology, terrorist threats (Walker, 2005)
or cut-throat competition tend to throw the supply chain haywire, the supply chain
networks must be ready to react to any ripple effect. Slack (1991) argues that supplier
networks are the essential building blocks of a flexible system. Some interviews with
operations managers conducted at the European vehicle assembly plants of Volvo
revealed that the lack of supplier network flexibility hampered the company’s
responsiveness (Holweg, 2005). Supplier network flexibility (Slack, 1991) and thus
supplier network responsiveness is an important part of the supply chain responsiveness.
Holweg and Pil (2001) argue that flexibility in the supplier network is an important
ingredient of being responsive to changes in customer demand. Thus supplier network
responsiveness is believed to be a dimension of supply chain responsiveness in this study.
In order to have a competitive advantage, organizations need to meet the changing needs
of customers by being able to rapidly supply products, including any demand changes in
terms of product volume, mix, product variations, and new product introductions.
Meeting these needs requires responsiveness in the supply chain at various stages from
the raw materials to finished products to distribution and delivery. In order to be
responsive the organizations should be able to select suppliers who can add new products
quickly, and have suppliers make desired changes. Selecting suppliers who can introduce
new products quickly can add responsiveness to a supply chain. Burt and Soukup (1985)
suggested that failure to include suppliers’ inputs in product development is a vulnerable
aspect of supply chain management. McGinnis and Vallopra (1999) found that involving
suppliers could make new product development a success. Fisher et al. (2000) found that
for short lifecycle products, such as fashion apparel, retailers are most successful if they
41
8/13/2019 Competitive_advantage of a Firm Through Supply Chain Responsiveness and SCM Practices
http://slidepdf.com/reader/full/competitiveadvantage-of-a-firm-through-supply-chain-responsiveness-and-scm 60/294
can work with suppliers who can provide initial shipments of product based on forecasts,
but then rapidly increase production to the right style, color, size, etc. based on actual
sales. They note that fast supply chains can produce products as they sell rather than
worrying about accurate forecasts. These studies suggest that supplier selection based on
product development capabilities and rapid deployment capabilities positively impact the
delivery time of new products. Choi and Hartley (1996) found that the capability of
suppliers to make product volume changes was a significant factor in supplier selection in
the automotive industry. In certain industries, e.g. electronics; demand volatility poses a
unique challenge to suppliers to vary output in line with demand. The increases or
decreases in demand may come at a short notice and need to be sustained over some time
period. Some of the measures of supplier network responsiveness include: major
suppliers’ ability to - change product volume in a relatively short time, change product
mix in a relatively short time, consistently accommodate the firm’s requests, provide
quick inbound logistics to the firm, have outstanding on-time delivery record, and
effectively expedite emergency orders.
2.5 Competitive Advantage
Competitive advantage is defined as the “capability of an organization to create a
defensible position over its competitors” (Li et al., 2006, p. 111).
Tracey et al. (1999) argues that competitive advantage comprises of distinctive
competencies that sets an organization apart from competitors, thus giving them an edge
in the marketplace. They further add that it is an outcome of critical management
decisions.
42

8/13/2019 Competitive_advantage of a Firm Through Supply Chain Responsiveness and SCM Practices
http://slidepdf.com/reader/full/competitiveadvantage-of-a-firm-through-supply-chain-responsiveness-and-scm 61/294
Competitive advantage traditionally involved the choice regarding the markets in
which a firm would compete, defending market share in clearly defined segments using
price and product performance attributes (Day, 1994). Today, however, competition is
considered a “war of movement” (p. 62) that depends on anticipating and quickly
responding to changing market needs (Stalk et al., 1992). Competitive advantage emerges
from the creation of superior competencies that are leveraged to create customer value
and achieve cost and/or differentiation advantages, resulting in market share and
profitability performance (Barney, 1991; Coyne, 1986; Day and Wensley, 1988; Prahalad
and Hamel, 1990). Sustaining competitive advantage requires that firms set up barriers
that make imitation difficult through continual investment to improve the advantage,
making this a long-run cyclical process (Day and Wensley, 1988). Porter's approach to
competitive advantage centers on a firm’s ability to be a low cost producer in its industry,
or to be unique in its industry in some aspects that are popularly valued by customers
(Porter, 1991). Most managers agree that cost and quality will continue to remain the
competitive advantage dimensions of a firm (D’ Souza and Williams, 2000).
Wheelwright (1978) suggests cost, quality, dependability and speed of delivery as some
of the critical competitive priorities for manufacturing. There is widespread acceptance of
time to market as a source of competitive advantage (Holweg, 2005).
Price/cost, quality, delivery dependability, and time to market have been
consistently identified as important competitive capabilities (Vokurka et al., 2002;
Fawcett and Smith, 1995; White, 1996; Skinner, 1985; Roth and Miller, 1990; Tracey et
al., 1999). ‘Time’ has been argued to be a dimension of competitive advantage in other
research contributions (viz: Stalk, 1988; Vesey, 1991; Handfield and Pannesi; 1995,
43

8/13/2019 Competitive_advantage of a Firm Through Supply Chain Responsiveness and SCM Practices
http://slidepdf.com/reader/full/competitiveadvantage-of-a-firm-through-supply-chain-responsiveness-and-scm 62/294
Kessler and Chakrabarti, 1996; Zhang, 2001). In a research framework, Koufteros et al.
(1997) describe the following five dimensions of competitive capabilities: competitive
pricing, premium pricing, value-to-customer quality, dependable delivery, and product
innovation. These dimensions were further described and utilized in other contributions
as well (Koufteros et al., 2002; Tracey et al., 1999; Rondeau et al., 2000; Roth and
Miller, 1990; Cleveland et al., 1989; Safizadeh et al., 1996; Vickery et al., 1999, Li et al.
2006). Based on these studies, the five dimensions of competitive advantage construct
used in this study are price/cost, quality, delivery dependability, product innovation, and
time to market.
Competitive advantage has been operationalized in the existing literature
(Koufteros et al., 1997; Zhang, 2001) and the measures have been adopted in this study
with minor modifications. Based on the study of Koufteros (1995), Zhang (1997), and Li
et al. (2006) the following five dimensions of competitive capability are used in this
study. The list of these sub-constructs, along with their definition and supporting
literature, are provided in Table 2.5.1
44

8/13/2019 Competitive_advantage of a Firm Through Supply Chain Responsiveness and SCM Practices
http://slidepdf.com/reader/full/competitiveadvantage-of-a-firm-through-supply-chain-responsiveness-and-scm 63/294
Table 2.5.1 List of Sub-Constructs for Competitive Advantage
Constructs Definitions Literature
Price/Cost “The ability of an organization tocompete against major competitors
based on low cost / price” (Li et al.,2006, p. 120)
Koufteros, 1995; Wood etal., 1990; Miller et al., 1992,
Hall et al., 1993; Rondeau etal., 2000
Quality “The ability of an organization to offer product quality and performance that
creates higher value for customers”
(Koufteros, 1995)
Li et al., 2006; Gray andHarvey, 1992;
Arogyaswamy and
Simmons, 1993; Rondeau etal., 2000.
DeliveryDependability
“The ability of an organization to provide on time the type and volume of
product required by customer(s)” (Li et
al., 2006, p. 120)
Li et al., 2005; Hall, 1993,Koufteros et al., 1997;
Rondeau et al., 2000
Product
Innovation
“The ability of an organization to
introduce new products and features in
the market place” (Koufteros, 1995)
Li et al., 2006; Clark and
Fujimoto, 1991; Rondeau et
al., 2000.
Time to Market “The ability of an organization to
introduce new products faster than
major competitors” (Li et al., 2006, p.
120)
Li et al., 2005; Stalk, 1988;
Vesey, 1991; Handfield and
Pannesi, 1995; Kessler and
Chakrobarti, 1996.
1) Price/Cost. “The ability of an organization to compete against major
competitors based on low price” (Li et al., 2006, p. 120).
2) Quality. “The ability of an organization to offer product quality and
performance that creates higher value for customers” (Koufteros, 1995).
3) Delivery Dependability. “The ability of an organization to provide on time the
type and volume of product required by customer(s)” (Li et al., 2006, p. 120).
4) Product Innovation. “The ability of an organization to introduce new products
and features in the market place” (Koufteros, 1995).
45

8/13/2019 Competitive_advantage of a Firm Through Supply Chain Responsiveness and SCM Practices
http://slidepdf.com/reader/full/competitiveadvantage-of-a-firm-through-supply-chain-responsiveness-and-scm 64/294
5) Time to Market. “The ability of an organization to introduce new products
faster than major competitors” (Li et al., 2006, p. 120).
To sum up, this chapter discussed the theoretical foundation of various constructs
used in this research: SCM practices, modularity based manufacturing practices, supply
chain responsiveness, and competitive advantage. In the next chapter, we present the
research framework that describes the relationships between these constructs along with
the development of research hypotheses.
46
8/13/2019 Competitive_advantage of a Firm Through Supply Chain Responsiveness and SCM Practices
http://slidepdf.com/reader/full/competitiveadvantage-of-a-firm-through-supply-chain-responsiveness-and-scm 65/294
CHAPTER 3: THEORETICAL FRAMEWORK AND HYPOTHESES
DEVELOPMENT
When understanding the phenomenon of supply chain responsiveness, it is
helpful to have a framework within which to work and from which testable hypotheses
can be drawn. A theoretical framework enables predictions to be made about the SCM
practices and modularity based manufacturing practices that affect supply chain
responsiveness and competitive advantage of a firm. It enables observed business
behavior to be evaluated and therefore provides better explanations of the motivations for
the adoption of SCM practices and modularity based manufacturing practices and its
desired consequences.
3.1 Theoretical Framework
To better understand the effect of SCM practices and modularity based
manufacturing practices on supply chain responsiveness, and supply chain responsiveness
on competitive advantage, a framework is established which describes the causal
relationships between SCM practices, modularity based manufacturing practices, supply
chain responsiveness, and competitive advantage (Figure 3.1). The rationale underlying
this research framework is as follows: The SCM practices (between organizations) of a
firm will impact the supply chain responsiveness; also the modularity based
manufacturing practices within an organization will impact the supply chain
47
8/13/2019 Competitive_advantage of a Firm Through Supply Chain Responsiveness and SCM Practices
http://slidepdf.com/reader/full/competitiveadvantage-of-a-firm-through-supply-chain-responsiveness-and-scm 66/294
responsiveness. Finally supply chain responsiveness will impact the competitive
advantage of a firm.
Figure 3.1 exhibits the theoretical model depicting the four constructs discussed in
Chapter 2. The numbers next to each arrow correspond to the five hypotheses to be
developed in this chapter.
The model (Figure 3.1) establishes direct, positive relationships between SCM
practices of firm and supply chain responsiveness; modularity based manufacturing
practices and supply chain responsiveness; and supply chain responsiveness and
competitive advantage of a firm.
The following section will provide theoretical support for each hypothesis.
48

8/13/2019 Competitive_advantage of a Firm Through Supply Chain Responsiveness and SCM Practices
http://slidepdf.com/reader/full/competitiveadvantage-of-a-firm-through-supply-chain-responsiveness-and-scm 67/294
Figure 3.1 Theoretical Model
H4
H1
H3
SCM Practices
H2
H5
3.2 Research Hypothesis 1 (SCM Practices and Supply Chain Responsiveness)
Tully (1994) states that there exists evidence that firms are achieving flexibility,
and thus responsiveness, through the use of SCM practices. Certain SCM practices
directly impact the operational flexibility, and firms should use SCM practices to excel in
attaining responsiveness (Narasimhan and Das, 1999).
Successful SCM can result in lower system inventories, a network of firms that
responds more quickly to market changes, and products that more closely match
customer expectations. Thus, firms pursuing differentiation, cost leadership, or quick
response strategies, or combinations of these can all find benefits from value system or
SCM (Porter, 1985).
• Strategic Supplier Partnership
• Customer Relationship
• Information SharingSupply Chain Responsiveness
• Operations System Responsiveness
• Logistics Process Responsiveness
• Supplier Network Responsiveness
Competitive Advantage
• Price
• Quality
• Delivery dependability
• Time to market
• Product innovation
Modularity Based
Manufacturing Practices
• Product Modularity
• Process Modularity
• Dynamic Teaming
49
8/13/2019 Competitive_advantage of a Firm Through Supply Chain Responsiveness and SCM Practices
http://slidepdf.com/reader/full/competitiveadvantage-of-a-firm-through-supply-chain-responsiveness-and-scm 68/294
Collaboration plays a key role in achieving responsiveness (Liu and Kumar,
2003). Liu and Kumar (2003) observed that collaborative practices such as 3PL, VMI,
and CPFR between supply chain trading partners led to increased supply chain
responsiveness (both flexibility and promptness of response). In a special report of
logistics and transport (2003), information sharing and strategic supplier partnership
practices have been highlighted as the critical steps to being responsive.
The need of today is close coordination with suppliers and customers, as
customers demand faster timely and accurate deliveries (Mentzer et al., 2001).
Generally, a single organization often may not be able to respond quickly to changing
market requirements. Temporary alliances or partnerships with trading partners help to
improve the flexibility and responsiveness of organizations (Gunasekaran and Yusuf,
2002).
Strategic supplier partnerships and early involvement of suppliers in the design
process has been argued to enhance the responsiveness of organizations to design
changes by customers (Power et al., 2001; Narasimhan and Das, 2000; Martin and Grbac,
2003). Close relationship with suppliers, has been empirically found to positively affect
the volume flexibility, mix flexibility and new product flexibility dimensions of
manufacturing flexibility (Suarez et al., 1995). Numerous studies have emphasized the
importance of integrating suppliers, manufacturers, and customers so as to achieve supply
chain responsiveness (Frohlich and Westbrook, 2001; Clinton and Closs, 1997; Storey,
2005; Gunasekaran and Yusuf, 2002; Fulconis and Pache, 2005; Van Hoek et al., 2001;
Herrmann et al., 1995; Christopher, 2000; Smith and Barclay, 1997; Handfield and
Nichols, 2002; Handfield et al., 1998). Working closely with suppliers to design or
50
8/13/2019 Competitive_advantage of a Firm Through Supply Chain Responsiveness and SCM Practices
http://slidepdf.com/reader/full/competitiveadvantage-of-a-firm-through-supply-chain-responsiveness-and-scm 69/294
redesign products and processes, solve problems, as well as prepare back-up plans is
critical in attaining supply chain responsiveness (Storey et al., 2005; Martin and Grbac,
2003; Sheth and Sharma, 1997; Tan et al., 1998; Araujo et al., 1999; Ghosh et al., 1997;
Ellinger, 2000; Lambert and Cooper, 2000; Turner et al., 2000; Harris, 2005; Yusuf et al.,
2004; Lee, 2004). Yusuf et al. (2003), found high correlation between the supplier
partnership practices and responsiveness. Based on the results of an empirical study of
purchasing managers in manufacturing firms, Narasimhan and Das (2000) found that the
selection, development, and integration of suppliers was a key determinant of the
manufacturing firm’s responsiveness. To develop a responsive supply chain, continuous
collaborative improvement among firms has become a strategic imperative (Noori, 2004).
Business-to-business (B2B) electronic commerce (e-commerce) and increasingly
competitive markets, are forcing firms to create and sustain long-term relationships with
their suppliers so as to improve supply chain responsiveness. The case of Dell Inc. is a
living example of supply chain practices such as strategic supplier partnership practice,
close customer relationship practice, and information sharing from which Dell has largely
benefited in terms of being more responsive to the final customer (Magretta, 1998).
Working closely together organizations can eliminate wasteful time and effort (Balsmeier
and Voisin, 1996).
Eisenhardt and Tabrizi (1994) looked at supplier involvement as one key factor in
reducing product development times in the computer industry. One of the many
advantages of supplier participation in new product development includes shorter project
development lead times (Gupta and Souder, 1998; Clark, 1989).
51

8/13/2019 Competitive_advantage of a Firm Through Supply Chain Responsiveness and SCM Practices
http://slidepdf.com/reader/full/competitiveadvantage-of-a-firm-through-supply-chain-responsiveness-and-scm 70/294
A growing trend for strategic supplier partnership practice is for the purpose of
reducing uncertainty and improving lead-time (Bleeke and Ernst, 1991; Whipple and
Gentry, 2000), thus rapidly responding to change in business environment. Verstraete
(2004) argues that building close and trustworthy relations with suppliers with efficient
communication channels, results in increased supply chain responsiveness.
Lee et al. (1999) assert that companies are moving towards collaborative SCM in
an effort to reduce the imbalances in information that result in “bullwhip effect”, while
increasing their responsiveness to the changing market needs (Mentzer et al., 2000).
A sustained relationship between the firm and its customers is essential for
attaining supply chain wide responsiveness (Storey et al., 2005; Mitchell, 1997;
Christine, 1997). Close relationships with customers in a supply chain increases
responsiveness to customers’ needs (Martin and Grbac, 2003, Sheth and Sharma, 1997;
Tan et al., 1998; Araujo et al., 1999; Van Hoek et al., 2001; Christopher, 2000). Harris
(2005) emphasizes close relations with customers, to be customer responsive. Lee (2004)
asserts that close relations with customers and working together to design or redesign
processes, components, and products as well as to prepare backup plans is critical in
attaining supply chain wide responsiveness. For instance, Taiwan Semiconductor
Manufacturing Company (TSMC), the world's largest semiconductor foundry, gives
suppliers and customers proprietary tools, data, and models so they can execute design
and engineering changes quickly and accurately. Yusuf et al. (2003), found high
correlation between the customer relationship practices and responsiveness. Wal-Mart
collaborated with Warner-Lambert to attain mutual benefits of collaborative planning,
forecasting, and replenishment (CPFR) (Parks, 2001). Mutual benefits included an
52
8/13/2019 Competitive_advantage of a Firm Through Supply Chain Responsiveness and SCM Practices
http://slidepdf.com/reader/full/competitiveadvantage-of-a-firm-through-supply-chain-responsiveness-and-scm 71/294
improvement in stock levels on Listerine (from 87% to 98 %), reduced lead times (21 to
11 days), reduced on-hand inventory (by two weeks), more consistent orders, and
increase in sales (by USD 8.5 million). In a similar fashion instead of carrying excess
inventory, General Electric (GE) collaborated with its retailers to respond to customer
demand (Treacy and Wiersema, 1993).
Information sharing plays an important role in constructing a responsive supply
chain network (Lau and Lee, 2000). Storey et al. (2005) assert that a great amount of
visibility through the supply chain is required in order to attain supply chain
responsiveness. This would it is argued, enable all the players in the supply chain “to see
from one end of the pipeline to another in as close to real time as possible” (Storey et al.,
2005, p. 244). It has been argued that information sharing between firms in a supply
chain enable organizations to rapidly respond to market conditions (Martin and Grbac,
2003; Handfield and Nichols, 2002; Hult et al., 1996; Gosain et al., 2004). Information
sharing practice in a supply chain increases responsiveness to customers’ needs in a
supply chain (Martin and Grbac, 2003, Sheth and Sharma, 1997; Tan et al., 1998; Araujo
et al., 1999; Van Hoek et al., 2001; Christopher, 2000). Fawcett et al. (1996) consider
information sharing as an antecedent to flexibility. Lambert and Cooper (2000) argue that
information sharing between the supply chain entities encourages responsiveness of a
firm’s supplier network. Tan et al. (1998) found that information sharing between trading
partners increased customer responsiveness of the firm. Information sharing between
trading partners can reduce uncertainty and improve supply chain responsiveness
(Christopher and Peck, 2004). Lee (2004) asserts that trading partners need to share
information / data on changes in supply and demand continuously so they can respond
53
8/13/2019 Competitive_advantage of a Firm Through Supply Chain Responsiveness and SCM Practices
http://slidepdf.com/reader/full/competitiveadvantage-of-a-firm-through-supply-chain-responsiveness-and-scm 72/294
quickly. He cites the example of Cisco which recently created an e-hub, which connects
suppliers and the company via the Internet. This allows all the firms to have the same
demand and supply data at the same time, to spot changes in demand or supply problems
immediately, and to respond in a concerted fashion. Yusuf et al. (2003) found high
correlation between data integration with other companies in a supply chain, and
responsiveness. Sharing of information with partners is detrimental to supply chain
flexibility (Gosain et al., 2004) and thus responsiveness.
Open sharing of information such as inventory levels, forecasts, sales promotion
strategies, and marketing strategies reduces the uncertainty between supply chain partners
(Andel, 1997; Lewis and Talalayevsky, 1997; Lusch and Brown, 1996; Salcedo and
Grackin, 2000) shall thus enable firms to respond rapidly to unexpected events on either
customer or supply side. According to Stein and Sweat (1998), information sharing
between trading partners enables individual organizations to better understand the needs
of the end customer thus facilitating quick response to market changes. Information
sharing with suppliers has given Dell Company the benefits of faster cycle times, reduced
inventory, and improved forecasts (Magretta, 1998; Stein and Sweat, 1998).
Simatupang and Sridharan (2005), contend that information sharing enables the
supply chain members to make effective decisions to address product flows quickly
thereby increasing responsiveness. For example, demand and inventory visibility can
minimize stock-outs by accurately replenishing hot products (Fisher, 1997), thereby
rendering more responsive partners to the changing customer demand.
54
8/13/2019 Competitive_advantage of a Firm Through Supply Chain Responsiveness and SCM Practices
http://slidepdf.com/reader/full/competitiveadvantage-of-a-firm-through-supply-chain-responsiveness-and-scm 73/294
Lummus and Vokurka (1999) emphasize the information sharing between trading
partners in a supply chain to respond more quickly to consumer needs. The above
arguments lead to:
Hypothesis 1: ‘SCM practices’ of a firm is positively related to supply chain
responsiveness.
3.3 Research Hypothesis 2 (Modularity Based Manufacturing Practices and Supply
Chain Responsiveness)
As uncertainty in supply and demand, markets and technology intensifies, more
companies are adopting modular product and process architectures to cope with changing
customer demands (Tu et al., 2004).
Feitzinger and Lee (1997) emphasize on both: effective SCM practices as well as
the modularity based manufacturing practices as essential and vital for attaining cost
effective responsiveness. Gunasekaran and Yusuf (2002), Abair (1997), Sharifi (1998),
and Van Hoek et al. (2001), advocate the fact that modular product design is vital for
attaining responsiveness.
Product modularity (or modular product design) provides the suppliers with the
responsiveness that it needs to cater to the firm’s demand changes due to its ability to
customize products quickly and inexpensively (Feitzinger and Lee, 1997; Hopwood,
1995; Mikkola and Larsen, 2004)
Many companies are exploring ways to do this to respond to constantly changing
demands. Yang et al. (2004) affirm that having modules with standardized interfaces is of
the most efficient options to achieve responsiveness in supply chains.
55

8/13/2019 Competitive_advantage of a Firm Through Supply Chain Responsiveness and SCM Practices
http://slidepdf.com/reader/full/competitiveadvantage-of-a-firm-through-supply-chain-responsiveness-and-scm 74/294
Modularity based manufacturing practices improves a company’s flexibility by
effectively meeting the changing needs of the customer, with quick response and greater
product variety (Lee et al., 1993; Sanchez, 1999). In recent times the amount of research
addressing product and process modularity has greatly increased. Increasing number of
products are now being manufactured using modular parts and processes. Some of the
companies that come to mind are Dell Computer, Hewlett-Packard (HP), Motorola,
Toyota Motor Corporation National Bicycle Industry Company in Japan (NBIC), and the
clothing manufacturer Benetton among others.
Modular architectures minimize the physical changes that are needed to achieve a
functional change (Mikkola, 2003), thus enabling quick customer response.
There is a high degree of modularity based manufacturing practices across almost
all industry segments today. Toyota is gearing itself to deliver a custom built car within
five days of receiving the order (Simison, 1999). Dell promises delivery of a customized
PC within a few days of receiving the order. Motorola delivers their made-to-order
cellular phones the next day to customers anywhere in the United States. Proctor and
Gamble once offered 13 different product designs in their pamper phases line to reflect
the change in infants as they grow from newborns to toddlers (Pine, 1999). All this is the
consequence of modular product and process designs which enables organizations and for
that matter supply chains to rapidly respond to customer demand.
Feitzinger and Lee (1997) based on a case study of Hewlett Packard, observe that
modularity based manufacturing practices leads to higher supply chain responsiveness as
it gives the supply chain the ability to postpone differentiation as close to the customer as
possible. Feitzinger and Lee (1997) cite the example of HP which due to its product
56

8/13/2019 Competitive_advantage of a Firm Through Supply Chain Responsiveness and SCM Practices
http://slidepdf.com/reader/full/competitiveadvantage-of-a-firm-through-supply-chain-responsiveness-and-scm 75/294
modularity practice (viz: standardizing the basic/common components in the LaserJet
printer and customizing the product close to the customer – as per demand) improved its
responsiveness to customer demand. McCutcheon and Raturi (1994) suggested that
modular product design is the best way to provide variety and speed, thereby leading to
customer responsiveness, which occurs when customers demand greater variety, and
reduced delivery times simultaneously.
Although the principles of modular production have been discussed for decades
(Starr, 1965; Ulrich & Tung, 1991), their strategic potentials are only recently being
rediscovered by many leading manufacturers as they seek improved responsiveness to
compete in an increasingly uncertain marketplace (Sanchez and Collins, 2001; Ketchen
and Hult, 2002; Pine, 1993).
Modular products can be disaggregated and recombined into new configurations
with little loss of functionality, thus giving organizations the ability to rapidly configure a
variety of products as customer demand changes. A complex system can thus be easily
managed by dividing it into smaller modules and examining each piece separately.
By developing the ability to produce a wide variety of products through assembly
of standardized modules, manufacturers can expect to significantly reduce uncertainty
and complexity (Sanchez, 2000), thus reducing the time to respond. Drucker (1990)
predicted that the factory of 1999 will be highly modular with products being built from
standard component modules and processes, which shall allow rapid product changes and
rapid response to market demands. Baldwin and Clark (1997, 2000) argue that it is
modularity, more than any other technology that makes rapid developments in computer
industry possible.
57
8/13/2019 Competitive_advantage of a Firm Through Supply Chain Responsiveness and SCM Practices
http://slidepdf.com/reader/full/competitiveadvantage-of-a-firm-through-supply-chain-responsiveness-and-scm 76/294
Modular products can be quickly assembled from individual component modules
(i.e. assemble to order) thus enabling wide variety of products from a few common
standard modules. Doing this enables firms to rapidly respond to changing customer
demand with a lead time equal to that dictated by final assembly process near to the
customer (Ulrich, 1995). Furthermore Ulrich (1995) contends that use of standard
components can lower the lead time of product development as well as the lead time of
the project (if component development would have been on the project critical path),
once again adding to the responsiveness of the firm and effectively the supply chain as a
whole.
In the automobile industry, Ford, GM, VW, and Chrysler are introducing modular
assembly lines and modular cars to improve the responsiveness of production process
(Suzik, 1999; Salerno, 2001). Modular design has also been an important factor in
Microsoft’s on-time delivery of its extremely complex Windows operating systems
(Eisenhardt & Brown, 1998).
Studies have shown that modularity has significant impacts on a firm’s supply
chain (Tu et al., 2004). Ulrich and Tung (1991) detail the benefits of modularity which
include - rapid product updating/modification, rapid product building (decreased order
lead time) with increased variety, rapid design and testing – which implies that
modularity leads to the responsiveness of the operations systems. Since modularity helps
postpone the final assembly and customization of the final product as close to the
customer in time it leads to logistics process responsiveness as well. Furthermore
modularity assists organizations to source different modules from individual suppliers,
instead of sourcing the whole product, this helps postponed purchasing of these modules
58
8/13/2019 Competitive_advantage of a Firm Through Supply Chain Responsiveness and SCM Practices
http://slidepdf.com/reader/full/competitiveadvantage-of-a-firm-through-supply-chain-responsiveness-and-scm 77/294
or subassemblies (rather than purchasing whole product) thereby implying an improved
supplier network responsiveness.
Product modularity and process modularity are crucial to agile manufacturing and
provide a way to rapidly respond to changing customer requirements (Kidd, 1994).
Baldwin and Clark (1997; 2000) suggest that modularity is an effective manufacturing
strategy that enables firms to cope with rapidly changing customer requirements and
increasing technical complexity, thus enabling organizations to achieve responsiveness.
Prater et al. (2001) in his case study research presents the case study of Hewlett
Packard, which reduced the uncertainty by designing the product appropriately so as to
customize it only when individual orders are received. This strategy is referred to as
postponement and is a crucial part within the logistic structure (Hise, 1995). Thus product
modularity has enabled HP to gain responsiveness to customer demand changes. Lee
(2004) asserts that designing products so that they share common parts (i.e. product
modularity) and processes (i.e. process modularity) initially and differ substantially only
by the end of the production process is one of the most important ways to respond
quickly to demand fluctuations, because it allows the firms to finish products only when
they have accurate information on consumer preferences.
For manufacturers, modularity enables them to handle increasingly complex
technology (Tu, 1999) and respond faster to changing customer demand by creating more
variety of products from a set of common modules or subassemblies. By breaking up a
product into modules, designers and producers have the flexibility so as to respond
rapidly to any uncertainties (Baldwin and Clark, 1997).
59
8/13/2019 Competitive_advantage of a Firm Through Supply Chain Responsiveness and SCM Practices
http://slidepdf.com/reader/full/competitiveadvantage-of-a-firm-through-supply-chain-responsiveness-and-scm 78/294
As customers become more demanding, modularity based practices shall enable
firms to design and operate production systems that can meet the specific needs of
customers with speed (Tu et al., 2004).
Salvador et al. (2002) based on case studies, observes that modularity increases
the responsiveness of suppliers of individual components thus enabling rapid assembly of
the final product close to the customer, in time.
Process modularity enables re-sequencing / addition of new process modules to
customize the products in response to changing customer demand, thus increasing the
responsiveness of the supply chain (Tu et al., 2004). Product and process modularity
leads to a responsive supply chain that can satisfy individual customer needs without
incurring higher production and inventory costs (Van Hoek and Weken, 1998; Tu et al.,
2004).
Firms can reorganize and reconfigure teams quickly and without loss of
efficiency, so response time is short yet the quality of the product design and process
execution are high (Tu et al. 2004). When companies form loosely coupled networks of
modular, flexible working units, instead of tightly coupled teams, these groups of people,
processes, and technology can be easily reconfigured to meet the ever changing customer
needs and thus attain responsiveness in the operations system (Weick, 1990; Tu et al.,
2004).
Traditional organizations have fairly stable boundaries, modular organizations can
quickly be recast as needed as per the task thus increasing flexibility (Ketchen and Hult,
2002) and speed in responding to changes in business conditions. Thus to summarize
60

8/13/2019 Competitive_advantage of a Firm Through Supply Chain Responsiveness and SCM Practices
http://slidepdf.com/reader/full/competitiveadvantage-of-a-firm-through-supply-chain-responsiveness-and-scm 79/294
modularity based manufacturing practices leads to overall supply chain responsiveness.
The above arguments lead to:
Hypothesis 2: ‘ Modularity based manufacturing practices’ of a firm is positively related
to supply chain responsiveness.
3.4 Research Hypothesis 3 (Supply Chain Responsiveness and Competitive
Advantage)
The improvement of flexibility and speed of response has become increasingly
important as a method to achieve competitive advantage (Upton, 1997; Martin and Grbac,
2003). Responsiveness to customer is critical to gaining competitive advantage
(Williamson, 1991; Martin and Grbac, 2003). Ellinger (2000) argues that competitive
advantage accrues to those firms who are responsive to the customer needs. Lummus et
al. (2003) argue that in the future, as supply chains compete with other supply chains,
organizations must understand that responsive supply chains will outperform those that
are less responsive. Creating responsive supply chains has become a source of
competitive advantage (Lau and Hurley, 2001).
Firms with more responsive supply chains will be more adaptive to demand
fluctuations and will handle this uncertainty at a lower cost due to the shorter lead time
(Randall et al., 2003). Yusuf et al. (1999) argues that lean manufacturing compromises
responsiveness over cost-efficiencies, however agile manufacturers place equal
importance on both cost and responsiveness. Cost and quality have been long
incorporated into agile competitive bases (Yusuf et al., 1999). Gunasekaran and Yusuf
(2002) emphasize that responsiveness without cost effectiveness is not a real competitive
61

8/13/2019 Competitive_advantage of a Firm Through Supply Chain Responsiveness and SCM Practices
http://slidepdf.com/reader/full/competitiveadvantage-of-a-firm-through-supply-chain-responsiveness-and-scm 80/294
strategy. However Yusuf et al. (2003) found that cost and responsiveness do not go hand
in hand. However due to visa-versa arguments, we maintain here that - on the whole -
supply chain responsiveness and competitive advantage are positively related. Yusuf et
al. (2003) found high correlation between the responsiveness and time to market,
dependability, product innovation and quality.
Towill (1996) suggests that the effective engineering of cycle time reduction will
lead to significant improvements in manufacturing costs and productivity. Towill (1996)
further argues that reduction in lead times is the necessary condition for a responsive
supply chain and which further reduces the time to market. Sharifi and Zhang (2001) and
Aitken et al. (2002), emphasize that responsiveness in the supply chain is a source of
competitive advantage. A 1997 study (Allnoch, 1997) of 225 manufacturers found that
average companies required much more time to respond to changes in customer demand
than did the leading manufacturers. In some cases, as much as eight times longer was
required. The study also found that while leading manufacturers required two weeks to
meet increased production requirements per customer demand, average companies
required four weeks to four months. The result ? These leading companies outperformed
their peers and realized huge cost savings and other competitive advantages. Thus we
propose here, that supply chain responsiveness shall reduce the costs, while leading to
competitive advantage for firms on other dimensions as well.
Being operationally responsive will enable organizations to compete based on
cost, quality, time to market, and delivery dependability; responsiveness of a firm’s
logistics (transportation and distribution) process will enable organizations to introduce
new products faster than major competitors (i.e. increasing the time to market), and also
62

8/13/2019 Competitive_advantage of a Firm Through Supply Chain Responsiveness and SCM Practices
http://slidepdf.com/reader/full/competitiveadvantage-of-a-firm-through-supply-chain-responsiveness-and-scm 81/294
lead to greater ability of a firm to provide on time the type and volume of product
required by customers (i.e. increasing delivery dependability); responsiveness of a firm’s
supplier network will improve - the ability of the firm to rapidly introduce new products
and features in the market place (i.e. compete based on product innovation and time to
market), as well as improve a firm’s ability to provide on time delivery (i.e. increase its
delivery dependability) as these firms will be endowed with responsive suppliers.
A supply chain characterized by quick responsiveness to customers will be
competitive in terms of time and quality (Li, 2002). The above arguments lead to:
Hypothesis 3: Supply Chain Responsiveness is positively related to competitive
advantage of a firm.
3.5 Research Hypothesis 4 (SCM Practices and Competitive Advantage)
Effective SCM produces competitive advantage for a firm in that it is said to
reduce costs (Martin and Grbac, 2003; Sheth and Sharma, 1997; Tan et al., 1998; Araujo
et al., 1999). SCM practices have been found to be positively related to competitive
advantage (price, quality, delivery dependability, product innovation, and time to market)
in prior literature (ex: Li et al., 2006)
It has been pointed out that practicing SCM has become an essential requirement
to staying competitive and growing profitably in today’s global race (Power et al., 2001;
Moberg et al., 2002).
Larson and Kulchitsky (1998), in an empirical study found that developing
strategic supplier partnerships also lead to cost effectiveness of the focal firm.
Christopher (1992) states that, the greater the collaboration, at all levels, between supplier
63
8/13/2019 Competitive_advantage of a Firm Through Supply Chain Responsiveness and SCM Practices
http://slidepdf.com/reader/full/competitiveadvantage-of-a-firm-through-supply-chain-responsiveness-and-scm 82/294
and customer, the greater the likelihood that competitive advantage can be gained by
organizations. Extensively coordination with suppliers and involving them in new
product development process has been found to enhance the ability of organizations to
develop successful new products, and thus gain competitive advantage in the marketplace
(Ragatz et al., 2002; Twigg, 1998). Ragatz et al. (2002) found that supplier integration
can reduce material costs and quality, product development time and cost, and
manufacturing cost while improving functionality. Advantages of supplier participation
in new product development include reduced project costs (Kessler, 2000; Clark, 1989),
and improved perceived product quality (McGinnis and Vallopra, 1999; Ragatz et al.,
1997). A long-term relationship with the supplier will have a lasting effect on the
competitiveness of the entire supply chain (Choi and Hartley, 1996; Kotabe et al., 2003).
Sharing information (and data) with other parties within the supply chain can be
used as a source of competitive advantage (Jones, 1998; Novack et al., 1995).
Furthermore, Tompkins and Ang (1999) consider the effective use of pertinent, timely,
and accurate information by supply chain members as a key competitive factor.
Information sharing with suppliers has given Dell Corp. the benefits of faster cycle times
(implying faster time to market), reduced inventory (implying reduced costs), and
improved forecasts. Customers, for their part, have benefited by getting a higher-quality
product at a lower price (Magretta, 1998; Stein and Sweat, 1998). The above arguments
lead to:
Hypothesis 4: ‘SCM practices’ of a firm is positively related to competitive advantage of
a firm.
64
8/13/2019 Competitive_advantage of a Firm Through Supply Chain Responsiveness and SCM Practices
http://slidepdf.com/reader/full/competitiveadvantage-of-a-firm-through-supply-chain-responsiveness-and-scm 83/294
3.6 Research Hypothesis 5 (Modularity Based Manufacturing Practices and
Competitive Advantage)
By developing the ability to produce a wide variety of products through
assembling standardized modules, manufacturers can expect to cut product development
time (and thus improve time to market new products), and lower overall costs (Sanchez,
2000).
Drucker (1990) had predicted that the factory of 1999 will be highly modular with
product being built from standard component modules and processes, which shall allow
low cost production of ‘options’ or ‘special products’ in fairly small batches. Modularity
results in better-integrated designs with more value to the customer, an integrated quality
focus, and reduced piece cost and investment (Suzik, 1999). Use of existing standard
components can lower the complexity and cost of products (due to no development
resources needed) (Ulrich, 1995).
As customers become more demanding, managers must understand how to use
modularity principles to design, and operate production systems that can meet the
specific needs of the customers with speed, in large volumes so economies of scope are
achieved, and at a cost that is close to mass produced goods (Tu et al., 2004). Designing
products and processes into modules, is cost effective due to the use of standard base
units and product customization when customer orders are received (Feitzinger and Lee,
1997; McCutcheon and Raturi, 1994).
The computer industry has dramatically increased its rate of innovation through
the widespread adoption of modular designs (Baldwin and Clark, 1997). Baldwin and
65

8/13/2019 Competitive_advantage of a Firm Through Supply Chain Responsiveness and SCM Practices
http://slidepdf.com/reader/full/competitiveadvantage-of-a-firm-through-supply-chain-responsiveness-and-scm 84/294
Clark (1997) further contend that modularity and responsiveness are both instrumental in
the heightened rate of innovation. The above arguments lead to:
Hypothesis 5: ‘ Modularity based manufacturing practices’ of a firm is positively related
to competitive advantage of a firm.
In sum, this chapter provides a theoretical framework for understanding the
practices influencing supply chain responsiveness and competitive advantage of a firm
and develops five hypotheses based on literature review. The following chapter will
discuss the research methodology for generating items for measurement instruments.
66

8/13/2019 Competitive_advantage of a Firm Through Supply Chain Responsiveness and SCM Practices
http://slidepdf.com/reader/full/competitiveadvantage-of-a-firm-through-supply-chain-responsiveness-and-scm 85/294
CHAPTER 4: INSTRUMENT DEVELOPMENT - ITEM GENERATION AND
PILOT TEST
In this chapter, the instruments for this research are developed and tested.
Instruments to measure SCM practices, modularity based manufacturing practices, and
competitive advantage were adopted from previous studies with minor modifications (Li
et al., 2005; Tu et al., 2004; Solis-Galvan, 1998; Li et al., 2006; Koufteros, 1995). Since
these instruments have been tested in previous studies and were found to be valid and
reliable, they will not be tested again in the pilot study. Instead, they will be revalidated
in the large-scale analysis. The construct supply chain responsiveness has been newly
developed in this research. Thus the instrument to measure supply chain responsiveness
(consisting of operations system responsiveness, logistics process responsiveness and
supplier network responsiveness) will be developed and pilot tested.
The development of the instrument was carried out in two stages. As per
Churchill (1979), the content validity is enhanced if steps are taken to ensure that the
domain of the construct is covered. In accordance with Churchill (1979), in the first pre-
pilot stage (also called as the pre-testing stage), potential items were generated through a
literature review and from construct definitions. Then the initial pool of items was pre-
tested with six academicians, one practitioner and one doctoral student. Also the
definitions of the sub-constructs - operations system responsiveness, logistics process
responsiveness and supplier network responsiveness - were presented to these
67
8/13/2019 Competitive_advantage of a Firm Through Supply Chain Responsiveness and SCM Practices
http://slidepdf.com/reader/full/competitiveadvantage-of-a-firm-through-supply-chain-responsiveness-and-scm 86/294
respondents to receive input on accuracy and modifications. Further the respondents
were asked to provide feedback on representativeness, clarity, specificity, ease of
understanding and interpretation of the questions. The respondents were also requested to
provide instructions on the length of the questionnaire. Based on the feedback, items
were modified or discarded, and definitions were modified to ensure that the domain of
the construct is covered and thus strengthen the content validity. The second stage was
scale development and testing through a pilot study using Q-sort method. Items placed in
a common pool were subjected to required number of sorting rounds (three in our case)
by the judges to establish which items should be in the various categories. The objective
was to pre-assess the convergent and discriminant validity of the scales by examining
how the items were sorted into various construct categories. Analysis of inter-judge
agreement about the item placements identified both bad items as well as weakness in the
original definitions of the constructs. The instruments were further refined based on Q-
sort results. The Q-sort is then followed by the large scale survey which includes the
validity and reliability tests using the data from large-scale sample and is described in
detail in Chapter 5. Research hypotheses were then tested based on the large-scale data
analysis.
4.1 Item Generation and Structured Interview (Pre-Pilot / Pre-test)
Proper generation of measurement items of a construct determines the validity
and reliability of an empirical research. The very basic requirement for a good measure is
content validity, which means the measurement items contained in an instrument should
cover the major content of a construct (Churchill, 1979). Content validity is usually
achieved through a comprehensive literature review and interviews with practitioners and
68
8/13/2019 Competitive_advantage of a Firm Through Supply Chain Responsiveness and SCM Practices
http://slidepdf.com/reader/full/competitiveadvantage-of-a-firm-through-supply-chain-responsiveness-and-scm 87/294
academicians. A list of initial items for each construct was generated based on a
comprehensive review of relevant literature. The general literature basis for items in the
newly developed supply chain construct is briefly discussed below.
The items for Supply Chain Responsiveness (Operations Systems
Responsiveness, Logistics Process Responsiveness, and Supplier Network
Responsiveness) were generated through supply chain flexibility literature,
manufacturing flexibility literature, supply chain agility literature, agile manufacturing
literature, and customer responsiveness literature (Prater et al., 2001; Lummus et al.,
2003; Duclos et al., 2003; Van Hoek, 2000; Fawcett, 1992; Fawcett et al., 1996; Fawcett
and Smith, 1995; Lau, 1999; Emerson and Grimm, 1998; Martin and Grbac, 2003).
Once item pools were created, items for the various constructs were reviewed by
six academicians and a doctoral student, and further re-evaluated through a structured
interview with one practitioner. The focus was to check the relevance of each construct’s
definition and clarity of wordings of sample questionnaire items. Based on the feedback
from the academicians and practitioners, redundant and ambiguous items were either
modified or eliminated. New items were added whenever deemed necessary. The result
was the following number of items in each pool entering Q-sort analysis (see Appendix
A). There were a total of 3 pools and 18 items.
Supply Chain Responsiveness
Operations System Responsiveness 7Logistics Process Responsiveness 5
Supplier Network Responsiveness 6
Total 18
69
8/13/2019 Competitive_advantage of a Firm Through Supply Chain Responsiveness and SCM Practices
http://slidepdf.com/reader/full/competitiveadvantage-of-a-firm-through-supply-chain-responsiveness-and-scm 88/294
4.2 Scale Development: the Q-Sort Method
Items placed in a common pool were subjected to three Q-sort rounds by two
independent judges per round. The objective was to pre-assess the convergent and
discriminant validity of the scales by examining how the items were sorted into various
factors or dimensions.
The basic procedure was to have relevant respondents representing the target
population (in our case, purchasing/materials/supply chain/operations vice presidents and
managers) act as judges and sort the items into several groups, each group corresponding
to a factor or dimension, based on similarities and differences among items. An indicator
of construct validity was the convergence and divergence of items within the categories.
If an item was consistently placed within a particular category, then it was considered to
demonstrate convergent validity with the related construct, and discriminant validity with
the others. Analysis of inter-judge disagreements about item placement identified both
bad items, as well as weakness in the original definitions of constructs. Based on the
misplacements made by the judges the items could be examined and inappropriately
worded or ambiguous items could be either modified or eliminated.
4.2.1 Sorting Procedures
One 3’’ by 5” card was printed for each item. The set of cards for each construct
were shuffled and given to the judges. The definitions of the constructs were also given to
the judges. The judges were then asked to put each card under one of the constructs to the
best of their knowledge. A “Not Applicable” category was also included to ensure that
70

8/13/2019 Competitive_advantage of a Firm Through Supply Chain Responsiveness and SCM Practices
http://slidepdf.com/reader/full/competitiveadvantage-of-a-firm-through-supply-chain-responsiveness-and-scm 89/294
the judges did not force any item into a particular category. A pair of judges included a
vice president and purchasing manager or a materials manager and purchasing manager
to ensure that the perception of the target population is included in the analysis. Prior to
sorting the cards, the judges were briefed with a standard set of instructions that were
previously tested with a separate judge to ensure comprehensiveness and
comprehensibility of the instructions. Judges were allowed to ask as many questions as
necessary to ensure they understood the procedure.
4.2.2 Inter-Rater Reliabilities
To assess the reliability of the sorting conducted by the judges, three different
measures were used. First, for each pair of judges in each sorting step, the inter-judge raw
agreement scores were calculated. This was done by counting the number of items both
judges agreed to place in a certain category. An item was considered as an item with
agreement, though the category in which the item was sorted together by both judges may
not be the originally intended category. Second, the level of agreement between the two
judges in categorizing the items was measured using Cohen’s Kappa (Cohen, 1960). This
index is a method of eliminating chance agreements, thus evaluating the true agreement
score between two judges. A description of the Cohen’s Kappa concept and methodology
is included in Appendix B. Third, item placement ratio (or Moore and Benbasat’s (1991)
“Hit Ratio”) was calculated by counting all the items that were correctly sorted into the
target category by the judges for each round and dividing them by twice the total number
of items.
71

8/13/2019 Competitive_advantage of a Firm Through Supply Chain Responsiveness and SCM Practices
http://slidepdf.com/reader/full/competitiveadvantage-of-a-firm-through-supply-chain-responsiveness-and-scm 90/294
4.2.3 Results of First Sorting Round
In the first round, the inter-judge raw agreement scores averaged 83% (Table
4.2.3.1), the initial overall placement ratio of items within the target constructs was 91%
(Table 4.2.3.2), and the Cohen’s Kappa score averaged 0.74.
The calculation for Cohen’s Kappa coefficient is shown below.
74.0116)18)(18(
116)15)(18(
)(
)(
2 =
−
−=
−
−=
∑
∑
++
++
i iii
i iiiii
N
X X X N k
The calculation of the k is based on Table 4.2.3.1. N i is the number of total items
(18); X ii is the total number of items on the diagonal, that is, the number of items agreed
on by two judges (15); is the total number of the items on the ith row of the table;
and
X i+
X i+ is the total number of items on the i th column of the table (see Appendix B for
the description of this methodology).
A summary of the first round inter-judge agreement indices is shown in the first
column of Table 4.2.3.3. For Kappa, no general agreement exists with respect to required
scores. However, several studies have considered scores greater than 0.65 to be
acceptable (e.g. Vessey, 1984; Jarvenpaa, 1989). Landis and Koch (1977) have provided
a more detailed guideline to interpret Kappa by associating different values of this index
to the degree of agreement beyond chance. They suggest the following guideline:
Value of KappaDegree of Agreement
Beyond Chance.76 - 1.00 Excellent
.40 - .75 Fair to Good (Moderate)
.39 or less Poor
Following the guidelines of Landis and Koch (1977) for interpreting the Kappa
coefficient, the value of 0.74 indicates a moderate but almost excellent level of agreement
72

8/13/2019 Competitive_advantage of a Firm Through Supply Chain Responsiveness and SCM Practices
http://slidepdf.com/reader/full/competitiveadvantage-of-a-firm-through-supply-chain-responsiveness-and-scm 91/294
(beyond chance) for the judges in the first round. This value is lower than the value for
raw agreement which is 0.83. The level of item placement ratios averaged 0.91. For
instance, the lowest item placement ratio value was 0.70 for the logistics process
responsiveness, indicating a low degree of construct validity.
Table 4.2.3.1 Inter-Judge Raw Agreement Scores: First Sorting Round
Judge 1
1 2 3 NA
1 7
2 3 2
3 6
J u d g e 2
NA
Total Item Placement: 18 Number of Agreements: 15 Agreement Ratio: 83 %
1. Operations system responsiveness
2. Logistics process responsiveness
3. Supplier network responsiveness
73

8/13/2019 Competitive_advantage of a Firm Through Supply Chain Responsiveness and SCM Practices
http://slidepdf.com/reader/full/competitiveadvantage-of-a-firm-through-supply-chain-responsiveness-and-scm 92/294
Table 4.2.3.2 Items Placement Ratios: First Sorting Round
Actual Categories
1 2 3 NA Total %
1 14 14 100 %
2 3 7 10 70 %
T h e o r e t i c a l
C a t e g o r i e s
3 12 12 100 %
Item Placements: 36 Hits: 33 Overall “Hit Ratio”: 91 %
1. Operations system responsiveness
2. Logistics process responsiveness
3. Supplier network responsiveness
4.2.3.3 Inter-Judge Agreements
Agreement Measure Round 1 Round 2
Raw Agreement 83% 100%
Cohen’s Kappa 74% 100%
Item Placement Ratio Summary
Operations system responsiveness 100% 100%
Logistics process responsiveness 70% 100%
Supplier network responsiveness 100% 100%
Average 91% 100%
74
8/13/2019 Competitive_advantage of a Firm Through Supply Chain Responsiveness and SCM Practices
http://slidepdf.com/reader/full/competitiveadvantage-of-a-firm-through-supply-chain-responsiveness-and-scm 93/294
On the other hand, the constructs - operations system responsiveness and supplier
network responsiveness - obtained a 100% item placement ratio, indicating a high degree
of construct validity.
In order to further improve the Cohen’s Kappa measure of agreement, an
examination of the off-diagonal entries in the placement matrix (Table 4.2.3.2) was
conducted. This was done in two parts: one part looked at clustering and the other part at
scattering. The first part of the analysis revealed one moderate cluster involving two
constructs (operations system responsiveness and logistics process responsiveness, with
three items from the latter being classified into the former). An analysis of this cluster
was conducted to identify ambiguous items (fitting in more than one category) or
indeterminate items (fitting in no category), and were reworded. The second part of the
analysis included looking for scattering. Scattering of a construct, raises concern for the
level of its internal consistency. There was no scattering of items observed for any
construct. Also, feedback from both judges was obtained on each item and incorporated
into the modification of the items. Further the definitions of logistics process
responsiveness and supplier network responsiveness were slightly modified based on the
feedback from judges. Overall, two items were reworded, with none being deleted. The
number of items for each construct remained unchanged after the first round of Q-sort:
Supply Chain Responsiveness
Operations System Responsiveness 7
Logistics Process Responsiveness 5Supplier Network Responsiveness 6
Total 18
75

8/13/2019 Competitive_advantage of a Firm Through Supply Chain Responsiveness and SCM Practices
http://slidepdf.com/reader/full/competitiveadvantage-of-a-firm-through-supply-chain-responsiveness-and-scm 94/294
4.2.4 Results of Second Sorting Round
Again, two judges were involved in the second sorting round, which included the
reworded items after the first sorting round. In the second round, the inter-judge raw
agreement scores averaged 100% (Table 4.2.4.1), the initial overall placement ratio of
items within the target constructs was 100% (Table 4.2.4.2), and the Cohen’s Kappa
score averaged 1.00.
A summary of the second round inter-judge agreement indices is shown in the
second column of Table 4.2.3.3.
Table 4.2.4.1 Inter-Judge Raw Agreement Scores: Second Sorting Round
Judge 1
1 2 3 NA
1 7
2 5
3 6
J u d g e
2
NA
Total Item Placement: 18 Number of Agreements: 18 Agreement Ratio: 100 %
1. Operations system responsiveness
2. Logistics process responsiveness
3. Supplier network responsiveness
76

8/13/2019 Competitive_advantage of a Firm Through Supply Chain Responsiveness and SCM Practices
http://slidepdf.com/reader/full/competitiveadvantage-of-a-firm-through-supply-chain-responsiveness-and-scm 95/294
The value for Kappa coefficient of 1.00 is much higher than the value obtained in
the first round (.74), indicating an excellent level of agreement for the judges in the
second round. The level of item placement ratios averaged 1.00. All the three constructs
- operations system responsiveness, logistics process responsiveness and supplier
network responsiveness - obtained a 100% item placement ratio, indicating a high degree
of construct validity.
Table 4.2.4.2 Items Placement Ratios: Second Sorting Round
Actual Categories
1 2 3 NA Total %
1 14 14 100 %
2 10 10 100 %
T h e o r e t i c a l
C a t e g o r i e s
3 12 12 100 %
Item Placements: 36 Hits: 36 Overall “Hit Ratio”: 100 %
1. Operations system responsiveness
2. Logistics process responsiveness
3.
Supplier network responsiveness
77
8/13/2019 Competitive_advantage of a Firm Through Supply Chain Responsiveness and SCM Practices
http://slidepdf.com/reader/full/competitiveadvantage-of-a-firm-through-supply-chain-responsiveness-and-scm 96/294
The Cohen’s Kappa measure of agreement is excellent in round two. There are no
off-diagonal entries in the placement matrix (Table 4.2.4.2) revealing absence of any
clustering or scattering. Feedback from the judges in round two led to the replacement of
one item for supplier network responsiveness to capture the domain of the construct (for
inbound logistics to the firm from the supplier). Further, four items were slightly
modified based on comments from judges in round two.
A third round of Q-sort was further conducted. However, the results of the third
round were similar to those obtained in the second sorting round, and thus they have not
been reported in the study.
After the second Q-sort round the number of items for each construct remained
unchanged (a total of 18 items into 3 pools) and were as follows:
Supply Chain Responsiveness
Operations System Responsiveness 7Logistics Process Responsiveness 5
Supplier Network Responsiveness 6Total 18
At this point, we stopped the Q-sort method at round two, for the raw agreement
score of 1.0, Cohen’s Kappa of 1.0, and the average placement ratio of 1.0 which were
considered an excellent level of inter-judge agreement, indicating a high level of
reliability and construct validity. The resulting measurement scale for supply chain
responsiveness is reported in Appendix C and will be used in the large-scale survey
(Appendix D). Tests for the quantitative assessment of construct validity and reliability
using the large-scale sample are presented in the next chapter .
78

8/13/2019 Competitive_advantage of a Firm Through Supply Chain Responsiveness and SCM Practices
http://slidepdf.com/reader/full/competitiveadvantage-of-a-firm-through-supply-chain-responsiveness-and-scm 97/294
CHAPTER 5: LARGE SCALE SURVEY AND INSTRUMENT VALIDATION
5.1 Large-Scale Data Collection Methodology
Data was collected using a large scale web-based survey. Quality of respondents
and response rate are two important factors that influence the quality of an empirical
study. Since this study has a supply chain management focus, the target respondents were
the operations / manufacturing / purchasing / logistics / materials – vice presidents,
directors and managers as these personnel were deemed to have the best knowledge in the
supply chain area. Seven SIC codes are covered in the study: 22: Textile Mill products,
23: Apparel and other Textile Products, 25: Furniture and Fixtures, 34: Fabricated Metal
Products, 35: Industrial Machinery and Equipment, 36: Electrical and Electronic
Equipment, and 37: Transportation Equipment. These SIC codes were chosen as they
predominantly represent the focus of this study; that is supply chain responsiveness, and
modularity based manufacturing practices. Also these industries represent the core
manufacturing industry (ex: transportation equipment, which include automobiles), most
of them deal with modular products and processes (ex: textile products, furniture and
fixtures, and once again automobiles), and the rest of them operate in a fast paced
industry (ex: industry clockspeed is high for electronics and computer industries). The
survey was confined to US only. The SIC codes and the target respondents were the two
criteria when purchasing email lists. The e-mail lists were purchased from three different
sources. These were the Council of Supply Chain Management (CSCMP),
79

8/13/2019 Competitive_advantage of a Firm Through Supply Chain Responsiveness and SCM Practices
http://slidepdf.com/reader/full/competitiveadvantage-of-a-firm-through-supply-chain-responsiveness-and-scm 98/294
Rsateleservices.com, and Lead411.com. From CSCMP members’ database - 1313 emails,
from rsateleservices.com – 5846 emails, and from lead411.com - 1083 emails were
purchased (8242 total names), based on the two criteria mentioned above. In order to
increase the response rate, it was decided to remove duplicate names. The refinement
resulted in a deletion of 316 names / emails, thus giving the researcher 7926 names.
Since the survey was sent by email, the email addresses had to be filtered by a
server program to guarantee that the email addresses were valid according to certain
standard. The undelivered emails were not counted in the final sample size since the
respondents never received the survey. This resulted in the removal of 2200 names from
the list. Accordingly the final mailing contained 5726 names.
The survey was conducted by the web-based method. To ensure a reasonable
response rate, the survey was sent in three waves. The questionnaire with the cover letter
indicating the purpose and significance of the study was emailed to target respondents. In
the cover letter, the respondents were given three options to send their response: 1) online
completion and submission: a web link was given so that they could complete the
questionnaire online (http://www.businessfaculty.utoledo.edu/athatte/SCRSurvey.asp)
and send it immediately; 2) download the hard copy online: a link to the questionnaire in
.pdf file (http://www.businessfaculty.utoledo.edu/athatte/FINALSURVEY.pdf) was
given and respondents could send it by fax or ask for a self-addressed stamped envelope;
3) request the hard copy by sending an email: they received in their regular mail a copy
of the questionnaire along with a self-addressed stamped envelope.
There were 228 automated email replies mentioning that the person is out of
office. These “out of office” emails were not counted in the final sample size. There were
80
8/13/2019 Competitive_advantage of a Firm Through Supply Chain Responsiveness and SCM Practices
http://slidepdf.com/reader/full/competitiveadvantage-of-a-firm-through-supply-chain-responsiveness-and-scm 99/294
a total of 298 responses from the mailings. Of these responses, 4 questionnaires were
submitted online with many unanswered questions, with an apology email indicating that
they were unable to answer all questions because the questions were not applicable to
their company, or they were inappropriate respondents, having realized that half way
through filling the questionnaire. Therefore the final number of complete and usable
responses was 294. This represents a response rate of 5.35% (calculated as 294/ (5726-
228)). Out of 294, the first wave produced 92 responses, and the second wave and the
third wave generated 100 and 102 responses, respectively. In addition, out of those
responses, 283 were received online and 11 were received via mail or fax.
5.2 Sample Characteristics of the Respondents and Organizations
This section will discuss sample characteristics in terms of the respondents (job
title, job function, and years worked at the organization) and the organizations (years of
implementing SCM program, the primary production system, industry, employment size,
and annual sales).
5.2.1 Sample Characteristics of Respondents
The result is shown in Table 5.2.1.1.
Job Title: About half of the respondents (45%) are vice presidents, while 25%
state they are directors and 19% are titled as managers. The rest of the respondents (11%)
are CEO/president. Thus 81% of the respondents (CEOs, VPs, and directors) are high
level executives, implying a high reliability of the responses received, as these executives
have a wider domain (job responsibility) and administrative knowledge.
81

8/13/2019 Competitive_advantage of a Firm Through Supply Chain Responsiveness and SCM Practices
http://slidepdf.com/reader/full/competitiveadvantage-of-a-firm-through-supply-chain-responsiveness-and-scm 100/294
Job Function: 42 % of the respondents were corporate executives, 17 % choose
SCM as their area of expertise, while 13% are responsible for distribution/logistics, 9%
for manufacturing/production, while and 6% belonged to the operations area. While 4%
of the respondents belonged to the purchasing area, transportation and materials
accounted for about 1% each. The rest of the respondents (7%) belong to the “other”
category. This distribution of respondents by job function implies that 50% of the
respondents are related to the operations field in addition to 42% which are corporate
executives (high level executives in either function), thereby signifying high reliability of
the obtained responses.
Years Stayed at the Organization: 33% of the respondents indicate they have been
with the organization over 10 years, 21% indicate having been at the organization
between 6-10years, and 27% state their years stayed at the organization as between 2-5
years. Also the respondents with years stayed at the organization less than 2 years
account for 19% of the sample.
Since majority of the respondents are senior level executives (CEO/president, vice
presidents, and directors) (11+ 45 + 25 = 81%) it can be said that the data is more
reliable. Figure 5.2.1.1 to 5.2.1.3 display the respondents by job titles, job functions, and
years worked at the organization, respectively.
82

8/13/2019 Competitive_advantage of a Firm Through Supply Chain Responsiveness and SCM Practices
http://slidepdf.com/reader/full/competitiveadvantage-of-a-firm-through-supply-chain-responsiveness-and-scm 101/294
Table 5.2.1.1 Characteristics of the Respondents
Job Titles (290)
CEO/President 10.69% (31)Vice President 44.83% (130)
Director 25.17% (73)
1.
Manager 19.31% (56)
Job Functions (291)
Corporate Executive 42.27% (123)
Purchasing 4.47% (13)
Manufacturing / Production 8.59% (25)
Distribution / Logistics 13.06% (38)
SCM 16.84 (49)
Transportation 1.37% (4)
Materials 0.69% (2)Operations 6.19% (18)
2.
Other 6.53% (19)
Years worked at the organization (290)
Under 2 years 19.31% (56)
2-5 years 26.55% (77)
6-10 years 20.69% (60)
3.
Over 10 years 33.45% (97)
Figure 5.2.1.1 Respondents by Job Title
Manager
19%
CEO/President
11%
Director
25%
VP
45%
83
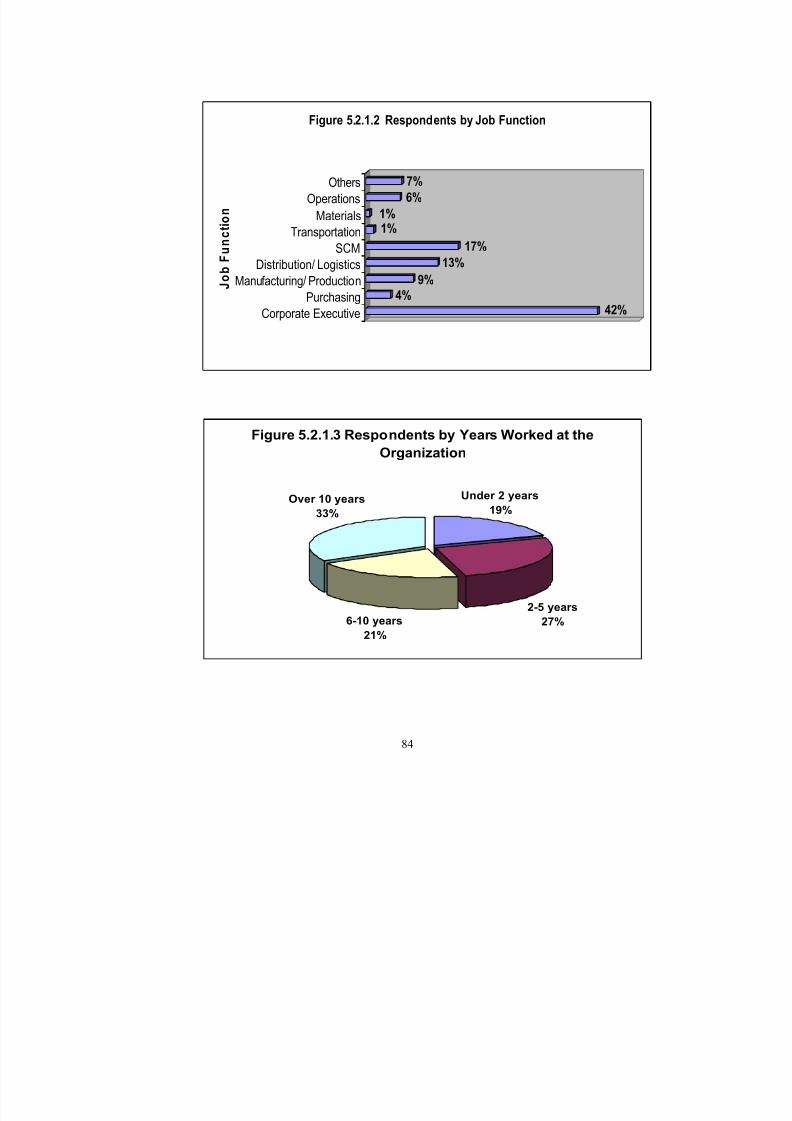
8/13/2019 Competitive_advantage of a Firm Through Supply Chain Responsiveness and SCM Practices
http://slidepdf.com/reader/full/competitiveadvantage-of-a-firm-through-supply-chain-responsiveness-and-scm 102/294
42%4%
9%
13%
17%
1%1%
6%
7%
Corporate ExecutivePurchasing
Manufacturing/ Production
Distribution/ Logistics
SCM
Transportation
Materials
Operations
Others
J o b
F u n
c t i o n
Figure 5.2.1.2 Respondents by Job Function
Figure 5.2.1.3 Respondents by Years Worked at the
Organization
Over 10 years
33%
6-10 years
21%
Under 2 years
19%
2-5 years27%
84
8/13/2019 Competitive_advantage of a Firm Through Supply Chain Responsiveness and SCM Practices
http://slidepdf.com/reader/full/competitiveadvantage-of-a-firm-through-supply-chain-responsiveness-and-scm 103/294
5.2.2 Sample Characteristics of Surveyed Organization
The result is shown in Table 5.2.2.1.
The Implementation of SCM Program: More than half the organizations surveyed
(64%) have embarked upon a program aimed specially at implementing SCM, and the
average length of the implementation is 4.15 years.
Primary Production System: 35% of the organizations use ‘make-to-order’ as
primary production system; while ‘make-to-stock’, ‘assemble to order’, and ‘engineer to
order’ account for 33%, 21%, and 11% respectively.
Industry (based upon SIC code): Most respondents (40%) indicate their
organization is in the ‘electrical and electronic equipment’ industry; 10% of respondents
are in the ‘fabricated metal products’ industry; the same number (10%) is in the
‘industrial machinery’ and ‘equipment industry’; while 9% of them are in the
‘transportation equipment’ industry. Finally 3% and 1% of respondents are in the
‘furniture and fixtures’ and the ‘apparel and other textile products’ industry. The rest
(27%) belong to the “other” category.
Number of Employees: The number of employees indicates the diversification of
the organization ranging from the small size to the large size. 56% of the organizations
have more than 1000 employees; another 9% of the organizations have between 501-
1000 employees, further 12% of the organizations have between 251-500 employees and
an equal number (12%) of them have between 101-250 employees. Also 7% and 4% of
the organizations have between 51-100 employees and 1-50 employees respectively.
Annual Sales: More than half the organizations (71%) have annual sales
exceeding 100million USD; 7% of the organizations have sales volume between 50-
85

8/13/2019 Competitive_advantage of a Firm Through Supply Chain Responsiveness and SCM Practices
http://slidepdf.com/reader/full/competitiveadvantage-of-a-firm-through-supply-chain-responsiveness-and-scm 104/294
100million USD; another 9% of the responding organizations have sales volume between
25-50million USD; while 7% of the organizations have annual sales between 10-25
million USD, 4% and 3% of the responding organizations have sales volume between 5-
10million USD and under 5million USD, respectively.
Figures 5.2.2.1, 5.2.2.2, 5.2.2.3, and 5.2.2.4 display the surveyed organizations by
primary production system, industry, number of employees, and annual sales,
respectively. Overall, the diversification in industry type, company size, and experience
in the operations field indicate that the survey has covered a wide range of organizations
in different industries with different sizes and experiences, of which more than half of the
organizations are large organizations with high annual sales.
86

8/13/2019 Competitive_advantage of a Firm Through Supply Chain Responsiveness and SCM Practices
http://slidepdf.com/reader/full/competitiveadvantage-of-a-firm-through-supply-chain-responsiveness-and-scm 105/294
Table 5.2.2.1 Characteristics of the Surveyed Organizations
Organizations that have embarked upon a program aimed specially atimplementing “Supply Chain Management” (294).
Yes: 63.27% (186)
No: 36.73% (108)
1.
Average length of implementation: 4.15 years
Primary production system (283)
Engineer to Order 10.60% (30)
Make to Order 35.69% (101)
Assemble to Order 20.85% (59)
2.
Make to Stock 32.86% (93)
Industry – SIC (278)
Textile mill Products (SIC 22) 0.00% (0)
Apparel and Other Textile Products (SIC 23) 1.44% (4)
Furniture and Fixtures (SIC 25) 2.52% (7)
3.
Fabricated Metal Products (SIC 34) 10.43% (29)Industrial Machinery and Equipment (SIC 35) 10.07% (28)
Electrical and Electronic Equipment (SIC 36) 39.57% (110)
Transportation Equipment (SIC 37) 9.35% (26)
Other 26.62% (74)
Number of employees (291)
1-50 4.12% (12)
51-100 6.87% (20)
101-250 12.03% (35)
251-500 12.37% (36)
501-1000 8.59% (25)
4.
Over 1000 56.01% (163)
Annual sales in millions of $ (278)Under 5 2.52% (7)5 to 10 3.60% (10)
10 to <25 7.19% (20)
25 to <50 8.99% (25)
50 to <100 6.83% (19)
5.
>100 70.86% (197)
87

8/13/2019 Competitive_advantage of a Firm Through Supply Chain Responsiveness and SCM Practices
http://slidepdf.com/reader/full/competitiveadvantage-of-a-firm-through-supply-chain-responsiveness-and-scm 106/294
Figure 5.2.2.1 Organizations by Primary Production
System
Engineer to
Order 11%
Assemble to
Order
21%
Make to Order
35%
Make to Stock
33%
0% 1% 3%
10% 10%
40%
9%
27%
0%
5%
10%
15%
20%
25%
30%
35%
40%
22 23 25 34 35 36 37 Other
Figure 5.2.2.2 Organizations by Industry (SIC
Codes)
88

8/13/2019 Competitive_advantage of a Firm Through Supply Chain Responsiveness and SCM Practices
http://slidepdf.com/reader/full/competitiveadvantage-of-a-firm-through-supply-chain-responsiveness-and-scm 107/294
Figure 5.2.2.3 Organizations by Number of
Employees
1-50
4% 51-1007%101-250
12%
251-500
12%
501-1000
9%
Over 1000
56%
3% 4% 7% 9% 7%
71%
0%
10%
20%
30%
40%
50%
60%
70%
80%
Under 5 5-10 10-25 25-50 50-100 >100
Figure 5.2.2.4 Organizations by Annual Sales (In
millions of $)
89

8/13/2019 Competitive_advantage of a Firm Through Supply Chain Responsiveness and SCM Practices
http://slidepdf.com/reader/full/competitiveadvantage-of-a-firm-through-supply-chain-responsiveness-and-scm 108/294
5.3 Between-Response Comparison
One concern of the survey is that information collected from respondents might
have a non-response bias. This research did not investigate non-response bias directly,
however a comparison was made between those subjects who responded after the initial
e-mailing and those who responded to the second/third wave. Chi-square tests were used
to make the comparisons. The results are shown in last column of Table 5.3.1. We can
see no significant difference in industry type (based on SIC), employment size, and
respondent’s job title between these two groups. Thus it can be concluded that the non-
response bias is not a cause for concern. Chi-square tests of independence were also
performed to observe if the distribution of responses across SIC codes, employment size,
and respondent’s job title is independent of the three waves. The results are shown in
Table 5.3.2. We observe that there is no significant difference in industry type (based on
SIC), employment size, and respondent’s job title between each of the three groups /
waves. Thus it can be concluded that the distribution of responses across SIC codes,
employment size and respondents job title is independent of the waves.
90

8/13/2019 Competitive_advantage of a Firm Through Supply Chain Responsiveness and SCM Practices
http://slidepdf.com/reader/full/competitiveadvantage-of-a-firm-through-supply-chain-responsiveness-and-scm 109/294
Table 5.3.1 Comparisons between First Wave and Second/Third Wave
First-wave Second/Third
wave
Second/Third
waveVariables
Frequency (%) Expected Freq.
(%)
Observed Freq.
(%)
Chi-square
Test
Industry - SIC (278)
SIC 22 0 (0.0%) 0 (0.0%) 0 (0.0%)
SIC 23 2 (2.3%) 4 (2.3%) 2 (1.05%)
SIC 25 2 (2.3%) 4 (2.3%) 5 (2.6%)
SIC 34 9 (10.3%) 20 (10.3%) 20 (10.5%)
SIC 35 7 (8.1%) 15 (8.1%) 21 (11.0%)
SIC 36 36 (41.4%) 79 (41.4%) 74 (38.7%)
SIC 37 8 (9.2%) 18 (9.2%) 18 (9.4%)
χ 2 =3.79
df=7 p>.10
Other 23 (26.4%) 50 (26.4%) 51 (26.7%)
Number of Employees (291)
1-50 4 (4.4%) 9 (4.4%) 8 (4.0%)
51-100 6 (6.6%) 13 (6.6%) 14 (7.0%)
100-250 9 (9.9%) 20 (9.9%) 26 (13.0%)
251-500 10 (11%) 22 (11%) 26 (13.0%)
501-1000 7 (7.7%) 15 (7.7%) 18 (9.0%)
Over 1000 55 121 (60.4%) 108 (54.0%)
χ 2 =5.0
df=5 p>.10
Job Title (290)
CEO/President 11 (12.0%) 24 (12.0%) 20 (10.1%)
Vice President 37 (40.2%) 80 (40.2%) 93 (47.0%)
Director 23 (25.0%) 50 (25.0%) 50 (25.3%)
Manager 21 (22.8%) 45 (22.8%) 35 (17.7%)
χ 2 =5.12
df=3 p>.10
Note: Figures in parentheses are percentage;
The calculation formula f
f f
e
o e)(
2
2 −∑= χ
df = (number of categories in the variable -1)
91

8/13/2019 Competitive_advantage of a Firm Through Supply Chain Responsiveness and SCM Practices
http://slidepdf.com/reader/full/competitiveadvantage-of-a-firm-through-supply-chain-responsiveness-and-scm 110/294
Table 5.3.2 Comparisons between First, Second, and Third Wave
First-wave
First-
wave
Second
wave
Second
wave
Third
wave
Third
waveVariables
Observed
Frequency
Expected
Frequency
Observed
Frequency
Expected
Frequency
Observed
Frequency
Expected
Frequency
Industry - SIC (278)
22 0 0.00 0 0.00 0 0.00
23 2 1.25 0 1.29 2 1.45
25 2 2.19 2 2.27 3 2.54
34 9 9.08 7 9.39 13 10.54
35 7 8.76 10 9.06 11 10.17
36 36 34.42 36 35.61 38 39.96
37 8 8.14 7 8.42 11 9.45
Other 23 23.16 28 23.96 23 26.88
Column Total 87 87 90 90 101 101
Number of Employees (291)
1-50 4 3.75 2 4.25 6 4.00
51-100 6 6.25 5 7.08 9 6.67
101-250 9 10.95 14 12.39 12 11.67
251-500 10 11.26 11 12.74 15 12.00
501-1000 7 7.82 7 8.85 11 8.33
Over 1000 55 50.97 64 57.69 44 54.33
Column Total 91 91 103 103 97 97
Job Title (290)
CEO/President 11 9.83 12 11.65 8 9.51
Vice President 37 41.24 50 48.86 43 39.90
Director 23 23.16 30 27.44 20 22.40
Manager 21 17.7 17 21.05 18 17.19
Column Total 92 92 109 109 89 89
92

8/13/2019 Competitive_advantage of a Firm Through Supply Chain Responsiveness and SCM Practices
http://slidepdf.com/reader/full/competitiveadvantage-of-a-firm-through-supply-chain-responsiveness-and-scm 111/294
The calculation formula f
f f
e
o e)(
2
2 −∑= χ
df = (row -1)*(column – 1)
5.4 Structural Equation Modeling Methodology
Before proceeding to the large scale instrument assessment, the structural
equation modeling methodology and the major model evaluation indices are discussed.
Unlike the traditional statistical methods that can examine only a single
relationship at a time, the structural equation modeling (SEM) method greatly expands
the researchers’ capability to study a set of interrelated relationships simultaneously. The
first important step in SEM is to specify the two components: Measurement Model and
Structural Model. SEM model specification must always be based on sound theory from
existing literature. The need for theoretical justification in SEM is very important for the
specification of dependence relationships, modifications to the proposed relationships,
and many other aspects of model estimation (Hair et al., 1998).
Once the measurement and structural models are specified, the researcher must
choose a computer program for model estimation and evaluation. One of the most widely
used programs is AMOS 6 by James L. Arbuckle (1994-2006). There is no single
statistical test that best describes the strength of a model. Instead, researchers have
developed a number of goodness-of-fit measures to assess the results from three
perspectives: 1) overall fit; 2) comparative fit to a base model; and 3) model parsimony.
AMOS provides several statistics that can be used to evaluate the hypothesized model
93
8/13/2019 Competitive_advantage of a Firm Through Supply Chain Responsiveness and SCM Practices
http://slidepdf.com/reader/full/competitiveadvantage-of-a-firm-through-supply-chain-responsiveness-and-scm 112/294
and also suggest ways in which the model might be modified, given sufficient theoretical
justification.
Overall Fit Measures
The most fundamental measure of overall fit is the chi-square statistic (χ2). Low
values, which result in significance levels greater than 0.05, indicate that the actual and
predicted input matrices are not statistically different, hence a good fit. However the χ2
measure is often criticized for its over-sensitivity to sample size, especially in cases
where the sample size exceeds 200 respondents (Hair et al., 1998). As sample size
increases, this measure has a greater tendency to indicate significant differences for
equivalent models. Thus the current study does not use the χ2 measure.
AMOS provides a second measure of overall fit and is called the goodness-of-fit
index (GFI). GFI represents the overall degree of fit (the squared residuals from
prediction compared to the actual data). GFI is not adjusted for the degrees of freedom.
Its value ranges value from 0 (poor fit) to 1 (perfect fit). Generally, a GFI value of greater
than 0.90 is considered as acceptable (Segars, 1997; Hair et al., 1998).
Another measure of overall fit is the root mean square error of approximation
(RMSEA). The RMSEA takes into account the error of approximation and is expressed
per degree of freedom. This makes the index sensitive to the number of estimated
parameters in the model. Values less than 0.05 indicate good fit, values as high as 0.08
represent reasonable errors of approximation in the population (Browne and Cudeck,
1993), values ranging from 0.08 to 0.10 indicate mediocre fit, and those greater than 0.10
indicate poor fit (MacCallum et al., 1996).
94

8/13/2019 Competitive_advantage of a Firm Through Supply Chain Responsiveness and SCM Practices
http://slidepdf.com/reader/full/competitiveadvantage-of-a-firm-through-supply-chain-responsiveness-and-scm 113/294
Comparative Fit Measures
This class of measures compares the proposed model to some baseline model
(null model) – some realistic model that all other models should be expected to exceed.
The null model, in most cases, is a single construct model with all indicators that
perfectly measure the construct. One of the most popular measures is the normed fit index
(NFI), which ranges from 0 (no fit at all) to 1 (perfect fit). A commonly recommended
value is 0.90 or greater (Hair et al., 1998).
Parsimonious Fit Measures
This measure relates the goodness-of-fit of the model to the number of estimated
coefficients required to achieve this level of fit. The basic objective is to diagnose
whether the model fit has been achieved by over-fitting the data with too many
coefficients. The most widely used measure of parsimonious fit, provided by AMOS is
the adjusted goodness-of-fit index (AGFI). AGFI is an extension of GFI but adjusted by
the ratio of degrees of freedom for the proposed model to the degrees of freedom for the
null model. An AGFI value of 0.80 or greater is considered as acceptable (Segars and
Grover, 1993).
Modification Indices
AMOS program provides modification indices that suggest possible ways of
improving the model fit. However, it is important that any modifications performed must
have sufficient theoretical justification.
Standardized Structural Coefficient
A standardized structural coefficient is also called as the effect size in SEM.
Effect size is a name given to a family of indices that measure the magnitude of a
95
8/13/2019 Competitive_advantage of a Firm Through Supply Chain Responsiveness and SCM Practices
http://slidepdf.com/reader/full/competitiveadvantage-of-a-firm-through-supply-chain-responsiveness-and-scm 114/294
treatment effect. These values are displayed above their respective arrows on the arrow
diagram specifying the model. The interpretation is similar to regression: if a
standardized structural coefficient is 0.5, then the latent dependent will increase by 0.5
standard units for each unit increase in the latent independent. In AMOS, the
standardized structural coefficients are labeled as standardized regression weights, which
are similar to the coefficients used to test the strength of relationships. Unlike
significance tests, these indices are independent of sample size. Effect size is commonly
used to compliment structural equation modeling (SEM) because SEM is a large-sample
technique. Two hundred is the minimum required size of the sample; thus larger sample
sizes are more appropriate. The effect size helps researchers to differentiate between
statistical significance and practical significance, when the test of a relationship deals
with a large-sample size. Table 5.4.1 shows the recommended values of effect size by
Cohen (1988 and 1990, pp.1309). The structural paths and loadings of substantial
strength (not just statistically significant) should be at least 0.371 to be considered large
indicating 13.8% of variance in the dependent variable (DV) that is accounted by the
independent variable (IV). Standardized paths should be at least 0.148 in order to be
considered meaningful or medium effect. Meehl (1990) argues that anything lower may
be due to what he terms the crud factor where everything correlates to some extent with
everything else because of a complex unknown network of genetic and environmental
factors. For example, a path of 0.10 represents a one-percent explanation of variance and
thus, portrays a mediocre relationship. In summary, the effect size of 0.371 or above is
considered large, between 0.100 and 0.371 is considered medium and 0.1 or below is
considered small.
96
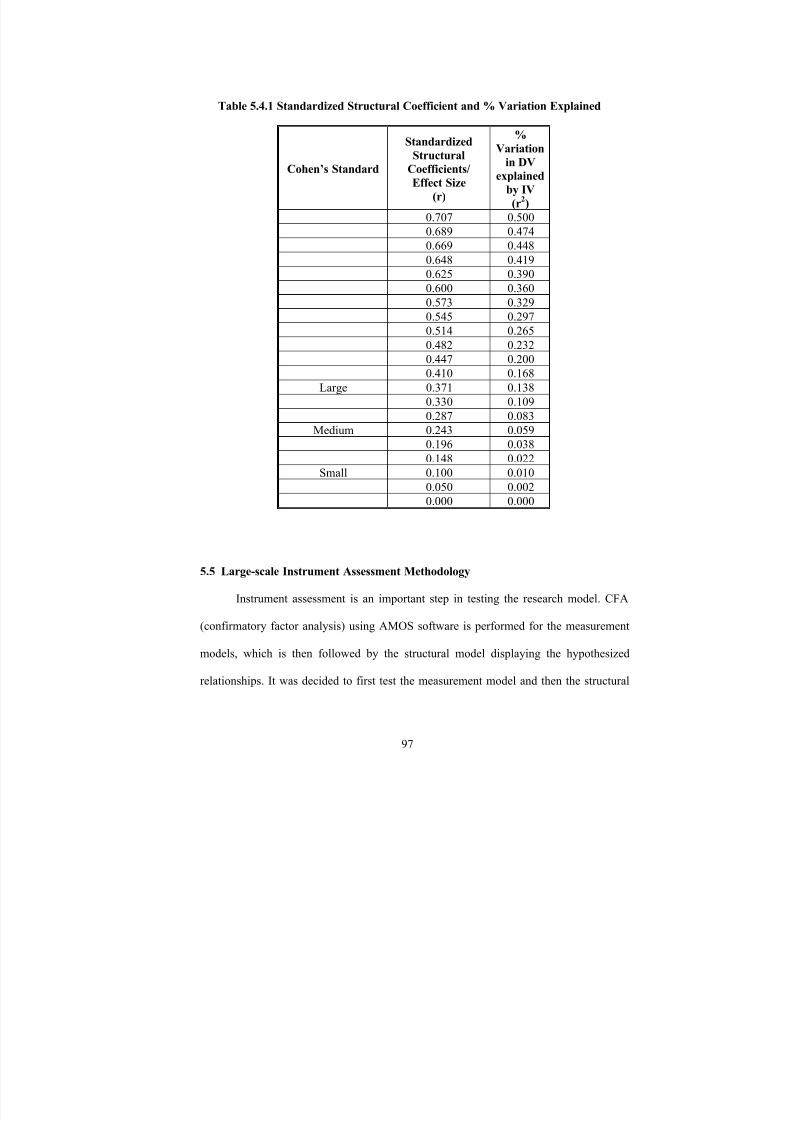
8/13/2019 Competitive_advantage of a Firm Through Supply Chain Responsiveness and SCM Practices
http://slidepdf.com/reader/full/competitiveadvantage-of-a-firm-through-supply-chain-responsiveness-and-scm 115/294
Table 5.4.1 Standardized Structural Coefficient and % Variation Explained
Cohen’s Standard
Standardized
StructuralCoefficients/
Effect Size
(r)
%
Variationin DV
explained
by IV
(r2)
0.707 0.500
0.689 0.474
0.669 0.448
0.648 0.419
0.625 0.390
0.600 0.360
0.573 0.3290.545 0.297
0.514 0.265
0.482 0.232
0.447 0.200
0.410 0.168
Large 0.371 0.138
0.330 0.109
0.287 0.083
Medium 0.243 0.059
0.196 0.038
0.148 0.022Small 0.100 0.010
0.050 0.002
0.000 0.000
5.5 Large-scale Instrument Assessment Methodology
Instrument assessment is an important step in testing the research model. CFA
(confirmatory factor analysis) using AMOS software is performed for the measurement
models, which is then followed by the structural model displaying the hypothesized
relationships. It was decided to first test the measurement model and then the structural
97

8/13/2019 Competitive_advantage of a Firm Through Supply Chain Responsiveness and SCM Practices
http://slidepdf.com/reader/full/competitiveadvantage-of-a-firm-through-supply-chain-responsiveness-and-scm 116/294
model, to avoid any interactions between the measurement and the structural model, and
as proposed by Gerbing and Anderson (1988). The purification of the measurement
models was done only to the new construct in the study - supply chain responsiveness - as
measures for the other constructs: SCM practices (Li et al., 2005), modularity based
manufacturing practices (Tu et al., 2004), and competitive advantage (Li et al., 2006; Li
et al., 2005; Koufteros, 1995) are adopted from previous literature and have already been
validated therein. We however report the reliabilities of the constructs that have been
adopted from prior literature (along with the reliabilities for the same as obtained in this
study) after we present the large-scale instrument validation results for the construct
‘Supply Chain Responsiveness’. The reliabilities for the borrowed constructs have been
reported in sections 5.6.2 (SCM Practices), 5.6.3 (Modularity Based Manufacturing
Practices), and 5.6.4 (Competitive Advantage).
Convergent validity, discriminant validity, and reliability are important for
construct validity (Ahire et al., 1996; Ragunathan and Ragunathan, 1994). Also, as per
the guidelines of Bagozzi (1980) and Bagozzi and Phillips (1982), the important
properties for measurement to be reliable and valid include content validity, construct
validity (convergent and discriminant validity), reliability (internal consistency or scale
consistency of operationalization), validation of second-order construct (we use the T
coefficient), and predictive validity (we use the construct level correlation analysis).
Structural equation modeling (AMOS) was used for convergent (measurement model)
and discriminant (two factors at a time) validity and is discussed in detail shortly.
Reliability estimation is performed after convergent and discriminant validity because in
the absence of a valid construct, reliability may not be relevant (Koufteros, 1999).
98
8/13/2019 Competitive_advantage of a Firm Through Supply Chain Responsiveness and SCM Practices
http://slidepdf.com/reader/full/competitiveadvantage-of-a-firm-through-supply-chain-responsiveness-and-scm 117/294
Following are the discussions of content validity, convergent validity, discriminant
validity, reliability analysis, and construct level correlation analysis (for predictive
validity).
Content validity is enhanced if steps are taken to ensure that the domain of the
construct is covered (Churchill, 1979). An instrument has content validity if there is a
general agreement among the subjects and researchers that the measurement items do
cover all the important aspects of the variable being measured. The evaluation of content
validity is a rational judgmental process not open to numerical justification. Content
validity mainly rests on appeals to reason regarding the adequacy with which important
content has been sampled and on the adequacy with which the content has been cast in
the form of test items (Nunnally, 1978). Content validity is assessed in two ways in this
study. First, a comprehensive literature review was conducted to define the variables and
constructs, and generate an initial list of items to ensure that domain of the construct is
covered (Nunnally, 1978). Secondly, a Q-sort method was conducted as a pilot study for
scale development and testing (Appendix B).
Convergent validity is defined as the extent to which the measurement items
converge into a theoretical construct. The traditional method employed for evaluation of
construct validity of measurement scales is confirmatory factor analysis. In this study,
one of the most widely used SEM (structural equation modeling) software called AMOS
was utilized. Using AMOS, it is possible to specify, test, and modify the measurement
model. Model-data fit was evaluated based on multiple fit indices. The overall model fit
indices include goodness of fit index (GFI), adjusted goodness of fit index (AGFI), and
root mean square error of approximation (RMSEA). GFI indicates the relative amount of
99
8/13/2019 Competitive_advantage of a Firm Through Supply Chain Responsiveness and SCM Practices
http://slidepdf.com/reader/full/competitiveadvantage-of-a-firm-through-supply-chain-responsiveness-and-scm 118/294
variance and covariance jointly explained by the model. AGFI differs from GFI in that it
adjusts for the number of degrees of freedom in the model. A GFI and AGFI score in the
range of 0.8 to 0.89 is considered as representing a reasonable fit; a score of 0.9 or higher
is considered as evidence of good fit (Joreskog and Sorbom, 1989). The RMSEA takes
into account the error of approximation and is expressed per degree of freedom, thus
making the index sensitive to the number of estimated parameters in the model; a value
of less than 0.05 indicates a good fit, a value as high as 0.08 represents reasonable errors
of approximation in the population (Browne and Cudeck, 1993), a value ranging from
0.08 to 0.10 indicates mediocre fit, and values greater than 0.10 indicate poor fit
(MacCallum et al., 1996). If the fit indices are not satisfactory, the modification indices
are observed to check for any error term correlation. Those items, whose error terms are
highly correlated with the error terms of other items measuring that variable, are further
studied for logic and theoretical support for deletion. Items are deleted one at a time if
there was a reason to do so, based on the criteria for model fit. Otherwise the item
remained in the model. This process of purification of the measurement model was
continued until an acceptable model fit was obtained.
Discriminant validity refers to the independence of the dimensions (Bagozzi and
Phillips, 1982) or factors measuring one construct. Discriminant validity can be assessed
using structural equation modeling methodology (Bagozzi and Phillips, 1982). In AMOS,
it can be done by taking two factors (i.e. variables) at a time at one instance, and then
having all items of the two constructs inserted into one single factor in the second
instance. The chi-square values of running each instance thus obtained are noted. The
constructs are considered to be distinct if the hypothesis that the two constructs together
100
8/13/2019 Competitive_advantage of a Firm Through Supply Chain Responsiveness and SCM Practices
http://slidepdf.com/reader/full/competitiveadvantage-of-a-firm-through-supply-chain-responsiveness-and-scm 119/294
form a single construct is rejected. A difference between the chi-square value (df =1) of
the two models must be greater than or equal to 3.84 for significance at p < 0.05 level so
as to indicate support for the discriminant validity criterion (Joreskog, 1971).
Reliability (internal consistency) of the items comprising each dimension was
examined using Cronbach’s alpha (Cronbach, 1951). Following the guideline established
by Nunnally (1978), an alpha score of higher than 0.70 is generally considered to be
acceptable, whereas an alpha score of higher than 0.80 is considered a good measure of
reliability.
Validation of second-order construct can be done using T-coefficient. T-
coefficient tests for the existence of a single second-order construct that accounts for the
variation in all its sub-constructs. For example, supply chain responsiveness is measured
by operations system responsiveness, logistics process responsiveness, and supplier
network responsiveness and each of these three sub-constructs is measured by several
items. The question here is to test whether these three sub-constructs form a higher order
construct - supply chain responsiveness. The T coefficient can be calculated as follows:
suppose that model A (Figure 5.5.1) is comprised of four correlated first-order factors,
and model B (Figure 5.5.2) hypothesizes the same four first-order factors and a single
second order factor. The T coefficient then, is the ratio of chi-square of model A to the
chi-square of model B which indicates the percentage of variation in the four first order
factors in model A explained by the second-order factor in model B (Doll et al., 1995).
101
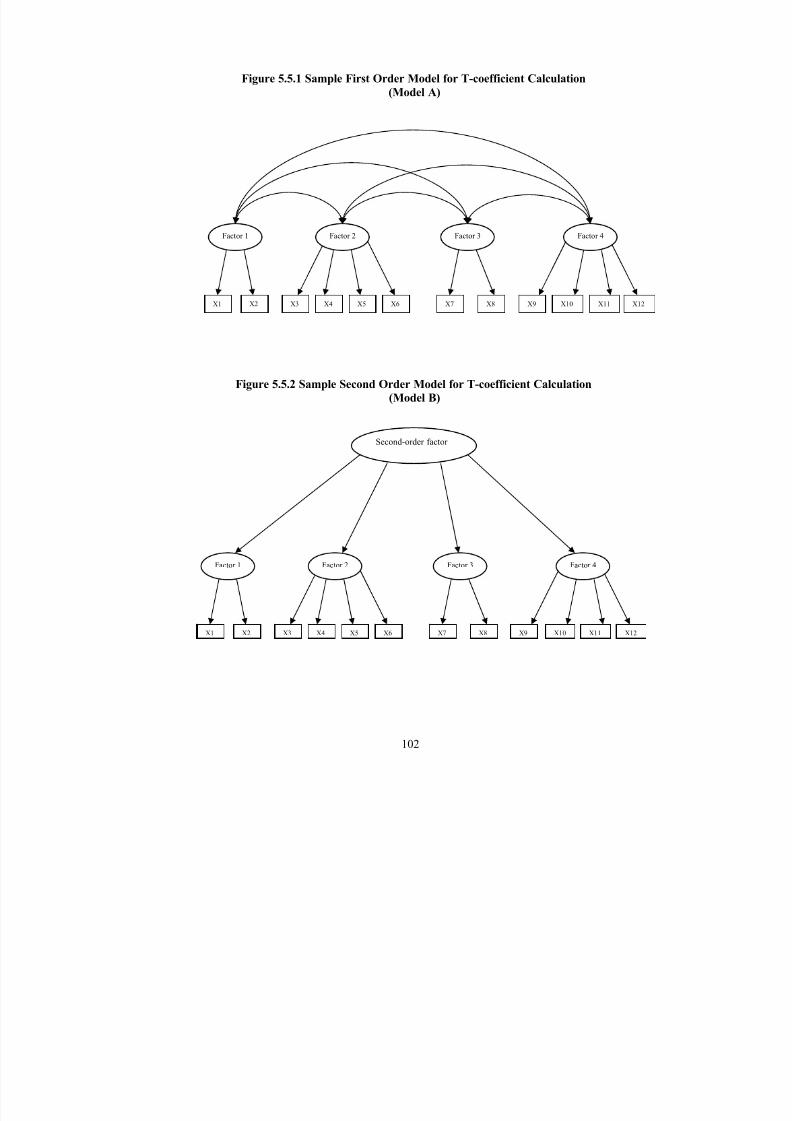
8/13/2019 Competitive_advantage of a Firm Through Supply Chain Responsiveness and SCM Practices
http://slidepdf.com/reader/full/competitiveadvantage-of-a-firm-through-supply-chain-responsiveness-and-scm 120/294
Figure 5.5.1 Sample First Order Model for T-coefficient Calculation
(Model A)
Factor 1 Factor 2 Factor 3 Factor 4
X2X1 X3 X4 X5 X6 X7 X8 X9 X10 X11 X12
Figure 5.5.2 Sample Second Order Model for T-coefficient Calculation
(Model B)
Second-order factor
Factor 1 Factor 2 Factor 3 Factor 4
X2X1 X3 X4 X5 X6 X7 X8 X9 X10 X11 X12
102

8/13/2019 Competitive_advantage of a Firm Through Supply Chain Responsiveness and SCM Practices
http://slidepdf.com/reader/full/competitiveadvantage-of-a-firm-through-supply-chain-responsiveness-and-scm 121/294
Although the fit index of model B is always a little worse than that of model A
since more constraints have been added in the model B, a T coefficient higher than 0.8
may indicate the existence of a second-order construct since most of the variation shared
by the first-order factors is explained by the single second-order factor.
A word of caution here however, in the case of three correlated first-order factors,
a second-order model has the same degrees of freedom and chi-square as that of the first-
order model, thus T coefficient equals 1.0, which has no meaning (Doll et al., 1995). In
this situation, an indirect way is to look at the standardized coefficient (γ) for each sub-
construct. If all of them are statistically significant, a second-order can be considered.
Construct level correlation analysis was performed between the second order
constructs to check for preliminary statistical validity of the hypotheses. A composite
score was calculated for each construct to get an aggregate score for that construct.
Pearson correlation was then run between these higher order constructs.
5.6 Large-Scale Measurement Results
The following section presents the large-scale instrument validation results for the
construct Supply Chain Responsiveness (SCR). For SCR construct, the instrument
assessment methodology described in the previous section was applied. In presenting the
results of the large-scale study, the following acronyms were used to number the
questionnaire items in each sub-construct.
103
8/13/2019 Competitive_advantage of a Firm Through Supply Chain Responsiveness and SCM Practices
http://slidepdf.com/reader/full/competitiveadvantage-of-a-firm-through-supply-chain-responsiveness-and-scm 122/294
SCR Supply Chain Responsiveness
OSR Operations System Responsiveness
LPR Logistics Process Responsiveness
SNR Supplier Network Responsiveness
For the above construct, the instrument assessment methodology described in the
previous section will be applied, and tables will be provided to present the results: 1)
Convergent validity; 2) Discriminant validity; 3) Reliability; and 4) The final set of
measurement items for the construct.
5.6.1 Supply Chain Responsiveness
The Supply Chain Responsiveness construct was initially represented by three
dimensions and 18 items, including Operations system Responsiveness (OSR) (7 items),
Logistics Process Responsiveness (LPR) (5 items), and Supplier Network
Responsiveness (SNR) (6 items).
Convergent Validity: In this step, the 18 SCR items were submitted to a
measurement model analysis to check model fit indices for each sub-construct (Table
5.6.1.1). The initial model fit indices for OSR consist of GFI = 0.866, AGFI = 0.732, and
RMSEA = 0.182. The initial measurement model for OSR is shown in Figure 5.6.1.1.
These indices show no where near a reasonable fit; therefore further model modification
was carried out based on modification indices (MI). MI represents both measurement
error correlations and item correlations (multicollinearity). MI shows evidence of misfit
between the default model and the hypothesized model. MI is conceptualized as a chi-
square statistic with one degree of freedom (Joreskog and Sorbom, 1989). Therefore the
104

8/13/2019 Competitive_advantage of a Firm Through Supply Chain Responsiveness and SCM Practices
http://slidepdf.com/reader/full/competitiveadvantage-of-a-firm-through-supply-chain-responsiveness-and-scm 123/294
threshold of MI is 4 chi-square statistics at a 0.05 significance level. High MI represents
error covariances meaning that one item might share variance explained with another
item (commonality) and thus they are redundant. The remedial action for error
covariances is to delete such an item which has high error variance.
Based on the modification indices, 2 items (OSR2 and OSR6) were dropped one
at a time. The concept of OSR2 – rapid change in product mix is already captured in part
by OSR1 – operations system responds rapidly to changes in product volume, and in part
by OSR 7 – operations system rapidly adjusts capacity, and therefore was dropped. The
concept of OSR6 – operations system rapidly changes manufacturing processes, is
already partially captured by OSR3 – operations system effectively expedites emergency
customer orders, and was therefore dropped in the next phase. The new model fit indices
improved significantly to GFI = 0.989, AGFI = 0.968, and RMSEA = 0.045. The final
measurement model for OSR is shown in Figure 5.6.1.2.
Figure 5.6.1.1 Initial Measurement Model for Operations System Responsiveness
(OSR)
OSRA
OSR1
e1
OSR2
e2
OSR3
e3
OSR4
e4
.82
OSR5
e5
OSR6
e6
OSR7
e7
.80.69.78.75
.78.76
105

8/13/2019 Competitive_advantage of a Firm Through Supply Chain Responsiveness and SCM Practices
http://slidepdf.com/reader/full/competitiveadvantage-of-a-firm-through-supply-chain-responsiveness-and-scm 124/294
Figure 5.6.1.2 Final Measurement Model for Operations System Responsiveness
(OSR)
OSRA
OSR1
e1
OSR3
e3
OSR4
e4
.81
OSR5
e5
OSR7
e7
.82.69.78
.74
The initial model fit indices for LPR consist of GFI = 0.926, AGFI = 0.777, and
RMSEA = 0.181. The initial measurement model for LPR is shown in Figure 5.6.1.3.
These indices show unreasonable fit; therefore further model modification was
carried out to get rid of both – measurement error correlations and item correlations
(multicollinearity). Based on the modification indices, one item (LPR4) was dropped.
The concept of LPR4 – logistics system rapidly accommodates special or non-routine
customer requests, is already partially captured by LPR5 - logistics system effectively
delivers expedited shipments, and partially by LPR1 - logistics system responds rapidly
to unexpected demand change, and therefore LPR4 was dropped. The new model fit
indices improved significantly to GFI = 0.996, AGFI = 0.98, and RMSEA = 0.025. The
final measurement model for LPR is shown in Figure 5.6.1.4.
106
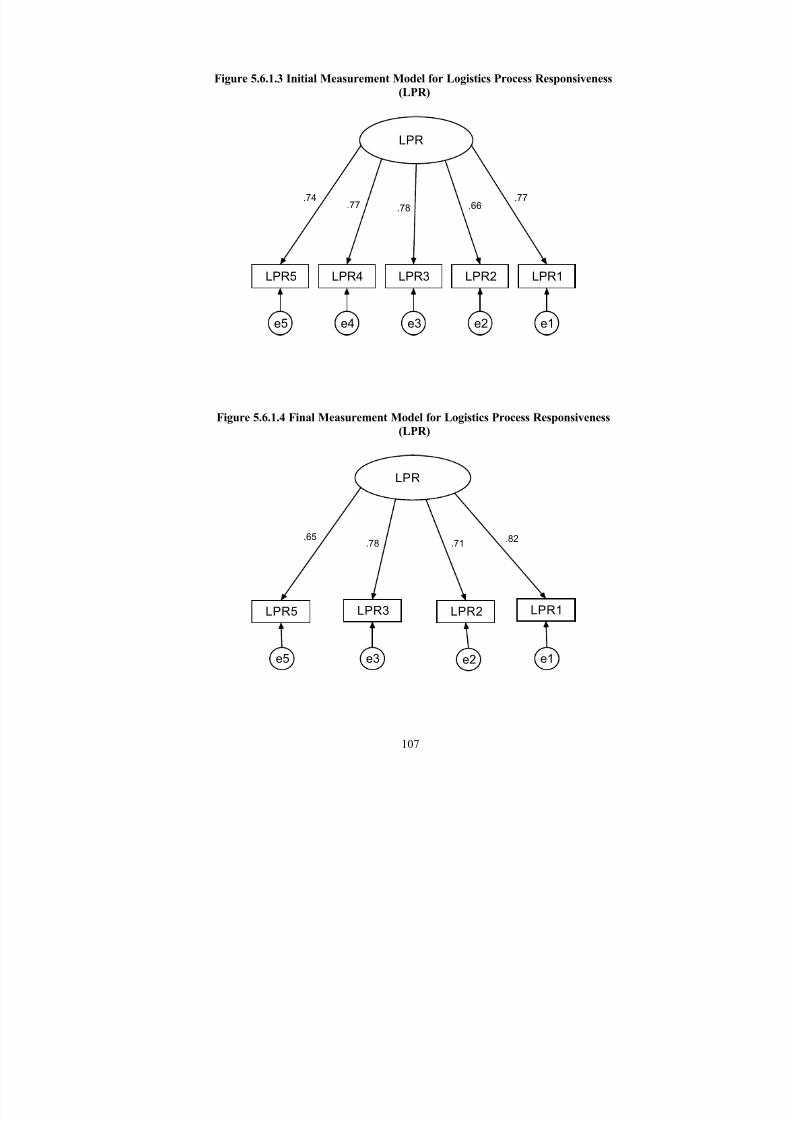
8/13/2019 Competitive_advantage of a Firm Through Supply Chain Responsiveness and SCM Practices
http://slidepdf.com/reader/full/competitiveadvantage-of-a-firm-through-supply-chain-responsiveness-and-scm 125/294
Figure 5.6.1.3 Initial Measurement Model for Logistics Process Responsiveness
(LPR)
LPR A
LPR1
e1
.77
LPR2
e2
LPR3
e3
.78
LPR4
e4
LPR5
e5
.74.77 .66
Figure 5.6.1.4 Final Measurement Model for Logistics Process Responsiveness
(LPR)
LPR A
LPR1
e1
LPR2
e2
LPR3
e3
LPR5
e5
.65 .82.71.78
107
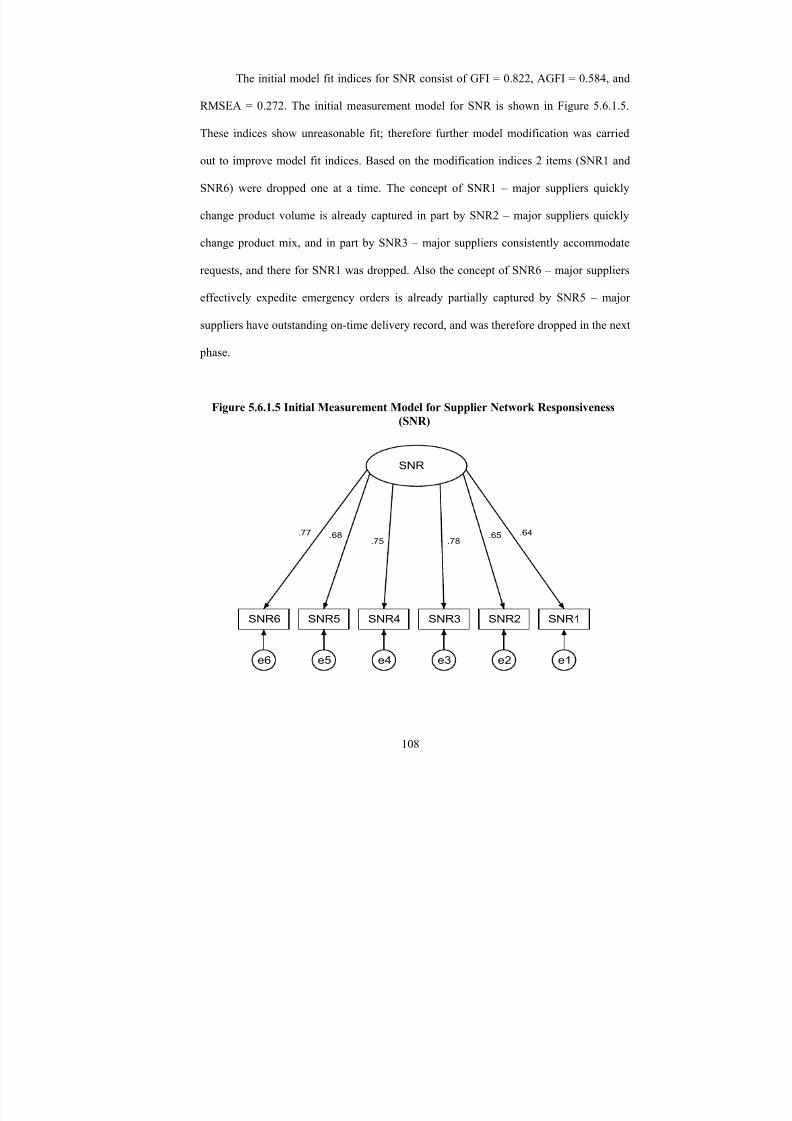
8/13/2019 Competitive_advantage of a Firm Through Supply Chain Responsiveness and SCM Practices
http://slidepdf.com/reader/full/competitiveadvantage-of-a-firm-through-supply-chain-responsiveness-and-scm 126/294
The initial model fit indices for SNR consist of GFI = 0.822, AGFI = 0.584, and
RMSEA = 0.272. The initial measurement model for SNR is shown in Figure 5.6.1.5.
These indices show unreasonable fit; therefore further model modification was carried
out to improve model fit indices. Based on the modification indices 2 items (SNR1 and
SNR6) were dropped one at a time. The concept of SNR1 – major suppliers quickly
change product volume is already captured in part by SNR2 – major suppliers quickly
change product mix, and in part by SNR3 – major suppliers consistently accommodate
requests, and there for SNR1 was dropped. Also the concept of SNR6 – major suppliers
effectively expedite emergency orders is already partially captured by SNR5 – major
suppliers have outstanding on-time delivery record, and was therefore dropped in the next
phase.
Figure 5.6.1.5 Initial Measurement Model for Supplier Network Responsiveness
(SNR)
SNR A
SNR1
e1
.64
SNR2
e2
.65
SNR3
e3
.78
SNR4
e4
.75
SNR5
e5
.68
SNR6
e6
.77
108

8/13/2019 Competitive_advantage of a Firm Through Supply Chain Responsiveness and SCM Practices
http://slidepdf.com/reader/full/competitiveadvantage-of-a-firm-through-supply-chain-responsiveness-and-scm 127/294
Figure 5.6.1.6 Final Measurement Model for Supplier Network Responsiveness
(SNR)
SNR A
SNR4
e4
SNR6
e6
SNR3
e3
.75
SNR2
e2
.57.79 .80
The new model fit indices improved significantly to GFI = 0.993, AGFI = 0.963,
and RMSEA = 0.064. The final measurement model for SNR is shown in Figure 5.6.1.6.
Although the loading of SNR2 is relatively low, it was decided to keep the item as the
product mix aspect is captured well in the item as well as the overall model fit is good.
109
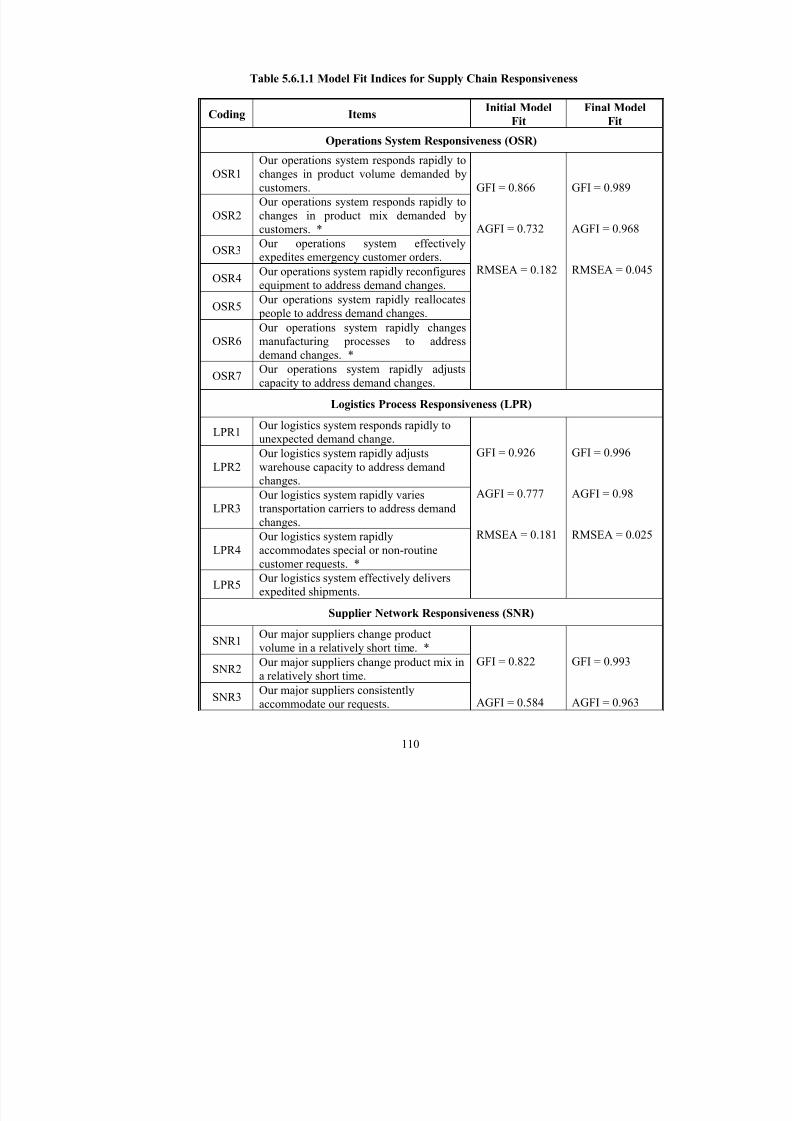
8/13/2019 Competitive_advantage of a Firm Through Supply Chain Responsiveness and SCM Practices
http://slidepdf.com/reader/full/competitiveadvantage-of-a-firm-through-supply-chain-responsiveness-and-scm 128/294
Table 5.6.1.1 Model Fit Indices for Supply Chain Responsiveness
Coding ItemsInitial Model
Fit
Final Model
Fit
Operations System Responsiveness (OSR)
OSR1Our operations system responds rapidly tochanges in product volume demanded bycustomers.
OSR2Our operations system responds rapidly tochanges in product mix demanded bycustomers. *
OSR3Our operations system effectivelyexpedites emergency customer orders.
OSR4Our operations system rapidly reconfiguresequipment to address demand changes.
OSR5 Our operations system rapidly reallocates people to address demand changes.
OSR6Our operations system rapidly changesmanufacturing processes to addressdemand changes. *
OSR7Our operations system rapidly adjustscapacity to address demand changes.
GFI = 0.866
AGFI = 0.732
RMSEA = 0.182
GFI = 0.989
AGFI = 0.968
RMSEA = 0.045
Logistics Process Responsiveness (LPR)
LPR1Our logistics system responds rapidly tounexpected demand change.
LPR2Our logistics system rapidly adjustswarehouse capacity to address demandchanges.
LPR3Our logistics system rapidly variestransportation carriers to address demandchanges.
LPR4Our logistics system rapidlyaccommodates special or non-routinecustomer requests. *
LPR5Our logistics system effectively deliversexpedited shipments.
GFI = 0.926
AGFI = 0.777
RMSEA = 0.181
GFI = 0.996
AGFI = 0.98
RMSEA = 0.025
Supplier Network Responsiveness (SNR)
SNR1Our major suppliers change productvolume in a relatively short time. *
SNR2Our major suppliers change product mix ina relatively short time.
SNR3Our major suppliers consistentlyaccommodate our requests.
GFI = 0.822
AGFI = 0.584
GFI = 0.993
AGFI = 0.963
110
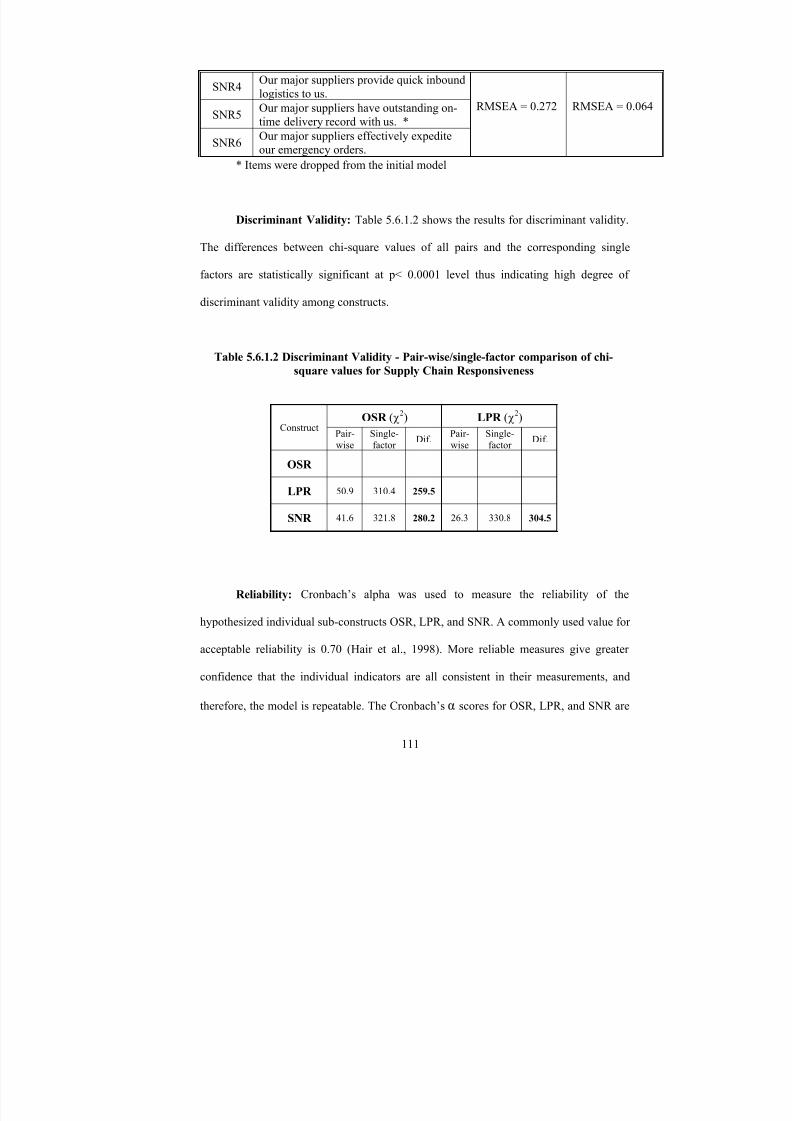
8/13/2019 Competitive_advantage of a Firm Through Supply Chain Responsiveness and SCM Practices
http://slidepdf.com/reader/full/competitiveadvantage-of-a-firm-through-supply-chain-responsiveness-and-scm 129/294
SNR4Our major suppliers provide quick inboundlogistics to us.
SNR5Our major suppliers have outstanding on-time delivery record with us. *
SNR6Our major suppliers effectively expedite
our emergency orders.
RMSEA = 0.272 RMSEA = 0.064
* Items were dropped from the initial model
Discriminant Validity: Table 5.6.1.2 shows the results for discriminant validity.
The differences between chi-square values of all pairs and the corresponding single
factors are statistically significant at p< 0.0001 level thus indicating high degree of
discriminant validity among constructs.
Table 5.6.1.2 Discriminant Validity - Pair-wise/single-factor comparison of chi-
square values for Supply Chain Responsiveness
OSR (χ2) LPR (χ2)Construct
Pair-wise
Single-factor
Dif.Pair-wise
Single-factor
Dif.
OSR
LPR 50.9 310.4 259.5
SNR 41.6 321.8 280.2 26.3 330.8 304.5
Reliability: Cronbach’s alpha was used to measure the reliability of the
hypothesized individual sub-constructs OSR, LPR, and SNR. A commonly used value for
acceptable reliability is 0.70 (Hair et al., 1998). More reliable measures give greater
confidence that the individual indicators are all consistent in their measurements, and
therefore, the model is repeatable. The Cronbach’s α scores for OSR, LPR, and SNR are
111
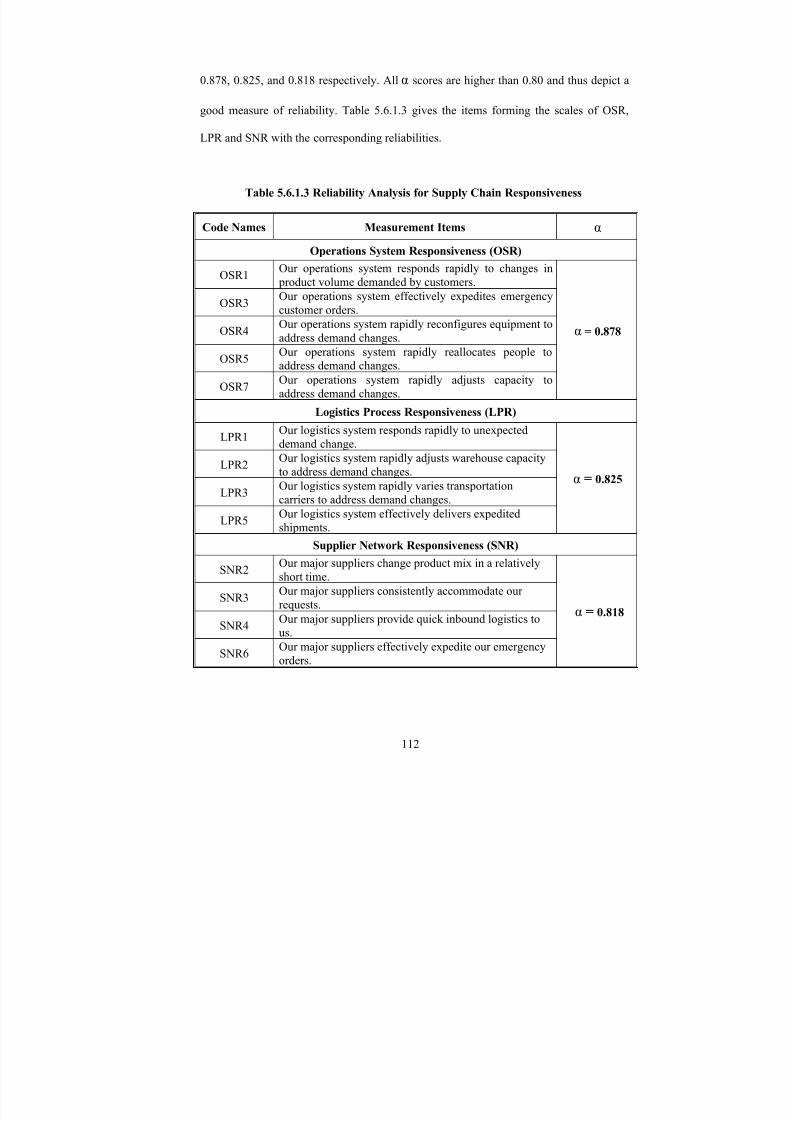
8/13/2019 Competitive_advantage of a Firm Through Supply Chain Responsiveness and SCM Practices
http://slidepdf.com/reader/full/competitiveadvantage-of-a-firm-through-supply-chain-responsiveness-and-scm 130/294
0.878, 0.825, and 0.818 respectively. All α scores are higher than 0.80 and thus depict a
good measure of reliability. Table 5.6.1.3 gives the items forming the scales of OSR,
LPR and SNR with the corresponding reliabilities.
Table 5.6.1.3 Reliability Analysis for Supply Chain Responsiveness
Code Names Measurement Items α
Operations System Responsiveness (OSR)
OSR1Our operations system responds rapidly to changes in product volume demanded by customers.
OSR3Our operations system effectively expedites emergencycustomer orders.
OSR4Our operations system rapidly reconfigures equipment toaddress demand changes.
OSR5Our operations system rapidly reallocates people toaddress demand changes.
OSR7Our operations system rapidly adjusts capacity toaddress demand changes.
α = 0.878
Logistics Process Responsiveness (LPR)
LPR1Our logistics system responds rapidly to unexpecteddemand change.
LPR2 Our logistics system rapidly adjusts warehouse capacityto address demand changes.
LPR3Our logistics system rapidly varies transportationcarriers to address demand changes.
LPR5Our logistics system effectively delivers expeditedshipments.
α = 0.825
Supplier Network Responsiveness (SNR)
SNR2Our major suppliers change product mix in a relativelyshort time.
SNR3Our major suppliers consistently accommodate our
requests.
SNR4Our major suppliers provide quick inbound logistics tous.
SNR6Our major suppliers effectively expedite our emergencyorders.
α = 0.818
112
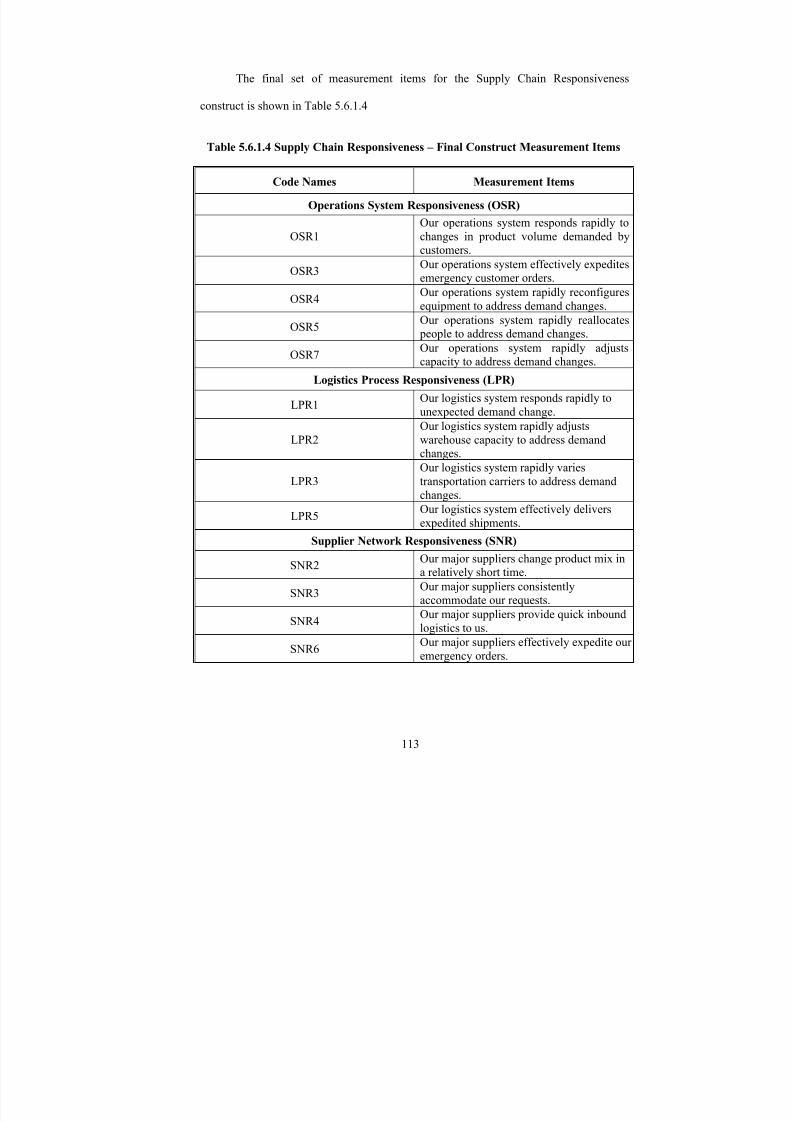
8/13/2019 Competitive_advantage of a Firm Through Supply Chain Responsiveness and SCM Practices
http://slidepdf.com/reader/full/competitiveadvantage-of-a-firm-through-supply-chain-responsiveness-and-scm 131/294
The final set of measurement items for the Supply Chain Responsiveness
construct is shown in Table 5.6.1.4
Table 5.6.1.4 Supply Chain Responsiveness – Final Construct Measurement Items
Code Names Measurement Items
Operations System Responsiveness (OSR)
OSR1Our operations system responds rapidly tochanges in product volume demanded bycustomers.
OSR3Our operations system effectively expeditesemergency customer orders.
OSR4
Our operations system rapidly reconfigures
equipment to address demand changes.
OSR5Our operations system rapidly reallocates people to address demand changes.
OSR7Our operations system rapidly adjustscapacity to address demand changes.
Logistics Process Responsiveness (LPR)
LPR1Our logistics system responds rapidly tounexpected demand change.
LPR2Our logistics system rapidly adjustswarehouse capacity to address demand
changes.
LPR3Our logistics system rapidly variestransportation carriers to address demandchanges.
LPR5Our logistics system effectively deliversexpedited shipments.
Supplier Network Responsiveness (SNR)
SNR2Our major suppliers change product mix ina relatively short time.
SNR3Our major suppliers consistentlyaccommodate our requests.
SNR4Our major suppliers provide quick inboundlogistics to us.
SNR6Our major suppliers effectively expedite ouremergency orders.
113
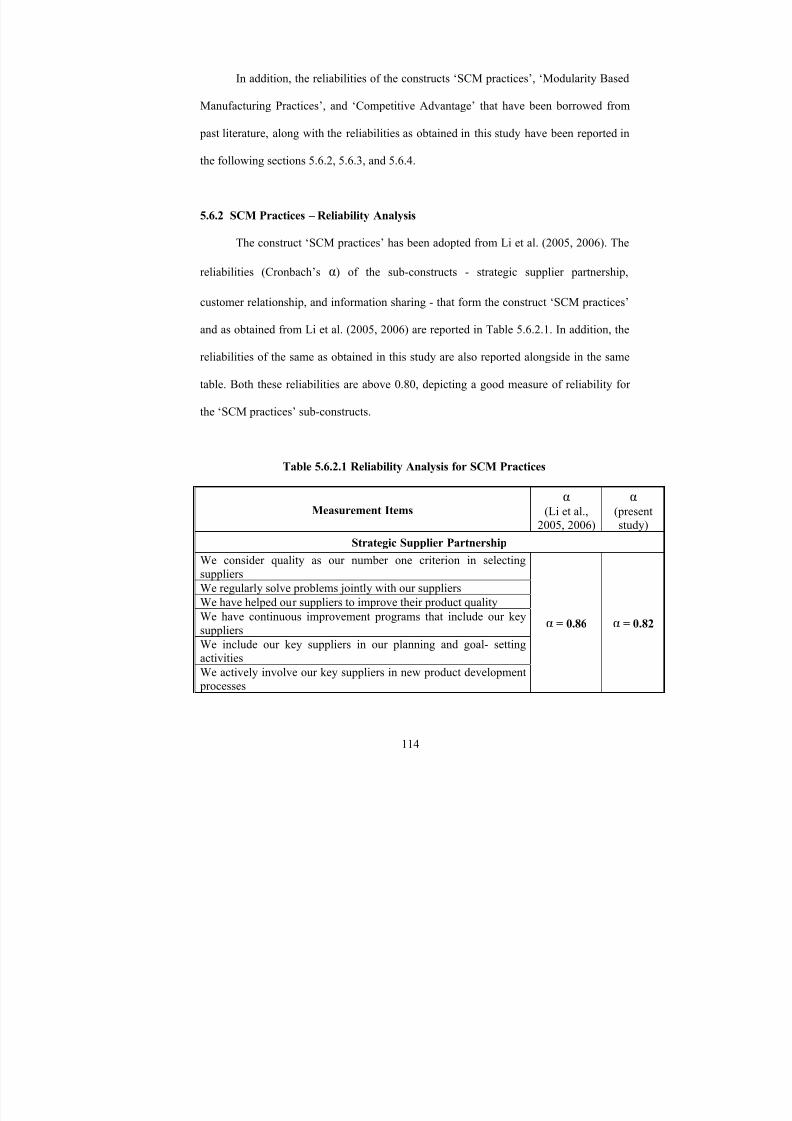
8/13/2019 Competitive_advantage of a Firm Through Supply Chain Responsiveness and SCM Practices
http://slidepdf.com/reader/full/competitiveadvantage-of-a-firm-through-supply-chain-responsiveness-and-scm 132/294
In addition, the reliabilities of the constructs ‘SCM practices’, ‘Modularity Based
Manufacturing Practices’, and ‘Competitive Advantage’ that have been borrowed from
past literature, along with the reliabilities as obtained in this study have been reported in
the following sections 5.6.2, 5.6.3, and 5.6.4.
5.6.2 SCM Practices – Reliability Analysis
The construct ‘SCM practices’ has been adopted from Li et al. (2005, 2006). The
reliabilities (Cronbach’s α) of the sub-constructs - strategic supplier partnership,
customer relationship, and information sharing - that form the construct ‘SCM practices’
and as obtained from Li et al. (2005, 2006) are reported in Table 5.6.2.1. In addition, the
reliabilities of the same as obtained in this study are also reported alongside in the same
table. Both these reliabilities are above 0.80, depicting a good measure of reliability for
the ‘SCM practices’ sub-constructs.
Table 5.6.2.1 Reliability Analysis for SCM Practices
Measurement Itemsα
(Li et al.,2005, 2006)
α (presentstudy)
Strategic Supplier Partnership
We consider quality as our number one criterion in selectingsuppliers
We regularly solve problems jointly with our suppliers
We have helped our suppliers to improve their product qualityWe have continuous improvement programs that include our keysuppliers
We include our key suppliers in our planning and goal- settingactivities
We actively involve our key suppliers in new product development processes
α = 0.86 α = 0.82
114
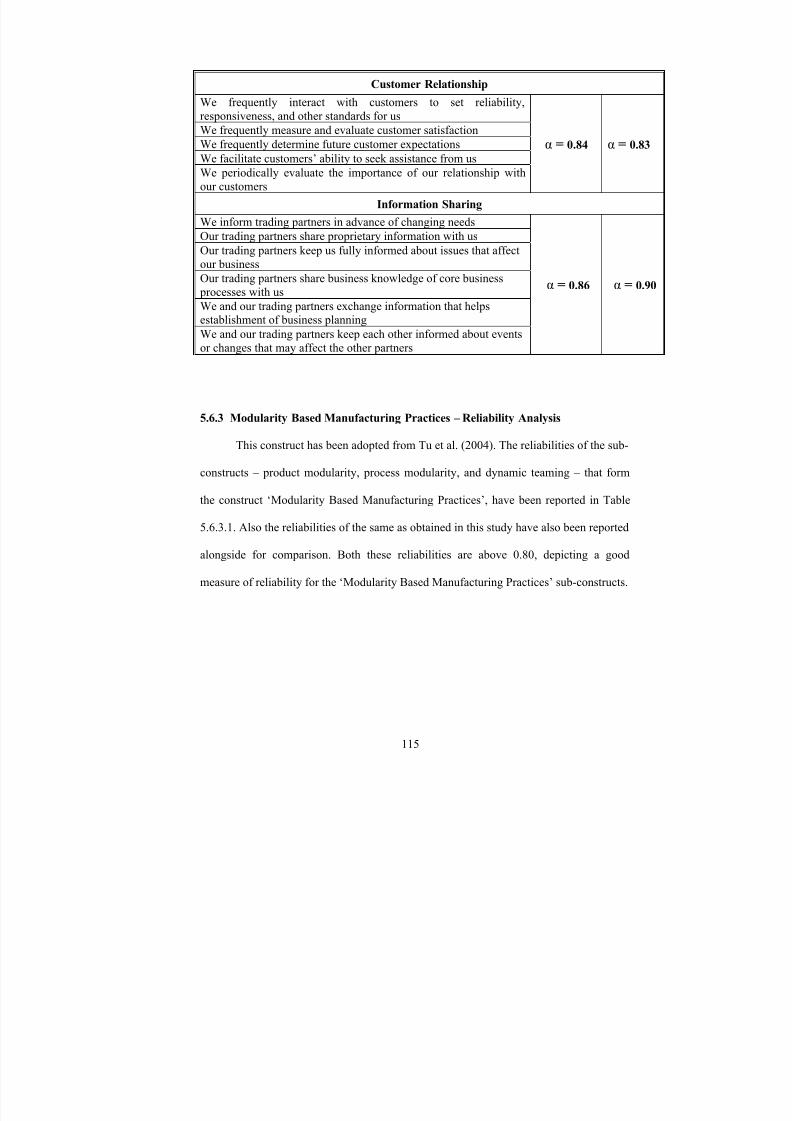
8/13/2019 Competitive_advantage of a Firm Through Supply Chain Responsiveness and SCM Practices
http://slidepdf.com/reader/full/competitiveadvantage-of-a-firm-through-supply-chain-responsiveness-and-scm 133/294
Customer Relationship
We frequently interact with customers to set reliability,responsiveness, and other standards for us
We frequently measure and evaluate customer satisfaction
We frequently determine future customer expectations
We facilitate customers’ ability to seek assistance from us
We periodically evaluate the importance of our relationship withour customers
α =0.84
α =0.83
Information Sharing
We inform trading partners in advance of changing needs
Our trading partners share proprietary information with us
Our trading partners keep us fully informed about issues that affectour business
Our trading partners share business knowledge of core business processes with us
We and our trading partners exchange information that helpsestablishment of business planning
We and our trading partners keep each other informed about eventsor changes that may affect the other partners
α = 0.86 α = 0.90
5.6.3 Modularity Based Manufacturing Practices – Reliability Analysis
This construct has been adopted from Tu et al. (2004). The reliabilities of the sub-
constructs – product modularity, process modularity, and dynamic teaming – that form
the construct ‘Modularity Based Manufacturing Practices’, have been reported in Table
5.6.3.1. Also the reliabilities of the same as obtained in this study have also been reported
alongside for comparison. Both these reliabilities are above 0.80, depicting a good
measure of reliability for the ‘Modularity Based Manufacturing Practices’ sub-constructs.
115

8/13/2019 Competitive_advantage of a Firm Through Supply Chain Responsiveness and SCM Practices
http://slidepdf.com/reader/full/competitiveadvantage-of-a-firm-through-supply-chain-responsiveness-and-scm 134/294
Table 5.6.3.1 Reliability Analysis for Modularity Based Manufacturing Practices
Measurement Itemsα
(Tu et al.,2004)
α (presentstudy)
Product Modularity
Our products use modularized design
Our products share common modules
Our product features are designed around a standard base unit
Product modules can be reassembled into different forms
Product feature modules can be added to a standard base unit
α = 0.83 α = 0.90
Process Modularity
Our production process is designed as adjustable modules
Our production process can be adjusted by adding new processmodules
Production process modules can be adjusted for changing production needs
Our production process can be broken down into standard sub- processes that produce standard base units and customization sub- processes that further customize the base units
Production process modules can be rearranged so thatcustomization sub-processes occur last
α = 0.82 α = 0.92
Dynamic Teaming
Production teams that can be reorganized are used in our plant
Production teams can be reorganized in response to product/process
changesProduction teams can be reassigned to different production tasks
Production team members can be reassigned to different teams
Production team members are capable of working on different teams
α = 0.88 α = 0.95
5.6.4 Competitive Advantage – Reliability Analysis
The construct has been adopted from Koufteros et al. (1997). Also, Li et al.
(2006) validated the construct with a condensed set of measures (which have been
borrowed in this study) under each sub-construct: Price/Cost, Quality, Delivery
Dependability, Product Innovation, and Time to Market. The reliabilities of these sub-
constructs which form the construct ‘Competitive Advantage’ have been reported in
116
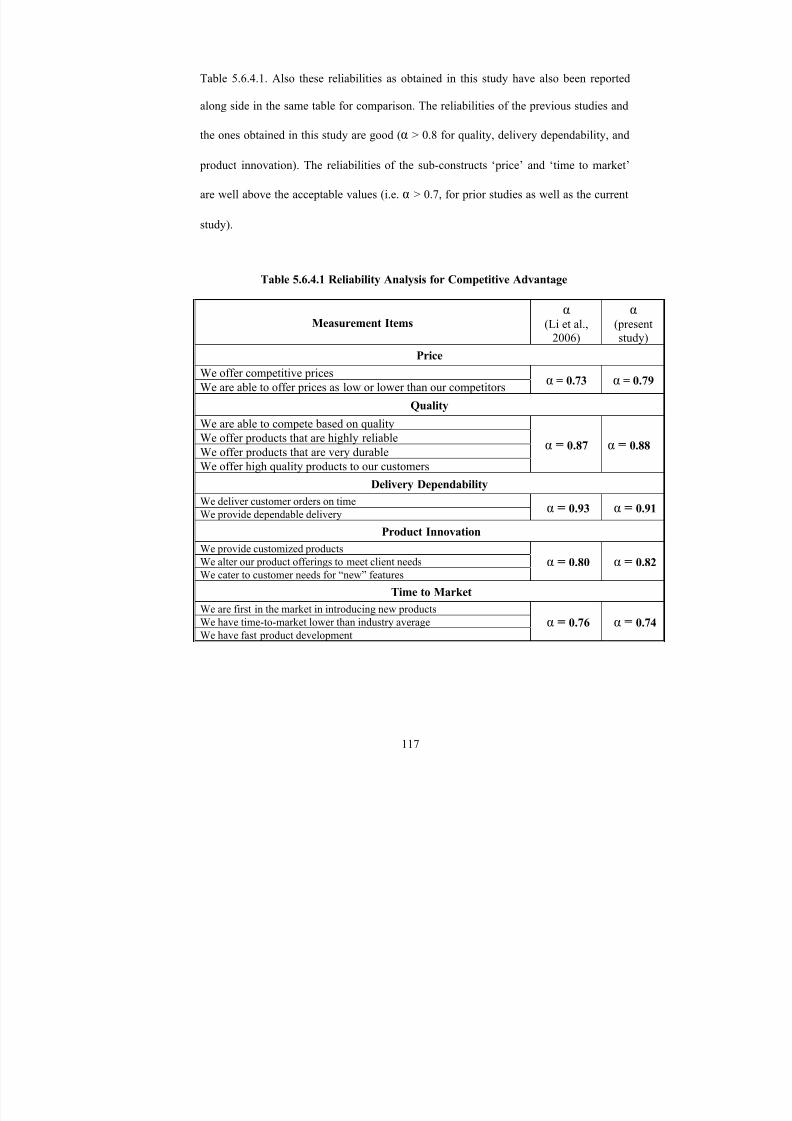
8/13/2019 Competitive_advantage of a Firm Through Supply Chain Responsiveness and SCM Practices
http://slidepdf.com/reader/full/competitiveadvantage-of-a-firm-through-supply-chain-responsiveness-and-scm 135/294
Table 5.6.4.1. Also these reliabilities as obtained in this study have also been reported
along side in the same table for comparison. The reliabilities of the previous studies and
the ones obtained in this study are good (α > 0.8 for quality, delivery dependability, and
product innovation). The reliabilities of the sub-constructs ‘price’ and ‘time to market’
are well above the acceptable values (i.e. α > 0.7, for prior studies as well as the current
study).
Table 5.6.4.1 Reliability Analysis for Competitive Advantage
Measurement Itemsα
(Li et al.,2006)
α (presentstudy)
Price
We offer competitive prices
We are able to offer prices as low or lower than our competitorsα = 0.73 α = 0.79
Quality
We are able to compete based on quality
We offer products that are highly reliable
We offer products that are very durableWe offer high quality products to our customers
α = 0.87 α = 0.88
Delivery Dependability
We deliver customer orders on time We provide dependable delivery
α = 0.93 α = 0.91
Product Innovation
We provide customized products
We alter our product offerings to meet client needs
We cater to customer needs for “new” featuresα = 0.80 α = 0.82
Time to Market
We are first in the market in introducing new productsWe have time-to-market lower than industry average
We have fast product developmentα = 0.76 α = 0.74
117

8/13/2019 Competitive_advantage of a Firm Through Supply Chain Responsiveness and SCM Practices
http://slidepdf.com/reader/full/competitiveadvantage-of-a-firm-through-supply-chain-responsiveness-and-scm 136/294
The sections 5.6.2, 5.6.3, and 5.6.4 above presented the reliabilities for the
constructs that are adopted from prior studies. All the scales portray good or acceptable
reliability measures. The next section 5.7 shall validate the second order construct
‘Supply Chain Responsiveness’ since it is newly developed in this research.
5.7 Validation of Second-order Construct
The validation of the second order construct is performed only for the newly
developed construct ‘Supply Chain Responsiveness’, as the other constructs have been
borrowed from past literatures and have already been validated therein. The next step is
to calculate the T coefficient to test if the three sub-constructs (Operations System
Responsiveness (OSR), Logistics Process Responsiveness (LPR), and Supplier Network
Responsiveness (SNR)) underlie a single higher-order construct (Supply Chain
Responsiveness (SCR)). However as discussed earlier, in the case of three correlated
first-order factors, a second-order model has the same degrees of freedom and chi-square
as that of the first-order model, thus T coefficient equals 1.0, which has no meaning (Doll
et al., 1995). In this situation, we look at the standardized coefficient for each sub-
construct. If all of them are statistically significant, a second-order construct can be
considered. From Table 5.7.1, it can be seen GFI (0.952), AGFI (0.93) are well above
0.9, RMSEA (0.045) is below 0.05 and thus indicative of a very good model-data fit.
Furthermore, the standardized coefficients for the three sub-constructs are 0.80 for OSR,
0.68 for LPR, and 0.61 for SNR, and are all statistically significant hence, the higher-
order construct (SCR) can be considered. Figures 5.7.1 and 5.7.2 depict the first order
118
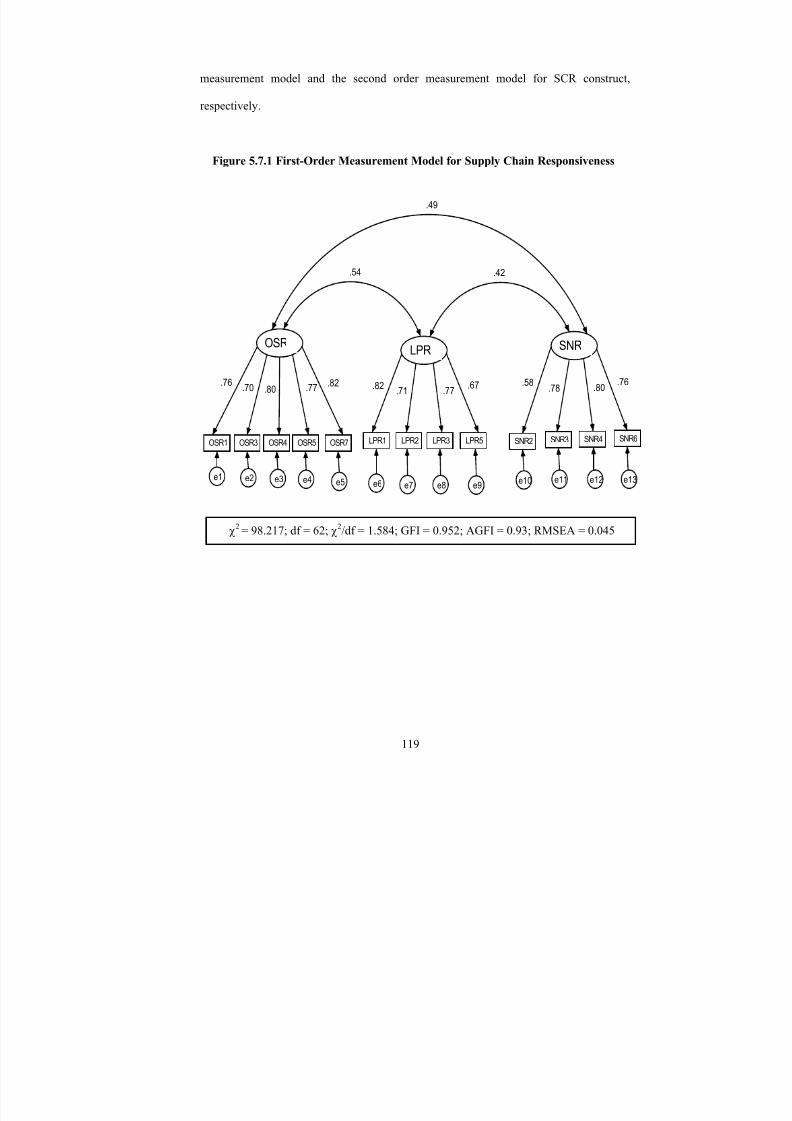
8/13/2019 Competitive_advantage of a Firm Through Supply Chain Responsiveness and SCM Practices
http://slidepdf.com/reader/full/competitiveadvantage-of-a-firm-through-supply-chain-responsiveness-and-scm 137/294
measurement model and the second order measurement model for SCR construct,
respectively.
Figure 5.7.1 First-Order Measurement Model for Supply Chain Responsiveness
OSR b
OSR5
e4
OSR4
e3
OSR3
e2
OSR1
e1
LPR b
LPR5
e9
LPR3
e8
LPR2
e7
LPR1
e6
SNR b
SNR6
e13
.76
SNR4
e12
SNR3
e11
SNR2
e10
OSR7
e5
.58.78.67.82.76
.70 .80 .82 .80.71 .77.77
.54
.49
.42
χ2 = 98.217; df = 62; χ2/df = 1.584; GFI = 0.952; AGFI = 0.93; RMSEA = 0.045
119
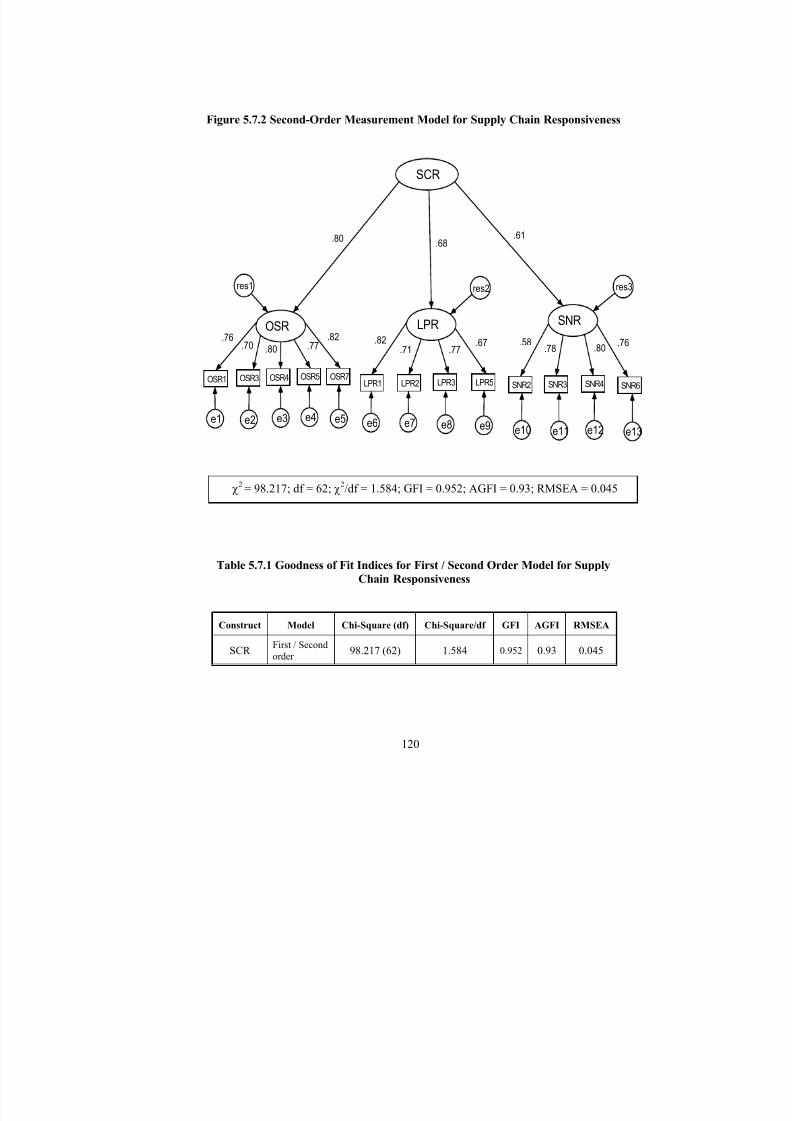
8/13/2019 Competitive_advantage of a Firm Through Supply Chain Responsiveness and SCM Practices
http://slidepdf.com/reader/full/competitiveadvantage-of-a-firm-through-supply-chain-responsiveness-and-scm 138/294
Figure 5.7.2 Second-Order Measurement Model for Supply Chain Responsiveness
SCR
OSR a
OSR5
e4
OSR4
e3
OSR3
e2
OSR1
e1
LPR a
LPR5
e9
LPR3
e8
LPR2
e7
LPR1
e6
SNR a
SNR6
e13
SNR4
e12
SNR3
e11
SNR2
e10
res1 res2 res3
OSR7
e5
.80
.80.70 .71.82.76 .82
.77 .76
.68
.77 .67 .58
.78 .80
.61
χ2 = 98.217; df = 62; χ2/df = 1.584; GFI = 0.952; AGFI = 0.93; RMSEA = 0.045
Table 5.7.1 Goodness of Fit Indices for First / Second Order Model for Supply
Chain Responsiveness
Construct Model Chi-Square (df) Chi-Square/df GFI AGFI RMSEA
SCRFirst / Secondorder
98.217 (62) 1.584 0.952 0.93 0.045
120
8/13/2019 Competitive_advantage of a Firm Through Supply Chain Responsiveness and SCM Practices
http://slidepdf.com/reader/full/competitiveadvantage-of-a-firm-through-supply-chain-responsiveness-and-scm 139/294
5.8 Construct-Level Correlation Analysis
In order for the measurement to be generalized, predictive validity or criterion-
related validity must be performed by comparing the second order factor models with one
or more external variables (criterion) known or believed to measure the attribute.
Criterion-related validity is characterized by prediction to an outside criterion and by
checking a measuring instrument, either now or future, against some outcome or measure
(Kerlinger, 1986). In this study, the criterion used to test the predictive validity is
dependent variable (also called as endogenous latent variable).
To check for preliminary statistical validity (predictive validity) of the 5
hypotheses presented in Chapter 3, the Pearson correlation (i.e. does not specify causal
relationships) was used. Each construct was represented by a composite score, computed
by taking the average scores of all items in a specific construct (i.e. average of all the
items for a sub-construct as the score for the sub-construct; further the average of all the
sub-constructs that comprised the higher order construct was calculated and this score
was treated as the composite score for the higher order construct). The results are
presented in Table 5.8.1. As evident from the table, all correlations are statistically
significant at 0.01 level. Thus all hypothesized relationships of interest are statistically
supported by the Pearson correlation. Further hypotheses testing using structural equation
modeling (using AMOS) is discussed in the next chapter.
121
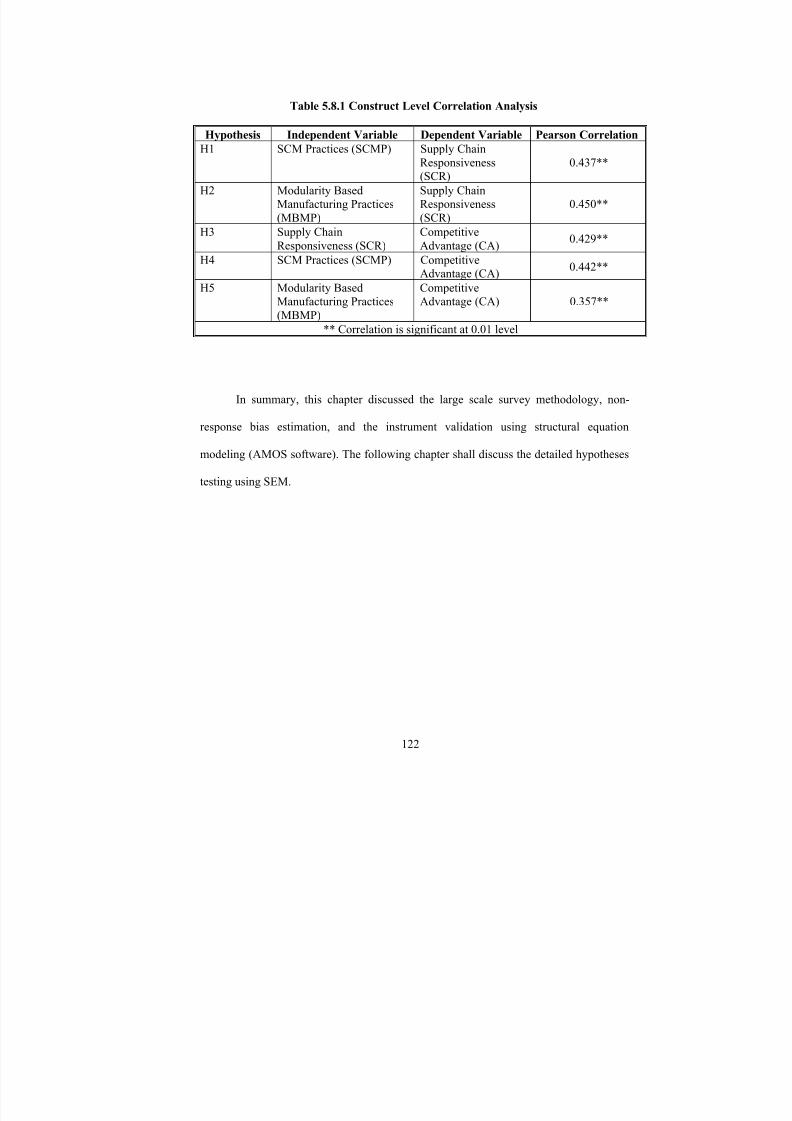
8/13/2019 Competitive_advantage of a Firm Through Supply Chain Responsiveness and SCM Practices
http://slidepdf.com/reader/full/competitiveadvantage-of-a-firm-through-supply-chain-responsiveness-and-scm 140/294
Table 5.8.1 Construct Level Correlation Analysis
Hypothesis Independent Variable Dependent Variable Pearson Correlation
H1 SCM Practices (SCMP) Supply ChainResponsiveness(SCR)
0.437**
H2 Modularity BasedManufacturing Practices(MBMP)
Supply ChainResponsiveness(SCR)
0.450**
H3 Supply ChainResponsiveness (SCR)
CompetitiveAdvantage (CA)
0.429**
H4 SCM Practices (SCMP) CompetitiveAdvantage (CA)
0.442**
H5 Modularity Based
Manufacturing Practices(MBMP)
Competitive
Advantage (CA) 0.357**
** Correlation is significant at 0.01 level
In summary, this chapter discussed the large scale survey methodology, non-
response bias estimation, and the instrument validation using structural equation
modeling (AMOS software). The following chapter shall discuss the detailed hypotheses
testing using SEM.
122

8/13/2019 Competitive_advantage of a Firm Through Supply Chain Responsiveness and SCM Practices
http://slidepdf.com/reader/full/competitiveadvantage-of-a-firm-through-supply-chain-responsiveness-and-scm 141/294
CHAPTER 6: CAUSAL MODEL AND HYPOTHESES TESTING
This chapter tests the five hypotheses proposed in Chapter 3, by using the AMOS
software for structural equation modeling. Although the bivariate correlations are
statistically significant for all hypothesized relationships, it may not be true when all the
relationships are put together in a multivariate complex model due to the interactions
among variables. Since the measurement instruments for all four major constructs in the
current study have already been validated in Chapter 5 (one new construct validated, the
other three validated constructs being adopted from prior literature and as quoted in
Chapter 5), the hypotheses can be tested in a much more rigorous manner using the
structural equation modeling (SEM) framework.
The development and application of SEM is considered to be a major
methodological breakthrough in the study of complex interrelations among variables
(Joreskog, 1970). SEM is widely recognized as a powerful methodology for capturing
and explicating complex multivariate relations in social science data. It represents the
unification of two methodological traditions: factor analysis originating from psychology
and psychometrics, and simultaneous equations (path analytic) modeling originating from
econometrics (Kaplan and Elliot, 1997). Therefore, the standard SEM is composed of two
parts – the measurement model (a sub model in SEM that specifies the indicators of each
construct and assesses the reliability of each construct for latter use in estimating the
causal relationships) and the structural model (the set of dependence relationships linking
123
8/13/2019 Competitive_advantage of a Firm Through Supply Chain Responsiveness and SCM Practices
http://slidepdf.com/reader/full/competitiveadvantage-of-a-firm-through-supply-chain-responsiveness-and-scm 142/294
the model constructs). Since the measurement properties of the instrument in the current
study have already been evaluated through rigorous validity and reliability analysis, the
SEM model described in this chapter will focus on path analysis using the AMOS
structural model. The significance of each path in the proposed structural model will be
tested and the overall goodness-of-fit of the entire structural equation model will be
assessed as well.
6.1 Proposed Structural Model
The proposed structural model depicted in Figure 6.1 is a replica of the
framework presented in Figure 3.1. There are four variables in the model: SCM Practices
(SCMP), Modularity Based Manufacturing Practices (MBMP), Supply Chain
Responsiveness (SCR), and Competitive Advantage (CA). SCMP and MBMP are
regarded as independent (exogenous) variables, and SCR and CA are regarded as
dependent (endogenous) variables.
The five hypotheses proposed in Chapter 3 are represented by the 5 causal
relationships in the model. Hypothesis 1 is represented in Figure 6.1 by the relationship
SCMP SCR; Hypothesis 2 is represented by the relationship MBMP SCR;
Hypothesis 3 is represented by the relationship SCR CA; Hypothesis 4 is represented
by the relationship SCMP CA; and Hypothesis 5 is represented by the relationship
MBMP CA.
124

8/13/2019 Competitive_advantage of a Firm Through Supply Chain Responsiveness and SCM Practices
http://slidepdf.com/reader/full/competitiveadvantage-of-a-firm-through-supply-chain-responsiveness-and-scm 143/294
Figure 6.1 Theoretical Framework
H4
H1
H3
H2
H5
SCM Practices
• Strategic Supplier Partnership
• Customer Relationship
• Information SharingSupply Chain Responsiveness
• Operations System Responsiveness
• Logistics Process Responsiveness
• Supplier Network Responsiveness
Competitive Advantage
• Price
• Quality
• Delivery dependability
• Time to market
• Product innovation
Modularity Based
Manufacturing Practices
• Product Modularity• Process Modularity
• Dynamic Teaming
6.2 Structural Model Testing Results
The hypothesized relationships are now ready to be tested based on the structural
model specified in Figure 6.1. The model fit properties are evaluated using the fit
statistics discussed in Chapter 5. The composite score computed for each construct at the
end of Chapter 5 was used as input to the structural modeling process.
6.2.1 Initial Structural Modeling Results
Figure 6.2 displays the structural model and Figure 6.3 shows the path analysis
resulting from the initial AMOS structural modeling analysis. More detailed results are
presented in Table 6.2.1. Out of 5 hypothesized relationships, 4 were found to be
significantly supported. Hypotheses 1, 2, and 4 all were significant at the 0.001 level.
125

8/13/2019 Competitive_advantage of a Firm Through Supply Chain Responsiveness and SCM Practices
http://slidepdf.com/reader/full/competitiveadvantage-of-a-firm-through-supply-chain-responsiveness-and-scm 144/294
Hypothesis 3 was significant at 0.05 level (t-value = 2.354). The t-value for Hypothesis 5
was 0.714, which is not significant at the 0.05 level. Therefore all research hypotheses
except Hypothesis 5 are supported by the AMOS structural modeling results. Out of the 4
supported relationships, 3 relationships had a medium effect size and 1 relationship had a
large effect size. Thus the effect size results confirm that the supported relationships have
both statistical and practical significance, which is crucial in providing both theoretical
and managerial implications. The initial model fit measures are GFI = 0.963, RMSEA =
0.056, and AGFI = 0.932. GFI was above the recommended minimum value of 0.90;
AGFI was much above the recommended minimum value of 0.80; RMSEA was very
close to the recommended value of 0.05 indicating a good fit. These results present an
initial good fit of the proposed model to the data. The implications of the one
insignificant relationship are also discussed later in this chapter.
126

8/13/2019 Competitive_advantage of a Firm Through Supply Chain Responsiveness and SCM Practices
http://slidepdf.com/reader/full/competitiveadvantage-of-a-firm-through-supply-chain-responsiveness-and-scm 145/294
Figure 6.2 Structural Model
SCMP
ISe3
1
1
CRe2
1
1
e1 SSP
MBMP
DTe6
1
1
PRMe5
1
PMe4
1
SCR
OSR
e9
LPR
e8
SNR
e7
1
res1
1
1
1
1
127

8/13/2019 Competitive_advantage of a Firm Through Supply Chain Responsiveness and SCM Practices
http://slidepdf.com/reader/full/competitiveadvantage-of-a-firm-through-supply-chain-responsiveness-and-scm 146/294
Figure 6.3 Path Analysis Results
H4 *
0.33, t = 3.484
GFI = 0.963, AGFI = 0.932, and RMSEA = 0.056, * Significance at < 0.0
H1 *
0.33, t = 3.354
H3
0.27, t = 2
H2 *0.51, t = 5.173
H5
0.07, t = 0.714
Supply Chain
Responsiveness
Modularity Based
Manufacturing Practices
SCM Practices
128

8/13/2019 Competitive_advantage of a Firm Through Supply Chain Responsiveness and SCM Practices
http://slidepdf.com/reader/full/competitiveadvantage-of-a-firm-through-supply-chain-responsiveness-and-scm 147/294
Table 6.2.1 Initial AMOS Structural Modeling Results
Hypotheses Relationship AMOS
Coefficients
Effect
Size
t-value P Support
H1 SCMP SCR 0.33 Medium 3.354 *** Yes
H2 MBMP SCR 0.51 Large 5.173 *** Yes
H3 SCR CA 0.27 Medium 2.353 0.019 Yes
H4 SCMP CA 0.33 Medium 3.484 *** Yes
H5 MBMP CA 0.07 Small 0.714 0.475 No
GFI = 0.963 AGFI = 0.932 RMSEA = 0.056 *** P < 0.001
129

8/13/2019 Competitive_advantage of a Firm Through Supply Chain Responsiveness and SCM Practices
http://slidepdf.com/reader/full/competitiveadvantage-of-a-firm-through-supply-chain-responsiveness-and-scm 148/294
6.3 Discussion of Structural Modeling and Hypotheses Testing Results
The previous sections reported the structural modeling and hypotheses testing
results on the proposed model. To summarize, 4 out of 5 hypothesized relations
(Hypotheses 1, 2, 3, and 4) were significant. Hypotheses 1, 2, and 4 were significant at
0.001 level and Hypothesis 3 was significant at the 0.05 level. One hypothesized relation
(Hypothesis 5) was not significantly supported. The final AMOS structural model
displayed very good fit to the data.
However, statistical significance and model fit are not ultimate objectives of
academic research. They are just the means to achieve the end, which is better
understanding of the subject under investigation and discovery of new relationships. The
results from this research can be used by both academicians in further exploring and
testing the causal linkages in supply chain responsiveness study, and practitioners for
guiding the implementation of SCM practices and modularity based manufacturing
practices, and the evaluation of supply chain responsiveness and thus competitive
advantage of the firm. Therefore, the practical and theoretical implications of the results
of each hypothesis are discussed as follows:
Hypothesis 1: ‘SCM practices’ of a firm is positively related to supply chain
responsiveness.
Hypothesis H1 was found to be significant and thus supported. This indicates that
the higher the level of SCM practices by a firm, the higher the level of its supply chain
responsiveness. In other words ‘SCM practices’ of a firm has a direct positive influence
on supply chain responsiveness. It empirically confirms the theoretical notion that a well-
130
8/13/2019 Competitive_advantage of a Firm Through Supply Chain Responsiveness and SCM Practices
http://slidepdf.com/reader/full/competitiveadvantage-of-a-firm-through-supply-chain-responsiveness-and-scm 149/294
managed and well-executed supply chain directly leads to improved supply chain
responsiveness. This is in line with Michael Dell’s (of Dell computers) view of being and
staying responsive (Magretta, 1998). He highlights three significant factors in achieving
responsiveness, namely working closely with suppliers, constant flow of information
between supply chain partners, and close customer relations. Engaging in sharing of
accurate information such as production schedules, inventory data, demand forecasts, etc.
by organizations with their partners shall improve visibility and enable supply chain
entities to respond rapidly to unexpected events on either customer or supply side. This
would enable them to respond quickly to the changing customers needs. As emphasized
in prior literature (Martin and Grbac, 2003, Tan et al., 1998; Van Hoek et al., 2001)
having close relationships with customers in a supply chain, involving them in joint
problem solving, and taking their inputs for the product design, shall increase
responsiveness of organizations to the customers’ needs. Having strategic partnerships
with suppliers shall reduce uncertainty and improve lead-time thus enabling firms to
rapidly respond to any changes in the business environment. This finding is also
supported by Yusuf et al’s (2003) study, which shows high correlation between the
supplier partnership practices and responsiveness.
Hypothesis 2: ‘ Modularity Based Manufacturing Practices’ of a firm is positively
related to supply chain responsiveness.
Hypothesis H2 was found to be significant and thus supported. This indicates that
the higher the level of modularity based manufacturing practices by a firm, the higher the
level of its supply chain responsiveness. In other words ‘modularity based manufacturing
131
8/13/2019 Competitive_advantage of a Firm Through Supply Chain Responsiveness and SCM Practices
http://slidepdf.com/reader/full/competitiveadvantage-of-a-firm-through-supply-chain-responsiveness-and-scm 150/294
practices’ of a firm has a direct positive influence on supply chain responsiveness. The
significance of Hypothesis 2 empirically confirms that having modular products and
processes could indeed improve the responsiveness of supply chains. This is in
agreement with Baldwin and Clark’s (1997) argument that by breaking up a product into
modules, designers and producers have the flexibility to respond rapidly to any
uncertainties. The empirical results of this study demonstrate to the managers, the
benefits of modularity which include – rapid product updating/modification, rapid
product building (decreased order lead time) with increased variety, rapid design and
testing – which implies that modularity leads to the responsiveness of the operations
systems. Modularity shall assist organizations to source different modules from
individual suppliers, instead of sourcing the whole product, this helps postponed
purchasing of these modules or subassemblies (rather than purchasing a whole product)
thereby improving the ability of suppliers to design, produce, and deliver
standard/modular parts quickly. This implies that modularity based manufacturing
practices improve the supplier network responsiveness in a supply chain. The support for
hypothesis 2 is also in accordance with Tu et al.’s (2004) argument that firms that can
reconfigure and reorganize production teams quickly, without loss of efficiency, can
minimize the manufacturing response time without compromising on the quality of
product design or process execution.
132
8/13/2019 Competitive_advantage of a Firm Through Supply Chain Responsiveness and SCM Practices
http://slidepdf.com/reader/full/competitiveadvantage-of-a-firm-through-supply-chain-responsiveness-and-scm 151/294
Hypothesis 3: Supply Chain Responsiveness is positively related to competitive
advantage of a firm.
Hypothesis H3 was found to be significant and thus supported. The AMOS results
supported hypothesis 3 at the 0.05 level, and so did the construct level correlation
analysis results in Chapter 5 (Table 5.8.1) at the 0.01 level of significance. There is
significant positive correlation between supply chain responsiveness (SCR) and
competitive advantage (CA). This finding empirically confirms the assertion in the
literature that a responsive supply chain could provide an organization with competitive
advantage on dimensions such as quality, delivery dependability, product innovation, and
time-to-market. For managers this implies that being operationally responsive will,
enable organizations to introduce new products faster than major competitors (i.e.
increasing the time to market), and improve the firm’s ability to provide on time the type
and volume of product required by customers (i.e. improve delivery dependability).
Responsiveness of a firm’s supplier network will improve - the ability of the firm to
rapidly introduce new products and features in the market place (i.e. compete based on
product innovation and time to market), as well as improve a firm’s ability to provide on
time delivery (i.e. improve its delivery dependability).
Hypothesis 4: ‘SCM practices’ of a firm is positively related to competitive advantage of
a firm.
Hypothesis H4 was found to be significant and thus supported. This indicates that
the higher the level of SCM practices by a firm, the higher the level of its competitive
advantage. In other words ‘SCM practices’ of a firm has a direct positive influence on its
133
8/13/2019 Competitive_advantage of a Firm Through Supply Chain Responsiveness and SCM Practices
http://slidepdf.com/reader/full/competitiveadvantage-of-a-firm-through-supply-chain-responsiveness-and-scm 152/294
competitive advantage. The successful SCM implementation will improve the
organization’s performance on cost, quality, dependability, flexibility, and time-to-
market, and give the organization a defensible position over its competitors through the
coordination of inter-organizational activities along the supply chain. This backs the
argument from prior literature (Li et al., 2005), that by adopting effective SCM practices
firms can gain greater competitive advantage.
Hypothesis 5: ‘ Modularity Based Manufacturing Practices’ of a firm is positively
related to competitive advantage of a firm.
Hypothesis H5 was found to be non-significant and thus not supported. This
indicates that a firm’s modularity based manufacturing practices do not positively
influence its level of competitive advantage. This implies that modularity cannot improve
the competitive advantage of a firm by itself, but only when it is supplemented by other
best industry practices which, when combined together can give the organization a
defensible position over its competitors.
6.4 Revised Structural Model
After revising the structural model by removing the one insignificant relationship
(H5), the model was tested again using AMOS. The results are presented in Figure 6.4
and Table 6.4.1. All paths have a t-value of greater than 2.0 and are significant at the
0.001 level. Out of the 4 supported relationships, 3 relationships have a medium effect
size and 1 relationship has a large effect size. Thus the effect size results confirm that the
supported relationships have both statistical and practical significance, which is crucial in
134

8/13/2019 Competitive_advantage of a Firm Through Supply Chain Responsiveness and SCM Practices
http://slidepdf.com/reader/full/competitiveadvantage-of-a-firm-through-supply-chain-responsiveness-and-scm 153/294
providing both theoretical and managerial implications. The fit indices of the revised
structural model indicate a good fit: GFI = 0.962 was greater than the minimum 0.90
level; AGFI = 0.933 was much above the recommended minimum value of 0.80;
RMSEA = 0.055 was very close to the recommended value of 0.05 indicating a good fit.
Table 6.4.1 Revised Structural Modeling Results
Hypotheses Relationship AMOS
Coefficients
Effect
Size
t-value P Support
H1 SCMP SCR 0.32 Medium 3.267 *** Yes
H2 MBMP SCR 0.52 Large 5.231 *** Yes
H3 SCR CA 0.31 Medium 3.510 *** Yes
H4 SCMP CA 0.34 Medium 3.661 *** Yes
GFI = 0.962 AGFI = 0.933 RMSEA = 0.055 *** P < 0.001
135

8/13/2019 Competitive_advantage of a Firm Through Supply Chain Responsiveness and SCM Practices
http://slidepdf.com/reader/full/competitiveadvantage-of-a-firm-through-supply-chain-responsiveness-and-scm 154/294
Figure 6.4 Revised Path Analysis Results
H4 *
0.34, t = 3.661
H1 *
0.32, t = 3.267
H3 *0.31, t = 3
H2 *
0.52, t = 5.231
SCM Practices
Supply Chain
Responsiveness
Modularity Based
Manufacturing Practices
GFI = 0.962, AGFI = 0.933, and RMSEA = 0.055, * Significance at < 0.0
136
8/13/2019 Competitive_advantage of a Firm Through Supply Chain Responsiveness and SCM Practices
http://slidepdf.com/reader/full/competitiveadvantage-of-a-firm-through-supply-chain-responsiveness-and-scm 155/294
6.5 Summary of Results
Overall, the results indicate that higher levels of SCM practices by a firm will
lead to both improved supply chain responsiveness, as well as higher levels of
competitive advantage of a firm. The results also show that modularity based
manufacturing practices positively influence supply chain responsiveness. In addition,
supply chain responsiveness will lead to competitive advantage of a firm. However, the
findings do not support the direct impact of modularity based manufacturing practices on
competitive advantage of a firm.
In order to explore, understand, and further analyze in greater depth, the specific
practices that affect supply chain responsiveness and competitive advantage, dimension-
level data analysis is needed. This type of analysis shall enable researchers to gain insight
into the specific dimensions that are influential in achieving the desired results. The next
chapter (chapter 7) discusses in-depth data analyses on a dimension level.
137

8/13/2019 Competitive_advantage of a Firm Through Supply Chain Responsiveness and SCM Practices
http://slidepdf.com/reader/full/competitiveadvantage-of-a-firm-through-supply-chain-responsiveness-and-scm 156/294
8/13/2019 Competitive_advantage of a Firm Through Supply Chain Responsiveness and SCM Practices
http://slidepdf.com/reader/full/competitiveadvantage-of-a-firm-through-supply-chain-responsiveness-and-scm 157/294
dependability, product innovation, and time to market; what specific SCM practices lead
to higher levels of competitive advantage in terms of price, quality, delivery
dependability, product innovation, and time to market. To answer these questions a
dimension-level statistical analysis is needed.
A dimension-level analysis was performed using regression analysis (discussed in
section 7.1), followed by multivariate analysis of variance (MANOVA – discussed in
section 7.3). The regression analysis was instrumental in indicating whether the
independent variables - SCM practices (SCMP) and modularity based manufacturing
practices (MBMP) - significantly predict the dependent variables – supply chain
responsiveness (SCR) and competitive advantage (CA) - and if they do what are the
specific dimensions within SCMP (i.e. strategic supplier partnership, customer
relationship, and information sharing) and MBMP (i.e. product modularity, process
modularity, and dynamic teaming) that predict the dimensions within SCR (i.e.
operations system responsiveness, logistics process responsiveness, and supplier network
responsiveness) and CA (price, quality, delivery dependability, product innovation, and
time to market). Also a dimension level analysis was carried out for the prediction of CA
by SCR.
A MANOVA was deemed to be the appropriate test here for two reasons: first
there was some correlation found between the DVs (dimensions of competitive
advantage), and second all five dimensions of competitive advantage (i.e. price, quality,
delivery dependability, product innovation, and time to market) were considered for
analysis at one single time thus resulting in more than one dependent variable, in which
case MANOVA would be the appropriate test.
139

8/13/2019 Competitive_advantage of a Firm Through Supply Chain Responsiveness and SCM Practices
http://slidepdf.com/reader/full/competitiveadvantage-of-a-firm-through-supply-chain-responsiveness-and-scm 158/294
7.1 Regression Analysis Results
7.1.1 Dimension-Level Analysis for Supply Chain Responsiveness
Stepwise multiple regression is often used in studies that are exploratory in nature
(Aron and Aron, 1999). In our study we have a set of predictors (individual dimensions
of MBMP; individual dimensions of SCMP) and want to explore as to which specific
independent variables (IVs) make meaningful contributions to the overall prediction of
SCR. The structural equation modeling results depict that modularity based
manufacturing practices predict supply chain responsiveness to a large extent, whereas
SCM practices predict supply chain responsiveness to a moderate extent.
A stepwise regression analysis is performed to determine what dimensions of
MBMP (i.e. product modularity (PM), process modularity (PRM), and dynamic teaming
(DT)) and SCMP (i.e. strategic supplier partnership (SSP), customer relationship (CR),
and information sharing (IS)) are significant predictors of SCR (composite score). These
regressions were carried out independently first for the MBMP dimensions on SCR,
followed by the SCMP dimensions on SCR.
The results are tabulated and discussed in the order of significance of predictors
of SCR (i.e. MBMP followed by SCMP), as evident from the results of section 6.2.1
(chapter 6).
7.1.1.1 MBMP (dimension level) – Supply Chain Responsiveness (composite score)
The stepwise regression results shown in Table 7.1.1.1 indicate an overall model
of two dimensions of MBMP (namely DT and PRM) that reasonably predict SCR, R 2
=
0.249, R 2adj = 0.244, F (2,291) = 48.324, p < 0.001. The model accounted for 24.4%
140

8/13/2019 Competitive_advantage of a Firm Through Supply Chain Responsiveness and SCM Practices
http://slidepdf.com/reader/full/competitiveadvantage-of-a-firm-through-supply-chain-responsiveness-and-scm 159/294
(R 2adj) of the variance in SCR. A summary of regression coefficients is presented in Table
7.1.1.2 and indicates that only two dimensions of MBMP in the order DT ( β = 0.317) and
PRM ( β = 0.250), significantly predict SCR (composite score). From these results it is
clear that product modularity (PM) does not contribute significantly to the prediction of
SCR. These are interesting findings and shall be more meaningful if analyzed on the
individual dimensions of supply chain responsiveness.
Table 7.1.1.1 Dimension Level Stepwise Regression Results
Model Summary for MBMP Dimensions on SCR
Step R R2 R
2adj ∆ R
2 F chg p df 1 df 2
1. DT 0.453 0.205 0.202 0.205 75.354 < 0.001 1 292
2. PRM 0.499 0.249 0.244 0.044 17.132 < 0.001 1 291
Table 7.1.1.2 Coefficients for MBMP Dimensions (DT and PRM) on SCR
B β t p
DT 0.221 0.317 5.249 0.000
PRM 0.170 0.250 4.139 0.000
We now proceed to the stepwise regression of SCMP dimensions on the
dependent variable SCR, as it is evidently the second significant predictor of SCR
(chapter 6 - section 6.2.1).
141

8/13/2019 Competitive_advantage of a Firm Through Supply Chain Responsiveness and SCM Practices
http://slidepdf.com/reader/full/competitiveadvantage-of-a-firm-through-supply-chain-responsiveness-and-scm 160/294
7.1.1.2 SCM Practices (dimension level) – Supply Chain Responsiveness (composite
score)
The stepwise regression results shown in Table 7.1.1.3 indicate an overall model
of all the three dimensions of SCMP (in the order IS, SSP and CR) that reasonably
predict SCR, R 2
= 0.194, R 2
adj = 0.186, F (3,290) = 23.271, p < 0.001. The model
accounted for 18.6% (R 2
adj) of the variance in SCR. A summary of regression coefficients
is presented in Table 7.1.1.4 and indicates the three dimensions of SCMP in the order IS
( β = 0.223), SSP ( β = 0.203), and CR ( β = 0.128), that significantly predict SCR
(composite score).
Table 7.1.1.3 Dimension Level Stepwise Regression Results
Model Summary for SCMP Dimensions on SCR
Step R R2 R
2adj ∆ R
2 F chg p df 1 df 2
1. IS 0.373 0.139 0.136 0.139 47.157 < 0.001 1 292
2. SSP 0.426 0.182 0.176 0.043 15.147 < 0.001 1 2913. CR 0.440 0.194 0.186 0.012 4.457 < 0.05 1 290
Table 7.1.1.4 Coefficients for SCMP Dimensions (IS, SSP, and CR) on SCR
B β t p
IS 0.185 0.223 3.551 0.000SSP 0.167 0.203 3.365 0.001
CR 0.104 0.128 2.111 0.036
Following the above dimension-level analysis MBMP and SCMP on summated
SCR score, it is further of interest as to what dimensions within MBMP and SCMP
142
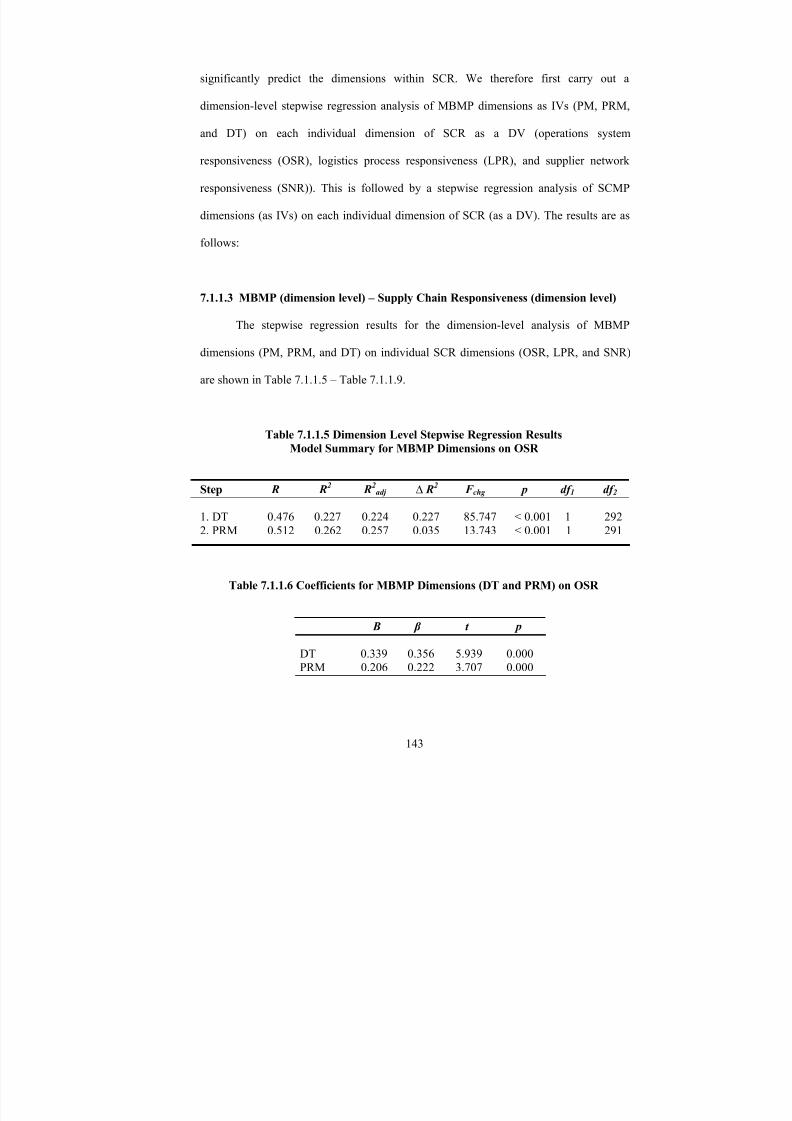
8/13/2019 Competitive_advantage of a Firm Through Supply Chain Responsiveness and SCM Practices
http://slidepdf.com/reader/full/competitiveadvantage-of-a-firm-through-supply-chain-responsiveness-and-scm 161/294
significantly predict the dimensions within SCR. We therefore first carry out a
dimension-level stepwise regression analysis of MBMP dimensions as IVs (PM, PRM,
and DT) on each individual dimension of SCR as a DV (operations system
responsiveness (OSR), logistics process responsiveness (LPR), and supplier network
responsiveness (SNR)). This is followed by a stepwise regression analysis of SCMP
dimensions (as IVs) on each individual dimension of SCR (as a DV). The results are as
follows:
7.1.1.3 MBMP (dimension level) – Supply Chain Responsiveness (dimension level)
The stepwise regression results for the dimension-level analysis of MBMP
dimensions (PM, PRM, and DT) on individual SCR dimensions (OSR, LPR, and SNR)
are shown in Table 7.1.1.5 – Table 7.1.1.9.
Table 7.1.1.5 Dimension Level Stepwise Regression Results
Model Summary for MBMP Dimensions on OSR
Step R R2 R
2adj ∆ R
2 F chg p df 1 df 2
1. DT 0.476 0.227 0.224 0.227 85.747 < 0.001 1 292
2. PRM 0.512 0.262 0.257 0.035 13.743 < 0.001 1 291
Table 7.1.1.6 Coefficients for MBMP Dimensions (DT and PRM) on OSR
B β t p
DT 0.339 0.356 5.939 0.000PRM 0.206 0.222 3.707 0.000
143

8/13/2019 Competitive_advantage of a Firm Through Supply Chain Responsiveness and SCM Practices
http://slidepdf.com/reader/full/competitiveadvantage-of-a-firm-through-supply-chain-responsiveness-and-scm 162/294
From these results (Tables 7.1.1.5 and 7.1.16) it is clear that only two dimensions
of MBMP in the order DT ( β = 0.356) and PRM ( β = 0.222), significantly predict OSR.
However, product modularity (PM) does not contribute significantly to the prediction of
OSR. A closer look at the measurement items of process modularity (PRM) and dynamic
teaming (DT) reveal that these items are very closely associated with the shop floor and
manufacturing / operations aspects of the overall responsiveness. Thus they have been
found to be positively related to operations system responsiveness (OSR). Also product
modularity (PM) is theoretically a strong candidate to contribute to the responsiveness of
organizations, as these organizations can quickly make a variety of products from
numerous modules. However, the results here do not support this fact. A plausible
explanation is that product modularity affects the ‘assembly responsiveness’ dimension
of supply chain responsiveness. This dimension has not been considered in this research
and shall be interesting to study in future research. In addition, another convincing
explanation to this effect is that product modularity directly impacts the postponement of
manufacturing, which in turn affects supply chain responsiveness. This relationship shall
be interesting to test in future studies.
Table 7.1.1.7 Dimension Level Stepwise Regression Results
Model Summary for MBMP Dimensions on LPR
Step R R2 R
2adj ∆ R
2 F chg p df 1 df 2
1. DT 0.286 0.082 0.079 0.082 26.006 < 0.001 1 292
2. PRM 0.312 0.097 0.091 0.016 5.029 < 0.05 1 291
144

8/13/2019 Competitive_advantage of a Firm Through Supply Chain Responsiveness and SCM Practices
http://slidepdf.com/reader/full/competitiveadvantage-of-a-firm-through-supply-chain-responsiveness-and-scm 163/294
As observed in Table 7.1.1.7 the results are not significant (R 2
adj = 0.091) to draw
conclusions with regards to logistics process responsiveness (LPR). It is desired that R 2adj
be at least 0.10 (i.e. the given IV/s explain at least 10% of the variance in DV) so as to
draw any substantial inferences. It is thus evident that none of the dimensions of MBMP
predict LPR. A convincing explanation for this result is that product modularity, process
modularity, and dynamic teaming are more manufacturing and product related and within
the firm. Outbound logistics is post manufacturing and outside the firm (given the fact
that most logistics activities of transportation, distribution, and warehousing are carried
out by third parties proficient in doing so). Thus the logistics process responsiveness is
not being affected by either of product modularity, process modularity, or dynamic
teaming practices.
Table 7.1.1.8 Dimension Level Stepwise Regression Results
Model Summary for MBMP Dimensions on SNR
Step R R2 R
2adj ∆ R
2 F chg p df 1 df 2
1. PRM 0.313 0.098 0.095 0.098 31.603 < 0.001 1 292
2. DT 0.345 0.119 0.113 0.021 6.956 < 0.01 1 291
Table 7.1.1.9 Coefficients for MBMP Dimensions (PRM and DT) on SNR
B β t p
PRM 0.174 0.219 3.342 0.001
DT 0.141 0.173 2.637 0.009
145
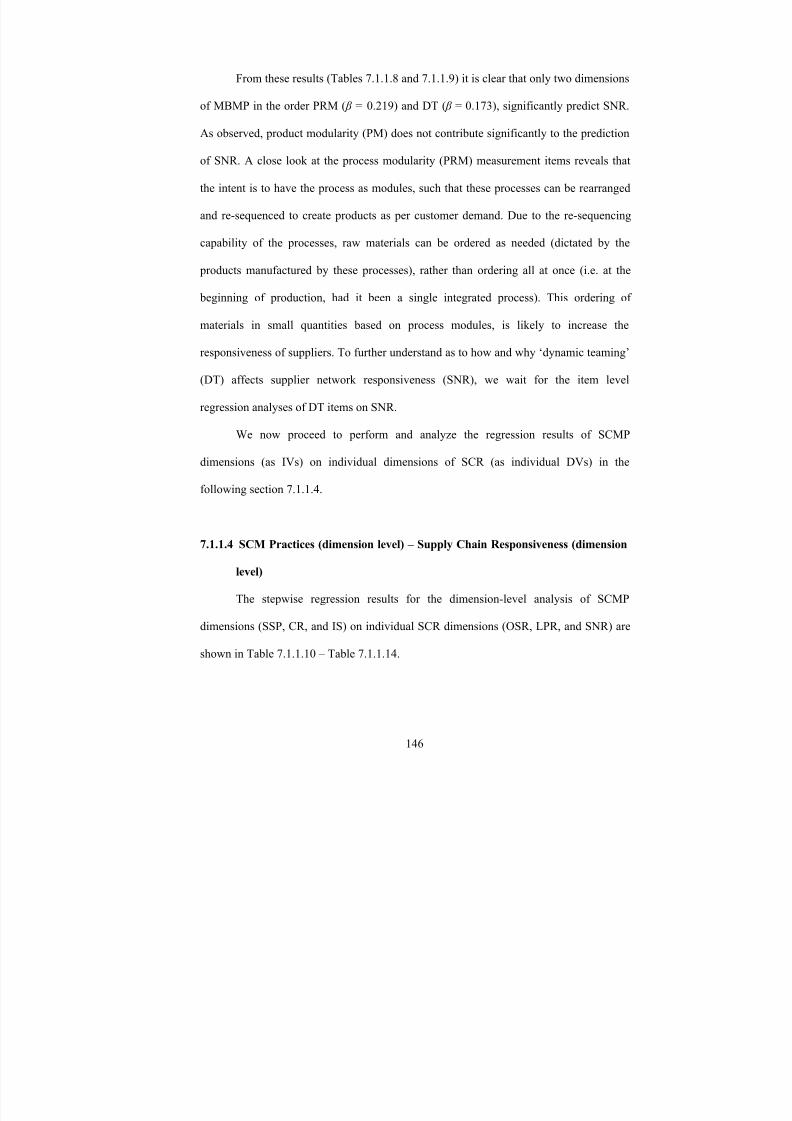
8/13/2019 Competitive_advantage of a Firm Through Supply Chain Responsiveness and SCM Practices
http://slidepdf.com/reader/full/competitiveadvantage-of-a-firm-through-supply-chain-responsiveness-and-scm 164/294
From these results (Tables 7.1.1.8 and 7.1.1.9) it is clear that only two dimensions
of MBMP in the order PRM ( β = 0.219) and DT ( β = 0.173), significantly predict SNR.
As observed, product modularity (PM) does not contribute significantly to the prediction
of SNR. A close look at the process modularity (PRM) measurement items reveals that
the intent is to have the process as modules, such that these processes can be rearranged
and re-sequenced to create products as per customer demand. Due to the re-sequencing
capability of the processes, raw materials can be ordered as needed (dictated by the
products manufactured by these processes), rather than ordering all at once (i.e. at the
beginning of production, had it been a single integrated process). This ordering of
materials in small quantities based on process modules, is likely to increase the
responsiveness of suppliers. To further understand as to how and why ‘dynamic teaming’
(DT) affects supplier network responsiveness (SNR), we wait for the item level
regression analyses of DT items on SNR.
We now proceed to perform and analyze the regression results of SCMP
dimensions (as IVs) on individual dimensions of SCR (as individual DVs) in the
following section 7.1.1.4.
7.1.1.4 SCM Practices (dimension level) – Supply Chain Responsiveness (dimension
level)
The stepwise regression results for the dimension-level analysis of SCMP
dimensions (SSP, CR, and IS) on individual SCR dimensions (OSR, LPR, and SNR) are
shown in Table 7.1.1.10 – Table 7.1.1.14.
146

8/13/2019 Competitive_advantage of a Firm Through Supply Chain Responsiveness and SCM Practices
http://slidepdf.com/reader/full/competitiveadvantage-of-a-firm-through-supply-chain-responsiveness-and-scm 165/294
Table 7.1.1.10 Dimension Level Stepwise Regression Results
Model Summary for SCMP Dimensions on OSR
Step R R2 R
2adj ∆ R
2 F chg p df 1 df 2
1. CR 0.295 0.087 0.084 0.087 27.841 < 0.001 1 292
2. SSP 0.339 0.115 0.109 0.028 9.119 < 0.01 1 291
Table 7.1.1.11 Coefficients for SCMP Dimensions (CR and SSP) on OSR
B β t p
CR 0.251 0.227 3.817 0.000SSP 0.201 0.180 3.020 0.003
From these results (Tables 7.1.1.10 and 7.1.1.11) it is clear that only two
dimensions of SCMP in the order CR ( β = 0.227) and SSP ( β = 0.180), significantly
predict OSR. However, information sharing (IS) does not contribute significantly to the
prediction of OSR. The results imply that having close customer and supplier relations
develop a better understanding between trading partners thus increasing a firm’s ability to
rapidly respond to demand changes by customer.
Table 7.1.1.12 Dimension Level Stepwise Regression Results
Model Summary for SCMP Dimensions on LPR
Step R R2 R
2adj ∆ R
2 F chg p df 1 df 2
1. IS 0.285 0.082 0.078 0.082 25.911 < 0.001 1 2922. CR 0.310 0.096 0.090 0.015 4.693 < 0.05 1 291
147
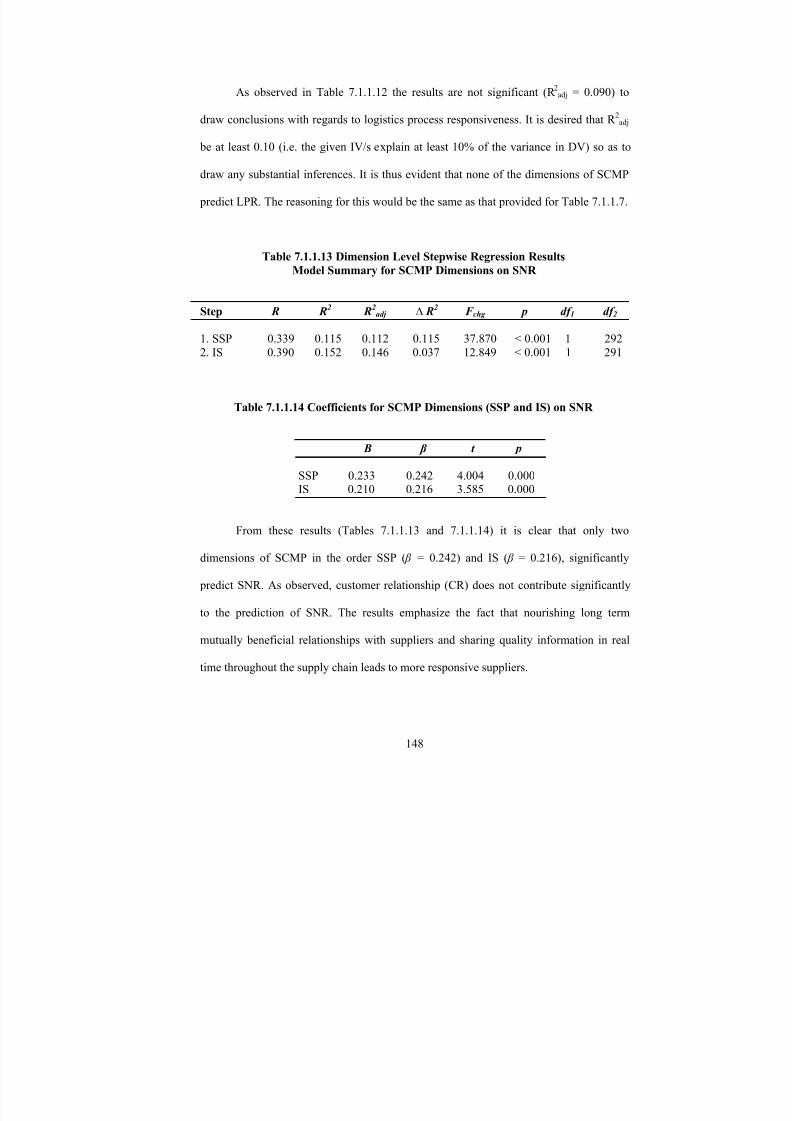
8/13/2019 Competitive_advantage of a Firm Through Supply Chain Responsiveness and SCM Practices
http://slidepdf.com/reader/full/competitiveadvantage-of-a-firm-through-supply-chain-responsiveness-and-scm 166/294
As observed in Table 7.1.1.12 the results are not significant (R 2adj = 0.090) to
draw conclusions with regards to logistics process responsiveness. It is desired that R 2adj
be at least 0.10 (i.e. the given IV/s explain at least 10% of the variance in DV) so as to
draw any substantial inferences. It is thus evident that none of the dimensions of SCMP
predict LPR. The reasoning for this would be the same as that provided for Table 7.1.1.7.
Table 7.1.1.13 Dimension Level Stepwise Regression Results
Model Summary for SCMP Dimensions on SNR
Step R R2 R
2adj ∆ R
2 F chg p df 1 df 2
1. SSP 0.339 0.115 0.112 0.115 37.870 < 0.001 1 292
2. IS 0.390 0.152 0.146 0.037 12.849 < 0.001 1 291
Table 7.1.1.14 Coefficients for SCMP Dimensions (SSP and IS) on SNR
B β t p
SSP 0.233 0.242 4.004 0.000IS 0.210 0.216 3.585 0.000
From these results (Tables 7.1.1.13 and 7.1.1.14) it is clear that only two
dimensions of SCMP in the order SSP ( β = 0.242) and IS ( β = 0.216), significantly
predict SNR. As observed, customer relationship (CR) does not contribute significantly
to the prediction of SNR. The results emphasize the fact that nourishing long term
mutually beneficial relationships with suppliers and sharing quality information in real
time throughout the supply chain leads to more responsive suppliers.
148

8/13/2019 Competitive_advantage of a Firm Through Supply Chain Responsiveness and SCM Practices
http://slidepdf.com/reader/full/competitiveadvantage-of-a-firm-through-supply-chain-responsiveness-and-scm 167/294
7.1.2 Item-Level Analysis for Supply Chain Responsiveness
We now analyze the effect of specific items (constituting the significant predictor
dimensions) on the dependent variable SCR, and further also on its significant
dimensions (OSR and SNR) to gain an insight into the specific practices that impact one
or more SCR dimensions. In this section stepwise regression analyses are performed with
all items that measure the predictors (that are significant in predicting the DV - as
depicted in the previous section 7.1.1) as IVs and the corresponding DV. This analysis is
performed one predictor dimension items at a time on the corresponding DV. The results
are tabulated and discussed in the order of significance of predictors of SCR, as evident
from the previous section 7.1.1.
7.1.2.1 MBMP (item level) – Supply Chain Responsiveness (composite score)
In section 7.1.1.1, DT is the first dimension within MBMP that reasonably
predicted SCR (summated score). To better understand the specific practices or measures
within DT that truly predict SCR, we now perform a stepwise multiple regression with
the items or measures of DT as IVs and SCR (summated score) as a DV. The stepwise
regression results are shown in Tables 7.1.2.1 and 7.1.2.2.
Table 7.1.2.1 Item-Level Stepwise Regression Results
Model Summary for DT Items on SCR
Step R R2 R
2adj ∆ R
2 F chg p df 1 df 2
1. DT3 0.438 0.192 0.189 0.192 69.220 < 0.001 1 2922. DT1 0.450 0.202 0.197 0.011 3.885 < 0.05 1 291
149

8/13/2019 Competitive_advantage of a Firm Through Supply Chain Responsiveness and SCM Practices
http://slidepdf.com/reader/full/competitiveadvantage-of-a-firm-through-supply-chain-responsiveness-and-scm 168/294
Table 7.1.2.2 Coefficients for DT Items (DT3 and DT1) on SCR
B β t p
DT3 0.219 0.329 4.324 0.000
DT1 0.090 0.150 1.971 0.05
From these results (Tables 7.1.2.1 and 7.1.2.2) it is clear that only two items of
DT in the order DT3 ( β = 0.329) and DT1 ( β = 0.150), significantly predict SCR on the
whole (i.e. summated score). As observed, the other three items measuring dynamic
teaming (viz: DT2, DT4, and DT5) do not contribute significantly to the prediction of
SCR.
In section 7.1.1.1, PRM is the second predictor within MBMP that predicts SCR
(summated score). To better understand the specific practices or measures within PRM
that truly predict SCR, we now perform a stepwise multiple regression with the items or
measures of PRM as IVs and SCR (summated score) as a DV. The stepwise regression
results are shown in Tables 7.1.2.3 and 7.1.2.4.
Table 7.1.2.3 Item-Level Stepwise Regression Results
Model Summary for PRM Items on SCR
Step R R2 R
2adj ∆ R
2 F chg p df 1 df 2
1. PRM2 0.398 0.158 0.155 0.158 54.993 < 0.001 1 292
2. PRM5 0.425 0.181 0.175 0.023 8.007 < 0.01 1 291
150
8/13/2019 Competitive_advantage of a Firm Through Supply Chain Responsiveness and SCM Practices
http://slidepdf.com/reader/full/competitiveadvantage-of-a-firm-through-supply-chain-responsiveness-and-scm 169/294
Table 7.1.2.4 Coefficients for PRM Items (PRM2 and PRM5) on SCR
B β t p
PRM2 0.182 0.294 4.566 0.000PRM5 0.105 0.182 2.830 0.005
From these results (Tables 7.1.2.3 and 7.1.2.4) it is clear that only two items of
PRM in the order PRM2 ( β = 0.294) and PRM5 ( β = 0.182), significantly predict SCR on
the whole (i.e. summated score). The other three items measuring process modularity
(viz: PRM1, PRM3, and PRM4) however, do not contribute significantly to the
prediction of SCR.
7.1.2.2 SCM Practices (item level) – Supply Chain Responsiveness (composite score)
In section 7.1.1.2 IS is the first dimension within SCMP that reasonably predicted
SCR (summated score). To better understand the specific practices or measures within IS
that truly predict SCR, we now perform a stepwise multiple regression with the items or
measures of IS as IVs and SCR (summated score) as a DV. The stepwise regression
results are shown in Tables 7.1.2.5 and 7.1.2.6.
Table 7.1.2.5 Item-Level Stepwise Regression Results
Model Summary for IS Items on SCR
Step R R2 R2adj ∆ R2 F chg p df 1 df 2
1. IS1 0.374 0.140 0.137 0.140 47.388 < 0.001 1 292
2. IS3 0.408 0.167 0.161 0.027 9.500 < 0.01 1 291
151
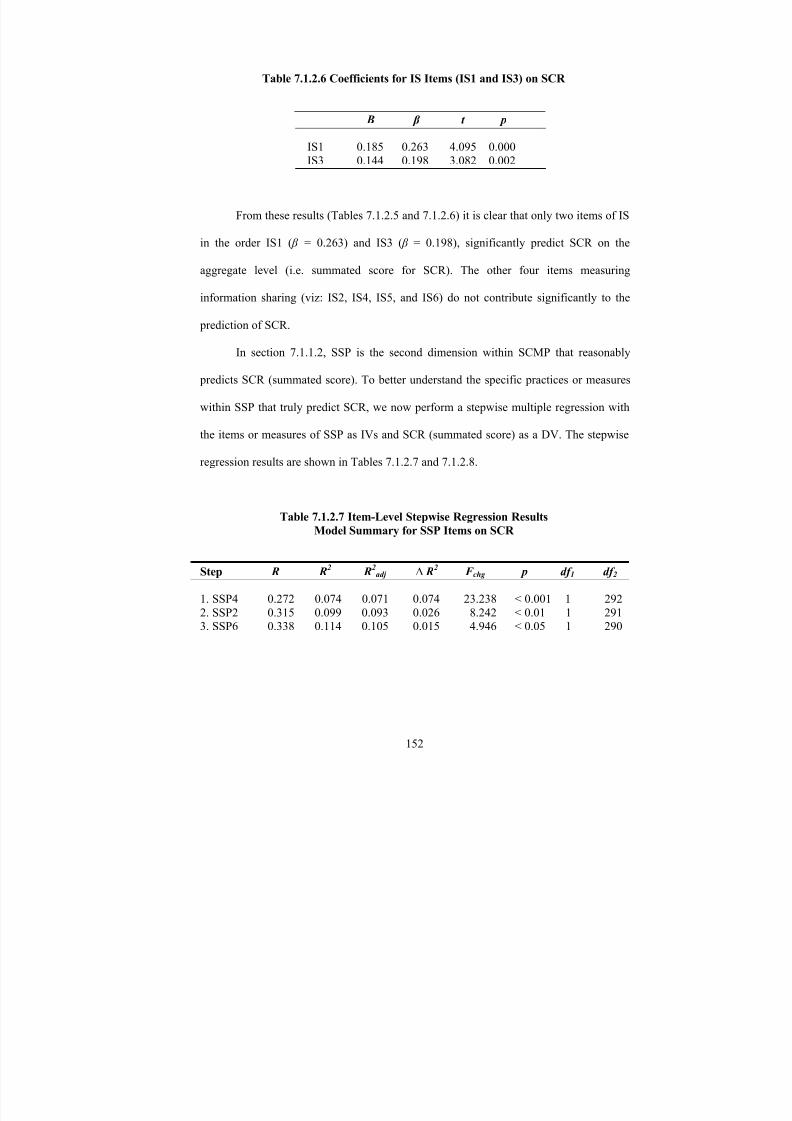
8/13/2019 Competitive_advantage of a Firm Through Supply Chain Responsiveness and SCM Practices
http://slidepdf.com/reader/full/competitiveadvantage-of-a-firm-through-supply-chain-responsiveness-and-scm 170/294
Table 7.1.2.6 Coefficients for IS Items (IS1 and IS3) on SCR
B β t p
IS1 0.185 0.263 4.095 0.000IS3 0.144 0.198 3.082 0.002
From these results (Tables 7.1.2.5 and 7.1.2.6) it is clear that only two items of IS
in the order IS1 ( β = 0.263) and IS3 ( β = 0.198), significantly predict SCR on the
aggregate level (i.e. summated score for SCR). The other four items measuring
information sharing (viz: IS2, IS4, IS5, and IS6) do not contribute significantly to the
prediction of SCR.
In section 7.1.1.2, SSP is the second dimension within SCMP that reasonably
predicts SCR (summated score). To better understand the specific practices or measures
within SSP that truly predict SCR, we now perform a stepwise multiple regression with
the items or measures of SSP as IVs and SCR (summated score) as a DV. The stepwise
regression results are shown in Tables 7.1.2.7 and 7.1.2.8.
Table 7.1.2.7 Item-Level Stepwise Regression Results
Model Summary for SSP Items on SCR
Step R R2 R
2adj ∆ R
2 F chg p df 1 df 2
1. SSP4 0.272 0.074 0.071 0.074 23.238 < 0.001 1 292
2. SSP2 0.315 0.099 0.093 0.026 8.242 < 0.01 1 2913. SSP6 0.338 0.114 0.105 0.015 4.946 < 0.05 1 290
152
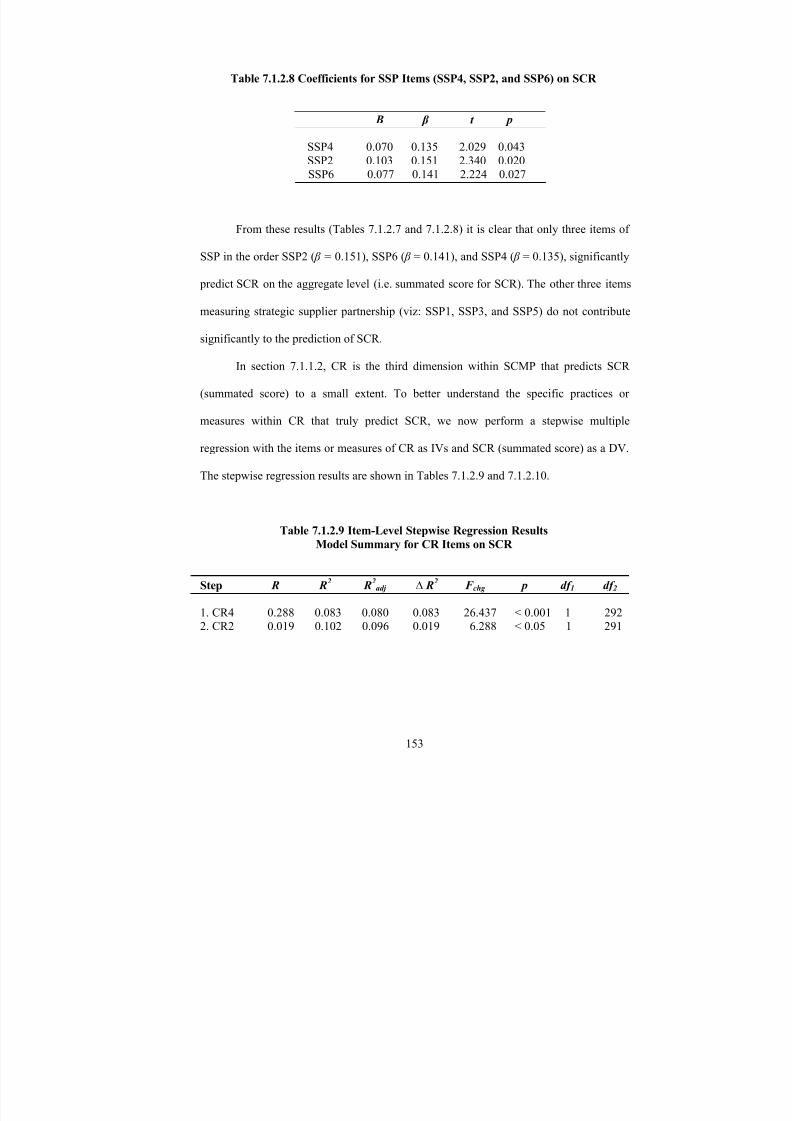
8/13/2019 Competitive_advantage of a Firm Through Supply Chain Responsiveness and SCM Practices
http://slidepdf.com/reader/full/competitiveadvantage-of-a-firm-through-supply-chain-responsiveness-and-scm 171/294

8/13/2019 Competitive_advantage of a Firm Through Supply Chain Responsiveness and SCM Practices
http://slidepdf.com/reader/full/competitiveadvantage-of-a-firm-through-supply-chain-responsiveness-and-scm 172/294
Table 7.1.2.10 Coefficients for CR Items (CR4 and CR2) on SCR
B β t p
CR4 0.150 0.225 3.697 0.000CR2 0.090 0.153 2.508 0.013
From Table 7.1.2.9 we observe that R 2adj is 0.096, which is marginally lower than
and almost equal to the cutoff (0.10) for interpretation of the regression results. We
therefore go ahead with the interpretation of the results of CR items on SCR. From these
results (Tables 7.1.2.9 and 7.1.2.10) it is clear that only two items of CR in the order CR4
( β = 0.225) and CR2 ( β = 0.153), significantly predict SCR on the aggregate level (i.e.
summated score for SCR). The other three items measuring customer relationship (viz:
CR1, CR3, and CR5) do not contribute significantly to the prediction of SCR.
Having analyzed the effects of specific items that significantly predict SCR, we
now proceed towards the item-level regression analyses on the significant dimensions of
SCR (OSR and SNR), one DV at a time. In this section stepwise regression analyses are
performed with all items that constitute the predictors - that are significant in predicting
the DV - as depicted in the previous sections 7.1.1.3 and 7.1.1.4 - as IVs and the
corresponding DV (specific significant dimension of SCR, namely OSR or SNR). This
analysis is performed one predictor dimension items at a time on the corresponding DV.
The results are tabulated and discussed in the order of significance of predictors of SCR
dimensions, as evident from the previous sections 7.1.1.3 and 7.1.1.4. The results are as
follows:
154
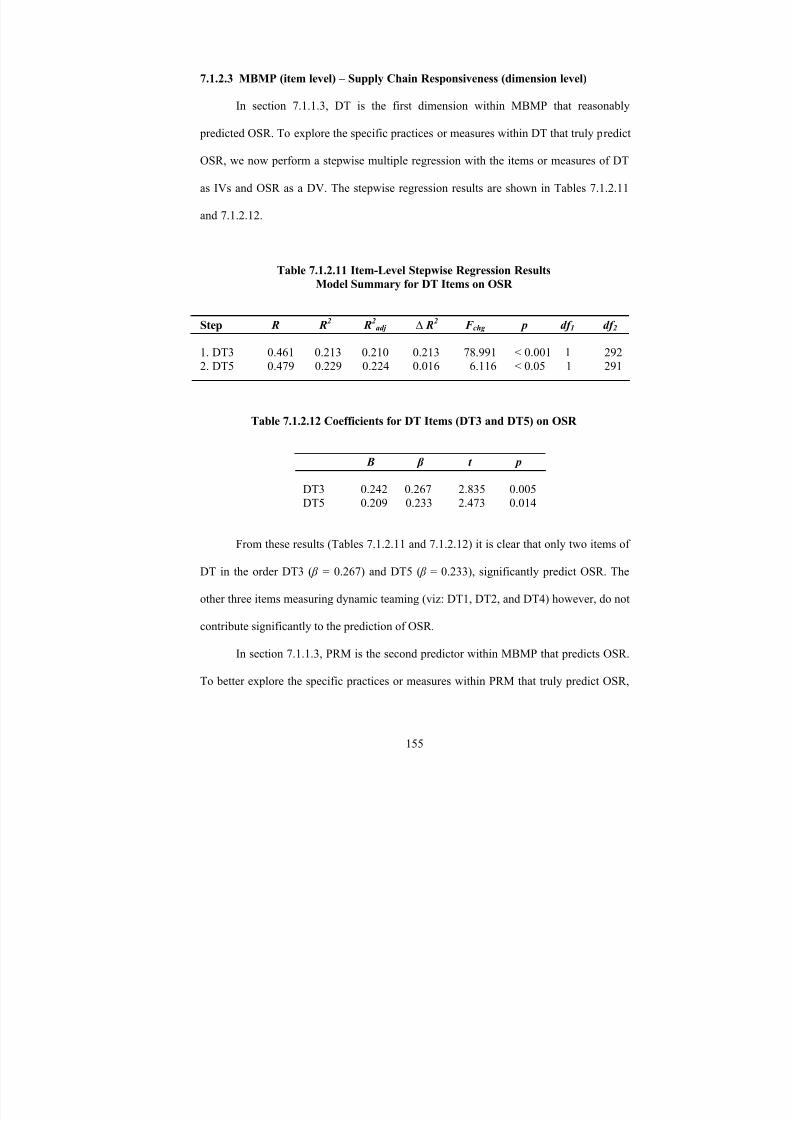
8/13/2019 Competitive_advantage of a Firm Through Supply Chain Responsiveness and SCM Practices
http://slidepdf.com/reader/full/competitiveadvantage-of-a-firm-through-supply-chain-responsiveness-and-scm 173/294
7.1.2.3 MBMP (item level) – Supply Chain Responsiveness (dimension level)
In section 7.1.1.3, DT is the first dimension within MBMP that reasonably
predicted OSR. To explore the specific practices or measures within DT that truly predict
OSR, we now perform a stepwise multiple regression with the items or measures of DT
as IVs and OSR as a DV. The stepwise regression results are shown in Tables 7.1.2.11
and 7.1.2.12.
Table 7.1.2.11 Item-Level Stepwise Regression Results
Model Summary for DT Items on OSR
Step R R2 R
2adj ∆ R
2 F chg p df 1 df 2
1. DT3 0.461 0.213 0.210 0.213 78.991 < 0.001 1 292
2. DT5 0.479 0.229 0.224 0.016 6.116 < 0.05 1 291
Table 7.1.2.12 Coefficients for DT Items (DT3 and DT5) on OSR
B β t p
DT3 0.242 0.267 2.835 0.005
DT5 0.209 0.233 2.473 0.014
From these results (Tables 7.1.2.11 and 7.1.2.12) it is clear that only two items of
DT in the order DT3 ( β = 0.267) and DT5 ( β = 0.233), significantly predict OSR. The
other three items measuring dynamic teaming (viz: DT1, DT2, and DT4) however, do not
contribute significantly to the prediction of OSR.
In section 7.1.1.3, PRM is the second predictor within MBMP that predicts OSR.
To better explore the specific practices or measures within PRM that truly predict OSR,
155
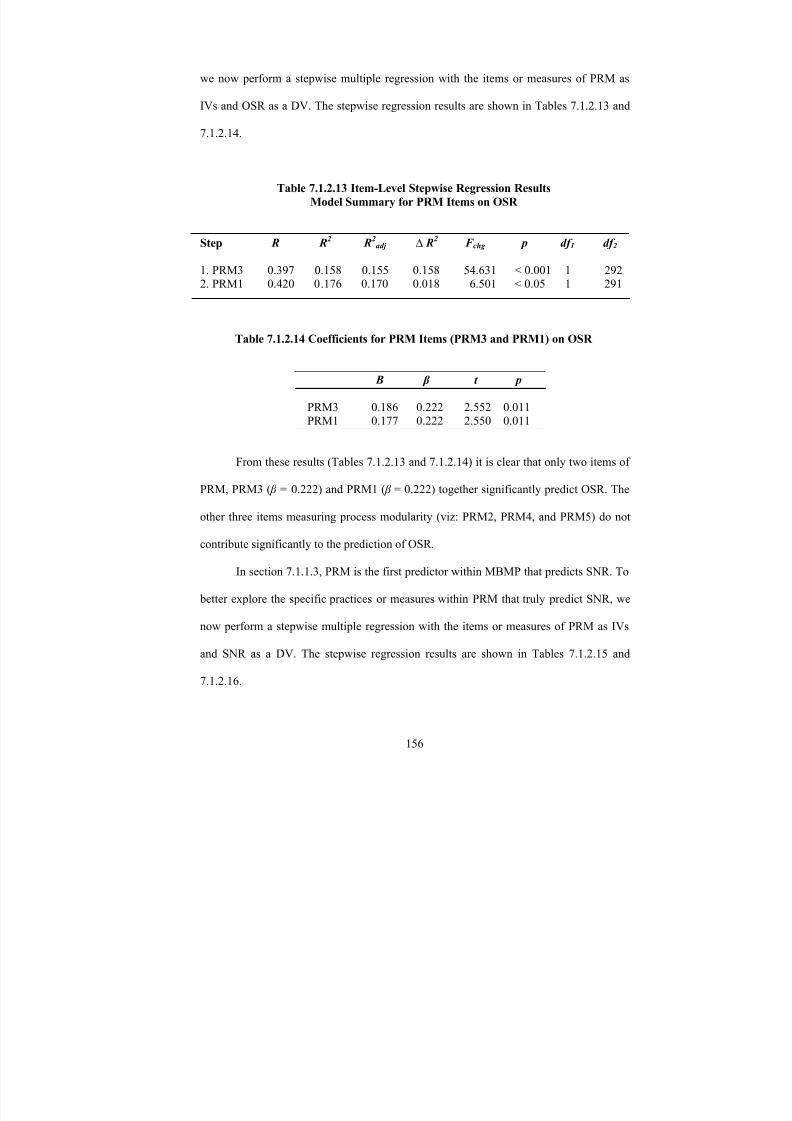
8/13/2019 Competitive_advantage of a Firm Through Supply Chain Responsiveness and SCM Practices
http://slidepdf.com/reader/full/competitiveadvantage-of-a-firm-through-supply-chain-responsiveness-and-scm 174/294
we now perform a stepwise multiple regression with the items or measures of PRM as
IVs and OSR as a DV. The stepwise regression results are shown in Tables 7.1.2.13 and
7.1.2.14.
Table 7.1.2.13 Item-Level Stepwise Regression Results
Model Summary for PRM Items on OSR
Step R R2 R
2adj ∆ R
2 F chg p df 1 df 2
1. PRM3 0.397 0.158 0.155 0.158 54.631 < 0.001 1 2922. PRM1 0.420 0.176 0.170 0.018 6.501 < 0.05 1 291
Table 7.1.2.14 Coefficients for PRM Items (PRM3 and PRM1) on OSR
B β t p
PRM3 0.186 0.222 2.552 0.011PRM1 0.177 0.222 2.550 0.011
From these results (Tables 7.1.2.13 and 7.1.2.14) it is clear that only two items of
PRM, PRM3 ( β = 0.222) and PRM1 ( β = 0.222) together significantly predict OSR. The
other three items measuring process modularity (viz: PRM2, PRM4, and PRM5) do not
contribute significantly to the prediction of OSR.
In section 7.1.1.3, PRM is the first predictor within MBMP that predicts SNR. To
better explore the specific practices or measures within PRM that truly predict SNR, we
now perform a stepwise multiple regression with the items or measures of PRM as IVs
and SNR as a DV. The stepwise regression results are shown in Tables 7.1.2.15 and
7.1.2.16.
156

8/13/2019 Competitive_advantage of a Firm Through Supply Chain Responsiveness and SCM Practices
http://slidepdf.com/reader/full/competitiveadvantage-of-a-firm-through-supply-chain-responsiveness-and-scm 175/294
Table 7.1.2.15 Item-Level Stepwise Regression Results
Model Summary for PRM Items on SNR
Step R R
2
R
2
adj ∆
R
2
F chg p df 1 df 2
1. PRM5 0.307 0.094 0.091 0.094 30.406 < 0.001 1 292
2. PRM2 0.340 0.116 0.110 0.022 7.088 < 0.01 1 291
Table 7.1.2.16 Coefficients for PRM Items (PRM5 and PRM2) on SNR
B β t p
PRM5 0.139 0.206 3.073 0.002
PRM2 0.129 0.178 2.662 0.008
From these results (Tables 7.1.2.15 and 7.1.2.16) it is clear that only two items of
PRM, in the order PRM5 ( β = 0.206) and PRM2 ( β = 0.178), significantly predict SNR.
From these results it is clear that the other three items measuring process modularity (viz:
PRM1, PRM3, and PRM4) do not contribute significantly to the prediction of SNR.
In section 7.1.1.3, DT is the second dimension within MBMP that predicted SNR.
To explore the specific practices or measures within DT that truly predict SNR, we now
perform a stepwise multiple regression with the items or measures of DT as IVs and SNR
as a DV. The stepwise regression result is shown in Table 7.1.2.17.
157
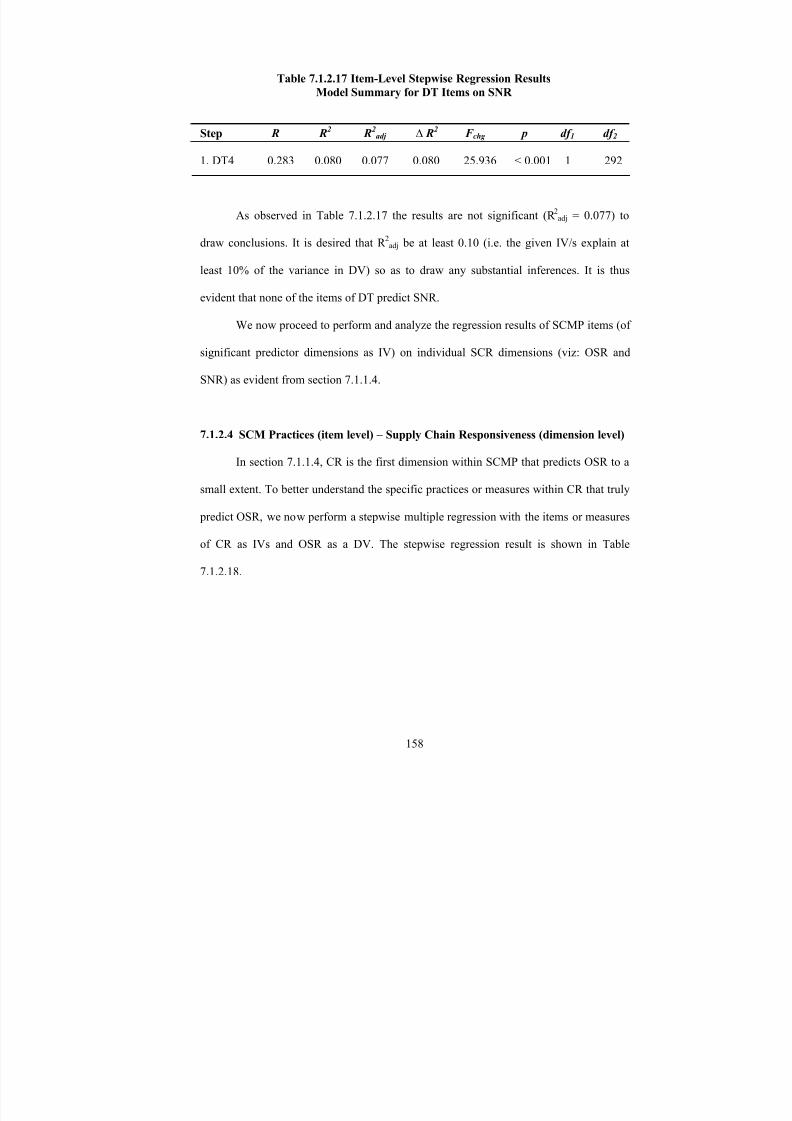
8/13/2019 Competitive_advantage of a Firm Through Supply Chain Responsiveness and SCM Practices
http://slidepdf.com/reader/full/competitiveadvantage-of-a-firm-through-supply-chain-responsiveness-and-scm 176/294
Table 7.1.2.17 Item-Level Stepwise Regression Results
Model Summary for DT Items on SNR
Step R R2 R
2adj ∆ R
2 F chg p df 1 df 2
1. DT4 0.283 0.080 0.077 0.080 25.936 < 0.001 1 292
As observed in Table 7.1.2.17 the results are not significant (R 2adj = 0.077) to
draw conclusions. It is desired that R 2adj be at least 0.10 (i.e. the given IV/s explain at
least 10% of the variance in DV) so as to draw any substantial inferences. It is thus
evident that none of the items of DT predict SNR.
We now proceed to perform and analyze the regression results of SCMP items (of
significant predictor dimensions as IV) on individual SCR dimensions (viz: OSR and
SNR) as evident from section 7.1.1.4.
7.1.2.4 SCM Practices (item level) – Supply Chain Responsiveness (dimension level)
In section 7.1.1.4, CR is the first dimension within SCMP that predicts OSR to a
small extent. To better understand the specific practices or measures within CR that truly
predict OSR, we now perform a stepwise multiple regression with the items or measures
of CR as IVs and OSR as a DV. The stepwise regression result is shown in Table
7.1.2.18.
158

8/13/2019 Competitive_advantage of a Firm Through Supply Chain Responsiveness and SCM Practices
http://slidepdf.com/reader/full/competitiveadvantage-of-a-firm-through-supply-chain-responsiveness-and-scm 177/294
Table 7.1.2.18 Item-Level Stepwise Regression Results
Model Summary for CR Items on OSR
Step R R2 R
2adj ∆ R
2 F chg p df 1 df 2
1. CR4 0.256 0.065 0.062 0.065 20.438 < 0.001 1 292
2. CR2 0.292 0.085 0.079 0.020 6.296 < 0.05 1 291
As observed in Table 7.1.2.18 the results are not significant (R 2adj = 0.079) to
draw conclusions. It is desired that R 2adj be at least 0.10 (i.e. the given IV/s explain at
least 10% of the variance in DV) so as to draw any substantial inferences. It is thus
evident that none of the items of CR predict OSR.
In section 7.1.1.4, SSP is the second dimension within SCMP that predicts OSR
to a small extent. To better understand the specific practices or measures within SSP that
truly predict OSR, we perform a stepwise multiple regression with the items or measures
of SSP as IVs and OSR as a DV. The stepwise regression result is shown in Table
7.1.2.19.
Table 7.1.2.19 Item-Level Stepwise Regression Results
Model Summary for SSP Items on OSR
Step R R2 R
2adj ∆ R
2 F chg p df 1 df 2
1. SSP4 0.217 0.047 0.044 0.047 14.404 < 0.001 1 292
2. SSP1 0.246 0.060 0.054 0.013 4.164 < 0.05 1 291
As observed in Table 7.1.2.19 the results are not significant (R 2adj = 0.054) to
draw conclusions. It is desired that R 2adj be at least 0.10 (i.e. the given IV/s explain at
159
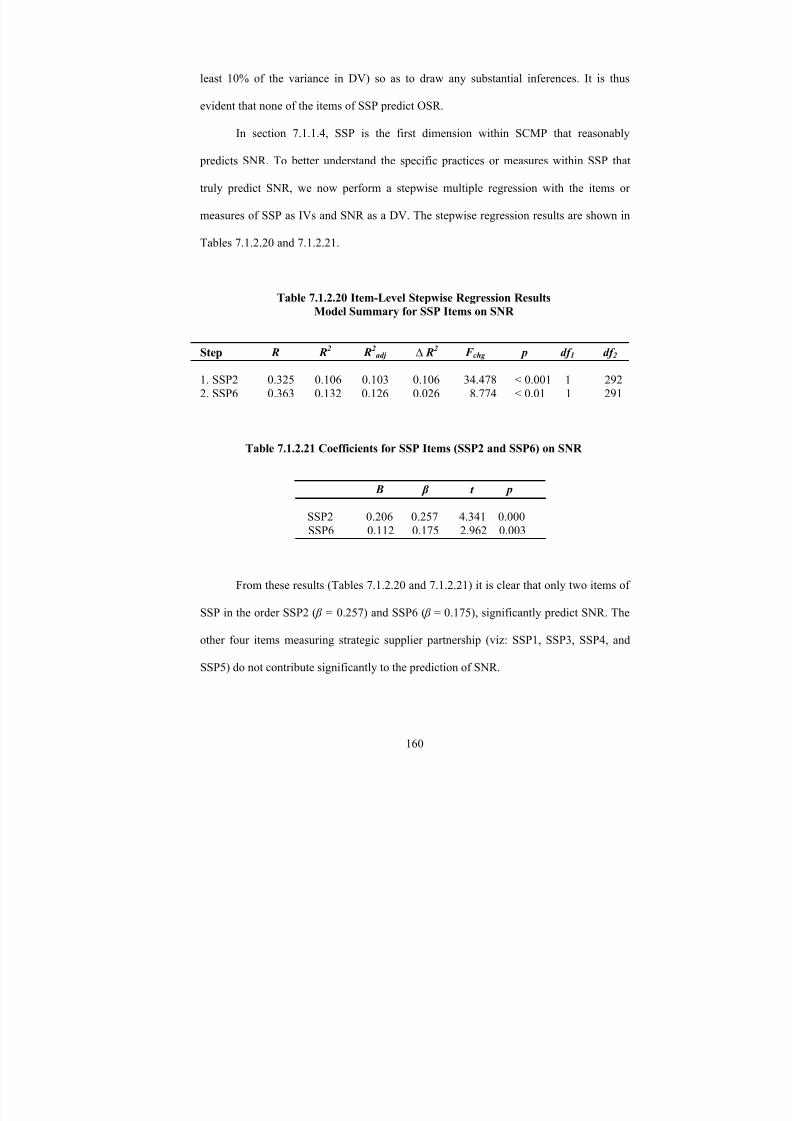
8/13/2019 Competitive_advantage of a Firm Through Supply Chain Responsiveness and SCM Practices
http://slidepdf.com/reader/full/competitiveadvantage-of-a-firm-through-supply-chain-responsiveness-and-scm 178/294
least 10% of the variance in DV) so as to draw any substantial inferences. It is thus
evident that none of the items of SSP predict OSR.
In section 7.1.1.4, SSP is the first dimension within SCMP that reasonably
predicts SNR. To better understand the specific practices or measures within SSP that
truly predict SNR, we now perform a stepwise multiple regression with the items or
measures of SSP as IVs and SNR as a DV. The stepwise regression results are shown in
Tables 7.1.2.20 and 7.1.2.21.
Table 7.1.2.20 Item-Level Stepwise Regression ResultsModel Summary for SSP Items on SNR
Step R R2 R
2adj ∆ R
2 F chg p df 1 df 2
1. SSP2 0.325 0.106 0.103 0.106 34.478 < 0.001 1 292
2. SSP6 0.363 0.132 0.126 0.026 8.774 < 0.01 1 291
Table 7.1.2.21 Coefficients for SSP Items (SSP2 and SSP6) on SNR
B β t p
SSP2 0.206 0.257 4.341 0.000
SSP6 0.112 0.175 2.962 0.003
From these results (Tables 7.1.2.20 and 7.1.2.21) it is clear that only two items of
SSP in the order SSP2 ( β = 0.257) and SSP6 ( β = 0.175), significantly predict SNR. The
other four items measuring strategic supplier partnership (viz: SSP1, SSP3, SSP4, and
SSP5) do not contribute significantly to the prediction of SNR.
160
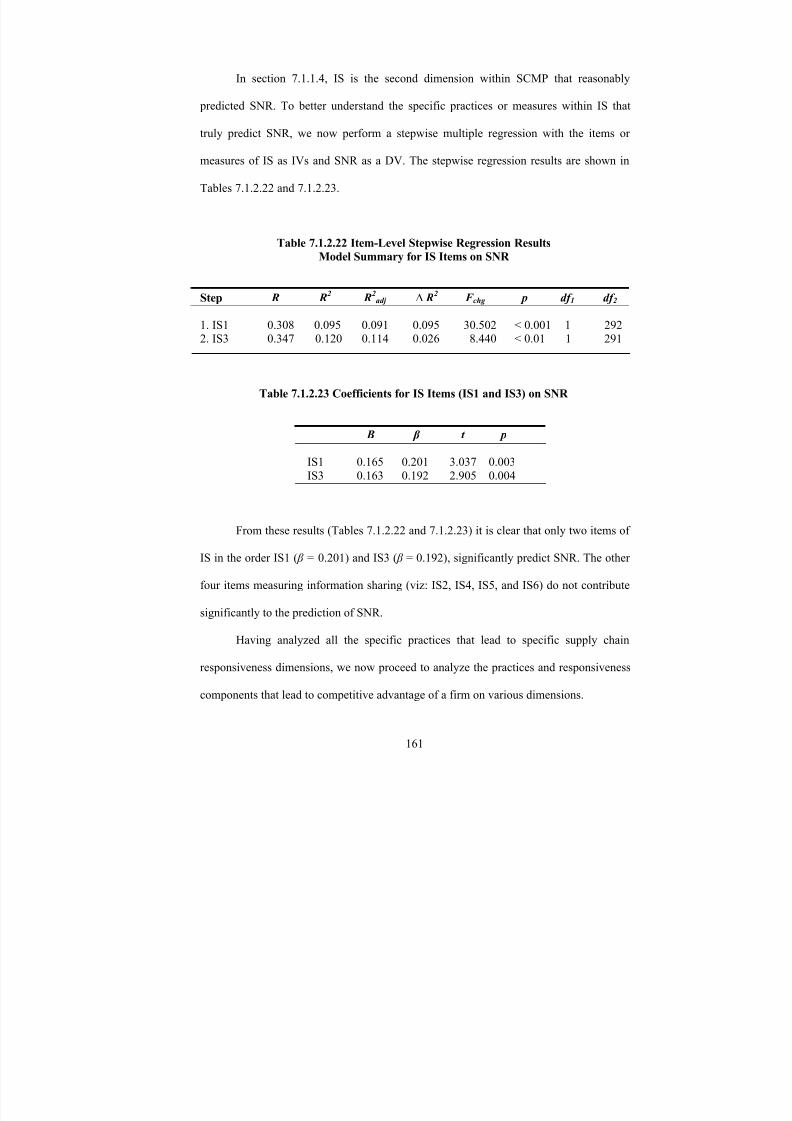
8/13/2019 Competitive_advantage of a Firm Through Supply Chain Responsiveness and SCM Practices
http://slidepdf.com/reader/full/competitiveadvantage-of-a-firm-through-supply-chain-responsiveness-and-scm 179/294
In section 7.1.1.4, IS is the second dimension within SCMP that reasonably
predicted SNR. To better understand the specific practices or measures within IS that
truly predict SNR, we now perform a stepwise multiple regression with the items or
measures of IS as IVs and SNR as a DV. The stepwise regression results are shown in
Tables 7.1.2.22 and 7.1.2.23.
Table 7.1.2.22 Item-Level Stepwise Regression Results
Model Summary for IS Items on SNR
Step R R
2
R
2
adj ∆
R
2
F chg p df 1 df 2
1. IS1 0.308 0.095 0.091 0.095 30.502 < 0.001 1 2922. IS3 0.347 0.120 0.114 0.026 8.440 < 0.01 1 291
Table 7.1.2.23 Coefficients for IS Items (IS1 and IS3) on SNR
B β t p
IS1 0.165 0.201 3.037 0.003
IS3 0.163 0.192 2.905 0.004
From these results (Tables 7.1.2.22 and 7.1.2.23) it is clear that only two items of
IS in the order IS1 ( β = 0.201) and IS3 ( β = 0.192), significantly predict SNR. The other
four items measuring information sharing (viz: IS2, IS4, IS5, and IS6) do not contribute
significantly to the prediction of SNR.
Having analyzed all the specific practices that lead to specific supply chain
responsiveness dimensions, we now proceed to analyze the practices and responsiveness
components that lead to competitive advantage of a firm on various dimensions.
161
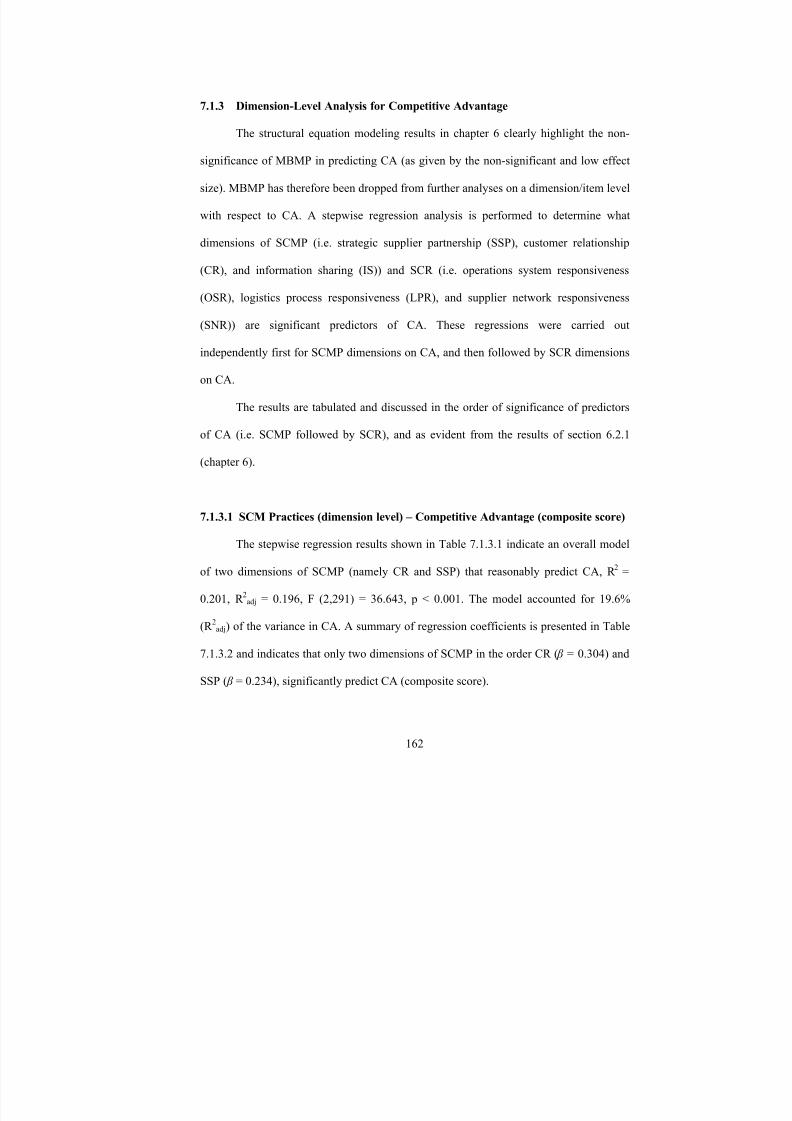
8/13/2019 Competitive_advantage of a Firm Through Supply Chain Responsiveness and SCM Practices
http://slidepdf.com/reader/full/competitiveadvantage-of-a-firm-through-supply-chain-responsiveness-and-scm 180/294
7.1.3 Dimension-Level Analysis for Competitive Advantage
The structural equation modeling results in chapter 6 clearly highlight the non-
significance of MBMP in predicting CA (as given by the non-significant and low effect
size). MBMP has therefore been dropped from further analyses on a dimension/item level
with respect to CA. A stepwise regression analysis is performed to determine what
dimensions of SCMP (i.e. strategic supplier partnership (SSP), customer relationship
(CR), and information sharing (IS)) and SCR (i.e. operations system responsiveness
(OSR), logistics process responsiveness (LPR), and supplier network responsiveness
(SNR)) are significant predictors of CA. These regressions were carried out
independently first for SCMP dimensions on CA, and then followed by SCR dimensions
on CA.
The results are tabulated and discussed in the order of significance of predictors
of CA (i.e. SCMP followed by SCR), and as evident from the results of section 6.2.1
(chapter 6).
7.1.3.1 SCM Practices (dimension level) – Competitive Advantage (composite score)
The stepwise regression results shown in Table 7.1.3.1 indicate an overall model
of two dimensions of SCMP (namely CR and SSP) that reasonably predict CA, R 2
=
0.201, R 2adj = 0.196, F (2,291) = 36.643, p < 0.001. The model accounted for 19.6%
(R 2adj) of the variance in CA. A summary of regression coefficients is presented in Table
7.1.3.2 and indicates that only two dimensions of SCMP in the order CR ( β = 0.304) and
SSP ( β = 0.234), significantly predict CA (composite score).
162
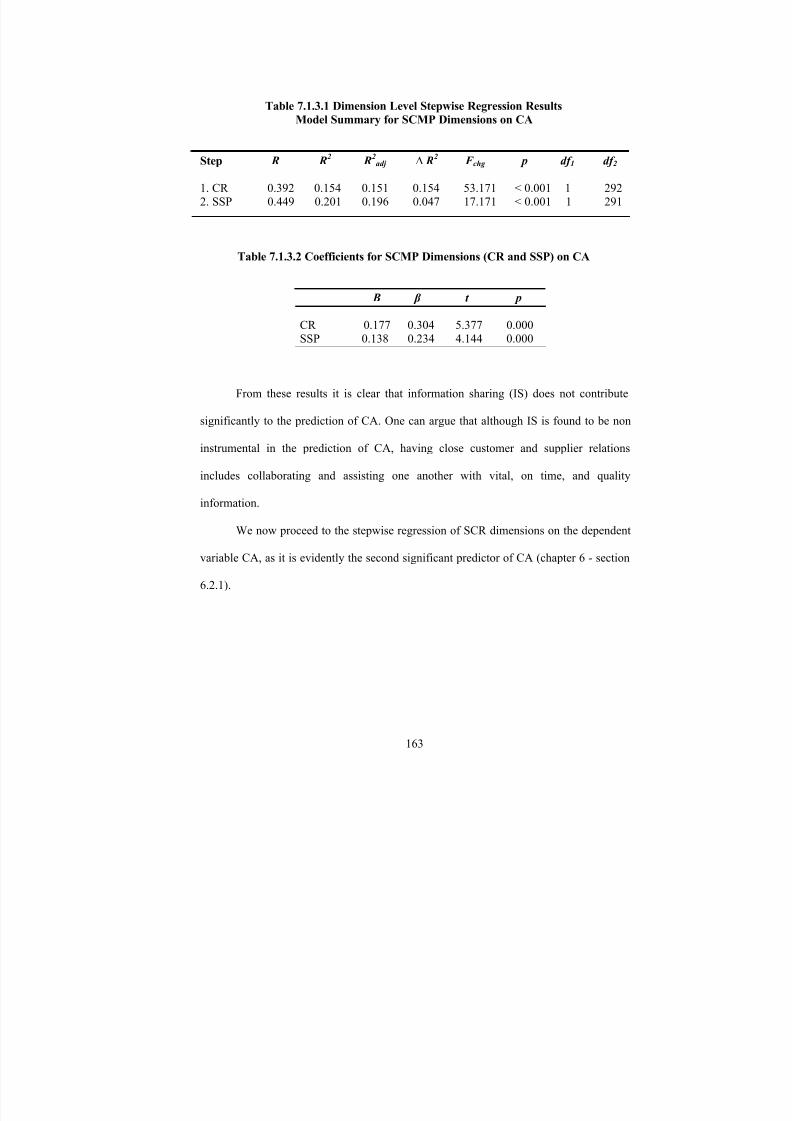
8/13/2019 Competitive_advantage of a Firm Through Supply Chain Responsiveness and SCM Practices
http://slidepdf.com/reader/full/competitiveadvantage-of-a-firm-through-supply-chain-responsiveness-and-scm 181/294
Table 7.1.3.1 Dimension Level Stepwise Regression Results
Model Summary for SCMP Dimensions on CA
Step R R2 R
2adj ∆ R
2 F chg p df 1 df 2
1. CR 0.392 0.154 0.151 0.154 53.171 < 0.001 1 2922. SSP 0.449 0.201 0.196 0.047 17.171 < 0.001 1 291
Table 7.1.3.2 Coefficients for SCMP Dimensions (CR and SSP) on CA
B β t p
CR 0.177 0.304 5.377 0.000SSP 0.138 0.234 4.144 0.000
From these results it is clear that information sharing (IS) does not contribute
significantly to the prediction of CA. One can argue that although IS is found to be non
instrumental in the prediction of CA, having close customer and supplier relations
includes collaborating and assisting one another with vital, on time, and quality
information.
We now proceed to the stepwise regression of SCR dimensions on the dependent
variable CA, as it is evidently the second significant predictor of CA (chapter 6 - section
6.2.1).
163
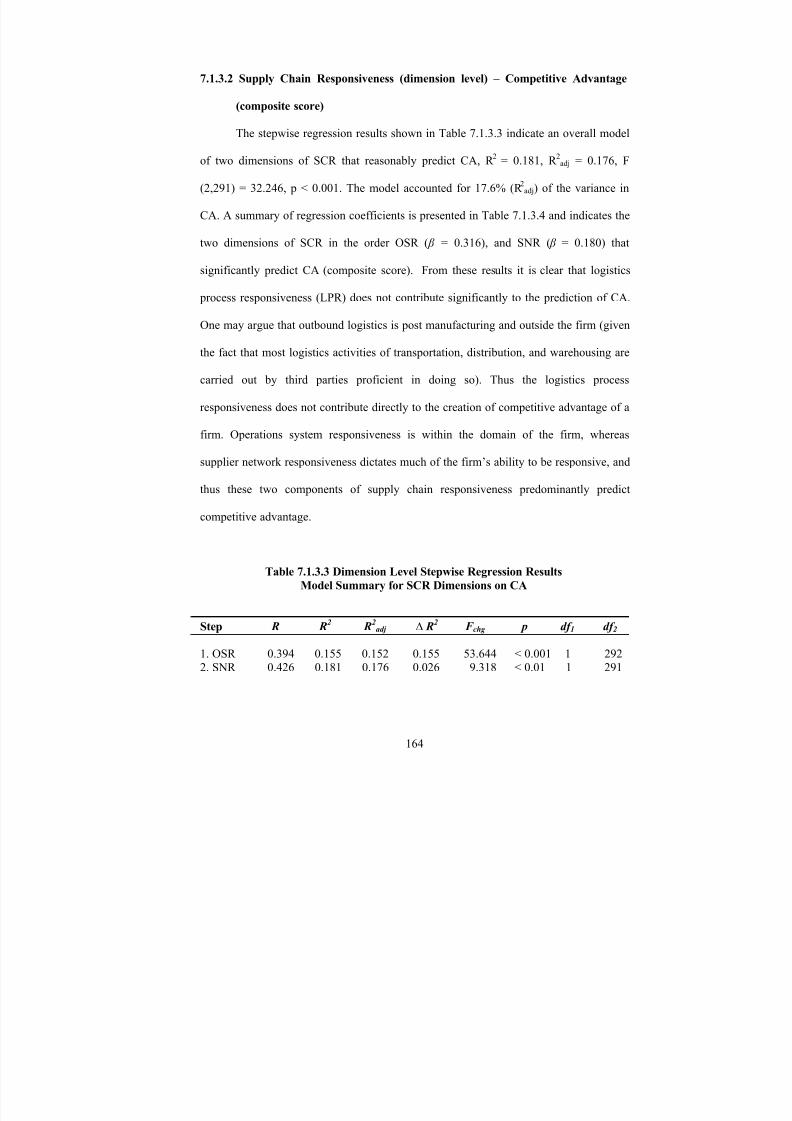
8/13/2019 Competitive_advantage of a Firm Through Supply Chain Responsiveness and SCM Practices
http://slidepdf.com/reader/full/competitiveadvantage-of-a-firm-through-supply-chain-responsiveness-and-scm 182/294
7.1.3.2 Supply Chain Responsiveness (dimension level) – Competitive Advantage
(composite score)
The stepwise regression results shown in Table 7.1.3.3 indicate an overall model
of two dimensions of SCR that reasonably predict CA, R 2
= 0.181, R 2adj = 0.176, F
(2,291) = 32.246, p < 0.001. The model accounted for 17.6% (R 2
adj) of the variance in
CA. A summary of regression coefficients is presented in Table 7.1.3.4 and indicates the
two dimensions of SCR in the order OSR ( β = 0.316), and SNR ( β = 0.180) that
significantly predict CA (composite score). From these results it is clear that logistics
process responsiveness (LPR) does not contribute significantly to the prediction of CA.
One may argue that outbound logistics is post manufacturing and outside the firm (given
the fact that most logistics activities of transportation, distribution, and warehousing are
carried out by third parties proficient in doing so). Thus the logistics process
responsiveness does not contribute directly to the creation of competitive advantage of a
firm. Operations system responsiveness is within the domain of the firm, whereas
supplier network responsiveness dictates much of the firm’s ability to be responsive, and
thus these two components of supply chain responsiveness predominantly predict
competitive advantage.
Table 7.1.3.3 Dimension Level Stepwise Regression Results
Model Summary for SCR Dimensions on CA
Step R R2 R
2adj ∆ R
2 F chg p df 1 df 2
1. OSR 0.394 0.155 0.152 0.155 53.644 < 0.001 1 2922. SNR 0.426 0.181 0.176 0.026 9.318 < 0.01 1 291
164
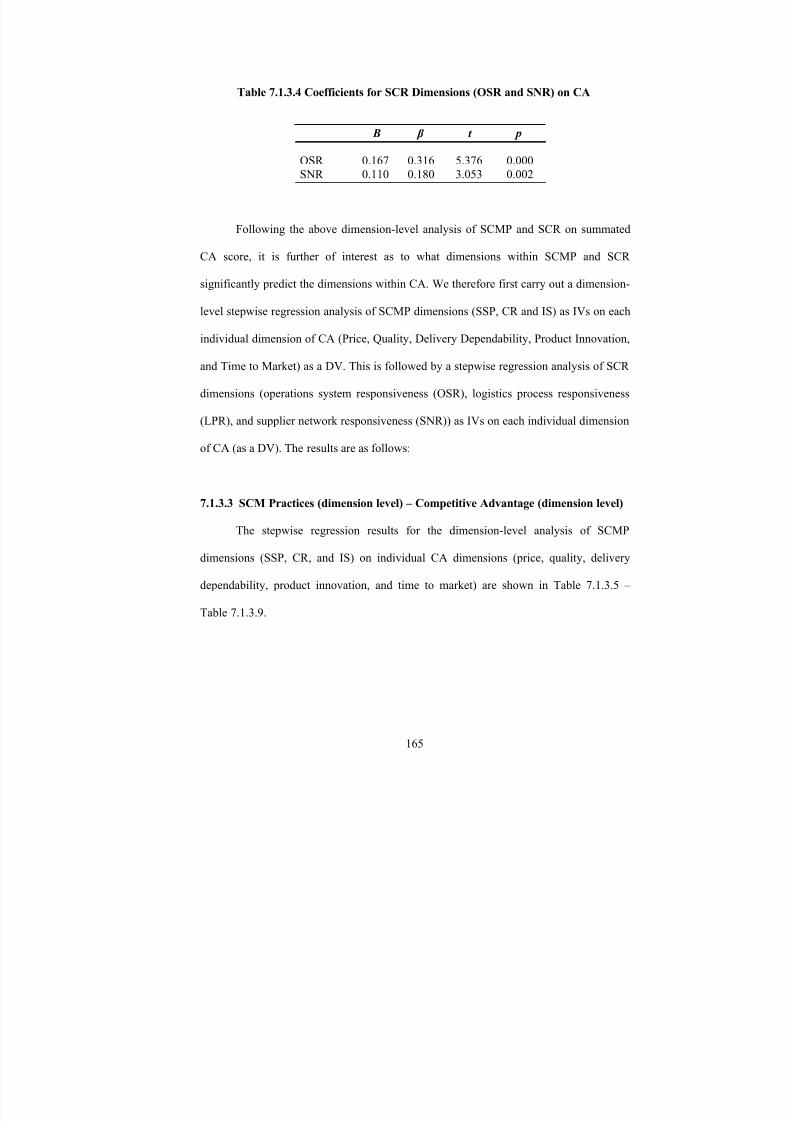
8/13/2019 Competitive_advantage of a Firm Through Supply Chain Responsiveness and SCM Practices
http://slidepdf.com/reader/full/competitiveadvantage-of-a-firm-through-supply-chain-responsiveness-and-scm 183/294
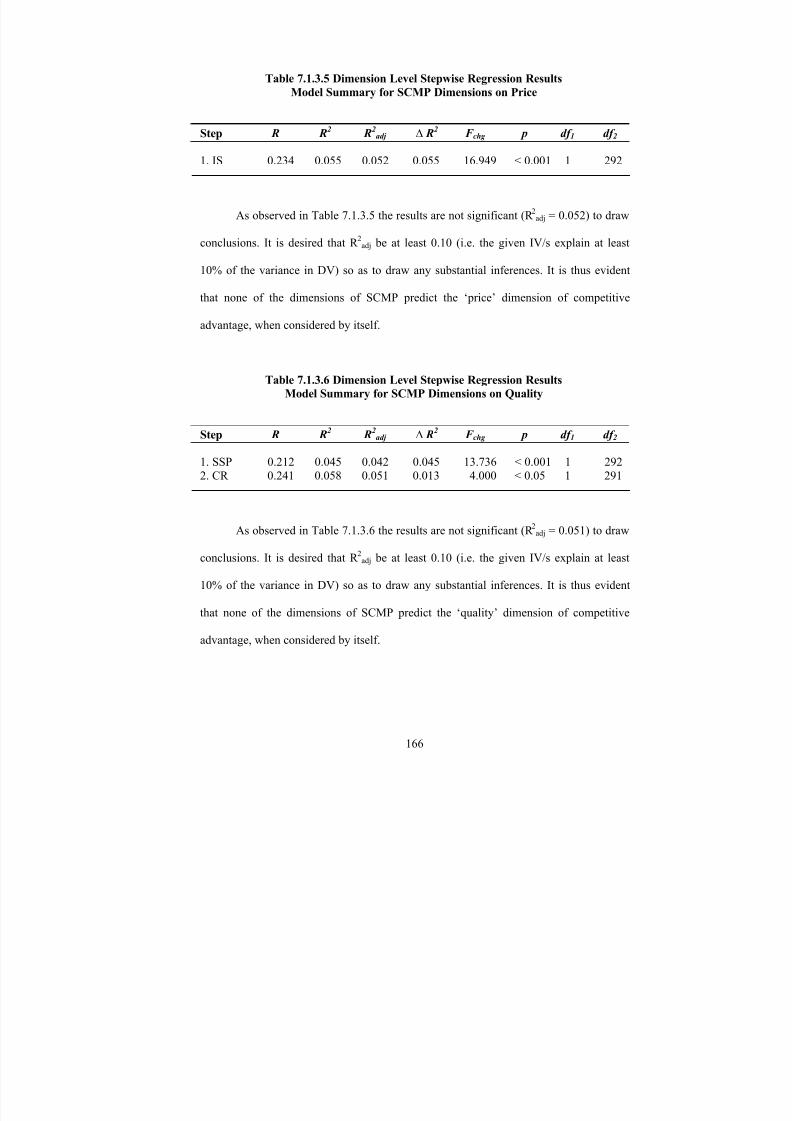
8/13/2019 Competitive_advantage of a Firm Through Supply Chain Responsiveness and SCM Practices
http://slidepdf.com/reader/full/competitiveadvantage-of-a-firm-through-supply-chain-responsiveness-and-scm 184/294
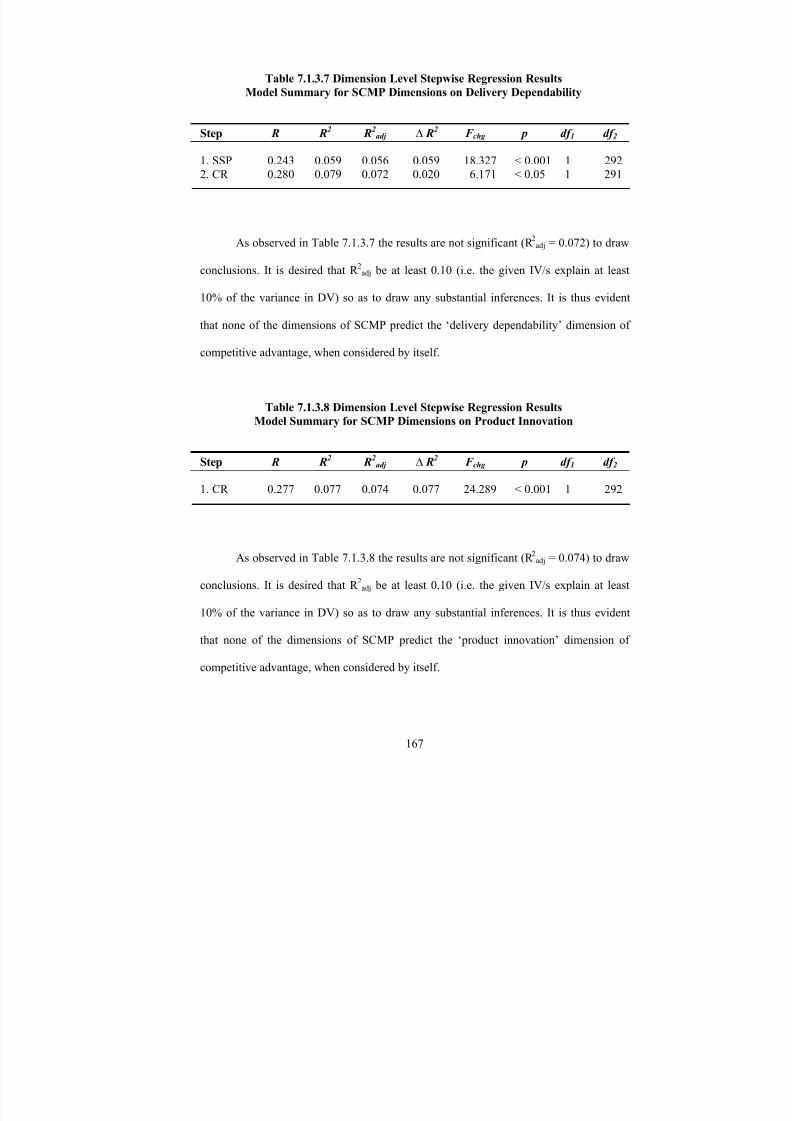
8/13/2019 Competitive_advantage of a Firm Through Supply Chain Responsiveness and SCM Practices
http://slidepdf.com/reader/full/competitiveadvantage-of-a-firm-through-supply-chain-responsiveness-and-scm 185/294
Table 7.1.3.7 Dimension Level Stepwise Regression Results
Model Summary for SCMP Dimensions on Delivery Dependability
Step R R2 R
2adj ∆ R
2 F chg p df 1 df 2
1. SSP 0.243 0.059 0.056 0.059 18.327 < 0.001 1 292
2. CR 0.280 0.079 0.072 0.020 6.171 < 0.05 1 291
As observed in Table 7.1.3.7 the results are not significant (R 2
adj = 0.072) to draw
conclusions. It is desired that R 2
adj be at least 0.10 (i.e. the given IV/s explain at least
10% of the variance in DV) so as to draw any substantial inferences. It is thus evident
that none of the dimensions of SCMP predict the ‘delivery dependability’ dimension of
competitive advantage, when considered by itself.
Table 7.1.3.8 Dimension Level Stepwise Regression Results
Model Summary for SCMP Dimensions on Product Innovation
Step R R2 R
2adj ∆ R
2 F chg p df 1 df 2
1. CR 0.277 0.077 0.074 0.077 24.289 < 0.001 1 292
As observed in Table 7.1.3.8 the results are not significant (R 2
adj = 0.074) to draw
conclusions. It is desired that R 2
adj be at least 0.10 (i.e. the given IV/s explain at least
10% of the variance in DV) so as to draw any substantial inferences. It is thus evident
that none of the dimensions of SCMP predict the ‘product innovation’ dimension of
competitive advantage, when considered by itself.
167
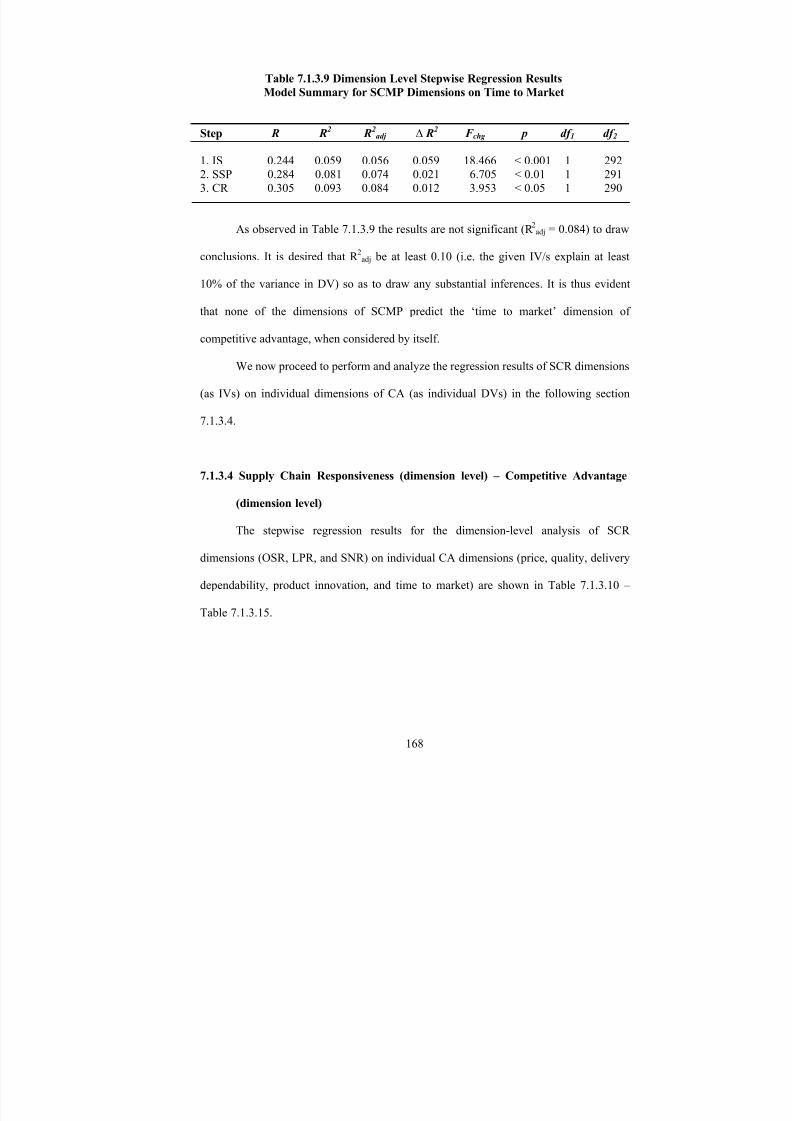
8/13/2019 Competitive_advantage of a Firm Through Supply Chain Responsiveness and SCM Practices
http://slidepdf.com/reader/full/competitiveadvantage-of-a-firm-through-supply-chain-responsiveness-and-scm 186/294
Table 7.1.3.9 Dimension Level Stepwise Regression Results
Model Summary for SCMP Dimensions on Time to Market
Step R R2 R
2adj ∆ R
2 F chg p df 1 df 2
1. IS 0.244 0.059 0.056 0.059 18.466 < 0.001 1 292
2. SSP 0.284 0.081 0.074 0.021 6.705 < 0.01 1 291
3. CR 0.305 0.093 0.084 0.012 3.953 < 0.05 1 290
As observed in Table 7.1.3.9 the results are not significant (R 2
adj = 0.084) to draw
conclusions. It is desired that R 2
adj be at least 0.10 (i.e. the given IV/s explain at least
10% of the variance in DV) so as to draw any substantial inferences. It is thus evident
that none of the dimensions of SCMP predict the ‘time to market’ dimension of
competitive advantage, when considered by itself.
We now proceed to perform and analyze the regression results of SCR dimensions
(as IVs) on individual dimensions of CA (as individual DVs) in the following section
7.1.3.4.
7.1.3.4 Supply Chain Responsiveness (dimension level) – Competitive Advantage
(dimension level)
The stepwise regression results for the dimension-level analysis of SCR
dimensions (OSR, LPR, and SNR) on individual CA dimensions (price, quality, delivery
dependability, product innovation, and time to market) are shown in Table 7.1.3.10 –
Table 7.1.3.15.
168

8/13/2019 Competitive_advantage of a Firm Through Supply Chain Responsiveness and SCM Practices
http://slidepdf.com/reader/full/competitiveadvantage-of-a-firm-through-supply-chain-responsiveness-and-scm 187/294
Table 7.1.3.10 Dimension Level Stepwise Regression Results
Model Summary for SCR Dimensions on Price
Step R R2 R
2adj ∆ R
2 F chg p df 1 df 2
1. OSR 0.215 0.046 0.043 0.046 14.218 < 0.001 1 292
As observed in Table 7.1.3.10 the results are not significant (R 2adj = 0.043) to
draw conclusions. It is desired that R 2adj be at least 0.10 (i.e. the given IV/s explain at
least 10% of the variance in DV) so as to draw any substantial inferences. It is thus
evident that none of the dimensions of SCR predict the ‘price’ dimension of competitive
advantage, when considered by itself.
Table 7.1.3.11 Dimension Level Stepwise Regression Results
Model Summary for SCR Dimensions on Quality
Step R R2 R
2
adj ∆ R
2 F
chg p df
1df
2
1. LPR 0.192 0.037 0.034 0.037 11.161 < 0.001 1 292
As observed in Table 7.1.3.11 the results are not significant (R 2adj = 0.034) to
draw conclusions. It is desired that R 2adj be at least 0.10 (i.e. the given IV/s explain at
least 10% of the variance in DV) so as to draw any substantial inferences. It is thus
evident that none of the dimensions of SCR predict the ‘quality’ dimension of
competitive advantage, when considered by itself.
169

8/13/2019 Competitive_advantage of a Firm Through Supply Chain Responsiveness and SCM Practices
http://slidepdf.com/reader/full/competitiveadvantage-of-a-firm-through-supply-chain-responsiveness-and-scm 188/294
Table 7.1.3.12 Dimension Level Stepwise Regression Results
Model Summary for SCR Dimensions on Delivery Dependability
Step R R2 R
2adj ∆ R
2 F chg p df 1 df 2
1. SNR 0.320 0.102 0.099 0.102 33.230 < 0.001 1 292
2. OSR 0.364 0.132 0.126 0.030 10.069 < 0.01 1 291
Table 7.1.3.13 Coefficients for SCR Dimensions (SNR and OSR)
on Delivery Dependability
B β t p
SNR 0.235 0.237 3.905 0.000OSR 0.164 0.192 3.173 0.002
From these results (Tables 7.1.3.12 and 7.1.3.13) it is clear that only two
dimensions of SCR in the order SNR ( β = 0.237) and OSR ( β = 0.192), significantly
predict ‘delivery dependability’. However surprisingly, logistics process responsiveness
(LPR) does not contribute significantly to the prediction of ‘delivery dependability’. A
plausible explanation to this is that, logistics process responsiveness is outside of the
focal firm and a characteristic of the logistic provider. Thus LPR is not in direct control
of the organization per se. However OSR is a characteristic within the organization. Also
SNR has been found to be crucial to delivery dependability because, in order to address
changes in customer demand in a timely manner by a firm, much relies on its suppliers’
ability to address changes in its demand in a timely manner.
170
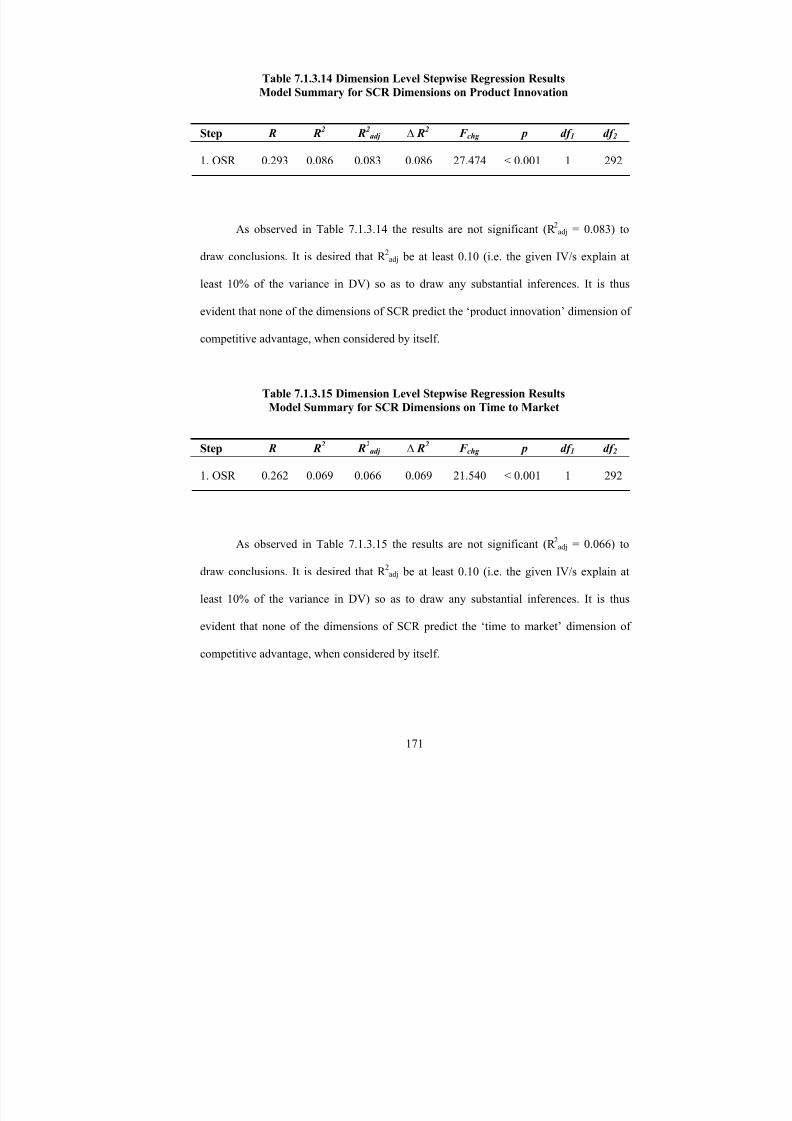
8/13/2019 Competitive_advantage of a Firm Through Supply Chain Responsiveness and SCM Practices
http://slidepdf.com/reader/full/competitiveadvantage-of-a-firm-through-supply-chain-responsiveness-and-scm 189/294
Table 7.1.3.14 Dimension Level Stepwise Regression Results
Model Summary for SCR Dimensions on Product Innovation
Step R R2 R
2adj ∆ R
2 F chg p df 1 df 2
1. OSR 0.293 0.086 0.083 0.086 27.474 < 0.001 1 292
As observed in Table 7.1.3.14 the results are not significant (R 2adj = 0.083) to
draw conclusions. It is desired that R 2adj be at least 0.10 (i.e. the given IV/s explain at
least 10% of the variance in DV) so as to draw any substantial inferences. It is thus
evident that none of the dimensions of SCR predict the ‘product innovation’ dimension of
competitive advantage, when considered by itself.
Table 7.1.3.15 Dimension Level Stepwise Regression Results
Model Summary for SCR Dimensions on Time to Market
Step R R2 R
2
adj ∆ R
2 F
chg p df
1df
2
1. OSR 0.262 0.069 0.066 0.069 21.540 < 0.001 1 292
As observed in Table 7.1.3.15 the results are not significant (R 2adj = 0.066) to
draw conclusions. It is desired that R 2adj be at least 0.10 (i.e. the given IV/s explain at
least 10% of the variance in DV) so as to draw any substantial inferences. It is thus
evident that none of the dimensions of SCR predict the ‘time to market’ dimension of
competitive advantage, when considered by itself.
171

8/13/2019 Competitive_advantage of a Firm Through Supply Chain Responsiveness and SCM Practices
http://slidepdf.com/reader/full/competitiveadvantage-of-a-firm-through-supply-chain-responsiveness-and-scm 190/294
7.1.4 Item-Level Analysis for Competitive Advantage
We now analyze the effect of specific items (constituting the significant predictor
dimensions) on the dependent variable CA, and further also on its dimensions (price,
quality, delivery dependability, product innovation, and time to market) to understand the
specific practices and responsiveness criteria that improve the competitive advantage of a
firm on various dimensions. In this section stepwise regression analyses are performed
with all items that measure the predictors (that are significant in predicting the DV - as
depicted in the previous section 7.1.3) as IVs and the corresponding DV. This analysis is
performed one predictor dimension items at a time on the corresponding DV. The results
are tabulated and discussed in the order of significance of predictors of CA, as evident
from the previous section 7.1.3.
7.1.4.1 SCM Practices (item level) – Competitive Advantage (composite score)
In section 7.1.3.1, CR is the first dimension within SCMP that reasonably
predicted CA (summated score). To better understand the specific practices or measures
within CR that truly predict CA, we now perform a stepwise multiple regression with the
items or measures of CR as IVs and CA (summated score) as a DV. The stepwise
regression results are shown in Tables 7.1.4.1 and 7.1.4.2.
172
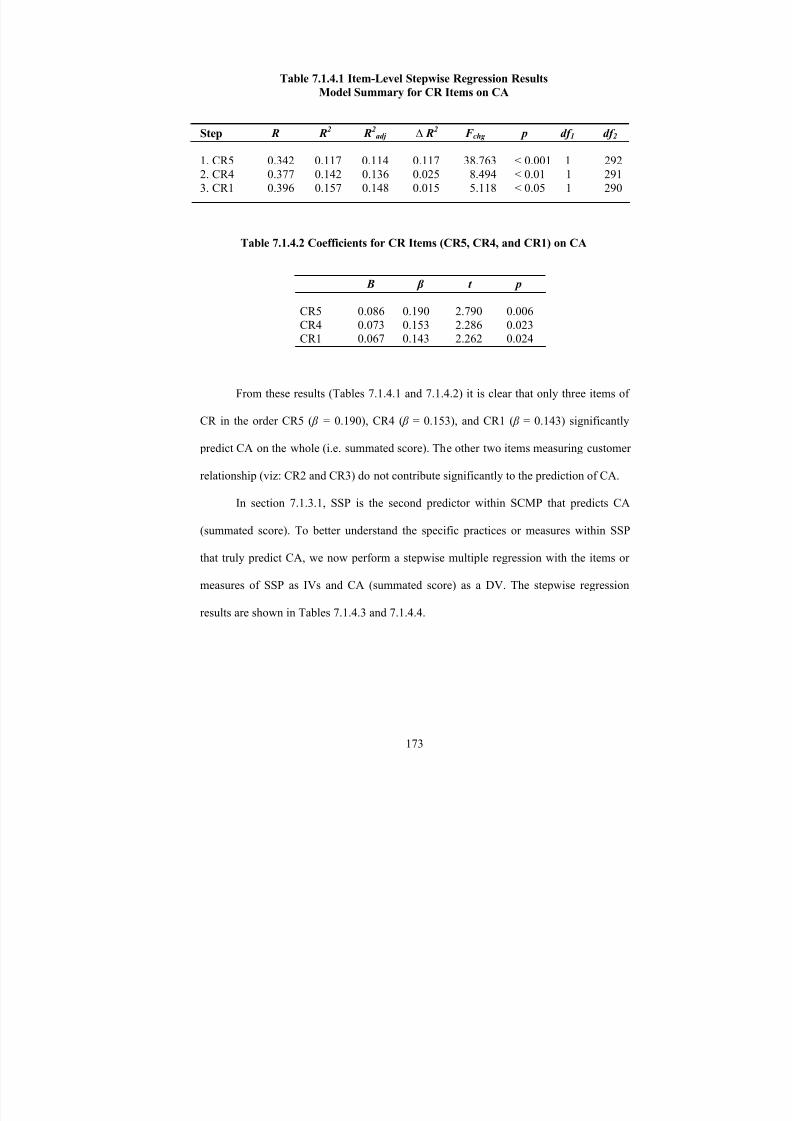
8/13/2019 Competitive_advantage of a Firm Through Supply Chain Responsiveness and SCM Practices
http://slidepdf.com/reader/full/competitiveadvantage-of-a-firm-through-supply-chain-responsiveness-and-scm 191/294
Table 7.1.4.1 Item-Level Stepwise Regression Results
Model Summary for CR Items on CA
Step R R2 R
2adj ∆ R
2 F chg p df 1 df 2
1. CR5 0.342 0.117 0.114 0.117 38.763 < 0.001 1 292
2. CR4 0.377 0.142 0.136 0.025 8.494 < 0.01 1 291
3. CR1 0.396 0.157 0.148 0.015 5.118 < 0.05 1 290
Table 7.1.4.2 Coefficients for CR Items (CR5, CR4, and CR1) on CA
B β t p
CR5 0.086 0.190 2.790 0.006
CR4 0.073 0.153 2.286 0.023CR1 0.067 0.143 2.262 0.024
From these results (Tables 7.1.4.1 and 7.1.4.2) it is clear that only three items of
CR in the order CR5 ( β = 0.190), CR4 ( β = 0.153), and CR1 ( β = 0.143) significantly
predict CA on the whole (i.e. summated score). The other two items measuring customer
relationship (viz: CR2 and CR3) do not contribute significantly to the prediction of CA.
In section 7.1.3.1, SSP is the second predictor within SCMP that predicts CA
(summated score). To better understand the specific practices or measures within SSP
that truly predict CA, we now perform a stepwise multiple regression with the items or
measures of SSP as IVs and CA (summated score) as a DV. The stepwise regression
results are shown in Tables 7.1.4.3 and 7.1.4.4.
173

8/13/2019 Competitive_advantage of a Firm Through Supply Chain Responsiveness and SCM Practices
http://slidepdf.com/reader/full/competitiveadvantage-of-a-firm-through-supply-chain-responsiveness-and-scm 192/294
Table 7.1.4.3 Item-Level Stepwise Regression Results
Model Summary for SSP Items on CA
Step R R2 R
2adj ∆ R
2 F chg p df 1 df 2
1. SSP2 0.300 0.090 0.087 0.090 28.856 < 0.001 1 292
2. SSP4 0.342 0.117 0.111 0.027 8.921 < 0.01 1 291
Table 7.1.4.4 Coefficients for SSP Items (SSP2 and SSP4) on CA
B β t p
SSP2 0.104 0.211 3.369 0.001SSP4 0.070 0.187 2.987 0.003
From these results (Tables 7.1.4.3 and 7.1.4.4) it is clear that only two items of
SSP in the order SSP2 ( β = 0.211) and SSP4 ( β = 0.187), significantly predict CA on the
whole (i.e. summated score). The other four items measuring strategic supplier
partnership (viz: SSP1, SSP3, SSP5, and SSP6) do not contribute significantly to the
prediction of CA.
7.1.4.2 Supply Chain Responsiveness (item level) – Competitive Advantage
(composite score)
In section 7.1.3.2, OSR is the first dimension within SCR that reasonably
predicted CA (summated score). To better understand the specific practices or measures
within OSR that truly predict CA, we now perform a stepwise multiple regression with
the items or measures of OSR as IVs and CA (summated score) as a DV. The stepwise
regression results are shown in Tables 7.1.4.5 and 7.1.4.6.
174

8/13/2019 Competitive_advantage of a Firm Through Supply Chain Responsiveness and SCM Practices
http://slidepdf.com/reader/full/competitiveadvantage-of-a-firm-through-supply-chain-responsiveness-and-scm 193/294
Table 7.1.4.5 Item-Level Stepwise Regression Results
Model Summary for OSR Items on CA
Step R R2 R
2adj ∆ R
2 F chg p df 1 df 2
1. OSR1 0.449 0.202 0.199 0.202 73.718 < 0.001 1 292
Table 7.1.4.6 Coefficients for OSR Items (OSR1) on CA
B β t p
OSR1 0.199 0.449 8.586 0.000
From these results (Tables 7.1.4.5 and 7.1.4.6) it is clear that only one item of
OSR, OSR1 ( β = 0.449), significantly predicts CA on the aggregate level (i.e. summated
score for CA). The other four items measuring operations system responsiveness (viz:
OSR3, OSR4, OSR5, and OSR7) do not contribute significantly to the prediction of CA.
In section 7.1.3.2, SNR is the second dimension within SCR that reasonably
predicts CA (summated score). To better understand the specific practices or measures
within SNR that truly predict CA, we now perform a stepwise multiple regression with
the items or measures of SNR as IVs and CA (summated score) as a DV. The stepwise
regression results are shown in Table 7.1.4.7.
175
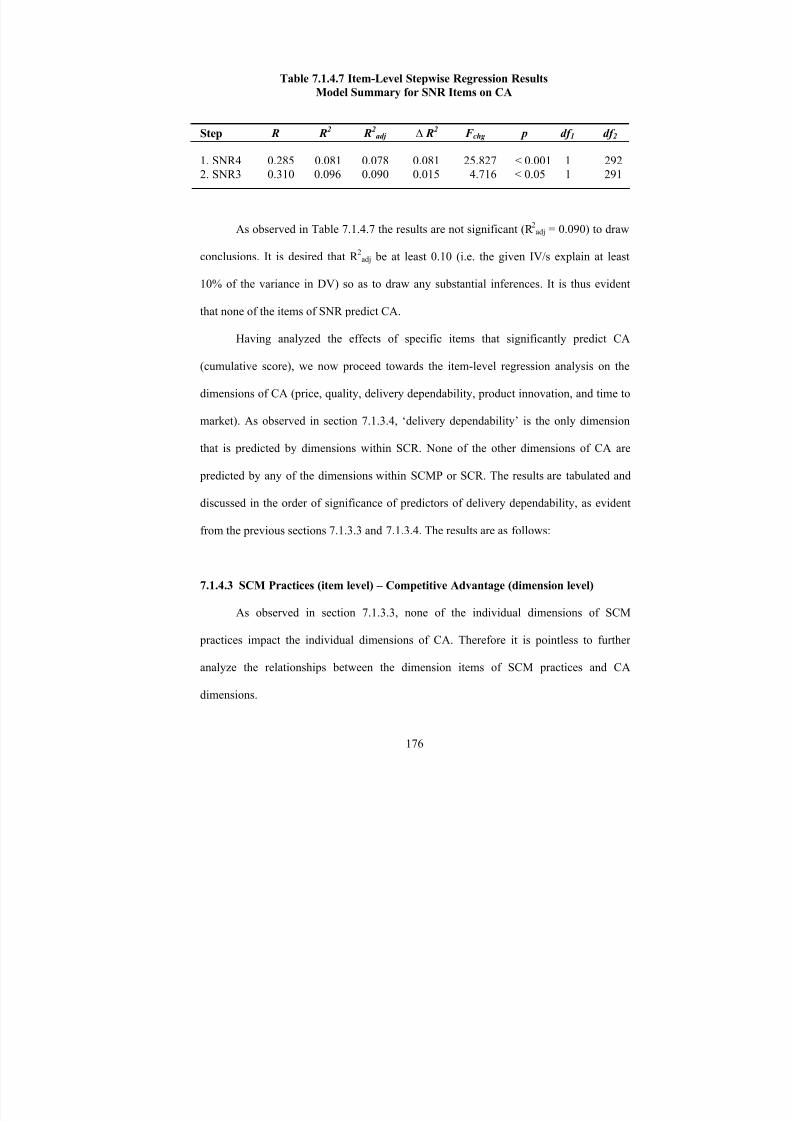
8/13/2019 Competitive_advantage of a Firm Through Supply Chain Responsiveness and SCM Practices
http://slidepdf.com/reader/full/competitiveadvantage-of-a-firm-through-supply-chain-responsiveness-and-scm 194/294
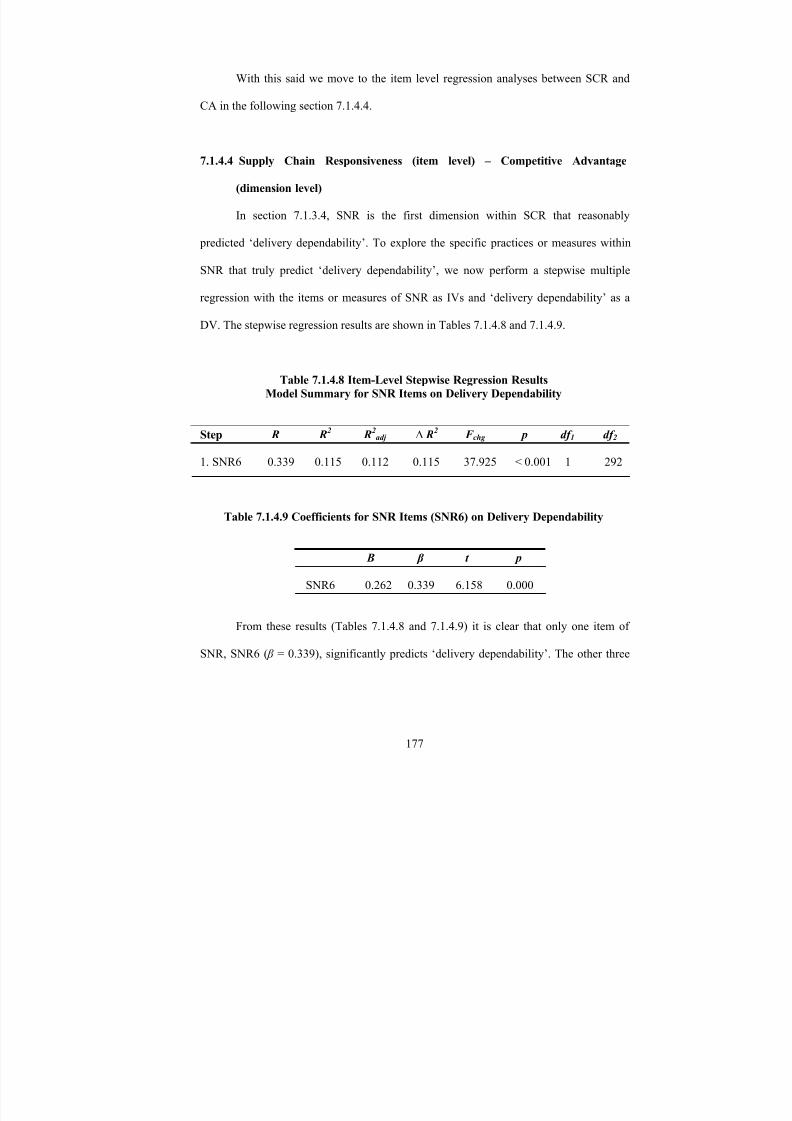
8/13/2019 Competitive_advantage of a Firm Through Supply Chain Responsiveness and SCM Practices
http://slidepdf.com/reader/full/competitiveadvantage-of-a-firm-through-supply-chain-responsiveness-and-scm 195/294
With this said we move to the item level regression analyses between SCR and
CA in the following section 7.1.4.4.
7.1.4.4 Supply Chain Responsiveness (item level) – Competitive Advantage
(dimension level)
In section 7.1.3.4, SNR is the first dimension within SCR that reasonably
predicted ‘delivery dependability’. To explore the specific practices or measures within
SNR that truly predict ‘delivery dependability’, we now perform a stepwise multiple
regression with the items or measures of SNR as IVs and ‘delivery dependability’ as a
DV. The stepwise regression results are shown in Tables 7.1.4.8 and 7.1.4.9.
Table 7.1.4.8 Item-Level Stepwise Regression Results
Model Summary for SNR Items on Delivery Dependability
Step R R2 R
2adj ∆ R
2 F chg p df 1 df 2
1. SNR6 0.339 0.115 0.112 0.115 37.925 < 0.001 1 292
Table 7.1.4.9 Coefficients for SNR Items (SNR6) on Delivery Dependability
B β t p
SNR6 0.262 0.339 6.158 0.000
From these results (Tables 7.1.4.8 and 7.1.4.9) it is clear that only one item of
SNR, SNR6 ( β = 0.339), significantly predicts ‘delivery dependability’. The other three
177
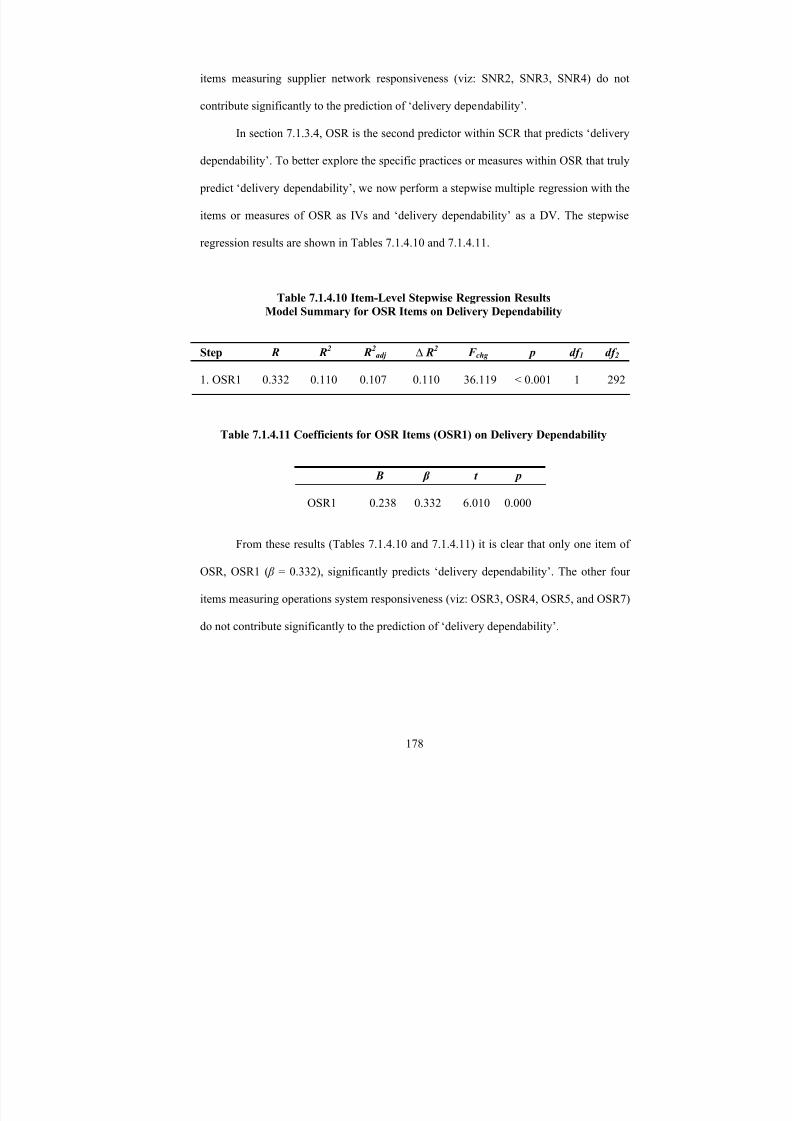
8/13/2019 Competitive_advantage of a Firm Through Supply Chain Responsiveness and SCM Practices
http://slidepdf.com/reader/full/competitiveadvantage-of-a-firm-through-supply-chain-responsiveness-and-scm 196/294
items measuring supplier network responsiveness (viz: SNR2, SNR3, SNR4) do not
contribute significantly to the prediction of ‘delivery dependability’.
In section 7.1.3.4, OSR is the second predictor within SCR that predicts ‘delivery
dependability’. To better explore the specific practices or measures within OSR that truly
predict ‘delivery dependability’, we now perform a stepwise multiple regression with the
items or measures of OSR as IVs and ‘delivery dependability’ as a DV. The stepwise
regression results are shown in Tables 7.1.4.10 and 7.1.4.11.
Table 7.1.4.10 Item-Level Stepwise Regression ResultsModel Summary for OSR Items on Delivery Dependability
Step R R2 R
2adj ∆ R
2 F chg p df 1 df 2
1. OSR1 0.332 0.110 0.107 0.110 36.119 < 0.001 1 292
Table 7.1.4.11 Coefficients for OSR Items (OSR1) on Delivery Dependability
B β t p
OSR1 0.238 0.332 6.010 0.000
From these results (Tables 7.1.4.10 and 7.1.4.11) it is clear that only one item of
OSR, OSR1 ( β = 0.332), significantly predicts ‘delivery dependability’. The other four
items measuring operations system responsiveness (viz: OSR3, OSR4, OSR5, and OSR7)
do not contribute significantly to the prediction of ‘delivery dependability’.
178
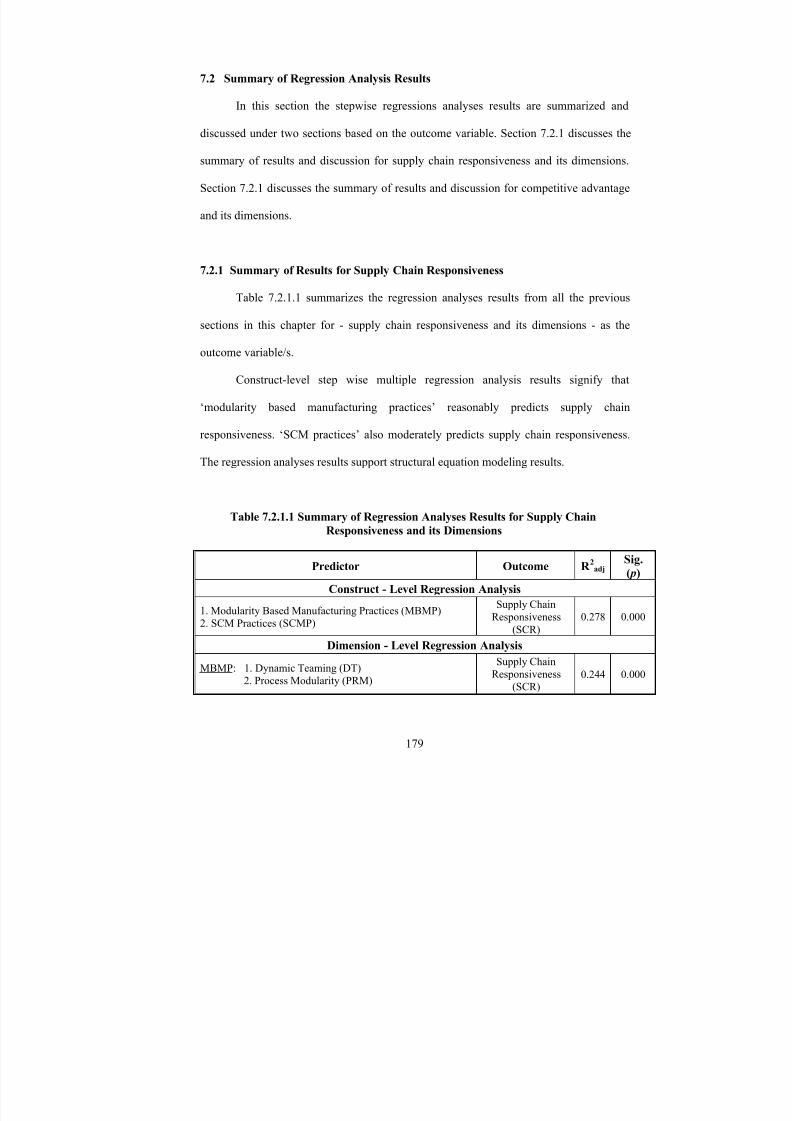
8/13/2019 Competitive_advantage of a Firm Through Supply Chain Responsiveness and SCM Practices
http://slidepdf.com/reader/full/competitiveadvantage-of-a-firm-through-supply-chain-responsiveness-and-scm 197/294
7.2 Summary of Regression Analysis Results
In this section the stepwise regressions analyses results are summarized and
discussed under two sections based on the outcome variable. Section 7.2.1 discusses the
summary of results and discussion for supply chain responsiveness and its dimensions.
Section 7.2.1 discusses the summary of results and discussion for competitive advantage
and its dimensions.
7.2.1 Summary of Results for Supply Chain Responsiveness
Table 7.2.1.1 summarizes the regression analyses results from all the previous
sections in this chapter for - supply chain responsiveness and its dimensions - as the
outcome variable/s.
Construct-level step wise multiple regression analysis results signify that
‘modularity based manufacturing practices’ reasonably predicts supply chain
responsiveness. ‘SCM practices’ also moderately predicts supply chain responsiveness.
The regression analyses results support structural equation modeling results.
Table 7.2.1.1 Summary of Regression Analyses Results for Supply Chain
Responsiveness and its Dimensions
Predictor Outcome R 2adj
Sig.
( p)
Construct - Level Regression Analysis
1. Modularity Based Manufacturing Practices (MBMP)
2. SCM Practices (SCMP)
Supply ChainResponsiveness
(SCR)
0.278 0.000
Dimension - Level Regression Analysis
MBMP: 1. Dynamic Teaming (DT)
2. Process Modularity (PRM)
Supply Chain
Responsiveness
(SCR)0.244 0.000
179

8/13/2019 Competitive_advantage of a Firm Through Supply Chain Responsiveness and SCM Practices
http://slidepdf.com/reader/full/competitiveadvantage-of-a-firm-through-supply-chain-responsiveness-and-scm 198/294

8/13/2019 Competitive_advantage of a Firm Through Supply Chain Responsiveness and SCM Practices
http://slidepdf.com/reader/full/competitiveadvantage-of-a-firm-through-supply-chain-responsiveness-and-scm 199/294

8/13/2019 Competitive_advantage of a Firm Through Supply Chain Responsiveness and SCM Practices
http://slidepdf.com/reader/full/competitiveadvantage-of-a-firm-through-supply-chain-responsiveness-and-scm 200/294
Predictor Outcome R 2adj
Sig.
( p)
IS: 1. IS1
(informing trading partners of changing needs in
advance by a firm)
2. IS3 (trading partners of a firm, keeping the firm fully
informed about issues that affect the firm’s business)
0.114 0.000
* Practically NS = Practically Not Significant (i.e. not practically significant, to draw any
substantial inferences)
These results imply that organizations can achieve higher levels of supply chain
responsiveness by having product, process and organizational modularity, as well as by
implementing the said SCM practices.
The dimension-level stepwise regression analyses signify that with regards to the
dimensions of ‘modularity based manufacturing practices’, ‘dynamic teaming’ is the
predominant practice that improves supply chain responsiveness on a composite level
(i.e. aggregate level) followed by process modularity practice. Also with regards to the
dimensions of SCM practices, information sharing is the predominant practice that
improves supply chain responsiveness on a composite basis, followed by strategic
supplier partnership and customer relationship practices. It is further observed that
dynamic teaming and process modularity in the same order are predominant in improving
operations system responsiveness dimension of supply chain responsiveness. A plausible
explanation for this result is that the specific dynamic teaming practices as well as
process modularity practices are all associated with manufacturing and production on the
shop floor, thus contributing toward increased operations system responsiveness.
Furthermore dynamic teaming and process modularity in the reverse order are
182

8/13/2019 Competitive_advantage of a Firm Through Supply Chain Responsiveness and SCM Practices
http://slidepdf.com/reader/full/competitiveadvantage-of-a-firm-through-supply-chain-responsiveness-and-scm 201/294
predominant in improving the supplier network responsiveness dimension of supply
chain responsiveness. An explanation to this result could be that process modularity gives
an organization greater flexibility in terms of sourcing various products that are needed
for various sub processes from suppliers, rather than sourcing a whole product. This
could improve the suppliers’ responsiveness to the focal firm. Thus it can be said with a
fair degree of confidence that dynamic teaming and process modularity practices are the
predominant modularity based manufacturing practice dimensions that are key to the
improvement of supply chain responsiveness as well as two of its dimensions - operations
system responsiveness and supplier network responsiveness. The regression results also
depict that product modularity does not in any way influence supply chain responsiveness
or its dimensions, and can be researched in detail in the future.
As regards SCM practice dimensions, the regression results imply that by having
close relations with customers as well as suppliers, organizations can improve its
operations system responsiveness. Further, as expected the results signify that by
developing close relations with suppliers and sharing information with supply chain
partners by an organization increases the responsiveness of the suppliers of the said firm.
Thus it can emphatically be said that strategic supplier partnership practice is the
predominant SCM practice dimension that is instrumental in the improvement of supply
chain responsiveness as well as two of its dimensions - operations system responsiveness
and supplier network responsiveness.
Surprisingly the results also highlight that none of the SCM practice or modularity
based manufacturing practice dimensions significantly affect or predict the logistics
183

8/13/2019 Competitive_advantage of a Firm Through Supply Chain Responsiveness and SCM Practices
http://slidepdf.com/reader/full/competitiveadvantage-of-a-firm-through-supply-chain-responsiveness-and-scm 202/294
process responsiveness dimension of supply chain responsiveness and gives future
researchers food for thought.
The item-level stepwise regression analyses results signify that DT3 (production
teams can be reassigned to different production tasks) and DT1 (production teams that
can be reorganized are used in our plant) are the two prime practices within dynamic
teaming (DT) that positively impact the overall supply chain responsiveness on a
composite basis. Also PRM2 (our products share common modules) and PRM5 (product
feature modules can be added to a standard base unit) are the two key practices within
process modularity (PRM) that enhance supply chain responsiveness on a composite
basis. Furthermore, IS1 (we inform trading partners in advance of changing needs) and
IS3 (our trading partners keep us fully informed about issues that affect our business) are
the two practices within information sharing (IS) that positively impact supply chain
responsiveness on a composite basis. In addition, SSP2 (we regularly solve problems
jointly with our suppliers), SSP6 (we actively involve our key suppliers in new product
development processes), and SSP4 (we have continuous improvement programs that
include our key suppliers) are the three significant practices within strategic supplier
partnership (SSP) that positively impact supply chain responsiveness on an aggregate
level. Lastly, CR4 (we facilitate customers’ ability to seek assistance from us) and CR2
(we frequently measure and evaluate customer satisfaction) are the two practices within
customer relationship (CR) that positively impact supply chain responsiveness on an
aggregate basis.
Further, we discuss the item-level analyses on the individual dimensions of supply
chain responsiveness. DT3 (production teams can be reassigned to different production
184

8/13/2019 Competitive_advantage of a Firm Through Supply Chain Responsiveness and SCM Practices
http://slidepdf.com/reader/full/competitiveadvantage-of-a-firm-through-supply-chain-responsiveness-and-scm 203/294
tasks) and DT5 (production team members are capable of working on different teams) are
the two prime practices within dynamic teaming (DT) that positively impact operations
system responsiveness (OSR) dimension of supply chain responsiveness. Also PRM3
(production process modules can be adjusted for changing production needs) and PRM1
(our production process is designed as adjustable modules) are the two key practices
within process modularity (PRM) that positively influence the operations system
responsiveness dimension. Although customer relationship (CR) and strategic supplier
partnership (SSP) positively impact operations system responsiveness (OSR) on a
dimension-level, they are not significantly instrumental in predicting OSR on an item-
level.
PRM5 (production process modules can be rearranged so that customization sub-
processes occur last) and PRM2 (our production process can be adjusted by adding new
process modules) are the two practices within process modularity (PRM) that positively
influence supplier network responsiveness (SNR) dimension of supply chain
responsiveness. Although dynamic teaming (DT) positively impacts supplier network
responsiveness (SNR) on a dimension-level, it is not significantly instrumental in
predicting SNR on an item-level. SSP2 (we regularly solve problems jointly with our
suppliers) and SSP6 (we actively involve our key suppliers in new product development
processes) are the two practices within strategic supplier partnership (SSP) that positively
impact the supplier network responsiveness dimension. Finally, IS1 (we inform trading
partners in advance of changing needs) and IS3 (our trading partners keep us fully
informed about issues that affect our business) are the two practices within information
sharing (IS) that positively affect the supplier network responsiveness dimension.
185

8/13/2019 Competitive_advantage of a Firm Through Supply Chain Responsiveness and SCM Practices
http://slidepdf.com/reader/full/competitiveadvantage-of-a-firm-through-supply-chain-responsiveness-and-scm 204/294
To sum up, the practices in bold letters in Table 7.2.1.1 are the predominant item-
level SCM practices and modularity based manufacturing practices that are repeatedly
positively impacting supply chain responsiveness (on a composite basis), and one or
more of its dimensions (viz: operations system responsiveness / supplier network
responsiveness). These practices are as follows: DT3 (production teams can be
reassigned to different production tasks), PRM2 (our products share common modules),
PRM5 (product feature modules can be added to a standard base unit), IS1 (we inform
trading partners in advance of changing needs), IS3 (our trading partners keep us fully
informed about issues that affect our business), SSP2 (we regularly solve problems
jointly with our suppliers), SSP6 (we actively involve our key suppliers in new product
development processes). The results of the survey thus imply that organizations could
greatly enhance their responsive on one or more of the said dimensions by the
implementing these predominant practices. These implications are discussed in detail in
the next chapter (Chapter 8).
7.2.2 Summary of Results for Competitive Advantage
Table 7.2.2.1 summarizes the regression analyses results from all the previous
sections in this chapter for – competitive advantage and its dimensions - as the outcome
variable/s.
Construct-level step wise multiple regression analysis results signify that ‘SCM
practices’ reasonably predicts competitive advantage. Supply chain responsiveness also
moderately predicts competitive advantage. The regression analyses results support
structural equation modeling results. These results imply that organizations can achieve
186
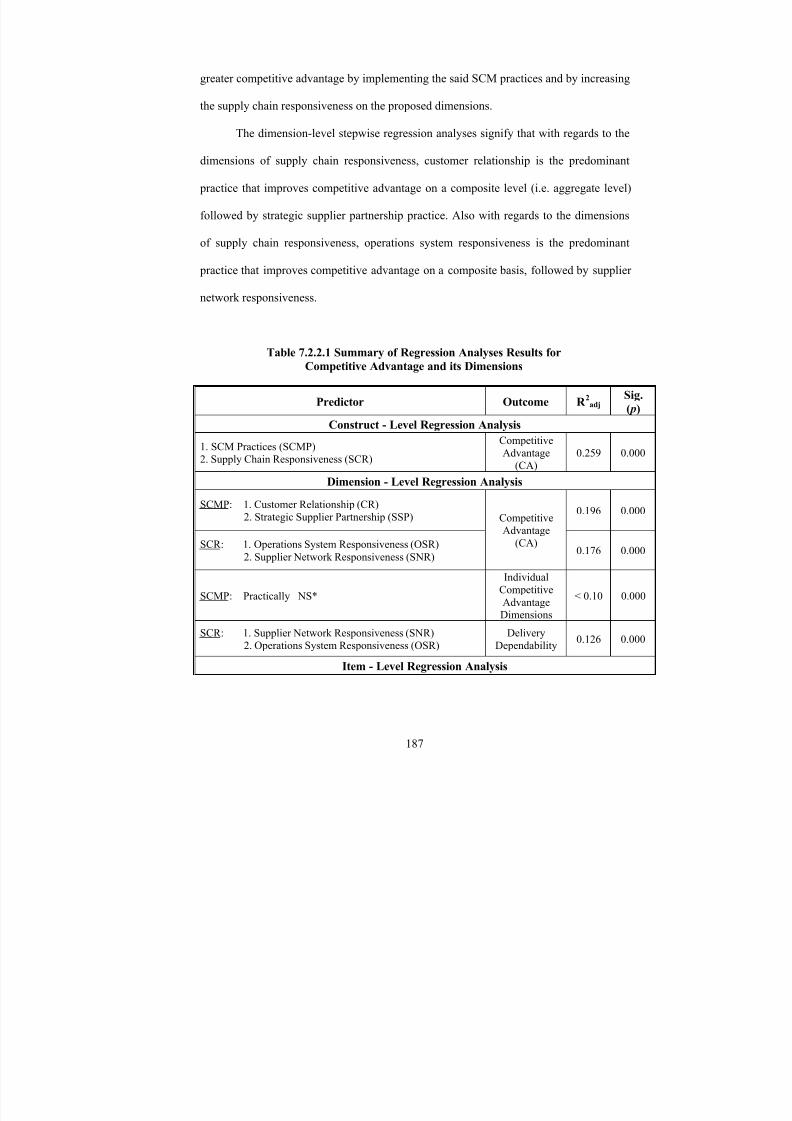
8/13/2019 Competitive_advantage of a Firm Through Supply Chain Responsiveness and SCM Practices
http://slidepdf.com/reader/full/competitiveadvantage-of-a-firm-through-supply-chain-responsiveness-and-scm 205/294
greater competitive advantage by implementing the said SCM practices and by increasing
the supply chain responsiveness on the proposed dimensions.
The dimension-level stepwise regression analyses signify that with regards to the
dimensions of supply chain responsiveness, customer relationship is the predominant
practice that improves competitive advantage on a composite level (i.e. aggregate level)
followed by strategic supplier partnership practice. Also with regards to the dimensions
of supply chain responsiveness, operations system responsiveness is the predominant
practice that improves competitive advantage on a composite basis, followed by supplier
network responsiveness.
Table 7.2.2.1 Summary of Regression Analyses Results for
Competitive Advantage and its Dimensions
Predictor Outcome R 2adj
Sig.
( p)
Construct - Level Regression Analysis
1. SCM Practices (SCMP)
2. Supply Chain Responsiveness (SCR)
Competitive
Advantage(CA)
0.259 0.000
Dimension - Level Regression Analysis
SCMP: 1. Customer Relationship (CR)
2. Strategic Supplier Partnership (SSP)0.196 0.000
SCR: 1. Operations System Responsiveness (OSR)
2. Supplier Network Responsiveness (SNR)
Competitive
Advantage
(CA)0.176 0.000
SCMP: Practically NS*
Individual
Competitive
AdvantageDimensions
< 0.10 0.000
SCR: 1. Supplier Network Responsiveness (SNR)
2. Operations System Responsiveness (OSR)
Delivery
Dependability0.126 0.000
Item - Level Regression Analysis
187

8/13/2019 Competitive_advantage of a Firm Through Supply Chain Responsiveness and SCM Practices
http://slidepdf.com/reader/full/competitiveadvantage-of-a-firm-through-supply-chain-responsiveness-and-scm 206/294
Predictor Outcome R 2adj
Sig.
( p)
CR: 1. CR5
(periodically evaluating the importance of a firm’s
relationship with its customers)
2. CR4(facilitating customers’ ability to seek assistance from
the firm)
3. CR1
(frequent interaction by the firm with its customers to
set reliability, responsiveness, and other standards for
the firm)
0.148 0.000
SSP: 1. SSP2
(regularly solving problems jointly with suppliers)
2. SSP4
(conducting continuous improvement programs by a
firm that include its key suppliers)
0.111 0.000
OSR: OSR1
(the ability of the operations system of a firm to rapidly
respond to changes in product volume demanded by
customers)
0.199 0.000
SNR: Practically NS*
Competitive
Advantage
(CA)
0.090 0.000
SNR: SNR6
(the ability of a firm’s major suppliers to effectively
expedite the firm’s emergency orders)
0.112 0.000
OSR: OSR1 (the ability of the operations system of a firm to rapidly
respond to changes in product volume demanded by
customers)
Delivery
Dependability
0.107 0.000
* Practically NS = Practically Not Significant (i.e. not practically significant, to draw any
substantial inferences)
It is further observed that none of the SCM practices dimensions predict any of
the dimensions of competitive advantage (R 2adj < 0.10). A plausible explanation for this
fact could be that the variance explained by the independent variable (SCM practices) is
significant when a cumulative score of the competitive advantage (dependent variable) is
considered. This variance gets distributed when individual factors or dimensions of
188
8/13/2019 Competitive_advantage of a Firm Through Supply Chain Responsiveness and SCM Practices
http://slidepdf.com/reader/full/competitiveadvantage-of-a-firm-through-supply-chain-responsiveness-and-scm 207/294
competitive advantage are taken as dependent variables in the regression analyses. It is
further observed that supplier network responsiveness and operations system
responsiveness in the same order are predominant in positively impacting delivery
dependability dimension of competitive advantage. This can be explained as follows.
Most logistics functions are outsourced to third parties. These third party logistics
companies maintain and most often exceed their service levels to stay in business and
beat competition. Therefore there is little scope for improvement on the logistics process
responsiveness dimension. However operations system responsiveness (responsiveness of
the manufacturing system of an organization) and supplier network responsiveness
(responsiveness of suppliers of an organization) directly impact the speed of response of
an organization in meeting customer demand and thus its ability to compete on the basis
of delivery dependability.
The item-level stepwise regression analyses results signify that CR5 (we
periodically evaluate the importance of our relationship with our customers), CR4 (we
facilitate customers’ ability to seek assistance from us), and CR1 (we frequently interact
with customers to set reliability, responsiveness, and other standards for us), in the same
order, are the three prime practices within customer relationship (CR) that positively
impact the overall competitive advantage of the firm on a composite basis. Also SSP2
(we regularly solve problems jointly with our suppliers) and SSP4 (we have continuous
improvement programs that include our key suppliers) are the two key practices within
strategic supplier partnership (SSP) that enhance competitive advantage on a composite
basis. Furthermore, OSR1 (our operations system responds rapidly to changes in product
volume demanded by customers) is the only criterion within operations system
189

8/13/2019 Competitive_advantage of a Firm Through Supply Chain Responsiveness and SCM Practices
http://slidepdf.com/reader/full/competitiveadvantage-of-a-firm-through-supply-chain-responsiveness-and-scm 208/294
responsiveness (OSR) that positively impacts competitive advantage on a composite
basis. Although supplier network responsiveness (SNR) positively impacts competitive
advantage (CA) on a dimension-level, it is not significantly instrumental in predicting CA
on an item-level. These implications are elaborately discussed in the next chapter
(Chapter 8)
We proceed to discuss the item-level analyses on the individual dimensions of
competitive advantage (i.e. only delivery dependability dimension is significant here).
SNR6 (our major suppliers effectively expedite our emergency orders) is the only
criterion within supplier network responsiveness (SNR) that positively impacts delivery
dependability dimension of competitive advantage. Also, OSR1 (our operations system
responds rapidly to changes in product volume demanded by customers) is the only key
criterion within operations system responsiveness (OSR) that positively influences the
delivery dependability dimension of competitive advantage.
To sum up, OSR1 (our operations system responds rapidly to changes in product
volume demanded by customers) is the predominant item-level supply chain
responsiveness criterion that positively impacts competitive advantage on a composite
basis, as well as its only impacted dimension ‘delivery dependability’. The results of the
survey thus imply that organizations could greatly improve their competitive advantage
both on an aggregate level as well as based on delivery dependability, by improving on
the predominant operations system responsiveness criterion (OSR1).
190
8/13/2019 Competitive_advantage of a Firm Through Supply Chain Responsiveness and SCM Practices
http://slidepdf.com/reader/full/competitiveadvantage-of-a-firm-through-supply-chain-responsiveness-and-scm 209/294
7.3 MANOVA Results
Supply chain responsiveness is the construct that is newly developed and
validated in this research. Moreover, supply chain responsiveness has been hypothesized
to be positively related to competitive advantage (measured by five dimensions/sub-
constructs: price, quality, delivery dependability, product innovation, and time to market)
in this research. As a newly developed construct, it is of keen interest to further drill
down into the impact of the dimensions of supply chain responsiveness on the
dimensions of competitive advantage. We note here that, although operations system
responsiveness (OSR) and supplier network responsiveness (SNR) have been found to be
significant in predicting competitive advantage (CA) on a composite basis (section
7.1.3.2), regression analyses results have not indicated any significant prediction of
measures/dimensions of competitive advantage (except delivery dependability) by supply
chain responsiveness dimensions. However as discussed earlier, this could be attributed
to the distribution of the variance explained by the IV on the DV when we go to the
dimension level analyses from the construct level analysis, thus leading to the
insignificance of these dimension level analyses. This section aims at understanding if the
measures of competitive advantage when considered collectively and individually,
significantly differ for high and low levels of the dimensions of supply chain
responsiveness. In the same regard, the analyses will be restricted to the significant
predictor dimensions of supply chain responsiveness (operations system responsiveness
and supplier network responsiveness) that are instrumental in impacting competitive
advantage, and as already discussed in the regression analysis section 7.1.3.2.
191
8/13/2019 Competitive_advantage of a Firm Through Supply Chain Responsiveness and SCM Practices
http://slidepdf.com/reader/full/competitiveadvantage-of-a-firm-through-supply-chain-responsiveness-and-scm 210/294
We first start with the general discussion of MANOVA, its advantages, and the
procedure of conducting the analysis. MANOVA has several advantages over ANOVA
(analysis of variance) (Tabachnick and Fidell, 1996). First, by measuring several DVs
instead of only one, the chances of discovering what actually changes as a result of the
differing treatments or characteristics (and any interactions) improve greatly. In our study
we are interested in knowing what measures of competitive advantage are affected by
operations system responsiveness and supplier network responsiveness. If we wanted to
know what measures of competitive advantage are affected by operations system
responsiveness, we improve our chances of uncovering these effects by including the
measures of competitive advantage (price, quality, delivery dependability, product
innovation, and time to market). A second advantage is that, under certain conditions,
MANOVA can reveal differences that separate ANOVAs might not (Tabachnick and
Fidell, 1996; Stevens, 1992). For example, assuming that we have a one-way design, with
two levels on the IV and two DVs, if we were to conduct separate ANOVAs on the two
DVs, the distributions for each of the two groups (and for the DV) might overlap
sufficiently, such that a mean difference probably would not be found. However, when
the two DVs are considered in combination with each other, the two groups may differ
substantially and could result in a substantially significant difference between groups
(Mertler and Vannatta, 2002).
The main difference between ANOVA and MANOVA is as follows: in ANOVA,
the null hypothesis states that the population means are equal, whereas in MANOVA the
null hypothesis states that the population mean vectors (for the combination of DVs) are
equal. ANOVA tests whether mean differences among k groups on a single DV are
192
8/13/2019 Competitive_advantage of a Firm Through Supply Chain Responsiveness and SCM Practices
http://slidepdf.com/reader/full/competitiveadvantage-of-a-firm-through-supply-chain-responsiveness-and-scm 211/294

8/13/2019 Competitive_advantage of a Firm Through Supply Chain Responsiveness and SCM Practices
http://slidepdf.com/reader/full/competitiveadvantage-of-a-firm-through-supply-chain-responsiveness-and-scm 212/294
overall α-level for the analysis (α = 0.05) divided by the number of DVs. For example, in
this study we have five DVs (viz: five dimensions of competitive advantage - price,
quality, delivery dependability, product innovation, and time to market) and want an
overall α equal to 0.05, then each univariate test is to be conducted at α = 0.01, since
0.05/5 = 0.01. This rounding down of the α-level is necessary to create an overall alpha
less that 0.05. All alphas can be set at the same level, or more important DVs can be
given more liberal alphas (Tabachnick and Fidell, 1996).
Hair et al. (1998) suggest that a second analysis of the dependent variate is the
stepdown test, which examines the significance of group differences while allowing for
dependent variable inter-correlation. Such a stepdown analysis is useful in showing that
the DVs have unique differences across the groups; that is showing that the DVs are not
so highly correlated that there are no unique differences in one DV after the effects of
other DVs are accounted for (Hair et al., 1998). Hair et al. (1998) suggest Roy-Bargman
stepdown F test.
Regression analyses results highlight the significant dimensions of supply chain
responsiveness (viz: operations system responsiveness (OSR) and supplier network
responsiveness (SNR)) that are predominant in predicting competitive advantage. Thus
for conducting MANOVA only these two dimensions of supply chain responsiveness
(OSR and SNR) have been considered as two distinct IVs. The DVs are the five
dimensions of competitive advantage (price, quality, delivery dependability, product
innovation, and time-to-market). In our study, the results of MANOVA shall answer the
following questions:
194

8/13/2019 Competitive_advantage of a Firm Through Supply Chain Responsiveness and SCM Practices
http://slidepdf.com/reader/full/competitiveadvantage-of-a-firm-through-supply-chain-responsiveness-and-scm 213/294
(1) Are there significant mean differences in competitive advantage of a firm (as
measured by the combination of price, quality, delivery dependability, product
innovation, and time to market) for high and low operations system
responsiveness / supplier network responsiveness?
(2) Are there significant mean differences in competitive advantage of a firm based
on low price, for high and low operations system responsiveness / supplier
network responsiveness?
(3) Are there significant mean differences in competitive advantage of a firm based
on high quality, for high and low operations system responsiveness / supplier
network responsiveness?
(4) Are there significant mean differences in competitive advantage of a firm based
on high delivery dependability, for high and low operations system
responsiveness / supplier network responsiveness?
(5) Are there significant mean differences in competitive advantage of a firm based
on high product innovation, for high and low operations system responsiveness /
supplier network responsiveness?
(6) Are there significant mean differences in competitive advantage of a firm based
on low time to market, for high and low operations system responsiveness /
supplier network responsiveness?
It is desired that the homogeneity of covariance matrices or the homoscedasticity
assumption (tested by Box’s Test of equality of covariance matrices) is met to analyze the
MANOVA results. If the assumption of homogeneity of variance-covariance is met (i.e.
Box’s test is non-significant when testing the null hypothesis that the observed
195

8/13/2019 Competitive_advantage of a Firm Through Supply Chain Responsiveness and SCM Practices
http://slidepdf.com/reader/full/competitiveadvantage-of-a-firm-through-supply-chain-responsiveness-and-scm 214/294
covariance matrices of the dependent variables are equal across groups), the Wilks’
Lambda is interpreted, if not then Pillai’s Trace is utilized when interpreting MANOVA
results (Mertler and Vannatta, 2002). Pillai’s Trace is a more robust multivariate test
statistic and is typically used if homogeneity of variance-covariance is violated. When
there are more than one quantitative correlated DVs (tested by Pearson correlation), a
MANOVA is preferred.
Mertler and Vannatta (2002) summarize the analysis procedure for MANOVA, as
follows:
(1) Evaluate Box’s Test. If homogeneity of variance-covariance is assumed, utilize
Wilks’ Lambda statistic when interpreting the multivariate tests. If the assumption
of equal variances is violated, use Pillai’s Trace.
(2) Once the multivariate test statistic has been identified, examine the significance (F
ratios and p values) of factor interaction (necessary if two or more IVs are
included). Examine the significance (F ratios and p values) of each factor’s main
effect – if the results are significant, proceed to the next step; if not, stop.
(3) Examine the univariate tests (ANOVAs) of individual DVs – if any are
significant, proceed to the next step; if not, stop.
(4) Perform Roy-Bargman stepdown F-test to support the results of ANOVA (Hair et
al., 1998)
(5) Examine post hoc tests for the individual DVs.
196
8/13/2019 Competitive_advantage of a Firm Through Supply Chain Responsiveness and SCM Practices
http://slidepdf.com/reader/full/competitiveadvantage-of-a-firm-through-supply-chain-responsiveness-and-scm 215/294
7.3.1 MANOVA – Effect of Operations System Responsiveness on Competitive
Advantage
Regression analyses results signify that operations system responsiveness is the
first dimension within supply chain responsiveness that predicts competitive advantage
on a composite basis. We therefore perform a one way MANOVA with operations
system responsiveness dimension of supply chain responsiveness as IV (with two
categories – high and low) and the five dimensions of competitive advantage (price,
quality, delivery dependability, product innovation, and time to market) as five
quantitative DVs. The operations system responsiveness scale was measured from 1 – not
at all to 5 – to a great extent. A score of above 3 (i.e. 4 and 5) was treated as high, and a
score of 3 or below was treated as low, for defining the two categories high and low.
It is desired that the DVs that are entered in the MANOVA analysis be correlated
(Mertler and Vannatta, 2002; Hair et al., 1998). Therefore, before proceeding with the
multivariate tests, Pearson correlation was performed to determine if the dependent
measures (i.e. price, quality, delivery dependability, product innovation, and time to
market) are significantly correlated. Table 7.3.1.1 shows the Pearson correlation results.
197

8/13/2019 Competitive_advantage of a Firm Through Supply Chain Responsiveness and SCM Practices
http://slidepdf.com/reader/full/competitiveadvantage-of-a-firm-through-supply-chain-responsiveness-and-scm 216/294
Table 7.3.1.1 Pearson Correlations for Competitive Advantage Dimensions
Price QualityDelivery
Dependability
Product
Innovation
Time to
Market
Price 1 0.180** 0.222** 0.069 0.207**
Quality 0.180** 1 0.214** 0.108 0.078
Delivery
Dependability0.222** 0.214** 1 0.030 0.230**
Product
Innovation0.069 0.108 0.030 1 0.238**
Time to
Market0.207** 0.078 0.230** 0.238** 1
** Correlation is significant at 0.01 level
It is observed from the results above that there is some correlation between the
five dimensions of competitive advantage (price, quality, delivery dependability, product
innovation, and time to market). Since some correlation is observed, we proceed with the
MANOVA tests.
The assumption of homogeneity of variance-covariance will be tested within
MANOVA. Thus MANOVA was conducted utilizing the multivariate procedure in
SPSS. The Box’s Test (Table 7.3.1.2) is not significant and indicates that homogeneity of
variance-covariance is fulfilled, F (15,242285.4) = 1.498, p = 0.096, so Wilks’ Lambda
test statistic will be used in interpreting the MANOVA results.
198
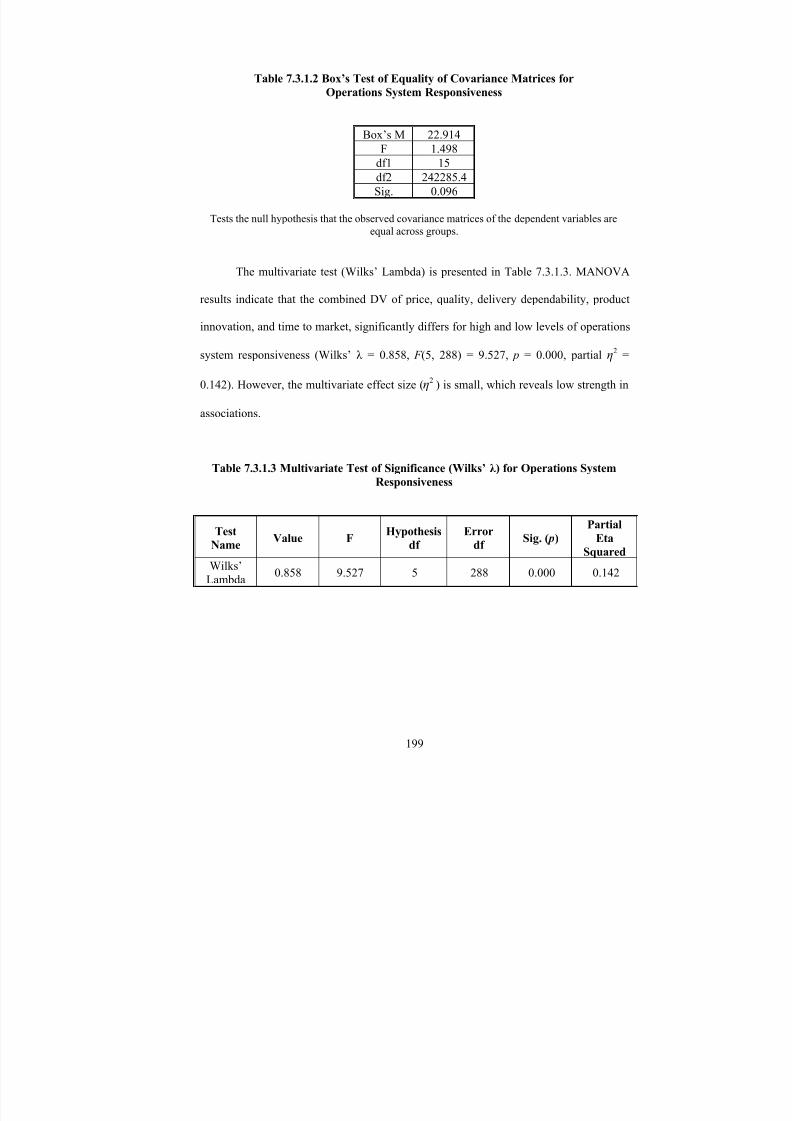
8/13/2019 Competitive_advantage of a Firm Through Supply Chain Responsiveness and SCM Practices
http://slidepdf.com/reader/full/competitiveadvantage-of-a-firm-through-supply-chain-responsiveness-and-scm 217/294
Table 7.3.1.2 Box’s Test of Equality of Covariance Matrices for
Operations System Responsiveness
Box’s M 22.914
F 1.498df1 15
df2 242285.4
Sig. 0.096
Tests the null hypothesis that the observed covariance matrices of the dependent variables are
equal across groups.
The multivariate test (Wilks’ Lambda) is presented in Table 7.3.1.3. MANOVA
results indicate that the combined DV of price, quality, delivery dependability, product
innovation, and time to market, significantly differs for high and low levels of operations
system responsiveness (Wilks’ λ = 0.858, F (5, 288) = 9.527, p = 0.000, partial η2 =
0.142). However, the multivariate effect size (η2) is small, which reveals low strength in
associations.
Table 7.3.1.3 Multivariate Test of Significance (Wilks’ λ ) for Operations System
Responsiveness
Test
NameValue F
Hypothesis
df
Error
dfSig. ( p)
Partial
Eta
Squared
Wilks’
Lambda0.858 9.527 5 288 0.000 0.142
199

8/13/2019 Competitive_advantage of a Firm Through Supply Chain Responsiveness and SCM Practices
http://slidepdf.com/reader/full/competitiveadvantage-of-a-firm-through-supply-chain-responsiveness-and-scm 218/294
Since the multivariate test was significant, we examine the ANOVA results (i.e.
univariate tests of individual DVs). Univariate ANOVA results (Table 7.3.1.4) were
interpreted using a more conservative alpha level (α = 0.05/5 = 0.01) to counteract the
potential of an inflated Type I error rate which can be caused due to multiple ANOVAs
and as recommended by Tabachnick and Fidell (1996).
Table 7.3.1.4 ANOVA Summary Table for Operations Systems Responsiveness
SourceDependent
Variable
Sum of
Squaresdf
Mean
SquareF
Sig.
( p)
Partial
Eta
Squared
Price 7.812 1 7.812 9.637 0.002 0.032
Quality 0.030 1 0.030 0.095 0.759 0.000
Delivery
Dependability7.434 1 7.434 16.085 0.000 0.052
Product
Innovation11.313 1 11.313 16.568 0.000 0.054
OperationsSystem
Responsiveness
Time to
Market13.092 1 13.092 20.421 0.000 0.065
ANOVA results indicate that the competitive advantage of a firm based on low
price ( F (1, 292) = 9.637, p< 0.01, partial η 2 = 0.032), high delivery dependability ( F (1,
292) = 16.085, p< 0.001, partial η 2 = 0.052), high product innovation ( F (1, 292) =
16.568, p< 0.001, partial η 2 = 0.054), and low time-to-market ( F (1, 292) = 20.421, p<
0.001, partial η 2 = 0.065), significantly differs for high and low levels of operations
system responsiveness.
200

8/13/2019 Competitive_advantage of a Firm Through Supply Chain Responsiveness and SCM Practices
http://slidepdf.com/reader/full/competitiveadvantage-of-a-firm-through-supply-chain-responsiveness-and-scm 219/294
Although significant group differences were found for these four DVs, the effect
sizes are small, indicating that a small proportion of variance in the individual abilities of
a firm to compete based on: low price, high delivery dependability, high product
innovation, and low time to market, is accounted for by operations system
responsiveness. The ability of an organization to compete based on high quality does not
significantly differ for high and low levels of operations system responsiveness ( F (1,
292) = 0.095, p= 0.759, partial η 2 = 0.000).
Roy-Bargman stepdown F test was performed to support the results of ANOVA
and to check for significance of group differences while allowing dependent variable
inter-correlation. This test will assure the researcher that the IV – operations system
responsiveness – does have significant separate effects on a particular DV that are
unrelated to any other DV in the analysis. In short, it will assure the researcher that the
effect of the IV on an individual DV is not due to the inter-correlation effect between the
DVs, but by itself. A stepdown analysis, as shown in Table 7.3.1.5, shows that four
variables – price ( F (1, 292) = 9.637, p< 0.01), delivery dependability ( F (1, 290) =
12.443, p< 0.001), product innovation ( F (1, 289) = 16.342, p< 0.001), and time to
market( F (1, 288) = 6.810, p= 0.01)) have unique differences across high and low levels
of operations system responsiveness; that is, the four variables are not so highly
correlated with each other that there are no unique differences in each of them after the
effects of the other three are accounted for.
201

8/13/2019 Competitive_advantage of a Firm Through Supply Chain Responsiveness and SCM Practices
http://slidepdf.com/reader/full/competitiveadvantage-of-a-firm-through-supply-chain-responsiveness-and-scm 220/294
Table 7.3.1.5 Roy-Bargman Stepdown F Tests for Operations System
Responsiveness
Degrees of Freedom
Variable
Between-
GroupsMean
Square
Within-
GroupsMean
Square
StepdownF Between Within
Significanceof Stepdown
F
Price 7.812 0.811 9.637 1 292 0.002
Quality 0.019 0.306 0.062 1 291 0.804
Delivery
Dependability5.386 0.433 12.443 1 290 0.000
Product
Innovation11.116 0.680 16.342 1 289 0.000
Time to Market 4.035 0.593 6.810 1 288 0.010
This result suggests that, level of operations system responsiveness has significant
separate effects on the competitive advantage of a firm based on low price, that are
unrelated to the competitive advantage of a firm based on: high delivery dependability,
high product innovation, and low time to market. Similarly, we can add that, level of
operations system responsiveness has significant separate effects on the competitive
advantage of a firm based on high delivery dependability, that are unrelated to the
competitive advantage of a firm based on: low price, high product innovation, and low
time to market. In the same fashion, we can say that level of operations system
responsiveness has significant separate effects on the competitive advantage of a firm
based on high product innovation, that are unrelated to the competitive advantage of a
firm based on: low price, high delivery dependability, and low time to market. Lastly, we
add that level of operations system responsiveness has significant separate effects on the
competitive advantage of a firm based on low time to market, that are unrelated to the
202
8/13/2019 Competitive_advantage of a Firm Through Supply Chain Responsiveness and SCM Practices
http://slidepdf.com/reader/full/competitiveadvantage-of-a-firm-through-supply-chain-responsiveness-and-scm 221/294
competitive advantage of a firm based on: low price, high delivery dependability, and
high product innovation. Therefore, after examining these results and tests, the researcher
can safely conclude that high and low levels of operations system responsiveness, both
collectively (as given by MANOVA results) and individually (as given by ANOVA
results and further supported by Roy-Bargman stepdown F tests), significantly differ on
the four variables: price, delivery dependability, product innovation, and time to market.
Table 7.3.1.6 tabulates the means and standard deviations of the DVs (competitive
advantage based on: price, delivery dependability, product innovation, and time to
market), by high and low categories / levels of operations system responsiveness. The
means are significantly different for high and low levels of operations system
responsiveness. These means (Table 7.3.1.6) signify that organizations can compete
based on: low price, high delivery dependability, high product innovation, and low time
to market, to a greater extent if they have high levels of operations system
responsiveness. Thus we can conclude that operations system responsiveness has a
positive impact on the ability of organizations to compete based on low price, high
delivery dependability, high product innovation, and low time to market, but not on their
ability to compete based on high quality. The practical implication of this result is that
organizations could be compromising on product quality in order to be operationally
responsive to customer demand. These implications are discussed in greater detail in the
next chapter (Chapter 8).
203

8/13/2019 Competitive_advantage of a Firm Through Supply Chain Responsiveness and SCM Practices
http://slidepdf.com/reader/full/competitiveadvantage-of-a-firm-through-supply-chain-responsiveness-and-scm 222/294
Table 7.3.1.6 Means and Standard Deviations for Competitive Advantage
Dimensions by Operations System Responsiveness
Operations System
Responsiveness
Mean Std. Deviations
Low 3.25 0.92Price
High 3.58 0.89
Low 4.04 0.71Delivery
Dependability High 4.37 0.66
Low 3.63 0.87Product
Innovation High 4.04 0.79
Low 2.94 0.80Time to Market
High 3.37 0.80
7.3.2 MANOVA – Effect of Supplier Network Responsiveness on Competitive
Advantage
Regression analyses results signify that supplier network responsiveness is the
second dimension within supply chain responsiveness that predicts competitive
advantage on a composite basis. We therefore perform a one way MANOVA with
supplier network responsiveness dimension of supply chain responsiveness as IV (with
two categories – high and low) and the five dimensions of competitive advantage (price,
quality, delivery dependability, product innovation, and time to market) as five
quantitative DVs. The supplier network responsiveness scale was measured from 1 – not
at all to 5 – to a great extent. A score of above 3 (i.e. 4 and 5) was treated as high, and a
score of 3 or below was treated as low, for defining the two categories high and low.
The assumption of homogeneity of variance-covariance will be tested within
MANOVA. Thus MANOVA was conducted utilizing the multivariate procedure in
SPSS. The Box’s Test (Table 7.3.2.1) is not significant and indicates that homogeneity of
204
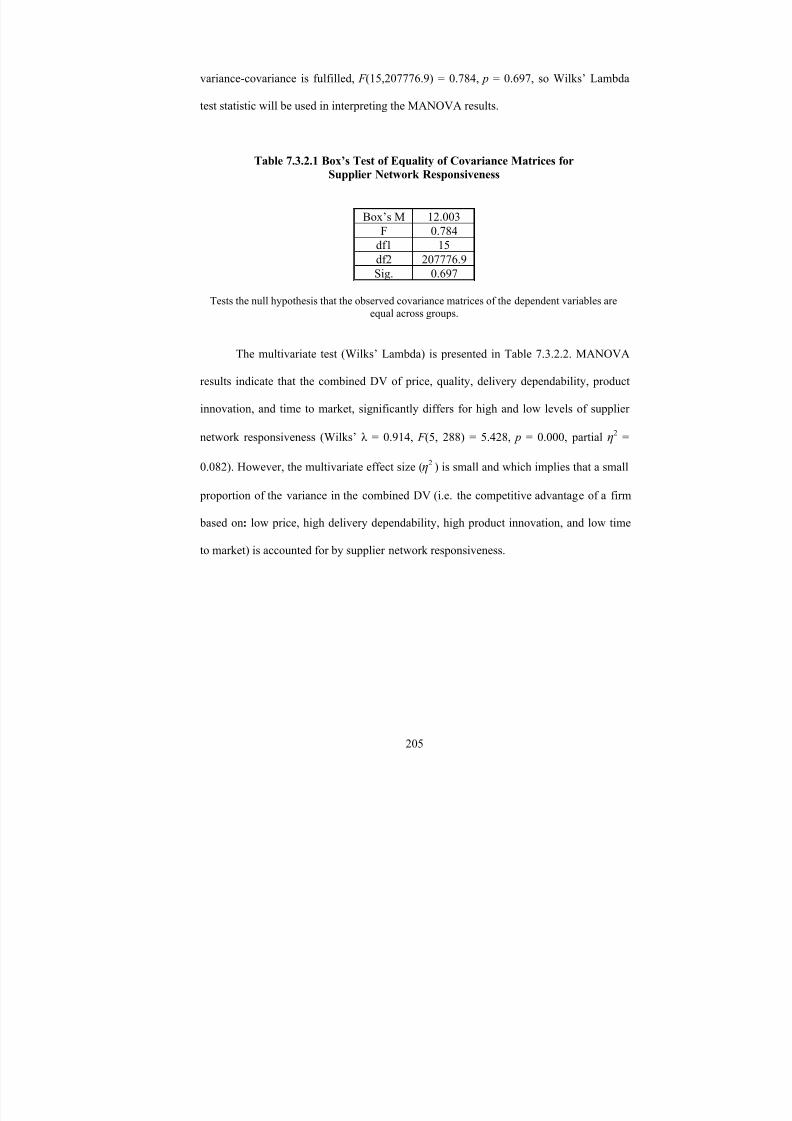
8/13/2019 Competitive_advantage of a Firm Through Supply Chain Responsiveness and SCM Practices
http://slidepdf.com/reader/full/competitiveadvantage-of-a-firm-through-supply-chain-responsiveness-and-scm 223/294
variance-covariance is fulfilled, F (15,207776.9) = 0.784, p = 0.697, so Wilks’ Lambda
test statistic will be used in interpreting the MANOVA results.
Table 7.3.2.1 Box’s Test of Equality of Covariance Matrices for
Supplier Network Responsiveness
Box’s M 12.003
F 0.784
df1 15
df2 207776.9
Sig. 0.697
Tests the null hypothesis that the observed covariance matrices of the dependent variables areequal across groups.
The multivariate test (Wilks’ Lambda) is presented in Table 7.3.2.2. MANOVA
results indicate that the combined DV of price, quality, delivery dependability, product
innovation, and time to market, significantly differs for high and low levels of supplier
network responsiveness (Wilks’ λ = 0.914, F (5, 288) = 5.428, p = 0.000, partial η2 =
0.082). However, the multivariate effect size (η2) is small and which implies that a small
proportion of the variance in the combined DV (i.e. the competitive advantage of a firm
based on: low price, high delivery dependability, high product innovation, and low time
to market) is accounted for by supplier network responsiveness.
205

8/13/2019 Competitive_advantage of a Firm Through Supply Chain Responsiveness and SCM Practices
http://slidepdf.com/reader/full/competitiveadvantage-of-a-firm-through-supply-chain-responsiveness-and-scm 224/294
Table 7.3.2.2 Multivariate Test of Significance (Wilks’ λ ) for Supplier Network
Responsiveness
Test
Name Value F
Hypothesis
df
Error
df Sig. ( p)
Partial
EtaSquared
Wilks’
Lambda0.914 5.428 5 288 0.000 0.086
Since the multivariate test was significant, we examine the ANOVA results (i.e.
univariate tests of individual DVs). Univariate ANOVA results (Table 7.3.1.4) were
interpreted using a more conservative alpha level (α = 0.05/5 = 0.01) to counteract the
potential of an inflated Type I error rate which can be caused due to multiple ANOVAs
and as recommended by Tabachnick and Fidell (1996). ANOVA results indicate that the
competitive advantage of a firm based on low price ( F (1, 292) = 8.105, p< 0.01, partial
η 2 = 0.027), high delivery dependability ( F (1, 292) = 18.784, p< 0.001, partial η
2 =
0.060), and low time-to-market ( F (1, 292) = 7.044, p< 0.01, partial η 2 = 0.024),
significantly differs for high and low levels of supplier network responsiveness. Although
significant group differences were found for these three DVs, the effect sizes are small,
indicating that a small proportion of variance in the individual abilities of a firm to
compete based on: low price, high delivery dependability, and low time to market, is
accounted for by supplier network responsiveness. The ability of an organization to
compete based on high quality ( F (1, 292) = 6.249, p= 0.013, partial η 2 = 0.021) and
high product innovation ( F (1, 292) = 0.650, p= 0.421, partial η 2 = 0.002), does not
significantly differ for high and low levels of supplier network responsiveness.
206

8/13/2019 Competitive_advantage of a Firm Through Supply Chain Responsiveness and SCM Practices
http://slidepdf.com/reader/full/competitiveadvantage-of-a-firm-through-supply-chain-responsiveness-and-scm 225/294
Table 7.3.2.3 ANOVA Summary Table for Supplier Network Responsiveness
SourceDependent
Variable
Sum of
Squaresdf
Mean
SquareF
Sig.
( p)
Partial
Eta
Squared
Price 6.604 1 6.604 8.105 0.005 0.027
Quality 1.926 1 1.926 6.249 0.013 0.021
DeliveryDependability
8.606 1 8.606 18.784 0.000 0.060
ProductInnovation
0.468 1 0.468 0.650 0.421 0.002
Supplier
NetworkResponsiveness
Time toMarket
4.718 1 4.718 7.044 0.008 0.024
Roy-Bargman stepdown F test was performed to support the results of ANOVA
and to check for significance of group differences while allowing dependent variable
inter-correlation. This test will assure the researcher that the IV – supplier network
responsiveness – does have significant separate effects on a particular DV that are
unrelated to any other DV in the analysis. In short, it will assure the researcher that the
effect of the IV on an individual DV is not due to the inter-correlation effect between the
DVs, but by itself. A stepdown analysis, as shown in Table 7.3.2.4, shows that only two
of the three significant variables from ANOVA results – price ( F (1, 292) = 8.11, p< 0.01)
and delivery dependability ( F (1, 290) = 12.193, p< 0.001), have unique differences
across high and low levels of supplier network responsiveness; that is, these two variables
are not so highly correlated with the other DVs that there are no unique differences in
each of them after the effects of the others are accounted for. However the DV time-to-
market was found to be non-significant ( F (1, 288) = 1.91, p= 0.168), and which implies
that it is correlated with the other DVs to an extent that there are no unique differences in
207

8/13/2019 Competitive_advantage of a Firm Through Supply Chain Responsiveness and SCM Practices
http://slidepdf.com/reader/full/competitiveadvantage-of-a-firm-through-supply-chain-responsiveness-and-scm 226/294
time-to-market after the effects of the other DVs are accounted. One can thus say that the
significant effect of supplier network responsiveness on time to market is due to the inter-
correlation effect between the DVs, and not by itself. Thus, after the Roy-Bargman
stepdown F test, we can summarize that only the competitive advantage of a firm based
on - low price and high delivery dependability - significantly differs for high and low
levels of supplier network responsiveness.
Table 7.3.2.4 Roy-Bargman Stepdown F Tests for Supplier Network Responsiveness
Degrees of Freedom
Variable
Between-
Groups
Mean
Square
Within-
Groups
Mean
Square
Stepdown
F Between Within
Significance
of Stepdown
F
Price 6.604 0.815 8.105 1 292 0.005
Quality 1.255 0.301 4.163 1 291 0.042
Delivery
Dependability5.283 0.433 12.193 1 290 0.001
ProductInnovation
0.152 0.718 0.198 1 289 0.657
Time to Market 1.151 0.603 1.910 1 288 0.168
This result suggests that level of supplier network responsiveness has significant
separate effects on the competitive advantage of a firm based on low price, that are
unrelated to the competitive advantage of a firm based on: high delivery dependability,
and low time to market. Similarly, we can add that, level of supplier network
responsiveness has significant separate effects on the competitive advantage of a firm
based on high delivery dependability, that are unrelated to the ability of an organization
208
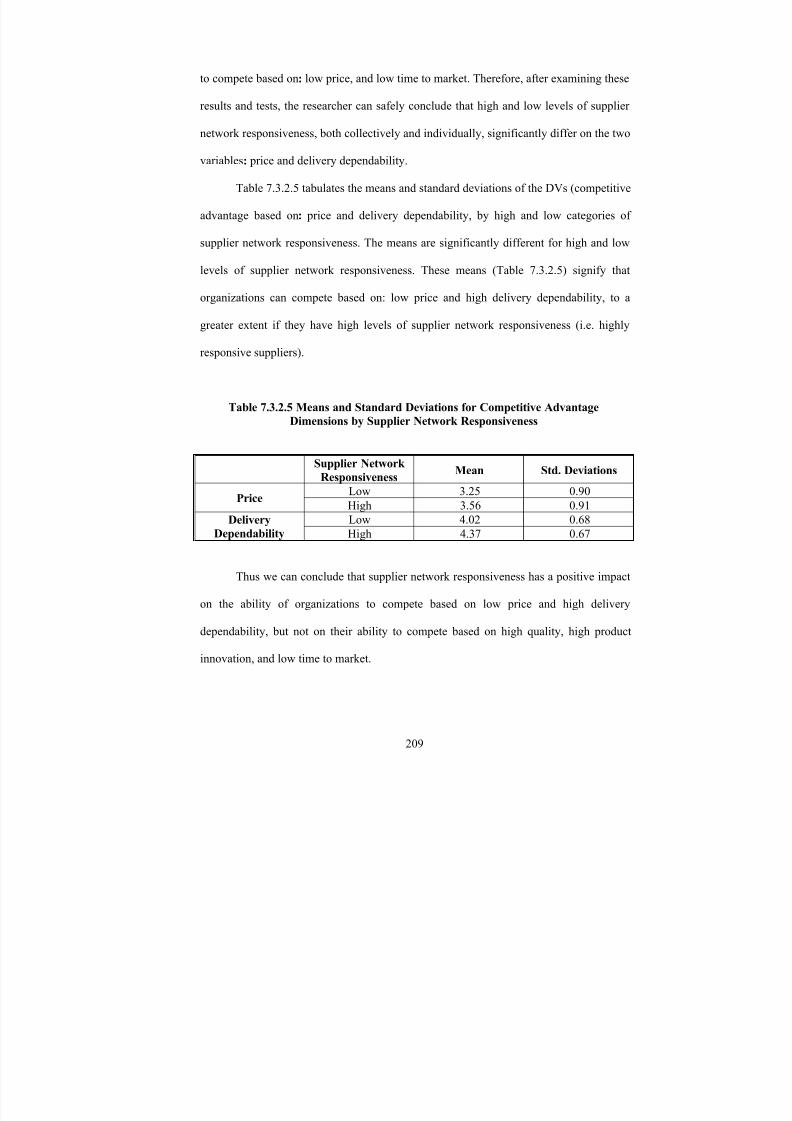
8/13/2019 Competitive_advantage of a Firm Through Supply Chain Responsiveness and SCM Practices
http://slidepdf.com/reader/full/competitiveadvantage-of-a-firm-through-supply-chain-responsiveness-and-scm 227/294
to compete based on: low price, and low time to market. Therefore, after examining these
results and tests, the researcher can safely conclude that high and low levels of supplier
network responsiveness, both collectively and individually, significantly differ on the two
variables: price and delivery dependability.
Table 7.3.2.5 tabulates the means and standard deviations of the DVs (competitive
advantage based on: price and delivery dependability, by high and low categories of
supplier network responsiveness. The means are significantly different for high and low
levels of supplier network responsiveness. These means (Table 7.3.2.5) signify that
organizations can compete based on: low price and high delivery dependability, to a
greater extent if they have high levels of supplier network responsiveness (i.e. highly
responsive suppliers).
Table 7.3.2.5 Means and Standard Deviations for Competitive Advantage
Dimensions by Supplier Network Responsiveness
Supplier Network
ResponsivenessMean Std. Deviations
Low 3.25 0.90Price
High 3.56 0.91
Low 4.02 0.68Delivery
Dependability High 4.37 0.67
Thus we can conclude that supplier network responsiveness has a positive impact
on the ability of organizations to compete based on low price and high delivery
dependability, but not on their ability to compete based on high quality, high product
innovation, and low time to market.
209

8/13/2019 Competitive_advantage of a Firm Through Supply Chain Responsiveness and SCM Practices
http://slidepdf.com/reader/full/competitiveadvantage-of-a-firm-through-supply-chain-responsiveness-and-scm 228/294
7.4 Summary of MANOVA Results
MANOVA results bring forth the following interesting findings.
First, operations system responsiveness has a positive impact on the ability of
organizations to compete based on price, delivery dependability, product innovation, and
time to market , but not on their ability to compete based on quality.
Second, competitive advantage of a firm, both collectively and individually based
on price, delivery dependability, product innovation, and time to market significantly
differs for high and low levels of operations system responsiveness.
Third, supplier network responsiveness has a positive impact on the ability of
organizations to compete based on price and delivery dependability, but not on their
ability to compete based on quality, product innovation, and time to market.
Fourth, competitive advantage of a firm, both collectively and individually based
on price, and delivery dependability, significantly differs for high and low levels of
supplier network responsiveness.
To summarize, this chapter dealt with the dimension level data analyses. Several
significant observations were made and discussed. The next chapter (Chapter 8) will
conclude with the implications of the findings of this research, contributions, limitations,
and recommendations for future research.
210

8/13/2019 Competitive_advantage of a Firm Through Supply Chain Responsiveness and SCM Practices
http://slidepdf.com/reader/full/competitiveadvantage-of-a-firm-through-supply-chain-responsiveness-and-scm 229/294
CHAPTER 8: SUMMARY AND RECOMMENDATIONS FOR FUTURE
RESEARCH
This chapter discusses (1) a summary of research findings and major
contributions; (2) implications for practitioners; (3) implications for researchers; (4)
limitations of the research; and (5) recommendations for future research.
8.1 Summary of Findings
The current research represents one of the first large-scale empirical efforts to
systematically investigate the causal relationships between SCM practices, modularity
based manufacturing practices, supply chain responsiveness, and competitive advantage.
It aims to answer the following important questions: 1) What are the key dimensions of
supply chain responsiveness? 2) What SCM practices affect supply chain responsiveness
and its dimensions? 3) What modularity based manufacturing practices affect supply
chain responsiveness and its dimensions? 4) What SCM practices affect competitive
advantage of the firm? 5) What supply chain responsiveness dimensions create
competitive advantage for a firm? In doing so, several relationships were assessed at the
sub-construct level, thus making the findings more meaningful (for decision makers),
interesting (for future researchers), and complete.
As mentioned in the introduction, although supply chain responsiveness has been
studied in past researches, very few of them have provided empirical evidence (most of
211

8/13/2019 Competitive_advantage of a Firm Through Supply Chain Responsiveness and SCM Practices
http://slidepdf.com/reader/full/competitiveadvantage-of-a-firm-through-supply-chain-responsiveness-and-scm 230/294
the research being conceptual and case study based), and there is no comprehensive
research model in the context of supply chain responsiveness. In this research, the
developed research model considers the various practices between and within
organizations that are correlated with the responsiveness of the supply chain and
competitive advantage of a firm. The relationships between those practices and supply
chain responsiveness and competitive advantage, are tested based on the data collected
from 294 high level executives in the manufacturing field. The study contributes to our
knowledge of supply chain responsiveness in a number of ways as elaborated in sections
8.1.1 – 8.1.8 below:
8.1.1 Valid and Reliable Instrument for Supply Chain Responsiveness
Measurement
The study provides a valid and reliable measurement for the supply chain
responsiveness construct. The scale has been tested through rigorous statistical
methodologies including pretest, pilot-test using Q-sort method, confirmatory factor
analysis, unidimensionality, reliability, and validation of second-order construct. The
scale is shown to meet the requirements for reliability and validity and thus, can be used
in future research. Such a valid and reliable scale has been otherwise lacking in the
literature. The development of these measurements will greatly stimulate and facilitate
the theory development in this field.
212

8/13/2019 Competitive_advantage of a Firm Through Supply Chain Responsiveness and SCM Practices
http://slidepdf.com/reader/full/competitiveadvantage-of-a-firm-through-supply-chain-responsiveness-and-scm 231/294
8.1.2 Theoretical Framework
This research provides a theoretical framework that identifies the detailed
dimensions of supply chain responsiveness. This framework provides a foundation for
future research. In the future, new constructs may be added to provide an in-depth
understanding of supply chain responsiveness theory.
8.1.3 Tested Relationships at Construct Level
This study provides supporting evidences to the conceptual and prescriptive
literature about previously untested statements regarding the relationship between SCM
practices and supply chain responsiveness, as well as modularity based manufacturing
practices and supply chain responsiveness. The results demonstrate that a higher level of
modularity based manufacturing practices and SCM practices will lead to a higher level
of supply chain responsiveness on an aggregate basis. This finding supports Feitzinger
and Lee’s (1997) case study based argument that both effective SCM practices as well as
the modularity based manufacturing practices are essential and vital for attaining cost
effective responsiveness.
Further, this study also provides supporting evidences to the literature on the
relationships between SCM practices and competitive advantage (Li et al., 2006; Moberg
et al., 2002) as well as supply chain responsiveness and competitive advantage (Lummus
et al., 2003). The results demonstrate that a higher level of SCM practices and supply
chain responsiveness will lead to a higher level of competitive advantage for a firm.
213

8/13/2019 Competitive_advantage of a Firm Through Supply Chain Responsiveness and SCM Practices
http://slidepdf.com/reader/full/competitiveadvantage-of-a-firm-through-supply-chain-responsiveness-and-scm 232/294
8.1.4 Tested Relationships between Practices and Supply Chain Responsiveness at
Dimension Level
The empirical results of this study gave researchers a clear idea about the specific
SCM practice dimensions and modularity based manufacturing practice dimensions that
positively influence the responsiveness of supply chains on various dimensions. The
results indicate that ‘dynamic teaming’ and ‘process modularity’ practices were most
influential in increasing operations system responsiveness, supplier network
responsiveness, and the overall supply chain responsiveness. However, the study did not
find any relationship between product modularity and supply chain responsiveness. Also,
information sharing and effective relationships with customers and suppliers will directly
lead to higher levels of supply chain responsiveness. This finding supports prior literature
(ex: Frohlich and Westbrook, 2001; Clinton and Closs, 1997; Gunasekaran and Yusuf,
2002; Van Hoek et al., 2001; Handfield and Nichols, 2002). In addition, effective
relationships with customers and suppliers will positively influence a firm’s ability to be
operationally responsive to demand changes by customers. This finding is consistent with
Magretta’s (1998) case study analyses of Dell Corp. Also, effective relations with
suppliers, and quality and timely information sharing (as found by Lambert and Cooper
(2000) in their case study research) with trading partners in a supply chain were found to
directly and positively lead to increased supplier responsiveness. This result suggests that
organizations must select suppliers based on the potential for close long-term
relationships and which is in accordance with Choi and Hartley’s (1996) findings.
214

8/13/2019 Competitive_advantage of a Firm Through Supply Chain Responsiveness and SCM Practices
http://slidepdf.com/reader/full/competitiveadvantage-of-a-firm-through-supply-chain-responsiveness-and-scm 233/294
8.1.5 Tested Relationships between Practices and Supply Chain Responsiveness at
Item Level
The empirical results uncovered the critical and predominant practices (at the item
level) within the individual dimensions of ‘SCM practices’ and modularity based
manufacturing practices that increase supply chain responsiveness on a
composite/aggregate basis, as well as on a dimension level. The results reveal that the
practice of reassigning production teams to different production tasks is the most
important ‘dynamic teaming’ practice that increases the responsiveness of the
manufacturing system of a firm, as well as the overall supply chain responsiveness (on an
aggregate basis). Furthermore, the ability to adjust the production processes by adding
new process modules, and the ability of the production process modules to be rearranged
so that customization sub-processes occur last, are the two most important ‘process
modularity’ practices that increase the responsiveness of a firm’s suppliers, as well as the
overall supply chain responsiveness. The results also revealed that firms’ practice of
informing its trading partners of its changing needs in advance, and the practice by
trading partners of a firm (suppliers and customers), of keeping the firm fully informed
about issues that affect the firm’s business, are the two most important ‘information
sharing’ practices that positively impact the responsiveness of suppliers as well as the
overall supply chain responsiveness. In addition, the results uncovered that regularly
solving problems jointly with suppliers, and actively involving the key suppliers of a firm
in new product development processes, are the two predominant ‘strategic supplier
partnership’ practices that directly lead to a higher level of both supplier network
responsiveness, as well as overall supply chain responsiveness. Also, the research
215

8/13/2019 Competitive_advantage of a Firm Through Supply Chain Responsiveness and SCM Practices
http://slidepdf.com/reader/full/competitiveadvantage-of-a-firm-through-supply-chain-responsiveness-and-scm 234/294
identified the secondary practices, not as predominant as the practices mentioned above
but significantly instrumental in leading to higher levels of supply chain responsiveness
or its dimensions, as follows: while the practice of using production teams (in the plant)
that can be reorganized is the ‘dynamic teaming’ practice that improves the overall
supply chain responsiveness, the use of production team members that are capable of
working on different teams is the ‘dynamic teaming’ practice that increases the
responsiveness of the manufacturing/operations system. Further the results revealed that,
use of production process modules that can be adjusted for changing production needs,
and design of the production process as adjustable modules, are the two ‘process
modularity’ practices that improve the operations system responsiveness of a firm.
Furthermore, conducting continuous improvement programs by a firm that include its key
suppliers, is the ‘strategic supplier partnership’ practice that increases the overall supply
chain responsiveness. Finally, the results also indicate that the practices by a firm to
facilitate customers’ ability to seek assistance from the firm, and to frequently measure
and evaluate customer satisfaction, are the two ‘customer relationship’ practices that
positively impact supply chain responsiveness on an aggregate basis.
8.1.6 Tested Relationships between Practices / Supply Chain Responsiveness and
Competitive Advantage at Dimension Level
The empirical results of this study gave researchers an insight about the specific
SCM practice dimensions and supply chain responsiveness dimensions that positively
impact competitive advantage of a firm. The results show that ‘customer relationship’
and ‘strategic supplier partnership’ practices were most influential in increasing
216

8/13/2019 Competitive_advantage of a Firm Through Supply Chain Responsiveness and SCM Practices
http://slidepdf.com/reader/full/competitiveadvantage-of-a-firm-through-supply-chain-responsiveness-and-scm 235/294
competitive advantage on an aggregate basis. However, the study did not find any
relationship between information sharing and competitive advantage. Also, operations
system responsiveness and supplier network responsiveness will directly lead to higher
levels of competitive advantage. In addition, supplier network responsiveness and
operations system responsiveness will positively influence a firm’s ability to compete
based on delivery dependability.
8.1.7 Tested Relationships between Practices / Supply Chain Responsiveness and
Competitive Advantage at Item Level
The study uncovered the critical and predominant practices (at the item level)
within the individual dimensions of ‘SCM practices’ as well as the measures within the
individual dimensions of supply chain responsiveness that increase competitive
advantage. The results reveal that, firms’ practices of periodically evaluating the
importance of their relationship with their customers, facilitating customers’ ability to
seek assistance from them, and frequently interacting with customers to set reliability,
responsiveness, and other standards for the firm, are the most important ‘customer
relationship’ practices that positively influence the overall competitive advantage for a
firm (on an aggregate basis). Furthermore, regularly solving problems jointly with
suppliers and conducting continuous improvement programs by a firm that include its key
suppliers, are the two predominant ‘strategic supplier partnership’ practices that increase
the overall competitive advantage of a firm. The empirical results reveal that the ability
of the operations system of a firm to rapidly respond to changes in product volume
demanded by customers is the single most important measure of ‘operations system
217

8/13/2019 Competitive_advantage of a Firm Through Supply Chain Responsiveness and SCM Practices
http://slidepdf.com/reader/full/competitiveadvantage-of-a-firm-through-supply-chain-responsiveness-and-scm 236/294
responsiveness’ that increases the competitive advantage of a firm based on delivery
dependability, as well as on an aggregate basis. Finally, the ability of a firm’s major
suppliers to effectively expedite the firm’s emergency orders is the single most important
measure of ‘supplier network responsiveness’ that directly leads to higher levels of
overall competitive advantage of a firm.
8.1.8 Dimension Level Analyses for Competitive Advantage for High and Low
Levels of Supply Chain Responsiveness
The results reveal that competitive advantage of a firm differs significantly both
collectively and individually based on low price, high delivery dependability, high
product innovation, and low time to market, for high and low levels of operations system
responsiveness. That is, higher level of operations system responsiveness creates higher
level of competitive advantage for a firm, collectively on four dimensions – low price,
high delivery dependability, high product innovation, and low time to market - as well as
individually on each of the said dimensions. In the literature there have been arguments
on both direct as well as inverse relationship between responsiveness and cost/price. The
results of this research support Randall et al.’s (2003) argument about inverse
relationship, that firms with more responsive supply chains will be more adaptive to
demand fluctuations and will handle this uncertainty at a lower cost / price due to the
shorter lead time. To confirm the results of this study, the relationship between
responsiveness and cost/price can be studied in greater depth in future research. Yusuf et
al. (2003) found high correlation between the responsiveness and time to market,
dependability, product innovation, and quality. This research partially supports the
218

8/13/2019 Competitive_advantage of a Firm Through Supply Chain Responsiveness and SCM Practices
http://slidepdf.com/reader/full/competitiveadvantage-of-a-firm-through-supply-chain-responsiveness-and-scm 237/294
findings by Yusuf et al. (2003), as there was no support for the impact of operations
system responsiveness on the ability of a firm to compete based on quality.
Secondly, the results disclose that competitive advantage of a firm differs
significantly both collectively and individually based on low price and high delivery
dependability for high and low levels of supplier network responsiveness. That is, higher
level of supplier network responsiveness creates higher level of competitive advantage
for a firm, collectively on two dimensions – low price and high delivery dependability -
as well as individually on each of the said dimensions. However, there was no support for
the impact of supplier network responsiveness on the ability of a firm to compete based
on quality, product innovation, and time to market.
8.2 Implications for Practitioners
The results of this study have several important implications for practitioners.
First, as today’s competition is moving from among organizations to between
supply chains, more and more organizations are increasingly adopting SCM practices, in
the hope for securing competitive advantage. 36% of the respondents (106 / 294)
indicated that their firm has not embarked upon a program aimed specially at
implementing supply chain management. Of the remaining 64% of the respondents, over
55% (97/178)) indicated that their firm has embarked on a supply chain management
program for just three years or less. The findings of this research assure the practitioners
that SCM is an effective way of competing, and the implementation of SCM practices
does have a strong impact on supply chain responsiveness and competitive advantage of
the firm.
219

8/13/2019 Competitive_advantage of a Firm Through Supply Chain Responsiveness and SCM Practices
http://slidepdf.com/reader/full/competitiveadvantage-of-a-firm-through-supply-chain-responsiveness-and-scm 238/294
Second, in today’s fast paced global competition, organizations are in need of
greater responsiveness, so as to rapidly meet customer needs. Moreover, responsiveness
on all dimensions, namely, supply side, within the organization, and downstream is
needed for total responsiveness of the firm. Supply chain responsiveness has been poorly
defined and there is a high degree of variability (ranging from flexibility to agility) in
people’s mind about its meaning. The findings demonstrate to the practitioners the vital
components of responsiveness, and ways of achieving them.
Third, the study provides organizations a set of valid and reliable measurements
for evaluating, benchmarking, and comparing supply chain responsiveness at different
nodes within the supply chain (i.e. raw material supplier, component supplier, assembler,
sub-assembler, manufacturer, distributor, wholesaler, and retailer). The measurements
developed in this research can capture the different aspects of supply chain
responsiveness, thus not only enabling use by practitioners to identify the immediate
outcomes of it, but also to understand its impacts on organizational performance.
Fourth, the study provides predominant and specific SCM and modularity based
manufacturing practices that directly impact supply chain responsiveness on an aggregate
basis, as well as on one or more of its dimensions, and as elaborately discussed in the
summary of findings. Looking at the means (on a scale of 1 to 5, 5 being the maximum
level of practice) of the predominant practices (of the responding firms) that are
instrumental in increasing supply chain responsiveness, the study provides important
suggestions with regards to the scope of improvement on each of the significant practices,
in order to increase the supply chain responsiveness. The summary of key practices that
220

8/13/2019 Competitive_advantage of a Firm Through Supply Chain Responsiveness and SCM Practices
http://slidepdf.com/reader/full/competitiveadvantage-of-a-firm-through-supply-chain-responsiveness-and-scm 239/294
positively influence supply chain responsiveness and / or one or more of its dimensions,
is presented Table 8.2.1, in the increasing order of means.
Table 8.2.1 Scope for Improvement on Practice Levels Based on Means
Practice Mean Outcome
1.
Process Modularity practice of a firm, of rearranging
production process modules so that customization sub- processes occur last (PRM5)
2.8 SCR, SNR
2Process Modularity practice of a firm, of adjusting production
process by adding new process modules (PRM2)3.0 SCR, SNR
3Process Modularity practice of a firm, of designing the
production process as adjustable modules (PRM1)3.0 OSR
4Process Modularity practice of a firm, of using production process modules that can be adjusted for changing production
needs (PRM3)
3.1 OSR
5Dynamic Teaming practice of a firm, of using productionteams in the plant that can be re-organized (DT1)
3.1 SCR
6Strategic Supplier Partnership practice of a firm, of activelyinvolving its key suppliers in new product development
processes (SSP6)
3.2 SCR, SNR
7Information Sharing practice by trading partners of a firm, ofkeeping the firm fully informed about issues that affect the
firm’s business (IS3)
3.2 SCR, SNR
8Dynamic Teaming practice of a firm, of reassigning productionteams to different production tasks (DT3)
3.4 SCR, OSR
9Information Sharing practice of a firm, of informing its trading
partners of its changing needs in advance (IS1)3.4 SCR, SNR
10Dynamic Teaming practice of a firm, of using production team
members that are capable of working on different teams (DT5)3.5 OSR
11
Strategic Supplier Partnership practice of a firm, of conducting
continuous improvement programs that include its keysuppliers (SSP4)
3.6 SCR
12Customer Relationship practice of a firm, of frequently
measuring and evaluating customer satisfaction (CR2)
3.9 SCR
13Strategic Supplier Partnership practice of a firm, of regularly
solving problems jointly with its suppliers (SSP2)4.1 SCR, SNR
14Customer Relationship practice of a firm, of facilitating
customers’ ability to seek assistance from the firm (CR4)4.1 SCR
221
8/13/2019 Competitive_advantage of a Firm Through Supply Chain Responsiveness and SCM Practices
http://slidepdf.com/reader/full/competitiveadvantage-of-a-firm-through-supply-chain-responsiveness-and-scm 240/294
Table 8.2.1 draws important implications in terms of improvement on current
levels of practices by a firm, so as to increase supply chain responsiveness. It can thus be
implied that the current mean levels of the practices of rearranging production process
modules so that customization sub-processes occur last (2.8), and adjusting production
processes by adding new process modules (3.0), suggest large scope for improvement of
these ‘process modularity’ practices so as to increase both, the responsiveness of a firm’s
suppliers, and the overall supply chain responsiveness. Similarly, the current mean levels
of ‘process modularity’ practices of designing the production process as adjustable
modules (3.0), and using production process modules that can be adjusted for changing
production needs (3.1), suggest large scope for improvement, so as to further enhance
operations system responsiveness. In the similar fashion, Table 8.2.1 may be used to
draw practical implications on the scope for improvement on the remaining practices, in
order to attain increased supply chain responsiveness.
Fifth, the study provides predominant and specific SCM practices and supply
chain responsiveness criteria that directly impact competitive advantage of a firm, and as
elaborately discussed in the summary of findings. Looking at the means (on a scale of 1
to 5, 5 being the maximum level) of the predominant practices / measures of
responsiveness (of the responding firms), that are instrumental in increasing competitive
advantage of the firm, the study provides important suggestions with regards to the scope
of improvement on each of the significant practices / measures of responsiveness, in
order to improve competitive advantage. The summary of key practices / supply chain
responsiveness criteria that positively influence competitive advantage is presented Table
8.2.2, in the increasing order of means.
222

8/13/2019 Competitive_advantage of a Firm Through Supply Chain Responsiveness and SCM Practices
http://slidepdf.com/reader/full/competitiveadvantage-of-a-firm-through-supply-chain-responsiveness-and-scm 241/294
Table 8.2.2 Scope for Improvement on Practice / Supply Chain Responsiveness
Criterion Levels Based on Means
Practice / SCR criterion Mean Outcome
1.
The ability of the operations system of a firm to rapidly
respond to changes in product volume demanded bycustomers (OSR1)
3.5
CA, Delivery
Dependability
2The ability of a firm’s major suppliers to effectively expeditethe firm’s emergency orders (SNR6)
3.5Delivery
Dependability
3
Strategic Supplier Partnership practice of a firm, of
conducting continuous improvement programs that includeits key suppliers (SSP4)
3.6 CA
4
Customer Relationship practice of a firm, of periodically
evaluating the importance of its relationship with its
customers (CR5)
4.0 CA
5
Customer Relationship practice of a firm, of frequent
interaction with its customers to set reliability,responsiveness, and other standards for the firm (CR1)
4.0 CA
6Customer Relationship practice of a firm, of facilitating
customers’ ability to seek assistance from the firm (CR4)4.1 CA
7Strategic Supplier Partnership practice of a firm, of regularlysolving problems jointly with its suppliers (SSP2)
4.1 CA
Table 8.2.2 draws important implications in terms of improvement on current
levels of practices / supply chain responsiveness criteria by a firm, so as to increase
competitive advantage. It can thus be implied that the current mean levels of the ability of
the operations system of a firm to rapidly respond to changes in product volume
demanded by customers (3.5), suggests reasonable scope for improvement, so as to
improve both, the competitive advantage of the firm based on delivery dependability, as
well as on a composite basis. Similarly, the current mean level of the ability of a firm’s
major suppliers to effectively expedite the firm’s emergency orders (3.5), suggests
reasonable scope for improvement, so as to improve the competitive advantage of the
firm based on delivery dependability. In the similar fashion, Table 8.2.2 may be used to
223
8/13/2019 Competitive_advantage of a Firm Through Supply Chain Responsiveness and SCM Practices
http://slidepdf.com/reader/full/competitiveadvantage-of-a-firm-through-supply-chain-responsiveness-and-scm 242/294
draw practical implications on the scope for improvement on the remaining practices, in
order to attain increased competitive advantage.
Sixth, the research provides evidence to practitioners that by increasing the firms’
operations system responsiveness, organizations can increase their capability to compete
both collectively as well as individually based on low price, high delivery dependability,
high product innovation, and low time to market. The study also provides evidence to
practitioners that by increasing the firms’ supplier network responsiveness, organizations
can increase their capability to compete both collectively as well as individually based on
low price, and high delivery dependability. This shall encourage firms, in this ever
competitive business world, to boost their responsiveness, so as to attain higher
competitive advantage, and stay ahead in business.
8.3 Implications for Researchers
First, the study provides inferences made from an instrument that is valid and
reliable for the current study’s context for evaluating the level of supply chain
responsiveness, and tests the construct with the outcome - competitive advantage - of the
firm. Although several previous studies discussed the responsiveness of firms, they were
oriented toward customer responsiveness at a firm level. The instrument developed in this
research captures three important aspects of supply chain responsiveness – operations
system responsiveness, logistics process responsiveness, and supplier network
responsiveness. Since practices are designed to achieve efficiency and responsiveness,
the new instrument shall provide better guideline for researchers in the SCM area, and
thus, can be considered as a strategic management tool.
224

8/13/2019 Competitive_advantage of a Firm Through Supply Chain Responsiveness and SCM Practices
http://slidepdf.com/reader/full/competitiveadvantage-of-a-firm-through-supply-chain-responsiveness-and-scm 243/294
Second, the study takes a look at the supply chain responsiveness at the firm level,
by measuring the extent of a firm’s ability on various dimensions to address changes in
customer demand. The concept of supply chain responsiveness is difficult to measure;
however, the degree to which demand changes are addressed at various nodes of a firm
(viz: upstream, within the firm, and downstream) can be used as an indirect measure of
this concept. This measure is useful to researchers who are interested in measuring supply
chain responsiveness but cannot specify a sampling frame of the supply chain. Measuring
supply chain responsiveness at the firm level provides an alternate way to study supply
chain outcomes.
Third, the study provides a research framework that identifies positive and
significant relationships between SCM practices, modularity based manufacturing
practices, supply chain responsiveness, and competitive advantage. This framework
(Figure 6.4) provides a foundation and insight for future researchers in the area of supply
chain responsiveness.
8.4 Limitations of the Research
This research has extended past research in several ways, by building on past
theoretical and empirical studies. Although this research has significant contributions
from both theoretical and practical point of views, it also has some limitations, which are
described below. The examination of those limitations will assist future researchers to
work around them.
First, due to the limited number of observations (294), the revalidation of
constructs was not carried out in this research. This needs to be addressed in future
225

8/13/2019 Competitive_advantage of a Firm Through Supply Chain Responsiveness and SCM Practices
http://slidepdf.com/reader/full/competitiveadvantage-of-a-firm-through-supply-chain-responsiveness-and-scm 244/294
research. New mailing lists and research methods can be used to improve the response
rate.
Second, in this research, individual respondents (high level executives from
purchasing, operations, materials, and logistics functions) in an organization were asked
to respond to complex SCM issues dealing with all the participants along the supply
chain, including upstream suppliers and downstream customers. However, no person in
an organization is in charge of the entire supply chain: for example, purchasing managers
are mainly responsible for purchasing and supply side, and may be not in an appropriate
position to answer the customer-related questions; the main area of manufacturing
managers is production and they may not have enough knowledge of their suppliers and
customers; similarly materials managers are mainly responsible for inventory and
materials management, and they may not have enough knowledge of their customer.
Therefore, the use of single respondent may generate some measurement inaccuracy.
Third, the response rate of 5.35%, even though comparable to similar studies, is
considered low. Future research questionnaires may be directed through the top
management (captive audience) to ensure higher response rates. The survey may also be
endorsed by leading educational institutes / professional organizations / practitioners’
councils and the like to guarantee higher response rates.
Fourth, the study is limited to the industries (SIC codes – 22, 23, 25, 34, 35, 36,
37) used for this research. This could limit generalizability of results to other industry
types. Future research can extended / replicate the study for other industry types to
enhance generalizability. Recommendations for future research will follow.
226

8/13/2019 Competitive_advantage of a Firm Through Supply Chain Responsiveness and SCM Practices
http://slidepdf.com/reader/full/competitiveadvantage-of-a-firm-through-supply-chain-responsiveness-and-scm 245/294
8/13/2019 Competitive_advantage of a Firm Through Supply Chain Responsiveness and SCM Practices
http://slidepdf.com/reader/full/competitiveadvantage-of-a-firm-through-supply-chain-responsiveness-and-scm 246/294
Fifth, future research should consider other relevant factors not considered in this
research. In the same regard additional dimensions of supply chain responsiveness such
assembly responsiveness and inbound logistics responsiveness can be examined. Also
additional SCM practices such as postponement and outsourcing can be examined. These
factors will bring more important insights into the indirect effects of product modularity
on supply chain responsiveness (that we found to be not significant), via postponement.
Future research should also examine in detail the effects of various practices not
considered in this research on logistics process responsiveness, and further the effects of
logistics process responsiveness on other dimensions of competitive advantage not
considered in this research.
Sixth, future research can study SCM issues at the supply chain level. Taking a
complete supply chain as an example, it is of interest to investigate the various practices
and mechanisms governing this supply chain, and how the SCM practices differ across
supply chains operating in different industries (ex: electronic and computer, heavy
machinery manufacturing, fashion and apparel, and consumer goods). Moreover,
comparisons can be made between supply chains to identify the strength and weakness of
each supply chain and also the best common SCM practices across the supply chain.
Further recommendations can, thus, be made to improve the overall responsiveness of the
whole supply chain.
Seventh, future research can expand the current theoretical framework by
integrating new constructs from within and outside the field. For example, it will be
interesting to study the effect of mass customization on supply chain responsiveness,
indirect effect of modularity based manufacturing practices on supply chain
228
8/13/2019 Competitive_advantage of a Firm Through Supply Chain Responsiveness and SCM Practices
http://slidepdf.com/reader/full/competitiveadvantage-of-a-firm-through-supply-chain-responsiveness-and-scm 247/294
responsiveness via mass customization. Also the study of direct and indirect (via
competitive advantage) impact of supply chain responsiveness on organizational
performance shall give the researchers interesting findings. Furthermore, it will be
interesting to study the effect of environmental factors / uncertainty, and electronic
commerce on supply chain responsiveness as well.
Eighth, canonical correlation can be used in future research to test the
simultaneous relationship between the three measures of supply chain responsiveness
with five measures of competitive advantage. Such an analysis shall provide more insight
into and easy interpretation of the various relationships pertaining to competitive
advantage of a firm. Canonical correlation analysis may also be used to test the
simultaneous relationships between the SCM practices / modularity based practices and
the three measures of supply chain responsiveness. By performing canonical correlation
analysis in the future work shall enhance the quality of this research from a
methodological point.
229
8/13/2019 Competitive_advantage of a Firm Through Supply Chain Responsiveness and SCM Practices
http://slidepdf.com/reader/full/competitiveadvantage-of-a-firm-through-supply-chain-responsiveness-and-scm 248/294
REFERENCES
Abair, R. A. (1997), “Agile Manufacturing: Successful Implementation Strategies”,
Annual International Conference Proceedings – American Production and Inventory
Control Society, pp. 218-219.
Academic Alliance Forum (1999), “Future Competition: Supply Chain Vs Supply
Chain”, Logistics Management and Distribution Report, 38(3), pp. 20-22.
Aggarwal, S. (1997), “Flexibility Management: the Ultimate Strategy”, Industrial
Management, 39(1), pp.26-31.
Ahire, S. L., Golhar, D. Y., and Waller, M. A. (1996), “Development and Validation of
TQM Implementation Constructs”, Decision Sciences, 27(1), pp. 23-56.
Aitken, J., Christopher, M., and Towill, D. (2002), “Understanding, Implementing and
Exploiting Agility and Leanness”, International Journal of Logistics: Research andApplications, 5(1), pp. 59-74.
Allnoch, A. (1997), “Efficient Supply Chain Practices Mean Big Savings to Leading
Manufacturers”, IIE Solutions, 29(7), pp. 8-9
Alvarado, U. Y. and Kotzab, H. (2001), “Supply Chain Management: The Integration of
Logistics in Marketing”, Industrial Marketing Management, 30(2), pp. 183–98.
Andel, T. (1997), “Information Supply Chain: Set and Get Your Goals”, Transportation
and Distribution, 38(2), pp. 33.
Anderson, D. and Lee, H. (2000), “Synchronized Supply Chains: The New Frontier”,
www.ascet.net/ascet/wp/wpAnderson.html
Anderson, J. C., Hakansson, H., and Johanson, J. (1994), “Dyadic Business Relationships
within A Business Network Context”, Journal of Marketing, 58(4), pp. 1-15.
Andries, B.L. and Gelders, L. (1995), "Time-Based Manufacturing Logistics", Logistics
Information Management, 8(6), pp. 25-31.
Aquilano, N. J., Chase, R. B., and Davis, M. M. (1995), Fundamentals of Operations
Management, Irwin, Chicago, IL
Araujo, L., Dubois, A., and Gadde, L. E. (1999), “Managing Interfaces with Suppliers”,
Industrial Marketing Management, 28, pp. 497-506.
Arogyaswamy, B. and Simmons, R. P. (1993), Value-Directed Management:
Organizations, Customers, and Quality, Quorum Books, Westport, CT.
230
8/13/2019 Competitive_advantage of a Firm Through Supply Chain Responsiveness and SCM Practices
http://slidepdf.com/reader/full/competitiveadvantage-of-a-firm-through-supply-chain-responsiveness-and-scm 249/294
Aron, A. and Aron, E. N. (1999), Statistics for Psychology (2nd ed.), Upper Saddle
River, Prentice Hall, NJ
Bagozzi, R. P., Phillips, L. W. (1982), “Representing and Testing Organizational
Theories: A Holistic Construal”, Administrative Science Quarterly, 27(3), pp. 459-489.
Baldwin, C. Y. and Clark, K. B. (1997), “Managing in an Age of Modularity”, Harvard
Business Review, 75(5), pp. 84-93.
Baldwin, C. Y. and Clark, K. B. (2000), Design Rules: The Power of Modularity, MIT
Press, Boston, MA.
Ballou, R. H., Gillbert, S. M., and Mukherjee, A. (2000), “New Managerial Challenge
from Supply Chain Opportunities”, Industrial Marketing Management, 29, pp. 7-18.
Balsmeier, P. W. and Voisin, W. (1996), “Supply Chain Management: a Time-Based
Strategy”, Industrial Management, 38(5), pp. 24-27.
Banfield, E. (1999), Harnessing Value in the Supply Chain, Wiley, New York, NY.
Barney, J. (1991), “Firm Resources and Sustained Competitive Advantage”, Journal of
Management, 17(1), pp. 99-120.
Bechtel, C. and Jayaram, J. (1997), “Supply Chain Management: A Strategic
Perspective”, International Journal of Logistics Management, 8(1), pp. 15–34.
Bensaou, M. (1999), “Portfolios of Buyer-Supplier Relationships”, Sloan ManagementReview, 40(4), pp. 35-44.
Bleeke, J. and Ernst, D. (1991), “The Way To Win In Cross-Border Alliances”, HarvardBusiness Review, 69(6), pp. 127-135.
Boddy, D., Cahill, D., Charles, M., Fraser-Kraus, H., and Macbeth, D. (1998), “Success
and Failure in Implementing Partnering”, European Journal of Purchasing and SupplyManagement, 4(2/3), pp. 143-151
Boddy, D., Macbeth, D., and Wagner, B. (2000), “Implementing Collaboration betweenOrganizations: An Empirical Study of Supply Chain Partnering”, Journal of Management
Studies, 37(7), pp. 1003-1018.
Bogozzi, R. P. (1980), A Causal Model in Marketing, Wiley, New York
Bommer, M., O’Neil, B. and Treat, S. (2001), “Strategic Assessment of the Supply ChainInterface: a Beverage Industry Case Study”, International Journal of Physical Distribution
and Logistics Management, 31(1), pp.11-25.
231
8/13/2019 Competitive_advantage of a Firm Through Supply Chain Responsiveness and SCM Practices
http://slidepdf.com/reader/full/competitiveadvantage-of-a-firm-through-supply-chain-responsiveness-and-scm 250/294
Bowersox, D.J. and Closs, D.J. (1996), Logistical Management: The Integrated Supply
Chain Process, McGraw-Hill.
Bowersox, D.J., Closs, D.J., and Stank, T.P. (1999), 21st Century Logistics: Making
Supply Chain Integration a Reality, The Council of Logistics Management, Oak Brook,
IL.
Bradley, P. (1997), “Adapt or Die”, Logistics Management, 36(10), pp. 11-12.
Browne, J., Dubois, D., Rathmill, K., Sethi, S., and Stecke, K. (1984), “Classification of
FMS”, FMS Magazine, 2(22), pp. 114-117.
Browne, M. W. and Cudeck, R. (1993), “Alternative Ways of Assessing Model Fit”, In
K. A. Bollen and J. S. Long (Eds.), Testing Structural Equation Models (pp. 445-455),
Sage Publication, Newbury Park, CA.
Burt, D. N. and Soukup, W. R. (1985), “Purchasing’s Role in New ProductDevelopment”, Harvard Business Review, 63, pp. 90–97
Chase, R. B., Aquilano, N. J., and Jacobs, R. (2000), Operations Management for
Competitive Advantage, Irwin / McGraw-hill, Boston, MA.
Chen, I. J. and Paulraj, A. (2004), “Towards A Theory of Supply Chain Management:
The Constructs and Measurements”, Journal of Operations Management, 22(2), pp. 119-
50.
Chen, I. J. and Paulraj, A. (2004), “Understanding Supply Chain Management: CriticalResearch and a Theoretical Framework”, International Journal of Production Research,
42(1), pp. 131-163.
Childhouse, P. and Towill, D. R. (2003), “Simplified Material Flow Holds the Key to
Supply Chain Integration”, OMEGA, 2003, 31(1), pp. 17–27.
Choi T.Y. and Hartley J.L. (1996), “An Exploration of Supplier Selection PracticesAcross the Supply Chain”, Journal of Operations Management, 14(4), pp. 333-343.
Christine, F. (1997), “Manufacturer-Retailer Relationships in the Food and DrinkIndustry: Strategies and Tactics in the Battle for Power”, Financial Times Retail and
Consumer Publications, UK.
Christopher, M. (1998), Logistics and Supply Chain Management, 2nd
Ed., Financial
Times/Prentice Hall, New York, NY
Christopher, M. (1998), Logistics and Supply-Chain Management: Strategies for
Reducing Cost and Improving Service, Prentice-Hall, London.
232

8/13/2019 Competitive_advantage of a Firm Through Supply Chain Responsiveness and SCM Practices
http://slidepdf.com/reader/full/competitiveadvantage-of-a-firm-through-supply-chain-responsiveness-and-scm 251/294
Christopher, M. (2000), “The Agile Supply Chain”, Industrial Marketing Management,
29(1), pp. 37-44.
Christopher, M. and Peck, H. (2004), “Building the Resilient Supply Chain”,
International Journal of Logistics Management, 15(2), pp. 1-13.
Christopher, M. G. (1992), Logistics and Supply Chain Management, Pitman Publishing,
London, UK.
Christopher, M., Lowson, R., and Peck, H. (2004), “Creating Agile Supply Chains in the
Fashion Industry”, International Journal of Retail & Distribution Management, 32(8/9),
pp. 367-376.
Churchill, G. A. (1979), “A Paradigm for Developing Better Measures of Marketing
Constructs”, Journal of Marketing Studies, Vol. 16, pp. 12-27.
Cigolini, R., Cozzi, M., and Perona, M. (2004), “A New Framework for Supply ChainManagement: Conceptual Model and Empirical Test”, International Journal of Operations
and Production Management, 24(1), pp. 7–14.
Clark, K. B. (1989), “Project Scope and Project Performance: The Effect of Parts”,
Management Science, 35(10), pp. 1247-1264.
Clark, K. B. and Fujimoto, T. (1991), Product Development Performance, Harvard
University Press, Boston, MA
Claycomb, C., Droge, C., and Germain, R. (1999), “The Effect of Just-in-Time withCustomers on Organizational Design and Performance”, International Journal of
Logistics Management, 10(1), pp. 37-58.
Cleveland, G., Schroeder, R. G., and Anderson, J. C. (1989), “A Theory of Production
Competence”, Decision Science, 20(4), pp. 655-668.
Clinton, S. R. and Closs, D. J. (1997), “Logistics Strategy: Does It Exist?”, Journal ofBusiness Logistics, 18(1), pp. 19-44.
Cohen, J. (1960), “A Coefficient of Agreement for Nominal Scales”, Educational andPsychological Measurement, Spring, pp.37-46.
Cohen, J. (1988), “Statistical Power Analysis for the Behavioral Sciences (2nd ed.),Lawrence Erlbaum, Hillsdale, NJ
Cohen, J. (1990), “Things I Have Learned (So Far)”, American Psychologist (12), pp.1304-1312.
233

8/13/2019 Competitive_advantage of a Firm Through Supply Chain Responsiveness and SCM Practices
http://slidepdf.com/reader/full/competitiveadvantage-of-a-firm-through-supply-chain-responsiveness-and-scm 252/294
Cooper, E. (1999), “Modular Assembly Lines Are Taking Over”, Machine Design,
71(19), pp. 97-102.
Cooper, M. and Gardner, J. (1993), “Good Business Relationships: More than Just
Partnerships or Strategic Alliances”, The International Journal of Physical Distribution
and Logistics Management, 23(6), pp. 4-26.
Cooper, M. C. and Ellram, L. M. (1993), “Characteristics of Supply Chain Management
and the Implications for Purchasing and Logistics Strategy”, International Journal ofLogistics Management, 4, pp. 13–24.
Cooper, M. C., Lambert, D. M., and Pagh, J. D. (1997), "Supply Chain Management:More Than a New Name for Logistics". The International Journal of Logistics
Management, 8(1), pp. 1-14.
Coronado, A. E., Lyons, A. C., Kehoe, D. F., and Coleman, J. (2004), “Enabling Mass
Customization: Extending Build-To-Order Concepts to Supply Chains”, ProductionPlanning & Control, 15(4), pp. 398-411.
Council of Supply Chain Management Professionals, www.cscmp.org
Coyne, K. P. (1986), “Sustainable Competitive Advantage-What It Is, What It Isn't”,Business Horizons, 29(1), pp. 54-61
Cronbach, L. J. (1951), “Coefficient Alpha and the Internal Structure of Tests”,Psychometrika, 16, pp. 297-335.
Croom, S., Romano, P., and Giannakis M. (2000), “Supply Chain Management: An
Analytical Framework for Critical Literature Review”, European Journal of Purchasing
and Supply Management, 6(1), pp. 67–83.
Croxton, K. L., Garcia-Dastugue, S. J., Lambert, D. M., and Rogers, D. S. (2001), “The
Supply Chain Management Processes”, The International Journal of Logistics
Management, 12(2), pp. 13-36.
Cunningham, J. (1996), "Designing Flexible Logistics Systems: A Review of Some
Singaporean Examples", Logistics Information Management, 9(2), pp. 40-48.
D' Souza, D. E. and Williams, F. P. (2000), “Toward A Taxonomy of Manufacturing
Flexibility Dimensions”, Journal of Operations Management, 18(5), pp. 577-593.
Daft, R. L. and Lewin, A. Y. (1993), “Where are the Theories for the "New"
Organizational Forms? An Editorial Essay”, Organization Science: A Journal of theInstitute of Management Sciences, 4(4), pp. 513-519.
234

8/13/2019 Competitive_advantage of a Firm Through Supply Chain Responsiveness and SCM Practices
http://slidepdf.com/reader/full/competitiveadvantage-of-a-firm-through-supply-chain-responsiveness-and-scm 253/294
Daugherty, P., Gennain, R., and Droge, C. (1996), "Predicting EDI Technology Adoption
in Logistics Management: The Influence of Context and Structure", Logistics andTransportation Review. 31(4), pp. 309-324.
Davenport, T. H., Harris, J. G., De Long, D. W., and Jacobson, A. L. (2001), “Data to
Knowledge to Results: Building an Analytic Capability”, California ManagementReview, 43(2), pp. 117-139.
Day, G. S. (1994), "The Capabilities of Market-Driven Organizations," Journal ofMarketing, 58(4), pp. 37-52.
Day, G. S. (2000), “Managing Market Relationships”, Journal of the Academy ofMarketing Science, 28(1), pp. 24–30.
Day, G. S. and Wensley, R. (1988), “Assessing Advantage: A Framework for DiagnosingCompetitive Superiority”, Journal of Marketing, 52(2), pp. 1-20.
De Groote, X. (1994), “The Flexibility of Production Processes: A General Framework”,
Management Science, 1994, 40(7), pp. 933-945.
De Toni, A. and Nassimbeni, G. (1999), “Buyer–supplier operational practices, sourcing
policies and plant performance: result of an empirical research”, International Journal ofProduction Research, 37, pp. 597–619.
Doherty, K. (1998), “The Faster Freight Moves the Better off We Are”, Food Logistics,October, pp. 105-110.
Doll, W. J., Ragu-nathan, T., Lim, S. J. and Gupta, Y. P (1995), “A Confirmatory Factor
Analysis of the User Information Satisfaction Instrument”, Information Systems
Research, 6(2), pp. 177-188.
Donlon, J. P. (1996), “Maximizing Value in the Supply Chain”, Chief Executive, 117, pp.
54-63.
Dowlatshahi, S. (1998), “Implementing Early Supplier Involvement: A Conceptual
Framework”, International Journal of Operations and Production Management, 18, pp.
143–167.
Dowlatshahi, S. (2000), “Designer–Buyer–Supplier Interface: Theory versus Practice”,
International Journal of Production Economics, 63, pp. 111–130.
Drucker, P. F. (1990), “The Emerging Theory of Manufacturing”, Harvard Business
Review, 68(3), pp. 94-102.
D'Souza, D. E. (2002), “Toward an Understanding of How Organizations Create
Manufacturing Flexibility”, Journal of Managerial Issues, 14(4), pp. 470-486
235
8/13/2019 Competitive_advantage of a Firm Through Supply Chain Responsiveness and SCM Practices
http://slidepdf.com/reader/full/competitiveadvantage-of-a-firm-through-supply-chain-responsiveness-and-scm 254/294
Duclos, L. K.., Vokurka, R. J., and Lummus, R. R. (2003), “A Conceptual Model ofSupply Chain Flexibility”, Industrial Management & Data Systems, 103(6), pp. 446-456.
Dwyer, F. R., Schurr, P. and Sejo, O. (1987), “Developing Buyer-Seller Relationships”,
Journal of Marketing, 51, pp. 11-27.
Eisenhardt, K. M. and Brown, S. L. (1998), “Time Pacing: Competing In Markets That
Won’t Stand Still”, Harvard Business Review, 76(2), pp. 59-69.
Eisenhardt, K. M. and Tabrizi, B. N. (1994), “Accelerating Adaptive Processes: Product
Innovation in the Global Computer Industry”, Administrative Science Quarterly, 40, pp.84–110.
Ellinger, A. E. (2000), “Improving Marketing/Logistics Cross-Functional Collaborationin Supply Chain”, Industrial Marketing Management, 29, pp. 85-96.
Ellram, L. M. (1990), “The Supplier Selection Decision in Strategic Partnerships”,
Journal of Purchasing and Materials and Management, Fall, pp. 8–14.
Ellram, L. M. (1991), “Supply Chain Management: The Industrial Organization
Perspective”, International Journal of Physical Distribution and Logistics Management,21(1), pp. 13-22.
Ellram, L. M. and Cooper M. C. (1990), “Supply Chain Management, Partnerships, andthe Shipper-Third-Party Relationship”, The International Journal of Logistics
Management, 1(2), pp. 1-10.
Emerson, C. and Grimm, C. (1998), "The Relative Importance of Logistics and
Marketing Customer Service: A Strategic Perspective”, Journal of Business Logistics,19(1), pp. 17-32.
Ernst, R. and Kamrad, B. (2000), “Evaluation of Supply Chain Structures Through
Modularization and Postponement” European Journal of Operational Research, 124(3), pp. 495–510.
Evans, D. H. (1963), “Modular Design: A Special Case in Nonlinear Programming”,Operations Research, 11, pp. 637-643.
Fawcett, S. E. (1992), “Strategic Logistics in Coordinated Global ManufacturingSuccess”, International Journal of Production Research, 30(5), pp. 1081-2000.
Fawcett, S. E. and Smith, S. R. (1995), “Logistics Measurement and Performance forUnited States-Mexican Operations under NAFTA”, Transportation Journal, 34(3), pp. 25-
34.
236

8/13/2019 Competitive_advantage of a Firm Through Supply Chain Responsiveness and SCM Practices
http://slidepdf.com/reader/full/competitiveadvantage-of-a-firm-through-supply-chain-responsiveness-and-scm 255/294
Fawcett, S. E., Calantone, R., and Smith, S. R. (1996), “An Investigation of the Impact of
Flexibility on Global Reach and Firm Performance”, Journal of Business Logistics, 17(2), pp. 168-196.
Feitzinger, E. and Lee, H. L. (1997), “Mass Customization at Hewlett-Packard: The
Power of Postponement”, Harvard Business Review, 75(1), pp. 116-121.
Feldmann, M. and Muller, S. (2003), “An Incentive Scheme for True Information
Providing In Supply Chains”, OMEGA, 2003, 31(2), pp. 63–73.
Ferrin, B. (1994), "Planning Just-In-Time Supply Operations: A Multiple-Case
Analysis", Journal of Business Logistics, 15(1), pp. 53-69.
Fisher M.L., Raman A., and Mcclelland A.S. (2000), “Rocket Science Retailing is
Almost Here: Are You Ready?”, Harvard Business Review, 78(4), pp. 115-124.
Fisher, M. L. (1997), “What Is the Right Supply Chain for Your Product?”, HarvardBusiness Review, 75(2), pp. 105-116.
Ford, D. (1990), Understanding Business Markets: Interaction, Relationships and
Networks, Academic Press, London.
Frohlich, M.T. and Westbrook, R. (2001), “Arcs of Integration: An International Study of
Supply Chain Strategies”, Journal of Operations Management, 19(2), pp. 185-200.
Fulconis, F. and Paché, G. (2005), “Exploiting SCM as Source of Competitive
Advantage: The Importance of Cooperative Goals Revisited”, Competitiveness Review,15(2), pp. 92-100.
Fuller, J. B., O’Conner, J., and Rawlinson, R. (1993), “Tailored Logistics: The NextAdvantage”, Harvard Business Review, 71(3), pp. 87-98.
Galunic, D. C. and Eisenhardt, K. M. (2001), “Architectural Innovation and Modular
Corporate Forms”, Academy of Management Journal, 44(6), pp. 1229-1249.
Garg, A. and Tang, C. (1997), "On Postponement Strategies for Product Families with
Multiple Points of Differentiation", IEE Transactions, 29, pp. 641-650
Garud, R. and Kumaraswamy, A. (1995), “Technological and Organizational Designs for
Realizing Economies of Substitution”, Strategic Management Journal, 16 (Special Issue), pp. 93-110
Gattorna, J. L. (Ed.) (1998), Strategic Supply Chain Alignment, Gower, Aldershot.
237
8/13/2019 Competitive_advantage of a Firm Through Supply Chain Responsiveness and SCM Practices
http://slidepdf.com/reader/full/competitiveadvantage-of-a-firm-through-supply-chain-responsiveness-and-scm 256/294
Gerbing, D. W. and Anderson, J. C. (1988), “Evaluating Structural Equation Methods,
Number of Indicators per Factor, and Improper Solutions on Structural EquationModeling Fit Indices”, Structural Equation Modeling, 2(2), pp. 119-144
Germain, R. (1989), “Output Standardization and Logistical Strategy, Structure and
Performance”, International Journal of Physical Distribution and Logistics Management,19(1), pp. 21-29.
Gerwin, D. (1987), "An Agenda for Research on the Flexibility of ManufacturingProcesses", International Journal of Operations and Production Management, 7(1), pp.
38-49.
Gerwin, D. (1993), “Manufacturing Flexibility: A Strategic Perspective”, Management
Science, 39, pp. 395-409.
Ghosh A. K., Benoy, W. J., Gardener, J. T., and Thach, S. V. (1997), “Antecedents,
Outcomes, and Moderating Influences on Industrial Distributors’ Satisfaction withSupplier Relationships”, Journal of Marketing Theory and Practice, 5(4), pp. 58-67.
Giannocearo, L. And Pontrandolfo, P. (2002), “Inventory Management in Supply Chains:
A Reinforcement Learning Approach”, International Journal of Production Economics,
78(2), pp.153-161.
Gibson, B. J., Mentzer, J. T., and Cook, R. L. (2005), “Supply Chain Management: The
Pursuit of a Consensus Definition”, Journal of Business Logistics, 26(2), pp. 17-25.
Gilbert, F W., Young, J. A., and O’Neal, C. R. (1994), “Buyer– Seller Relationships inJust-In-Time Purchasing Environments”, Journal of Business Research, 29(2), pp. 111-
120.
Goldman, S., Nagel, R., and Preiss, K. (1994), Agile competitive strategies, Agility
Forum, Bethlehem, PA
Goldman, S., Nagel, R., and Preiss, K. (1995), Agile Competitors and Virtualorganisations: Strategies for Enriching the Customer, Van Nostrand Reinhold, New York,
NY.
Gosain, S., Malhotra, A., and El Sawy, O. A. (2004), “Coordinating for Flexibility in e-
Business Supply Chains”, Journal of Management Information Systems, 21(3), pp. 7-45.
Gould, P. (1997), “What is Agility”, Manufacturing Engineer, 76(1), pp. 28-31.
Gray, J. L. and Harvey, T. W. (1992), Quality Value Banking: Effective ManagementSystems that Increase Earnings, Lower Costs, and Provide Competitive Customer
Service, Wiley, New York, NY.
238

8/13/2019 Competitive_advantage of a Firm Through Supply Chain Responsiveness and SCM Practices
http://slidepdf.com/reader/full/competitiveadvantage-of-a-firm-through-supply-chain-responsiveness-and-scm 257/294
Greene, A. H. (1991), "Supply Chain of Customer Satisfaction", Production and
Inventory Management Review and APICS News, 11(4), pp. 24-25.
Gunasekaran, A. and Yusuf, Y. Y. (2002), “Agile Manufacturing: A Taxonomy of
Strategic and Technological Imperatives”, International Journal of Production Research,
40(6), pp. 1357-1385.
Gunasekaran, A., Patel, C., and Tirtiroglu, E. (2001), “Performance Measures and
Metrics in a Supply Chain Environment”, International Journal of Operations andProduction Management, 21(1/2), pp. 71-87.
Gupta, A. K. and Souder, W. E. (1998), “Key Drivers of Reduced Cycle Time”, ResearchTechnology Management, pp. 38-43.
Gupta, D. and Buzacott, J. A. (1996), “A 'Goodness Test' For Operational Measures ofManufacturing Flexibility”, International Journal of Manufacturing Systems, 8, pp. 233-
245.
Gupta, Y. and Somers, T. M. (1992), “Measurement of Manufacturing Flexibility”,European Journal of Operational Research, 60(2), pp. 166-182.
Gupta, Y. P. and Goyal, S. (1989), “Flexibility of Manufacturing Systems: Concepts andMeasurements”, European Journal of Operations Research, 43(2), pp. 119-135.
Gupta, Y. P. and Somers, T. M. (1996), “Business Strategy, Manufacturing Flexibility,and Organizational Performance Relationships: A Path Analysis Approach”, Production
and Operations Management, 5, pp. 204-233.
Hair, J. F., Anderson, R. E., Tatham, R. L., and Black, W. C. (1998), Multivariate Data
Analysis, Fifth Edition, Macmillan Publishing Company, New York, NY.
Hakansson, H. and Eriksson, A. K. (1993), “Getting Innovations Out of Supplier
Networks”, Journal of Business to Business Marketing, 1, pp. 3–34.
Hall, G., Rosenthal, J., and Wade, J. (1993), “How to Make Reengineering Really
Work”, Harvard Business Review, Nov.-Dec., pp. 119-131.
Hall, R. W. (1993), “A Framework for Linking Intangible Resources and Capabilities to
Sustainable Competitive Advantage”, Strategic Management Journal, 14(8), pp. 607-618
Handfield, R. and Nichols, E. (2002), Supply Chain Redesign, Prentice-Hall, Upper
Saddle River, NJ.
Handfield, R. B. and Pannesi, R. T. (1995), “Antecedents of Lead-Time Competitiveness
in Make-To-Order Manufacturing Firms”, International Journal of Production Research,
33(2), pp. 511-537.
239
8/13/2019 Competitive_advantage of a Firm Through Supply Chain Responsiveness and SCM Practices
http://slidepdf.com/reader/full/competitiveadvantage-of-a-firm-through-supply-chain-responsiveness-and-scm 258/294
Handfield, R., Krause, D., Scannell, T., Monczka, R. (1998), “An Empirical Investigationof Supplier Development: Reactive and Strategic Processes”, Journal of Operations
Management; 17(1), pp. 39-58.
Harris, A. (2005), “Reaping the Rewards of Agile Thinking”, Manufacturing Engineer,83(6), pp. 24-27.
Helper, S. R. (1991), “How Much Has Really Changed Between US Automakers andTheir Suppliers”, Sloan Management Review, Summer, pp. 15-28.
Henke, J. W., Krachenberg, A. R., and Lyons, T. F. (1993), “PERSPECTIVE: Cross-Functional Teams: Good Concept, Poor Implementation”, Journal of Product Innovation
Management, 10(3), pp. 216-229.
Herrmann, J.W., Minis, I., and Ramachandran, V. (1995), “Information Models for
Partner Selection in Agile Manufacturing”, Computer Engineering Division, CED,American Society of Mechanical Engineers, 7, pp. 75-91.
Hines, P. (1994), Creating World Class Suppliers: Unlocking Mutual Competitive
Advantage, Pitman, London, UK.
Hise, R. T. (1995), “The Implications of Time-Based Competition on International
Logistics Strategies”, Business Horizons, 38(5), pp. 39-46.
Holweg, M. (2005), “An Investigation into Supplier Responsiveness”, International
Journal of Logistics Management, 16(1), pp. 96-119.
Holweg, M. and Pil, F. K. (2001), “Successful Build-To-Order Strategies Start with the
Customer”, MIT Sloan Management Review, 43(1), pp. 74-84.
Hoogeweegen, M. R., Teunissen, W. J. M., Vervest, P. H. M., and Wagenaar, R. W.
(1999), “Modular Network Design: Using Information and Communication Technology
to Allocate Production Tasks in a Virtual Organization”, Decision Sciences, 30(4), pp.1073-1103.
Hopwood, K. (1995), “Modularity Transforms Manufacturing”, Electronic EngineeringTimes, 14, pp. 72.
Huber, G. P. (1984), "Nature and Design of Post Industrial Organizations", ManagementScience, 30(8), pp. 928-951.
Hult, G., Tomas, M., and Nichols, E. L. (1996), “The Organizational Buyer BehaviorLearning Organization”, Industrial Marketing Management, 25, pp. 197-207.
240
8/13/2019 Competitive_advantage of a Firm Through Supply Chain Responsiveness and SCM Practices
http://slidepdf.com/reader/full/competitiveadvantage-of-a-firm-through-supply-chain-responsiveness-and-scm 259/294
Huppertz, P. (1999), “Market Changes Require Supply Chain Thinking”, Transportation
and Distribution, 40(3), pp. 70-74
Hyun, J. H. and Ahn B. H. (1992), "A Unifying Framework for Manufacturing
Flexibility", Manufacturing Review, 5(4), pp. 251-260.
James-Moore, S. M. R. (1996), “Agility is Easy; But Effective Agile Manufacturing is
not”, IEE Colloquium (Digest), 179, pp. 4.
Jarvenpaa, S. (1989), “The Effect of Task Demands and Graphical Format on
Information Process Strategies”, Management Science, March, 35(3), pp. 285-303.
Jones, C. (1998), “Moving Beyond ERP: Making the Missing Link”, Logistics Focus,
6(7), pp. 2–7.
Jones, C. (1998), “Moving beyond ERP: Making the Missing Link”, Logistics Focus,
6(7), pp. 2-7.
Jones, R. M. (2002), The Apparel Industry, Blackwell, Oxford.
Jordan J. A. and Michel F. J. (2000), Next Generation Manufacturing: Methods and
Techniques, John Wiley and Sons, New York, NY.
Joreskog, K. G. (1970), “A General Method for Analysis of Covariance Structures”,
Biometrika, 57, pp. 239-251.
Joreskog, K. G. (1971), “Statistical Analysis of Sets of Congeneric Tests”,Psychometrika, 36(2), pp. 109-133.
Joreskog, K. G. and Sorbom D. (1989), LISREL 7 Users’ Reference Guide, ScientificSoftware Inc., Chicago, IL.
Juga, J. (1996), "Organizing for Network Synergy in Logistics: A Case Study",
International Journal of Physical Distribution and Logistics Management, 26(2), pp. 51-67.
Kalwani, M. and Narayandas, N. (1995), “Long-Term Manufacturing-SupplierRelationships: Do They Pay-Off For Supplier Firms?”, Journal of Marketing, 59(1), pp.
1-16.
Kaplan, D., and Elliott, P. R. (1997), “A Didactic Example of Multilevel Structural
Equation Modeling Applicable to the Study of Organizations”, Structural Equation
Modeling: A Multidisciplinary Journal, 4, 1-24
Kerlinger, F. N. (1978), “Foundations of Behavioral Research, McGraw Hill, New York.
241
8/13/2019 Competitive_advantage of a Firm Through Supply Chain Responsiveness and SCM Practices
http://slidepdf.com/reader/full/competitiveadvantage-of-a-firm-through-supply-chain-responsiveness-and-scm 260/294
8/13/2019 Competitive_advantage of a Firm Through Supply Chain Responsiveness and SCM Practices
http://slidepdf.com/reader/full/competitiveadvantage-of-a-firm-through-supply-chain-responsiveness-and-scm 261/294
Lambert, D. M., Cooper, M. C., and Pagh, J. D. (1998), "Supply Chain Management:Implementation Issues and Research Opportunities," International Journal of Logistics
Management, 9(2), pp. 1-20.
Lamming, R. (1993), “Beyond Partnership: Strategies for Innovation and Lean Supply”Prentice-Hall, New York, NY.
Lancioni, R. A., Smith, M. F., and Oliva, T. A. (2000), “The Role of the Internet inSupply Chain Management”, Industrial Marketing Management, 29, pp. 45-56.
Landeros, R. and Monczka, R. M. (1989), “Cooperative Buyer/Seller Relationships and aFirm’s Competitive Posture”, Journal of Purchasing and Materials Management, Fall, pp.
9-18.
Landis, J. R. & Koch, G. G. (1977) “The Measurement of Observer Agreement for
Categorical Data,” Biometrics, 33, pp. 159-174.
Larson, P. D. and Kulchitsky, J. D. (1998), “Single Sourcing and Supplier Certification:Performance and Relationship Implications”, Industrial Marketing Management, 27, pp.
73-81.
Lau, H. C. W. and Lee, W. B. (2000), “On A Responsive Supply Chain Information
System”, International Journal of Physical Distribution & Logistics Management,
30(7/8), pp. 598-611.
Lau, R. S. M. (1999), “Critical Factors for Achieving Manufacturing Flexibility”,International Journal of Operations and Production Management, 19(3/4), pp. 328-341
Lau, R. S. M. and Hurley, N. M. (2001), “Creating Agile Supply Chains for CompetitiveAdvantage”, Business Review, 60(1), pp. 1-5
Lee, H. L. (2002), “Aligning Supply Chain Strategies with Product Uncertainties”,
California Management Review, 44(3), pp. 105-119.
Lee, H. L. (2004), “The Triple-A Supply Chain”, Harvard Business Review, 82(10), pp.
102-112.
Lee, H. L., Billington, C., and Carter, B. (1993), “Hewlett-Packard Gains Control of
Inventory and Service through Design for Localization”, Interfaces 23(4), pp. 1-11.
Lee, H. L., Padmanabhan, V., and Whang, S. (1997), “Information Distortion in a Supply
Chain: The Bullwhip Effect”, Management Science, 43(4), pp. 546-558.
Lee, H., and Whang, S. (2001), “E-Business and Supply Chain Integration,” Stanford
Global Supply Chain Management Forum, Stanford University Report, Stanford, CA.
243

8/13/2019 Competitive_advantage of a Firm Through Supply Chain Responsiveness and SCM Practices
http://slidepdf.com/reader/full/competitiveadvantage-of-a-firm-through-supply-chain-responsiveness-and-scm 262/294
Lee, H., Padmanabhan, V., and Whang, S. (1997), “The Bullwhip Effect in SupplyChains,” Sloan Management Review, 38, pp. 93-102.
Lewis, I. and Talalayevsky A. (1997), “Logistics and Information Technology: A
Coordination Perspective”, Journal of Business Logistics, 18(1), pp. 141-157.
Li, S. (2002), An Integrated Model for Supply Chain Management Practice, Performance
and Competitive Advantage, Doctoral Dissertation, University of Toledo, Toledo, OH.
Li, S., Ragu-Nathan, B., Ragu-Nathan, T. S., and Rao, S. Subba (2006), “The Impact of
Supply Chain Management Practices on Competitive Advantage and OrganizationalPerformance”, Omega, 34(2), pp. 107-124.
Li, S., Rao, S. Subba, Ragu-Nathan, T. S., and Ragu-Nathan, B. (2005), “Developmentand Validation of A Measurement Instrument for Studying Supply Chain Management
Practices”, Journal of Operations Management, 23(6), pp. 618-641.
Liu, E. R. and Kumar, A. (2003), “Leveraging Information Sharing to Increase SupplyChain Configurability”, Twenty Fourth International Conference on Information
Systems, pp. 523-537.
Lummus, R. R. and. Vokurka, R. J. (1999), “Defining Supply Chain Management: A
Historical Perspective and Practical Guidelines”, Industrial Management & Data
Systems, 99(1), pp. 11-17.
Lummus, R. R., Duclos, L. K., and Vokurka, R. J. (2003), “Supply Chain Flexibility:Building a New Model”, Global Journal of Flexible Systems Management, 4(4), pp. 1-13.
Lusch, R. F. and Brown, J. (1996), “Interdependency, Contracting, and RelationalBehavior in Marketing Channels”, Journal of Marketing, 60, pp. 19-38.
MacCallum, R. C., Browne, M. W., and Sugawara, H. M. (1996), “Power Analysis and
Determination of Sample Size for Covariance Structure Modeling”, PsychologicalMethods, 1, pp. 130-149.
Magretta, J. (1998), “The Power of Virtual Integration: An Interview with DellComputers’ Michael Dell”, Harvard Business Review, 76(2), pp.72-84.
Marsh, H. W. and Hocevar, D. (1985), “Application of Confirmatory Factor Analysis tothe Study of Self-Concept: First and Higher-Order Factor Models and their Invariance
across Groups”, Psychological Bull, 97(3), pp. 562-582.
Marshall, M. (1996), “Oracle goes modular”, Communications Week, 631, pp. 1.
244
8/13/2019 Competitive_advantage of a Firm Through Supply Chain Responsiveness and SCM Practices
http://slidepdf.com/reader/full/competitiveadvantage-of-a-firm-through-supply-chain-responsiveness-and-scm 263/294
Martin, J. H. and Grbac, B. (2003), “Using supply chain management to leverage a firm's
market orientation”, Industrial Marketing Management, 32(1), pp. 25-38
Mason S. J., Cole M. H., Ulrey B. T., and Yan, L. (2002), “Improving Electronics
Manufacturing Supply Chain Agility through Outsourcing, International Journal of
Physical Distribution and Logistics Management, 32(7), pp. 610-620.
Matson, J. B. and McFarlane, D. C. (1999), “Assessing the Responsiveness of Existing
Production Operations”, International Journal of Operations & Production Management,19(8), pp. 765-785.
McCutcheon, D. M. and Raturi, A. S. (1994), “The Customization-ResponsivenessSqueeze”, Sloan Management Review, 35(2), pp. 89-99.
McGinnis M. A. and Vallorpa R. M. (1999), “Purchasing and Supplier Involvement:Issues and Insights Regarding New Product Success”, Journal of Supply Chain
Management, 35(3), pp. 4-15.
Meehan, S. and Dawson, C. (2002), “Customer Responsiveness: Getting It Fast and Rightthrough Impatience and Intolerance”, Business Strategy Review, 13(4), pp. 26-37.
Meehl, P. E. (1990), “Why Summaries of Research on Psychological Theories are OftenUninterpretable”, Psychological Reports, 66, pp. 195-244
Mentzer, J. T. (2001), Supply Chain Management, Sage, Thousand Oaks, CA
Mentzer, J. T., DeWitt, W., Keebler, J. S., Soonhoong M., Nix, N. W., Smith, C. D., andZacharia, Z. G. (2001), “Defining Supply Chain Management”, Journal of Business
Logistics, 22(2), pp. 1-25.
Mentzer, J. T., Foggin, J. H. and Golicic, S. L. (2000a), “Collaboration: the Enablers,
Impediments, and Benefits”, Supply Chain Management Review, Sept/Oct.
Mentzer, J. T., Min, S., and Zacharia, Z. G. (2000b), “The Nature of Interfirm Partneringin Supply Chain Management”, Journal of Retailing, 76(4), pp. 549-568.
Mertler, C. A. and Vannatta, R. A. (2002), Advanced Multivariate Statistical Methods(2nd Ed.), Pyrczak Publishing, Los Angeles, CA.
Mikkola, J. H. and Larsen, S. T. (2004), “Supply-Chain Integration: Implications forMass Customization, Modularization and Postponement Strategies”, Production Planning
& Control, 15(4), pp. 352-361.
Mikkola, J. H. R. (2003), “Modularity, Component Outsourcing, and Inter-Firm
Learning”, R and D Management, 33(4), pp. 439-454.
245
8/13/2019 Competitive_advantage of a Firm Through Supply Chain Responsiveness and SCM Practices
http://slidepdf.com/reader/full/competitiveadvantage-of-a-firm-through-supply-chain-responsiveness-and-scm 264/294
Miller, J. G., DeMeyer, A., and Nakane, J. (1992), Benchmarking Global Manufacturing,
Business One Irwin, Homewood, IL.
Min, S. and Mentzer, J. T. (2004), “Developing and Measuring Supply Chain Concepts”,
Journal of Business Logistics, 25(1), pp. 63–99.
Mitchell, A. (1997), Efficient Consumer Response: A New Paradigm for the European
FMCG Sector, Financial Times Retail and Consumer Publishing, UK.
Moberg, C. R., Cutler, B. D., Gross, A., and Speh, T. W. (2002), “Identifying
Antecedents of Information Exchange Within Supply Chains”, International Journal of
Physical Distribution and Logistics Management, 32(9), pp. 755–770.
Monczka, R. M., Petersen, K. J., Handfield, R. B., and Ragatz, G. L. (1998), “Success
Factors in Strategic Supplier Alliances: the Buying Company Perspective”, DecisionScience, 29(3), pp. 5553-5577.
Moore, G. and Benbasat, I. (1991), “Development of an Instrument to Measure the
Perceptions of Adopting an Information Technology Innovation”, Information SystemsResearch, 2(3), pp. 192-222
Morgan, R. M. and Hunt, S. D. (1994), “The Commitment-Trust Theory of RelationshipMarketing”, Journal of Marketing, 58(3), pp. 20-38.
Morris, J. and Imrie, R. (1993), “Japanese Style Subcontracting — Its Impact onEuropean Industries”, Long Range Planning, 26(4), pp. 53-58.
Nahm, A., Solis-Galvan, L. E., Rao, S., and Ragu-Nathan, T. S. (2002), “The Q-Sort
Method: Assessing Reliability and Construct Validity of Questionnaire Items at a Pre-
Testing Stage,” Journal of Modern Applied Statistical Methods, 1(1), pp.114-125.
Narasimhan R. and Das A. (2000), “Manufacturing Agility and Supply Chain
Management Practices”, The Journal of Enterprise Resource Management- Australasian
Production and Inventory Control Society, 3(3), pp. 11-17.
Narasimhan, R. and Das, A. (1999), "An Empirical Investigation of The Contribution of
Strategic Sourcing to Manufacturing Flexibilities and Performance", Decision Sciences,30(3), pp. 683-718.
Narasimhan, R. and Das, A. (1999), “Manufacturing Agility and Supply ChainManagement Practices”, Production and Inventory Management Journal, 40(1), pp. 4-10.
New, S. J. and Payne, P. (1995), “Research Framework in Logistics: Three Models,Seven Dinners and a Survey”, International Journal of Physical Distribution and Logistics
Management, 25(10), pp.60-77.
246

8/13/2019 Competitive_advantage of a Firm Through Supply Chain Responsiveness and SCM Practices
http://slidepdf.com/reader/full/competitiveadvantage-of-a-firm-through-supply-chain-responsiveness-and-scm 265/294
8/13/2019 Competitive_advantage of a Firm Through Supply Chain Responsiveness and SCM Practices
http://slidepdf.com/reader/full/competitiveadvantage-of-a-firm-through-supply-chain-responsiveness-and-scm 266/294
Porter, M. E. (1980), Competitive Strategy, The Free Press, New York, NY.
Porter, M. E. (1985), Competitive Advantage: Creating and Sustaining Superior
Performance, The Free Press, New York.
Porter, M. E. (1991), “Towards A Dynamic Theory of Strategy”, Strategic Management
Journal, 12(8), pp. 95-117.
Power, D. J., Sohal, A., and Rahman, S. U. (2001), “Critical Success Factors in Agile
Supply Chain Management: An Empirical Study”, International Journal of Physical
Distribution and Logistics Management, 31(4), pp.247-265.
Prahalad, C. K. and Hamel, G. (1990), “The Core Competence of the Corporation”,
Harvard Business Review, 68(3), pp. 79-92.
Prater, E., Biehl, M., and Smith, M. A. (2001), “International Supply Chain Agility”,International Journal of Operations & Production Management, 21(5/6), pp. 823-840.
Radjou, N. (2000), “Deconstruction of the Supply Chain”, Supply Chain Management
Review, 4(5), pp. 30-38.
Ragatz, G. L., Handfield, R. B. and Scannell, T. V. (1997), “Success Factors for
Integrating Suppliers into New Product Development”, Journal of Product Innovation
Management, 14, pp. 190–202.
Ragatz, G. L., Handfield, R. B., and Petersen, K. J. (2002), "Benefits Associated WithSupplier Integration into New Product Development under Conditions of Technology
Uncertainty", Journal of Business Research, 55, pp. 389-400.
Raghunathan, B. and Raghunathan, T. S. (1994), “Adaptation of a Planning System
Success Model to Information Systems Planning”, Information Systems Research, 5(3),
pp. 326-340.
Randall, T. R., Morgan, R. M., and Morton, A. R. (2003), “Efficient versus Responsive
Supply Chain Choice: An Empirical Examination of Influential Factors”, Journal of
Product Innovation Management, 20(6), pp. 430-443.
Rich, N. and Hines, P. (1997), “Supply-Chain Management and Time-Based
Competition: The Role of the Supplier Association”, The International Journal ofPhysical Distribution and Logistics Management, 27(3-4), pp. 210-226.
Richardson, H. (1998), “Design Warehouses for Flexibility”, Transportation andDistribution, 39(10), pp. 119-126.
248
8/13/2019 Competitive_advantage of a Firm Through Supply Chain Responsiveness and SCM Practices
http://slidepdf.com/reader/full/competitiveadvantage-of-a-firm-through-supply-chain-responsiveness-and-scm 267/294

8/13/2019 Competitive_advantage of a Firm Through Supply Chain Responsiveness and SCM Practices
http://slidepdf.com/reader/full/competitiveadvantage-of-a-firm-through-supply-chain-responsiveness-and-scm 268/294

8/13/2019 Competitive_advantage of a Firm Through Supply Chain Responsiveness and SCM Practices
http://slidepdf.com/reader/full/competitiveadvantage-of-a-firm-through-supply-chain-responsiveness-and-scm 269/294
Sethi, A. K. and Sethi, S. P. (1990), “Flexible Manufacturing: A Survey”, International
Flexible Manufacturing Systems, 2, pp. 289-328.
Sharifi, H. (1998), “Agile Manufacturing – A Structured Perspective”, IEE Colloquium
(Digest), 213, pp. 5/1-5/4.
Sharifi, H. and Zhang, Z. (2001), “Agile Manufacturing in Practice”, International
Journal of Operations & Production Management, 21(5/6), pp. 772-805.
Sheridan, J. H. (1998), “The Supply-Chain Paradox”, Industry Week, 247(3), pp. 20-29.
Sheth J. and Sharma A. (1997), “Supplier Relationships: Emerging Issues andChallenges”, Industrial Marketing Management 32(1), pp. 91– 100.
Sheth, J. N. (1996), “Organizational Buying Behavior: Past Performance and FutureExpectations”, Journal of Business and Industrial Marketing, 11, pp. 7-24.
Sheth, J. N. and Sharma, A. (1997), “Relationship Marketing: An Agenda for Inquiry”,
Industrial Marketing Management, 26, pp. 91-100.
Shin, H., Collier, D. A., and Wilson, D. D. (2000), “Supply Management Orientation and
Supplier/Buyer Performance”, Journal of Operations Management, 18, pp. 317–333.
Simatupang, T. M. and Sridharan, R. (2002), “The Collaborative Supply Chain”,
International Journal of Logistics Management, 13(1), pp. 15-30.
Simatupang, T. M. and Sridharan, R. (2005), “An Integrative Framework for SupplyChain Collaboration”, International Journal of Logistics Management, 16(2), pp. 257-
274.
Simchi-Levi, D., Kaminsky, P., and Simchi-Levi, E. (2000), Designing and Managing the
Supply Chain, 1st Ed., Irwin McGraw-Hill, New York, NY.
Simison, R. L. (1999), "Toyota Develops a Way to Make a Car within Five Days of aCustomer Order”, The Wall Street Journal.
Skinner, W. (1985), The Taming of The Lions: How Manufacturing Leadership Involved,1780–1984. In: Clark, K. B., Hayes, R., Lorenz, C., Editors, The Uneasy Alliance:
Managing The Productivity-Technology Dilemma, The Harvard Business School Press,
Boston, MA. pp. 63–110.
Slack, N. (1983), “Flexibility as a Manufacturing Objective”, International Journal of
Production Management, 3(3), pp. 4-13.
Slack, N. (1987), “The Flexibility of Manufacturing Systems”, International Journal of
Operations & Production Management, 7(4), pp. 35-45.
251
8/13/2019 Competitive_advantage of a Firm Through Supply Chain Responsiveness and SCM Practices
http://slidepdf.com/reader/full/competitiveadvantage-of-a-firm-through-supply-chain-responsiveness-and-scm 270/294
Slack, N. (1991), The Manufacturing Advantage, Mercury Books, London.
Solis-Galvan, L. E. (1998), An Exploratory Study of the Relationship between Quality
Management and Manufacturing Competitive Capabilities, Doctoral Dissertation, the
University of Toledo, Toledo, OH.
Sparks, L. and Fernie, J. (Eds) (1998), Logistics and Retail Management: Insights into
Current Practice and Trends from Leading Experts, Kogan Page, London.
Spekman, R. E., Kamauff, Jr., J. W., Myhr, N. (1998), “An Empirical Investigation into
Supply Chain Management: A Perspective on Partnerships”, Supply Chain Management,3(2), pp. 53-67.
Spekman, R.E. (1988), “Strategic Supplier Selection: Understanding Long-Term BuyerRelationships”, Business Horizons, pp. 75-81.
Stalk, G. (1988), “Time - The Next Source of Competitive Advantage”, Harvard Business
Review, 66(4), pp. 41-51.
Stalk, G. and Hout, T. (1990), Competing Against Time, The Free Press, New York, NY.
Stalk, G., Evans, P. Shulman, L. E. (1992), “Competing on Capabilities: The New Rules
of Corporate Strategy”, Harvard Business Review, 70(2), pp. 54-65
Stank, T. P., Davis, B. R., and Fugate, B. S. (2005), “A Strategic Framework for Supply
Chain Oriented Logistics”, Journal of Business Logistics, 26(2), pp. 27-45.
Stapleton D., Hanna J. B., and Ross, J. B. (2006), “Enhancing Supply Chain Solutions
with the Application of Chaos Theory”, Supply Chain Management, 11(2), pp. 108-114.
Starr, M. K. (1965), “Modular Production--A New Concept”, Harvard Business Review,
43(6), pp. 131-142.
Stein, T. and Sweat, J. (1998), “Killer Supply Chains”, Information Week, 708(9), pp.
36-46.
Stern, L. and Reve, T. (1980), “Distribution Channels as Political Economies: A
Framework for Competitive Analysis”, Journal of Marketing, 44, pp. 52–64.
Stevens, J. (1992), Applied Multivariate Statistics for the Social Sciences (2nd Ed.),
Lawrence Erlbaum, New Jersey.
Storey, J., Emberson, C., and Reade, D. (2005), “The Barriers to Customer Responsive
Supply Chain Management”, International Journal of Operations & Production
Management, 25(3), pp. 242-260.
252
8/13/2019 Competitive_advantage of a Firm Through Supply Chain Responsiveness and SCM Practices
http://slidepdf.com/reader/full/competitiveadvantage-of-a-firm-through-supply-chain-responsiveness-and-scm 271/294
Stuart, F. I. (1993), “Supplier Partnerships: Influencing Factors and Strategic Benefits”,International Journal of Purchasing and Materials Management, Fall, pp. 22–28.
Stuart, F. I. (1997), “Supply-Chain Strategy: Organizational Influence through Supplier
Alliances”, British Academy of Management, 8, pp. 223-236.
Suarez, F. F. and Cusumano, M. A. (1996), “An Empirical Study of Manufacturing
Flexibility in Printed Circuit Board Assembly”, Operations Research, 44(1), pp. 223-240.
Suarez, F., Cusumano, M. A., and Fine, C. (1995), “An Empirical Study of Flexibility in
Manufacturing”, Sloan Management Review, 37(1), pp. 25-32.
Suzik, H. A. (1999), “GM Announces Modularity Project” Quality, 38(5), pp. 14.
Swaminathan, J. M. (2001), “Enabling Customization Using Standard Operations”,
California Management Review, 43(3), pp. 125-135
Swink, M. (1999), “Threats to New Product Manufacturability and the Effects ofDevelopment Team Integration Processes”, Journal of Operations Management, 17, pp.
691–709.
Tabachnick, B. G. and Fidell, L. S. (1996), Using Multivariate Statistics (3rd Ed.), Harper
Collins College Publishers, New York.
Tan, K. C. (2001), “A Framework of Supply Chain Management Literature”, European
Journal of Purchasing and Supply Management, 7(1), pp. 39-48.
Tan, K. C., Kannan, V. R., and Handfield, R. B. (1998), “Supply Chain Management:
Supplier Performance and Firm Performance”, International Journal of Purchasing andMaterials Management, 34(3), pp. 2–9.
Tan, K. C., Kannan, V. R., Handfield, R. B., and Ghosh, S. (1999), “Supply Chain
Management: An Empirical Study of Its Impact on Performance”, International Journalof Operations & Production Management, 19(9/10), pp. 1034-1052.
Tan, K. C., Lyman, S. B., and Wisner, J. D. (2002), “Supply Chain Management: AStrategic Perspective”, International Journal of Operations and Production Management,
22(6), pp. 614–631.
Taymaz, E. (1989), “Types of Flexibility in a Single-Machine Production System”,
International Journal of Production Research, 27(11), pp. 1891-1899.
Thomas, J. (1999), “Why Your Supply Chain Doesn't Work”, Logistics Management and
Distribution Report, 38(6), pp. 42-44.
253

8/13/2019 Competitive_advantage of a Firm Through Supply Chain Responsiveness and SCM Practices
http://slidepdf.com/reader/full/competitiveadvantage-of-a-firm-through-supply-chain-responsiveness-and-scm 272/294
Tomkins, C. (2001), “Inter-Dependencies, Trust and Information in Relationships,
Alliances and Networks”, Accounting Organizations and Society, 26(2), pp. 161-91.
Tompkins, J. and Ang, D. (1999), “What are Your Greatest Challenges Related to Supply
Chain Performance Measurement?”, IIE Solutions, 31(6), pp. 66.
Towill, D. and Christopher, M. (2002), “The Supply Chain Strategy Conundrum: To be
Lean Or Agile or To be Lean And Agile?”, International Journal of Logistics: Research
& Applications, 5(3), pp. 299-309.
Towill, D. R. (1996), “Time Compression and Supply Chain Management - A Guided
Tour”, Supply Chain Management, 1(1), pp. 15-27.
Towill, D. R. (1997), “The Seamless Chain- the Predator’s Strategic Advantage”,
International Journal of Technology Management, 13(1), pp. 37-56.
Tracey, M., Vonderembse, M. A., and Lim, J. S. (1999), “Manufacturing Technology andStrategy Formulation: Keys to Enhancing Competitiveness and Improving Performance”,
Journal of Operations Management, 17(4), pp. 411-428.
Treacy, M. and Wiersema, F. (1993), “Customer Intimacy and Other Value Disciplines”,
Harvard Business Review, 71(1), pp. 84-93.
Tu, Q. (1999), Achieving Mass Customization through Technology Application and
Absorptive Capacity – A Customer-Oriented Framework, Doctoral Dissertation,University of Toledo, Toledo, OH.
Tu, Q., Vonderembse, M. A., Ragu-Nathan, T. S., and Ragu-Nathan, B. (2004),
“Measuring Modularity-Based Manufacturing Practices and Their Impact on Mass
Customization Capability: A Customer-Driven Perspective”, Decision Sciences, 35(2), pp. 147-168.
Tully, S. (1994), “You’ll Never Guess Who Really Makes”, Fortune, 130(7), pp. 124-
128.
Turner, G. B., LeMay, S. A., Hartley, M., and Wood, C. M. (2000), “Interdependence
and Co-operation in Industrial Buyer-Supplier Relationships”, Journal of MarketingTheory and Practice, 8(1), pp. 16-24.
Turner, J. R. (1993), “Integrated Supply Chain Management: What's Wrong With ThisPicture?”, Industrial Engineering, 25(12), pp. 52-55.
Twigg, D. (1998), "Managing Product Development within a Design Chain",International Journal of Operations & Production Management, 18(5), pp. 508-524.
254

8/13/2019 Competitive_advantage of a Firm Through Supply Chain Responsiveness and SCM Practices
http://slidepdf.com/reader/full/competitiveadvantage-of-a-firm-through-supply-chain-responsiveness-and-scm 273/294
Tyndall, G., Gopal, C., Partsch, W., and Kamauff, J. (1998), Supercharging Supply
Chains: New Ways to Increase Value through Global Operational Excellence, John Wiley& Sons, New York, NY.
Ulrich, K. (1995), “The Role of Product Architecture in the Manufacturing Firm”,
Research Policy, 24(3), pp. 419-440
Ulrich, K. and Tung, K. (1991), “Fundamentals of Product Modularity”, Proceedings of
the 1991 ASME Design Engineering Technical Conferences – Conference onDesign/Manufacture Integration, Miami, FL
Upton, D. M. (1994), “The Management of Manufacturing Flexibility”, CaliforniaManagement Review, 36(2), pp. 72-89.
Upton, D. M. (1997), “Process Range in Manufacturing: An Empirical Study ofFlexibility”, Management Science, 43(8), pp. 1079-1093.
Van Hoek, R. (2001), 'The Rediscovery of Postponement a Literature Review and
Directions for Research", Journal of Operations Management, 19, pp. 161-184.
Van Hoek, R. I. (1998), “Measuring the Unmeasurable - Measuring and Improving
Performance in the Supply Chain”, Supply Chain Management, 3(4), pp. 187–192.
Van Hoek, R. I. (2000), “The Role of Third-Party Logistics Providers in Mass
Customization”, International Journal of Logistics Management, 11(1), pp. 37-47.
Van Hoek, R. I. and Weken, H. A. M. (1998), “The Impact of Modular Production on theDynamics of Supply Chains”, International Journal of Logistics Management, 9(2), pp.
35-50.
Van Hoek, R. I., Harrison A., and Christopher, M. (2001), “Measuring Agile Capabilities
in the Supply Chain”, International Journal of Operations and Production Management,
21 (1/2), pp. 126-147.
Van Hoek, R., Commandeur, H. and Vos, B. (1998), "Reconfiguring Logistics Systems
through Postponement Strategies", Journal of Business Logistics, 19(1), pp. 33-54.
Vastag, G., Kasarda, J. D., and Boone, T. (1994), “Logistical Support for Manufacturing
Agility in Global Markets”, International Journal of Operations and Production
Management, 14(11), pp. 73-85.
Verstraete, C. (2004), “Manufacturing Outsourcing--Can You Get It Right?”,
Manufacturing Engineer”, 83(4), pp. 20-23.
Vesey, J. T. (1991), “The New Competitors: They Think in Terms of Speed-To-Market”,
Academy of Management Executive, 5(2), pp. 23-33.
255
8/13/2019 Competitive_advantage of a Firm Through Supply Chain Responsiveness and SCM Practices
http://slidepdf.com/reader/full/competitiveadvantage-of-a-firm-through-supply-chain-responsiveness-and-scm 274/294
Vessey, I., (1984), An Investigation of the Psychological Processes Underlying theDebugging of Computer Programs, Unpublished Ph. D Dissertation, Department of
Commerce, The University of Queensland, Queensland, Australia.
Vickery, S. K., Droge, C., and Markland, R. E. (1997), “Dimensions of ManufacturingStrength in the Furniture Industry”, Journal of Operations Management, 15, pp. 317-330.
Vickery, S., Calantone, R., and Droge, C. (1999), “Supply Chain Flexibility: anEmpirical Study”, The Journal of Supply Chain Management, 35(3), pp. 16-24.
Vokurka, R. and Fliedner, G. (1998), “The Journey Toward Agility”, IndustrialManagement and Data Systems, 98(4), pp. 165-171.
Vokurka, R. J. and Lummus, R. R. (2000), “The Role of Just-in-Time in Supply ChainManagement”, International Journal of Logistics Management, 11(1), pp. 89-98.
Vokurka, R. J. and O'Leary-Kelly, S. W. (2000), “A Review of Empirical Research on
Manufacturing Flexibility”, Journal of Operations Management, 18(4), pp. 485-501.
Vokurka, R. J., Zank, G. M., and Lund III, C. M. (2002), “Improving Competitiveness
through Supply Chain Management: A Cumulative Improvement Approach”,Competitiveness Review, 12(1), pp. 14-25.
Vonderembse, M. A. and Tracey, M. (1999), “The Impact of Supplier Selection Criteriaand Supplier Involvement on Manufacturing Performance”, The Journal of Supply Chain
Management, 35(3), pp. 33-39.
Walker, W. T. (2005), “Supply chain Flexibility”, ASCET Supply Chain White Paper.
Waller, M., Dabholkar, P., and Gentry, J. (2000), "Postponement, Product Customization,
and Market-Oriented Supply Chain Management", Journal of Business Logistics, 21(2),
pp. 2000.
Walton, L. W., (1996), “Partnership Satisfaction: Using the Underlying Dimensions of
Supply Chain Partnership to Measure Current and Expected Levels of Satisfaction”,
Journal of Business Logistics”, 17(2), pp.57-75.
Ward, P., Mccreery, J., Ritzman, L., and Shamia, D. (1998), "Competitive Priorities in
Operations Management", Journal of Operations Management, 29(4), pp. 1035-1046.
Webster, M., Muhlemann, A. P., and Alder, C. (2000), “Decision Support for the
Scheduling of Subcontract Manufacture”, International Journal of Operations andProduction Management, 20(10), pp. 1218-1235
256

8/13/2019 Competitive_advantage of a Firm Through Supply Chain Responsiveness and SCM Practices
http://slidepdf.com/reader/full/competitiveadvantage-of-a-firm-through-supply-chain-responsiveness-and-scm 275/294
Weick, K. E. (1990), “Technology as Equivoque: Sensing in New Technologies”,
Technology and Organizations, edited by Paul S. Goodman, Lee S. Sproull, andAssociates, Jossey-Bass, Sam Francisco, pp. 1-44.
Wheelwright, S. C. (1978), “Reflecting Corporate Strategy in Manufacturing Decisions”,
Business Horizons, 21(1), pp. 57-66.
Whipple, J. S. and Gentry, J. J. (2000), “A Network Comparison of Alliance Motives and
Achievements”, The Journal of Business & Industrial Marketing, 15(5), pp. 301.
White, G. P. (1996), “A Meta-analysis Model of Manufacturing Capabilities”, Journal of
Operations Management, 14(4), pp. 315-331.
Wilkinson, I. and Young, L. (1995), “Business Dancing: The Nature And Role Of Inter-
Firm Relations In Business Strategy”, Asia-Australia Marketing Journal, 2(1), pp. 67-79.
Williamson, O. (1975), Markets and Hierarchies: Analysis and Antitrust Implications,The Free Press, New York, NY.
Williamson, P. J. (1991), “Supplier strategy and customer responsiveness: Managing the
links”, Business Strategy Review, 2(2), pp. 75-91.
Wines, L. (1996), “High Order Strategy for Manufacturing”, The Journal of Business
Strategy, 17(4), pp. 32-33.
Wisner, J. D. (2003), “A Structural Equation Model of Supply Chain Management
Strategies and Firm Performance”, Journal of Business Logistics, 24(1), pp. 1-26.
Womack, J. and Jones, D. (1996), Lean Thinking, Simon and Schushter, New York, NY.
Wood, C. H, Ritzman, L. P., and Sharma, D. (1990), Intended and Achieved Competitive
Advantage: Measures, Frequencies, and Financial Impact, In J. E. Ettlie, M. C. Burstein
and A. Fiegenbaum (Eds), Manufacturing Strategy: The Research Agenda for the Next
Decade, Kluwer, Boston, MA.
Wu, B. (2001), “A Unified Framework of Manufacturing Systems”, Industrial
Management and Data Systems, 101(9), pp. 446-469.
Yajiong, X., Sankar, C. S., and Mbarika, V. W. (2004), “Information Technology
Outsourcing and Virtual Team”, Journal of Computer Information Systems, 45(2), pp. 9-16.
Yang, B. and Burns, N. (2003), “Implications of Postponement for the Supply Chain”,International Journal of Production Research, 41(9), pp. 2075-2090.
257

8/13/2019 Competitive_advantage of a Firm Through Supply Chain Responsiveness and SCM Practices
http://slidepdf.com/reader/full/competitiveadvantage-of-a-firm-through-supply-chain-responsiveness-and-scm 276/294
Yang, B., Burns, N. D., and Backhouse, C. J. (2004), “Postponement: A Review and an
Integrated Framework”, International Journal of Operations and ProductionManagement”, 24(5), pp. 468-487.
Yoshino, M. and Rangan, S. (1995), “Strategic Alliances: An Entrepreneurial Approach
To Globalization”, Harvard Business School Press, Boston, MA.
Young, L. and Wilkinson, I. (1989), “The Role of Trust and Cooperation in Marketing
Channels: A Preliminary Study”, European Journal of Marketing, 23(2), pp. 109-22.
Yu, Z. X., Yan, H., and Cheng, T. C. E. (2001), “Benefits of Information Sharing with
Supply Chain Partnerships”, Industrial Management and Data Systems, 101(3), pp. 114-119.
Yusuf, Y. Y., Adeleye, E. O., and Sivayoganathan, K. (2003), “Volume Flexibility: TheAgile Manufacturing Conundrum”, Management Decision, 41(7), pp. 613-624.
Yusuf, Y. Y., Gunasekaran, A., Adeleye, E. O., and Sivayoganathan, K. (2004), “Agile
Supply Chain Capabilities: Determinants of Competitive Objectives”, European Journalof Operational Research, 159(2), pp. 379-392.
Yusuf, Y.Y., Sarhadi, M., and Gunasekaran, A. (1999), “Agile Manufacturing: TheDrivers, Concepts and Attributes”, International Journal of Production Economics,
62(1/2), pp. 33-43.
Zhang, Q. Y. (2001), “Technology Infusion Enabled Value Chain Flexibility: A Learning
and Capability-Based Perspective”, Doctoral Dissertation, University of Toledo, Toledo,OH.
Zhang, Q., Vonderembse, M. A., and Lim, J. S. (2003), “Manufacturing Flexibility:Defining and Analyzing Relationships among Competence, Capability, and Customer
Satisfaction”, Journal of Operations Management, 21(2), pp.173-191.
Zhang, Q., Vonderembse, M. A., and Lim, J. S. (2005), “Logistics Flexibility and itsImpact on Customer Satisfaction” International Journal of Logistics Management, 16(1),
pp. 71-95.
Zielke, A. and Pohl, M. (1996), “Virtual Vertical Integration: the Key to Success”, The
Mckinsey Quarterly, 3, pp. 160-163.
Zimmerman, M. R. (2003), “Storage, Modular and Cubed”, eWeek, 10.
258

8/13/2019 Competitive_advantage of a Firm Through Supply Chain Responsiveness and SCM Practices
http://slidepdf.com/reader/full/competitiveadvantage-of-a-firm-through-supply-chain-responsiveness-and-scm 277/294
259
APPENDIX A: MEASUREMENT ITEMS ENTERING Q-SORT
Supply Chain Responsiveness
Operations System ResponsivenessOur operations system responds rapidly to changes in product volume demanded bycustomersOur operations system responds rapidly to changes in product mix demanded bycustomersOur operations system effectively expedites emergency customer ordersOur operations system rapidly reconfigures equipment to address demand changesOur operations system rapidly reconfigures people to address demand changesOur operations system rapidly changes processes to address demand changesOur operations system rapidly adjusts capacity to address demand changes
Logistics Process ResponsivenessOur logistics system responds rapidly to unexpected demand changeOur logistics system rapidly adjusts warehouse capacity to address demand changesOur logistics system rapidly varies transportation carriers to address demand changesOur logistics system rapidly accommodates special or non-routine customer requestsOur logistics system effectively delivers expedited shipments
Supplier Network Responsiveness
Our major suppliers change production volume in a relatively short timeOur major suppliers change production variety in a relatively short timeOur major suppliers consistently accommodate our requestsOur major suppliers promptly vary capacity to address our changing needsOur major suppliers have outstanding on-time delivery record with usOur major suppliers effectively expedite our emergency orders.

8/13/2019 Competitive_advantage of a Firm Through Supply Chain Responsiveness and SCM Practices
http://slidepdf.com/reader/full/competitiveadvantage-of-a-firm-through-supply-chain-responsiveness-and-scm 278/294
260
APPENDIX B: COHEN’S KAPPA AND MOORE AND BENBASAT
COEFFICIENT
The Q-sort method is an iterative process in which the degree of agreement between judges forms the basis of assessing construct validity and improving the reliability of the
constructs. The Q-sort method was devised by Nahm et al. (2002) as a method ofassessing reliability and construct validity of questionnaire items that are generated forsurvey research. This method is applied as a pilot study, which comes after the pre-testand before administering the questionnaire items as a survey (Nahm et al., 2002). Themethod is simple, cost efficient and accurate and provides sufficient insight into potential problem areas in the questionnaire items that are being tested. The method consists oftwo stages. In the first stage, two judges are requested to sort the questionnaire itemsaccording to different constructs, based on which the inter-judge agreement is measured.In the second stage, questionnaire items that were identified as being too ambiguous, as aresult of the first stage, are reworded or deleted, in an effort to improve the agreement between the judges. The process is carried out repeatedly until a satisfactory level of
agreement is reached.The following example describes the theoretical basis for the Q-sort method and the
two evaluation indices to measure inter-judge agreement level: Cohen’s Kappa (Cohen,1960) and Moore and Benbasat’s ‘Hit Ratio” (Moore and Benbasat, 1991).
Let us assume that two judges independently classified a set of N components aseither acceptable or rejectable. After the work was finished the following table wasconstructed:
Judge 1
Acceptable Rejectable Totals
Acceptable X11 X12 X 1+
Rejectable X21 X22 X 2+ Judge 2
Totals X+1 X+2 N
Xij = the number of components in the ith row and jth column, for i,j = 1,2.
The above table can also be constructed using percentages by dividing eachnumerical entry by N. For the population of components, the table will look like:
Judge 1
Acceptable Rejectable Totals
Acceptable P11 P12 P 1+
Rejectable P21 P22 P 2+ Judge 2
Totals P+1 P+2 100
Pij = the percentage of components in the ith row and jth column.
We will use this table of percentages to describe the Cohen’s Kappa coefficient ofagreement. The simplest measure of agreement is the proportion of components that were
classified the same by both judges, i.e., Σi Pii = P11 + P22. However, Cohen suggested
comparing the actual agreement, Σi Pii, with the chance of agreement that would occur if

8/13/2019 Competitive_advantage of a Firm Through Supply Chain Responsiveness and SCM Practices
http://slidepdf.com/reader/full/competitiveadvantage-of-a-firm-through-supply-chain-responsiveness-and-scm 279/294
261
the row and columns are independent, i.e., Σi Pi+P+i. The difference between the actual
and chance agreements, Σi Pii - Σi Pi+P+i, is the percent agreement above that which is dueto chance. This difference can be standardized by dividing it by its maximum possible
value, i.e., 100% - Σi P i + P+I = 1 - Σi Pi +P+i. The ratio of these is denoted by the Greekletter kappa and is referred to as Cohen’s kappa.
) P P ( -1
) P P ( - P =k
i++ii
i++iiiii
Σ
ΣΣ
Thus, Cohen’s Kappa is a measure of agreement that can be interpreted as the proportion of joint judgement in which there is agreement after chance agreement isexcluded. The three basic assumptions for this agreement coefficient are: 1) the units areindependent, 2) the categories of the nominal scale are independents, mutually exclusive,and 3) the judges operate independently. For any problem in nominal scale agreement between two judges, there are only two relevant quantities:
po= the proportion of units in which the judges agreed pc= the proportion of units for which agreement is expected by chance
Like a correlation coefficient, k =1 for complete agreement between the two judges.If the observed agreement is greater than or equal to chance K <= 0. The minimum value
of k occurs when ΣPii =0, i.e.
When sampling from a population where only the total N is fixed, the maximumlikelihood estimate of k is achieved by substituting the sample proportions for those ofthe population. The formula for calculating the sample kappa (k) is:
For kappa, no general agreement exists with respect to required scores. However,recent studies have considered scores greater than 0.65 to be acceptable (e.g. Vessey,1984; Jarvenpaa 1989; Solis-Galvan, 1998). Landis and Koch (1977) have provided a
more detailed guideline to interpret kappa by associating different values of this index tothe degree of agreement beyond chance. The following guideline is suggested:
Value of Kappa Degree of Agreement Beyond Chance
.76 - 1.00 Excellent
.40 - .75 Fair to Good (Moderate)
.39 or less Poor
) P P ( -1
) P P ( -=(k)
i++ii
i++ii
Σ
Σmin
) X X ( - N
) X X ( - Xii N =k
i++ii2
i++iii
Σ
Σ
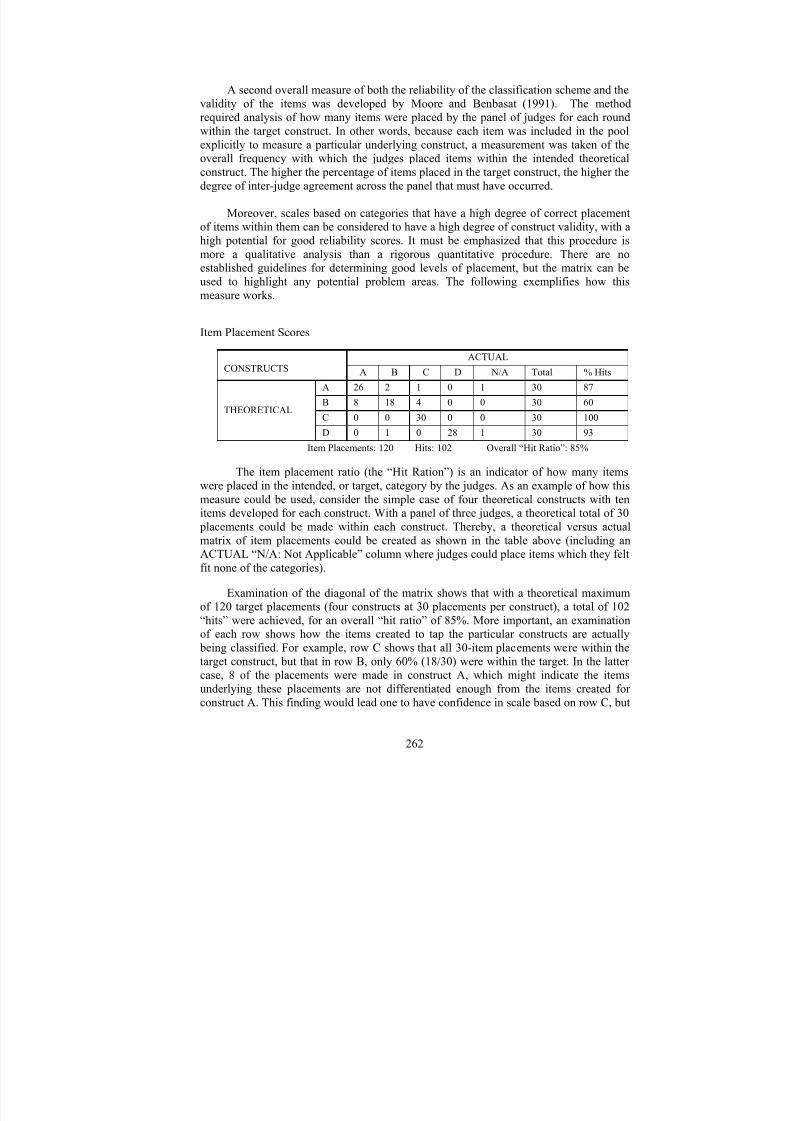
8/13/2019 Competitive_advantage of a Firm Through Supply Chain Responsiveness and SCM Practices
http://slidepdf.com/reader/full/competitiveadvantage-of-a-firm-through-supply-chain-responsiveness-and-scm 280/294
262
A second overall measure of both the reliability of the classification scheme and thevalidity of the items was developed by Moore and Benbasat (1991). The methodrequired analysis of how many items were placed by the panel of judges for each roundwithin the target construct. In other words, because each item was included in the poolexplicitly to measure a particular underlying construct, a measurement was taken of theoverall frequency with which the judges placed items within the intended theoreticalconstruct. The higher the percentage of items placed in the target construct, the higher thedegree of inter-judge agreement across the panel that must have occurred.
Moreover, scales based on categories that have a high degree of correct placementof items within them can be considered to have a high degree of construct validity, with ahigh potential for good reliability scores. It must be emphasized that this procedure ismore a qualitative analysis than a rigorous quantitative procedure. There are noestablished guidelines for determining good levels of placement, but the matrix can beused to highlight any potential problem areas. The following exemplifies how thismeasure works.
Item Placement Scores
ACTUALCONSTRUCTS A B C D N/A Total % Hits
A 26 2 1 0 1 30 87
B 8 18 4 0 0 30 60
C 0 0 30 0 0 30 100THEORETICAL
D 0 1 0 28 1 30 93
Item Placements: 120 Hits: 102 Overall “Hit Ratio”: 85%
The item placement ratio (the “Hit Ration”) is an indicator of how many itemswere placed in the intended, or target, category by the judges. As an example of how thismeasure could be used, consider the simple case of four theoretical constructs with tenitems developed for each construct. With a panel of three judges, a theoretical total of 30 placements could be made within each construct. Thereby, a theoretical versus actualmatrix of item placements could be created as shown in the table above (including anACTUAL “N/A: Not Applicable” column where judges could place items which they feltfit none of the categories).
Examination of the diagonal of the matrix shows that with a theoretical maximum
of 120 target placements (four constructs at 30 placements per construct), a total of 102“hits” were achieved, for an overall “hit ratio” of 85%. More important, an examinationof each row shows how the items created to tap the particular constructs are actually being classified. For example, row C shows that all 30-item placements were within thetarget construct, but that in row B, only 60% (18/30) were within the target. In the lattercase, 8 of the placements were made in construct A, which might indicate the itemsunderlying these placements are not differentiated enough from the items created forconstruct A. This finding would lead one to have confidence in scale based on row C, but

8/13/2019 Competitive_advantage of a Firm Through Supply Chain Responsiveness and SCM Practices
http://slidepdf.com/reader/full/competitiveadvantage-of-a-firm-through-supply-chain-responsiveness-and-scm 281/294
263
be hesitant about accepting any scale based on row B. An examination of off-diagonalentries indicates how complex any construct might be. Actual constructs based oncolumns with a high number of entries in the off diagonal might be considered tooambiguous, so any consistent pattern of item misclassification should be examined.
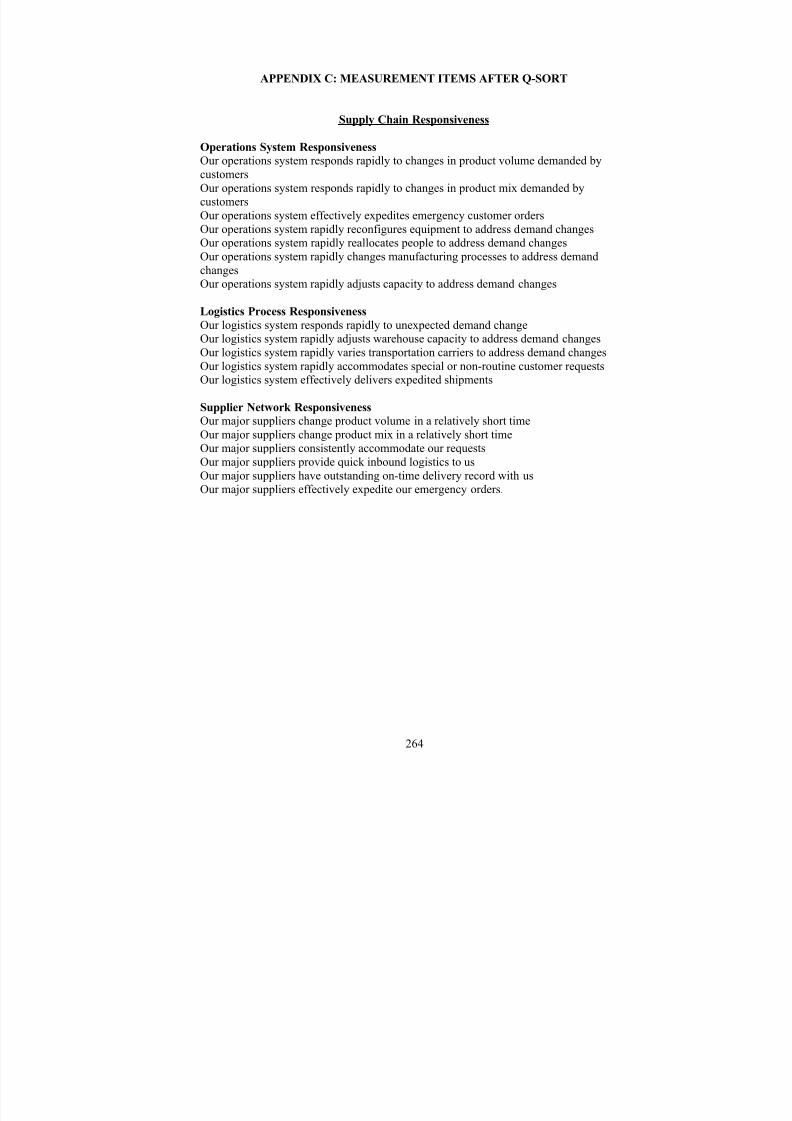
8/13/2019 Competitive_advantage of a Firm Through Supply Chain Responsiveness and SCM Practices
http://slidepdf.com/reader/full/competitiveadvantage-of-a-firm-through-supply-chain-responsiveness-and-scm 282/294
264
APPENDIX C: MEASUREMENT ITEMS AFTER Q-SORT
Supply Chain Responsiveness
Operations System ResponsivenessOur operations system responds rapidly to changes in product volume demanded bycustomersOur operations system responds rapidly to changes in product mix demanded bycustomersOur operations system effectively expedites emergency customer ordersOur operations system rapidly reconfigures equipment to address demand changesOur operations system rapidly reallocates people to address demand changesOur operations system rapidly changes manufacturing processes to address demandchangesOur operations system rapidly adjusts capacity to address demand changes
Logistics Process Responsiveness
Our logistics system responds rapidly to unexpected demand changeOur logistics system rapidly adjusts warehouse capacity to address demand changesOur logistics system rapidly varies transportation carriers to address demand changesOur logistics system rapidly accommodates special or non-routine customer requestsOur logistics system effectively delivers expedited shipments
Supplier Network Responsiveness
Our major suppliers change product volume in a relatively short timeOur major suppliers change product mix in a relatively short timeOur major suppliers consistently accommodate our requestsOur major suppliers provide quick inbound logistics to usOur major suppliers have outstanding on-time delivery record with usOur major suppliers effectively expedite our emergency orders.

8/13/2019 Competitive_advantage of a Firm Through Supply Chain Responsiveness and SCM Practices
http://slidepdf.com/reader/full/competitiveadvantage-of-a-firm-through-supply-chain-responsiveness-and-scm 283/294
265
APPENDIX D: SAMPLE EMAILS FOR DATA COLLECTION
(COVER LETTER)
From: Thatte, Ashish [mailto:[email protected]]
Sent: Wednesday, April 26, 2006 6:04 AM
To: Sullivan, DavidSubject: Doctoral Dissertation Research Survey, Ashish Thatte - College of Business
College of Business
The University of Toledo
phone: 419.944.3130fax: 419.530.2290
The University of Toledo
Dear David Sullivan,
My name is Ashish Thatte. I am a PhD student at The University of Toledo, College ofBusiness Administration, and I am currently doing research for my dissertation onSupply Chain Responsiveness and Competitive Advantage. The data gathering of myresearch requires your collaboration in filling out the questionnaire. It takes an averageof 15 minutes.
I would really appreciate your help. Your response is extremely valuable for mydissertation. Please take the time to complete the questionnaire, and if you have anyquestions, please contact me.
There are three ways to complete and send the questionnaire:
1. Online completion and submission. Requires completing and submitting thequestionnaire all at once, but it provides immediate submission.
2. Download the hard copy and send it by fax to 419.530.2290 or ask me to sendyou a self-addressed stamped envelope (please send me your regularaddress).
3. Request the hard copy by sending me an email and you will receive in yourregular mail, the copy of the questionnaire along with a self-addressedstamped envelope.
Thank you in advance for your attention and response.
Ashish
This email was sent personalized to each member in the database.

8/13/2019 Competitive_advantage of a Firm Through Supply Chain Responsiveness and SCM Practices
http://slidepdf.com/reader/full/competitiveadvantage-of-a-firm-through-supply-chain-responsiveness-and-scm 284/294
266
(FOLLOW-UP EMAIL)
From: Thatte, Ashish [mailto:[email protected]]Sent: Wednesday, April 26, 2006 6:04 AMTo: Sullivan, David
Subject: Doctoral Dissertation Research Survey, Ashish Thatte - College of Business -Remind Reminder II
College of Business
The University of Toledo
phone: 419.944.3130
fax: [email protected]
The University of Toledo
Dear David Sullivan,
This is a follow-up email to request you to fill out my doctoral dissertationquestionnaire. My name is Ashish Thatte. I am a PhD student at The University ofToledo, College of Business Administration, and I am currently doing research for mydissertation on Supply Chain Responsiveness and Competitive Advantage. The datagathering of my research requires your collaboration in filling out the questionnaire.
I would be very thankful if you can take 15 minutes of your time and fill out thequestionnaire for my research. Your response is extremely valuable for mydissertation. If you have any questions, please contact me.
There are three ways to complete and send the questionnaire:
4. Online completion and submission. Requires completing and submitting thequestionnaire all at once, but it provides immediate submission.
5. Download the hard copy and send it by fax to 419.530.2290 or ask me to sendyou a self-addressed stamped envelope (please send me your regularaddress).
6. Request the hard copy by sending me an email and you will receive in yourregular mail, the copy of the questionnaire along with a self-addressedstamped envelope.
Thank you in advance for your attention and response. This will be the last email sentto you.
Ashish
This email was sent personalized to each member in the database.

8/13/2019 Competitive_advantage of a Firm Through Supply Chain Responsiveness and SCM Practices
http://slidepdf.com/reader/full/competitiveadvantage-of-a-firm-through-supply-chain-responsiveness-and-scm 285/294
267
APPENDIX E: LARGE-SCALE MAIL SURVEY QUESTIONNAIRE
A SURVEY OF SUPPLY CHAIN RESPONSIVENESS, SCM PRACTICES AND
COMPETITIVE ADVANTAGE
General Instructions and Information
• This survey is being conducted by Ashish Thatte, a Ph.D. candidate, The University ofToledo
• This research will study the effect of Supply Chain Responsiveness and SCM practices ofa firm on a firm’s Competitive Advantage. We hope to determine various critical practices of a firm for attaining supply chain responsiveness and their effect oncompetitive advantage of the firm.
• Please answer all questions. There is no right or wrong answer. Please provide your best
estimate.
• If you would like to get a copy of the executive summary of results, please provide theinformation requested on the last page of the questionnaire.
• If you have any questions, please contact:
Ashish ThatteCollege of Business
The University of Toledo2801 West Bancroft Street, Toledo, OH 43606
Phone: (419) 944-3130Fax: (419) 530-2290
Email: [email protected]
All RESPONSES WILL BE KEPT CONFIDENTIAL. DATA WILL BE USED FOR STATISTICAL ANALYSIS ONLY

8/13/2019 Competitive_advantage of a Firm Through Supply Chain Responsiveness and SCM Practices
http://slidepdf.com/reader/full/competitiveadvantage-of-a-firm-through-supply-chain-responsiveness-and-scm 286/294
Unless otherwise specifically requested, please use the following scale to answer each item:
1 2 3 4 5 6 Not at all To a small extent To a moderate extent To a considerable extent To a great extent Not applicable
268
Section I: Supply Chain Management (SCM) Practices
SCM practices – is defined as the set of activities undertaken by an organization to promoteeffective management of its supply chain through outsourcing, strategic supplier partnership,customer relationship, information sharing, postponement, and mass customization.
Please circle the number that accurately reflects the extent of your firm’s current level of SCM
practices.
EXTENT OF OUTSOURCING
Outsourcing is the practice of transferring internal business activities / operations of a firm to
third parties.
Our firm outsources information systems 1 2 3 4 5 6
Our firm outsources manufacturing 1 2 3 4 5 6
Our firm outsources logistics 1 2 3 4 5 6(this includes transportation, distribution and warehousing)
Our firm outsources pre-sales customer care 1 2 3 4 5 6
Our firm outsources after sales support 1 2 3 4 5 6
Our firm outsources product design 1 2 3 4 5 6
STRATEGIC SUPPLIER PARTNERSHIP
Strategic Supplier Partnership is the long-term relationship between the organization and its
suppliers. It is designed to leverage the strategic and operational capabilities of individual
participating organizations to help them achieve significant ongoing benefits.
We consider quality as our number one criterion in selecting suppliers 1 2 3 4 5 6
We regularly solve problems jointly with our suppliers 1 2 3 4 5 6
We have helped our suppliers to improve their product quality 1 2 3 4 5 6
We have continuous improvement programs that include our key 1 2 3 4 5 6suppliers
We include our key suppliers in our planning and goal- setting activities 1 2 3 4 5 6
We actively involve our key suppliers in new product development 1 2 3 4 5 6 processes
CUSTOMER RELATIONSHIP
Customer Relationship is the entire array of practices that are employed for the purpose of
managing customer complaints, building long-term relationships with customers, and improving
customer satisfaction.
We frequently interact with customers to set reliability, 1 2 3 4 5 6responsiveness, and other standards for us
We frequently measure and evaluate customer satisfaction 1 2 3 4 5 6
We frequently determine future customer expectations 1 2 3 4 5 6
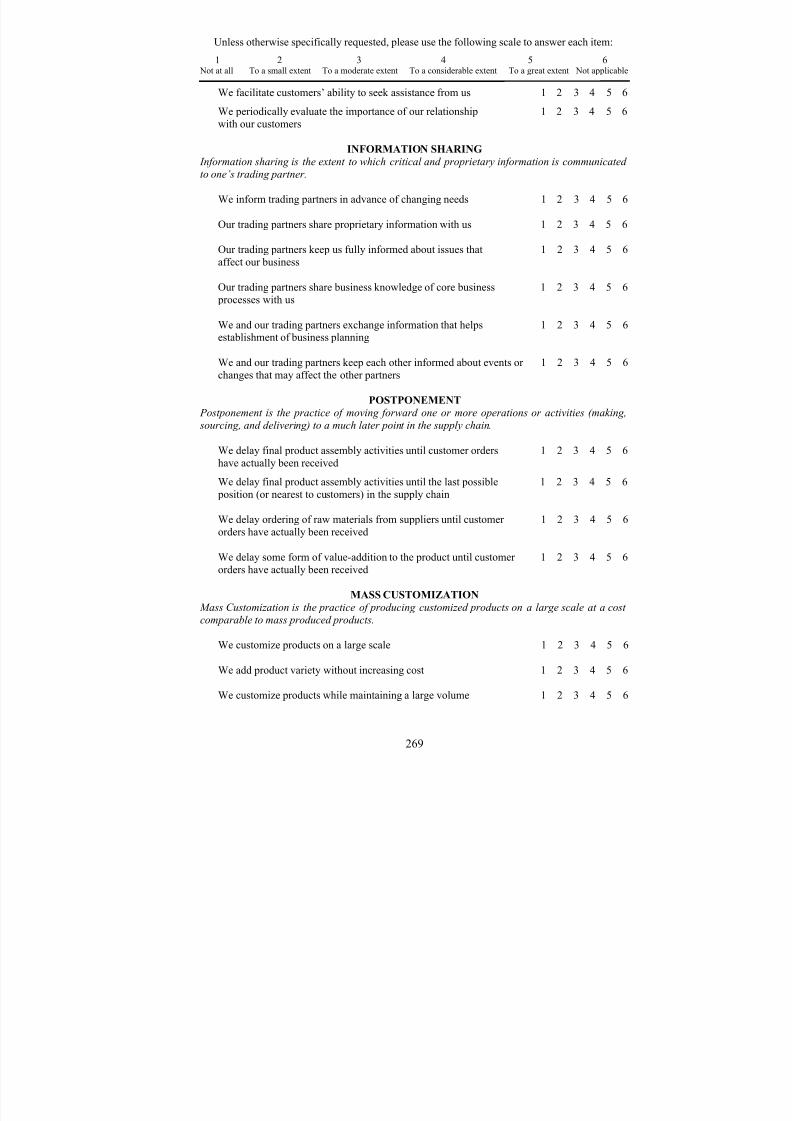
8/13/2019 Competitive_advantage of a Firm Through Supply Chain Responsiveness and SCM Practices
http://slidepdf.com/reader/full/competitiveadvantage-of-a-firm-through-supply-chain-responsiveness-and-scm 287/294
Unless otherwise specifically requested, please use the following scale to answer each item:
1 2 3 4 5 6 Not at all To a small extent To a moderate extent To a considerable extent To a great extent Not applicable
269
We facilitate customers’ ability to seek assistance from us 1 2 3 4 5 6
We periodically evaluate the importance of our relationship 1 2 3 4 5 6with our customers
INFORMATION SHARING Information sharing is the extent to which critical and proprietary information is communicated
to one’s trading partner.
We inform trading partners in advance of changing needs 1 2 3 4 5 6
Our trading partners share proprietary information with us 1 2 3 4 5 6
Our trading partners keep us fully informed about issues that 1 2 3 4 5 6affect our business
Our trading partners share business knowledge of core business 1 2 3 4 5 6
processes with us
We and our trading partners exchange information that helps 1 2 3 4 5 6establishment of business planning
We and our trading partners keep each other informed about events or 1 2 3 4 5 6changes that may affect the other partners
POSTPONEMENT
Postponement is the practice of moving forward one or more operations or activities (making,
sourcing, and delivering) to a much later point in the supply chain.
We delay final product assembly activities until customer orders 1 2 3 4 5 6have actually been received
We delay final product assembly activities until the last possible 1 2 3 4 5 6 position (or nearest to customers) in the supply chain
We delay ordering of raw materials from suppliers until customer 1 2 3 4 5 6orders have actually been received
We delay some form of value-addition to the product until customer 1 2 3 4 5 6orders have actually been received
MASS CUSTOMIZATION
Mass Customization is the practice of producing customized products on a large scale at a costcomparable to mass produced products.
We customize products on a large scale 1 2 3 4 5 6
We add product variety without increasing cost 1 2 3 4 5 6
We customize products while maintaining a large volume 1 2 3 4 5 6
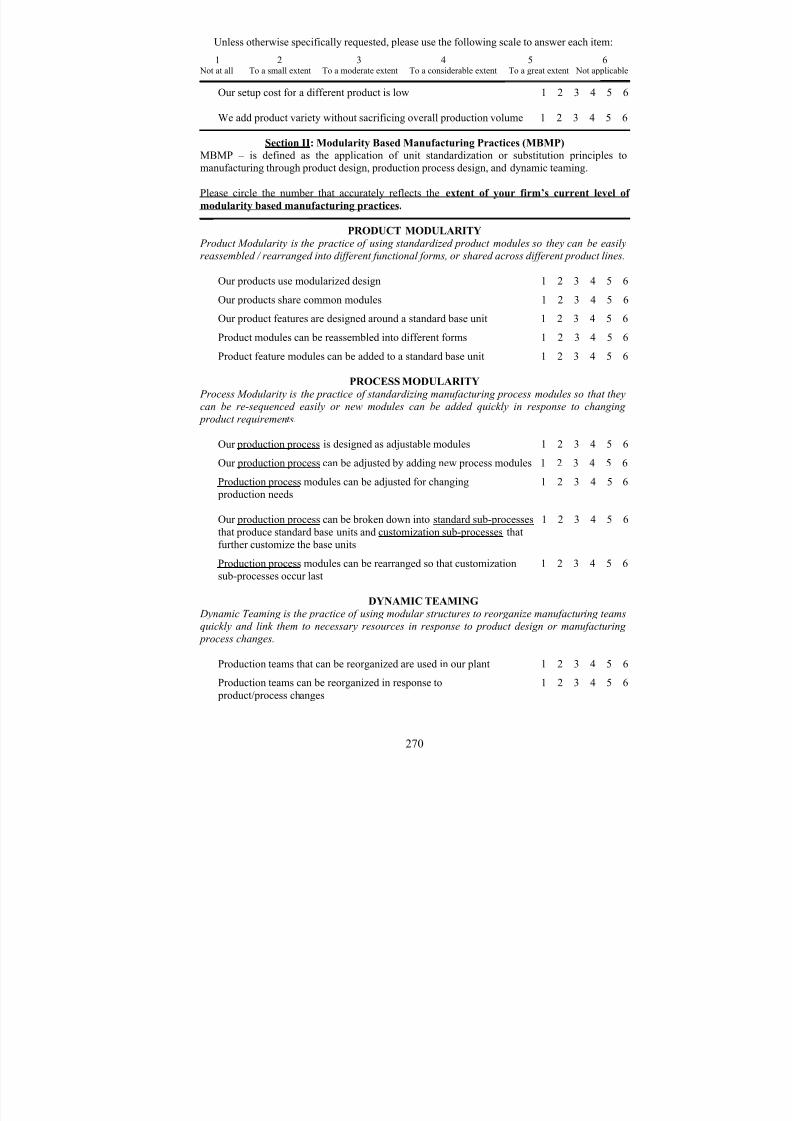
8/13/2019 Competitive_advantage of a Firm Through Supply Chain Responsiveness and SCM Practices
http://slidepdf.com/reader/full/competitiveadvantage-of-a-firm-through-supply-chain-responsiveness-and-scm 288/294
Unless otherwise specifically requested, please use the following scale to answer each item:
1 2 3 4 5 6 Not at all To a small extent To a moderate extent To a considerable extent To a great extent Not applicable
270
Our setup cost for a different product is low 1 2 3 4 5 6
We add product variety without sacrificing overall production volume 1 2 3 4 5 6
Section II: Modularity Based Manufacturing Practices (MBMP)
MBMP – is defined as the application of unit standardization or substitution principles tomanufacturing through product design, production process design, and dynamic teaming.
Please circle the number that accurately reflects the extent of your firm’s current level of
modularity based manufacturing practices.
PRODUCT MODULARITY
Product Modularity is the practice of using standardized product modules so they can be easily
reassembled / rearranged into different functional forms, or shared across different product lines.
Our products use modularized design 1 2 3 4 5 6
Our products share common modules 1 2 3 4 5 6Our product features are designed around a standard base unit 1 2 3 4 5 6
Product modules can be reassembled into different forms 1 2 3 4 5 6
Product feature modules can be added to a standard base unit 1 2 3 4 5 6
PROCESS MODULARITY
Process Modularity is the practice of standardizing manufacturing process modules so that they
can be re-sequenced easily or new modules can be added quickly in response to changing
product requirements.
Our production process is designed as adjustable modules 1 2 3 4 5 6
Our production process can be adjusted by adding new process modules 1 2 3 4 5 6
Production process modules can be adjusted for changing 1 2 3 4 5 6 production needs
Our production process can be broken down into standard sub-processes 1 2 3 4 5 6
that produce standard base units and customization sub-processes thatfurther customize the base units
Production process modules can be rearranged so that customization 1 2 3 4 5 6sub-processes occur last
DYNAMIC TEAMING Dynamic Teaming is the practice of using modular structures to reorganize manufacturing teams
quickly and link them to necessary resources in response to product design or manufacturing
process changes.
Production teams that can be reorganized are used in our plant 1 2 3 4 5 6
Production teams can be reorganized in response to 1 2 3 4 5 6 product/process changes

8/13/2019 Competitive_advantage of a Firm Through Supply Chain Responsiveness and SCM Practices
http://slidepdf.com/reader/full/competitiveadvantage-of-a-firm-through-supply-chain-responsiveness-and-scm 289/294
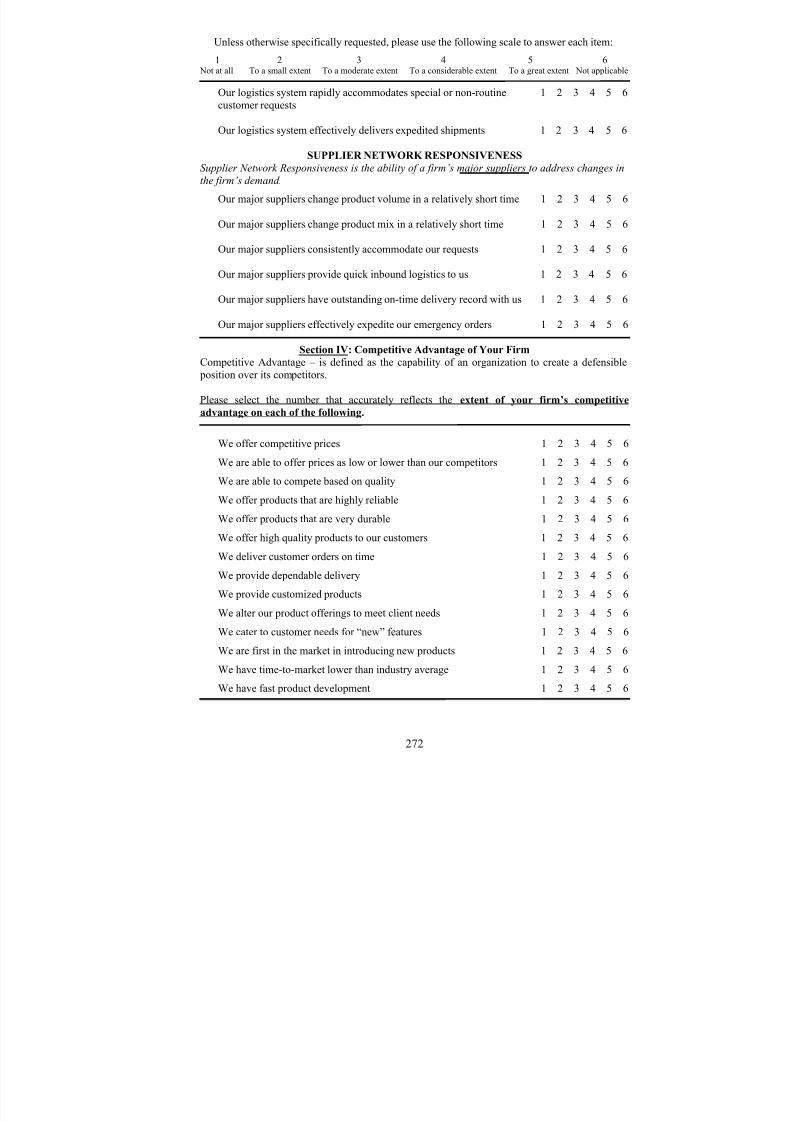
8/13/2019 Competitive_advantage of a Firm Through Supply Chain Responsiveness and SCM Practices
http://slidepdf.com/reader/full/competitiveadvantage-of-a-firm-through-supply-chain-responsiveness-and-scm 290/294
Unless otherwise specifically requested, please use the following scale to answer each item:
1 2 3 4 5 6 Not at all To a small extent To a moderate extent To a considerable extent To a great extent Not applicable
272
Our logistics system rapidly accommodates special or non-routine 1 2 3 4 5 6customer requests
Our logistics system effectively delivers expedited shipments 1 2 3 4 5 6
SUPPLIER NETWORK RESPONSIVENESS
Supplier Network Responsiveness is the ability of a firm’s major suppliers to address changes in
the firm’s demand.
Our major suppliers change product volume in a relatively short time 1 2 3 4 5 6
Our major suppliers change product mix in a relatively short time 1 2 3 4 5 6
Our major suppliers consistently accommodate our requests 1 2 3 4 5 6
Our major suppliers provide quick inbound logistics to us 1 2 3 4 5 6
Our major suppliers have outstanding on-time delivery record with us 1 2 3 4 5 6
Our major suppliers effectively expedite our emergency orders 1 2 3 4 5 6
Section IV: Competitive Advantage of Your Firm
Competitive Advantage – is defined as the capability of an organization to create a defensible position over its competitors.
Please select the number that accurately reflects the extent of your firm’s competitive
advantage on each of the following.
We offer competitive prices 1 2 3 4 5 6
We are able to offer prices as low or lower than our competitors 1 2 3 4 5 6
We are able to compete based on quality 1 2 3 4 5 6
We offer products that are highly reliable 1 2 3 4 5 6
We offer products that are very durable 1 2 3 4 5 6
We offer high quality products to our customers 1 2 3 4 5 6
We deliver customer orders on time 1 2 3 4 5 6
We provide dependable delivery 1 2 3 4 5 6
We provide customized products 1 2 3 4 5 6
We alter our product offerings to meet client needs 1 2 3 4 5 6
We cater to customer needs for “new” features 1 2 3 4 5 6
We are first in the market in introducing new products 1 2 3 4 5 6
We have time-to-market lower than industry average 1 2 3 4 5 6
We have fast product development 1 2 3 4 5 6

8/13/2019 Competitive_advantage of a Firm Through Supply Chain Responsiveness and SCM Practices
http://slidepdf.com/reader/full/competitiveadvantage-of-a-firm-through-supply-chain-responsiveness-and-scm 291/294
Unless otherwise specifically requested, please use the following scale to answer each item:
1 2 3 4 5 6 Not at all To a small extent To a moderate extent To a considerable extent To a great extent Not applicable
273
Section V: Performance of Your Firm
Please circle the number that best describes your firm’s overall performance as compared to
your industry average.
1 2 3 4 5 6
Much below Below Average Above Much above Doaverage average average average not know
Market share 1 2 3 4 5 6
Return on investment 1 2 3 4 5 6
The growth of market share 1 2 3 4 5 6
The growth of sales 1 2 3 4 5 6
Growth in return on investment 1 2 3 4 5 6
Profit margin on sales 1 2 3 4 5 6
Overall competitive position 1 2 3 4 5 6
Section VI: Demographic Information
For the following questions, please check the appropriate response.
1) Has your organization embarked upon a programaimed specially at implementing “Supply ChainManagement”?
________ Yes ________ No.If your answer is Yes, how long ? ______ years.
2) Type of Industry (SIC Code) your company is in:
SIC Description
22 Textile mill products
23 Apparel and other textile products
25 Furniture and fixtures
34 Fabricated metal products, except
machinery and transportationequipment
35 Industrial and commercialmachinery and computer equipment
36 Electronic, electrical equipment andcomponents, except computerequipment
37 Transportation equipmentOther _____________________________
3) Your company’s primary production system is(choose the most appropriate one).
____Engineer to Order _______Make to Order ____Assemble to Order _______Make to Stock
4) Your company’s primary process choice is (choosthe most appropriate one).
_____Project _____Jobshop _____Batch _____Line _____Continuous Processing
5) The number of product lines your firm makes______
6) Company Website: _________________________
7) Number of employees in your company: ___ 1 -50 ___ 51-100 ___ 101-250 ___251-500 ___ 501 -1000 ___ Over 1000
8) Average annual sales of your company in millions o$:
___ Under 5 ___5 to <10 ____10 to <25 ___25 to <50 ___ 50 to <100 ____ >100
9) Your present job title: ____CEO/president _____Director ____Manager _____Other (please indicate_____)
10) Your present job function (mark all that apply): _____ Corporate Executive _____ Purchasing _____ Manufacturing / Production _____ Distribution _____ Transportation _____ Sales _____ Other (please indicate _____________)
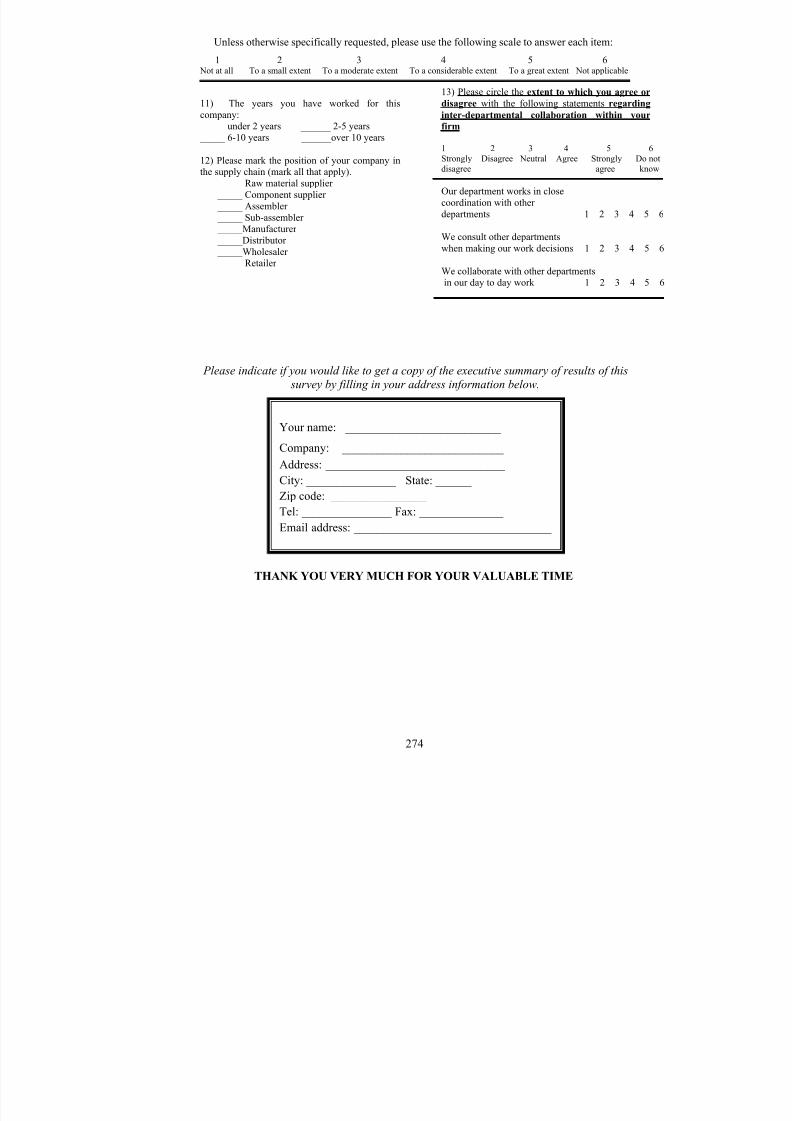
8/13/2019 Competitive_advantage of a Firm Through Supply Chain Responsiveness and SCM Practices
http://slidepdf.com/reader/full/competitiveadvantage-of-a-firm-through-supply-chain-responsiveness-and-scm 292/294
Unless otherwise specifically requested, please use the following scale to answer each item:
1 2 3 4 5 6 Not at all To a small extent To a moderate extent To a considerable extent To a great extent Not applicable
274
11) The years you have worked for thiscompany: _____ under 2 years ______ 2-5 years _____ 6-10 years ______over 10 years
12) Please mark the position of your company inthe supply chain (mark all that apply).
_____ Raw material supplier _____ Component supplier _____ Assembler _____ Sub-assembler _____Manufacturer _____Distributor _____Wholesaler _____ Retailer
13) Please circle the extent to which you agree or
disagree with the following statements regarding
inter-departmental collaboration within your
firm
1 2 3 4 5 6Strongly Disagree Neutral Agree Strongly Do notdisagree agree know
Our department works in closecoordination with otherdepartments 1 2 3 4 5 6
We consult other departmentswhen making our work decisions 1 2 3 4 5 6
We collaborate with other departmentsin our day to day work 1 2 3 4 5 6
Please indicate if you would like to get a copy of the executive summary of results of this
survey by filling in your address information below.
THANK YOU VERY MUCH FOR YOUR VALUABLE TIME
Your name: __________________________
Company: ___________________________
Address: ______________________________
City: _______________ State: ______
Zip code: ________________
Tel: _______________ Fax: ______________
Email address: _________________________________

8/13/2019 Competitive_advantage of a Firm Through Supply Chain Responsiveness and SCM Practices
http://slidepdf.com/reader/full/competitiveadvantage-of-a-firm-through-supply-chain-responsiveness-and-scm 293/294
268
APPENDIX F: ACRONYMS USED FOR CODING OF ITEMS
Supply Chain Management Practices (SCMP)
Strategic Supplier Partnership SSPCustomer Relationship CRInformation Sharing IS
Modularity Based Manufacturing Practices (MBMP)
Product Modularity PMProcess Modularity PRMDynamic Teaming DT
Supply Chain Responsiveness (SCR)
Operations System Responsiveness OSRLogistics Process Responsiveness LPRSupplier Network Responsiveness SNR
Competitive Advantage (CA)
275

8/13/2019 Competitive_advantage of a Firm Through Supply Chain Responsiveness and SCM Practices
http://slidepdf.com/reader/full/competitiveadvantage-of-a-firm-through-supply-chain-responsiveness-and-scm 294/294
APPENDIX G: IRB FROM UNIVERSITY OF TOLEDO