competitive exclusion of cyanobacterial species in the
TRANSCRIPT
Brigham Young University Brigham Young University
BYU ScholarsArchive BYU ScholarsArchive
Theses and Dissertations
2008-07-10
Competitive Exclusion of Cyanobacterial Species in the Great Salt Competitive Exclusion of Cyanobacterial Species in the Great Salt
Lake Lake
Hillary Christine Roney Brigham Young University - Provo
Follow this and additional works at: https://scholarsarchive.byu.edu/etd
Part of the Animal Sciences Commons
BYU ScholarsArchive Citation BYU ScholarsArchive Citation Roney, Hillary Christine, "Competitive Exclusion of Cyanobacterial Species in the Great Salt Lake" (2008). Theses and Dissertations. 1826. https://scholarsarchive.byu.edu/etd/1826
This Thesis is brought to you for free and open access by BYU ScholarsArchive. It has been accepted for inclusion in Theses and Dissertations by an authorized administrator of BYU ScholarsArchive. For more information, please contact [email protected], [email protected].
Competitive Exclusion of Cyanobacterial
Species in the Great Salt Lake
by
Hillary C. Roney
Brigham Young University
in partial fulfillment of the requirements for the degree of
Department of Plant and Wildlife Sciences
Brigham Young University
Master of Science
August 2008
A thesis submitted to the faculty of

Copyright © 2008 Hillary C. Roney
All Rights Reserved

BRIGHAM YOUNG UNIVERSITY
GRADUATE COMMITTEE APPROVAL
of a thesis submitted by
Hillary C. Roney
This thesis has been read by each member of the following graduate committee and by
majority vote has been found to be satisfactory.
Date Gary M. Booth, Chair
Date Donald P. Breakwell
Date John Gardner
Bruce Schaalje Date

As chair of the candidate‟s graduate committee, I have read the thesis of Hillary C.
Roney in its final form and have found that (1) its format, citations, and bibliographical
style are consistent and acceptable and fulfill university and department style
requirements; (2) its illustrative materials including figures, tables, and charts are in
place; and (3) the final manuscript is satisfactory to the graduate committee and is ready
for submission to the university library.
Date Gary M. Booth
Chair, Graduate Committee
Accepted for the Department
Loreen A. Woolstenhulme
Accepted for the College
Date Rodney Brown
Date
BRIGHAM YOUNG UNIVERSITY
ABSTRACT
Competitive Exclusion of Cyanobacterial Species in the Great Salt Lake
Hillary C. Roney
Department of Plant and Wildlife Sciences
Master of Science
Under Gause‟s principle two species cannot indefinitely occupy the same niche.
The north and south arms of Great Salt Lake are separated by a rail causeway, resulting
in salinity differences and color variation between the arms. Farmington Bay is also
separated from the south arm by a vehicular causeway to Antelope Island. These
causeways allow examination of competitive exclusion of cyanobacteria in the
hypersaline environment of the Great Salt Lake. Cyanobacterial distributions partially
map salinity, with Aphanothece halophytica proliferating in the north arm, and Nodularia
spumigena in the south arm. I hypothesized that cyanobacterial species abundant north of
the railway causeway are competitively excluded from the south by other species, and
that cyanobacterial species that thrive and bloom south of the Antelope Island causeway
cannot grow in the high salinity of the north. To test these hypotheses, 129 flasks of
autoclaved water from the north and south sides of each causeway were inoculated with
Great Salt Lake water samples from the north and south sides of the causeways. Four
genera of
cyanobacteria, Aphanothece, Oscillatoria, Phormidium, and Nodularia were identified
and counted from the culture flasks using comparative differential interference contrast,
fluorescence, and scanning electron microscopy. Counts of the cyanobacteria found in
each flask were totaled and two way Analysis of Variance tests as well as exact tests were
performed. Rankings of median abundances were also calculated.
These data support the first hypothesis because Aphanothece halophytica was
found in all inocula, but appears to be suppressed by the presence of Nodularia
spumigena, which periodically blooms. The second hypothesis is also supported by the
data because N. spumigena was found only in inocula from the less saline waters south of
Antelope Island causeway, and apparently cannot survive the high saline waters north of
the railway causeway.

ACKNOWLEDGEMENTS
I want to thank my advisor Dr. Booth and my graduate committee for all of their
support, encouragement and help on this thesis. I thank the Institute for Ethnomedicine
for access to their microscopy facility in Jackson Hole. I thank my parents, Paul and
Barbara Cox, for contributing ideas, encouragement, transportation and support; my in-
laws, Blake and Nancy Roney, for letting me use their greenhouse and encouragement;
Professor Lee and the BYU Microbiology stockroom for autoclaving my samples; The
BYU SEM lab for assistance on the ESEM; my husband Britton for pushing me forward
and reading numerous drafts of this paper; and the countless brine shrimp that gave their
lives for this research.

viii
Table of Contents
List of Figures .................................................................................................................... ix
List of Tables ...................................................................................................................... x
I. Introduction: Niches and Ecological Theory ................................................................... 1
II. Cyanobacteria ................................................................................................................. 1
III. The Great Salt Lake and Causeway Partitioning .......................................................... 4
IV. Previous Studies on the Cyanobacteria of the Great Salt Lake .................................... 7
V. Great Salt Lake Cyanobacteria and Gause‟s Principle .................................................. 9
VI. Methods ...................................................................................................................... 11
A. Experimental Cultures ................................................................................................... 11
B. Identification of Cyanobacteria ...................................................................................... 16
C. Data Analysis Methods ................................................................................................... 17
VII Results and Discussion ............................................................................................... 19
A. Experimental cultures ..................................................................................................... 19
B. Identification of Cyanobacteria ...................................................................................... 20
C. Data Analysis .................................................................................................................. 24
VIII Future Studies ........................................................................................................... 31
IX. References................................................................................................................... 31
X. Appendix: Original and Transformed Data ................................................................. 35

ix
List of Figures
Figure 1: Union Pacific train on railway causeway ...................................................... 4
Figure 2: The Great Salt Lake (From USGS) ............................................................... 5
Figure 3: North and south sides of the railway causeway. ........................................... 9
Figure 4: Antelope Island causeway. .......................................................................... 13
Figure 5: The railway causeway. ................................................................................ 13
Figure 6: Liquid cultures ............................................................................................. 16
Figure 7: Samples from the north and south side of the railway causeway. ............... 19
Figure 8: Oscillatoria spp. .......................................................................................... 21
Figure 9: Aphanothece halophytica ............................................................................ 22
Figure 10: Phormidium tenue. .................................................................................... 22
Figure 11: Spirulina labyrinthiformis ......................................................................... 23
Figure 12: Nodularia spumigena.. .............................................................................. 23
Figure 13: Comparative Means. .................................................................................. 24

x
List of Tables
Table 1: Media and inocula setup ............................................................................... 14
Table 2: Competition experimental setup ................................................................... 15
Table 3: Control experimental setup ........................................................................... 15
Table 4: Ranked orders of Aphanothece, Oscillatoria, Nodularia, and Phormidium. 25
Table 5: Cyanobacteria ranking by medians. .............................................................. 26
Table 6: ANOVA of Aphanothece halophytica counts .............................................. 26
Table 7: ANOVA of Dunaliella spp. counts .............................................................. 26

1
I. Introduction: Niches and Ecological Theory
In ecological theory, species occupy different niches within any given habitat.
Niches, which can be mathematically represented as multi-dimensional volumes along
axes of different nutrient, temperature, spatial, and biotic components, can be thought of
as an organism‟s “profession”. In a similar manner, the habitat can be thought of as an
organisms “address.” Often in constrained habitats, such as small oceanic atolls, a limited
number of niches exist. This is reflected by the low terrestrial species diversity of atolls,
as well as the high rates of extinction for new island immigrants. Niches are abundant in
continental areas, such as tropical rainforests. Evolutionary forces, including adaptive
radiation, can lead to species evolving specific niches. However, in ecological time,
occupancy of niches occurs primarily through immigration and subsequent shifts in
species distributions.
Although species diversity is greatest in areas with comparatively benign physical
environments such as tropical rain forests or coral reefs, there is no theoretical reason
why few species should exist in extreme environments such as arctic ice sheets, caves,
undersea volcanic smokers, or hypersaline lakes unless limitations on species diversity in
abiotically challenging environments likely reflect the limited ways that organisms can
adapt to intense temperature, pH, or osmotic stress.
II. Cyanobacteria
Cyanobacteria, once known as “blue-green” algae, are photosynthetic prokaryotic
organisms that are perhaps most similar to the earliest organisms on earth than other
extant species. Reliable fossil records suggest that cyanobacteria existed on earth
approximately 3500 million years ago and are still very similar to their Precambrian
2
microfossils (Castenholz 1992, Schopf 2000). Macrofossil indications of cyanobacterial
presence consist of fossilized stromatolites, formed by layered secretions of
cyanobacteria in marine systems.
Cyanobacteria are well-adapted for living in harsh conditions where other
organisms cannot survive. Examples of such areas include deep sea thermal vents,
photosynthetic areas beneath Antarctic ice, hot springs and geysers in Yellowstone, and
high saline lakes and ponds, including the hypersaline environment of the Great Salt Lake
(Dyer 2003).
Although cyanobacteria are taxonomically embedded within the Bacteria as a
whole, phylogenetic relationships within the cyanobacterial radiation are not well
understood (Brown et al. 2001). Genomes have been derived for Nostoc strains, but
pending further genetic determination, relationships within the cyanobacterial radiation
are unclear. Traditionally most workers split the cyanobacteria into five groups based on
their branching morphology in culture (Rippka et al. 1979).
Since the cyanobacterial species are not well defined, and cyanobacteria taxonomy
is poorly understood and often difficult to determine, different authors often use different
names for the same morphological type (Oren 2000). This is true for the cyanobacterium
Aphanothece halophytica. J. Bauld stated, “Aphanothece halophytica, Aphanocapsa
halophytica, Aphanothece packardii, Polycystis packardii, Microcystis packardii,
Aphanothece utahensis, and Coccochloris elabens, appear to be synonyms for the same
coccoid cyanobacterium” (as quoted in Valera 1988a). The phenotypic method is still the
most common and appropriate way of identifying and classifying cyanobacteria for
practical purposes (Cronberg and Annadotter 2006).
3
Two common cyanobacteria species that have been identified from the Great Salt
Lake are Aphanothece halophytica and Nodularia spumigena. Thomas Brock was the
first person to identify A. halophytica from the Great Salt Lake. Brock called A.
halophytica, “the most halophilic blue-green alga known” (Brock 1976). Most of his
isolates from the north part of the Lake were taken from a fossil algal reef just off Rozel
Point in the northern arm. Brock found that A. halophytica grew the most rapidly in salt
concentrations between 16-23%, slow growth occurred at 7%, no growth occurred at
3.5%, and at 30% salt concentrations growth occurred but it was very slow (Brock 1976).
A. halophytica is considered a true halophile and can be found worldwide at salinities
above 1000/00 (Oren 2000). The nomenclature of A. halophytica is confusing (as
mentioned above) and very few, if any, modern taxonomic phylogenetic studies have
been performed on Aphanothece. A. halophytica is unicellular varying from 2-10µm, has
ellipsoidal, ovoid, or cylindrical shapes, and often has a mucilaginous polysaccharide
coating. A. halophytica occurs both as a benthic and planktonic species (Oren 2000).
The cyanobacterium Nodularia spumigena is present in the most southern part of
the Great Salt Lake (Farmington Bay). Sometimes there are large blooms of N.
spumigena in Farmington Bay (Marcarelli et al. 2006). N. spumigena has a worldwide
distribution and is a toxic species that produces the cyanotoxin nodularin. N. spumigena
has straight or spirally twisted trichomes that are enclosed in a mucilaginous sheath and
elliptical heterocysts which are 14µm in diameter and 7µm long (Cronberg and
Annadotter 2006).
Since nitrogen is the limiting nutrient in the Great Salt Lake (Oren 2002) it is
interesting to note that both A. halophytica and N. spumigena can fix nitrogen. A.

4
halophytica fixes nitrogen and has the capability of anoxygenic photosynthesis with
sulfide as an electron donor (Oren 2000).
III. The Great Salt Lake and Causeway Partitioning
The Great Salt Lake is a hypersaline, thalassohaline remnant of the ancient
Pleistocene Lake Bonneville (Oren 2002b). About 15,000 years ago, Lake Bonneville
was 346 miles (557km) long and 145 miles (233km) wide, occupying 20,000 square
miles in what is now Utah, Idaho, and Nevada but then rapidly emptied due to a break in
Red Rock pass in Idaho (Utah Geological Survey 1990). In prehistory, as Lake
Bonneville retreated the lake lost all outlets, so salinity increased.
To save hundreds of additional rail miles for trains traveling across the North
American continent, the Southern Pacific
Railroad (since absorbed into the Union
Pacific Railroad) constructed a railway
causeway across the Great Salt Lake in 1959
(Fig. 1). This replaced an earlier trestle built in
1902 by Southern Pacific. To approach the
former trestle, a rock fill crossed Bear River
Bay, and then led to an open wooden trestle (which did not impact flow of water) across
the 12-13 mile central part of the lake (Butts 1980). The new 1959 central portion of the
railway causeway is 12 miles (19km) long and built with rock fill, with only two culverts
allowing exchange of water between the north and south portions (Sturm 1980). The
1902 wooden trestle and the 1959 rock fill causeway routed trains directly across the lake
waters, avoiding the historic terrestrial corridor which went north from Ogden near
Figure 1: Union Pacific train on railway causeway
5
Promontory Point, where the golden spike was placed. Unlike the 1902 wooden trestle,
the 1959 causeway
hydrologically divided the
waters of the Great Salt Lake
into two portions, a northern
arm with negligible freshwater
inputs, and a southern arm with
more than 90% of the
freshwater flow (Oren 2002b).
Three major freshwater rivers
– the Bear River, the Weber River and the Jordan River – all flow into the Great Salt
Lake south of the railway causeway (Gwynn 2002). The overall salinity of the Great Salt
Lake, which to that point had been linked solely to changing lake levels, quickly adjusted
with the northern arm becoming even more hypersaline, moving from an average of 15%
in the 1870s to as high as 28% salinity in the 1960s (Sturm 1980). In 1970, the northern
arm held approximately 330-350 g salts per liter, while the south arm held 120-130 g
salts per liter (Oren 2002b).
The habitat changes, created by the construction of the railway causeway, were
later partially replicated with construction of a second barrier to lake water flow – this
time a causeway for vehicular use – from Syracuse, Utah to Antelope Island. Previously,
a roadway was built over mud flats in about 1952 to the northern tip of Antelope Island,
which was later turned into a highway in 1969 with the creation of Antelope Island State
Park. Subsequent flooding in the early 1980s, concomitant with historic highs in the
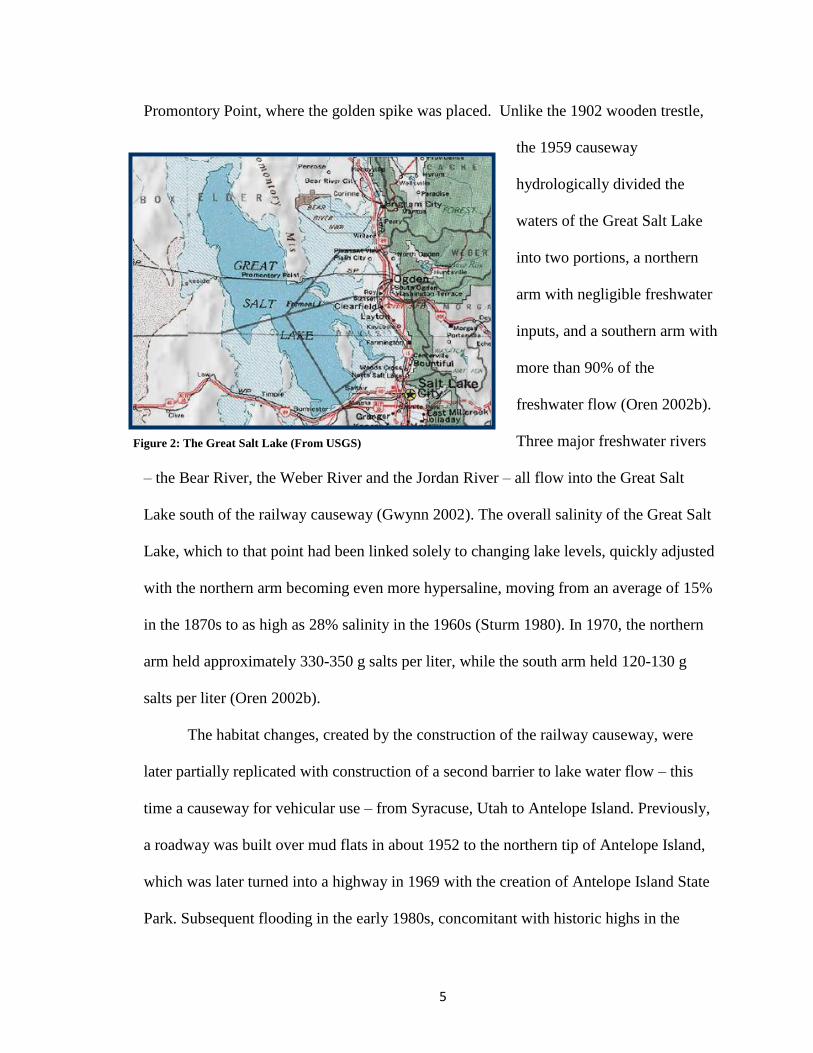
Figure 2: The Great Salt Lake (From USGS)
6
levels of the Great Salt Lake, breached the Antelope Island highway. After nearly a
decade hiatus, the vehicular causeway was rebuilt in 1992 for visitor access to Antelope
Island State Park (Gwynn 2002). These two different causeways resulted in the
partitioning of the Great Salt Lake into three different salinity regimes: the northern arm,
with an average of 27% salinity, the middle arm with average salinity of 10-16%, and the
southern arm, with average salinity of 6% or less (Utah Geological Survey 1990).
Geologically, the Great Salt Lake is divided into three bays: The northern part is
called Gunnison Bay, the center part is called Gilbert Bay and the far southern part is
called Farmington Bay (Fig 2). These three different salinity regimes, any one of which
would be considered hypersaline, allowed species to sort according to ecological
tolerances. The results are striking: each large area of the lake has different colored water,
resulting in part from different concentrations of Artemia fransiscana brine shrimp cysts
and microscopic green algae such as Dunaliella salina and Dunaliella viridis, but also
perhaps due to different concentrations and species compositions of cyanobacteria.
By the early 1990s, three distinct hypersaline niches were inadvertently created in
the Great Salt Lake by construction of the causeways. I became interested in seeing how
cyanobacterial species sorted themselves in these varying salinity regimes and to see if
biotic competition and salinity tolerances resulted in some cyanobacteria species being
competitively excluded from some regions of the lake. I postulated that the partitioning of
the lake by the two causeways could provide the basis for testing Gause‟s theory of
competitive exclusion.
Previous explanations for apparent persistence of competing species in the same
niche such as G. E. Hutchinson‟s „Paradox of the Plankton‟ (1961), were based on the
7
existence of non-equilibrium conditions, such as turbulence within the water column.
Since the causeways across the Great Salt Lake were constructed decades ago, it is
unlikely that cyanobacterial populations in the three different salinity regimes remain in
disequilibrium due to turbulence or similar stochastic effects. Local turbulence generated
by wave motion and storms may effect population dynamics within each salinity realm,
but not between salinity realms. Hutchinson‟s “Paradox of the Plankton” does not,
therefore, appear in the Great Salt Lake to allow persistence of cyanobacterial species
which share the same niche. Darlington (1972) suggests that Hutchinson (1961) may
have confused failure to achieve equilibrium with competitive exclusion . Therefore my
experiments were designed to determine which cyanobacteria species occupy different
regions, and to determine if any observed differences were due to an intrinsic difference
in salt tolerance, or if they could be due to competitive exclusion.
IV. Previous Studies on the Cyanobacteria of the Great Salt Lake
Since the Great Salt Lake in Utah is one of the largest saline lakes in the world
(Sturm 1980), and because cyanobacteria are major factors in nitrogen cycles within the
lake, its cyanobacterial flora is of significant interest. Prior to 1959 the Great Salt Lake
was mostly uniform in its brine concentrations (Gywnn 2002). Now, with the railway
and vehicular causeways, the waters are separated. In the vehicular causeway to Antelope
Island, there are two 15 foot culverts that serve as the only connections between these
parts of the lake that were once an uninterrupted body of water (Stephens and Gillespie
1976).
Felix and Rushforth (1980) identified four species of cyanobacteria that occur in
the Great Salt Lake. They recorded Spirulina major as occurring only in Farmington Bay,

8
and Coccochloris elebans as occurring only in the southern arm, with Microcoleus
lyngbaceus and Nodularia spumigena occurring in both waters. These authors were
apparently unaware of an earlier study by Brock (1976) in which he isolated the
cyanobacterium Aphanothece halophytica from the Great Salt Lake. Felix (1978) may
have observed this truly halophytic cyanobacterial species in the south arm but confused
it with Coccochloris elebans (Felix and Rushforth 1980). Brock notes:
“This alga could be cultured from other samples collected
in saturated brine which did not show any microscopic
evidence of the organism . . . Since cultures of the
halophytic Aphanothece were able to grow in saturated
brine, albeit very slow, it seems reasonable to conclude that
the alga can maintain populations in brine, but grows much
better when the salinity is reduced” (1976).
In their 1980 paper, Felix and Rushforth cite Flowers and Evans, (1966) who
report Coccochloris elabens (Aphanothece halophytica) as the most abundant algal
species in the lake. Felix and Rushforth‟s explanation for finding C. elebans infrequently
was that the decreasing salinity in the south arm fosters diatom growth and limits the
growth of C. elabens (Felix and Rushforth 1980). In 1982, Rushforth and Felix listed C.
elabens as common in the south arm, with Nodularia spumigena as rare in the south arm.
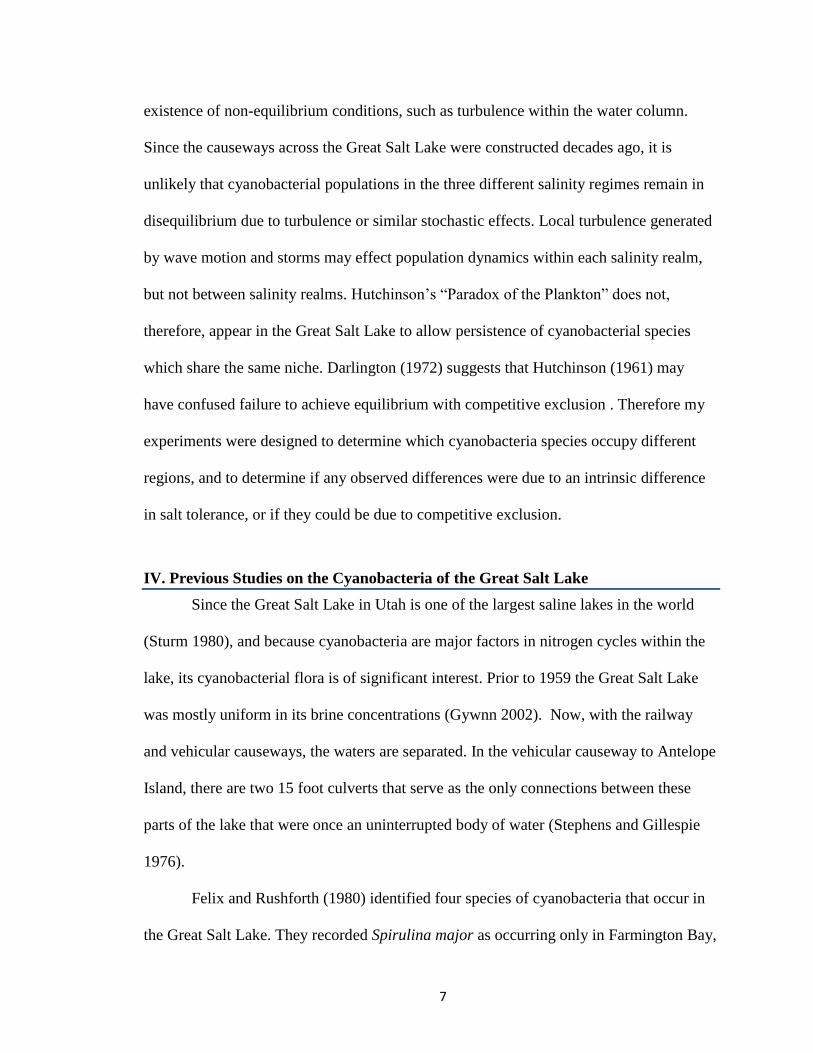
In my initial sampling, I found clear visual differences in color on both sides of
the railway causeway (Fig. 3) which perhaps reflects differences in cyanobacterial
species composition in addition to Dunaliella densities. This raises an interesting
ecological question: are the species on north side of the causeway and the species on the
south side of the causeway uniquely adapted to high and low salinity respectively, or,
could the northern species grow in the fresher southern waters, but are prevented from
doing so by competition from other species?
9
Figure 3: North and south sides of the railway causeway.
Although studies have been done concerning cyanobacteria inhabiting harsh
hypersaline waters such as the Great Salt Lake, (Brock 1976, Butts 1980, Felix and
Rushforth 1978), Marcarelli et al 2006, Oren 2002, Post 1981, Stephens and Gillespie
1976, and Sturm 1980), I have found no previous studies that have been performed on
Gause‟s principle as applied to cyanobacteria of the Great Salt Lake.
V. Great Salt Lake Cyanobacteria and Gause’s Principle
The question of whether the north species are out-competed in the south waters by
the southern species is similar to the question pursued by the microbiologist Gause
(1969) who derived what we now know as Gause‟s Principle: two similar species cannot
indefinitely share the same niche because one of the other species will competitively
10
exclude the other. One author summed up Gause‟s Principle as “complete competitors
cannot coexist” (Hardin 1960). Empirical verification of Gause‟s Principle was originally
provided by competition experiments on Paramecium aurelia and P. caudatum growing
in mixed culture, where “Paramecium caudatum gradually diminished as a result of its
being driven out by P. aurelia” (Gause 1969). Gause‟s principle became foundational in
ecology, and is cited in most textbooks: “Two similar species scarcely ever occupy
similar niches, but displace each other in such a manner that each takes possession of
certain particular kinds of food and modes of life in which it has an advantage over its
competitor” (Gause 1969).
Gause‟s principle is conceptually important in the formation of modern ecological
theory and has been used to help derive the theoretical basis of island biogeography, as
well as providing an ecological engine for evolutionary change. Clearly this is the basis
for adaptive radiation in evolutionary ecology and competitive exclusion. Although the
principle has often been applied to develop theory, there have been only few other
experimental verifications of Gause‟s principle.
Since the Great Salt Lake is divided into salinity regimes by two causeways– a
railway causeway which separates the northern arm of the lake from the southern portion,
and a vehicular causeway from Syracuse, Utah to the northern tip of Antelope Island–
these causeways allow a test of Gause‟s principle. The waters south of each causeway are
less saline (because of fresh water inputs) than the waters north of each causeway. Aerial
photographs (Fig. 3) show the water on either side of the causeways to be colored
differently, which suggests that the different salinity regimes of the lake maintain
different algal and cyanobacterial floras.
11
The main purpose of my study was to determine whether cyanobacterial
distributions in the Great Salt are influenced by abiotic factors, biotic factors, or both. To
test this question, experiments were designed to examine two hypotheses:
Hypothesis 1: Cyanobacterial species abundant north of the railway
causeway are competitively excluded from the south
by other species.
Hypothesis 2: Cyanobacterial species that thrive and bloom south
of the Antelope causeway cannot grow in the high
salinity of the north.
VI. Methods
A. Experimental Cultures
A total of 28 water samples from both the north and south sides of Antelope
Island causeway and the north and south sides of the railway causeway (seven from each
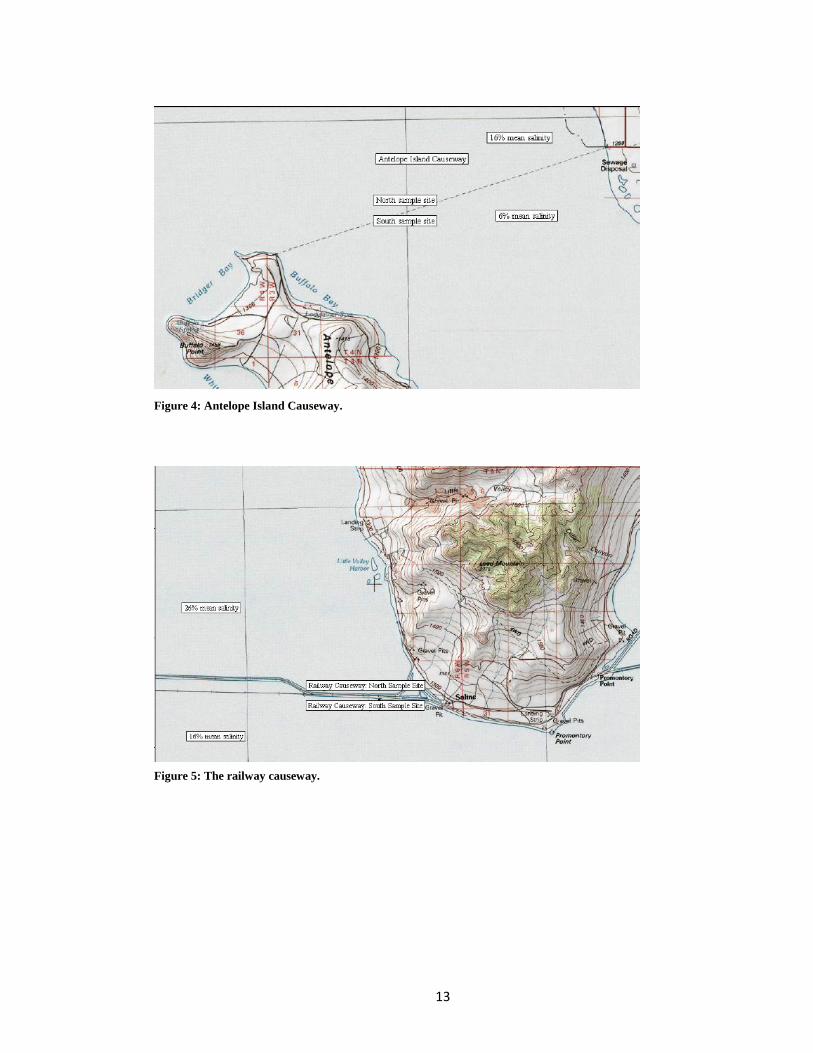
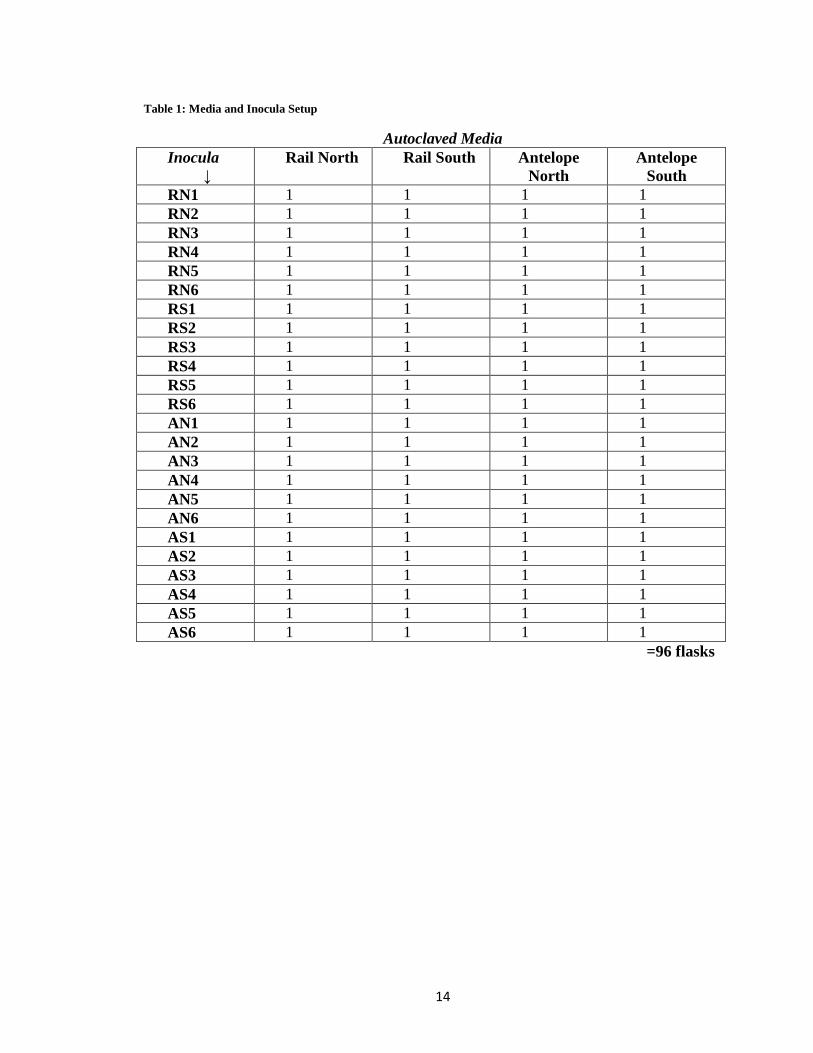
site) were collected in December 2007 (Fig. 4, 5). Since the Antelope Island causeway is
accessible to vehicles, water collections could be made by driving to the center of the
causeway. Sample sites were chosen based on distance from the two fifteen-foot culverts
that link both sides of the lake and accessibility to sufficiently deep water levels. Samples
were collected from either side of the Union Pacific railway causeway to the area west of
the remote Promontory peninsula, by parking a vehicle next to the tracks.
Digital thermometers were used to take the temperatures of the water on each side
of the causeways and the GPS coordinates of the sample sites were recorded.
To avoid pseudoreplication, six water samples from both sides of the Antelope and
railway causeways, approximately four liters in volume, were labeled as inocula. The
seventh jar from each side was approximately eight liters in volume and labeled as media.
The media water was filtered using 185 mm Whatman grade 3 filter paper.

12
Approximately 30 ml of the filtered media water was placed in autoclavable, sterile 50ml
nalgene plastic flasks.
In total there were 96 flasks (Table 1). Each of the 96 flasks were inoculated with
approximately 10 ml of unsterilized water from either the north or the south Great Salt
Lake water causeways totaling six replicates of inoculum water for each medium type.
No nutrients or other growth media were added to the water, which is a newer technique
of isolating rare bacteria from nature (Dyer 2003).
For the competition experiments, 30 ml of media water were autoclaved, and then
5 ml of inoculum from both the north and south sides of the causeways (north and south
railway together, and Antelope north and south together) were added. A random number
table was used to decide which sample jars to draw the inoculum from. There were a total
of 12 competition experiments.
In addition to the other experiments, 20 control flasks were prepared using
autoclaved media and autoclaved inocula. A random number table was used to decide
from which sample jars to draw the inoculum. In addition, one control flask was prepared
which consisted of autoclaved distilled water inoculated into autoclaved distilled water
medium (refer to Tables 1-3 for experimental design).
13
Figure 4: Antelope Island Causeway.
Figure 5: The railway causeway.
14
Table 1: Media and Inocula Setup
Autoclaved Media
Inocula
↓
Rail North Rail South Antelope
North
Antelope
South
RN1 1 1 1 1
RN2 1 1 1 1
RN3 1 1 1 1
RN4 1 1 1 1
RN5 1 1 1 1
RN6 1 1 1 1
RS1 1 1 1 1
RS2 1 1 1 1
RS3 1 1 1 1
RS4 1 1 1 1
RS5 1 1 1 1
RS6 1 1 1 1
AN1 1 1 1 1
AN2 1 1 1 1
AN3 1 1 1 1
AN4 1 1 1 1
AN5 1 1 1 1
AN6 1 1 1 1
AS1 1 1 1 1
AS2 1 1 1 1
AS3 1 1 1 1
AS4 1 1 1 1
AS5 1 1 1 1
AS6 1 1 1 1
=96 flasks

15
Table 2: Competition Experimental Setup Autoclaved Media
Inocula
↓
Rail North Rail South Antelope
North
Antelope
South
RN7+RS7 1
RN7+RS7 1
RN4+RS4 1
RN4+RS4 1
RN6+RS6 1
RN6+RS6 1
AN2+AS2 1
AN2+AS2 1
AN3+AS23 1
AN3+AS3 1
AN4+AS4 1
AN4+AS4 1
=12 flasks
Table 3: Control Experimental Setup
Autoclaved media
Autoclaved
Inocula↓
Rail North Rail South Antelope
North
Antelope
South
Water
RN5 1
RN5 1
RN5 1
RN5 1
RS5 1
RS5 1
RS5 1
RS5 1
AN1 1
AN1 1
AN1 1
AN1 1
AS3 1
AS3 1
AS3 1
AS3 1
Water 1
Water 1
Water 1
Water 1 1
=21 flasks

16
After all 129 flasks were inoculated, they were placed in a heated green house.
Growth lights provided constant 8.5 hour/ day illumination. Each flask was gently shaken
periodically for aeration. These liquid cultures were incubated for 7 weeks (Fig. 6).
B. Identification of Cyanobacteria
In their manual on aquatic cyanobacteria, Gertrud Cronberg and Helene
Annadotter state that to identify cyanobacteria, light microscopy, phase and/or
interference contrast, and sometimes electron
microscopy should be used (Cronberg and
Annadotter 2006). Identification and abundance
counts of the cyanobacteria from the Great Salt
Lake were performed using a Zeiss Axioplan
microscope with differential interference
contrast imaging and epi- fluorescence imaging at the Institute for Ethnomedicine
Research Center in Jackson Hole, Wyoming. Scanning Electron Microscope (SEM)
photos were taken to verify species in the culture flasks. The SEM protocols for each
sample were strictly followed:
1) Fix in 2% Glutaraldehyde ( .06M cacodylate)
2) Wash in washing buffer ( .03M sodium cacodylate) 6X10 minutes each
3) Stain and fix with OsO4 (osmium tetroxide)
4) Rinse with distilled water 6X10 minutes each
5) Place in filter paper pouch
6) Dehydrate with acetone series: 10%, 30%, 50%, 70%, 95%, 100%
7) Pelco critical point dry
8) Mount on stub with two sided conductive tape
9) Polaron E5300 gold sputter coating
Figure 6: Liquid cultures

17
C. Data Analysis Methods
Two slides from each flask were prepared, with two sweeps of each slide counted
to determine relative species abundance. Counts were recorded on a six-cell mechanical
lab counter, with four common Great Salt Lake cyanobacterial species (Aphanothece
halophytica, Oscillatoria sp., Phormidium tenue, and Nodularia spumigena) labeled on a
specific button. In addition to cyanobacterial species, one button was also labeled for the
green alga Dunaliella spp.
For ease of analysis, the counts of the two slides were summed. In the case of
mass colonies of cyanobacteria where individual numbers were high, the colony was
counted as either “500” for large colonies or “1000” for very large colonies.
In each of the sixteen possible combinations of four types of media (railway
north, railway south, Antelope north, and Antelope south) and four types of inocula
(railway north, railway south, Antelope north, and Antelope south), the median counts of
the four major cyanobacterial species (Aphanothece halophytica , Oscillatoria sp.,
Phormidium tenue, and Nodularia spumigena) were ranked and recorded.
A two-way Analysis of Variance (ANOVA) was calculated for abundance of
Aphanothece halophytica and the green alga Dunaliella spp. in the culture flasks, using
hand calculations entered on an Excel spreadsheet. The results were checked with the
computer program SAS. F statistics were calculated for each species to test three different
pairs of hypotheses:
Hypothesis pair #1
Ho : There is no variation in cyanobacterial or algal counts due to differences in
media.

18
H1 : There is variation in cyanobacterial or algal counts due to
differences in media.
Hypothesis pair #2
Ho : There is no variation in cyanobacterial or algal counts due to differences in
inocula.
H1 :There is variation in cyanobacterial or algal counts due to
differences in inocula.
Hypothesis pair #3
Ho : There is no variation in cyanobacterial or algal counts due to interactions
between differences in media and inocula.
H1 : There is variation in cyanobacterial or algal counts due to
interactions between differences in media and inocula.
Each hypothesis was tested for significance, with the null hypothesis to be rejected at
the p<0.05 level. Square root transformations were used on the two ANOVAS, which is
common for count data.
Given the absence of the cyanobacterial taxa Nodularia spumigena, Phormidium
tenue, and Oscillatoria sp. from many (but not all) of the culture flasks, a two-way
ANOVA was not an appropriate statistical technique for data analysis, and so exact
logistic tests were calculated.
19
VII Results and Discussion
A. Experimental cultures
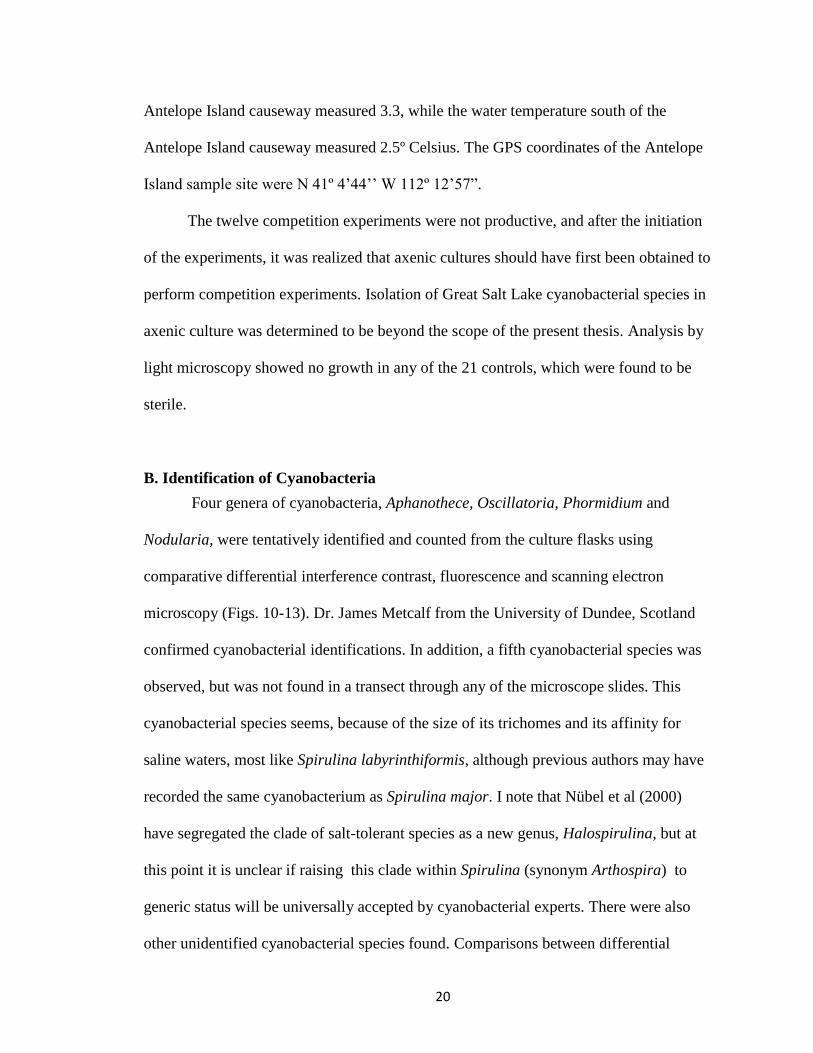
Sampling for the experimental cultures of Great Salt Lake water on the north and
south side of the railway causeway exhibited profoundly different colors when observed
from the air (Fig. 3). This color difference was confirmed when the samples were
collected on either side of the causeway (Fig. 7). Water samples from north of the railway
causeway appeared distinctly reddish while water samples from the south side of the
railway causeway appeared to be greenish. Salinity readings of the four types of media
measured by hydrometers also differed: waters from the south side of Antelope causeway
were 20.6 ppt, waters from north of the Antelope causeway were 75 ppt, waters from
south of the railway causeway were 155ppt, and waters north of the railway causeway
were 195ppt (Roney 2007). Salinity values of the flasks were altered slightly by addition
of inocula, except when the same inoculum was added to the same medium.
At the time of sampling (December 14, 2007), the ambient air temperature on the
railway causeway was -2.2 C.
Water temperatures north of the
railway causeway measured 2.0
C, and the water temperatures
south of the railway causeway
measured 4.3 C. The GPS
coordinates of the railway
causeway sample site were N 41º
13‟16‟‟ W 112º 32‟34”. The
ambient air temperature at the Antelope Island causeway was -2.8 C. The waters north of
Figure 7: Samples from the north and south side of the railway
causeway.
20
Antelope Island causeway measured 3.3, while the water temperature south of the
Antelope Island causeway measured 2.5º Celsius. The GPS coordinates of the Antelope
Island sample site were N 41º 4‟44‟‟ W 112º 12‟57”.
The twelve competition experiments were not productive, and after the initiation
of the experiments, it was realized that axenic cultures should have first been obtained to
perform competition experiments. Isolation of Great Salt Lake cyanobacterial species in
axenic culture was determined to be beyond the scope of the present thesis. Analysis by
light microscopy showed no growth in any of the 21 controls, which were found to be
sterile.
B. Identification of Cyanobacteria
Four genera of cyanobacteria, Aphanothece, Oscillatoria, Phormidium and
Nodularia, were tentatively identified and counted from the culture flasks using
comparative differential interference contrast, fluorescence and scanning electron
microscopy (Figs. 10-13). Dr. James Metcalf from the University of Dundee, Scotland
confirmed cyanobacterial identifications. In addition, a fifth cyanobacterial species was
observed, but was not found in a transect through any of the microscope slides. This
cyanobacterial species seems, because of the size of its trichomes and its affinity for
saline waters, most like Spirulina labyrinthiformis, although previous authors may have
recorded the same cyanobacterium as Spirulina major. I note that Nübel et al (2000)
have segregated the clade of salt-tolerant species as a new genus, Halospirulina, but at
this point it is unclear if raising this clade within Spirulina (synonym Arthospira) to
generic status will be universally accepted by cyanobacterial experts. There were also
other unidentified cyanobacterial species found. Comparisons between differential

21
interference contrast microscopy, fluorescence microscopy, and scanning electron
microscopy allowed different observations of cyanobacterial morphology and size to be
compared for taxonomic identification.
Figure 8: Oscillatoria spp. left: Differential Interference Contrast Microscopy; middle: Fluorescence
Microscopy; right: Scanning Electron Microscopy
22
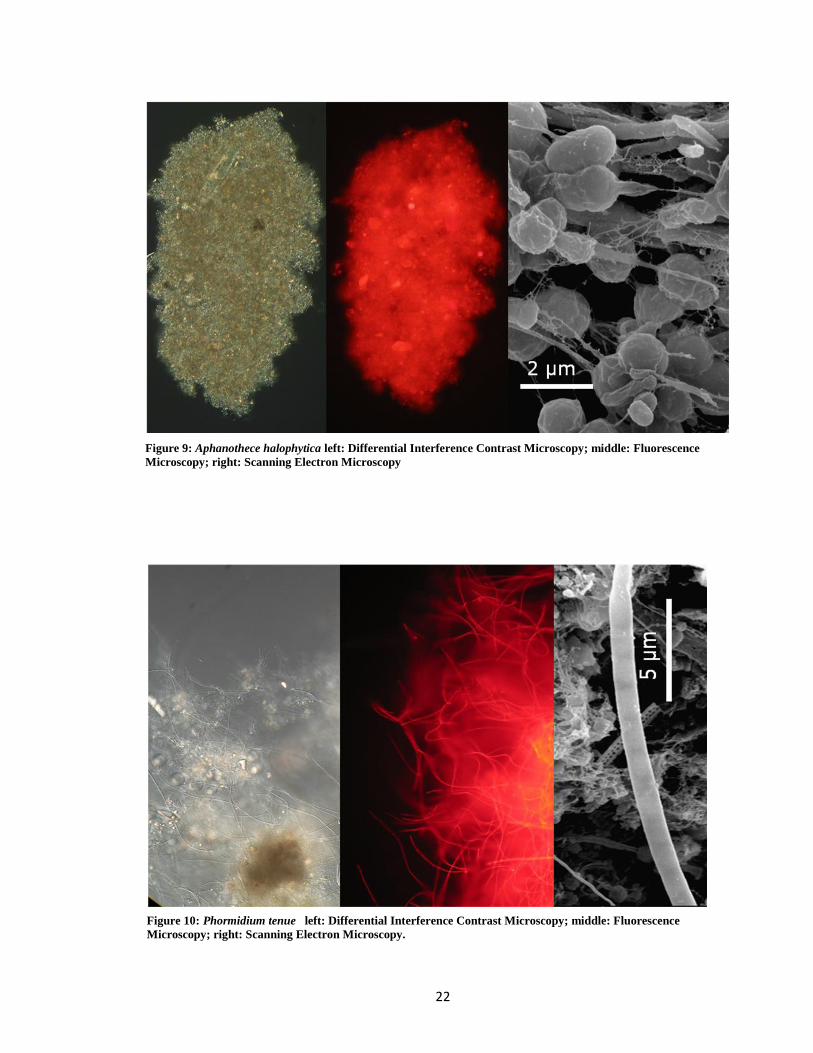
Figure 9: Aphanothece halophytica left: Differential Interference Contrast Microscopy; middle: Fluorescence
Microscopy; right: Scanning Electron Microscopy
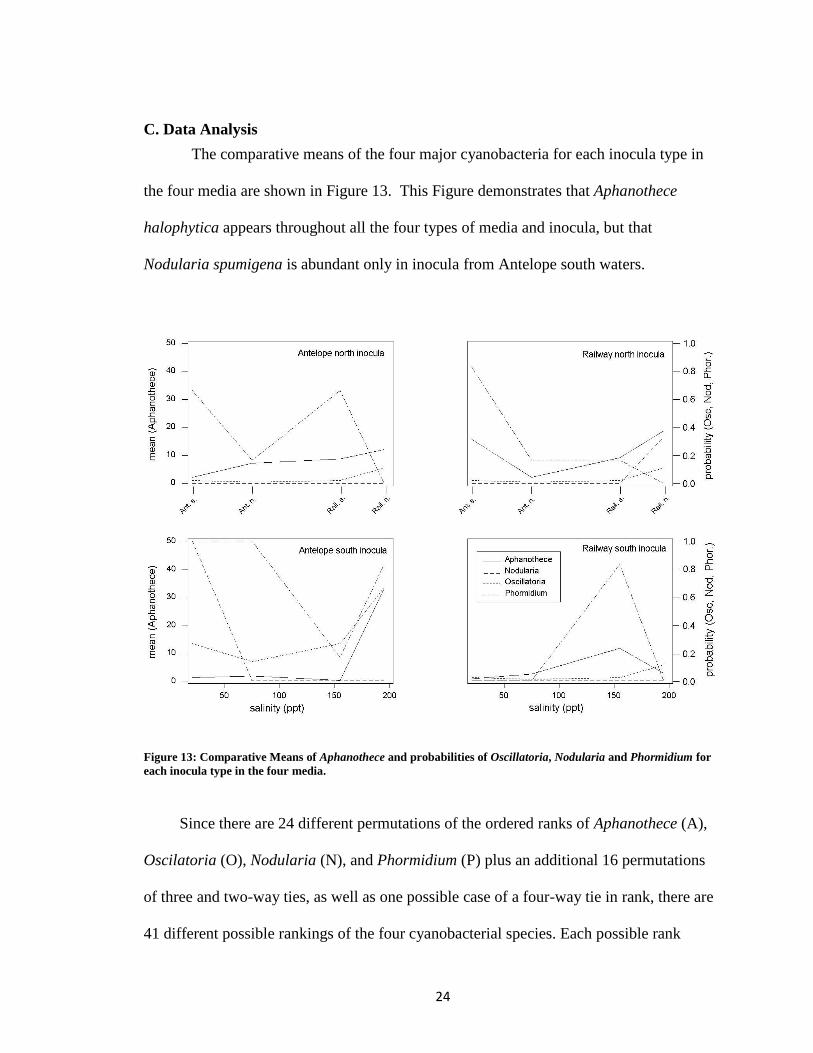
Figure 10: Phormidium tenue left: Differential Interference Contrast Microscopy; middle: Fluorescence
Microscopy; right: Scanning Electron Microscopy.

23
Figure 12: Nodularia spumigena. left: Differential Interference Contrast Microscopy; middle: Fluorescence
Microscopy; right: Scanning Electron Microscopy.
Figure 11: Spirulina labyrinthiformis. left: Differential Interference Contrast Microscopy; middle:
Fluorescence Microscopy; right: Scanning Electron Microscopy
24
C. Data Analysis
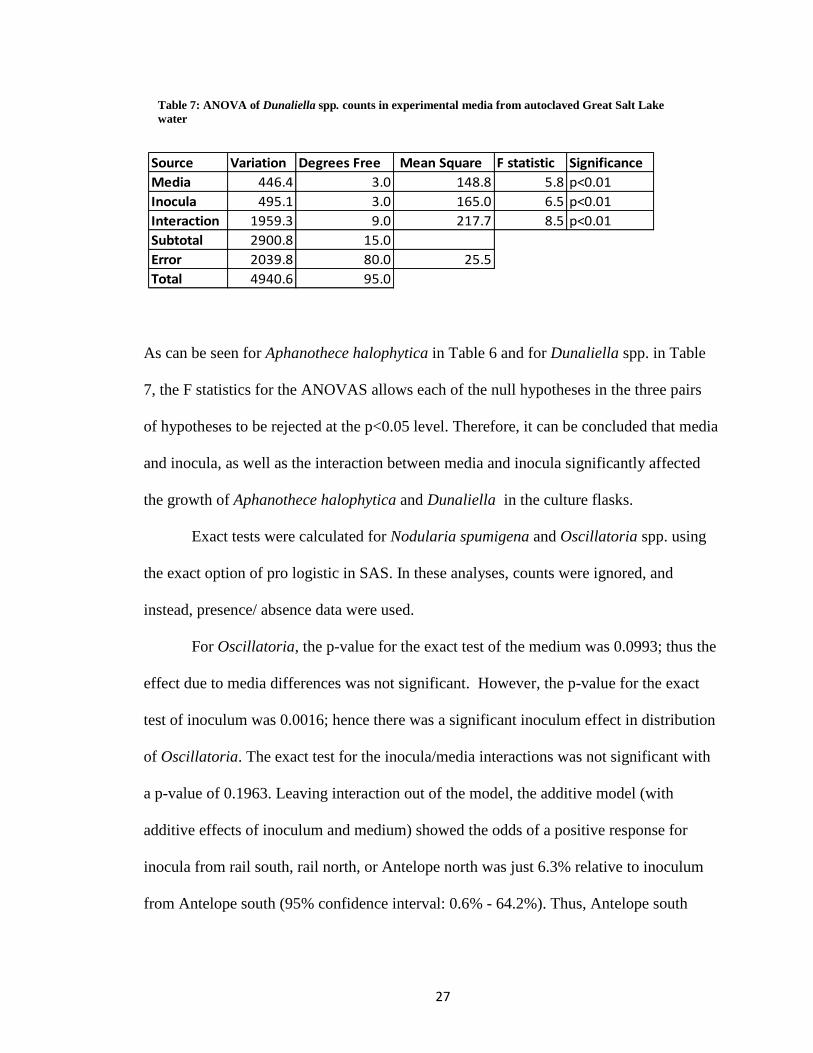
The comparative means of the four major cyanobacteria for each inocula type in
the four media are shown in Figure 13. This Figure demonstrates that Aphanothece
halophytica appears throughout all the four types of media and inocula, but that
Nodularia spumigena is abundant only in inocula from Antelope south waters.
Figure 13: Comparative Means of Aphanothece and probabilities of Oscillatoria, Nodularia and Phormidium for
each inocula type in the four media.
Since there are 24 different permutations of the ordered ranks of Aphanothece (A),
Oscilatoria (O), Nodularia (N), and Phormidium (P) plus an additional 16 permutations
of three and two-way ties, as well as one possible case of a four-way tie in rank, there are
41 different possible rankings of the four cyanobacterial species. Each possible rank

25
order of species abundance was therefore assigned a number ranging from 1 to 41, and
entered into a table for each of the sixteen different inocula/media combinations (Table
4). The ranking P,A,O,N was arbitrarily assigned the number 1, the rank P,N,A,O was
assigned the number 2, the rank A, P, with N and O tied was assigned the number 3, the
rank A, with P, N, and O tied was assigned the number 4, and the four way tie of all
species (including all having a median abundance of 0) was assigned the number 5. Thus
the ordinal data have been transformed into nominal data.
Table 4: Ranked orders of Aphanothece, Oscillatoria, Nodularia, and Phormidium. Medium
Inoculum Rail North Rail South Antelope North Antelope South
Rail North 4 4 5 3
Rail South 4 3 4 5
Antelope North 4 3 4 3
Antelope South 1 3 3 2
For ease of discussion, these different rankings can perhaps most easily be
portrayed as different colors (Table 5). For the sixteen possible combinations of four
types of media (Railway North, Railway South, Antelope North, and Antelope South)
and four types of inocula (Railway North, Railway South, Antelope North, and Antelope
South), the median counts of the four major cyanobacterial species (Aphanothece
halophytica , Oscillatoria sp., Nodularia spumigena, and Phormidium tenue ) were
ranked and shown in Table 5.

26
Table 5: Cyanobacteria ranking by medians.
As can be seen in Table 5 (above), Aphanothece halophytica was dominant in all
cultures flasks, except those in which Nodularia spumigena and Oscillatoria sp.
occurred.
Two-way ANOVA for the distributions of Aphanothece halophytica and
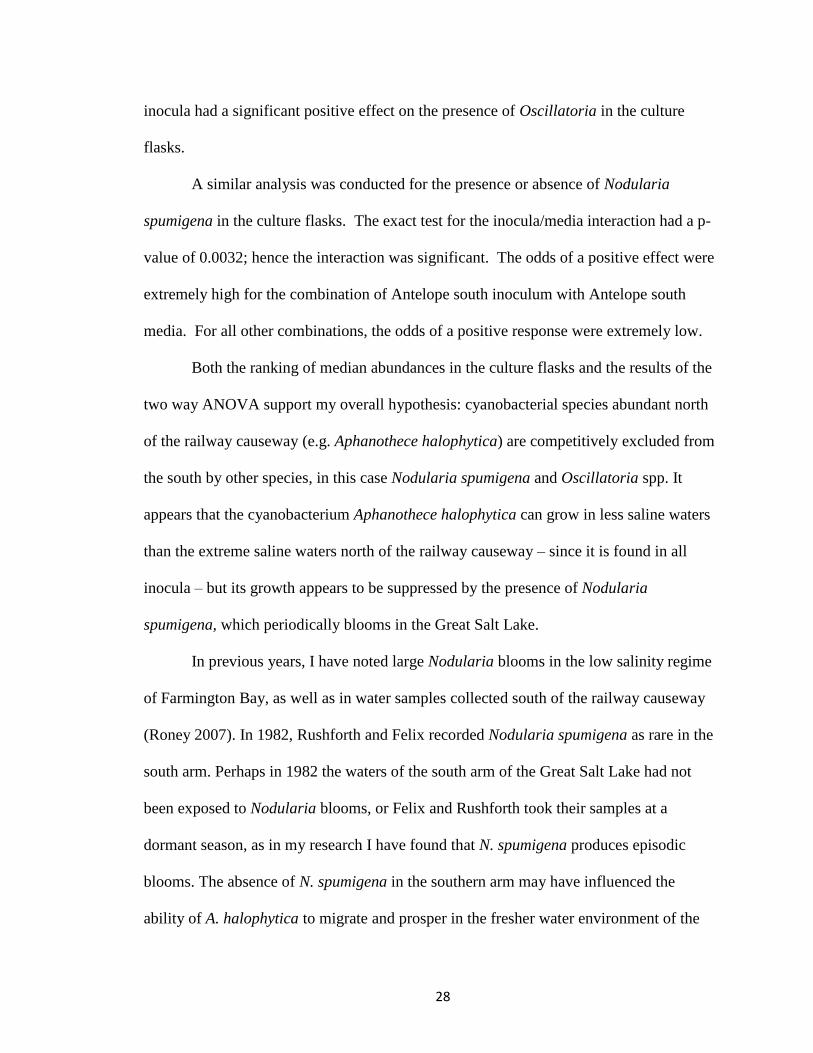
Dunaliella spp. were performed as indicated in Table 6 and Table 7.
Table 6: ANOVA of Aphanothece halophytica counts in experimental media from autoclaved Great
Salt Lake water
Table 7: ANOVA of transformed data from Dunaliella spp. counts in experimental media from
autoclaved Great Salt Lake water
Source Variation Degrees Free Mean Square F statistic Significance
Media 64.6 3.0 21.5 11.4 p<0.01
Inocula 26.1 3.0 8.7 4.6 p<0.01
Interaction 105.6 9.0 11.7 6.2 p<0.01
Subtotal 196.3 15.0
Error 151.1 80.0 1.9
Total 347.4 95.0
27
As can be seen for Aphanothece halophytica in Table 6 and for Dunaliella spp. in Table
7, the F statistics for the ANOVAS allows each of the null hypotheses in the three pairs
of hypotheses to be rejected at the p<0.05 level. Therefore, it can be concluded that media
and inocula, as well as the interaction between media and inocula significantly affected
the growth of Aphanothece halophytica and Dunaliella in the culture flasks.
Exact tests were calculated for Nodularia spumigena and Oscillatoria spp. using
the exact option of pro logistic in SAS. In these analyses, counts were ignored, and
instead, presence/ absence data were used.
For Oscillatoria, the p-value for the exact test of the medium was 0.0993; thus the
effect due to media differences was not significant. However, the p-value for the exact
test of inoculum was 0.0016; hence there was a significant inoculum effect in distribution
of Oscillatoria. The exact test for the inocula/media interactions was not significant with
a p-value of 0.1963. Leaving interaction out of the model, the additive model (with
additive effects of inoculum and medium) showed the odds of a positive response for
inocula from rail south, rail north, or Antelope north was just 6.3% relative to inoculum
from Antelope south (95% confidence interval: 0.6% - 64.2%). Thus, Antelope south
Source Variation Degrees Free Mean Square F statistic Significance
Media 446.4 3.0 148.8 5.8 p<0.01
Inocula 495.1 3.0 165.0 6.5 p<0.01
Interaction 1959.3 9.0 217.7 8.5 p<0.01
Subtotal 2900.8 15.0
Error 2039.8 80.0 25.5
Total 4940.6 95.0
Table 7: ANOVA of Dunaliella spp. counts in experimental media from autoclaved Great Salt Lake
water
28
inocula had a significant positive effect on the presence of Oscillatoria in the culture
flasks.
A similar analysis was conducted for the presence or absence of Nodularia
spumigena in the culture flasks. The exact test for the inocula/media interaction had a p-
value of 0.0032; hence the interaction was significant. The odds of a positive effect were
extremely high for the combination of Antelope south inoculum with Antelope south
media. For all other combinations, the odds of a positive response were extremely low.
Both the ranking of median abundances in the culture flasks and the results of the
two way ANOVA support my overall hypothesis: cyanobacterial species abundant north
of the railway causeway (e.g. Aphanothece halophytica) are competitively excluded from
the south by other species, in this case Nodularia spumigena and Oscillatoria spp. It
appears that the cyanobacterium Aphanothece halophytica can grow in less saline waters
than the extreme saline waters north of the railway causeway – since it is found in all
inocula – but its growth appears to be suppressed by the presence of Nodularia
spumigena, which periodically blooms in the Great Salt Lake.
In previous years, I have noted large Nodularia blooms in the low salinity regime
of Farmington Bay, as well as in water samples collected south of the railway causeway
(Roney 2007). In 1982, Rushforth and Felix recorded Nodularia spumigena as rare in the
south arm. Perhaps in 1982 the waters of the south arm of the Great Salt Lake had not
been exposed to Nodularia blooms, or Felix and Rushforth took their samples at a
dormant season, as in my research I have found that N. spumigena produces episodic
blooms. The absence of N. spumigena in the southern arm may have influenced the
ability of A. halophytica to migrate and prosper in the fresher water environment of the

29
south arm instead of thriving in the hyper-saline north arm. Every time I have sampled
south of the Antelope causeway since 2004, I have found N. spumigena present in the
water column.
My second overall hypothesis that cyanobacterial species that thrive and bloom
south of the Antelope causeway cannot grow in the high salinity of the north, is also
supported by these data. Nodularia spumigena was found only in inocula from the less
saline waters south of the Antelope Island causeway, and apparently cannot survive the
high saline waters north of the railway causeway.
Experimental confirmation of these two hypotheses helps answer my original
question: Are cyanobacterial distributions in the Great Salt Lake influenced by abiotic
factors, biotic factors, or both? Indeed, both abiotic (salinity) and biotic (interspecies
competition) seem to affect distributions of cyanobacterial species. N. spumigena
distributions seem to be primarily influenced by salinity, which can only grow in fresher
waters. By contrast, A. halophytica distributions seem to be primarily influenced by
competition by N. spumigena and Oscillatoria sp.
These experimental data, therefore, are consistent with Gause‟s Law, which
predicts that no two species can indefinitely occupy the same niche, but they add
additional information. A. halophytica and N. spumigena cannot occupy the same
hypersaline habitat north of the railway causeway – since N. spumigena cannot tolerate
hypersaline conditions, and does not even occur in inocula from the northern waters in
my sample – while growth of A. halophytica is consistently suppressed in the presence of
N. spumigena.

30
However, this leaves unanswered the question of why A. halophytica is not totally
excluded from the south, since it occurs in all samples of inocula, regardless of salinity. I
suggest that A. halophytica is periodically excluded from southern waters by N.
spumigena blooms, but that in the intervals between blooms, this extremely small
cyanobacterium can persist, albeit at levels far lower than in areas where Nodularia is not
present. Thus, Gause‟s law should perhaps include a clarification: two species cannot
indefinitely occupy the same niche, except for cases of episodic blooms or population
explosions.
The relative abundances of cyanobacteria in the Great Salt Lake demonstrate an
important truth about niche theory– that species can partition niches temporally as well as
spatially.
To my knowledge no previous studies have been performed testing competitive
exclusion of cyanobacteria in the Great Salt Lake. Since my results show that
distributions of cyanobacteria in the Great Salt Lake are influenced by both abiotic as
well as biotic factors it would be interesting to compare my data with the intermediate
salinity hypothesis of David Herbst: “Abundance of salt-tolerant organisms is limited by
physiological stress at high salinities, and by ecological factors, such as predation and
competition, in more diverse communities at low salinities” (Herbst 1999). Since
Nodularia spumigena distributions cannot survive the high salinity stress of the north arm
of the Great Salt Lake, and Aphanothece halophytica distributions seem to be
competitively excluded at lower salinities, the intermediate salinity hypothesis applies to
my study.
31
VIII Future Studies
Based on the current study, five different approaches should be considered in
future investigations:
1) Aphanothece and Nodularia should be grown in axenic cultures, and placed in
competition trials to see how exactly Nodularia competes with Aphanothece.
2) Physiological tolerances for differing salinities of Aphanothece and Nodularia
should be carefully measured. Sørensen et al. (2004) state that, “Members of such natural
prokaryotic communities may have salt adaptations that are not reflected in culture
collections, and studies of pure cultures should be supplemented with salinity response
studies of natural communities in order to fully understand to what extent increased
salinity limits prokaryotic growth.”
3) Microscopic identifications of the Great Salt Lake cyanobacteria should be
confirmed with 16S rRNA studies (Castenholz and Norris 2005).
4) Temperature and nutrient conditions triggering Nodularia blooms should be
identified.
5) The relationship between the green algae Dunaliella and the cyanobacteria in
the Great Salt Lake should be closely examined to see how they compete and impact each
other.
IX. References
Brock, T. D. (1976). "Halophilic blue-green algae." Archives of Microbiology
107(1): 109-111.
Brown, J. R., C. J. Douady, et al. (2001). "Universal trees based on large combined
protein sequence data sets." Nature Genetics 28: 281-285.

32
Butts, D. S.(1980). “Factors affecting the concentration of Great Salt Lake Brines”.
Great Salt Lake: A Scientific, Historical, and Economic Overview. Ed. J. W. Gwynn. Salt
Lake City: Utah Geological and Mineral Survey. 163.
Castenholz, R. W. (1992). "Species usage, concept, and evolution in the
cyanobacteria (blue-green algae)." J. Phycol 28: 737-745.
Castenholz, R. W. and T. B. Norris (2005). "Revisionary concepts of species in the
Cyanobacteria and their applications." Algological Studies (Cyanobacterial Research 6)
117: 53-69.
Cronberg, G. and H. Annadotter (2006). Manual of aquatic cyanobacteria: A photo
guide and a synopsis of their toxicology. Copenhagen: International Society for the Study
of Harmful Algae.
Darlington, P. J. (1972). "Competition, Competitive Repulsion, and Coexistence"
PNAS 69: 3151- 3155.
Dyer, B. D. (2003). A Field Guide to Bacteria. New York: Cornell University Press.
Felix, E. A. (1978). “The Algal Flora of the Great Salt Lake.” Provo: Department of
Botany and Range Science Brigham Young University.
Felix, E.A. and S.R. Rushforth. (1980). “Biology of the South Arm of the Great Salt
Lake, Utah.” Great Salt Lake: A Scientific, Historical, and Economic Overview. Ed. J.
W. Gwynn. Salt Lake City: Utah Geological and Mineral Survey. 305.
Gause, G.F. (1969). The Struggle for Existence. New York: Hafner Publishing
Company.
Gwynn, J. W. (2002). Great Salt Lake: an overview of change. Salt Lake City: Utah
Department of Natural Resources.
Hardin, G. (1960). "The competitive exclusion principle." Science 131: 1292- 1297.
33
Herbst, D. B. (1999). "Biogeography and Physiological Adaptations of the Brine Fly
Genus Ephydra (Diptera: Ephydridae) In Saline Waters of the Great Basin." Great Basin
Naturalist 59(2): 127-135.
Hutchinson, G. E. (1961). "The paradox of the plankton." American Naturalist 95:
137-145.
Marcarelli, A. M., W. A. Wurtsbaugh, et al. (2006). "Salinity controls phytoplankton
to nutrient enrichment in the Great Salt Lake, Utah, USA."Canadian Journal of Fisheries
and Aquatic Sciences 63: 2236-2248.
Nübel, U., Ferran Garcia-Pichel, et al. (2000). "The halotolerance and phylogeny of
cyanobacteria with tightly coiled trichomes (Spirulina turpin) and the description of
Halospirulina tapeticola gen. nov., sp. nov." International Journal of Systematic and
Evolutionary Microbiology 50: 1265-1277.
Oren, A. (2000). “Salts and Brines”. The Ecology of Cyanobacteria. Ed. Brian A.
Whitton and Malcolm Potts. Dordrecht: Kluwer Academic Publishers. 281.
Oren, A. (2002). Halophilic Microrganisms and their Environments. Dordrecht:
Kluwer Academic Publishers.
Post, F. J. (1981). "Microbiology of the Great Salt Lake north arm " Hydrobiologia
81-82(1): 59-69.
R. Rippka, J. B. Deruelle, et al. (1979). "Generic assignments, strain histories and
properties of pure cultures of cyanobacteria." J. Gen. Microbiol 111: 1-61.
Rodriguez-Valera, F. (1988). Halophilic Bacteria Volume I. Boca Raton: CRC Press,
Inc.
Roney, Hillary (2007). “Competitive Exclusion of Cyanobacteria in the Great Salt
Lake.” Provo: Department of Biology Brigham Young University.

34
Rushforth, S. R. and E. A. Felix (1982). "Biotic adjustments to changing salinities in
the Great Salt Lake, Utah, USA " Microbial Ecology 8(2): 157-161.
Schopf, J. W. (2000). "The fossil record: tracing the roots of the cyanobacterial
linage”. The Ecology of Cyanobacteria. Eds. Brian A. Whitton and Malcolm Potts.
Dordrecht: Kluwer Academic Publishers. 13.
Sørensen, K. B., D. E. Canfield, et al. (2004). "Salinity Responses of Benthic
Microbial Communities in a Solar Saltern (Eilat, Israel)." Applied and Environmental
Microbiology 70(3): 1608–1616.
Stephens, D. W. and D. M. Gillespie (1976). "Phytoplankton Production in the Great
Salt Lake, Utah, and a Laboratory Study of Algal Response to Enrichment " Limnology
and Oceanography 21(1): 74-87.
Sturm, P. A. (1980). “The Great Salt Lake Brine System”. Great Salt Lake: A
Scientific, Historical, and Economic Overview. Ed. J. W. Gwynn. Salt Lake City: Utah
Geological and Mineral Survey. 147.
Utah Geological and Mineral Survey. (1990). The Great Salt Lake Information Sheet.
Utah Geological Survey, Public Information Series 8:1-2.
Whitton, B. A. and M. Potts (2000). The Ecology of Cyanobacteria: Their
Diversity in Time and Space. Dordrecht: Kluwer Academic Publishers.
Williams, W. D. (1998). "Salinity as a determinant of the structure of biological
communities in salt lakes" Hydrobiologia 381(1-3): 191-201.
35
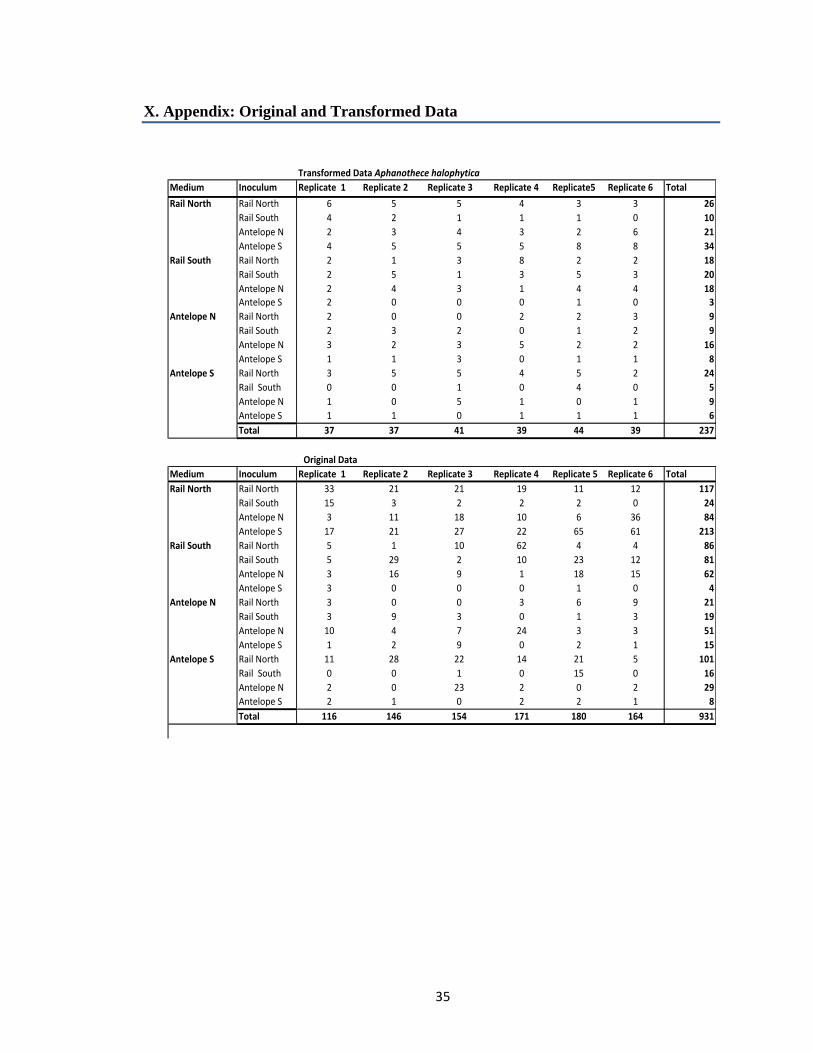
X. Appendix: Original and Transformed Data
Transformed Data Aphanothece halophytica
Medium Inoculum Replicate 1 Replicate 2 Replicate 3 Replicate 4 Replicate5 Replicate 6 Total
Rail North Rail North 6 5 5 4 3 3 26
Rail South 4 2 1 1 1 0 10
Antelope N 2 3 4 3 2 6 21
Antelope S 4 5 5 5 8 8 34
Rail South Rail North 2 1 3 8 2 2 18
Rail South 2 5 1 3 5 3 20
Antelope N 2 4 3 1 4 4 18
Antelope S 2 0 0 0 1 0 3
Antelope N Rail North 2 0 0 2 2 3 9
Rail South 2 3 2 0 1 2 9
Antelope N 3 2 3 5 2 2 16
Antelope S 1 1 3 0 1 1 8
Antelope S Rail North 3 5 5 4 5 2 24
Rail South 0 0 1 0 4 0 5
Antelope N 1 0 5 1 0 1 9
Antelope S 1 1 0 1 1 1 6
Total 37 37 41 39 44 39 237
Original Data
Medium Inoculum Replicate 1 Replicate 2 Replicate 3 Replicate 4 Replicate 5 Replicate 6 Total
Rail North Rail North 33 21 21 19 11 12 117
Rail South 15 3 2 2 2 0 24
Antelope N 3 11 18 10 6 36 84
Antelope S 17 21 27 22 65 61 213
Rail South Rail North 5 1 10 62 4 4 86
Rail South 5 29 2 10 23 12 81
Antelope N 3 16 9 1 18 15 62
Antelope S 3 0 0 0 1 0 4
Antelope N Rail North 3 0 0 3 6 9 21
Rail South 3 9 3 0 1 3 19
Antelope N 10 4 7 24 3 3 51
Antelope S 1 2 9 0 2 1 15
Antelope S Rail North 11 28 22 14 21 5 101
Rail South 0 0 1 0 15 0 16
Antelope N 2 0 23 2 0 2 29
Antelope S 2 1 0 2 2 1 8
Total 116 146 154 171 180 164 931
36
Transformed Dunaliella Data
Medium Inoculum Replicate 1 Replicate 2 Replicate 3 Replicate 4 Replicate 5 Replicate 6 Total
Rail North Rail North 6 5 5 1 4 5 27
Rail South 11 10 10 10 10 11 62
Antelope N 9 7 27 11 11 16 82
Antelope S 23 12 39 26 38 32 169
Rail South Rail North 7 6 8 8 10 13 53
Rail South 13 13 16 9 9 12 73
Antelope N 15 13 10 12 10 9 68Antelope S 15 10 11 17 9 9 71
Antelope N Rail North 9 8 7 8 6 7 47
Rail South 9 10 5 8 10 8 49
Antelope N 9 8 8 12 8 7 51
Antelope S 8 15 11 8 11 5 58
Antelope S Rail North 0 10 23 33 16 22 104
Rail South 5 7 3 9 6 6 36
Antelope N 14 5 6 2 2 2 30
Antelope S 16 2 17 10 4 4 54
Total 168 141 208 185 164 169 1036
Original Dunaliella Data
Medium Inoculum Replicate 1 Replicate 2 Replicate 3 Replicate 4 Replicate 5 Replicate 6 Total
Rail North Rail North 39 30 30 1 13 23 136
Rail South 124 94 92 104 108 126 648
Antelope N 82 54 749 123 127 258 1393
Antelope S 509 155 1512 685 1428 1000 5289
Rail South Rail North 52 41 62 66 107 173 501
Rail South 176 163 260 81 88 155 923
Antelope N 213 174 93 138 91 86 795
Antelope S 225 94 132 290 90 75 906
Antelope N Rail North 87 70 55 65 40 55 372
Rail South 75 92 30 63 96 63 419
Antelope N 74 61 57 148 66 51 457
Antelope S 64 217 125 69 123 24 622
Antelope S Rail North 0 97 530 1118 244 474 2463
Rail South 22 50 12 82 31 41 238
Antelope N 184 24 39 3 3 4 257
Antelope S 258 3 302 102 19 20 704
Total 2184 1419 4080 3138 2674 2628 16123