competitive advantage through customer satisfaction case
TRANSCRIPT

Competitive advantage through
customer satisfaction
Case: Koulutettujen Hierojien Liitto
Markus Ihalainen
2011 Leppävaara
Laurea University of Applied Sciences Laurea Leppävaara
Competitive advantage through Customer satisfaction
Markus Ihalainen Degree Programme in Business Management Bachelor’s Thesis March 16, 2011

Laurea University of Applied Sciences Abstract Laurea Leppävaara Degree Programme in Business Management Markus Ihalainen Competitive advantage through customer satisfaction Year 2011 Pages 38
The main objective of the thesis was to investigate how customers perceive the services of wellness improvement providers such as massage therapists, chiropractors, physiotherapists or someone practicing a similar profession, and how this information can be used to gain a better competitive advantage. The motivation for implementing this survey was the low level of business education in these fields and the lack of awareness about how to manage their scarce resources beneficially. The survey offers guidelines for how these professions can meet more accurately the expectations of their customers and how they can manage their resources to gain a competitive advantage over their competitors through the ability to offer superior service experiences. The theoretical section of the thesis was based on investigating what is essential to good customer service, how quality of service is increased and which subjects influences how customers perceive the service. Theory related to the implementation of the survey and the validity of the case study is also defined in this section. The empirical research was implemented using a quantitative customer satisfaction survey. The survey took place in the November of 2010 via emails and personal interviews to a randomly chosen group of people from friends, family and some massage therapists’ current customers at their own practices. The method used in the selection of the respondents was chosen to receive the widest selection of different opinions from people with different backgrounds. The findings from the customer satisfaction survey indicated clear trends in the market and possible fluctuations in the opinions of the professionals in the field. The results from the survey were investigated and compared to the theoretical section, and based on these results suggestions for improvements of the services were made. Key words Customer service, competition, satisfaction, quality

Laurea-ammattikorkeakoulu Tiivistelmä Laurea Leppävaara Liiketalouden koulutusohjelma Sales and marketing Markus Ihalainen Competitive advantage through customer satisfaction
Vuosi 2011 Sivut 38
Tämän tutkimuksen tarkoituksena on tutkia, miten ihmiset näkevät terveydenhoitopalvelut, esim. hierojien, kiropraktikkojen, fysioterapeuttien ja muiden vastaavien palvelujen tarjoajien palvelut, ja kuinka tämä tieto voidaan kääntää näiden kilpailueduksi. Motivaationa kyselyn toteutukseen oli alan heikko kaupallinen koulutustaso ja tietämättömyys siitä, kuinka hallinnoida resursseja hyödyllisesti. Tutkimus tarjoaa näille aloille ohjenuoran siitä kuinka kohdata asiakkaiden odotukset tehokkaammin ja kuinka hallinnoida resursseja saavuttaakseen paremman kilpailukyvyn tarjoamalla asiakkaille parempaa palvelua. Teoreettisen osion pohja tutkimukselle on rakennettu tutkimalla, mitkä ovat avainasiat hyvälle asiakaspalvelulle, miten palvelun laatua voidaan korottaa ja mitkä seikat vaikuttavat siihen miten asiakkaat kokevat palvelun laadun. Teoria kyselyn toteutukseen ja kyselyn validiteetti on määritelty tässä osiossa. Kyselyn empiirinen osio toteutettiin kvantitatiivisena asiakastyytyväisyyskyselynä. Kysely toteutettiin marraskuussa 2010 sattumanvaraisesti valikoitujen ihmisten henkilökohtaisilla haastatteluilla ja emaililla. Vastaajat oli valittu ystävien, tuttavien ja perheenjäsenten joukosta ja osa vastaajista oli hierojayrittäjien asiakkaita. Kyselyn toteutus valittiin siten, että saavutettaisiin mahdollisimman paljon erilaisia mielipiteitä ihmisiltä, joilla on erilaisia taustoja. Tulokset osoittivat selkeitä suuntauksia markkinoilla ja myös eroavaisuuksia asiakkaiden mielipiteissä alaa kohtaan. Tulokset tutkittiin ja verrattiin teoriaosuuteen, jonka pohjalle palvelun parannusehdotukset kerättiin. Asiasanat asiakaspalvelu, kilpailu, tyytyväisyys, laatu
Contents
1 Introduction ......................................................................................... 7
1.1 The objective of the study ............................................................... 7
1.2 Research problem .......................................................................... 7
1.3 Outlook of massage therapy in Finland from authors point of view .............. 7
2 Service ............................................................................................... 8
2.1 Definition of service ....................................................................... 8
2.2 Service quality creation ................................................................... 8
2.3 Three elements of service production ................................................ 10
2.4 Marketing .................................................................................. 11
2.5 Factors affecting customer satisfaction .............................................. 12
2.6 Customer loyalty ......................................................................... 15
2.7 Customer satisfaction as a competitive advantage ................................ 16
2.8 Maintaining customer satisfaction .................................................... 17
3 Case study ......................................................................................... 18
3.1 The main questions concluding the theory .......................................... 18
3.2 Methods .................................................................................... 19
3.3 Reliability .................................................................................. 19
3.4 Validity ..................................................................................... 20
3.5 Background information of the respondents ........................................ 20
3.5.1 The frequency of use of the services ....................................... 21
3.5.2 The selection of the service provider ....................................... 22
3.5.3 Questions 3 and 4 concerning the location of the service provider ... 22
3.5.4 Finding the service provider .................................................. 23
3.5.5 The range of the service offerings ........................................... 24
3.5.6 The additions to the core service ............................................ 24
3.5.7 The opinion of the services near the respondents’ homes or work .... 25
3.5.8 The opinion of the gender of the service provider ....................... 25
3.5.9 The habit of recommendations ............................................... 25
3.5.10 The reasons for seeking wellness services ................................ 25
3.5.11 Preferable opening hours .................................................... 25
3.5.12 Average spending on wellness services .................................... 26
3.5.13 The perception of the premises of the service provider ............... 26
3.5.14 The booking for the service appointment................................. 27
3.5.15 The involvement of the customer to the flow of the service ......... 28
3.5.16 Open question ................................................................. 28
4 The conclusions................................................................................... 29
4.1 Product ..................................................................................... 29

4.2 Price ........................................................................................ 30
4.3 Place ........................................................................................ 31
4.4 Promotion ................................................................................. 31
4.5 Future surveys ............................................................................ 32
References ................................................................................................ 33
Figures ..................................................................................................... 34
Appendices ................................................................................................ 35
Appendixe 1: Questionnaire .................................................................... 36

1 Introduction
1.1 The objective of the study
Satisfaction of customers is widely regarded as an essential factor for any business, and is
important that the rate of the satisfaction should be measured regularly in order to define
how successful the business actually is, and it is a rather good indication when the company is
making a profit. However, at least for the author this is not enough and for some managers
also this might not be enough. The market could be offering much more to the business which
can be revealed through a thorough investigation. The other aspect that drove this study was
not only to investigate how with fairly good customer service the company can succeed, but
also the necessary factors for a longer term sustainable customer base and how they can
exceed the customers’ expectations. On the basis of the case study the goal is to create
guidelines on how to manage resources most efficiently for massage therapists to develop
their services and actions to match their customers’ expectations in general. The secondary
goal of the study was to investigate potential and also most commonly faced problems of the
services and to suggest improvements, so that the services could become more customer
friendly. In future the same questionnaire can be used again to investigate the progress of
customer satisfaction and to compare the results to the outcome of this one.
1.2 Research problem
This thesis was conducted on behalf of Koulutettujen Hierojien Liitto for small service
providers like massage therapists to research how customers in general perceive massage
therapists and what aspects would need to be changed and developed for better customer
satisfaction. Massage therapy and other similar practices seem to be practised by a single
entrepreneur and therefore their resources are rather limited compared to bigger
organizations. The study aimed to help service providers to use those few resources the most
efficiently and to clarify the correct placements for the resources to gain the best
competitive advantage.
1.3 Outlook of massage therapy in Finland from authors point of view
Massage has been an approach in the management of patients with various disorders dating
back to ancient times and continues to play a significant role in current health care. The
appreciation of massage therapy went into decline with the arrival of modern medicine. At
the turn of the millennium awareness of holistic healing begun to strengthen its position with
people looking for substitution to regular drug use in healing. Also the popularity of massage

therapy is strengthened by the acknowledgement of the adverse effects of drugs and people
are more conscious of their health, so people are keen on trying alternative healing methods.
The need for services is rising most among the elderly and people in home care. The aging of
the population, with large numbers soon going into retirement, and the movement from
facility care to home care is a clear trend nowadays. This is a huge opportunity for massage
therapists and will increase the demand for services. In the future private health care is going
to have a big role in caring selection in order to relieve pressure from the government’s
facility services. These private wellness services are going to be a true option next to
traditional healthcare. Additionally, as more workplaces try to position themselves as
employee-friendly, many companies will want to provide in-office, seated massages for
employees as an on-the-job benefit. More and more people perceive that massage is an
increasingly popular technique for relaxation and stress reduction.
In the future manual methods and rehabilitation services are going to have an even bigger
role. Patients are not going to be looked at as just a shoulder or an arm, rather the focus is
going to be more on the whole body and on the patient’s physical being. Social-, health- and
physical education businesses will benefit from increasing the information based on case
studies, which will help them to increase their quality of service through better knowledge of
their customers’ needs and expectations.
Every year in Finland the transition from medicating and nursing towards wellness services
has been rising and even big insurance companies are beginning more accepting of alternative
healing methods. Common healthcare massage therapy and other alternative healing methods
are becoming a more acknowledged and approved way of healing and treating patients. A
problem facing this field of business is the level of education is rather low, meaning that they
know only about their own field of business and that the development of the entire field of
business is not the main focus of the employees. Also the number of personnel in the field of
alternative healing methods on other wellness services is rather low; people don’t educate
themselves to work in this field anymore.
In the near future entrepreneurs will need to invest more in continuous education,
networking and cooperation with others in the caring business. Also the quality of services is
becoming more essential, because the demand is rising meaning that competition is growing
with it. Cooperation and networking is a commonly used strategy amongst businesses to build
their competitive advantage. Cooperation and networking is essential to improve customer
service, because not everything can be healed with alternative methods, so it is good
customer service to be able to point out the right facility for the customer.

8
2 Service
2.1 Definition of service
Service has many special features which affect marketing and need to be taken notice of so
that customers can be satisfied (Ylikoski 2001, 17). According to Grönroos (2001, 78) service is
not a simple thing that can be easily explained, service as a concept is a complicated matter.
The word “service” has multiple meanings from personal service to service as a product.
Grönroos states that almost all products can be turned into services, if the seller or the
service provider adjusts the product according to the customers’ smallest requirements. In
this instance the product is nothing tangible, but being delivered to the customer in a
superior way will turn it into a product.
Customer service and diverse a variety of additional services supporting the company’s core
competence are the most important activities for specialized shops to stand out from bigger
supermarket chains and department stores also selling similar services and products. When
buying services or deciding upon the supplier of the services, the customers will consider the
benefits being gained from the service. The core benefit is that someone is doing something
for someone (Ylikoski 2001, 18-19). Massage therapists deliver muscle maintenance for their
customers, even though the customers could stretch more often to keep their bodies flexible.
Service is an act, activity or performance where the customer is offered something
intangible, that is often produced and consumed simultaneously and which offers the
customer added value; time savings, ease, comfort, entertainment or health improvements.
The service organization can be defined by which offerings are services that are clearly the
main interest of the customers (Ylikoski 2001, 20).
2.2 Service quality creation
Human relationship skills have an essential meaning to a company’s success. The service
environment and interaction skills of the staff and the quality outcome create the service
experience. The service environment influences the customers’ first impression of the
company. The first impression is created already within the first seconds or the first minutes
and is very sustainable (Isoviita & Lahtinen 1998, 63).
There is a clear linkage between customer satisfaction and the quality experienced by the
client. In reality the quality of the service is always the clients own vision of quality and how
the service process meets the vision. Every customer has certain expectations and a picture
of the company image in their minds according to their previous experiences, friends and

9
relatives’ opinions and marketing actions. Quality experiences are influenced by comparing
the expectations to the received quality of the service and the image of the company. Due to
the fact that experiences and expectations are perceived differently from person to person, it
is clear that the perception of quality is very individual (Rope & Pöllänen 1994, 30).
Customers’ expectations are influenced by the company’s image and act as a filter in the
service experience. If the company is well known, the reputation usually improves the
company’s image. Likewise, a bad reputation of the company or a product is likely to turn
away possible clientele. Image is a customer’s impression of the company’s willingness and
ability to satisfy their needs (Lahtinen & Isoviita 1998, 63).
According to Grönroos (1991 68-71) there are ten steps affecting the quality of the services:
1. It is important that company service actions are reliable and consistent. The company
strives to perform their services right from the first time and to be delivered as agreed.
2. Swiftness of service, just-in-time delivery and immediate contact with the customer
indicates employees’ willingness and readiness to serve the customers.
3. When the company wants to be seen as a professional company, the staff needs to have
professional knowledge and skills as well.
4. The service needs to be easily accessible. This means that contacting the company is
made easy, without excess waiting and opening hours need to be reasonable for the
customer base.
5. The employees’ appearance and their discretion towards the customers’ belongings are
an aspect of courtesy towards customers. Contact personnel ought to behave in a
friendly manner and respectfully and according to approved social standards towards
customers.
6. Communications are a relevant part of the service experience and should take place in
a way that the customer will understand everything without any confusion e.g. price of
the service. Also to listen to the customer is relevant to the correct outcome of the
service process.
7. The company’s reputation and the contact personnel’s personality influence the
customers’ experience of the service quality. The credibility of the company in the

10
eyes of the customer is dependent on how customers’ interests are advocated and how
sincerity pointed.
8. For service to be high quality, it needs the customer to feel a certain amount of
security when using the company’s services. Risks and doubts should be not included
into a confidential customer relationship, but a physically and financially secure
relationship between the company and the customer needs to be established.
9. The more individually the customer is treated and the more well known the regular
customer is the better the service is perceived. The customer and his/her needs are
taken seriously in every situation and the service provider inquires the customers’
special requirements to create a better relationship with the customer.
10. The premises, appearance of the staff and other customers are the physical elements
of the entire service creation. All of the physical elements can influence the service
quality.
2.3 Three elements of service production
Providing service consists of a series of events and in these events three main elements can
be distinguished. The customer who is being serviced is the key to the entire process. The
main elements of producing a service are (Lahtinen & Isoviita 1994, 112):
1. Service environment
Location
Business premises that are pleasant, comfortable and spacious
Appropriate service equipment
2. Contact personnel
Highly professional and competent
Helpful and pleasant
Service that is fast and well managed
3. Other Customers
Experiences and word-of-mouth
Recommendations of other customers
Negative word-of-mouth travels fast and far

11
2.4 Marketing
Marketing is a function of the business world, which is used to identify unfulfilled needs and
wishes, specify and measure their size and profitability; determine which target groups can
be served, deciding suitable products, services and programs to serve the chosen target group
and which encourages everybody within the organization to develop their emotions and
willingness to serve customers (Kotler 2006, 203).
Grönroos (2001, 81) states that today ever larger number of companies are faced with a
situation where their core competence does not guarantee their competitive edge. Their
customers have become more enlightened of their options and therefore can be more
demanding about getting better value for their money. The competition among service
providers has become reality for many companies.
With a help of marketing the organization informs their possible customers what they have to
offer and of their features: what type of services they have to offer, what they cost, booking
methods. Marketing is also used to create an image for the services and the organization. The
purpose of marketing is also to influence their customers’ shopping behavior (Ylikoski 2001,
281).
To create a very successful marketing campaign the company needs to know their target
group, their needs, characteristics and what the campaign aims to achieve. After this the
company needs to decide which actions need to be taken to reach their target group most
efficiently (Ylikoski 2001, 282).
Kotler (2005, 16) states that the key in succeeding to the business world is the ability to
create, deliver and communicate more value more efficiently than their competitors. This
can be achieved by using marketing activities, also known as the marketing mix, which consist
of a set of marketing tools used in pursuing the company’s marketing objectives. Kotler
(2005, 19) has divided these into four different groups as four Ps, product, price, promotion
and place. All these four groups can be divided further into smaller subgroups as follows:
Product: variety, quality, design, features, name, sizes, packaging.
Price: list price, discounts, allowances, financing, credit terms.
Promotion: media, advertising, sales force, PR, coverage, budget, message.
Place: location, logistics, transport, channels, channel members.
These four Ps represent the service providers’ view of the methods that he/she can use to
make an impact on the target market. The ideal situation is that the right product can be

12
sold at the best profit margin, in a perfect place with suitable promotion for the target
market (Kotler 2005, 19).
Figure 1: 4Ps affecting target market
Rope & Pöllänen (1994, 131-132) suggest differentiating the customer base into four main
groups according to their visits. First are regular customers who are faithful to the company
and use the company’s services clearly more often than others. Random shoppers also uses
the competitors’ services and don’t have any personal feelings towards the company. The
third group consists of the non-customers who have never used company’s services and the
last group is the group that have used the company’s services in the past but stopped or
switched to using competitors products and services.
Rope & Pöllänen (1994, 132) also divide customers into three groups according to the volume
of their purchases, which can be used separately or to define the previous four groups even
further. The first group consists of the customers who buys the most and that are usually the
smallest group, 20/80, meaning that they are 20% of the company’s customer base, but
purchase 80% of the company’s volume. The second group is the 80/20, who buy only 20% of
company’s volume but which is a much bigger group. And the last group of this category
consists of the non-buyers, who are not the company’s customers.
2.5 Factors affecting customer satisfaction
Only really satisfied customers make repurchases and spread good information about the
company. The company needs to serve their customers in a way that the customers feel that
they can trust the company in any way and in all situations. Only the companies that develop

13
their service quality and range will gain competitive and profitability advantages (Grönroos
2001, 179-181).
A customer centered company tries to accomplish their mission with the help of
improvements in their customer satisfaction. To affect customer satisfaction the company
needs specific information about what exactly makes their customers satisfied and to
accomplish this the company needs constant information from their customers (Ylikoski 2001,
149).
The satisfaction is created when a customer enters the company’s domain and receives the
company’s contact surface. The contact surface consists of all the following
1. Personnel contacts (customer service or sales)
2. Product contacts (durability, price or functions)
3. Support services (invoicing, marketing, delivery or after sales)
4. Environment contacts (interior decoration, tidiness or parking)
All these contacts create experiences that are compared to the expectations the customer
had towards the company before entering (Rope & Pöllänen 1994, 28).
When a customer uses some of the company’s contacts, for example delivery, to investigate
the rate of customer satisfaction, the company needs to take into account the fact that
customers might have different ideas of good delivery service. Other customers might
appreciate early delivery when the other might expect just-in-time delivery. They might also
be in different situations when the rate of satisfaction is compromised with some external
interference, and normally the customer could be really difficult to please (Kotler 2006, 146).
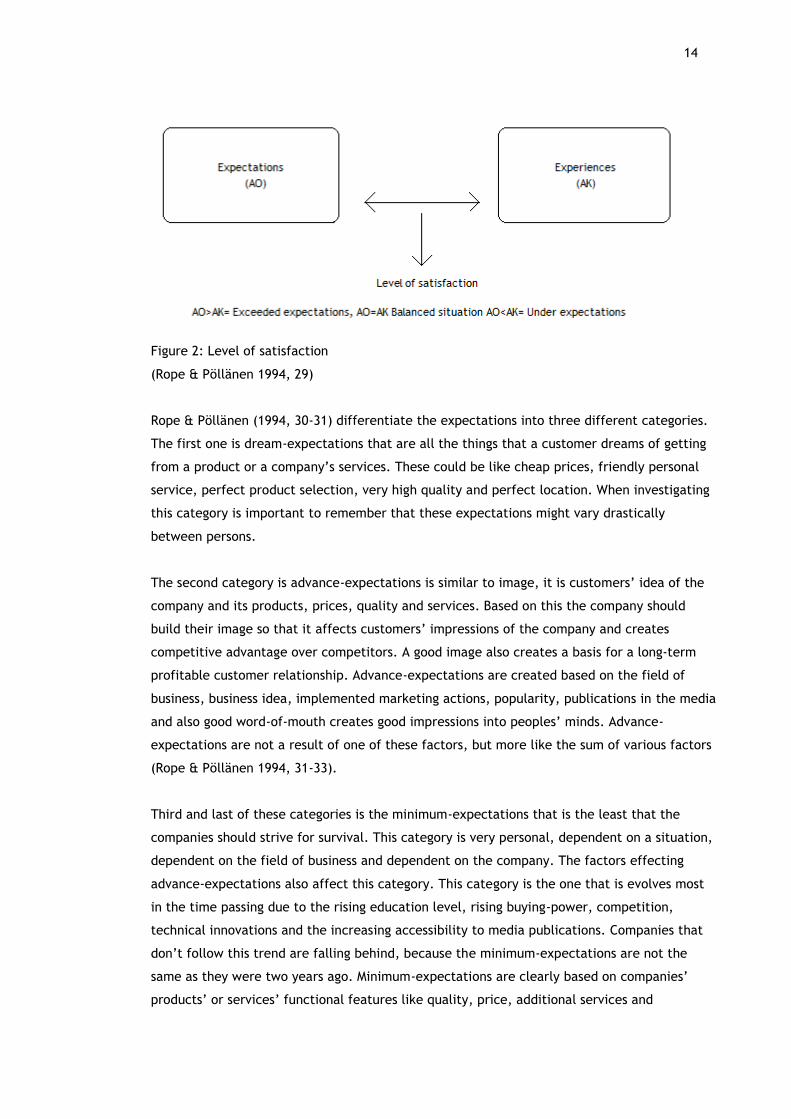
The level of satisfaction is the outcome of customers’ expectations versus experiences, which
are formed on the basis of personnel, products and support- and contact systems (Figure 1). A
good example of this is that people have higher expectations of five star hotels than of two
star motels. If the operations and standards are at the same level in both place the customer
in the five star hotels are more likely to be dissatisfied, but the customer in the motel is
going to be overwhelmed. When striving for customer satisfaction it is essential to know the
levels of the customers’ expectations and experiences, so they can be met and exceeded
(Rope & Pöllänen 1994, 30)
14
Figure 2: Level of satisfaction
(Rope & Pöllänen 1994, 29)
Rope & Pöllänen (1994, 30-31) differentiate the expectations into three different categories.
The first one is dream-expectations that are all the things that a customer dreams of getting
from a product or a company’s services. These could be like cheap prices, friendly personal
service, perfect product selection, very high quality and perfect location. When investigating
this category is important to remember that these expectations might vary drastically
between persons.
The second category is advance-expectations is similar to image, it is customers’ idea of the
company and its products, prices, quality and services. Based on this the company should
build their image so that it affects customers’ impressions of the company and creates
competitive advantage over competitors. A good image also creates a basis for a long-term
profitable customer relationship. Advance-expectations are created based on the field of
business, business idea, implemented marketing actions, popularity, publications in the media
and also good word-of-mouth creates good impressions into peoples’ minds. Advance-
expectations are not a result of one of these factors, but more like the sum of various factors
(Rope & Pöllänen 1994, 31-33).
Third and last of these categories is the minimum-expectations that is the least that the
companies should strive for survival. This category is very personal, dependent on a situation,
dependent on the field of business and dependent on the company. The factors effecting
advance-expectations also affect this category. This category is the one that is evolves most
in the time passing due to the rising education level, rising buying-power, competition,
technical innovations and the increasing accessibility to media publications. Companies that
don’t follow this trend are falling behind, because the minimum-expectations are not the
same as they were two years ago. Minimum-expectations are clearly based on companies’
products’ or services’ functional features like quality, price, additional services and

15
durability. All these features should be kept above minimum-expectations in order for
companies to maintain their position in the market and susteinable customer relationships
(Rope & Pöllänen 1994, 35-37).
2.6 Customer loyalty
A loyal customer is very important to a company, not only, because they are great
advertisements for the company through good word-of-mouth but also because they need less
marketing for a repurchase. This improves the company’s profitability and usually loyal
customers bring in other regular customers (Lahtinen & Isoviita 1998, 64).
Ylikoski (2001, 173) thinks that customer loyalty is a requirement for a development of a
long-term customer relationship. A long-term customer relationship is not get generated
without focused and well targeted actions to develop a well grounded relationship. Not even
the most effective marketing campaigns create customer loyalty by themselves. Customers
remain loyal if they consider receiving superior added value from the company compared to a
competition and if they have been satisfied with the company’s previous performance.
Kotler (2006, 145) states that the link between customer satisfaction and customer loyalty is
not proportional. If the satisfaction is rated using a scale from one to five and the customer
rates the company as being one, customer is most likely to abandon the company and switch
to using the competitors products. If the customer rates the company’s performance between
two and four meaning that the customer is fairly satisfied, but not loyal to the company when
a better offer comes along. When the company is rated as level five the customer has an
emotional bond built to the company and is very likely to repurchase the company’s products
while spreading good word-of-mouth (Kotler 2006, 145). The bond can be technical,
geographical or economical (Grönroos 2001, 207).
Customer satisfaction should be measured regularly to clarify the rate of customer loyalty.
When customers achieve level five on the customer satisfaction scale, they tend to stay loyal
for a longer time and make repurchases more often. Loyal customers are more likely to buy
all the new products or product up-dates for the existing models that the company introduces
to the market. A loyal customer usually speaks for the company and their products’ and does
not pay attention to the competitors’ products and is not as price sensitive as a new customer
could be. Loyal customers are very keen on getting involved with the company’s actions by
giving feedback on the products and the overall company performance, services and image.
They are also less costly to serve because they usually look for new releases from the
company and due to the transactions that are more or less a routine (Kotler 2006, 145).

16
For a company it is much more cost effective to preserve current satisfied customers than to
find new ones. The basic rule is that finding new customers increases basic service costs from
five to six times more than the costs of maintaining the current satisfied customers. With
current customers the basic service process proceeds smoothly and mistakes occur more
seldom and therefore the service costs per customer decreases and the cost efficiency
increases (Grönroos 2001, 183).
2.7 Customer satisfaction as a competitive advantage
Customers don’t buy products or services, but they buy the benefits that the product or a
service can offer to them. They buy offerings that consist of products, services, information
and other factors. The value created from the purchase of an offering is dependent on how
the customer experiences the benefits created (Grönroos 2001, 26-27).
Customer satisfaction can be developed on its own without any effort, but usually it needs
work and planning. Customer satisfaction is a competition and tool, the competitive
advantage received from customer satisfaction is hard to duplicate for other companies,
especially if the company devotes more effort into their customer service than their
competition. If the company’s personnel have outstanding personal chemistry, empathy,
helpfulness and they can offer other pleasant gestures towards the customers, qualities that
are hard to imitate for other companies. Even the ability to apologize or react correctly to
negative feedback can indicate a sense of professionalism to the customer and that the
customer is taken seriously (Lahtinen & Isoviita 1998, 64). For many companies the situation
nowadays is that their core competence needs to be refined into a service offering to develop
their competitiveness and that the offering consists of all the value creating items that
customers expect (Grönroos 2001, 37).
When the customer becomes a regular customer through positive experiences of the
company’s services the amount of visits usually rises due to the ease of the usage of the
services. The company has the personal data of the customer and knowledge how to please
the customer more efficiently; this also lowers the barriers towards the usage of the services.
The customer does not want to go through the effort of switching the service provider and to
go through all the steps to achieve the same position in the competing company again, this
creates a competitive advantage for the company. The cost of the customer relationship
decreases the longer the relationship is an increase of only 5 percent customer retention
results in 25-100 percent profit on each customer (Ylikoski 2001, 180-183).
There are many benefits that a company can achieve through customer satisfaction, not only
monetary benefits but also intangible benefits. When a regular customer is being served, the
17
time used in the process is much shorter than the time used with a new customer and the risk
of misunderstandings decreases. This will make the customer more satisfied and the
communion between the customer and the personnel more relaxed. When the company’s
personnel are able to serve happy customers, the atmosphere within the entire company
raises the rate of satisfaction of the employees with it. When the employees of the company
are satisfied, they tend to expend more effort in serving the customers and keeping the
customers satisfied, making a cycle of satisfaction. The company needs to make the first
effort in achieving the cycle (Ylikoski 2001, 183-184).
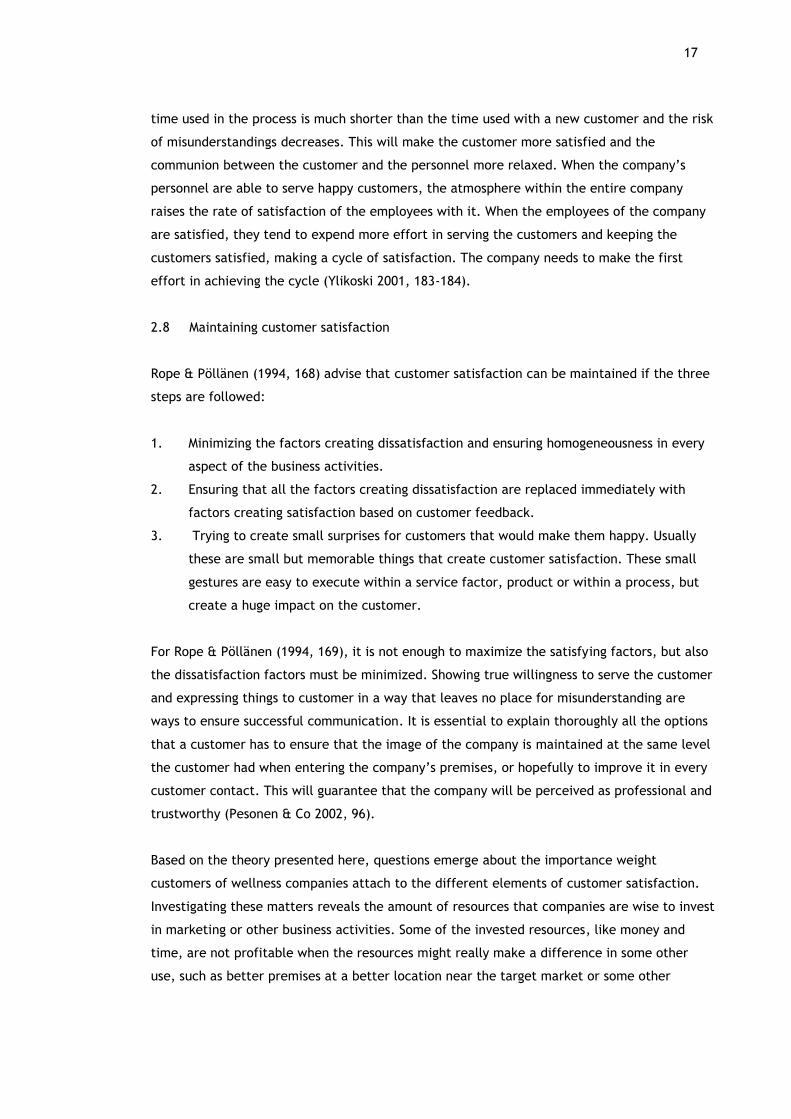
2.8 Maintaining customer satisfaction
Rope & Pöllänen (1994, 168) advise that customer satisfaction can be maintained if the three
steps are followed:
1. Minimizing the factors creating dissatisfaction and ensuring homogeneousness in every
aspect of the business activities.
2. Ensuring that all the factors creating dissatisfaction are replaced immediately with
factors creating satisfaction based on customer feedback.
3. Trying to create small surprises for customers that would make them happy. Usually
these are small but memorable things that create customer satisfaction. These small
gestures are easy to execute within a service factor, product or within a process, but
create a huge impact on the customer.
For Rope & Pöllänen (1994, 169), it is not enough to maximize the satisfying factors, but also
the dissatisfaction factors must be minimized. Showing true willingness to serve the customer
and expressing things to customer in a way that leaves no place for misunderstanding are
ways to ensure successful communication. It is essential to explain thoroughly all the options
that a customer has to ensure that the image of the company is maintained at the same level
the customer had when entering the company’s premises, or hopefully to improve it in every
customer contact. This will guarantee that the company will be perceived as professional and
trustworthy (Pesonen & Co 2002, 96).
Based on the theory presented here, questions emerge about the importance weight
customers of wellness companies attach to the different elements of customer satisfaction.
Investigating these matters reveals the amount of resources that companies are wise to invest
in marketing or other business activities. Some of the invested resources, like money and
time, are not profitable when the resources might really make a difference in some other
use, such as better premises at a better location near the target market or some other

18
service creation elements that truly create value to the customer. These topics will form the
framework for the questionnaire of the case study.
3 Case study
3.1 The main questions concluding the theory
The main questions emerging from the theory concern how the overall experience has been
perceived by the respondents and which parts are the most influential for the customer in
terms the image creation. In the conclusion of the case study the classical marketing mix of
the 4Ps, product, and factors can be easily affected by the service provider. These four Ps
help the service providers to improve their offerings; quoting Philip Kotler (2005, 16) “the job
is not to find the right customers for your product, but the right products for your
customers”. Most of the questions concern these four items in order to deepen how the
perception of the customers is being created and which parts are the most valuable or the
most vulnerable in the value creation process.
When looking at the first P, product, and in the terms of this case study the service, it the
question is whether being delivered to the customer as the majority of the service consumers
would wish it to be. Is the service being provided so that the majority of the customers will
get the most value from it, such as whether abroad product range is the thing that people
value, the quality of the one main product or the occasional additions to the products. Also a
significant question that emerged from the theory was how the consumption of the service
could be made more convenient for the customers.
The pricing needs to be adjusted so that it corresponds to the value received from the
consumption of the service. Therefore there needs to be an investigation of how much value
on average the respondents tend to receive from these services and what are the factors that
the service provider could improve to optimize difference between the costs and gain but still
give the best value for both the customer and the service provider.
The third factor of the marketing mix that needs to be examined is the place where service
will be consumed and how the service can be conveniently accessed. The respondents might
speculate according to the premises where the service is being provided and how easily the
booking or the transportation to the premises can be accessed. Transportation and the
surroundings of the premises could make a big difference to some customers that are used to
do things in a special way and how big is the number of the respondents.

19
The last P, promotion, needs to be investigated so that most of the target market can be
reached most efficiently. The respondents need to be asked how they usually search for the
services they have used and what are the issues in the media that influences the most the
images of the companies for the customer. On the basis of these results the service provider
can increase how many people will receive the message the service provider sends to the
target market, how to create the best first impression and maintain it.
3.2 Methods
The study was conducted by using customer survey as the research method and on anonymous
questionnaire. The research concentrated mainly on what customers really appreciate when
using health improving services like massage therapy. The questionnaire consists of fifteen
quantitative questions about how the customers perceive services and one qualitative
question for open opinions. Quantitative questions were used for the questionnaire to receive
as wide range of answers as possible. The open question was added to ensure that if some
question was missing from the questionnaire, the person would have the possibility to express
it for the research. The questionnaire was sent to the respondents by email in the beginning
of November 2010. The questionnaire was asked to be returned within four days. The
questionnaire was conducted via email to ensure that the respondents are able to answer the
questions whenever they have time to think, because it was not sure that all the respondents
had used such services recently or maybe had not used them at all. 67 questionnaires were
sent and 36 were received in time for the evaluation. The 31 questionnaires were not
received due to the random selection of the respondents. The respondents were chosen
randomly, therefore some of the email addresses could have been old, and some of the
respondents have never used wellness services and therefore did not bother to answer the
questionnaire. No incentives were used in this study that could have had an influence on the
rate of the answers received.
The qualitative responses were read through and the objective was to receive respondents’
ideas to improve services based on their previous experiences, but the number of open
answers was so small that no ideas for improvement were developed. The answers received
were basically opinions if the respondents were satisfied with the service they received. All
the answers were inserted into an Excel-table and analyzed based on the amounts of same
answers for each question.
3.3 Reliability
In this research the reliability was satisfactory due to the rate of responses received. The
method of collecting the answers could have been better or the selection of respondents

20
could have been bigger to receive more responses for the case study. The number of
responses received is close to a normal customer base of one medium sized wellness company
therefore the reliability of the case study is rather reasonable.
3.4 Validity
The validity of the research is good. According to Koulutettujen Hierojien Liitto similar case
studies have not been conducted previously. The questionnaire and the questions were
designed to be easy to understand and answer so that as many as possible respondents would
complete the questionnaire.
3.5 Background information of the respondents
As stated earlier the respondents to the survey were selected randomly. The first three
questions were designed to receive general information about the background of the
respondents, their age, occupation and their level of exercise. This was analyzed to
investigate how much muscle tension could be involved in the decision to use wellness
services. The gender of the respondents is not essential information for the case study and
therefore not asked in the questionnaire.
28 of the respondents were over 50. years old, which is a significant number, but due to the
random selection of the respondents the age selection could not have been influenced.
Figure 3: Age fluctuation
The second question on the questionnaire concerned the amount of the exercise respondents
were engaged in. 78% percent of the respondents regularly participated in different kinds of
sport activities and only 3 out of 36 were not involved in any exercise, leaving 5 stating little
involvement with exercise.
0
10
20
30
40-50 50+

21
Figure 4: Participation in sports
The third question on background information was about respondents’ occupation. Here all
the respondents on pension were discarded leaving 41% of the respondent on office work. The
remaining 59% of the respondents were involved with work that involves moving from place to
place like janitors, sales representatives and teachers. The lack of respondents here was
evident; therefore no clear trend could be discovered based on this information.
3.5.1 The frequency of use of the services
This section of the questionnaire was designed to investigate how much the respondents have
used wellness services. The first question was designed to give an idea of how many times the
respondents have used these services in overall. 95% percent of the respondents have used
wellness services many times; the reason for this is the high average age of the respondents.
The second question was about whether the respondents have used the same company’s
services and the next two questions were about how frequently they have used the services.
The last one of this section was about how homogenous the service was.
21 respondents stated that they have been loyal to one service provider and 17 of these have
used same service provider for many years. Only 4 out of 21 respondents have gone to the
same service provider more than 10 times, this suggests that these 4 are not using the
services regularly.
Only 7 out of the 36 respondents use wellness services weekly, 10 on a monthly basis and the
remaining 47 percent use them as little as once or twice in a year. There could be a huge
profit making opportunity trying to change this 47% of the respondents into regular users.
0
5
10
15
20
25
30
Regular Little None

22
Figure 5: Usage of wellness services
The last question of this section was designed to investigate how homogenous the services the
respondents received have been. 72% of the respondents claimed to have had very
homogenous services and the remaining 28% consist of the people that have not gone to the
same service provider regularly; therefore their claims have little validity here. This question
suggests that the average quality of services in the field of wellness services is rather good.
3.5.2 The selection of the service provider
The second set of questions was designed to investigate the motives of the respondents that
choose a particular service provider. There were five different questions where the
respondents were asked to answer yes or no if the question did or did not affect the choice of
the service provider.
The most influential factors claimed by the respondents claimed to be were location with 81%
and friends recommendation with 72%. Then the second most influential factors were image
and the overall service selection of the service provider. The least influential factors
according to the respondents were the surrounding services of the location of the service
provider’s premises.
Some of the respondents, less than 8%, left some parts unanswered due to the fact that some
of the respondents had the service provider come to their office or home, therefore these
questions did not concern them.
3.5.3 Questions 3 and 4 concerning the location of the service provider
0
5
10
15
20
Weekly Monthly Less than monthly

23
With question number three, the respondents were asked which factors are valued by
customers concerning the location of the service providers. 56% percent stated that the time
used for the trip to the location is the most important; the location must be in a convenient
place for the customer. A parking place near the service providers’ premises and easy access
with public transportation were valued by most of the respondents. Only 19% claimed that
these matters do not make any difference to them.
Question number four was designed to investigate if the respondents are willing to travel
further for maybe a little cheaper service provider or if the respondents are willing to pay a
little more for services in a more convenient location for their daily routines. 56% of the
respondents claimed that the service provider should be near their home or work so that the
respondents do not need to make a detour to their daily routes. Again 19% of the respondents
claimed that this matter does not make any difference to them. These respondents were
most likely to be the same ones as in the previous question. Also 19% of the respondents
claimed that only quality matters, meaning that they are willing to travel longer distances for
better quality than some local service provider could offer.
These questions suggest that the accessibility to the service provider needs to be really easy
and the respondents are not willing to put much effort in to receiving the service. Location
should be within crowded living areas where there are loads of people living within walking
distance, but still a car park and public transportation is essential to the customers coming
from a distance.
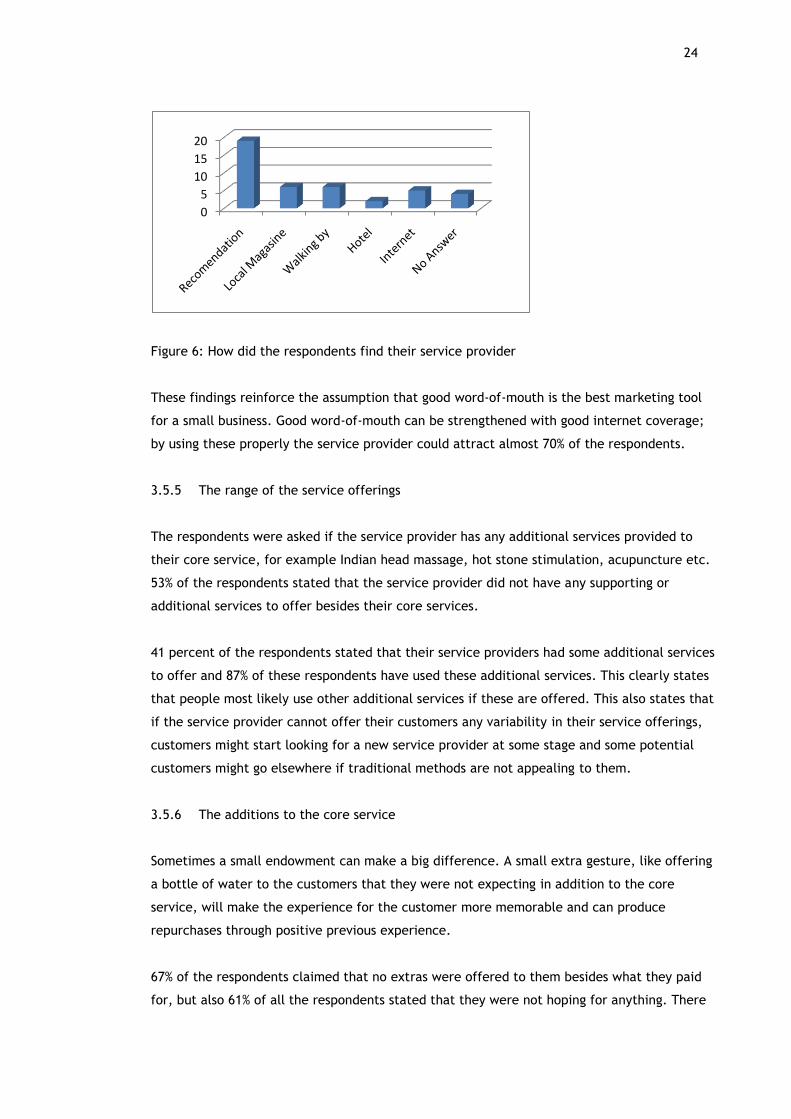
3.5.4 Finding the service provider
As a fifth question the respondents were asked to state how they found their service provider.
Most, 53 percent, of the respondents stated that their vicinity was the biggest influence on
finding the specific service provider for them. Also other three important matters affecting
the choice when looking for service provider were internet, local newspapers and an
appealing store window. Two of the respondents said that a hotels reception recommended a
service provider for them.
24
Figure 6: How did the respondents find their service provider
These findings reinforce the assumption that good word-of-mouth is the best marketing tool
for a small business. Good word-of-mouth can be strengthened with good internet coverage;
by using these properly the service provider could attract almost 70% of the respondents.
3.5.5 The range of the service offerings
The respondents were asked if the service provider has any additional services provided to
their core service, for example Indian head massage, hot stone stimulation, acupuncture etc.
53% of the respondents stated that the service provider did not have any supporting or
additional services to offer besides their core services.
41 percent of the respondents stated that their service providers had some additional services
to offer and 87% of these respondents have used these additional services. This clearly states
that people most likely use other additional services if these are offered. This also states that
if the service provider cannot offer their customers any variability in their service offerings,
customers might start looking for a new service provider at some stage and some potential
customers might go elsewhere if traditional methods are not appealing to them.
3.5.6 The additions to the core service
Sometimes a small endowment can make a big difference. A small extra gesture, like offering
a bottle of water to the customers that they were not expecting in addition to the core
service, will make the experience for the customer more memorable and can produce
repurchases through positive previous experience.
67% of the respondents claimed that no extras were offered to them besides what they paid
for, but also 61% of all the respondents stated that they were not hoping for anything. There
0
5
10
15
20

25
are still the rest of the respondents that stated that something extra, like a cup of thee or a
glass of orange juice. would be nice. There could be a great chance to exceed the customers’
expectations, especially when all the extras like a bottle of water are tax deductible.
3.5.7 The opinion of the services near the respondents’ homes or work
This question was designed to clarify the respondents’ perception of services in neighboring
areas. Most, 91%, of the respondents were used to using services near their work or home.
3.5.8 The opinion of the gender of the service provider
This question was designed to investigate if there could be a clear trend that could be
exploited, but 89% of the respondents claimed that it does not matter at all. Some of the
respondents seemed a little offended by the question.
3.5.9 The habit of recommendations
All the recommendations are free marketing for any company; these are essential especially
to small businesses with small budgets and all the savings are clear profits for the
entrepreneur. The respondents claimed that only 13% have not recommended their service
provider to anyone, but in this case these respondents have most likely been on holiday, so
there is no continuity in the customer relationship.
3.5.10 The reasons for seeking wellness services
This question was to clarify the motives of the respondents in seeking wellness services. 83%
of the respondents used wellness services of their own will, but 33% of the respondents also
stated that a doctor had recommended seeking for help from wellness service providers.
3.5.11 Preferable opening hours
The 12th question was designed to investigate which opening hours would attract most
customers. This was the first question, which really created most dispersion amongst the
answers.
Only 19% of the respondents claimed that mornings and afternoons would be most preferable
for them, when 36% preferred evenings and 16% preferred weekends. Flexibility with opening
hours was highly valued with 15% of the respondents. The rest of the respondents claimed

26
that all the opening hours suit them. Flexibility and evenings with opening hours would bring
in most customers.
Figure 7: Preferred opening hours
3.5.12 Average spending on wellness services
In general (45%) the respondents were used to spending 30 to 50 Euros on their services,
where 28% were used to spending over 50 Euros. The amounts spent on wellness services are
rather high even spent on a monthly basis, but it must be remembered that most of the
respondents were from the Helsinki area where wellness services are more expensive than in
other cities.
However, 17% of the respondents did not answer this question and only three out of all the
respondents claimed they were willing to pay less than 30 euros. The number of the
respondents not giving an answer was so high, was probably due for using free vouchers that
people are used to giving each other for presents. Also some companies subsidise their
employees’ visits to wellness centers.
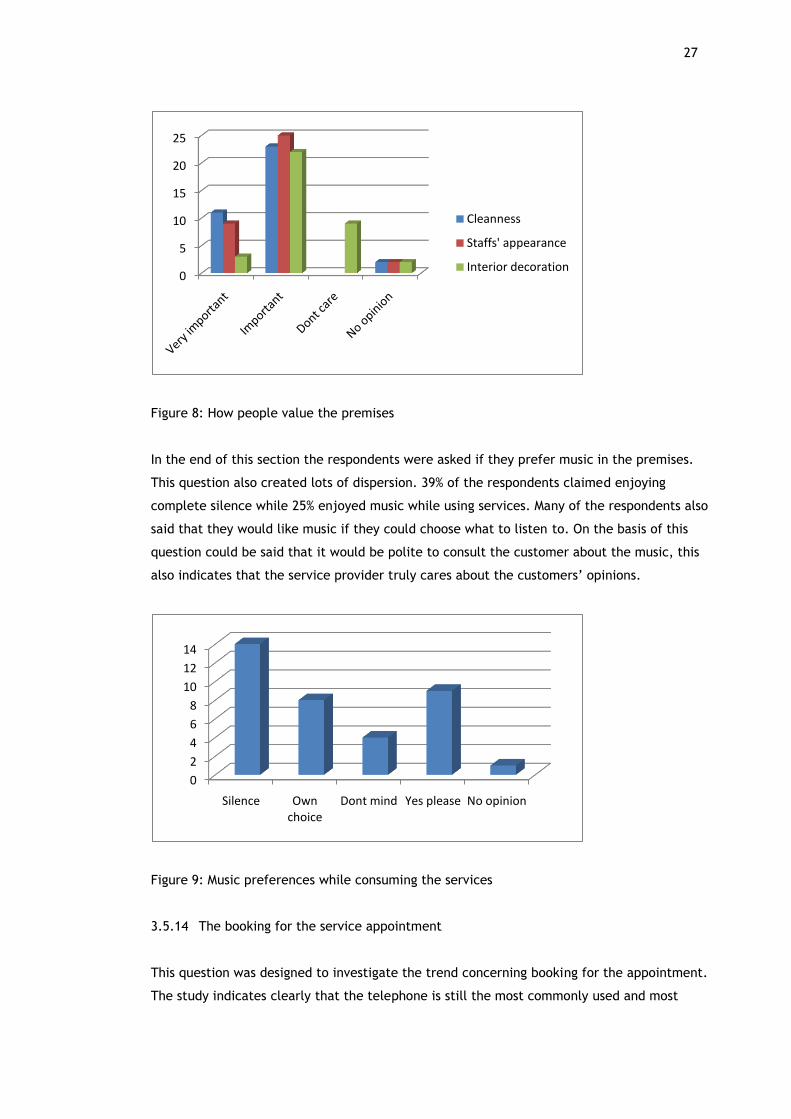
3.5.13 The perception of the premises of the service provider
In this question the respondents were asked four different things about the service provider’s
premises and how the respondents value them. Cleanliness was highly valued by 31% where
63% claimed to only value cleanliness. The appearance of the service provider was also highly
valued by 25% of the respondents, 69% claimed only valuing it. 25% claimed that they do not
care about the interior of the premises while only 3 of the respondents emphasized the
importance of the interior. Therefore it could be said that it does not matter what the
interior looks like as long as everything is clean and the service provider is neat.
02468
101214
Morning Evening Does not matter
Weekend Flexibility
27
Figure 8: How people value the premises
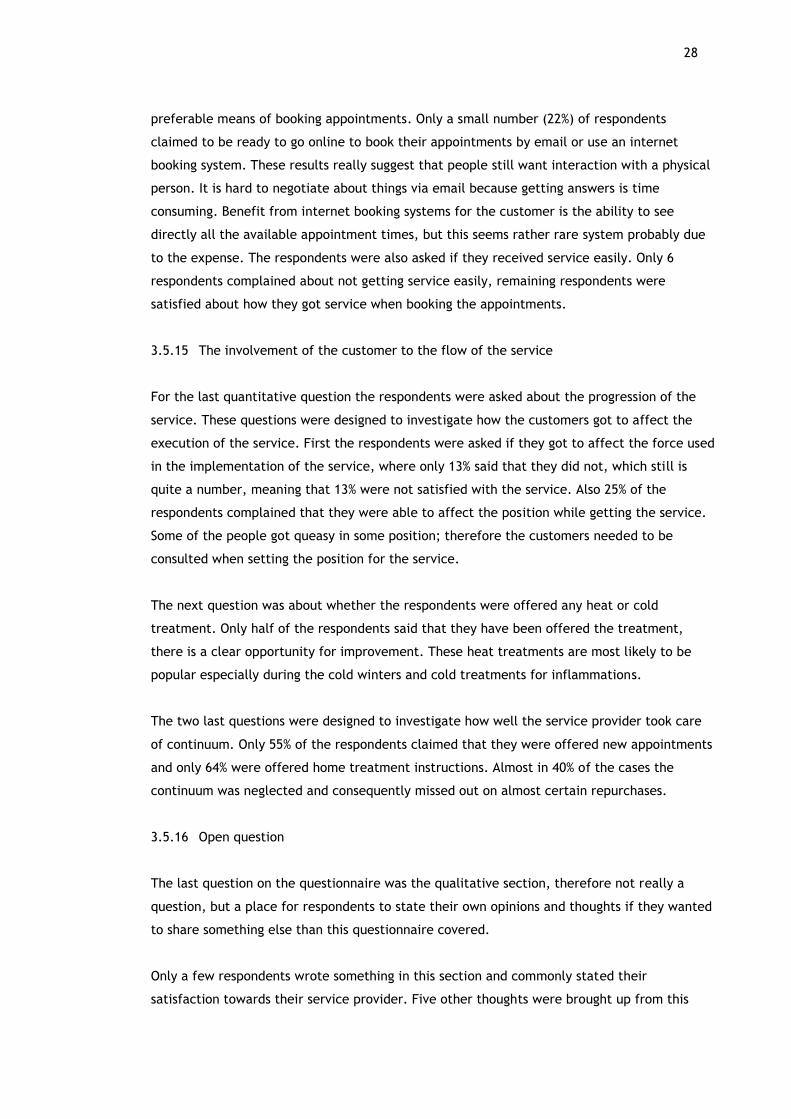
In the end of this section the respondents were asked if they prefer music in the premises.
This question also created lots of dispersion. 39% of the respondents claimed enjoying
complete silence while 25% enjoyed music while using services. Many of the respondents also
said that they would like music if they could choose what to listen to. On the basis of this
question could be said that it would be polite to consult the customer about the music, this
also indicates that the service provider truly cares about the customers’ opinions.
Figure 9: Music preferences while consuming the services
3.5.14 The booking for the service appointment
This question was designed to investigate the trend concerning booking for the appointment.
The study indicates clearly that the telephone is still the most commonly used and most
0
5
10
15
20
25
Cleanness
Staffs' appearance
Interior decoration
0
2
4
6
8
10
12
14
Silence Own choice
Dont mind Yes please No opinion
28
preferable means of booking appointments. Only a small number (22%) of respondents
claimed to be ready to go online to book their appointments by email or use an internet
booking system. These results really suggest that people still want interaction with a physical
person. It is hard to negotiate about things via email because getting answers is time
consuming. Benefit from internet booking systems for the customer is the ability to see
directly all the available appointment times, but this seems rather rare system probably due
to the expense. The respondents were also asked if they received service easily. Only 6
respondents complained about not getting service easily, remaining respondents were
satisfied about how they got service when booking the appointments.
3.5.15 The involvement of the customer to the flow of the service
For the last quantitative question the respondents were asked about the progression of the
service. These questions were designed to investigate how the customers got to affect the
execution of the service. First the respondents were asked if they got to affect the force used
in the implementation of the service, where only 13% said that they did not, which still is
quite a number, meaning that 13% were not satisfied with the service. Also 25% of the
respondents complained that they were able to affect the position while getting the service.
Some of the people got queasy in some position; therefore the customers needed to be
consulted when setting the position for the service.
The next question was about whether the respondents were offered any heat or cold
treatment. Only half of the respondents said that they have been offered the treatment,
there is a clear opportunity for improvement. These heat treatments are most likely to be
popular especially during the cold winters and cold treatments for inflammations.
The two last questions were designed to investigate how well the service provider took care
of continuum. Only 55% of the respondents claimed that they were offered new appointments
and only 64% were offered home treatment instructions. Almost in 40% of the cases the
continuum was neglected and consequently missed out on almost certain repurchases.
3.5.16 Open question
The last question on the questionnaire was the qualitative section, therefore not really a
question, but a place for respondents to state their own opinions and thoughts if they wanted
to share something else than this questionnaire covered.
Only a few respondents wrote something in this section and commonly stated their
satisfaction towards their service provider. Five other thoughts were brought up from this

29
section where three of the respondents shared the same thoughts wanting to emphasize their
desire for silence while receiving a service. Also three other of the respondents wished to
receive some refreshments due to low blood pressure and gain fluids after a intense massage
or some other physical service.
The last three matters that were brought up by this section concerned the services as a
whole. One of the respondents wished for more alternative forms of healing that indicates
the willingness and need for wider selection in the forms of healing. Then one of the
respondents complained that sometimes the service provider in a massage therapy did not
apply enough force to satisfy the customer’s wishes. The last thing that was brought up from
one of the respondents was the wish for home instructions for the customer to keep the
healing process going on even after receiving the service.
4 The conclusions
The purpose of the study was to investigate how customers perceive wellness services and
based on the responses to the survey suggestions for improvements are made according to the
4Ps marketing mix theory. The results of the survey suggest that the respondents were mostly
rather satisfied with all aspects that the survey covered about the services that the
respondents received. The positive feedback received from the survey indicates that the
respondents’ expectations have been met in general, but this still does not suggest that there
are no issues that need or could be improved.
4.1 Product
The survey already indicated the first question that the quality of the services is good
according to the respondents. According to the survey the overall number of different service
offerings could be bigger. Additional services would offer variability to the customer and also
to the service provider, otherwise the service could become too much of a routine and
customers could start searching for alternative services elsewhere. The respondents claimed
that the ones that go to a place where there are additional healing services only two have not
used these services; therefore people seem to be willing to use these services. Additional
services might only increase the customer base, but would not evict anyone.
A wide range of different offerings indicates true dedication to the field of business raising
the image of the company which was important to 50% of the respondents. The question 4
indicated that 19% out of the respondents were willing to travel longer distances for better
quality of services, meaning that the ability to satisfy customers’ needs in different ways and
on different levels could attract customers from a distance. Small things like offering heat
30
and cold treatments could make huge differences to the customers when the survey indicated
that only half of the respondents have ever been offered such treatments.
The booking of the service is an important part of service. Without properly operating a
booking system the service provider could lose customers when they get frustrated with
trying over and over again. The results from the survey indicated that only 16% of the
respondents claimed to not get a service easily indicating that booking system overall is in
good condition. Booking by telephone is still the most commonly used method, but this is
rather time consuming to the entrepreneur especially if he/she should be serving the
customers in the premises, unless they have an answering system or secretary, but even then
they might have to call back to the customer. 22% of the respondents stated a willingness to
use both email and internet booking, but emails also need the service provider to confirm the
booking to the customer, when with internet booking customers could see all the available
times and could book them directly as they wished. Internet booking could take over the
customers using emails quite quickly making internet booking the second preferable way of
booking with 45% of the respondents. Internet booking could also free the service provider
from the need to answer the phone all the time giving them more time for other things.
4.2 Price
According to the survey the respondents were willing to spend 30 to 50€ on the wellness
services, while 27% of the respondents were willing to use more than 50€ on the services.
Respondents spending more than 50€ on their services most likely want something special as
an addition to the basic services like an Indian head massage after a normal back and neck
massage. These customers are going to go somewhere else if the service provider cannot offer
them anything extra. With a frequent user card that would offer discounts to the customer,
then even the most price sensitive, 10% of the respondents, could be attracted to frequent
users and bound to use the service provider.
The survey indicates that the service provider will attract most customers in a location near a
huge customer base even though that prices would need to be set higher than in a location a
bit further away, the most important thing the customers are willing to pay for is ease access
to the services.
The survey also indicated that more than 50% of the customers claimed rather using a
wellness service during the evenings and weekends and 19% during the mornings and
afternoons. Around 30% of the respondents don’t care when they get to use the services.
These results indicates that flexibility with the opening hours would be most profitable and
the morning opening hours the least profitable.

31
4.3 Place
The premises should be selected on the basis of the surroundings. The premises should be
chosen where there are the most potential customers as near the premises as possible, urban
areas and close to heavily populated apartment building areas seem to be the most profitable
according to the survey. Most of the respondents stated that they like to use services near
their work place or near their homes, therefore shopping centres and city centers are not
likely places to attract customers. Only 13% of the respondents claimed that the surrounding
services of the service providers’ premises influences their decision when choosing the service
provider, indicating that the premises could be on the ground level of an apartment building
giving good exposure to the people living near for free and the lease of the premises could be
much cheaper than in a shopping centre or such without being dependent on the surrounding
facilities attracting customers.
The premises need to be conveniently accessible, so that the customers do not need to use
extra time just to be able to enter the premises. Even though 99% of the respondents claimed
that they like to use local nearby services and 55% of the respondents choose their service
provider according to the time need to be travelled, still 44% of the respondents valued the
possibility of a car parking space and accessibility with public transportation. Accessibility
from a distance should also be taken into consideration when choosing the premises, because
these are the customers that make an effort to be able to use these specific services and
likely are willing to pay well for the services.
According to the survey the overall image of the company is not the main subject people look
into when deciding on the service provider, but the cleanliness of the premises is the most
important factor for most of the respondents. The fact that 30% out of 96% claimed that
cleanliness of the premises is the most important factor emphasizes the importance of this
aspect. Also the interior decorations were an important factor for 69% of the respondents.
This indicates that the only image building that wellness improvement service provider needs
comes through clean and pleasant interior of the premises.
4.4 Promotion
According to the results of the survey the only promotion a small wellness improvement
service provider needs is good customer relationships offering positive word-of-mouth,
internet website, advertisement in local newspaper and appealing window decorations.
According to the survey the most influential and cheapest marketing method is good word-of-
mouth. 72% of the respondents were influenced by someone else’s recommendation and 52%

32
claimed that they have chosen their service provider according to someone else’s
recommendation. Therefore by offering customers something that they have not been
expecting, like a bottle of water or a cup of other refreshments could make a difference
when striving to exceed customers’ expectations, especially when 61% of the respondents
were not expecting anything extra from the service provider. In addition the majority of the
respondents stated that the local paper is the first place where they would search for service
provider and then the internet, and also that the choice is often made when passing by the
service provider’s window. Local paper offers exposure to the target market for a low cost
and internet offers exposure for all the people searching the internet for the service provider,
e.g. the people that have heard recommendations and are searching for additional
information. The display window is also a rather important item to invest in, because it gives
the first impression of the company and when customers are leaving the premises it is the last
thing they will see.
The survey indicated clearly that only half of the respondents were frequent users of wellness
improvement services, which means that there is a huge opportunity to convert random users
into frequent users by offering them, for example, cards that are prepaid and entitle the
customer to get ten massages for the price of nine. Cards like these would tie the customer
to a specific service provider and for the most price sensitive customers this would offer a
rather good discount. Also cards like these would decrease the need for advertising, when
the customers are tied to the service provider.
Advertising is still an important way to attract customers, because 83% of the respondents
seek help spontaneously and then the service provider needs to be easily found. In the
advertisements should be mentioned all the factors that the potential customers could value
and could be favorable to the service provider such as parking space, public transportation
connections, alternative healing services, opening hours and booking system. Advertising and
co-operation with local healthcare centers and doctors’ offices could also be profitable when
33% of the respondent have seeked for help due to doctor’s recommendation from wellness
improvement services.
4.5 Future surveys
This survey also can and should be conducted on a steady basis over the years to monitor
progress of the improvement of the quality of the services. Trends are evolving all the time
therefore the service providers need to be able to react to these changes accordingly. The
number of the respondents could have been better, so that the results would have been
based on wider range of opinions and younger respondents should be questioned in the
future. Also use of incentives in the future could improve the rate of respons.
33
References
Grönroos, Christian. 2001. Palveluiden johtaminen ja markkinointi. Porvoo: WS Bookwell Oy Grönroos, Christian. 1991. Nyt kilpaillaan palveluilla. Jyväskylä: Gummerus Kir-japaino Oy Isoviita, Antti & Lahtinen, Jouni 1998. Asiakaspalvelu ja markkinointi. Jyväskylä: Gummerus kirjapaino Oy. Kotler, Philip & Keller, Kevin 2006. Marketing Management. New Jersey: Pearson Education, Inc. Lahtinen, Jukka & Isoviita, Antti 1994. Customer Relationship Marketing. Kokkola: Avaintulos Oy Pesonen, Hanna-Leena & Lehtonen, Jaakko & Toskala, Antero 2002. Asiakaspalvelu vuorovaikutuksena: markkinointia, viestintää, psykologiaa. Jyväskylä: PS-kustannus. Rope, Timo & Pöllänen, Jouni 1994. Asiakastyytyväisyysjohtaminen. Juva: WSOY Ylikoski, Tuire 2001. Unohtuiko asiakas? Keuruu: Otavan Kirjapaino www.khl.fi

34
Figures
Figure 1: Level of satisfaction ..................................................................... 14

35
Appendices
Appendixe 1 Questionare ....................................................................... 36

36
Appendixe 1
Appendixe 1 Questionare
Hyvä vastaanottaja, olen Markus Ihalainen, tradenomi opiskelija Leppävaaran Laureasta. Nyt tarvitsisin hieman teidän apua lopputyöni loppuun saattamisessa. Lopputyöni aiheena on ”kilpailukyvyn luominen asiakastyytyväisyyden kautta” ja tutkimus tuotetaan yhteistyössä Kouluttettujen hierojien liiton kanssa (KHL.fi). Tutkimuksen tavoitteena on luoda toimiva ja hyödyllinen toimintamalli pienille hoitoalan yrittäjille, asiakastyytyväisyyden mittaamiseen ja jonka pohjalta he voivat kehittää toimintaansa ja asiakaspalveluaan nyt ja tulevaisuudessa. Nyt tarvitsisin teidän apua täyttämällä alempana olevan asiakastyytyväisyys kyselyn, jotta saan vertauskohteita raporttini tekemiseen. Kyselyyn olisi toivottavaa jos vastaukset olisivat mahdollisimman lyhyitä: kyllä / ei / ehkä, tyylisiä tai numeroilla. Tosin jotkut kysymykset vaativat hieman selitystä, mutta niidenkin kohdalla olisi toivottavaa pysyttäytyä yhden tai kahden lauseen mitoissa. Perustiedot: Ikä: Toimenkuva: Harrastukset: Itsekysely: 1.Oletko koskaan käyttänyt hierojan (vastaavan) palveluita?
- monta kertaa käyttänyt: - Kävitkö samassa paikassa: - Kauan käynyt samassa paikassa: - Kuinka säännöllisesti käyttänyt palveluita: - Onko palvelu ollut tasalaatuista:
2. Millä perusteella valitsit paikan, millä edellytyksin: - Liikkeen palvelukokonaisuus:
- liikkeen sijainti: - muut läheiset palvelut: - Liikkeen imago:
- Tuttavien suositukset: 3. Onko mielestäsi liikkeen sijainnilla merkitystä? Esim. Julkinen liikenne/parkkipaikka… 7. Mitä arvostaisit eniten keskeistä sijaintia vaikka palvelun hinta olisikin korkeampi kuin hieman kauempana oleva palvelupiste: - matka minkä valmis matkustamaan

37
Appendixe 1
4. Miten löysit paikan? Internetti, lehti, näyteikkuna, muu mikä: 5. Onko/oliko paljon erilaista palvelutarjontaa? Intialainen päähieronta, akupunktio, vyöhyketerapia… - Oletko hyödyntänyt muita palveluita: 6. Sisältyikö palvelun hintaan extraa? Vesipullo, kahvi, kylpytakki, suihku jne: - Olisitko halunnut/kaivannut jotain, mitä: 7. Oletko tottunut hyödyntämään kotialueesi/ työpaikkasi lähiseudun palveluita: 8. Onko mielestäsi palvelun tarjoajan sukupuolella merkitystä: 9. Oletko suositellut palvelun tarjoajaa muille: 10. Mikä ajoi hoitoon? Lääkärin kehotuksesta, oma tahto: 11. Millaisia aukioloaikoja arvostaisit eniten? Onko päivät hyviä sinulle vai kävisitkö mieluummin iltaisin tai viikonloppuisin: 12. Mitä olet tottunut maksamaan hoitoalan palveluista, täyttä hinnastoa ei tarvitse muistaa, mutta suunnilleen mitä olet maksanut mistäkin palvelusta: 13. Miten olet kokenut liikkeen/liikkeiden ilmapiirin?
- siisteys:
- työntekijän olemus: - sisustus: - musiikki? oli/ei/ ei haluttu: 14. Kuinka ajanvaraus onnistui?
- Internetti:
- puhelin:
- Email:
- saiko helposti palvelua:
- Millainen ajanvaraus sinulle sopii parhaiten:
15. Pääsitkö itse vaikuttamaan hoidon kulkuun?
- Hierojan/vasttavan voiman käyttöön: - Palvelun suorittamisen asentoon? Makuu, istuen jne. - Lämpöhoitojen käyttö? Kylmä, lämmin jne:
- Tarjottiinko jatkumoa hoitoon? Kotihoito-ohjeet, uusinta käyntiä:

38
Appendixe 1
16. Mitä jäit kaipaamaan? (Vapaa sana): Kiitos paljon vastauksistanne, ja mukavaa talvea: Markus Ihalainen Email: [email protected] P. 041-4313525