competitive advantage from production and supply … advantage from production and supply chain...
TRANSCRIPT

2015 Honeywell Users Group
Europe, Middle East and Africa
Competitive Advantage from Production and Supply Chain
Excellence
Satyendra Dubey, Honeywell

2 © 2015 Honeywell International All Rights Reserved
SCOR model as basis of Excellence
Industry recognized model driving production and supply chain excellence
Cu
sto
me
r pro
ce
sse
s S
up
pli
er
pro
ce
sse
s
Supply Chain
Cu
sto
me
r pro
ce
sse
s S
up
pli
er
pro
ce
sse
s
SCOR Model
Deliver Make Source
Plan
Source Make Deliver
Process, arrow indicates material flow direction
Process, no material flow Information flow
Return Return
• Supply Chain
Operations Reference
model
‒ Process framework
Standard processes
Standard metrics
Standard practices
Created by SCC
‒ Since 1996
‒ Over 800 companies
‒ 40% owner operators
3 © 2015 Honeywell International All Rights Reserved
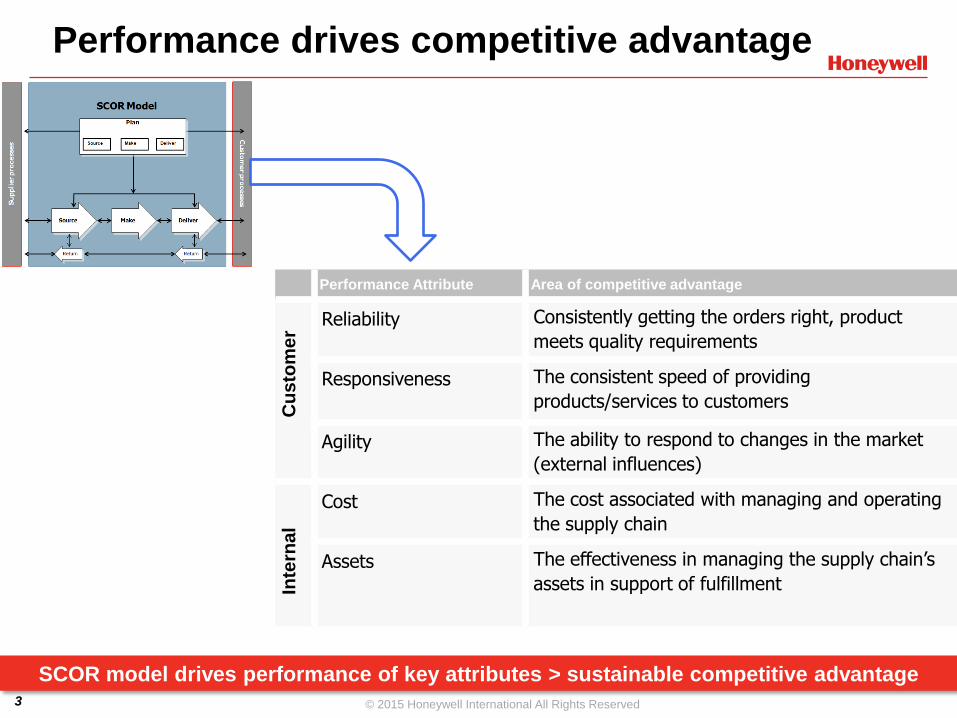
Performance drives competitive advantage
SCOR model drives performance of key attributes > sustainable competitive advantage
Performance Attribute Area of competitive advantage
Reliability Consistently getting the orders right, product
meets quality requirements
Responsiveness The consistent speed of providing
products/services to customers
Agility The ability to respond to changes in the market
(external influences)
Cost The cost associated with managing and operating
the supply chain
Assets The effectiveness in managing the supply chain’s
assets in support of fulfillment
Cu
sto
me
r In
tern
al
4 © 2015 Honeywell International All Rights Reserved
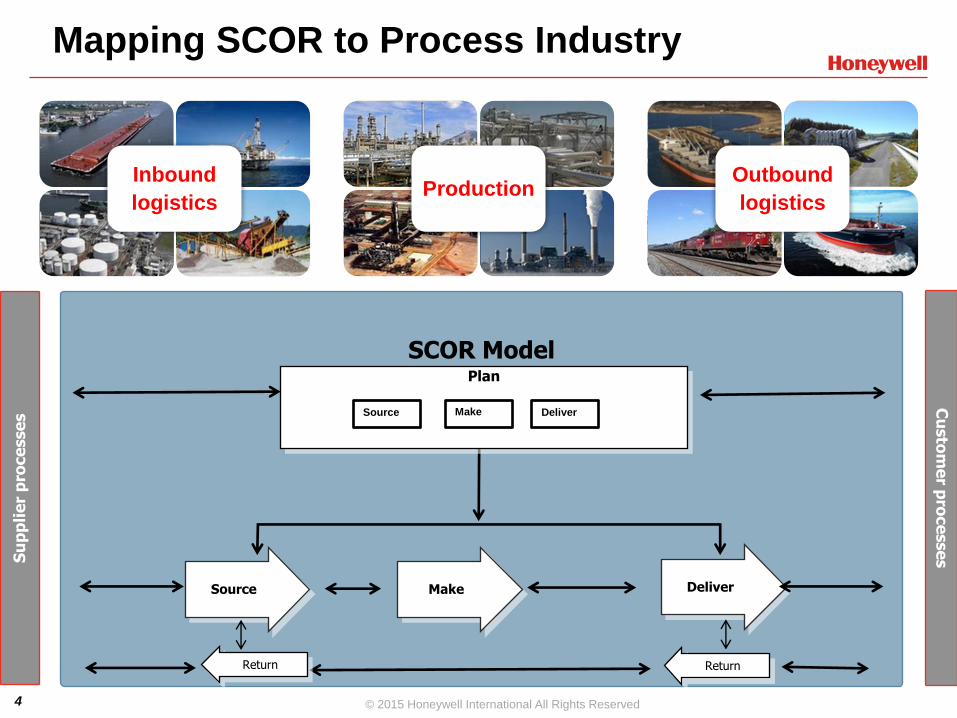
Mapping SCOR to Process Industry
Inbound
logistics Production
Outbound
logistics
Cu
sto
me
r pro
ce
sse
s S
up
pli
er
pro
ce
sse
s
SCOR Model
Deliver Make Source
Plan
Source Make Deliver
Return Return

5 © 2015 Honeywell International All Rights Reserved
Mapping SCOR to Process Industry
Inbound
logistics Production
Outbound
logistics
Integrated Planning
Production Planning Distribution Planning
Supply & Demand Balance
Production Accounting &
Management
Outbound Logistics
Management
Inbound Logistics
Management
Downtime Management
Scheduling
Su
pp
ly
Dem
an
d

6 © 2015 Honeywell International All Rights Reserved
Comprehensive Footprint
Comprehensive, scalable and integrated suite of services, products and solutions
Integrated Planning
Production Planning1 Distribution Planning
Supply & Demand Balance
Plant Manager4 Port & Marine Manager5 Mine Logistics Manager
Production Accounting & Reconciliation Production Form Plan Vs Actual3
Downtime Management
Scheduling 2
Supply chain
baseline
assessment
SCPM Master
Planning
Integration
Services
Model audit
and assurance
services
Covered in detail

7 © 2015 Honeywell International All Rights Reserved
Integrated Planning
Optimize across supply, production, sales & distribution
Supply Production Sales &
Distribution
• Maximize netback or
minimize cost
• Maximize sales ,
minimize logistics cost
• Maximize production
margins and
throughputs of
individual plants in silo
Optimize across silos
Multi site organizations can increase their margins by
more than 300 basis points by deploying integrated
planning process that optimizes the entire supply chain
for the enterprise.
Use Refinery and Petrochemical Modeling
System (RPMS) multi plant for
• Enterprise level production and distribution planning
(Budgeting, Quarterly, Monthly)
• Feedstock evaluation and selection (Term and spot
contracts), exchange agreements
• Investment analysis (new production or distribution
infrastructure) and strategic decisions
• Logistic costs or
demand not considered
• Synergy between plants
not considered
• Marginal production
costs not considered
• Demand & production
constraints not
considered
Performance Attribute
SCPM Responsiveness: Reduction in planning cycle
times
SCPM Agility: Capture opportunity trades
SCPM Cost: Reduce feedstock and production costs
SCPM Assets: Increased revenue from profit mix
optimization, new investment optimization &
debottlenecking
Benefit

8 © 2015 Honeywell International All Rights Reserved
RPMS 510: Release 30th Oct 2015

9 © 2015 Honeywell International All Rights Reserved
Supply & Demand Balance
Sales, inventory and operations planning and coordination across
supply chain
Ideally suited for bulk supply chains where inventory
management is key and demurrage can be significant
Use Capacity Distribution Planner (CDP) for
• Integrated sales, inventory and operations planning for
complex supply chains
• Inventory forecasts and control for planning horizon
• Collecting actual data and plan vs actual
• Make plans by balancing supply and demand for simpler
supply chains
Planning &
Scheduling systems
Accounting systems,
actual data
Manual
Inputs
Integrated reporting
Plan visualization
Revise
Review Current
Plan
Approve
Supply Inventory
Dispatch
Forecast
positions
Day 1
Day 2
Day 3 . . .
Profit/day
Performance Attribute
SCPM Reliability: Reduction in demurrages & stock outs
SCPM Responsiveness: Reduction in fulfillment cycle times
& replenishments
SCPM Agility: Capture opportunity trades,
SCPM Assets: Increased utilization of supply chain assets
Benefit

10 © 2015 Honeywell International All Rights Reserved
CDP 230: released 19th Oct 2015
PlanningStaff
CustomerSupportStaff
CommercialStaff
Shareholders & Stakeholders
Customers
MaintenanceStaff
Field Data
Business Data
Collaborative Environment
CDP
• Key Enhancements:
‒ Enable a multi-level approval workflow;
‒ Enable plan revisions consolidation which brings performance
improvements;
‒ Enable Gantt chart view provider for Data Objects;
‒ Enable localization on Data Objects, and
‒ Platform upgrades (PCC250, Infragistics V15.1, SQL Server 2012,
Windows Server 2012 R2, Office 2013)

11 © 2015 Honeywell International All Rights Reserved
Production Accounting and Reconciliation
Accurate production data that helps business take
better economic decisions with reduced uncertainty
• Increased reconciliation accuracy which leads to reduction in
losses up to 1% and improves decision making capability
which helps deliver a margin improvement of up to 5%
• Integrated graphical workflow environment and “best in class”
reconciliation solver helps close balances up to 20% faster
and reduces learning time by up to 20% for new engineers
ensuring sustained delivery of benefits
Use PAR for
• Complex wide or Unit Specific material balances in mass
or volume units
• Multi Component balances for Mineral processing
industries
• Inventory calculation using built in VCF calculations as per
API standards
• Supports AMIRA P754 metal accounting guidelines
Receipts
Measured,
Interfaced
or Manually
Entered
Feeds
Inventory
Mass/Volume
Intermediates Products
Inventory
Mass/Volume
Shipments
Measured,
Interfaced
or Manually
Entered
Process
Unit
Process
Unit
Process
Unit
Reconciled Production/consumption & Inventory position by product
Losses, Missing Movements, Meter Maintenance
Planning
Systems
Scheduling
Systems
Simulation
Systems ERP
Enterprise
Dashboard
Benefit
Performance Attribute
SCPM Reliability: Reduction in shipment and invoicing
errors, increased planning model accuracy
SCPM Responsiveness: Reduction in accounting cycle time
SCPM Costs: Reduction in Fuel and Loss

12 © 2015 Honeywell International All Rights Reserved
PAR 200: Released June 2015
• Graphically create
accounting model
• Bulk Configure
Models
• Model Versioning
• Model Tuning
• Automatic collection
from Historian /
Movement Systems
• Manual Movement
entry
• Import movements
from Excel
• Graphically
highlight balance
issues
• View Production
Metrics
• Perform Simple
balances
• Range Constraints
• Loss Modelling
• Solver Diagnostics
• Missing Movements
solver
• Notifications &
Approval workflow
• Data Auditing
• Standard/Custom
Reports
• Excel Analytics
• Historian Writeback
Configure
Production Model
Collect
Production Data
Perform
Initial Analysis Perform Statistical
Reconciliation
Collaborate
Modular Accounting
Models
Flexible Data
Collection Methods
Intuitive visual aids and metrics for
faster analysis
Multiple Mechanisms
to view Information
Dashboard
Historian
Easier to Build,
Learn & Maintain
Secure & Seamless
Data Collection Faster identification of Key Errors
Reliable, Fast & Extensive Information
Availability

13 © 2015 Honeywell International All Rights Reserved
Base Lining Services
Baseline and improve supply chain and production management practices
and models
Rich technology and domain
experience enables Honeywell
to provide tailored consulting
based on customer needs
Use Honeywell SC&PM services for
• Baseline current supply chain and production
management processes against the industry best
practices
• Developing improvement roadmap to achieve best in
class status
• Model review and audits of supply chain and production
management models
Supply chain
baseline
• Based on SCOR model applied to process
industry
• Honeywell best practice repository
• Standardized questionnaire & scoring
Best in class
roadmap
• Roadmap to address gaps based on
unique supply chain characteristics and
complexity. Highlights low hanging fruits
such as process enhancements, training
and review metrics.
• Also highlights needs for small and large
project based improvements
• Recommends phased approach that pays
for itself
Model audit and
assurance
• LP and accounting model reviews
• Set up assurance and back casting
processes
Interviews1 Mapping as-is process2 3 Standard way of scoring, Baseline of
as-is
4 Detailed gap assessment
5 Supply chain complexityDevelop roadmap based on baseline
score, gaps and complexity6
14 © 2015 Honeywell International All Rights Reserved
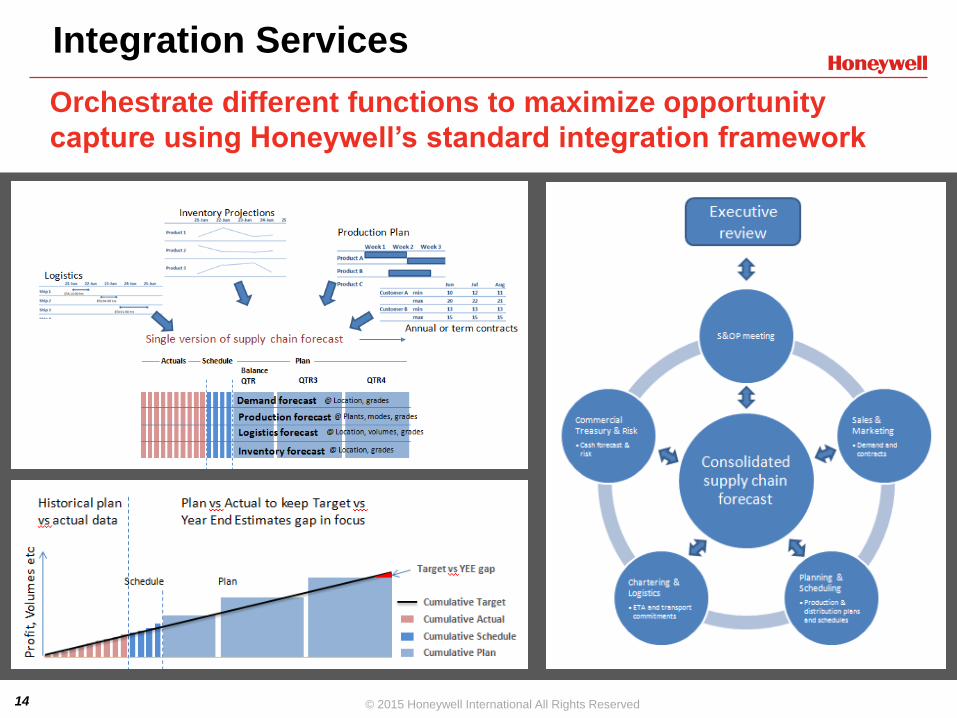
Integration Services
Orchestrate different functions to maximize opportunity
capture using Honeywell’s standard integration framework
• LP and accounting model reviews
• Set up assurance and back casting
processes

15 © 2015 Honeywell International All Rights Reserved
Vertical Solutions
Performance
Attribute
Area of competitive advantage
Reliability Reduction in re blends (15 to 45 cents per barrel of product), Increase in on time delivery, Reduction in demurrages
(10%), Reduction in shipment errors
Responsiveness Reduction in cycle times (Planning, Accounting processes etc.) up to 20%, Order fulfillment cycle time
Agility Increase in proportion of spot trades, Minimize impact of unplanned events (e.g. vessel late arrival, customer
shutdown, production slowdown), Reduction in tank top or tank bottom
Cost Reduction in feedstock cost, Reduction in Fuel and Loss (0.1 to 0.3%), Identification of downtime events and support
proactive maintenance, Productivity of SCPM personnel, Inventory carrying costs
Assets Increased revenue from product mix optimization, New investment optimization, Debottlenecking
Typical Benefits
16 © 2015 Honeywell International All Rights Reserved
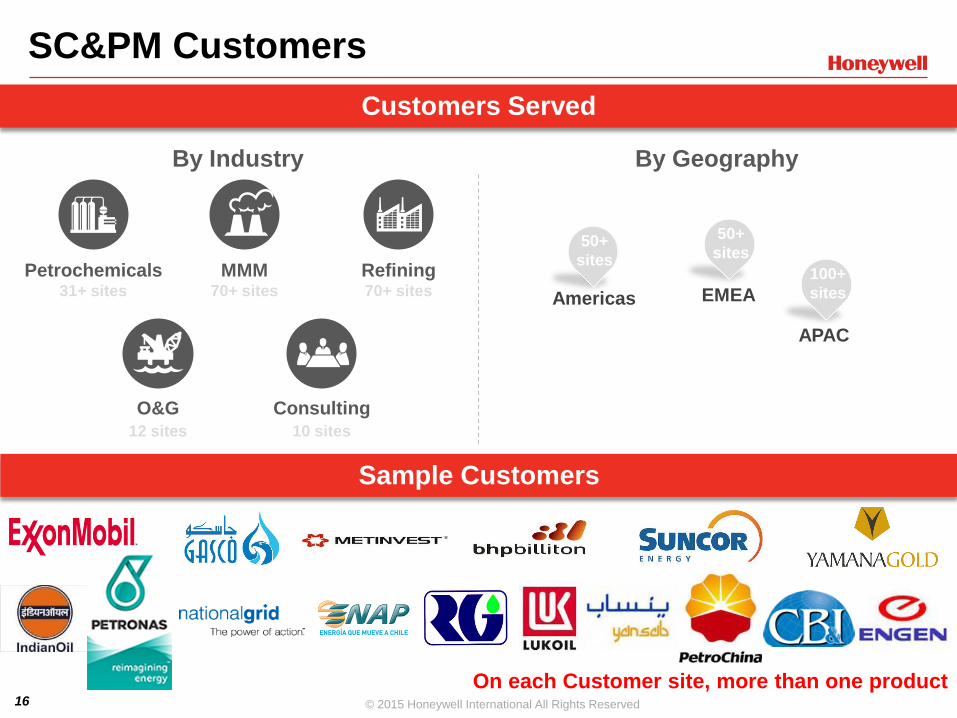
SC&PM Customers
Customers Served
By Industry By Geography
Petrochemicals Refining
O&G Consulting
31+ sites 70+ sites
12 sites 10 sites
Sample Customers
Americas
50+
sites
EMEA
50+
sites
APAC
100+
sites
On each Customer site, more than one product
MMM 70+ sites

17 © 2015 Honeywell International All Rights Reserved
Contact Honeywell for SCPM Base Lining & Master Planning