competition and security of supply in philippine ... · 1 prof. rowaldo del mundo university of the...
TRANSCRIPT
1
Prof. Rowaldo del Mundo University of the Philippines
EPDP Conference 2016
Competition and Security of Supply in Philippine Electricity Market
EPDP Conference 2016
New World Makati Hotel
12-13 January 2016
Prof. Rowaldo del Mundo
Electrical & Electronics Engineering Institute University of the Philippines

2
Prof. Rowaldo del Mundo University of the Philippines
EPDP Conference 2016
Energy Security
“The uninterrupted availability of energy sources at an affordable price.”
Long-term energy security mainly deals with timely investments to supply energy in line with economic developments and environmental needs.
Short-term energy security focuses on the ability of the energy system to react promptly to sudden changes in the supply-demand balance.
- International Energy Agency
AVAILABILITY AFFORDABILITY

3
Prof. Rowaldo del Mundo University of the Philippines
EPDP Conference 2016
Security of Supply: Availability Power Supply Security can be measured by
the Loss-of Load Expectation (LOLE) popularly referred to as LOLP
LOLE - The expected number of times in a year that the
available generation capacity considering scheduled and forced-outages of power plants will not meet system daily peak demand
- number of days in a year that there will be “brownouts” (blackouts) that would be caused by power plant outages

4
Prof. Rowaldo del Mundo University of the Philippines
EPDP Conference 2016
Source: R. del Mundo, UP College of Engineering (1991)
Optimal Level of Reliability in the Philippines
1 day/year LOLE
US and Europe LOLE ~ 0.3 to 0.1 day/year
Note: Based on study conducted by UPNEC for NEDA in 1991 (System Peak Demand 3,046 MW, Power rates was PHP2/kWh)
Outage Cost (PHP/kWh) =
(0.0086 + 0.0023D)F + 0.1730
Frequency and Duration of Loss of Load
Security of Supply: Availability

5
Prof. Rowaldo del Mundo University of the Philippines
EPDP Conference 2016
Source: R. del Mundo, UPCOE College of Engineering (1991)
Translating LOLE to Capacity Reserve
In 1990, System Peak Demand of Luzon Grid ~ 3,000 MW
1 day/yr LOLE = 34% Reserve
Security of Supply: Availability
6
Prof. Rowaldo del Mundo University of the Philippines
EPDP Conference 2016
Source: R. del Mundo, UPNEC (2011)
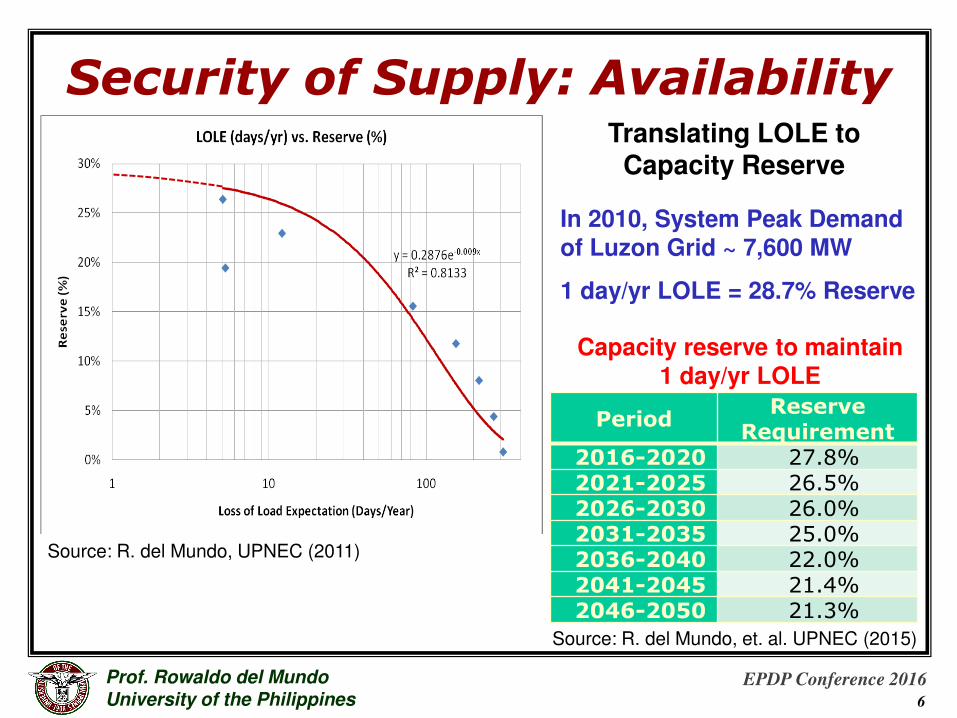
Translating LOLE to Capacity Reserve
In 2010, System Peak Demand
of Luzon Grid ~ 7,600 MW
1 day/yr LOLE = 28.7% Reserve
Period Reserve
Requirement
2016-2020 27.8%
2021-2025 26.5%
2026-2030 26.0%
2031-2035 25.0%
2036-2040 22.0%
2041-2045 21.4%
2046-2050 21.3%
Source: R. del Mundo, et. al. UPNEC (2015)
Capacity reserve to maintain 1 day/yr LOLE
Security of Supply: Availability
7
Prof. Rowaldo del Mundo University of the Philippines
EPDP Conference 2016
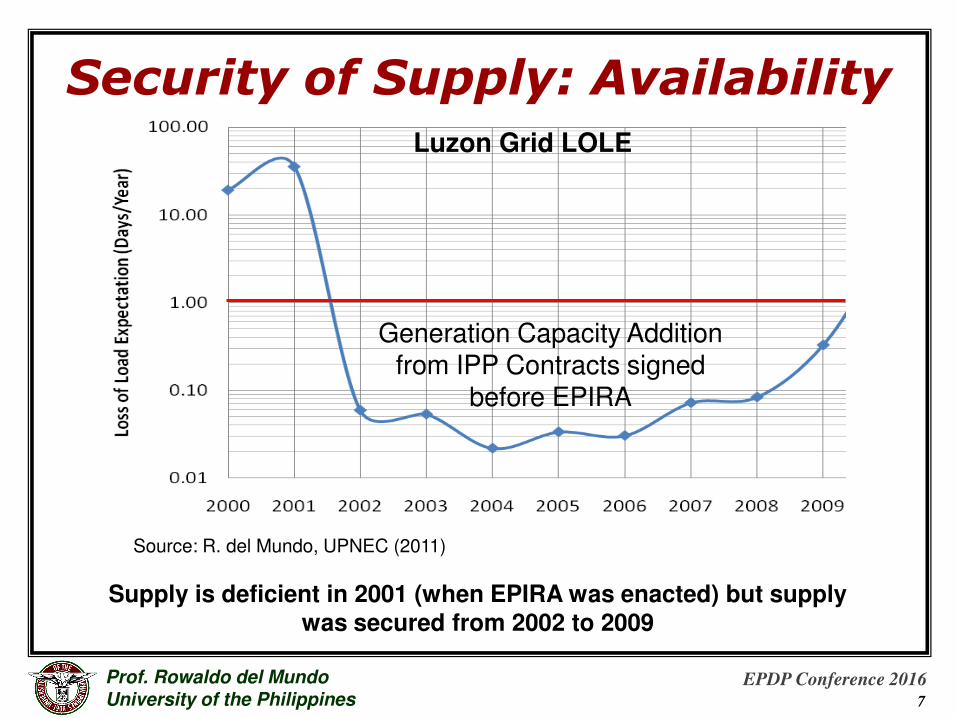
Source: R. del Mundo, UPNEC (2011)
Luzon Grid LOLE
Generation Capacity Addition from IPP Contracts signed
before EPIRA
Supply is deficient in 2001 (when EPIRA was enacted) but supply
was secured from 2002 to 2009
Security of Supply: Availability
8
Prof. Rowaldo del Mundo University of the Philippines
EPDP Conference 2016
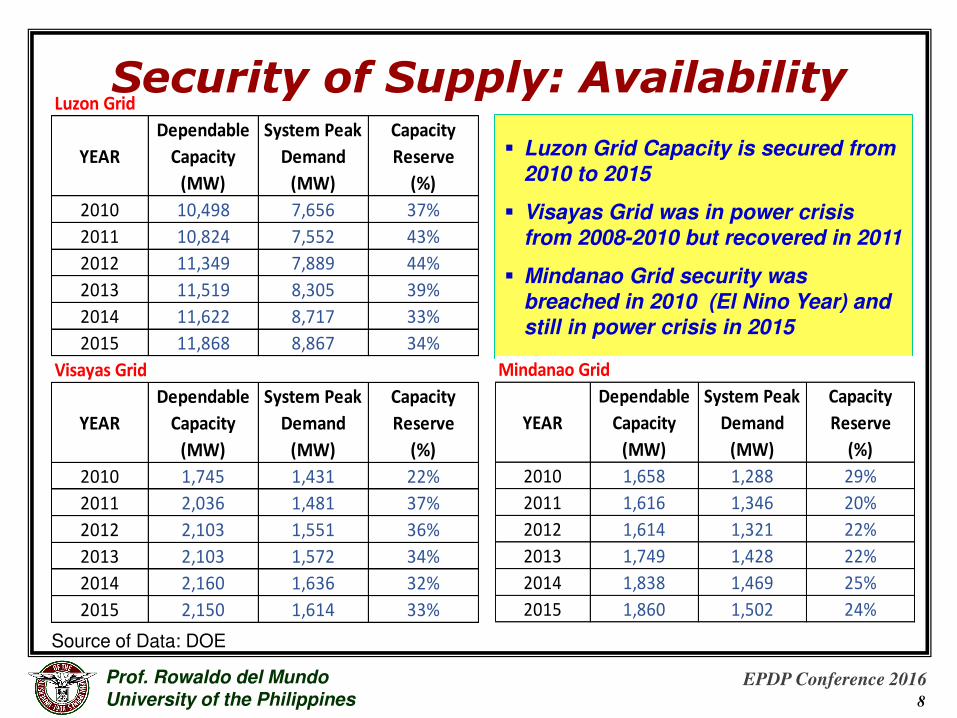
Source of Data: DOE
Luzon Grid Capacity is secured from
2010 to 2015
Visayas Grid was in power crisis
from 2008-2010 but recovered in 2011
Mindanao Grid security was
breached in 2010 (El Nino Year) and
still in power crisis in 2015
Luzon Grid
YEAR
Dependable
Capacity
(MW)
System Peak
Demand
(MW)
Capacity
Reserve
(%)
2010 10,498 7,656 37%
2011 10,824 7,552 43%
2012 11,349 7,889 44%
2013 11,519 8,305 39%
2014 11,622 8,717 33%
2015 11,868 8,867 34%
Visayas Grid
YEAR
Dependable
Capacity
(MW)
System Peak
Demand
(MW)
Capacity
Reserve
(%)
2010 1,745 1,431 22%
2011 2,036 1,481 37%
2012 2,103 1,551 36%
2013 2,103 1,572 34%
2014 2,160 1,636 32%
2015 2,150 1,614 33%
Mindanao Grid
Security of Supply: Availability
Mindanao Grid
YEAR
Dependable
Capacity
(MW)
System Peak
Demand
(MW)
Capacity
Reserve
(%)
2010 1,658 1,288 29%
2011 1,616 1,346 20%
2012 1,614 1,321 22%
2013 1,749 1,428 22%
2014 1,838 1,469 25%
2015 1,860 1,502 24%

9
Prof. Rowaldo del Mundo University of the Philippines
EPDP Conference 2016
Luzon Grid 2015 2016 2017 2018 2019 2020
Peak Demand (MW) 9,011 9,365 9,732 10,114 10,512 10,924
Commited New Capacity (MW) 135 600 460 900 2,100
Total Dependable Capacity (MW) 11,757 11,757 12,357 12,817 13,717 15,817
Capacity Reserve (%) 30% 26% 27% 27% 30% 45%
Visayas Grid 2015 2016 2017 2018 2019 2020
Peak Demand (MW) 1,848 1,949 2,048 2,137 2,226 2,313
Commited New Capacity (MW) 116 153 143
Total Dependable Capacity (MW) 2,276 2,429 2,572 2,572 2,572 2,572
Capacity Reserve (%) 23% 25% 26% 20% 16% 11%
Mindanao Grid 2015 2016 2017 2018 2019 2020
Peak Demand (MW) 1,574 1,645 1,729 1,813 1,902 1,990
Commited New Capacity (MW) 415 751 149 640
Total Dependable Capacity (MW) 2,253 3,004 3,153 3,793 3,793 3,793
Capacity Reserve (%) 43% 83% 82% 109% 99% 91%
Above data excludes several power plants listed by DOE as indicative projects (no financial close yet)
Source of Data: DOE List of Existing Power Plants (2010 to 2014) and IPPs
Critical Supply for Luzon in 2016 to 2018 (Reserve is less than 30%)
Critical Supply for Visayas in 2015 to 2020 (Reserve is les than 30%)
Power Crisis in Mindanao will be solved in 2016 (Reserve is more than 50%) Dependable Capacity in 2014 is 46% Hydro
Security of Supply: Availability

10
Prof. Rowaldo del Mundo University of the Philippines
EPDP Conference 2016
Source of Data: DOE List of Existing Power Plants (June 2015)
Security of Supply: Fuel Diversity
Luzon Grid and Visayas Grid
Capacity are secured from point of
view of fuel diversity
Mindanao Grid dominant supply from
hydro and oil-based power plants
does not provide enough diversity

11
Prof. Rowaldo del Mundo University of the Philippines
EPDP Conference 2016
LUZON GRID CAPACITY 2013 2014
A Dependable Capacity 11,519 MW 11,622 MW
B Peak Demand 8,305 MW 8,717 MW
C Largest Generating Unit 647 MW 647 MW
D Total Capacity of NatGas CCGT 2,760 MW 2,760 MW
Effective Reserve (A – B - C – D) (193) MW (502) MW
System Operating Reserve under Lost of Largest Generating Unit and NatGas Fuel Constraint from Malampaya
Outage Duration
Outage Type
Average Market Price
(PhP/kWh)
Highest Market Price (PhP/kWh)
Feb 10 – Mar 12, 2010 Turn-Around Shutdown 11.18 25.00
October 20 – 26, 2011 Maintenance Shutdown 9.11 45.00
July 13 – 21, 2012 Maintenance Shutdown 7.14 54.01
Nov 11 – Dec 10, 2013 Turn-Around Shutdown 22.85 62.00
Source of Data: WESM Market Data (2010-2013)
Source of Data: DOE Power Statistics (2014)
Diversity in Fuel Type is negated by Diversity in Fuel Source. Single fuel source affecting short-term security of supply
Security of Supply: Fuel Diversity

12
Prof. Rowaldo del Mundo University of the Philippines
EPDP Conference 2016
Security of Supply: Self-Sufficiency
Total Dependable
Capacity (MW)
Total Indigenous
Capacity (MW)
Self- Sufficiency
(%Indigenous)
Luzon Grid 11,868 6,062 51%
Visayas Grid 2,150 1,027 48%
Mindanao Grid 1,860 945 51%
Total 15,878 8,034 51%
Philippines Self-Sufficiency has reach more than 50% contributed mainly by Renewable Energy and Natural Gas
Source of Data: DOE List of Existing Power Plants (June 2015)
Generating Capacity and Self-Sufficiency (June 2015)

13
Prof. Rowaldo del Mundo University of the Philippines
EPDP Conference 2016
0
5
10
15
20
25
30 Residential Commercial IndustryUS¢/kWh
Source: ACE as Compiled by IEEJ (2013)
Affordability of Supply: Price
Philippines’ electricity price is almost twice of the average price of the Region

14
Prof. Rowaldo del Mundo University of the Philippines
EPDP Conference 2016
Source: of Data: USAID CEnergy
Electricity Tariffs
after Removing
Taxes and
Subsidies
Customer Class PH SG IND MAL TH
Residential 0.2066 0.2063 0.0514 0.0713 0.1034
Commercial 0.2133 0.2062 0.1480 0.1365 0.1254
LV Industrial 0.1729 0.1988 0.1144 0.1197 0.1195
HV Industrial 0.1714 0.1784 0.0973 0.1080 0.1075
Residential 0.2066 0.2063 0.0866 0.0808 0.1419
Commercial 0.2133 0.2062 0.1832 0.1461 0.1639
LV Industrial 0.1729 0.1988 0.1496 0.1293 0.1580
HV Industrial 0.1714 0.1784 0.1325 0.1176 0.1461
Residential 100.00% 100.00% 168.39% 113.40% 137.30%
Commercial 100.00% 100.00% 123.78% 107.04% 130.73%
LV Industrial 100.00% 100.00% 130.75% 108.03% 132.26%
HV Industrial 100.00% 100.00% 136.18% 108.90% 135.83%
Residential 100.00% 99.85% 41.90% 39.12% 68.70%
Commercial 100.00% 96.66% 85.87% 68.48% 76.83%
LV Industrial 100.00% 114.98% 86.53% 74.75% 91.36%
HV Industrial 100.00% 104.09% 77.26% 68.59% 85.21%
Pre-tax with Subsidies (USD/kWh)
Pre-tax after Removing Subsidies (USD/kWh)
Percent Change in Electricity Tariffs
Price of Electricity Relative to Philippines
PH Power Rates still higher by 30% compared to Indonesia, Malaysia and Thailand and almost comparable to Singapore
Affordability of Supply:
Price

15
Prof. Rowaldo del Mundo University of the Philippines
EPDP Conference 2016
Fuel Type IND PH SG TH VIE
Total GWh 182,384 69,176 45,999 155,986 99,179
Coal 44.4% 36.6% 0.0% 22.3% 21.1%
Nat Gas 23.2% 29.8% 78.0% 68.3% 43.9%
Oil 20.3% 4.9% 18.4% 1.3% 4.8%
Hydro 6.8% 14.0% 0.0% 5.2% 30.1%
Other RE 5.2% 14.7% 3.6% 2.8% 0.1%
Cost of Fuel for Generation and Retail Rates (2011)
Generation Mix by Fuel (2011)
Affordability of Supply: Price
Price is affected by Fuel Type
Price in Philippines should be lower than Singapore (96% Oil-based)
Source of Data: ACE as Compiled by IEEJ (2013)
16
Prof. Rowaldo del Mundo University of the Philippines
EPDP Conference 2016
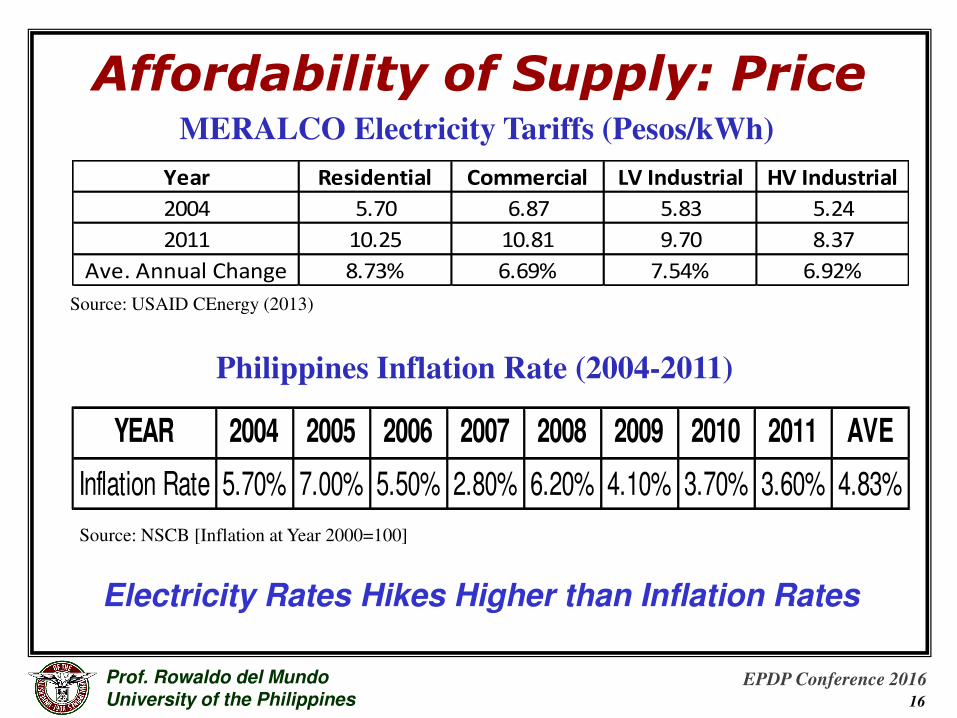
Year Residential Commercial LV Industrial HV Industrial
2004 5.70 6.87 5.83 5.24
2011 10.25 10.81 9.70 8.37
Ave. Annual Change 8.73% 6.69% 7.54% 6.92%
YEAR 2004 2005 2006 2007 2008 2009 2010 2011 AVE
Inflation Rate 5.70% 7.00% 5.50% 2.80% 6.20% 4.10% 3.70% 3.60% 4.83%
MERALCO Electricity Tariffs (Pesos/kWh)
Source: USAID CEnergy (2013)
Philippines Inflation Rate (2004-2011)
Source: NSCB [Inflation at Year 2000=100]
Electricity Rates Hikes Higher than Inflation Rates
Affordability of Supply: Price

17
Prof. Rowaldo del Mundo University of the Philippines
EPDP Conference 2016
Affordability of Supply: Price Ave. Monthly Price Settlement in WESM
December 2012 to January 2014
Ave. Monthly Price Settlement in WESM
July 2006 to October 2015
Volatility of Price in WESM affected by Short-Term Security of Supply
Source of Data: WESM
18
Prof. Rowaldo del Mundo University of the Philippines
EPDP Conference 2016
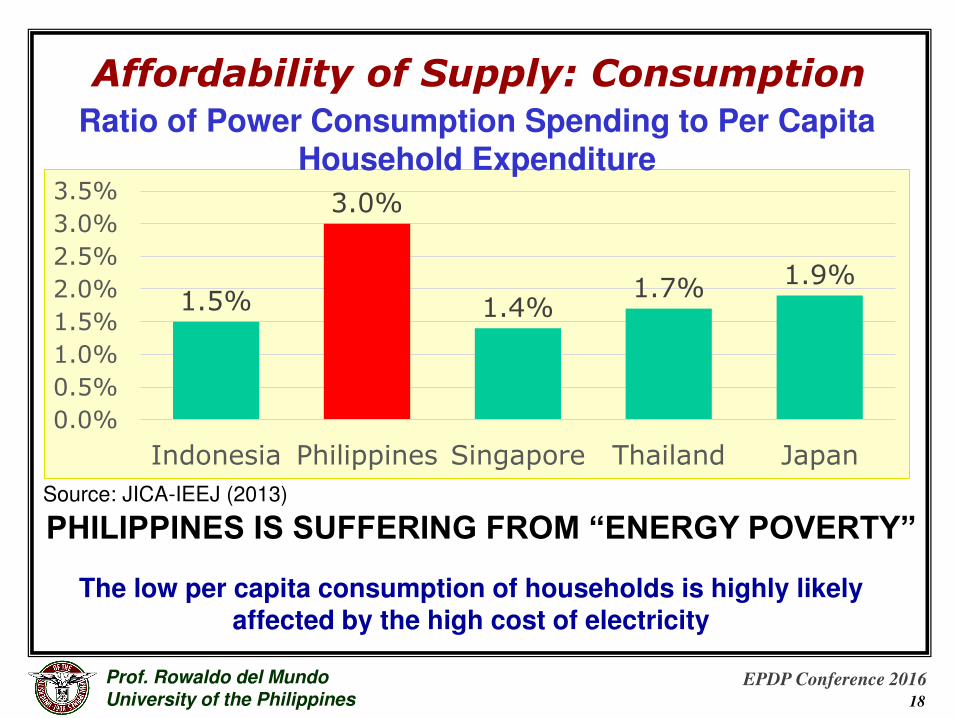
Affordability of Supply: Consumption
1.5%
3.0%
1.4% 1.7%
1.9%
0.0%
0.5%
1.0%
1.5%
2.0%
2.5%
3.0%
3.5%
Indonesia Philippines Singapore Thailand Japan
Source: JICA-IEEJ (2013)
PHILIPPINES IS SUFFERING FROM “ENERGY POVERTY”
The low per capita consumption of households is highly likely affected by the high cost of electricity
Ratio of Power Consumption Spending to Per Capita Household Expenditure

19
Prof. Rowaldo del Mundo University of the Philippines
EPDP Conference 2016
0
200
400
600
800
1000
1200
1400
1600
2000 2001 2002 2003 2004 2005 2006 2007 2008 2009 2010 2011
Indonesia Philippine Singapore Thailand Vietnam
kWh/Capita
Source: JICA-IEEJ (2013)
PHILIPPINES has lowest Per
Capita
Consumption
(based on
energy consumed by
residential
consumers)
and PH is not
improving compared to
neighboring
countries in
the ASEAN
Per Capita Electricity Consumption
(based on residential consumption)
Affordability of Supply: Consumption

20
Prof. Rowaldo del Mundo University of the Philippines
EPDP Conference 2016
Addressing Security of Supply: Availability and Affordability
YEAR SPOT
2006 36%
2007 15%
2008 13%
2009 13%
2010 15%
2011 14%
2012 8%
2013 8%
2014 10%
2015 7%
Source: WESM Monthly Summary Reports
(1) Bilateral Contracts (2) Spot Market
Focus of Reducing Prices should be in Bilateral Contracts!
Philippine Electricity Market

21
Prof. Rowaldo del Mundo University of the Philippines
EPDP Conference 2016
1. Short Term Power Supply Procurement and Contracting
Bidding Result
Statistics2015 2016 2017 2018
Aggregated
Demand65 MW 78 MW 83 MW 93 MW
Number of Bids
Received3 5 7 7
Total Capacity
Offered57 MW 170 MW 298 MW 308 MW
No. of Winning
Bidders2 3 1 1
Total Power
Supply60 MW 78 MW 83 MW 93 MW
Blended Price
(PhP/kWh)5.70* 5.34 4.01 4.05
*3rd Bidder's Bid from Diesel was rejected.
• 2015 & 2016: Supply is tight. Former Sec. Petillla even recommended to P-Noy to see emergency power from Congress
• 2017 & 2018: New power plants will be commissioned
Outcome of the Power Supply Aggregation and Joint Procurement of Electric Cooperatives
Addressing Security of Supply: Availability and Affordability

22
Prof. Rowaldo del Mundo University of the Philippines
EPDP Conference 2016
2. Long Term Power Supply Procurement and Contracting
• Mindanao ECs received “take it or leave it offer” before the Aggregation at PHP5.50 to PHP6.30/kWh
• Existing contracts of Central Luzon, Region1+CAR and Region8 ECs at PHP5.00/kWh (estimated average)
Outcome of the Power Supply Aggregation and Joint
Procurement of Electric Cooperatives
Addressing Security of Supply: Availability and Affordability
Aggregation
GroupNo. of ECs
Contract
Price
Reference
Date
Mindanao
ECs21 PHP4.12/kWh
October
2011
Central Luzon
ECs11 PHP4.12/kWh August 2013
Region 1 +
CAR ECs8 PHP3.33/kWh
September
2014
Region 8 ECs 11 PHP3.32/kWhSeptember
2014
Note: Contract Price at 100% Capacity Utilization
at FOREX and Fuel Price of Ref. Date

23
Prof. Rowaldo del Mundo University of the Philippines
EPDP Conference 2016
19.11
15.85 14.74
9.59 11.46
3.09
19.76
9.9 9.17
24.83
19.78
15.23
0
5
10
15
20
25
30
ASEAN Ave. =US¢13.49/kWh
Sources of Data: IEEJ-JICA (2013) and CLECAFLAG/USAID COMPETE (2014)
ASEAN Retail Rates (2011) and CLECAFLAG (2013 and 2019) [U.S. Cents/kWh]
Generation prices will be reduced by 32% in 2019
Retail rates to consumers will be reduced by 20%

24
Prof. Rowaldo del Mundo University of the Philippines
EPDP Conference 2016
a) Prices from existing power plants remains high
Contributing factors (a) supply-demand balance, (b) less-efficient legacy power plants of NPC, and (c) PSALM privatization which increased the capital of
the power plants even without increasing capacity
Existing plants should be given only short-term
contracts
Lessons from Power Supply Procurement and Contracting of ECs
Addressing Security of Supply: Availability and Affordability

25
Prof. Rowaldo del Mundo University of the Philippines
EPDP Conference 2016
b) competitive procurement process and
contracting of the ECs for their long-term power supply demonstrated that the power rates can be
reduced significantly GENCOs in competition seek the least-cost that they offer because they were given the options to select the type, size, site, technology provider, EPC contractor, fuel supplier, and lenders.
Long-term contracts should be given only for new power plants
Lessons from Power Supply Procurement and Contracting of ECs
Addressing Security of Supply: Availability and Affordability

26
Prof. Rowaldo del Mundo University of the Philippines
EPDP Conference 2016
1. Least-Cost Power Supply Plan
2. Focus on Objectives: Target Price
3. Market Assessment and Transaction Design
4. Requirements for New Capacity in Long-Term Power Supply Agreements
5. Evaluation Methodology: Level Playing Field
6. Transparent Procurement Process
Addressing Security: Competitive Procurement of Power Supply

27
Prof. Rowaldo del Mundo University of the Philippines
EPDP Conference 2016
1. Least Cost Power Supply
• Economic Mix of Power Supply
• BASE LOAD Capacity and Energy
• PEAKING Capacity & Energy
• [INTERMEDIATE]
Example: Baseload Plant: Coal & Peaking Plant is Diesel
Baseload Demand: 78% of Peak and 97% of annual energy
Peaking Demand: 22% of Peak and 3% of annual energy
Addressing Security: Competitive Procurement of Power Supply

28
Prof. Rowaldo del Mundo University of the Philippines
EPDP Conference 2016
1. Least Cost Power Supply
• Short Term Power Supply
• Up to 5 Years
• Long Term Power Supply
• Lead time of at least 5 years
• Contract baseload for next 5 years to avoid exposure in WESM
Uncontracted Demand and Timing of Procurement
Addressing Security: Competitive Procurement of Power Supply

29
Prof. Rowaldo del Mundo University of the Philippines
EPDP Conference 2016
2. Focus on Objectives: Target Price
Calculate best new entrant power plant in the grid to set the target price
Target Prices of the ECs Joint Procurement
Mindanao ECs (300 MW): PHP4.20/kWh
Central Luzon ECs (300 MW): PHP3.90/kWh
Region 1 + CAR ECs (106 MW): PHP3.90/kWh
Region 8 ECs (150 MW): PHP3.33/kWh
Addressing Security: Competitive Procurement of Power Supply

30
Prof. Rowaldo del Mundo University of the Philippines
EPDP Conference 2016
3. Market Assessment and Transaction Design
“who will bid and what will be the likely bid?” Mindanao ECs experience
Set target price at PhP4.20/kWh
Only 2 GENCOs are interested to join a bidding but already said “take it or leave it at PhP5.50/kWh - PhP6.30 /kWh”
GENCOs in Luzon and Visayas were not interested
Soluution
Design an international procurement process
The most important element in a competition is the TENSION among competitors
Addressing Security: Competitive Procurement of Power Supply

31
Prof. Rowaldo del Mundo University of the Philippines
EPDP Conference 2016
3. Market Assessment and Transaction Design
“who will bid and what will be the likely bid?” Central Luzon ECs experience
Addressing Security: Competitive Procurement of Power Supply

32
Prof. Rowaldo del Mundo University of the Philippines
EPDP Conference 2016
3. Market Assessment and Transaction Design
Target and Achieved Price after implementing the carefully designed transaction
Addressing Security: Competitive Procurement of Power Supply
Aggregation
Group
Aggregated
Demand
Target
Price
Contract
Price
Mindanao
ECs300 PHP4.20/kWh PHP4.12/kWh
Central
Luzon ECs300 PHP3.90/kWh PHP4.12/kWh
Region 1 +
CAR ECs106 PHP3.90/kWh PHP3.33/kWh
Region 8 ECs 150 PHP3.33/kWh PHP3.32/kWh

33
Prof. Rowaldo del Mundo University of the Philippines
EPDP Conference 2016
4. Requirements for New Capacity in Long-Term Power Supply Agreements
Bid Submission Requirements: Technical Proposal
a) Evidences of Secured Site
b) Evidences of Arrangement with EPC Contractor
c) Evidences of Arrangement with Fuel Supplier
d) Evidences of Arrangement with Lenders
Addressing Security: Competitive Procurement of Power Supply

34
Prof. Rowaldo del Mundo University of the Philippines
EPDP Conference 2016
Elements of Competitive Procurement Process for Power Supply
5. Evaluation Methodology: Level Playing Field
a. Levelized Cost for the duration of contract
b. Capture factors affecting price • Plant Outages (substitute WESM Price) • Value Added Tax for Non-Renewable Energy • Security Deposits (equivalent PHP/kWh) • Value-Added Services for Risk Mitigation

35
Prof. Rowaldo del Mundo University of the Philippines
EPDP Conference 2016
Elements of Competitive Procurement Process for Power Supply
6. Transparent Procurement Process
a. Organization of procurement process • ECs have Memorandum of Agreement for Joint power
supply planning and procurement
– Joint Board, Joint BAC, Joint TWG and Transaction Advisers
– Commitment to undergo and finish the competitive procurement process
– Follow Procurement Code of Conduct
b. Detailed evaluation methodology • Complete instructions including equations on how the
evaluated price will be calculated • Bidders must be able to prepare a financial model
c. Independent Observers and Auditors

36
Prof. Rowaldo del Mundo University of the Philippines
EPDP Conference 2016
Conclusion and Recommendations Security (availability and Affordability) of
Supply in the Philippines must be addressed by focusing on Bilateral Contract market
Key to significantly reducing the price of electricity in the Philippines is to prioritize security of supply through:
a) long-term power supply contracting for new generation capacity which avoids the high-priced privatized legacy power plants and IPP contracts of NPC and allows GENCOs to seek the least cost. Existing power plants must be given only short term contracts (1 to 5 years) while long-term contracts (10 to 25 years) must be reserved only to new power generation capacity; and
b) competitive power supply procurement process
37
Prof. Rowaldo del Mundo University of the Philippines
EPDP Conference 2016
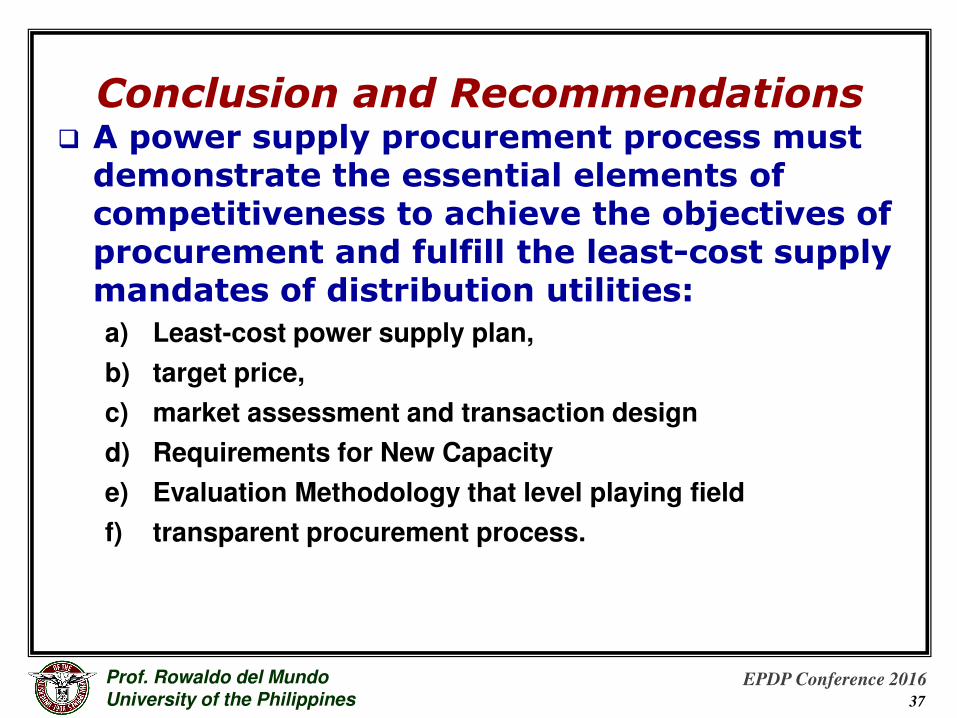
Conclusion and Recommendations A power supply procurement process must
demonstrate the essential elements of competitiveness to achieve the objectives of procurement and fulfill the least-cost supply mandates of distribution utilities:
a) Least-cost power supply plan,
b) target price,
c) market assessment and transaction design
d) Requirements for New Capacity
e) Evaluation Methodology that level playing field
f) transparent procurement process.
38
Prof. Rowaldo del Mundo University of the Philippines
EPDP Conference 2016
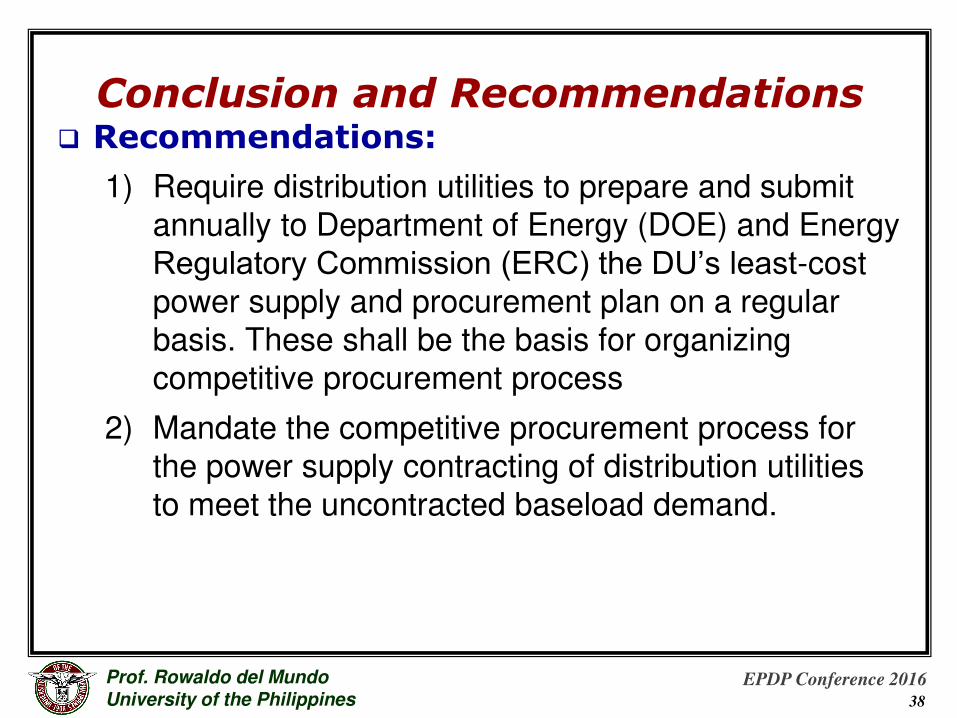
Conclusion and Recommendations Recommendations:
1) Require distribution utilities to prepare and submit annually to Department of Energy (DOE) and Energy Regulatory Commission (ERC) the DU’s least-cost power supply and procurement plan on a regular basis. These shall be the basis for organizing competitive procurement process
2) Mandate the competitive procurement process for the power supply contracting of distribution utilities to meet the uncontracted baseload demand.

39
Prof. Rowaldo del Mundo University of the Philippines
EPDP Conference 2016
Conclusion and Recommendations Recommendations:
3) DOE and/or ERC must organize the competitive procurement process for the uncontracted demand of the DU if the power supply and procurement plan was not implemented by the DU;
4) If a bilateral contract is submitted to the ERC for approval but without evidence that the DU has conducted a competitive procurement process, the ERC must organize a competitive process such as CSP through comparative proposals.
5) Ensure transparency through clear and well defined rules and evaluation methodology and requiring independent CSP Monitors.

40
Prof. Rowaldo del Mundo University of the Philippines
EPDP Conference 2016
PROF. ROWALDO “Wali” DEL MUNDO
Electrical & Electronics Engineering Institute University of the Philippines Diliman, Quezon City 1101
Email: [email protected]