competition and credit ratings after the fallandraghent.com/research/flynnghent.pdfthe three main...
TRANSCRIPT

Competition and Credit Ratings After the Fall
First Draft: February 4, 2014
This Draft: June 6, 2016
Abstract
We analyze the entry of new credit rating agencies into structured finance products.
Our setting is unique as we study a period in which the incumbents’ reputation was
extremely poor and the benefit of more fee income from inflating ratings was low. We
find entrants cater to issuers by issuing higher ratings than incumbents, particularly
for interest-only (IO) tranches. Using measures of market share that are exogenous to
incumbent ratings, we provide suggestive evidence that incumbent rating levels become
more generous as entrant market share in a product type increases. We also exploit a
feature of structured finance that identifies rating shopping and find that incumbent
ratings increase in shopping.
JEL: G18, G21, G24, G28.
1 Introduction
High quality credit ratings can reduce informational asymmetries and transactions costs in
financial markets. Credit ratings provided by a third party can be particularly helpful in
encouraging participation in financial market activities among investors that are less likely
to collect their own information (see Boot and Thakor (1993) for a discussion of market
segmentation by information sensitivity). Conversely, low quality credit ratings can lead to
dysfunction in financial markets. Indeed, Mathis, McAndrews, and Rochet (2009), Ashcraft,
Goldsmith-Pinkham, and Vickery (2010), and Griffin and Tang (2012) have documented the
role of the credit rating agencies (CRAs) in the dysfunction that led to a collapse in structured
finance products in the 2007-2009 period. A large literature from other asset classes has
also shown that credit ratings have meaningful effects on real economic outcomes.1 Given
the central role that CRAs play in financial markets, several entities including the SEC
(2011, 2012) have suggested that one way to improve credit ratings is to enable greater
competition. Indeed, the Credit Rating Agency Reform Act of 2006 required the SEC to
increase competition among CRAs (SEC 2013). In the spring of 2012, European regulators
also implemented a framework to increase competition between CRAs (Kanter 2012).
To better understand how rating agencies compete and the effects of competition on
ratings, we study the entry of two firms into the market for commercial mortgage-backed
securities (CMBS) ratings. Our setting is unique given that (1) the entrants did not initially
rate corporate, municipal, or sovereign bonds,2 and (2) the upheaval in the structured finance
market in recent years resulted in a significant loss of reputation for incumbent CRAs.
We find that the entrants issue systematically higher ratings, often by several notches,
than established CRAs. The entrants’ average ratings are higher than those of each of
1See, for example, Alp (2013), Baghai, Servaes, and Tamayo (2014), Adelino and Ferreira (forthcoming),Almeida, Cunha, Ferreira, and Restrepo (forthcoming), and Cornaggia, Cornaggia, and Israelson (2014).See Cornaggia, Cornaggia, and Israelson (2014) for a review of the extensive earlier literature on the realeffects of credit ratings.
2One of the entrants intends to rate corporate bonds and has very recently begun rating public financebonds, but over our sample period was primarily active in CMBS. The other entrant rates only structuredfinance.
1

the three main incumbents, and this phenomenon is not due to unobserved heterogeneity
in security quality. The difference between entrant and incumbent ratings is especially
pronounced in interest-only (IO) tranches, which the entrants rate AAA almost uniformly.
The entrants’ ratings are still significantly higher in the non-IO sample although the economic
magnitude of the difference is much smaller for these securities. The gap between entrant
and incumbent ratings is higher for the entrant that is struggling more to gain market share,
and it is also higher shortly after entry by the CRA that does gain significant market share.
Taken together, the findings suggest that higher entrant ratings are part of a strategy to win
business from the incumbents. However, it does not appear this strategy is sufficient to gain
a dominant market position.
We further find that entry affects the level of the incumbents’ ratings. Our main variable
of interest is the percentage of securities of a particular CMBS deal type (“conduit/fusion,”
“large loan,” and “other” deal types) issued in a given year that are rated by the entrants. By
simultaneously controlling for the year of issuance and the deal type, as well as time trends,
we do not capture merely that CMBS ratings became more lax over time, or that some
deal types are rated more leniently. To further mitigate endogeneity and other selection
concerns, we generate predicted entrant market shares that are exogenous to the level of
incumbent ratings. While we cannot completely rule out selection explaining some of the
increase in incumbent ratings, our results using these predicted shares suggest that some of
the relationship between entrant shares and incumbent ratings is causal rather than solely
reflecting the ability of entrants to choose markets in which incumbent rating levels are
already increasing.
We find that as the entrants’ market share in a deal type increases, the ratings assigned
by incumbents are more favorable from the perspective of the issuer. A 10 percentage point
increase in the share of non-IO securities rated by an entrant raises the average incumbent
rating by about 0.3 notches. As the entrants’ total combined market share is 52% by the end
of our sample period, this represents an economically meaningful increase in the favorability
2

of incumbent ratings. Consistent with more generous incumbent ratings, we also find that
an increase in the entrants’ share lowers the level of subordination for securities rated AAA
by at least one incumbent. These results hold when we use the predicted entrant shares as
explanatory variables.
The finding that the ratings of the incumbents increase in the entrants’ market share
could be due to rating shopping on the part of issuers, rating catering on the part of the
CRAs, or a combination of both. Rating shopping occurs when issuers seek multiple ratings
in an attempt to find the most favorable ones. Rating catering refers to the CRAs courting
business by using lax standards. Theoretical work shows that competition always exacerbates
shopping and often exacerbates catering. However, no empirical work to date has attempted
to distinguish between these two mechanisms or measure their relative impact on rating
levels. We show that no one agency had close to 100% market share in the CMBS market,
thus leaving scope for both shopping and catering.
Rating shopping is never explicitly disclosed, so we exploit a unique feature of the struc-
tured finance market - the interdependence of securities within a given deal - and create
two measures of shopping. Our more conservative measure considers a deal to be “shopped”
when alternate tranches are missing ratings from different CRAs, with no change in the total
number of ratings, a structure which 6% of the deals in our sample exhibit. Both our mea-
sures increase following entry, and one of the measures is consistently statistically significant
in explaining the change in incumbent ratings in response to changes in entrant shares.
The remainder of the paper proceeds as follows. The next section discusses the insti-
tutional setting, explains theoretical predictions about and previous empirical work on the
effect of competition on ratings, and relates this work to our setting. Section 3 presents our
shopping measures and data. Section 4 discusses the ratings of the entrants. In Section 5,
we estimate the effect of entry on the ratings of the incumbents, and Section 6 concludes.
3
2 Background and Hypotheses
2.1 Institutional Setting
To better understand the catering and shopping mechanisms and the extent to which the
intensity of each varies across security types, a brief overview of the institutional details in
the structured finance rating market is useful. See An, Deng, and Gabriel (2011) and Titman
and Tsyplakov (2010) for descriptions of the CMBS market more generally.
Structured finance issuers, like other types of issuers, seek ratings in order to (1) provide
investors with information about the risk of loss of value and (2) to satisfy investors’ demand
for regulatory certification. The key difference between the rating process in structured
finance as compared to that in, e.g., corporate debt, is what is being rated vs. what is
being evaluated. For corporate debt these are one and the same—a CRA evaluates default
risk for a security and then issues a rating. In structured finance, however, the individual
securities are part of a larger deal, and the cash flows and risks associated with a particular
security are usually related to its position in the deal relative to the other securities. This
means that the CRA must evaluate the entire deal structure in order to generate ratings for
most individual securities. Thus, although the market observes security-level ratings, CRAs
conduct deal -level analysis to produce those ratings.
There are usually multiple AAA tranches in a CMBS deal. One reason for this is to
satisfy different maturity appetites such that there are multiple top tranches that differ by
the schedule on which they are to receive principal payments. This allows the issuer to
create low-risk securities with expected maturities of, say, 3, 5, and 7 years.3 Rating a
structured finance security typically begins by determining the subordination level for the
highest tranches in the capital structure (e.g., the tranches that will receive AAA ratings).
This process involves an informal, back-and-forth discussion between the CRA and the issuer
3Prepayment risk on CMBS is small since the majority of securitized commercial mortgages have defea-sance clauses (see Dierker, Quan, and Torous 2005). Therefore, the main source of risk is the credit risk ofthe collateral.
4

that centers on how the issuer can maximize the portion of the deal that is rated AAA.
Importantly, determining the top tranches’ subordination levels requires a CRA to analyze
the underlying collateral for the deal, but does not require it to analyze the remainder of
the deal structure (the waterfall) since, by definition, the top tranches are the first to receive
principal and interest payments.
However, if an issuer wants ratings for securities in a deal with, say, three tranches, a
CRA must analyze and rate the first and second in order to rate the third. This is because
rating a security that lies below others in the waterfall requires an analysis of the interest
and principal cash flows that the waterfall promises to the tranches above it. More generally,
to rate tranche n in the capital structure, a CRA must conduct enough analysis to also rate
tranche n − 1. In other words, the CRA must analyze the deal structure in order to rate
a given security. Shopping for ratings for mezzanine or junior securities necessarily implies
that a CRA must also analyze (and more or less rate) the portion of the deal structure that
is senior. In such a case it may be more accurate to characterize shopping as occurring at
the deal level.
The requirement that CRAs analyze an entire deal structure in order to rate securities
below the most senior makes the concept of rating shopping more nuanced in structured
finance than in corporate debt. Whereas shopping is a security-level phenomenon in cor-
porate bonds, it cannot be thought of as such in structured finance. From the perspective
of a CRA, rating a structured finance deal involves a substantial investment of resources
and it seems unlikely that the issuer can see the actual rating of every security in the deal
before it decides whether to buy each one. It is more likely that it gets a preliminary opinion
from a CRA on certain aspects of the deal and then decides whether to proceed with further
negotiations. If the threat of unsolicited ratings is sufficiently strong, some of the shopping
will be disclosed in the form of an additional rating.4 However, it is also possible that, so
long as the issuer purchases ratings for enough of the securities in the deal, it can choose not
4Fulghieri, Strobl, and Xia (2014) suggest that CRAs issue unsolicited ratings precisely to deter shopping.
5

to buy the ratings on only one or two tranches.
Another unique aspect of structured finance is the existence of a class of securities known
as interest-only (IO) that have very different features, rating methodology, and investor bases
than non-IOs. The IO tranches are created by stripping off the spread between the weighted
average collateral coupon and the coupon on the securities with principal balances. Securi-
tizing this spread allows the issuer to immediately monetize the profit from deal issuance,
rather than waiting to accumulate the profits over the life of the deal. IOs are not trivial in
terms of volume in CMBS: they represent 20% of the number of tranches in our sample, and
38% of the dollar amount of trading volume (primary and secondary market) in CMBS is in
IO and Principal Only (PO) tranches.5 IOs have no principal balance by definition. Thus,
they lack features, such as subordination and weighted average life, CRAs use as part of the
rating process for non-IOs. The result is that some CRAs publish separate methodologies
for this class of securities.
Additionally, IO investors tend to be more sophisticated investors with the ability to
conduct the same type of risk analysis as CRAs. Our conversations with market participants
indicate that IO investors are more likely to be hedge funds, dealers, and money managers
than large insurance companies or pension funds. Thus, they may not use IO ratings for
the information they contain, but merely for the regulatory certification, either internal or
external, that they provide. Even among institutions that are not subject to government-
mandated ratings-based regulatory requirements, internal controls usually require reporting
a rating on any security held. Such investors would likely have a preference for higher ratings
regardless of whether they believe the ratings are accurate.
5We calculate the share of IOs and POs in CMBS trading using FINRA aggregate trading volume datafor structured products for 2011-2014 as tabulated by SIFMA (2014a).
6

2.2 Competition and product quality: what are the effects and
what are the channels?
While competition is generally thought to improve product quality in most economic set-
tings, ratings are unusual because the main consumers are investors while the purchasers
are issuers. Similar settings include vehicle emissions testing and auditing of financial state-
ments.6 Because the buyers and consumers of ratings have different goals, it is not obvious
from either a theoretical or empirical standpoint that increased competition should lead to
higher rating quality.
Much of the theory on ratings in particular (e.g., Bolton, Freixas, and Shapiro 2012,
Camanho, Deb, and Liu 2012, and Frenkel 2015) suggests that, under the issuer-pays fee
scheme, the effect of competition depends on the reputation of the incumbents.7 In par-
ticular, Camanho, Deb, and Liu (2012) show that more competition can actually lead to
more accurate ratings when the reputations of both the incumbent and the entrant are low.
Intuitively, this occurs because the possibility of gaining market leadership when reputations
are similar is higher than if one CRA has a much better reputation than the other. Since
market leadership is “up for grabs,” both CRAs have an incentive to rate accurately and
make incremental gains in reputation and therefore market share. Conversely, if reputations
are far apart, a “market-sharing” effect dominates, whereby the CRA with lower reputation
will inflate ratings in order to gain additional market share. Similarly, Frenkel (2015) finds
that the degree to which competition can improve rating quality depends on how low the
reputation of the entrant is relative to the incumbent. Finally, Manso (2013) explores the
implications of competition in the presence of feedback effects from ratings to a firm’s cost
of capital. He finds that increased competition can result in downward pressure on ratings,
which leads to a higher probability of default, and lower welfare.8
6See Bennett, Pierce, Snyder, and Toffel (2013) on auto emissions testing, and Lennox (2000), Chan,Lin, and Mo (2006), Lu (2006) and the review in DeFond and Zhang (2014) for audits.
7An issuer-paid CRA generates income from fees it collects from security issuers. In contrast, investor-paid CRAs generate income by charging individual and institutional investors for access to their ratings.
8In our setting, a “firm” is in fact a special purpose self-liquidating entity such that the survival of the
7
The empirical results of Griffin, Nickerson, and Tang (2013), Strobl and Xia (2012),
and Jiang, Stanford and Xie (2012) support the existence of catering. Although they do not
examine the effect of entry, Griffin, Nickerson, and Tang (2013) find that competition among
CRAs leads to ratings inflation in the collateralized debt obligation (CDO) market. Strobl
and Xia (2012) use the investor-paid CRA Egan-Jones to document that S&P’s corporate
ratings are more inflated in situations in which they face a greater conflict of interest as a
result of their issuer-pays business model. Jiang, Stanford, and Xie (2012) find that S&P’s
transition from an investor-pay to an issuer-pay model resulted in higher ratings.
Give the unclear theoretical predictions, the effect of competition on ratings is an empir-
ical question, but the empirical results to date are mixed. Becker and Milbourn (2011) and
Cohen and Manuszak (2013) use data from prior to the financial crisis and find that increases
in Fitch’s market share are associated with more generous credit ratings. In contrast, Behr,
Kisgen, and Taillard (2014) find that rating quality decreased after the SEC introduced a
NRSRO certification process in 1975 that resulted in less room for competition. Bae, Kang,
and Wang (2015) find that Fitch’s entry did not affect the level of credit ratings. Doherty,
Kartasheva, and Phillips (2012) find that when S&P entered the insurance rating market it
actually applied stricter rating standards than the incumbent A.M. Best.9 Xia (2014) shows
that the entry of an investor-pays CRA improves the quality of ratings.
Even if competition does result in less stringent ratings, the mechanism behind this ef-
fect is still unclear. Much of the theoretical work (e.g., Skreta and Veldkamp 2009, Bolton,
Freixas, and Shapiro 2012, and Sangiorgi and Spatt forthcoming) has focused on explicit
rating “shopping,” whereby issuers solicit ratings from multiple CRAs in search of the best
ones. The presence of shopping does not necessarily indicate that CRAs are inflating ratings,
firm is less responsive to changes in credit ratings.9Doherty, Kartasheva, and Phillips (2012) argue that this is likely due to the different incentives insurance
companies have to seek additional ratings. A non-insurance corporate issuer usually seeks additional ratingsin order to make its bonds appealing to investors with “regulatory constraints” (e.g., investors who can onlyhold bonds with ratings from two or more CRAs). An insurance company, in contrast, will seek an additionalrating only if it allows it to charge a higher price to buyers of its policies such that seeking a more stringentrating is optimal.
8

though: they could be issuing ratings that are perfectly accurate given their private infor-
mation, but cross-sectional differences in this private information could lead to differences in
disclosed ratings. In contrast to shopping, rating catering is an action on the part of CRAs
and occurs when they issue ratings that are higher than their private information dictates
for the purpose of garnering more business. Unlike shopping, catering always implies some
degree of rating inflation, and it is therefore a channel that is distinct from shopping.
2.3 Our Setting
The works closest in spirit to our paper, Becker and Milbourn (2011), Cohen and Manuszak
(2013), and Bae, Kang, and Wang (2015), are set in time periods in which the incumbents’
reputation in the particular asset class in question (corporate bonds in the case of Becker
and Milbourn and Bae et al, and structured finance in the case of Cohen and Manuszak)
was solid. Additionally, the benefit to inflating ratings was high due to the size of these
markets during their time periods. In contrast, our setting is one in which competition has
the best chance of leading to more stringent ratings for two reasons. First, our data come
from a time period and asset class in which the incumbent rating agencies had very poor
reputations. The massive downgrades of billions of dollars of RMBS and ABS CDOs and
the failure of large financial institutions led to public backlash from lawmakers and lawsuits
from investors. As our sample period begins in 2009, we have an environment in which
competition is most likely to lead to more rigorous ratings as predicted in the model of
Camanho, Deb, and Liu (2012).
Second, our setting is one in which the benefit from inflating was small. Theoretical work
(e.g., Bar-Isaac and Shapiro 2013, Bolton, Freixas, and Shapiro 2012) shows that CRAs are
least likely to inflate ratings when fee income from doing so is low. As the CMBS market
has been relatively small post financial crisis, the benefits of issuing higher ratings to gain
business are low relative to the benefits of exploiting a better reputation in the future. Along
this dimension as well, therefore, our setup is one in which competition has the best chance
9

of leading to more stringent ratings.
We also analyze how the entrants compete and show clearly that they do so by being
more generous, which suggests catering. Given that there are far fewer issuers of structured
finance products than corporate bonds, catering is likely to be a more important issue for
this asset class. The magnitude of our point estimates regarding the effect of competition
on incumbent ratings suggests that, indeed, competition may have even more deleterious
effects in structured finance, and perhaps other similar asset classes, than in corporates.
Finally, our setting is one in which shopping can and, as we show, does occur on a significant
scale. Although the CMBS market itself is small relative to the corporate market, the set of
all mortgage- and non-mortgage-related asset-backed securities (i.e., “structured finance”)
is larger by total issuance and by amount outstanding than the corporate market (SIFMA
2014b).
2.3.1 Hypotheses
Motivated by the theoretical literature and the unique aspects of our setting, we test the
following hypotheses:
Hypothesis 1 Entrant CRAs issue higher ratings than incumbents for the same security.
After testing for differences in ratings between entrants and incumbents, we attempt
to identify entrant catering by considering the following alternative hypotheses for these
differences:
Hypothesis 1a We observe higher entrant ratings because they rate securities that incum-
bents have have rated unexpectedly low.
Hypothesis 1b We observe higher entrant ratings because their rating models are less pre-
cise than those of incumbents.
10

Hypothesis 1c We observe higher entrant ratings because incumbents are excessively con-
servative as measured by average spreads on CMBS relative to similarly-rated securities in
other asset classes.
We then turn to the question of how entrant CRAs affect incumbent ratings. We first
test whether the entrants affect incumbent ratings generally
Hypothesis 2 The presence of the entrant CRAs affects incumbent ratings.
We then attempt to identify the channel through which entry affects incumbent ratings
Hypothesis 2a Entry affects incumbent ratings because it widens the scope for shopping.
Hypothesis 2b Entry affects incumbent ratings because incumbents increase catering to
issuers in response to entry.
3 Data and Variable Definitions
3.1 Data Collection and Sample Restrictions
We collect data from Bloomberg terminals on entrant and incumbent ratings, collateral
characteristics, tranche structure, and coupons of CMBS issued from January 2009 through
June 2014. We begin our sample in 2009 as the disruption in securitization markets resulted
in very little issuance in 2008. Additionally, securities issued after the financial crisis are
quite different from those issued before. We include all CMBS except ReREMIC deals,
CDOs, or agency multi-family deals. Our incumbent CRAs are Moody’s, S&P, Fitch, and
Dominion Bond Rating Service (DBRS), and our entrants are Morningstar Credit Ratings
LLC (“Entrant 1”) and Kroll Bond Ratings (“Entrant 2”). All six CRAs are Nationally
Recognized Statistical Rating Organizations (NRSROs).10
10See, for example, Beaver, Shakespeare, and Soliman (2006), Bongaerts, Cremers, and Goetzmann(2012), Cole and Cooley (2014), and Bruno, Cornaggia, and Cornaggia (forthcoming) regarding the im-portance of NRSRO certification for CRAs.
11

Entrant 1 was formed via the acquisition of a small investor-paid NRSRO by a large
investment advisory services firm that subsequently converted the entity to an issuer-pays
model. The conversion occurred after its acquisition in March 2010 (SEC 2012) and, because
we are interested in studying issuer-paid ratings, we drop the small number of ratings (17
securities in total) by this entrant prior to its conversion. Entrant 1 also receives revenue
from data services it provides to CMBS investors. Entrant 1 has plans to expand into the
RMBS market and rated its first RMBS deal in late 2013 (Morningstar Credit Ratings,
LLC 2013a). Entrant 1 provides corporate credit ratings as well but is not an NRSRO for
corporate ratings.
Entrant 2’s debut in the CMBS market was January 19th, 2011 (Kroll Bond Ratings
2011a). It adopted the tagline “[o]ur name is on the line” to underscore its “emphasis on
ratings trust and accuracy” (Kroll Bond Ratings 2011a). Entrant 2 rated its first deal, a
single borrower transaction, in July 2011 (Kroll Bond Ratings 2011b). It initially focused
only on the large loan / single asset segment of the market, releasing its methodology for
rating such deals on August 9th, 2011 (Kroll Bond Ratings 2011c). In 2012, it moved into the
conduit/fusion market and issued methodology for rating such transactions on February 23,
2012 (Kroll Bond Ratings 2012). By mid-2013 entrant 2 had the third highest market share
in CMBS ratings, and although initially active only in CMBS, it now also rates RMBS, credit
card receivables securitizations, and auto loan securitizations. It has also recently started
rating public finance bonds. However, its market share in these asset classes remains small.
3.2 Shopping
With the institutional detail described in Section 2.1 in mind, we define two measures of
deal-level shopping. Both take advantage of the interdependence of securities in a deal and
are based on missing ratings, as industry analysts have indicated that the presence of missing
ratings in a deal indicates shopping (see, for example, Commercial Mortgage Alert 2014).
Table 1 provides an illustration of how we define the two measures. To define the first
12

measure, dealshop1, we look for deals in which different tranches are missing ratings from
different CRAs. For example, suppose we observe a deal with tranches A1, A2, and A3 (in
order of seniority). Suppose S&P rates A2 and A3, Moody’s rates A1 and A2, and entrant 2
rates all three tranches. Thus, two different tranches (A1 and A3) are missing ratings from
different CRAs (S&P and Moody’s). This implies the issuer had a desire for at least two
ratings each on tranches A1 and A3, but that it chose to use different CRAs to rate them.
In other words, the issuer shopped for ratings on A1 and A3. In this case, we code every
security in the deal as dealshop1 = 1 with S&P and Moody’s being the CRAs that were
shopped. Our CRA-specific measures of shopping scale by the number of deals the CRA
rates. That is, we define dealshop2 Y as the number of deals on which CRA Y gets shopped
divided by the total number of deals in which CRA Y rates at least one security.
Our second measure, dealshop2, is less stringent than dealshop1 and takes a value of 1
for all securities in a deal for which a tranche in the deal is missing a rating from a CRA but
a tranche below it in the capital structure has a rating from the same CRA. For example, if
we observe that the A2 tranche does not have a rating from S&P but that the A3 tranche
was rated by S&P, we would label every security in that deal as dealshop2 = 1. Such a rating
pattern implies that S&P did analysis sufficient to assess the risk of loss, and thus rate, the
A2 tranche, as it is not possible to rate the A3 tranche without first assessing the risk of
eating through the capital above it. As such, we know there was a potential rating for the
A2 tranche that was not purchased. To code dealshop2, we identify seniority based on the
average rating on the tranche and then by its alphanumeric name, since for the majority of
non-IOs, the priority of the tranche in the capital structure is indicated by its name (e.g., the
A2 tranche is below the A1 tranche and the A3 tranche is below the B tranche). We sort first
on average rating since the IO tranches are almost always labeled beginning with an ‘X’ but
usually have high ratings. We do not label the deal as having been shopped if the missing
rating is for an unrated tranche, or if the more senior tranche for which a rating is missing
has less subordination than the less senior tranche. There are two advantages of dealshop1
13
over dealshop2. First, it prevents us from coding a deal as having been shopped simply
because we observe fewer ratings for some tranches, and second, it requires no assumptions
about the waterfall.
In addition to dealshop1 and dealshop2, we include the number of ratings, nratings,
in some of our regressions. We include this variable because more observed ratings may
indicate that an issuer went to more CRAs to inquire about rating the issue. For example,
observing four ratings means the security was shopped to at least four CRAs, and possibly
more, and that those four ratings were sufficiently high to induce the issuer to purchase
them. An alternative view of shopping at the security level is offered in He, Qian, and
Strahan (2016), who find that non-AAA RMBS securities with single ratings perform worse
than those with multiple ratings. This is taken as evidence that single-rated tranches have
been shopped more and thus many potentially low ratings, which would have indicated the
observed poor performance, were never purchased. Hence, these results would suggest a
measure of shopping should be decreasing in the number of ratings.
3.3 Summary Statistics
Table 2 summarizes the securities in our sample. Our sample contains 2,488 securities from
287 separate deals, and only rated securities are included. The variable nratings is the total
number of ratings for that security. The average security is rated by at least 2 CRAs and
some are rated by 4. Moody’s and Fitch each rate more than half the securities, S&P rates
a third, and DBRS rates just over a quarter. Entrant 1 rates only 379 securities, whereas
Entrant 2 rates 1,006, more than S&P. In total, more than half of the securities issued are
rated by at least one entrant.
The entrants generate ratings on an alphabetical scale comparable to the incumbents.11
Hence, the ratings of all six CRAs in the sample can be mapped one-to-one to the same
11The entrants and incumbents use similar definitions to describe what various ratings for a structuredfinance security represent. The appendix contains the exact definitions for AAA securities; the definitionsfor lower ratings are analogous.
14

numerical scale. We map the alphabetic ratings to a 16 notch numerical scale as follows:
AAA = 16, AA+ = 15, AA = 14, AA− = 13, A+ = 12, A = 11, A− = 10, BBB+ = 9,
BBB = 8, BBB− = 7, BB+ = 6, BB = 5, BB− = 4, B+ = 3, B = 2, B− = 1. We
drop all ratings below B−. Half of the securities are rated AAA by at least one CRA, and
46.9% are rated AAA by at least one incumbent, with the remaining 3.5% being rated AAA
by only an entrant. The average rating assigned by incumbents is about one grade lower
than the average rating assigned by the entrants. We discuss in the next section whether
the differences in ratings across CRAs are because of differences in the securities they rate.
The size of the issue is the tranche size (tranchesize). We treat the small number of
issues for which tranchesize is 0 or equal to the size of the deal (usually IO tranches) as
missing for this variable. Subordination is the main measure of credit enhancement for
non-IO structured finance products. It is the percentage of the value of all the securities
in the deal that are below it in the priority of payments and the allocation of losses on the
principal of the collateral to the principal of the tranches. Thus, AAA securities usually
have the most subordination and B− tranches usually have the least. Because IO securities
have no principal balance, they have no subordination.
The main measure of expected maturity in the CMBS market is the weighted average
life (WAL) which Bloomberg provides in years. The WAL is calculated by projecting the
principal repayment schedule and then calculating the number of years from issuance in
which the average dollar of principal is paid off. It is similar to Macaulay’s duration but
includes only anticipated principal payments rather than scheduled principal and interest
payments. Because IO securities do not have a principal balance, they have no WAL. The
WAL is calculated under particular assumptions about prepayment and default, and issuers
usually provide a WAL in the prospectus supplement (Bloomberg populates its WAL field
using these supplements). We use this measure to create categories of WAL: less than 3
years, 3 to 5 years, 5 to 7 years, and 7 years or more.
The securities in our sample vary in the form of the coupons they pay and in their expected
15
maturity, and include (1) floating rate (“floaters”), which pay a constant fixed spread to one
month LIBOR, (2) fixed rate, and (3) variable rate securities other than floaters.
Our data contains the shares of each property type backed by the loans in the pool for
the top 3 most common property types in that pool. From the top 3 property type shares,
we construct the shares of retail, office, hospitality, and industrial property. To account for
geographic heterogeneity, we construct variables measuring the share of loans in each pool
that were originated in five MSAs: New York-Newark-Jersey City (nyshare), Los Angeles-
Long Beach-Anaheim (lashare), Houston-Woodlands-Sugar Land (houshare), Miami-Fort
Lauderdale-West Palm Beach (mishare), and Chicago-Naperville-Elgin (chishare). These
five cities are the largest by deal count.
We have three additional variables that describe the collateral, all of which are measured
at origination of the loans: (1) the weighted average loan-to-value (waltv), the weighted
average debt-service coverage ratio (wadscr), which is the ratio of the net rents (usually
called net operating income (NOI)) the property is expected to earn divided by the required
mortgage payment, and (3) the weighted average maturity (wam) of the loans backing the
security.
The mean issuance date of a security is June 2012. The CMBS market recovered slowly
from the financial crisis. Thus, issuance of CMBS increases gradually over the sample, with
28 securities issued in 2009, 112 in 2010, 343 in 2011, 550 in 2012, 1006 in 2013, and 449 in
the first half of 2014.
To account for heterogeneity in CMBS issuers in some of our empirical analysis, we
include the total amount of issuance for the issuer/sponsor (sponsortot) in the year the
security is issued. We do so following the finding of He, Qian, and Strahan (2012) for the
RMBS market that larger issuers often get more favorable ratings.
CMBS deals differ in their structure and the market is segmented according to the type,
which is important because the CRAs have different methodologies for rating different types.
Our first type is conduit/fusion, which comprise about two thirds of our sample. The second
16

category is large loan or single loans, which are deals backed by only a few or one large loan.
We combine the Bloomberg categories Single-Asset and Large Loans into typlarge since we
have relatively few large loan deals that are not only one loan and CRAs usually use the
same methodology for rating Single-Asset and Large Loan deals. Our typlarge category
constitutes 27% of our sample. We group the remaining deals (portfolio, European, and
Small Balance) into an “other” category that contains 5% of the securities in our sample.
Table 3 tabulates the frequency of dealshop1 and dealshop2 across various time periods
and deal types. By our more stringent measure of shopping, dealshop1, 6% of deals in our
sample are shopped, whereas nearly a quarter are shopped according to dealshop2. Shopping
is higher post entry by both measures (column (3) vs column (2)) and, consistent with the
prediction of Skreta and Veldkamp (2009), it is more common in more complex (and harder to
rate) conduit/fusion deals than in large loan deals (column (4) vs. column (5)). Incumbents
are about as likely as entrants to get shopped. It is thus not the case that issuers always
purchase incumbent ratings and then shop for entrant ratings.
4 The Entrants’ Ratings
Reflecting the belief that competition improves the quality of credit ratings, the SEC per-
mitted both entrants to remain NRSROs, despite them deriving a large share of their CMBS
rating revenue from a handful of issuers, because it was consistent with the SEC’s goal of
enhancing competition (SEC 2011, 2012, 2013). Figure 1 documents the evolution of the
entrants’ market share of the CMBS deal types. Entrant 1 does not exhibit much forward
momentum, rating no securities in 2010 and around 20% in 2011 and 2013. Entrant 2 enters
the market halfway through 2011 such that it rates just 10% of securities issued that year but
39% of large loan deals, consistent with its initial focus on that market segment. Through
the first half of 2014, it rates 56% of CMBS, giving it the third largest market share in that
six month period ahead of S&P.
17

Part of this is due to S&P losing market share as a result of a mishap on a July 2011 deal
(it pulled ratings after pricing but before settlement) which led it to not rate any conduit
deals for several months. S&P asserts its temporary exit from the conduit market was
voluntary (Reuters, 2011), but some commentators in the financial press assert that it was
effectively shut out (see, for example, Tempkin 2012a). Both entrants had plans to enter
the CMBS market well in advance of this incident, though, so the entry is not endogenous
to S&P’s problems. In fact, entrant 2 initially entered only the large loan segment of the
CMBS market; it could not have known it would have a unique opportunity in the conduit
market due to S&P’s problems.
4.1 Differences Between Entrant and Incumbent Ratings
We now turn to testing Hypothesis 1, that entrants rate higher than incumbents. Table 4
compares entrant and incumbent ratings for the set of securities rated by both, which allows
us to hold security characteristics constant. The results of the paired t-tests indicate that
both entrants issue systematically more generous ratings that the main incumbents on the
same securities.
The differences between both entrants’ ratings and those of S&P, Moody’s, and Fitch are
all positive and statistically significant at the 1% level, indicating that the entrants rate more
generously. On average, entrant 1 rates one grade higher than the three main incumbents,
but there is no significant difference between entrant 1’s ratings and those of DBRS. Entrant
1 rates IO securities 3.1 grades higher than the average of the four incumbents, but rates
non-IOs only 0.4 grades higher, although the difference is still highly statistically significant.
Entrant 2 is somewhat less generous than entrant 1, although on average it still rates
a security 0.4 grades higher than incumbents. The differences between entrant 2’s ratings
and those of Fitch, Moody’s, and S&P are positive and significant at the 1% level. DBRS
rates slightly higher, on average, than entrant 2. Like entrant 1, entrant 2’s higher ratings
are much more pronounced for IO tranches: it rates those an average of 2.6 grades higher,
18

but rates non-IOs only 0.04 grades higher. Entrant 2’s higher ratings in non-IO tranches
are also concentrated in the early part of the sample (2011-2012) when it is struggling to
gain market share. In contrast, there is no statistical difference between entrant 2 and the
average incumbent rating on non-IOs in the second half of the sample (2013-2014).
S&P is the most “conservative” incumbent relative to the entrants, which may be because
it faced greater regulatory pressure. Regulators’ concerns centered on a period in early 2011
during which S&P is alleged to have deviated from its own published standards in its conduit
ratings without disclosing the deviations from those standards to investors. The regulatory
pressure culminated in S&P agreeing to stop rating conduit deals for a period of one year
beginning in January 2015 (Scully 2015). While we do not know for certain, as the matter
was settled out of court, it seems possible that these regulatory concerns were related to the
aforementioned July 2011 ratings mishap that led to S&P not rating any conduit transactions
for several months thereafter.
The entrants’ ratings of non-IOs are usually within four notches of the incumbents’ aver-
age rating, a phenomenon illustrated in Figure 2 which plots the average incumbent rating
against the rating of the entrant for each non-IO security rated by both. If entrant and
incumbent ratings were the same, the dots would line up along the 45 degree line. Alter-
natively, if the differences between entrants and incumbents were simply a result of random
differences of opinion, we would observe the dots in Figure 2 randomly scattered around the
45 degree line. Consistent with the statistics in Table 4, however, the entrants’ ratings are
usually above the 45 degree line. The difference in ratings is even more pronounced in the
IO tranches—the entrants rate IOs AAA almost uniformly, and their average rating is nearly
three notches higher than the average incumbent rating.
The uniformity in IO ratings by the entrants may suggest they expend less resources in
creating detailed models to assess risk, instead preferring to have a blanket policy that does
not consider the variation in IO structures in the CMBS market. They may do this because,
as discussed in Section 2.1, IO investors use ratings less for their information content than for
19

their certification benefit. By issuing nearly uniform AAA ratings to IOs, the entrants can
simultaneously save on information production costs and meet or exceed the ratings-based
certification threshold. Although this results in less informative ratings, the consequences
(in terms of future loss of business from IO investors) are mitigated because IO investors
are less sensitive to informative ratings as they are to ratings that meet their investment
guidelines.
Selection, Incumbent Conservatism, or Catering?
We have shown that the difference between the entrants’ and incumbents’ ratings persists
after controlling for security characteristics. While this suggests catering, it is possible
that such differences arise due to selection effects or because the incumbents are excessively
conservative. To determine whether this is the case, we look at three alternative hypotheses.
First, we consider whether the differences arise because issuers purchase entrant ratings
only after observing a low rating from one or more incumbents (Hypothesis 1a). Second, we
examine whether the incumbents models are more precise than the entrants’ in the sense of a
larger fraction of the variance in ratings being explained by observable security characteristics
(Hypothesis 1b). Third, we look at whether investors view incumbents’ ratings as excessively
conservative (Hypothesis 1c).
Selection due to low ratings from incumbents If the differences arise because issuers
choose to buy entrant ratings only after observing an unexpectedly low rating from one or
more incumbents, a gap would exist even if the entrants do not issue systematically higher
ratings. In other words, the difference would not be due to catering on the part of entrants.
To test this, we estimate a model of predicted incumbent ratings and test whether an
entrant is more likely to rate an issue if the incumbent rates low. That is, we first estimate
avgratingincumbenti,j,t = α0 + α′xControlsi,j,t + εi,j,t (1)
20

where i indexes the security, j indicates the deal type, and t indicates the year of issuance.
The controls include dummies for the year of issue, deal type dummies, collateral character-
istics, dummies for the coupon type (fixed rate, floating rate, or variable rate), and the ex
ante WAL of the security in categories.
We then generate predicted ratings for each security (predictavgratingincumbenti,j,t) the
incumbent rates and compute the “error” in average incumbent ratings:
avgincumerrori,j,t = avgratingincumbenti,j,t − predictavgratingincumbenti,j,t (2)
Additionally, we compute the binary variable
incumlowi,j,t =
1 if avgratingincumbenti,j,t < predictavgratingincumbenti,j,t
0 else.
(3)
Finally, we estimate whether a low incumbent rating increases the probability of an
entrant rating via
ratedentranti,j,t = α0 +α1avgincumerrori,j,t +Y rofIssueFEs+DealTypeFEs+ εi,j,t (4)
and
ratedentranti,j,t = α0 + α1incumlowi,j,t + Y rofIssueFEs+DealTypeFEs+ εi,j,t (5)
by probit. In equations (4) and (5), Y rofIssueFEs and DealTypeFEs denote fixed effects
for the year of issue and security type, respectively. The dependent variable, ratedentrant,
takes a value of 1 if an entrant rates the security and 0 otherwise. We estimate equations
(4) and (5) at the security level rather than the deal level as CRAs sometimes rate only a
subset of securities in a deal rather than the entire deal.
The α1 coefficients are statistically insignificant in all but one specification and change
21

sign depending on the specification. The results are available in an appendix. We thus reject
Hypothesis 1a.
Selection due to noisier entrant ratings Another reason we might observe systemati-
cally higher entrant ratings even if they do not rate systematically higher on purpose is if the
entrants have noisier rating models. By noisier, we do not mean less accurate in the sense
of being worse predictors of ex post default; as we discuss below, the nature of performance
in structured finance makes it difficult to assess accuracy from an ex post perspective until
many years after issuance. Rather, noise refers to lower precision in the sense of observables
explaining less of the variation in ratings. If entrant ratings are higher variance, issuers may
choose, in a tie breaker situation, to purchase an entrant rating only if it is greater than
or equal to the incumbent rating. While this channel is not entirely distinct from catering,
since it too implies that the entrants garner business by rating higher than the incumbents,
it implies a less deliberate strategy on the part of the entrants than having a methodology
geared toward systematically higher ratings.
To explore this possibility, we estimate separate rating models for each of the three main
incumbents and the two entrants using our control variables and data from 2011 onward.
The R2s are similar across CRAs indicating that the entrants’ ratings are similar in precision
to those of the incumbents. We thus reject Hypothesis 1b. The results from these regressions
are available in an appendix.
Are incumbent ratings excessively conservative? A final explanation for higher ob-
served entrant ratings is that the incumbents are simply being too conservative, which may
be plausible given their experience in the financial crisis. The ideal measure of incumbent
conservatism is to use the cross-sectional performance of CMBS securities and/or collateral
to assess relative rating accuracy. However, as summary statistics (available in an appendix)
indicate, the CMBS in our sample have thus far performed too well (i.e., the collateral and
securities have suffered very few delinquencies or principal/interest shortfalls) to assess con-
22
servatism in this way. The primary reason for this is because, unlike in other asset classes
(e.g., corporate bonds, municipal bonds), performance takes a considerable amount of time
to observe in structured finance. Partly, the securities usually have stated maturity dates
much longer (typically 30 to 40 years from issuance) than when most investors expect to
stop receiving cash flows. Thus, a technical default in the sense of a writedown of principal
for securities that have a principal balance, need not happen until that maturity date. Fur-
thermore, some have argued (see Coval, Jurek, and Stafford 2009) that structured finance
securities necessarily involve defaults more clustered in time than those on other kinds of
bonds. The pricing of the Markit CMBX Series 6 and Series 7 indices, which are based
on the performance of securities issued in 2012 and 2013, has also remained close to 100,
indicating little expectation of imminent default. Additionally, there have been few rating
changes by incumbent CRAs. Despite good performance thus far, it is difficult to conclude
that the securities are being rated too conservatively, especially given that subprime and
Alt-A RMBS deals issued during the subprime boom also performed well until mid-2006.
A further limitation in the structured finance market is that a time series of yields on in-
dividual securities is unavailable for two reasons. First, reporting requirements for structured
products are much less standardized than for corporate bonds – there is nothing equivalent
to TRACE for these asset classes with the exception of TBA agency securities since May
2011. As such, the vast majority of CMBS do not have current yield or spread informa-
tion available in Bloomberg. Bloomberg reports modeled prices for most securities on many
dates subsequent to issuance but does not have transaction prices.12 The second challenge
for getting a time series of yields is more fundamental: the majority of these products never
trade after issuance. Bessembinder, Maxwell, and Venkataraman (2013) report that only
about 20% of structured products traded at all in the 21 month period from May 2011 to
January 2013. While about half of corporate bonds also trade infrequently (see, for example,
12As of May 2011, the Financial Industry Regulatory Authority (FINRA) requires reporting of all MBStransactions. FINRA released the data from 2011 onward early to three groups of researchers; see Atanasovand Merrick (2013), Bessembinder, Maxwell, and Venkataraman (2013), and Hollifield, Neklyudov, and Spatt(2013).
23

Edwards, Harris, and Piwowar 2007), there are far more corporate bonds than CMBS.
Absent variation in security performance or time series data on yields, we can assess
whether the non-IO securities that the incumbents rate below AAA are conservatively rated
by comparing the yields at issuance of CMBS with those of corporate bonds. We use the
initial coupon as a measure of the yield for CMBS.13
Spreads on CMBS that the incumbents rate below AAA are almost always higher than
spreads on like-rated corporate bonds.14 While some of the higher spread on CMBS is likely
an illiquidity premium, it is unlikely that this premium is enough to explain the more than
100 basis point average difference. Thus, the market seems to perceive these securities as
riskier than corporate bonds of a given rating. Furthermore, spreads on BBB-rated corporate
bonds (those closest to the investment grade-high yield cutoff) are almost uniformly lower
than spreads on AA-rated CMBS (far away from the cutoff). We are thus able to reject
Hypothesis 1c for the securities that account for most of the sample.
The observed difference in IO ratings is also unlikely to be driven by incumbent conser-
vatism. As Beaman and Pendergast (2013) discuss, even the IOs attached to AAA securities
may be much riskier than a AAA rating would indicate. The same is true of IOs attached
to non-AAA non-IOs or IOs not attached to a particular non-IO tranche. In fact, as Bea-
man and Pendergast (2013) illustrate, IOs receiving most of their cash flows from mezzanine
investment-grade (above BB+ but below AAA) tranches have more stable cash flows than
IOs promised their cash flows from the non-IO AAA portion of the capital structure. The
reason is that, while CMBS have far more prepayment protection than RMBS, any prepay-
ments not completely covered by defeasance clauses for the entire loan term accrue to the
most senior tranches first, thus reducing the interest available to pay IOs. The incumbent
13An, Deng, and Gabriel (2011) and He, Qian, and Strahan (2012) make similar assumptions in theiruse of coupons as initial yields for structured finance. Although some junior securities may price below paraccording to industry participants, the bias this creates for us is to understate the yields earned on morejunior securities.
14This is consistent with Merrill, Nadauld, and Strahan (2014), who find that yields on highly-ratedstructured finance securities held by insurance companies were higher than yields on like-rated corporatebonds.
24

CRAs formerly had a practice of rating IOs AAA when the IOs received priority in the wa-
terfall commensurate to a linked non-IO AAA’s payments (Beaman and Pendergast, 2013).
However, the incumbents abandoned this practice in 2010 so that their ratings better reflect
the true risks of investing in IOs (Beaman and Pendergast, 2013).
4.2 Are Entrant Ratings Substitutes for Incumbent Ratings?
The entrants’ ratings do not appear to be perfect substitutes for the incumbents’ ratings,
as an issuer’s choice to get an entrant rating appears to be closely related to opting for
an additional rating. For the 2011-2014:Q2 time period, the mean number of ratings for
securities that get rated by an entrant is 2.8, while it is 2.0 for securities that do not get
rated by an entrant. The difference in the number of ratings that securities rated by an
entrant have persists in a multivariate context. In a regression of the number of ratings on
our full set of controls and ratedentrant, the coefficient on ratedentrant is 0.7 in the non-IO
sample and 0.8 in the IO sample. It is statistically significant at the 1% level in both the
non-IO and IO samples. In the interest of brevity, the results are available upon request.
5 The Effect of Entry on Incumbent Ratings
While the entrants give more generous ratings to gain business, it is unclear whether the
incumbent CRAs would necessarily respond to competitive pressure, or how much more
issuers are able to shop when there are more CRAs. First, the incumbents may value their
reputations enough that they ignore the competitive pressure, especially because, for the
time being, the entrants compete only in structured finance products. Second, it does not
appear that entrant ratings are treated as perfect substitutes by issuers. Finally, it is unclear
whether the market actually believes higher entrant ratings are accurate. As discussed in
the appendix, there is weak evidence that investors require higher initial yields for securities
rated AAA by an entrant vs securities with AAA ratings from only incumbents.
25

However, theoretical work suggests that competition can exacerbate rating catering. Ad-
ditionally, this literature shows that incumbent ratings will certainly increase in response to
competition via the shopping channel. Thus, to test Hypothesis 2, whether entry into the
CRA market affects incumbents’ ratings, we construct variables to separately identify both
potential channels (Hypotheses 2a and 2b).
5.1 Regression Design
Our identification of the effect of competition on incumbent ratings exploits differences in
the market share of the entrants over time and within subsegments of the CMBS market
(large loan, conduit/fusion, or other). There is substantial variation in which types of CMBS
the entrants are active in. Hence, for each year and CMBS type, we construct the entrants’
market shares as the percent of securities they rate. We then include year and CMBS type
fixed effects to control for variation in ratings over the business cycle and the fact that some
CMBS types may be riskier than others. We also include a quadratic trend for the number
of months since the start of the sample to control for trends in rating standards unrelated
to the entrants.
We estimate
avgratingincumbenti,j,t = α0 + α1entrant1sharej,t + α2entrant2sharej,t
+α′xControlsi,j,t + εi,j,t (6)
where the controls include dummies for the year of issue and deal type, collateral character-
istics, dummies for the coupon type (fixed rate, floating rate, or variable rate), a quadratic in
the months since the start of the sample, and the ex ante WAL of the security in categories.
The independent variables of interest are entrant1sharej,t and entrant2sharej,t, which
are the percentage of securities of type j issued in year t that are rated by entrants 1 and 2,
respectively. Competition results in more generous ratings by the incumbents if α1 > 0 or
26
α2 > 0.
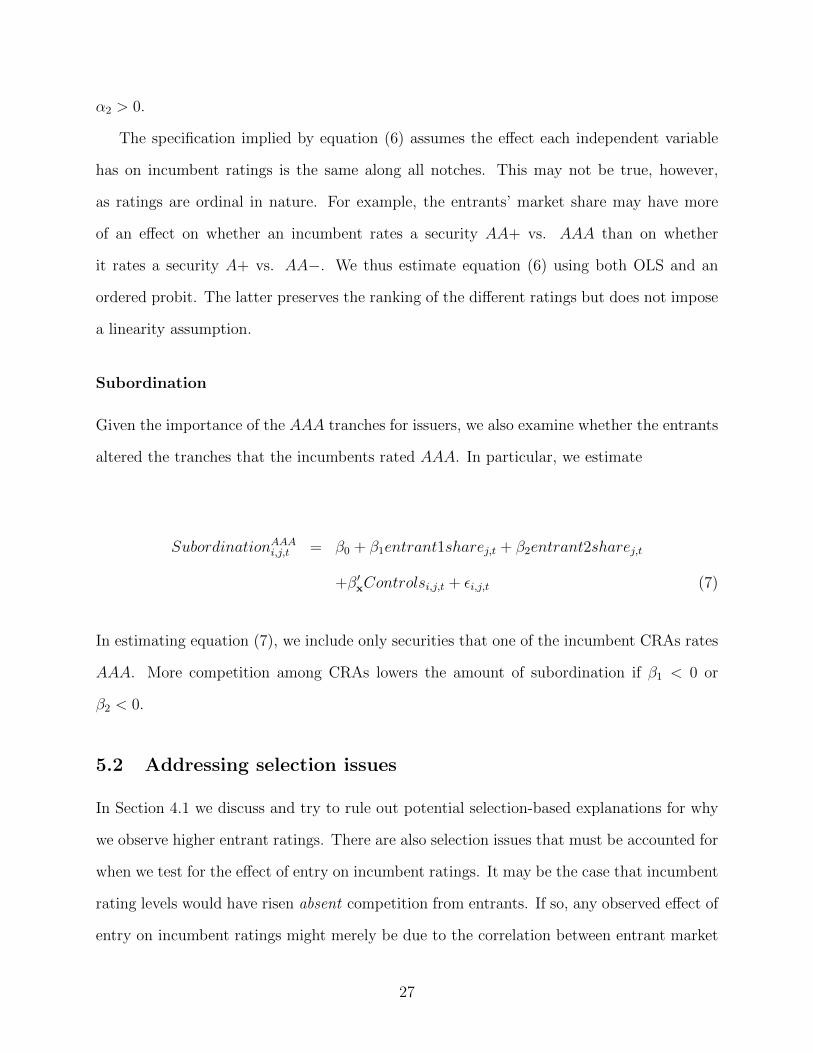
The specification implied by equation (6) assumes the effect each independent variable
has on incumbent ratings is the same along all notches. This may not be true, however,
as ratings are ordinal in nature. For example, the entrants’ market share may have more
of an effect on whether an incumbent rates a security AA+ vs. AAA than on whether
it rates a security A+ vs. AA−. We thus estimate equation (6) using both OLS and an
ordered probit. The latter preserves the ranking of the different ratings but does not impose
a linearity assumption.
Subordination
Given the importance of the AAA tranches for issuers, we also examine whether the entrants
altered the tranches that the incumbents rated AAA. In particular, we estimate
SubordinationAAAi,j,t = β0 + β1entrant1sharej,t + β2entrant2sharej,t
+β′xControlsi,j,t + εi,j,t (7)
In estimating equation (7), we include only securities that one of the incumbent CRAs rates
AAA. More competition among CRAs lowers the amount of subordination if β1 < 0 or
β2 < 0.
5.2 Addressing selection issues
In Section 4.1 we discuss and try to rule out potential selection-based explanations for why
we observe higher entrant ratings. There are also selection issues that must be accounted for
when we test for the effect of entry on incumbent ratings. It may be the case that incumbent
rating levels would have risen absent competition from entrants. If so, any observed effect of
entry on incumbent ratings might merely be due to the correlation between entrant market
27

share and some unobserved driver of incumbent rating levels. This type of selection can
be due to several factors. First, entrants might be able to identify deal types for which
the market is improving or likely to improve and hence for which rating levels are likely to
improve. A second source of selection may arise if entrants are more able to increase their
market share in segments characterized by more issuer shopping (and hence higher rating
levels). We are not aware of any theoretical work suggesting a particular reason for an
exogenous increase in the desire to shop in a particular deal type and year. While the desire
to shop may increase over time, or may be higher in a particular deal type due to differences
in the complexity of the deal, our regressions control for both the deal type and the year.
We find it much less likely that shopping demand should vary at the deal type - year level
for reasons unrelated to the degree of competition because there is no obvious mechanism
that would drive that behavior.
Despite this, we try to account for both potential sources of selection by constructing
a measure of predicted entrant market share that is correlated with observed market share
but plausibly uncorrelated with the error term in equation 6. We do so by estimating a
regression of whether an entrant rates a security based on two sources of exogenous variation
that changed the likelihood of an entrant rating.
For the first source of exogenous variation, we take advantage of a change to the De-
partment of Labor regulations concerning the Employee Retirement Income Security Act of
1974 (ERISA). For pension funds under its purview, ERISA constrains structured finance
investment choices to securities that are rated by certain rating agencies. The entrants were
added to the list of approved rating agencies, and hence their ratings became eligible to use
in ERISA certification, in July 2013 (see Kroll Bond Ratings 2013 and Morningstar Credit
Ratings, LLC 2013b). Certification eligibility should increase demand from pension funds
for entrant ratings, and thus increase the likelihood that an entrant rates a security, without
having any direct effect on how incumbents rate. We thus define a variable called posterisa
that takes a value of 1 from July 2013 onward, and 0 otherwise.
28

Additionally, we take advantage of the fact that entrant 2 initially rated only large loan
deals, a decision it made before observing incumbent ratings during its first several months
of existence. It did not release a methodology for conduit/fusion deals until February 2012
and did not rate its first conduit/fusion deal until March 2012. We thus define a variable
called entrant2out as equal to 1 for all securities in conduit/fusion deals issued from July
2011 (entrant 2’s debut) to February 2012. We expect that entrant2out will have a positive
effect on the probability that entrant 1 rates a security, since the two ratings are imperfect
substitutes, but a negative effect on the probability that entrant 2 rates a security. The fact
that entrant 2 initially chose to focus on the large loan market rather than the conduit/fusion
market should have no effect on incumbent ratings other than through how it influences the
entrants’ market shares.
We thus estimate a probit model of
ratedentranti,t = γ0+γerisaposterisa+γe2outentrant2out+DealTypeFEs+γ′xXi,t+υi,j,t (8)
where Xi,t includes month, monthsq, floater, variable, IO, geographic characteristics, and
property type shares. Note that, in estimating equation (8), we exclude characteristics
that are commonly subject to negotiation between CRAs and issuers such as the level of
subordination. Because negotiation over the level of subordination also affects the size of
the tranche and the WAL, we treat these variables as potentially subject to endogeneity bias
and exclude them from equation (8). Similarly, issuers and CRAs often negotiate over the
LTV of the loans, particularly for large loan deals, such that we exclude waltv. The LTV
of the loans in turn influences wadscr and could affect wam such that we exclude these
variables as well. Finally, we do not include year fixed effects since our goal is to simulate
deal type shares by year based solely on posterisa and entrant2out, predetermined security
characteristics, and a time trend.
After estimating equation (8) separately for each entrant, we then generate predicted val-
29

ues for the probability that an entrant rates each security in the sample, pratedentranti,t. We
then assign a value of 1 to this variable if the predicted probability is greater than or equal to
0.5, and 0 otherwise. Finally, to get predicted entrant market shares, we calculate the mean
of pratedentrant for each entrant by year and CMBS subtype. After constructing the pre-
dicted shares, pentrant1share and pentrant2share, we then estimate equations (6) and (7)
using these shares as explanatory variables rather than entrant1share and entrant2share.
5.3 Catering vs. Shopping
In our setting, the results from estimating equations (6) and (7) cannot distinguish between
whether any change in the incumbents’ ratings is due to catering or shopping. As discussed
previously, theory suggests that competition is likely to lead to more catering and hence
higher ratings, and the results of Section 4 indicate catering on the part of the entrants.
Theory also suggests competition should lead to more shopping, thus both channels may be
at work.
To understand the extent to which shopping drives the increase in incumbent ratings,
we augment equations (6) and (7) with ntranches and dealshop1 or dealshop2. If either
coefficient is positive, some of the decrease in the stringency in ratings could be due to the
greater capacity of issuers to shop for ratings, thus supporting Hypothesis 2a. On the other
hand, if the coefficient on entrant1share or entrant2share is statistically significant and
positive after controlling for the amount of deal-level shopping and the number of ratings,
the data would suggest that incumbents cater to issuers more as entrants increase their
market share (Hypothesis 2b).
30

5.4 Results
5.4.1 Average incumbent ratings
Table 5 presents the results from estimating equation (6) on the non-IO securities. In all
specifications, we cluster the standard errors by year-deal type because our main variable of
interest varies only at the year-deal type level. Columns (1) shows the effect of entrant market
shares on the average incumbent rating. The coefficient on entrant 2’s share is statistically
significant at the 1% level while the coefficient on entrant 1’s share is statistically significant
at the 10% level. Column (4) presents the results when estimating the effect using the
predicted entrant market shares rather than the actual ones; the results from the first stage
of the estimation are in an appendix available from the authors. When the effect is estimated
via the predicted entrant market shares rather than OLS, the coefficient on entrant 2’s share
continues to be statistically significant at the 5% level. The coefficient on entrant1share is
positive but is no longer statistically significant.
The economic magnitude of the effect for non-IO tranches is such that a 10 percentage
point increase in Entrant 2’s market share raises the average incumbents’ rating by roughly
0.35 grades. As Entrant 2 increased its overall market share from 0 to 56% (see Table
A.2), the effect is economically important since it implies an increase in average ratings by
incumbents of more than a grade. The magnitude of the coefficient on Entrant 1’s share is
slightly higher and implies that a 10 percentage point increase in market share results in a
0.4 grade higher average incumbent rating.
One possible reason that we observe positive coefficients on the entrant market shares
that is not due to catering is positive learning on the part of incumbents. In particular,
it is possible that changes to Moody’s and S&P’s methodologies for some CMBS securities
are the result of learning from the entrants’ methodologies. If the model changes by the
incumbents are because they see the entrant methodologies, decide they are more accurate,
and then make changes accordingly, the positive coefficients could indicate something other
31

than catering. The two relevant changes to incumbent ratings are a February 2012 change
in Moody’s IO rating methodology (Moody’s Investors Service 2012) and a September 2012
change in S&P’s Conduit/Fusion and Large Loan methodology (Tempkin 2012b). Entrant
2 released its large loan deal methodology in Aug 2011 and its conduit/fusion Feb 2012.
Entrant 1 released a general methodology in June 2012.
To test for this possibility, we estimate the effect of entrant1share and entrant2share
for each of the three main incumbents separately. Because Fitch had no changes to its
methodology post-entry and Moody’s had no substantive changes to its rating of non-IO
tranches, if positive learning is the only reason we observe higher incumbent ratings in
response to changes in the entrants’ market share, we should observe positive coefficients
only for S&P for the non-IO tranches. However, for each of the incumbents, entrant2share
is statistically significant at the 10% level. It is higher for Moody’s and Fitch than for S&P.
Entrant 1’s share is statistically significant at the 5% level for S&P and Fitch but not for
Moody’s.
In summary, the results support Hypothesis 2 that the presence of the entrants affects
incumbent ratings. The coefficients are lower for entrant 2 than for entrant 1. The finding of
a stronger incumbent response to entrant 1 is consistent with the theoretical predictions of
Frenkel (2015) to the extent that entrant 2 has a better reputation than entrant 1. Frenkel’s
analysis shows that incumbents will inflate ratings less in response to entry to the extent
that the entrant has a better reputation (see Proposition 6ii). Entrant 1 rates systematically
higher than entrant 2 on same issues (see Table 4) suggesting that entrant 1 may be the less
credible of the two ex ante.
5.4.2 Subordination for securities rated AAA by an incumbent
Table 6 contains the results from estimating equation (7). Column (1) shows that, for
tranches that at least one incumbent has rated AAA, a higher market share for Entrant 2
is associated with less subordination. A 10 percentage point increase in the market share
32

of Entrant 2 lowers subordination by 1 percentage point, and this is statistically significant
at the 1% level when we estimate the model by OLS. When we estimate the model using
predicted market shares (Column (4)), entrant2share is statistically significant at the 5%
level and the magnitude is such that a 10 percentage point increase in market share is
associated with a 0.7 percentage point decrease in subordination. Entrant 1’s share is not
statistically significant in either estimation. These results provide further support in favor
of Hypothesis 2 sample but, similarly to our results for the level of ratings, the evidence is
stronger for entrant 2 than for entrant 1.
5.4.3 Shopping
Table 5 compares our benchmark incumbent rating results with the results when we include
our deal-level shopping measure and the total number of ratings the security receives. The
coefficients on the entrant shares decrease in magnitude when moving from columns (1)
and (4) to (2) and (5) in Table 5 and the coefficients on both nratings and dealshop1 are
positive and statistically significant at the 5% level. When we use dealshop2 as the measure
of shopping (columns (3) and (6)), its coefficient is statistically insignificant, but nratings is
still positive and significant, and the coefficients on the entrant shares decrease by a similar
magnitude when moving from columns (1) and (4) to (3) and (6). The results in Table
5 indicate that some of the increase in incumbent ratings is due to shopping on the part
of issuers, but a substantial portion appears to be explained by catering on the part of
incumbents.
There is less evidence that shopping affects the subordination of the AAA tranches,
however. In Table 6, the coefficients on entrant1share and entrant2share change little when
we add the shopping measure to the model and only dealshop1 is statistically significant (at
the 10%) level. The results are similar in unreported robustness checks in which we regress
subordination for other rating buckets (e.g., AA, A, BBB) on the number of ratings. Thus,
the evidence suggests that both catering and shopping are likely responsible for the observed
33

increase in average incumbent ratings in the non-IO sample, corroborating Hypotheses 2b
and 2a.
We also estimate the effect of entrant market shares on the level of incumbent ratings in
the IO sample. The results are available in Table 7. In the IO sample, incumbent ratings
are increasing in entrant 2’s market share but not in entrant 1’s market share when we
do not include our shopping variables. When we include the shopping variables, however,
neither entrants’ market share is statistically significant but both dealshop1 and nratings
are significant at the 5% level. Thus, issuer shopping explains all of the observed increase in
incumbent ratings, corroborating only hypothesis 2a.
What explains the lack of incumbent response in IOs despite the nearly uniform AAA
entrant ratings? As previously discussed, a substantial portion of the investor base for IOs
is informed investors that want ratings solely for certification purposes. The nearly uniform
AAA ratings of entrants indicates that there is little information content in those ratings.
As such, the investors that are happy with an entrant rating simply want a higher rating
regardless of its accuracy. The IO ratings of incumbent CRAs, on the other hand, likely have
some information content. To compete with the entrants’ ratings on IOs for certification-
motivated investors, the incumbents would have to revise their IO ratings so dramatically
that it may risk making it obvious they are responding to the entrants’ threat rather than
changing their views of the risk of these securities. That would cost the incumbents repu-
tational capital and their base of IO investors that do care about the information content
of ratings. Of course, the incumbents could perhaps credibly revise their ratings upwards
by a notch once they observe entrant ratings. But even that would be insufficient to induce
investors who solely care about certification to purchase their ratings over an entrant’s, given
that the gap would still be two notches or more. Thus, the incumbent CRAs do not respond
at all since doing so would provide no benefit in terms of increased fee income, while at the
same time risking reputational capital.
34

6 Conclusions
We have studied the effect of CRA entry on the level of ratings in structured finance. The
entrants issue systematically higher ratings than the incumbents, and this indicates a strategy
of catering to issuers. Furthermore, as the entrants’ market share increases, the incumbents’
ratings rise and the level of subordination they require for AAA tranches falls. The effect
of entrant share on incumbent ratings is robust to the use of predicted market shares rather
than actual market shares showing that the effect is unlikely to be purely due to selection—
rather, incumbents appear to respond to entry. The observed increase in the ratings of the
incumbents is due to both rating catering on their part and to shopping by issuers.
A limitation of our analysis is that we are unable to offer any theory, nor empirical support
for existing theories, regarding which particular securities the incumbents rate. While we
have addressed several specific concerns regarding reverse causality, we cannot foreclose the
possibility that some of our results are due to selection. We hope future research can provide
greater insights into why we see entrants rate some securities but not others.
Furthermore, it is too soon to assess the relative accuracy of the ratings of the incumbents
and entrants in our market given the nature of default in structured finance. We cannot
be certain that the entrants’ higher ratings will not be justified based on ex post losses.
The theoretical literature identifies an upward bias from competition, however, so it is less
probable that the incumbents are excessively conservative in their ratings. Alp (2013) has
also shown that, historically, moves towards relaxing rating standards have been associated
with more default such that relaxation of standards has been associated with less accurate
ratings. Finally, the theoretical literature indicates that the shopping that we uncover is not
welfare improving. As such, our results suggest that, contrary to the stated belief of the
SEC and the policy of European regulators, increasing competition among CRAs is likely to
exacerbate, rather than reduce, any tendency the CRAs have to issue inflated ratings unless
both the rating shopping and catering problems are addressed.
35
References
Adelino, Manuel and Miguel A. Ferreira, forthcoming. Bank Ratings and Lending Supply:
Evidence from Sovereign Downgrades. Review of Financial Studies.
Almeida, Heitor, Igor Cunha, Miguel A. Ferreira, and Felipe Restrepo, forthcoming. The
Real Effects of Credit Ratings: The Sovereign Ceiling Channel. Journal of Finance.
Alp, Aysun, 2013. Structural Shifts in Credit Rating Standards. Journal of Finance,
63:6, 2435-70.
An, Xudong, Yongheng Deng, and Stuart Gabriel, 2011. Asymmetric Information, Ad-
verse Selection, and the Pricing of CMBS. Journal of Financial Economics, 100, 304-25.
Ashcraft, Adam, Goldsmith-Pinkham, Paul and James Vickery, 2010. MBS Ratings and
the Mortgage Credit Boom. FRB of New York Staff Report No. 449.
Atanasov, Vladimir and John J. Merrick Jr., 2013. The Effects of Market Frictions on
Asset Prices: Evidence from Agency MBS. Manuscript, College of William and Mary.
Bae, Kee-Hong, Jun-Koo Kang, and Jin Wang, 2015. Does Increased Competition Affect
Credit Ratings? A Reexamination of the Effect of Fitch’s Market Share on Credit Ratings in
the Corporate Bond Market. Journal of Financial and Quantitative Analysis, 50:5, 1011-35.
Baghai, Ramin P., Henri Servaes, and Ane Tamayo, 2014. Have Rating Agencies Be-
come More Conservative? Implications for Capital Structure and Debt Pricing. Journal of
Finance, 69:5, 1961-2005.
36
Bar-Isaac, Heski and Joel Shapiro, 2013. Ratings Quality Over the Business Cycle. Jour-
nal of Financial Economics, 108, 62-78.
Beaman, John and Lisa Pendergast, 2013. Investing in CMBS IO. Ch. 5.3 in CRE Fi-
nance Council: CMBS E-Primer.
Beaver, William H., Catherine Shakespeare and Mark T. Soliman, 2006. Differential
Properties in the Ratings of Certified versus Non-certified Bond-rating Agencies. Journal of
Accounting and Economics, 42, 303-34.
Becker, Bo and Todd Milbourn, 2011. How did Increased Competition Affect Credit
Ratings? Journal of Financial Economics, 101, 493-514.
Behr, P., Kisgen, D. and J. Taillard, 2014. Did Government Regulations Lower Credit
Rating Quality? Working paper,
SSRN http : //papers.ssrn.com/sol3/papers.cfm?abstractid = 2412294
Bennett, Victor Manuel, Lamar Pierce, Jason A. Snyder, and Michael W. Toffel, 2013.
Customer-Driven Misconduct: How Competition Corrupts Business Practices. Management
Science, 59:8, 1725-42.
Bessembinder, Hendrik, William Maxwell, and Kumar Venkataraman, 2013. Introducing
Daylight to Structured Credit Products. Financial Analysts Journal, 69:6, 55-67.
Bolton, Patrick, Xavier Freixas, and Joel Shapiro, 2012. The Credit Ratings Game.
Journal of Finance, 67:1, 85-111.
37
Bongaerts, Dion, K.J. Martijn Cremers, and William N. Goetzmann, 2012. Tiebreaker:
Certification and Multiple Credit Ratings. Journal of Finance, 67:1, 113-52.
Boot, Arnoud W.A. and Anjan V. Thakor, 1993. Security Design. Journal of Finance,
48:4, 1349-78.
Bruno, Valentina, Jess Cornaggia, and Kimberly J. Cornaggia, forthcoming. Does Cer-
tification Affect the Information Content of Credit Ratings? Management Science.
Camanho, Nelson, Pragyan Deb, and Zijun Liu, 2012. Credit Rating and Competition.
Working paper, Catolica Lisbon School of Business & Economics.
Chan, K. Hung, Kenny Z. Lin, and Phylli Lai-lan Mo, 2006. A Political-economic Anal-
ysis of Auditor Reporting and Auditor Switches. Review of Accounting Studies, 11, 21-48.
Cohen, Andrew and Mark D. Manuszak, 2013. Ratings Competition in the CMBS Mar-
ket. Journal of Money, Credit and Banking, 45:1, 93-119.
Cole, Harold and Thomas F. Cooley, 2014. Rating Agencies. NBER Working Paper
19972.
Commercial Mortgage Alert, 2014. Issuers Test Split Ratings on Senior CMBS. Septem-
ber 19.
Cornaggia, Jess, Kimberly J. Cornaggia, and Ryan Israelson, 2014. Credit Ratings and
the Cost of Municipal Financing. Working Paper, Indiana University.
38

Coval, Joshua D., Jakub W. Jurek, and Erik Stafford, 2009. Economic Catastrophe
Bonds. American Economic Review, 99:3, 628-66.
DeFond, Mark, and Jieying Zhang, 2014. A Review of Archival Auditing Research. Jour-
nal of Accounting and Economics, 58, 275-326.
Dierker, Martin, Daniel Quan, and Walter Torous, 2005. Valuing the Defeasance Option
in Securitized Commercial Mortgages. Real Estate Economics, 33:4, 663-80.
Doherty, Neil A., Anastasia V. Kartasheva, and Richard D. Phillips, 2012. Information
Effect of Entry into Credit Ratings Market: The Case of Insurers’ Ratings. Journal of Fi-
nancial Economics, 106, 308-30.
Edwards, Amy K., Lawrence E. Harris, and Michael S. Piwowar, 2007. Corporate Bond
Market Transaction Costs and Transparency. Journal of Finance, 62:3, 1421-51.
Frenkel, Sivan, 2015. Repeated Interaction and Rating Inflation: A Model of Double
Reputation. American Economic Journal: Microeconomics, 7:1, 250-80.
Fulghieri, Paolo, Gunter Strobl, and Han Xia, 2014. The Economics of Solicited and
Unsolicited Credit Ratings. Review of Financial Studies, 27:2, 484-518.
Griffin, John M., Jordan Nickerson, and Dragon Yongjun Tang, 2013. Rating Shopping
or Catering? An Examination of the Response to Competitive Pressure for CDO Credit
Ratings. Review of Financial Studies, 26:9, 2270-310.
Griffin, John M. and Dragon Tang, 2012. Did Subjectivity Play a Role in CDO Credit
39
Ratings? Journal of Finance, 67:4, 1293-328.
He, Jie (Jack), Jun ‘QJ’ Qian, and Philip E. Strahan, 2012. Are All Ratings Created
Equal? The Impact of Issuer Size on the Pricing of Mortgage-Backed Securities. Journal of
Finance, 67:6, 2097-137.
He, Jie (Jack), Jun ‘QJ’ Qian, and Philip E. Strahan, 2016. Does the Market Understand
Rating Shopping? Predicting MBS Losses with Initial Yields. Review of Financial Studies,
29:2, 457-85.
Hollifield, Burton, Artem Neklyudov, and Chester Spatt, 2013. Bid-Ask Spreads and the
Pricing of Securitizations: 144a vs. Registered Securitizations. Manuscript, Carnegie Mellon
University.
Jiang, John (Xuefeng), Mary Harris Stanford, and Yuan Xie, 2012. Does it Matter Who
Pays for Bond Ratings? Historical Evidence. Journal of Financial Economics, 105, 607-21.
Kanter, James, 2012. Finance Ministers Clear Way for Credit Rating Competition in
Europe. New York Times, March 31.
Kroll Bond Ratings, 2011a. Kroll Bond Ratings Makes Official Debut With Multi-Media
Marketing Campaign. Press Release, Kroll Bond Ratings, January 19, 2011.
Kroll Bond Ratings, 2011b. KBRA Assigns Final Ratings to BAMLL Trust 2011-FSHN.
Press Release, Kroll Bond Ratings, July 14, 2011.
Kroll Bond Ratings, 2011c. Kroll Bond Rating Agency Issues CMBS Single Borrower &
40
Large Loan Methodology. Press Release, Kroll Bond Ratings, August 9, 2011.
Kroll Bond Ratings, 2012. U.S. CMBS Multi-Borrower Rating Methodology. Manuscript,
Kroll Bond Ratings, February 23, 2012.
Kroll Bond Ratings, 2013. Kroll Bond Rating Agency Now ERISA Eligible Following
DOL Amendment. July 11, 2013.
Lennox, Clive, 2000. Do Companies Successfully Engage in Opinion Shopping? Evidence
from the UK. Journal of Accounting and Economics, 29, 321-27.
Lu, Tong, 2006. Does Opinion Shopping Impair Auditor Independence and Audit Qual-
ity? Journal of Accounting Research, 44:3, 561-83.
Manso, G., 2013. Feedback Effects of Credit Ratings. Journal of Financial Economics,
109, 535-548.
Mathis, J., J. McAndrews and J.-C. Rochet, 2009. Rating the Raters: Are Reputation
Concerns Powerful Enough to Discipline Rating Agencies? Journal of Monetary Economics,
56, 657-74.
Merrill, C. B., Nadauld T. D., and P. E. Strahan, 2014. Final Demand for Structured
Finance Securities. Working paper,
SSRN http : //papers.ssrn.com/sol3/papers.cfm?abstractid = 2380859
Moody’s Investors Service, 2012. Moody’s Approach to Rating Structured Finance
Interest-Only Securities.
41

Morningstar Credit Ratings, LLC, 2013a. Final Ratings Confirmation - Invitation Homes
2013-SFR1.
Morningstar Credit Ratings, LLC, 2013b. News Release: Morningstar Credit Ratings
Now Qualifies as a Rating Agency Under Amended Underwriter Exemption of the Employee
Retirement Income Security Act of 1974. July 10, 2013.
Reuters, 2011. S&P: U.S. CMBS Conduit/Fusion Pool Criteria Change. July 27. Avail-
able at
http : //www.reuters.com/article/2011/07/27/markets−ratings−uscmbs−idUSL3E7IR5E820110727
(last accessed May 19, 2015).
Sangiorgi, Francesco and Chester Spatt, forthcoming. Opacity, Credit Rating Shopping
and Bias. Management Science.
Scully, Matt, 2015. Ratings Shopping Run Amok in U.S. Property Debt Fuels Buyer Ire.
Bloomberg, Apr. 15. Available at
http://www.bloomberg.com/news/articles/2015-04-15/ratings-shopping-run-amok-in-u-s-property-
debt-fuels-buyer-ire
(last accessed May 19, 2015).
SEC, 2011. Release No. 34-65339, September 14, 2011.
SEC, 2012. Release No. 34-66514, March 5, 2012.
SEC, 2013. Annual Report on Nationally Recognized Statistical Rating Organizations
42

as Required by Section 6 of the Credit Rating Agency Reform Act of 2006.
SIFMA, 2014a. U.S. Average Trading Volume.
SIFMA, 2014b. US Bond Market Issuance and Outstanding.
Skreta, V. and L. Veldkamp, 2009. Ratings Shopping and Asset Complexity: A Theory
of Ratings Inflation. Journal of Monetary Economics, 56, 678-95.
Strobl, Gunter and Han Xia, 2012. The Issuer-Pays Rating Model and Ratings Inflation:
Evidence from Corporate Credit Ratings. Working paper, University of Texas (Dallas).
Tempkin, Adam 2012a. ABS - S&P Re-enters CMBS Ratings Game after Industry
Shutout. Chicago Tribune, May 15.
Tempkin, Adam, 2012b. S&P Criticized Over Changes to CMBS Ratings Standards.
CNBC, Oct. 12. Available at http://www.cnbc.com/id/100140849 (last accessed August
19, 2014).
Titman, Sheridan and Sergey Tsyplakov, 2010. Originator Performance, CMBS Struc-
tures, and the Risk of Commercial Mortgages. Review of Financial Studies, 23:9, 3558-94.
Xia, Han, 2014. Can Investor-Paid Credit Rating Agencies Improve the Information
Quality of Issuer-Paid Rating Agencies? Journal of Financial Economics, 111, 450-68.
43
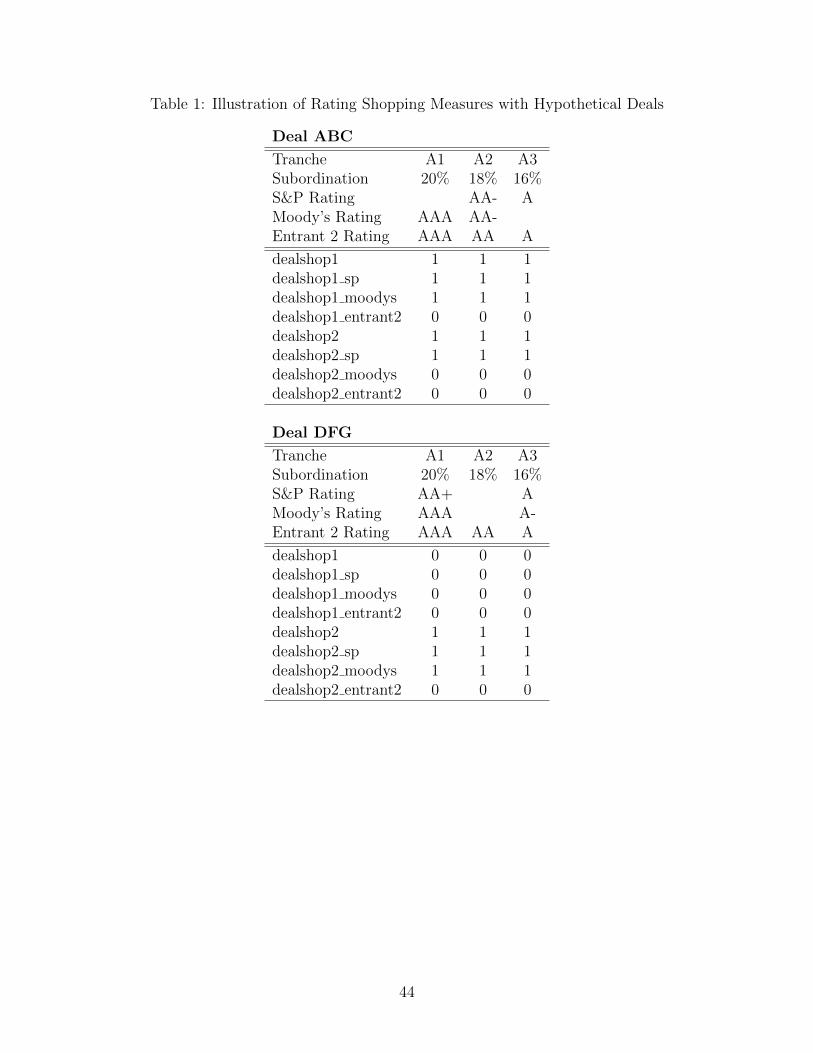
Table 1: Illustration of Rating Shopping Measures with Hypothetical Deals
Deal ABC
Tranche A1 A2 A3Subordination 20% 18% 16%S&P Rating AA- AMoody’s Rating AAA AA-Entrant 2 Rating AAA AA A
dealshop1 1 1 1dealshop1 sp 1 1 1dealshop1 moodys 1 1 1dealshop1 entrant2 0 0 0dealshop2 1 1 1dealshop2 sp 1 1 1dealshop2 moodys 0 0 0dealshop2 entrant2 0 0 0
Deal DFG
Tranche A1 A2 A3Subordination 20% 18% 16%S&P Rating AA+ AMoody’s Rating AAA A-Entrant 2 Rating AAA AA A
dealshop1 0 0 0dealshop1 sp 0 0 0dealshop1 moodys 0 0 0dealshop1 entrant2 0 0 0dealshop2 1 1 1dealshop2 sp 1 1 1dealshop2 moodys 1 1 1dealshop2 entrant2 0 0 0
44

Table 2: Summary Statistics
Variable Obs. Mean Median Std. Dev. Min Maxnratings 2488 2.4 2 0.7 1 4numericsp 841 11.6 13 4.4 1 16numericmoodys 1618 12.6 16 4.4 1 16numericfitch 1442 12.0 14 4.7 1 16numericdbrs 652 12.9 16 4.3 1 16avgratingincumbent 2488 11.9 14 4.6 1 16numericentrant1 379 12.8 16 4.1 1 16numericentrant2 1006 12.7 16 4.4 1 16avgratingentrant 1291 12.7 16 4.4 1 16AAAanyone 2488 0.503 1 0.5 0 1AAAincumbent 2488 0.469 0 0.499 0 1AAAentrantonly 2488 0.035 0 0.183 0 1cpnspread 2031 1.915 1.727 0.991 0.005 8.924tranchesize 2438 165 75 253 1 4100subordination 1854 19.6 18.5 13.2 0 75IO 2488 0.2 0 0.4 0 1floater 2488 0.13 0 0.34 0 1variable 2488 0.47 0 0.5 0 1walunder3 2052 0.13 0 0.34 0 1wal3to5 2052 0.15 0 0.36 0 1wal5to7 2052 0.07 0 0.26 0 1walover7 2052 0.64 1 0.48 0 1retailshare 2348 32 28 27 0 100officeshare 2348 20 17 21 0 100hospshare 2348 15 0 31 0 100indshare 2348 1 0 4 0 28waltv 2354 60 63 8 8 113wadscr 2267 2.2 1.9 0.9 1.2 7.4wam 2419 96.2 108 35.1 12 540year 2488 2012.5 2013 1.1 2009 2014sponsortot 2488 14809.4 13271.3 10259.6 14 34458typconduitfusion 2488 0.68 1 0.47 0 1typlarge 2488 0.27 0 0.44 0 1typother 2488 0.05 0 0.22 0 1nyshare 2178 16.3 10 24.7 0 100lashare 2178 4.7 0 12.8 0 100chishare 2178 2.9 0 9.1 0 100mishare 2178 2.4 0 11.2 0 100houshare 2178 1.5 0 4 0 26dealshop1 2488 0.08 0.27 0 1dealshop2 2488 0.35 0.48 0 1
45

Variable definitions in Table 2 are as follows: nratings is the total number of ratings the security received;
numericsp, numericmoodys, numericfitch, numericdbrs, numericentrant1, and numericentrant2 are
the numeric ratings of S&P, Moody’s, Fitch, DBRS, Entrant 1, and Entrant 2 where 16 corresponds to
AAA and a rating of 1 corresponds to B-. avgratingincumbent is the average rating assigned by the four
incumbent CRAs. avgratingentrant is the average rating assigned by the entrants. AAAanyone takes a
value of 1 if any CRA assigns the security a AAA rating and 0 otherwise. AAAincumbent takes a value of
1 if any incumbent CRA assigns a AAA rating. AAAentrantonly takes a value of 1 if only an entrant CRA
assigns a AAA rating. tranchesize is the $ value of the issue (in millions). cpnspread is the annual spread
at issuance (in %) that the security pays relative to a US treasury of comparable maturity (available only
for non-IO tranches). subordination is the level of subordination (in %) of the security. IO takes a value of
1 if the security is an interest-only tranche. floater takes a value of 1 if the coupon is a fixed spread above
a benchmark index (almost always 1-month LIBOR). variable takes a value of 1 if the coupon is variable
rate other than a floater. walunder3, wal3to5, wal5to7, walover7 are indicator variables that take a value
of 1 if the security’s weighted average life (WAL) is in the range indicated. retailshare, officeshare,
hospshare, and indshare capture the percentage of the loans backed by retail, office, hospitality, and
industrial properties. waltv is the weighted average loan-to-value (LTV) of the loans (in %). wadscr is the
weighted average debt service coverage ratio. wam is the weighted average maturity of the loans measured
in months. year is the year of issuance of the security. sponsortot is the total $ volume (in millions) of
CMBS issued by the lead sponsor of the deal in the year the security is issued. typconduitfusion, typlarge,
and typother are indicator variables for CMBS deal types. nyshare, lashare, chishare, mishare, and
houshare capture the percentage of the loans originated on property in the New York, Los Angeles,
Chicago, Miami, and Houston MSAs, respectively. dealshop1 takes a value of 1 if the security is part of a
deal in which alternate tranche ratings are missing from two different CRAs. dealshop2 takes a value of 1 if
the security is part of a deal with a capital structure in which tranche n has a rating from CRA A, but
tranche n− 1 is not rated by CRA A.
46

Table 3: Frequency of Deals with Shopping
(1) (2) (3) (4) (5)Period 2009-2014:H1 2009-2010 2011-2014:H1 2009-2014:H1 2009-2014:H1Deal Type All All All Conduit/Fusion Large Loandealshop1 5.6% 0.0% 6.3% 9.8% 2.8%dealshop1 sp 2.6% 0.0% 3.0% 7.4% 1.4%dealshop1 moodys 6.1% 0.0% 6.6% 9.0% 2.0%dealshop1 fitch 7.9% 0.0% 9.0% 10.9% 4.7%dealshop1 dbrs 1.3% 0.0% 1.4% 2.4% 0.0%dealshop1 entrant1 4.3% - 4.3% 14.3% 0.0%dealshop1 entrant2 5.3% - 5.3% 5.0% 6.5%dealshop2 24.4% 12.5% 25.9% 40.6% 13.8%dealshop2 sp 2.6% 0.0% 3.0% 3.7% 2.8%dealshop2 moodys 8.8% 0.0% 9.6% 7.2% 16.3%dealshop2 fitch 23.8% 22.2% 24.1% 35.9% 7.0%dealshop2 dbrs 0.0% 0.0% 0.0% 0.0% 0.0%dealshop2 entrant1 14.9% - 14.9% 35.7% 3.2%dealshop2 entrant2 18.9% - 18.9% 28.3% 3.2%
Notes: 1) Data includes all CMBS deals issued January 2009 through June 2014 excludingReREMICS and CDOs. 2) Statistics are deal-level. 3) See Table 2 for variable definitions.4) Our CRA-specific measures of shopping scale by the number of deals the CRA rates.That is, we define dealshop2 Y as the number of deals on which CRA Y gets shoppeddivided by the total number of deals in which CRA Y rates at least one security.
47

Table 4: Comparison of Entrants’ Ratings with Incumbents’ on Same Issues
Entrant Rating S&P Moody’s Fitch DBRS Incum. Avg. Difference N T-statPanel A: Entrant 1 vs. Incumbents
12.36 11.11 1.25*** 195 6.013.38 12.51 0.87*** 177 5.313.16 12.52 0.64*** 151 4.813.92 13.95 -0.03 39 -0.212.80 11.82 0.98*** 379 8.1
IOs only:16.00 12.86 3.14*** 75 6.7
non-IOs only:12.01 11.57 0.44*** 304 6.7
non-IOs only, 2011-2012:12.06 11.74 0.32*** 119 3.2
non-IOs only, 2013-2014:11.97 11.45 0.52*** 185 6.0
Panel B: Entrant 2 vs. Incumbents12.48 11.81 0.67*** 296 4.513.55 13.27 0.28*** 674 4.912.63 12.28 0.35*** 574 6.213.39 13.46 -0.07** 216 -2.312.69 12.27 0.42*** 1006 7.4
IOs only:15.77 13.14 2.63*** 149 8.3
non-IOs only:12.16 12.12 0.04** 857 2.2
non-IOs only, 2011-2012:11.81 11.71 0.10*** 214 3.2
non-IOs only, 2013-2014:12.27 12.25 0.02 643 0.9
Panel C: Entrant Average vs. Incumbents12.37 11.45 0.92*** 443 7.013.52 13.11 0.41*** 813 6.912.75 12.34 0.41*** 717 7.713.46 13.50 -0.04 230 -1.713.00 12.10 0.9*** 1291 10.4
IOs only:15.84 12.99 2.85*** 207 10.4
non-IOs only:12.10 11.95 0.14*** 1084 6.3
non-IOs only, 2011-2012:11.85 11.67 0.18*** 308 4.2
non-IOs only, 2013-2014:12.20 12.07 0.13*** 776 4.8
Notes: 1) Table shows the average rating of the entrant vs. the incumbent in the columnlisted on securities that both CRAs rate. 2) IO is an interest-only security. 3) ∗ ∗ ∗p < 0.01,∗ ∗ p < 0.05, and ∗p < 0.1. 4) Data includes all tranches of CMBS deals rated AAA by atleast one CRA issued January 2009 through June 2014 excluding ReREMICS and CDOs.
48
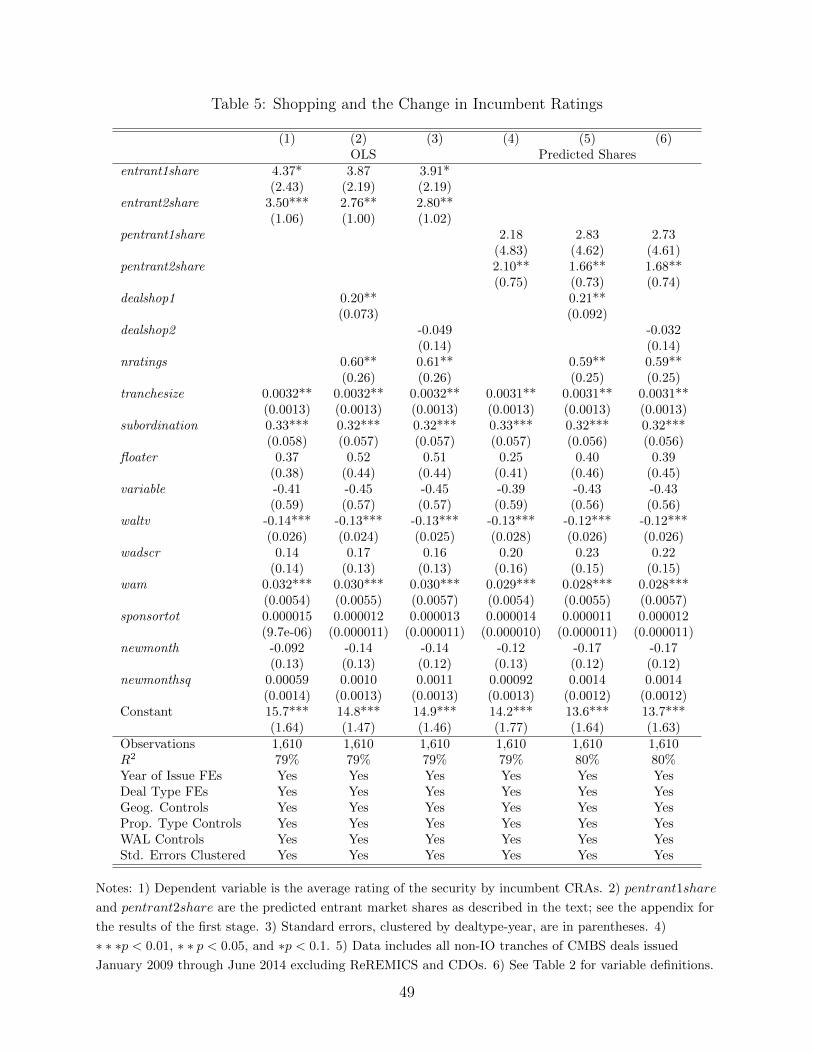
Table 5: Shopping and the Change in Incumbent Ratings
(1) (2) (3) (4) (5) (6)OLS Predicted Shares
entrant1share 4.37* 3.87 3.91*(2.43) (2.19) (2.19)
entrant2share 3.50*** 2.76** 2.80**(1.06) (1.00) (1.02)
pentrant1share 2.18 2.83 2.73(4.83) (4.62) (4.61)
pentrant2share 2.10** 1.66** 1.68**(0.75) (0.73) (0.74)
dealshop1 0.20** 0.21**(0.073) (0.092)
dealshop2 -0.049 -0.032(0.14) (0.14)
nratings 0.60** 0.61** 0.59** 0.59**(0.26) (0.26) (0.25) (0.25)
tranchesize 0.0032** 0.0032** 0.0032** 0.0031** 0.0031** 0.0031**(0.0013) (0.0013) (0.0013) (0.0013) (0.0013) (0.0013)
subordination 0.33*** 0.32*** 0.32*** 0.33*** 0.32*** 0.32***(0.058) (0.057) (0.057) (0.057) (0.056) (0.056)
floater 0.37 0.52 0.51 0.25 0.40 0.39(0.38) (0.44) (0.44) (0.41) (0.46) (0.45)
variable -0.41 -0.45 -0.45 -0.39 -0.43 -0.43(0.59) (0.57) (0.57) (0.59) (0.56) (0.56)
waltv -0.14*** -0.13*** -0.13*** -0.13*** -0.12*** -0.12***(0.026) (0.024) (0.025) (0.028) (0.026) (0.026)
wadscr 0.14 0.17 0.16 0.20 0.23 0.22(0.14) (0.13) (0.13) (0.16) (0.15) (0.15)
wam 0.032*** 0.030*** 0.030*** 0.029*** 0.028*** 0.028***(0.0054) (0.0055) (0.0057) (0.0054) (0.0055) (0.0057)
sponsortot 0.000015 0.000012 0.000013 0.000014 0.000011 0.000012(9.7e-06) (0.000011) (0.000011) (0.000010) (0.000011) (0.000011)
newmonth -0.092 -0.14 -0.14 -0.12 -0.17 -0.17(0.13) (0.13) (0.12) (0.13) (0.12) (0.12)
newmonthsq 0.00059 0.0010 0.0011 0.00092 0.0014 0.0014(0.0014) (0.0013) (0.0013) (0.0013) (0.0012) (0.0012)
Constant 15.7*** 14.8*** 14.9*** 14.2*** 13.6*** 13.7***(1.64) (1.47) (1.46) (1.77) (1.64) (1.63)
Observations 1,610 1,610 1,610 1,610 1,610 1,610R2 79% 79% 79% 79% 80% 80%Year of Issue FEs Yes Yes Yes Yes Yes YesDeal Type FEs Yes Yes Yes Yes Yes YesGeog. Controls Yes Yes Yes Yes Yes YesProp. Type Controls Yes Yes Yes Yes Yes YesWAL Controls Yes Yes Yes Yes Yes YesStd. Errors Clustered Yes Yes Yes Yes Yes Yes
Notes: 1) Dependent variable is the average rating of the security by incumbent CRAs. 2) pentrant1share
and pentrant2share are the predicted entrant market shares as described in the text; see the appendix for
the results of the first stage. 3) Standard errors, clustered by dealtype-year, are in parentheses. 4)
∗ ∗ ∗p < 0.01, ∗ ∗ p < 0.05, and ∗p < 0.1. 5) Data includes all non-IO tranches of CMBS deals issued
January 2009 through June 2014 excluding ReREMICS and CDOs. 6) See Table 2 for variable definitions.
49
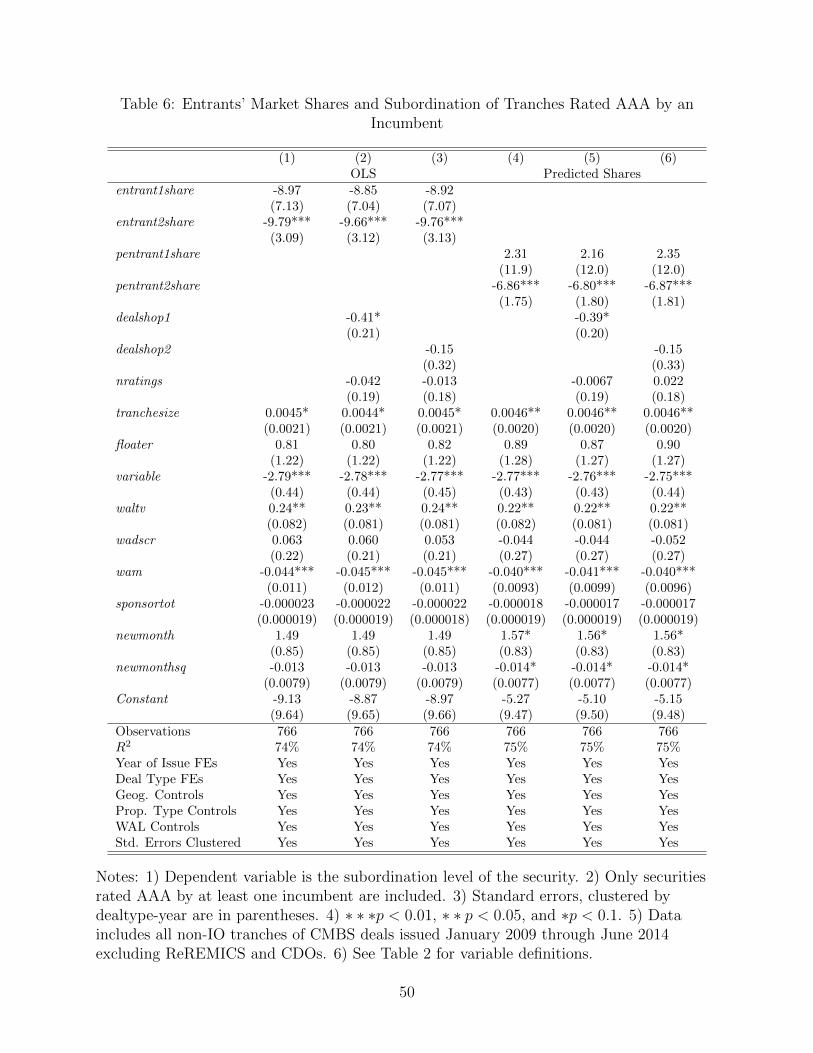
Table 6: Entrants’ Market Shares and Subordination of Tranches Rated AAA by anIncumbent
(1) (2) (3) (4) (5) (6)OLS Predicted Shares
entrant1share -8.97 -8.85 -8.92(7.13) (7.04) (7.07)
entrant2share -9.79*** -9.66*** -9.76***(3.09) (3.12) (3.13)
pentrant1share 2.31 2.16 2.35(11.9) (12.0) (12.0)
pentrant2share -6.86*** -6.80*** -6.87***(1.75) (1.80) (1.81)
dealshop1 -0.41* -0.39*(0.21) (0.20)
dealshop2 -0.15 -0.15(0.32) (0.33)
nratings -0.042 -0.013 -0.0067 0.022(0.19) (0.18) (0.19) (0.18)
tranchesize 0.0045* 0.0044* 0.0045* 0.0046** 0.0046** 0.0046**(0.0021) (0.0021) (0.0021) (0.0020) (0.0020) (0.0020)
floater 0.81 0.80 0.82 0.89 0.87 0.90(1.22) (1.22) (1.22) (1.28) (1.27) (1.27)
variable -2.79*** -2.78*** -2.77*** -2.77*** -2.76*** -2.75***(0.44) (0.44) (0.45) (0.43) (0.43) (0.44)
waltv 0.24** 0.23** 0.24** 0.22** 0.22** 0.22**(0.082) (0.081) (0.081) (0.082) (0.081) (0.081)
wadscr 0.063 0.060 0.053 -0.044 -0.044 -0.052(0.22) (0.21) (0.21) (0.27) (0.27) (0.27)
wam -0.044*** -0.045*** -0.045*** -0.040*** -0.041*** -0.040***(0.011) (0.012) (0.011) (0.0093) (0.0099) (0.0096)
sponsortot -0.000023 -0.000022 -0.000022 -0.000018 -0.000017 -0.000017(0.000019) (0.000019) (0.000018) (0.000019) (0.000019) (0.000019)
newmonth 1.49 1.49 1.49 1.57* 1.56* 1.56*(0.85) (0.85) (0.85) (0.83) (0.83) (0.83)
newmonthsq -0.013 -0.013 -0.013 -0.014* -0.014* -0.014*(0.0079) (0.0079) (0.0079) (0.0077) (0.0077) (0.0077)
Constant -9.13 -8.87 -8.97 -5.27 -5.10 -5.15(9.64) (9.65) (9.66) (9.47) (9.50) (9.48)
Observations 766 766 766 766 766 766R2 74% 74% 74% 75% 75% 75%Year of Issue FEs Yes Yes Yes Yes Yes YesDeal Type FEs Yes Yes Yes Yes Yes YesGeog. Controls Yes Yes Yes Yes Yes YesProp. Type Controls Yes Yes Yes Yes Yes YesWAL Controls Yes Yes Yes Yes Yes YesStd. Errors Clustered Yes Yes Yes Yes Yes Yes
Notes: 1) Dependent variable is the subordination level of the security. 2) Only securitiesrated AAA by at least one incumbent are included. 3) Standard errors, clustered bydealtype-year are in parentheses. 4) ∗ ∗ ∗p < 0.01, ∗ ∗ p < 0.05, and ∗p < 0.1. 5) Dataincludes all non-IO tranches of CMBS deals issued January 2009 through June 2014excluding ReREMICS and CDOs. 6) See Table 2 for variable definitions.
50
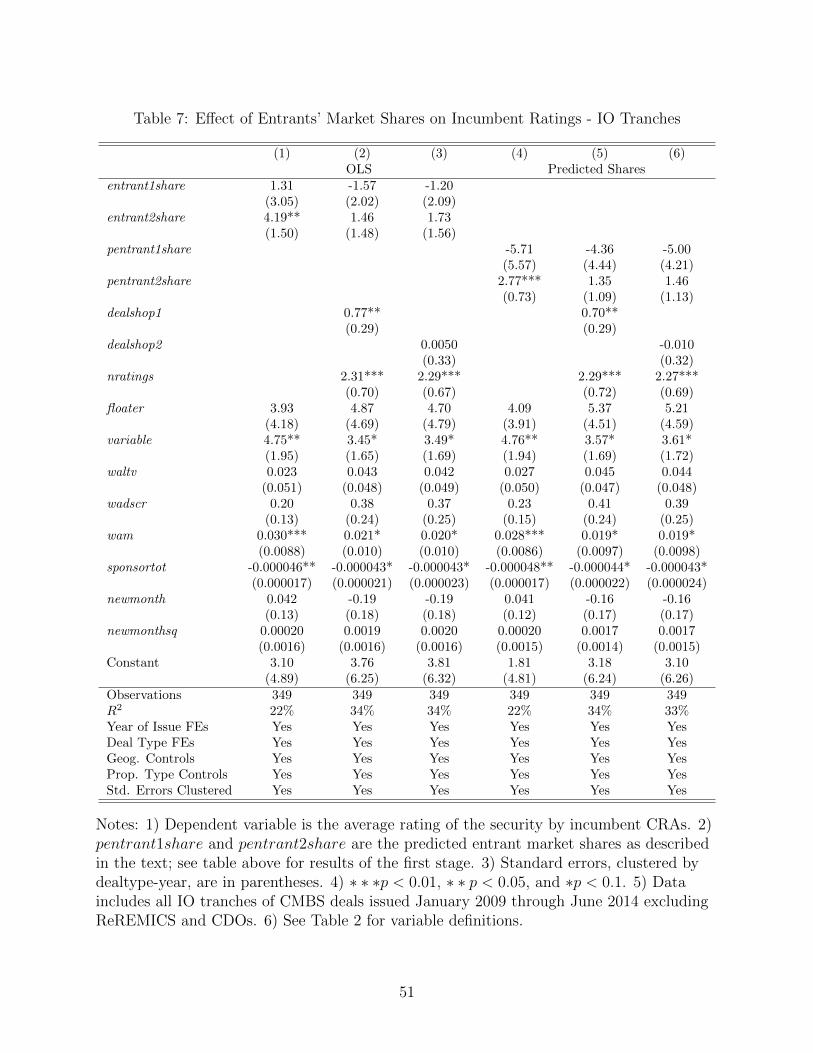
Table 7: Effect of Entrants’ Market Shares on Incumbent Ratings - IO Tranches
(1) (2) (3) (4) (5) (6)OLS Predicted Shares
entrant1share 1.31 -1.57 -1.20(3.05) (2.02) (2.09)
entrant2share 4.19** 1.46 1.73(1.50) (1.48) (1.56)
pentrant1share -5.71 -4.36 -5.00(5.57) (4.44) (4.21)
pentrant2share 2.77*** 1.35 1.46(0.73) (1.09) (1.13)
dealshop1 0.77** 0.70**(0.29) (0.29)
dealshop2 0.0050 -0.010(0.33) (0.32)
nratings 2.31*** 2.29*** 2.29*** 2.27***(0.70) (0.67) (0.72) (0.69)
floater 3.93 4.87 4.70 4.09 5.37 5.21(4.18) (4.69) (4.79) (3.91) (4.51) (4.59)
variable 4.75** 3.45* 3.49* 4.76** 3.57* 3.61*(1.95) (1.65) (1.69) (1.94) (1.69) (1.72)
waltv 0.023 0.043 0.042 0.027 0.045 0.044(0.051) (0.048) (0.049) (0.050) (0.047) (0.048)
wadscr 0.20 0.38 0.37 0.23 0.41 0.39(0.13) (0.24) (0.25) (0.15) (0.24) (0.25)
wam 0.030*** 0.021* 0.020* 0.028*** 0.019* 0.019*(0.0088) (0.010) (0.010) (0.0086) (0.0097) (0.0098)
sponsortot -0.000046** -0.000043* -0.000043* -0.000048** -0.000044* -0.000043*(0.000017) (0.000021) (0.000023) (0.000017) (0.000022) (0.000024)
newmonth 0.042 -0.19 -0.19 0.041 -0.16 -0.16(0.13) (0.18) (0.18) (0.12) (0.17) (0.17)
newmonthsq 0.00020 0.0019 0.0020 0.00020 0.0017 0.0017(0.0016) (0.0016) (0.0016) (0.0015) (0.0014) (0.0015)
Constant 3.10 3.76 3.81 1.81 3.18 3.10(4.89) (6.25) (6.32) (4.81) (6.24) (6.26)
Observations 349 349 349 349 349 349R2 22% 34% 34% 22% 34% 33%Year of Issue FEs Yes Yes Yes Yes Yes YesDeal Type FEs Yes Yes Yes Yes Yes YesGeog. Controls Yes Yes Yes Yes Yes YesProp. Type Controls Yes Yes Yes Yes Yes YesStd. Errors Clustered Yes Yes Yes Yes Yes Yes
Notes: 1) Dependent variable is the average rating of the security by incumbent CRAs. 2)pentrant1share and pentrant2share are the predicted entrant market shares as describedin the text; see table above for results of the first stage. 3) Standard errors, clustered bydealtype-year, are in parentheses. 4) ∗ ∗ ∗p < 0.01, ∗ ∗ p < 0.05, and ∗p < 0.1. 5) Dataincludes all IO tranches of CMBS deals issued January 2009 through June 2014 excludingReREMICS and CDOs. 6) See Table 2 for variable definitions.
51
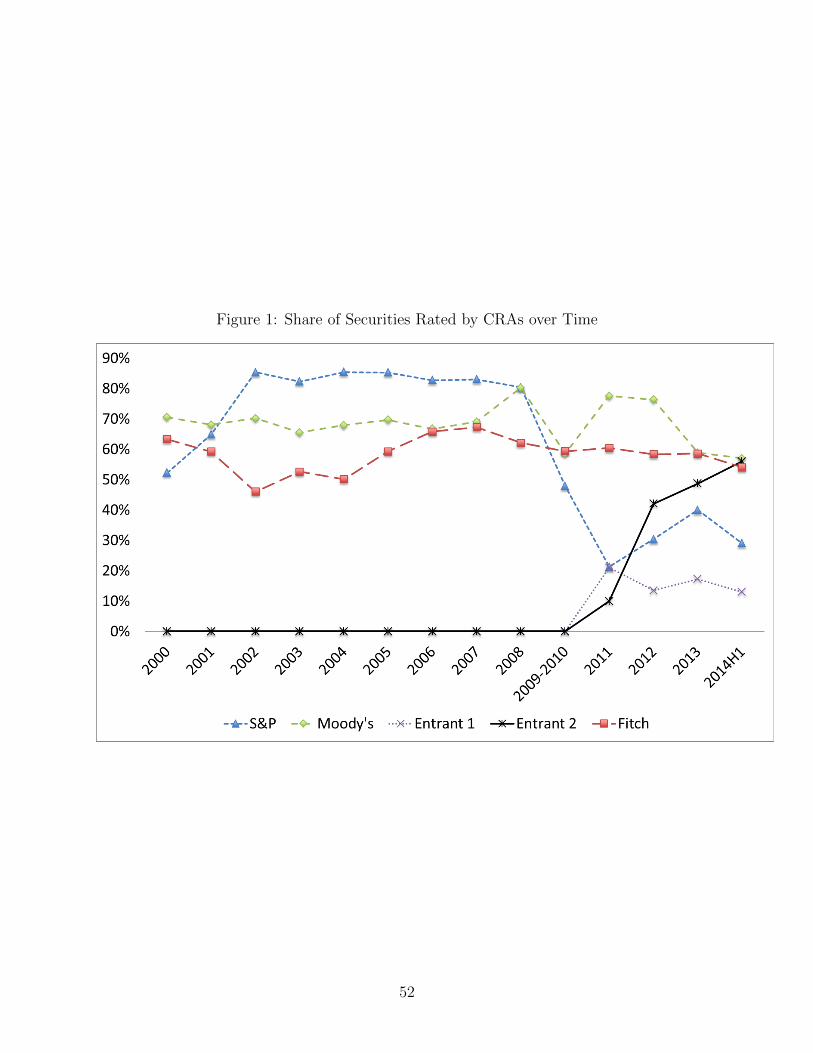
Figure 1: Share of Securities Rated by CRAs over Time
52
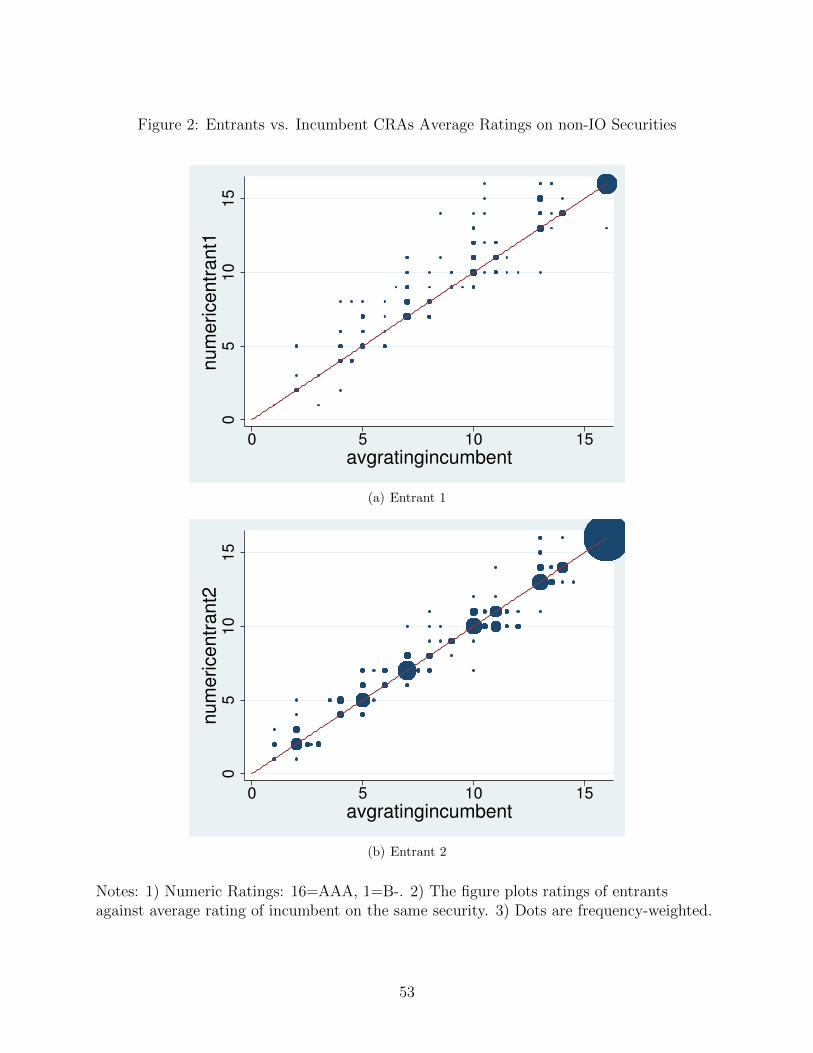
Figure 2: Entrants vs. Incumbent CRAs Average Ratings on non-IO Securities
05
10
15
nu
me
rice
ntr
an
t1
0 5 10 15
avgratingincumbent
(a) Entrant 1
05
10
15
nu
me
rice
ntr
an
t2
0 5 10 15
avgratingincumbent
(b) Entrant 2
Notes: 1) Numeric Ratings: 16=AAA, 1=B-. 2) The figure plots ratings of entrantsagainst average rating of incumbent on the same security. 3) Dots are frequency-weighted.
53

A Supplementary Material (Not-for-Publiction)
Table A.1: Rating Definitions for AAA
S&P The obligor’s capacity to meet its financial commitment on the obligationis extremely strong.
Moody’s Financial obligations assessed aaa (sca) are judged to have the highestcredit quality and thus subject to the lowest credit risk, when used asinputs in determining a structured finance transaction’s rating.
Fitch “AAA” ratings denote the lowest expectation of default risk. They areassigned only in cases of exceptionally strong capacity for payment offinancial commitments. This capacity is highly unlikely to be adverselyaffected by foreseeable events.
DBRS Highest credit quality. The capacity for the payment of financial obliga-tions is exceptionally high and unlikely to be adversely affected by futureevents.
Entrant 1 A rating of “AAA” is the highest letter-grade assigned by Morningstar.Securities rated “AAA” have an extremely strong ability to make timelyinterest payments and ultimate principal payments on or prior to a ratedfinal distribution date.
Entrant 2 Determined to have almost no risk of loss due to credit-related events.Assigned only to the very highest quality obligors and obligations ableto survive extremely challenging economic events.
Notes: 1) S&P and DBRS do not have rating definitions specific to structured finance; theappropriate scale for structured finance for these CRAs is ‘long-term obligation’. 2)Sources are the CRA’s most recent publication of rating definitions: (Standard & Poor’s2009, Moody’s Investors Service 2014, FitchRatings 2014, DBRS 2013, Morningstar CreditRatings, LLC 2012, and Kroll Bond Ratings 2014). 3) Moody’s changed its ratingdefinition for structured finance in 2014 relative to 2009; the definition in the 2009publication (Moody’s Investors Service 2009) uses similar language to the definition in the2014 publication.
54

Table A.2: Share of Securities Rated by Entrants
Year 2009 2010 2011 2012 2013 2014H1 TotalPanel A: All Deal Typesratedentrant1 0% 0% 21% 13% 17% 13% 15%ratedentrant2 0% 0% 10% 42% 49% 56% 40%ratedentrant 0% 0% 31% 49% 63% 62% 52%Panel B: Conduit/Fusion Dealsratedentrant1 0% 0% 24% 5% 6% 13% 9%ratedentrant2 0% 0% 2% 40% 66% 61% 47%ratedentrant 0% 0% 26% 45% 70% 68% 54%Panel C: Large Loan Dealsratedentrant1 0% 0% 18% 29% 45% 15% 31%ratedentrant2 0% 0% 39% 46% 18% 43% 29%ratedentrant 0% 0% 57% 61% 57% 50% 53%Panel D: Other Dealsratedentrant1 0% 0% 0% 41% 0% 0% 10%ratedentrant2 0% 0% 0% 50% 2% 0% 13%ratedentrant 0% 0% 0% 50% 2% 0% 13%
55
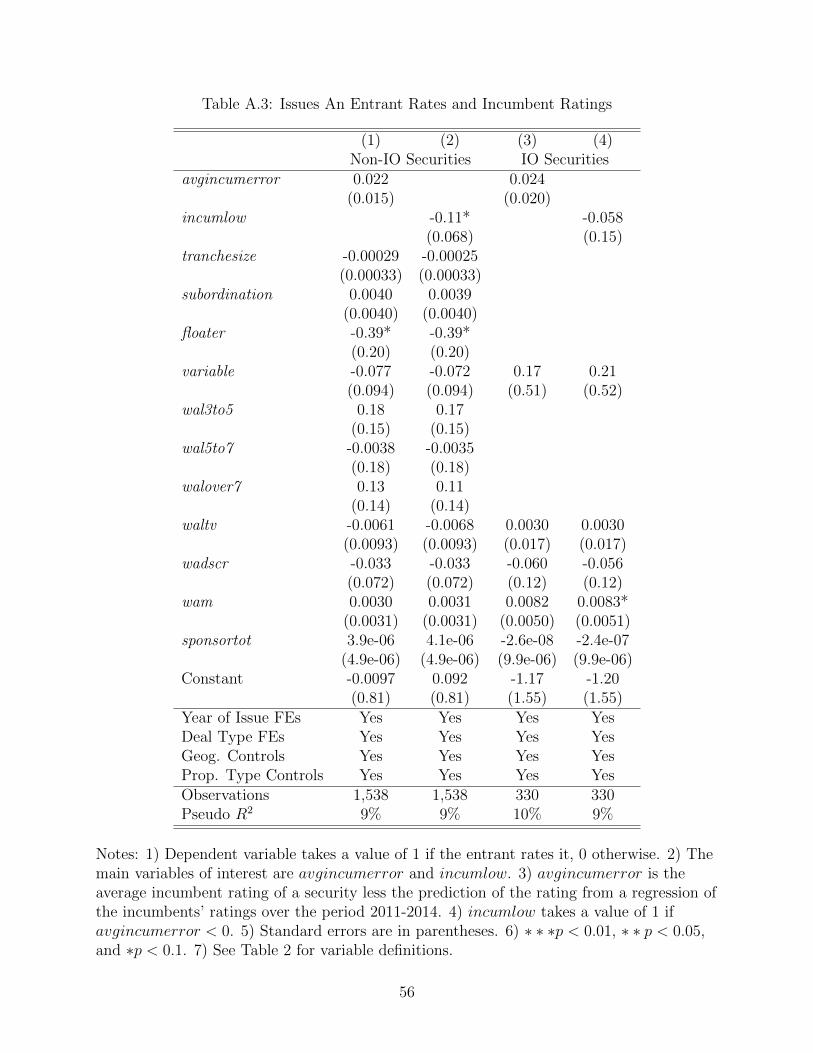
Table A.3: Issues An Entrant Rates and Incumbent Ratings
(1) (2) (3) (4)Non-IO Securities IO Securities
avgincumerror 0.022 0.024(0.015) (0.020)
incumlow -0.11* -0.058(0.068) (0.15)
tranchesize -0.00029 -0.00025(0.00033) (0.00033)
subordination 0.0040 0.0039(0.0040) (0.0040)
floater -0.39* -0.39*(0.20) (0.20)
variable -0.077 -0.072 0.17 0.21(0.094) (0.094) (0.51) (0.52)
wal3to5 0.18 0.17(0.15) (0.15)
wal5to7 -0.0038 -0.0035(0.18) (0.18)
walover7 0.13 0.11(0.14) (0.14)
waltv -0.0061 -0.0068 0.0030 0.0030(0.0093) (0.0093) (0.017) (0.017)
wadscr -0.033 -0.033 -0.060 -0.056(0.072) (0.072) (0.12) (0.12)
wam 0.0030 0.0031 0.0082 0.0083*(0.0031) (0.0031) (0.0050) (0.0051)
sponsortot 3.9e-06 4.1e-06 -2.6e-08 -2.4e-07(4.9e-06) (4.9e-06) (9.9e-06) (9.9e-06)
Constant -0.0097 0.092 -1.17 -1.20(0.81) (0.81) (1.55) (1.55)
Year of Issue FEs Yes Yes Yes YesDeal Type FEs Yes Yes Yes YesGeog. Controls Yes Yes Yes YesProp. Type Controls Yes Yes Yes YesObservations 1,538 1,538 330 330Pseudo R2 9% 9% 10% 9%
Notes: 1) Dependent variable takes a value of 1 if the entrant rates it, 0 otherwise. 2) Themain variables of interest are avgincumerror and incumlow. 3) avgincumerror is theaverage incumbent rating of a security less the prediction of the rating from a regression ofthe incumbents’ ratings over the period 2011-2014. 4) incumlow takes a value of 1 ifavgincumerror < 0. 5) Standard errors are in parentheses. 6) ∗ ∗ ∗p < 0.01, ∗ ∗ p < 0.05,and ∗p < 0.1. 7) See Table 2 for variable definitions.
56
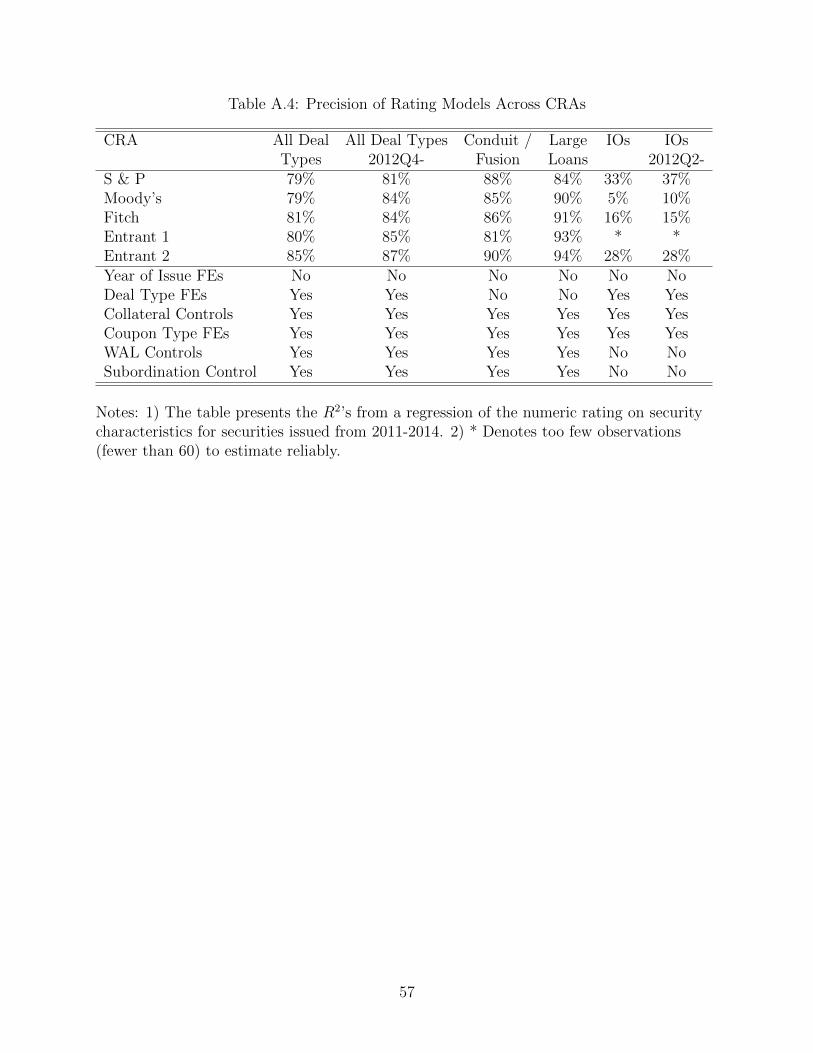
Table A.4: Precision of Rating Models Across CRAs
CRA All Deal All Deal Types Conduit / Large IOs IOsTypes 2012Q4- Fusion Loans 2012Q2-
S & P 79% 81% 88% 84% 33% 37%Moody’s 79% 84% 85% 90% 5% 10%Fitch 81% 84% 86% 91% 16% 15%Entrant 1 80% 85% 81% 93% * *Entrant 2 85% 87% 90% 94% 28% 28%Year of Issue FEs No No No No No NoDeal Type FEs Yes Yes No No Yes YesCollateral Controls Yes Yes Yes Yes Yes YesCoupon Type FEs Yes Yes Yes Yes Yes YesWAL Controls Yes Yes Yes Yes No NoSubordination Control Yes Yes Yes Yes No No
Notes: 1) The table presents the R2’s from a regression of the numeric rating on securitycharacteristics for securities issued from 2011-2014. 2) * Denotes too few observations(fewer than 60) to estimate reliably.
57
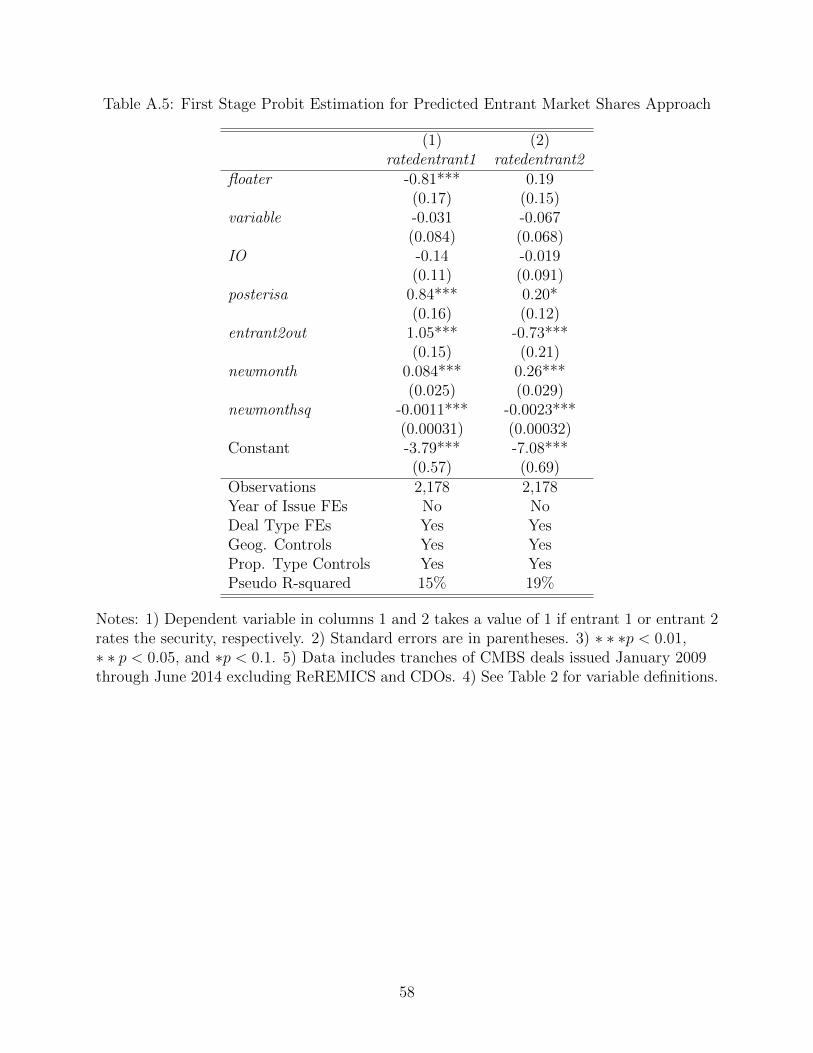
Table A.5: First Stage Probit Estimation for Predicted Entrant Market Shares Approach
(1) (2)ratedentrant1 ratedentrant2
floater -0.81*** 0.19(0.17) (0.15)
variable -0.031 -0.067(0.084) (0.068)
IO -0.14 -0.019(0.11) (0.091)
posterisa 0.84*** 0.20*(0.16) (0.12)
entrant2out 1.05*** -0.73***(0.15) (0.21)
newmonth 0.084*** 0.26***(0.025) (0.029)
newmonthsq -0.0011*** -0.0023***(0.00031) (0.00032)
Constant -3.79*** -7.08***(0.57) (0.69)
Observations 2,178 2,178Year of Issue FEs No NoDeal Type FEs Yes YesGeog. Controls Yes YesProp. Type Controls Yes YesPseudo R-squared 15% 19%
Notes: 1) Dependent variable in columns 1 and 2 takes a value of 1 if entrant 1 or entrant 2rates the security, respectively. 2) Standard errors are in parentheses. 3) ∗ ∗ ∗p < 0.01,∗ ∗ p < 0.05, and ∗p < 0.1. 5) Data includes tranches of CMBS deals issued January 2009through June 2014 excluding ReREMICS and CDOs. 4) See Table 2 for variable definitions.
58
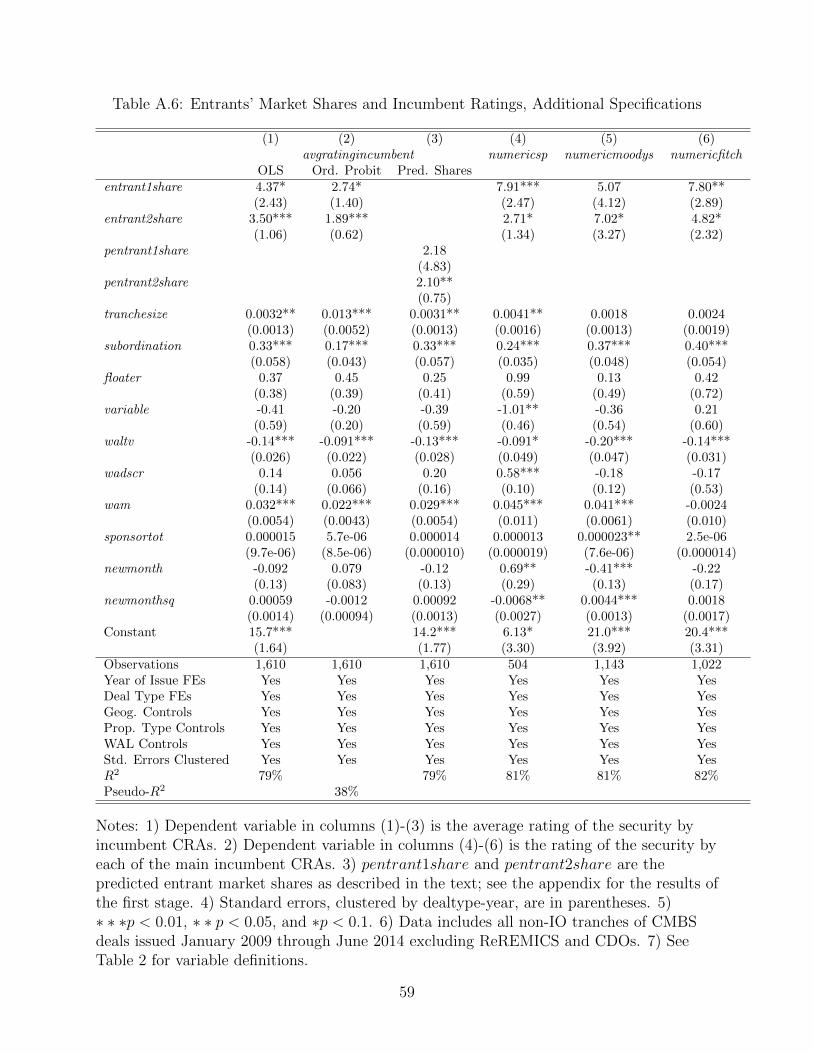
Table A.6: Entrants’ Market Shares and Incumbent Ratings, Additional Specifications
(1) (2) (3) (4) (5) (6)avgratingincumbent numericsp numericmoodys numericfitch
OLS Ord. Probit Pred. Sharesentrant1share 4.37* 2.74* 7.91*** 5.07 7.80**
(2.43) (1.40) (2.47) (4.12) (2.89)entrant2share 3.50*** 1.89*** 2.71* 7.02* 4.82*
(1.06) (0.62) (1.34) (3.27) (2.32)pentrant1share 2.18
(4.83)pentrant2share 2.10**
(0.75)tranchesize 0.0032** 0.013*** 0.0031** 0.0041** 0.0018 0.0024
(0.0013) (0.0052) (0.0013) (0.0016) (0.0013) (0.0019)subordination 0.33*** 0.17*** 0.33*** 0.24*** 0.37*** 0.40***
(0.058) (0.043) (0.057) (0.035) (0.048) (0.054)floater 0.37 0.45 0.25 0.99 0.13 0.42
(0.38) (0.39) (0.41) (0.59) (0.49) (0.72)variable -0.41 -0.20 -0.39 -1.01** -0.36 0.21
(0.59) (0.20) (0.59) (0.46) (0.54) (0.60)waltv -0.14*** -0.091*** -0.13*** -0.091* -0.20*** -0.14***
(0.026) (0.022) (0.028) (0.049) (0.047) (0.031)wadscr 0.14 0.056 0.20 0.58*** -0.18 -0.17
(0.14) (0.066) (0.16) (0.10) (0.12) (0.53)wam 0.032*** 0.022*** 0.029*** 0.045*** 0.041*** -0.0024
(0.0054) (0.0043) (0.0054) (0.011) (0.0061) (0.010)sponsortot 0.000015 5.7e-06 0.000014 0.000013 0.000023** 2.5e-06
(9.7e-06) (8.5e-06) (0.000010) (0.000019) (7.6e-06) (0.000014)newmonth -0.092 0.079 -0.12 0.69** -0.41*** -0.22
(0.13) (0.083) (0.13) (0.29) (0.13) (0.17)newmonthsq 0.00059 -0.0012 0.00092 -0.0068** 0.0044*** 0.0018
(0.0014) (0.00094) (0.0013) (0.0027) (0.0013) (0.0017)Constant 15.7*** 14.2*** 6.13* 21.0*** 20.4***
(1.64) (1.77) (3.30) (3.92) (3.31)Observations 1,610 1,610 1,610 504 1,143 1,022Year of Issue FEs Yes Yes Yes Yes Yes YesDeal Type FEs Yes Yes Yes Yes Yes YesGeog. Controls Yes Yes Yes Yes Yes YesProp. Type Controls Yes Yes Yes Yes Yes YesWAL Controls Yes Yes Yes Yes Yes YesStd. Errors Clustered Yes Yes Yes Yes Yes YesR2 79% 79% 81% 81% 82%Pseudo-R2 38%
Notes: 1) Dependent variable in columns (1)-(3) is the average rating of the security byincumbent CRAs. 2) Dependent variable in columns (4)-(6) is the rating of the security byeach of the main incumbent CRAs. 3) pentrant1share and pentrant2share are thepredicted entrant market shares as described in the text; see the appendix for the results ofthe first stage. 4) Standard errors, clustered by dealtype-year, are in parentheses. 5)∗ ∗ ∗p < 0.01, ∗ ∗ p < 0.05, and ∗p < 0.1. 6) Data includes all non-IO tranches of CMBSdeals issued January 2009 through June 2014 excluding ReREMICS and CDOs. 7) SeeTable 2 for variable definitions.
59

Figure A.1: Interest Rates on CMBS vs. Corporates
23
45
67
01jan2010 01jan2011 01jan2012 01jan2013 01jan2014Date
CMBS AA 10 yld Corp AA 10 yld
(a) AA
24
68
01jan2010 01jan2011 01jan2012 01jan2013 01jan2014Date
CMBS A 10 yld Corp A 10 yld
(b) A
34
56
78
01jan2010 01jan2011 01jan2012 01jan2013 01jan2014Date
CMBS BBB 10 yld Corp BBB 10 yld
(c) BBB
Notes: 1) Ratings for CMBS are ratings by incumbent CRAs. 2) Corporate bond yieldscome from Bloomberg’s composite yield indices, which are constructed daily using allbonds that have Bloomberg Valuation prices at market close. 3) CMBS yields are thecoupon at issuance averaged by quarter for CMBS with WAL between 9 and 15 years.
60

Market Valuation of Entrant Ratings
Given that the entrants are more likely to issue AAA ratings, a natural question is whether
the market discounts these ratings. To test whether investors treat AAA ratings from en-
trants and incumbents differently, we estimate
cpnspreadi,j,t = α0 + α1AAAentrantonlyi,j,t + α′xControlsi,j,t + εi,j,t (9)
on the set of securities that are rated AAA by at least one CRA and
cpnspreadi,j,t = β0 + β1AAAtwowithentranti,j,t + β′xControlsi,j,t + εi,j,t (10)
on the set of securities rated by exactly two CRAs where both ratings are AAA. In equation
(9), AAAentrantonly takes a value of 1 if only an entrant rates it AAA. In equation (10),
AAAtwowithentrant takes a value of 1 if at least one of the two AAA ratings is from an
entrant. cpnspreadi,j,t is the initial coupon spread over comparable maturity Treasuries as
a proxy. To compute this spread, we use the WAL as the security’s maturity and subtract
off the yield on a treasury of comparable maturity in the month the security is issued.15
In equations (9) and (10), i indexes the security, j indicates the deal type, and t indicates
the year of issuance. The controls include dummies for the year of issue, deal type dummies,
collateral characteristics, dummies for the coupon type (fixed rate, floating rate, or variable
rate), and the ex ante WAL of the security in categories. If investors perceive the entrants’
ratings to be a less reliable indicator of quality than the incumbents’, they will demand a
higher return for an issue rated AAA by only an entrant (AAAentrantonly = 1). Similarly, if
investors find incumbent ratings more credible than those of entrants, it will treat a security
rated AAA by less than two incumbents (AAAtwowithentrant = 1) riskier than a security
rated AAA by two incumbents. A finding that α1 > 0 or β1 > 0 thus indicates that investors
15The actual legal maturity dates for CMBS are usually 30-40 years after issuance although that does notrepresent the true final payment date expected by investors.
61

do not treat ratings from entrants and incumbents equally.
Column 1 of Table A.7 contains the results of estimating (9) on securities of all coupon
types. The coefficient on AAAentrantonly is positive but statistically insignificant. Because
the effect of the covariates may differ depending on whether the coupon is fixed rate, variable,
or floating, in Column 2 we estimate (9) using only the subset of securities that have a fixed
rate coupon while in column 3 we estimate the model using only securities that have variable
or floating rate coupons. In Column 2, the coefficient on AAAentrantonly indicates that a
security rated AAA by only an entrant must pay investors roughly 39 basis points more than
a security rated AAA by at least one incumbent, but the effect is statistically insignificant.
Columns 3 and 4 of Table A.7 present the findings from estimating (10) on all securities
with exactly two AAA ratings. In Column 3, which includes securities of all coupon types,
β1 > 0 is positive but only borderline significant at the 10 % level. The magnitude indicates
that securities that have at least one of their AAA ratings from an entrant must pay investors
19 basis points more than securities that two incumbents rates AAA. When we estimate
(10) separately for securities with fixed coupons, the coefficient continues to be positive, of
similar magnitude, and is statistically significant at the 10% level.
Thus, it appears that investors treat AAA ratings from entrants differently than those
of incumbents. The statistical evidence is admittedly not strong but the consistency of the
signs across specifications suggests there may be some discounting of entrant ratings.
62
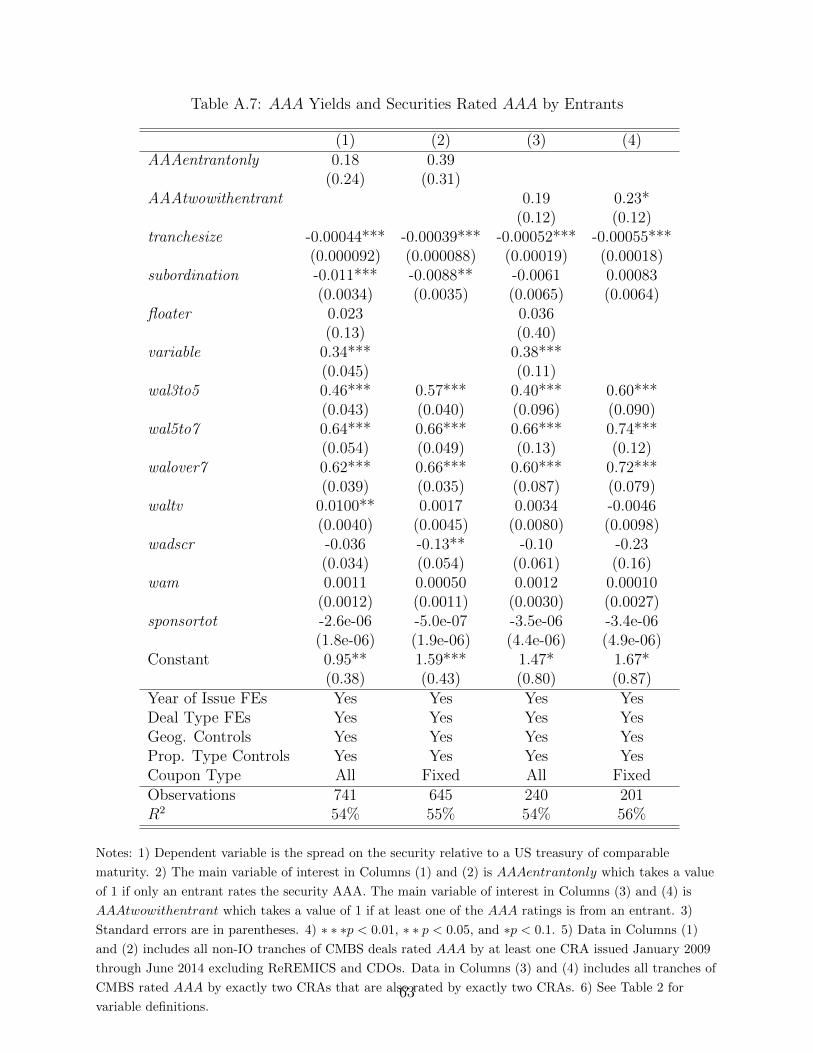
Table A.7: AAA Yields and Securities Rated AAA by Entrants
(1) (2) (3) (4)AAAentrantonly 0.18 0.39
(0.24) (0.31)AAAtwowithentrant 0.19 0.23*
(0.12) (0.12)tranchesize -0.00044*** -0.00039*** -0.00052*** -0.00055***
(0.000092) (0.000088) (0.00019) (0.00018)subordination -0.011*** -0.0088** -0.0061 0.00083
(0.0034) (0.0035) (0.0065) (0.0064)floater 0.023 0.036
(0.13) (0.40)variable 0.34*** 0.38***
(0.045) (0.11)wal3to5 0.46*** 0.57*** 0.40*** 0.60***
(0.043) (0.040) (0.096) (0.090)wal5to7 0.64*** 0.66*** 0.66*** 0.74***
(0.054) (0.049) (0.13) (0.12)walover7 0.62*** 0.66*** 0.60*** 0.72***
(0.039) (0.035) (0.087) (0.079)waltv 0.0100** 0.0017 0.0034 -0.0046
(0.0040) (0.0045) (0.0080) (0.0098)wadscr -0.036 -0.13** -0.10 -0.23
(0.034) (0.054) (0.061) (0.16)wam 0.0011 0.00050 0.0012 0.00010
(0.0012) (0.0011) (0.0030) (0.0027)sponsortot -2.6e-06 -5.0e-07 -3.5e-06 -3.4e-06
(1.8e-06) (1.9e-06) (4.4e-06) (4.9e-06)Constant 0.95** 1.59*** 1.47* 1.67*
(0.38) (0.43) (0.80) (0.87)Year of Issue FEs Yes Yes Yes YesDeal Type FEs Yes Yes Yes YesGeog. Controls Yes Yes Yes YesProp. Type Controls Yes Yes Yes YesCoupon Type All Fixed All FixedObservations 741 645 240 201R2 54% 55% 54% 56%
Notes: 1) Dependent variable is the spread on the security relative to a US treasury of comparable
maturity. 2) The main variable of interest in Columns (1) and (2) is AAAentrantonly which takes a value
of 1 if only an entrant rates the security AAA. The main variable of interest in Columns (3) and (4) is
AAAtwowithentrant which takes a value of 1 if at least one of the AAA ratings is from an entrant. 3)
Standard errors are in parentheses. 4) ∗ ∗ ∗p < 0.01, ∗ ∗ p < 0.05, and ∗p < 0.1. 5) Data in Columns (1)
and (2) includes all non-IO tranches of CMBS deals rated AAA by at least one CRA issued January 2009
through June 2014 excluding ReREMICS and CDOs. Data in Columns (3) and (4) includes all tranches of
CMBS rated AAA by exactly two CRAs that are also rated by exactly two CRAs. 6) See Table 2 for
variable definitions.63
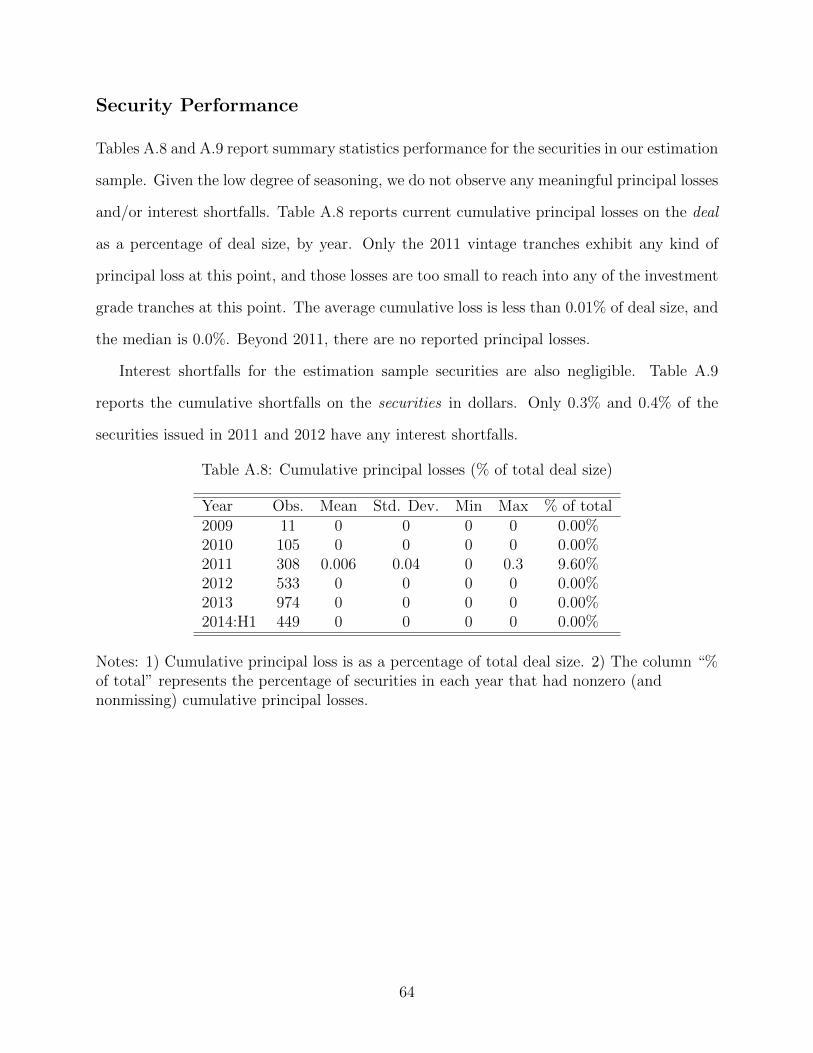
Security Performance
Tables A.8 and A.9 report summary statistics performance for the securities in our estimation
sample. Given the low degree of seasoning, we do not observe any meaningful principal losses
and/or interest shortfalls. Table A.8 reports current cumulative principal losses on the deal
as a percentage of deal size, by year. Only the 2011 vintage tranches exhibit any kind of
principal loss at this point, and those losses are too small to reach into any of the investment
grade tranches at this point. The average cumulative loss is less than 0.01% of deal size, and
the median is 0.0%. Beyond 2011, there are no reported principal losses.
Interest shortfalls for the estimation sample securities are also negligible. Table A.9
reports the cumulative shortfalls on the securities in dollars. Only 0.3% and 0.4% of the
securities issued in 2011 and 2012 have any interest shortfalls.
Table A.8: Cumulative principal losses (% of total deal size)
Year Obs. Mean Std. Dev. Min Max % of total2009 11 0 0 0 0 0.00%2010 105 0 0 0 0 0.00%2011 308 0.006 0.04 0 0.3 9.60%2012 533 0 0 0 0 0.00%2013 974 0 0 0 0 0.00%2014:H1 449 0 0 0 0 0.00%
Notes: 1) Cumulative principal loss is as a percentage of total deal size. 2) The column “%of total” represents the percentage of securities in each year that had nonzero (andnonmissing) cumulative principal losses.
64

Table A.9: Cumulative interest shortfall
Year Obs. Mean Std. Dev. Min Max % of total2009 15 3.27 12.66 0 49.02 3.60%2010 107 0.46 4.74 0 49 0.90%2011 325 38.3 690.38 0 12446 0.30%2012 539 0.32 5.26 0 97.16 0.40%2013 982 0 0 0 0 0.00%2014:H1 446 0 0 0 0 0.00%
Notes: 1) Cumulative interest shortfall is in dollars. 2) The column “% of total” representsthe percentage of securities in each year that had nonzero (and nonmissing) cumulativeinterest shortfalls.
65
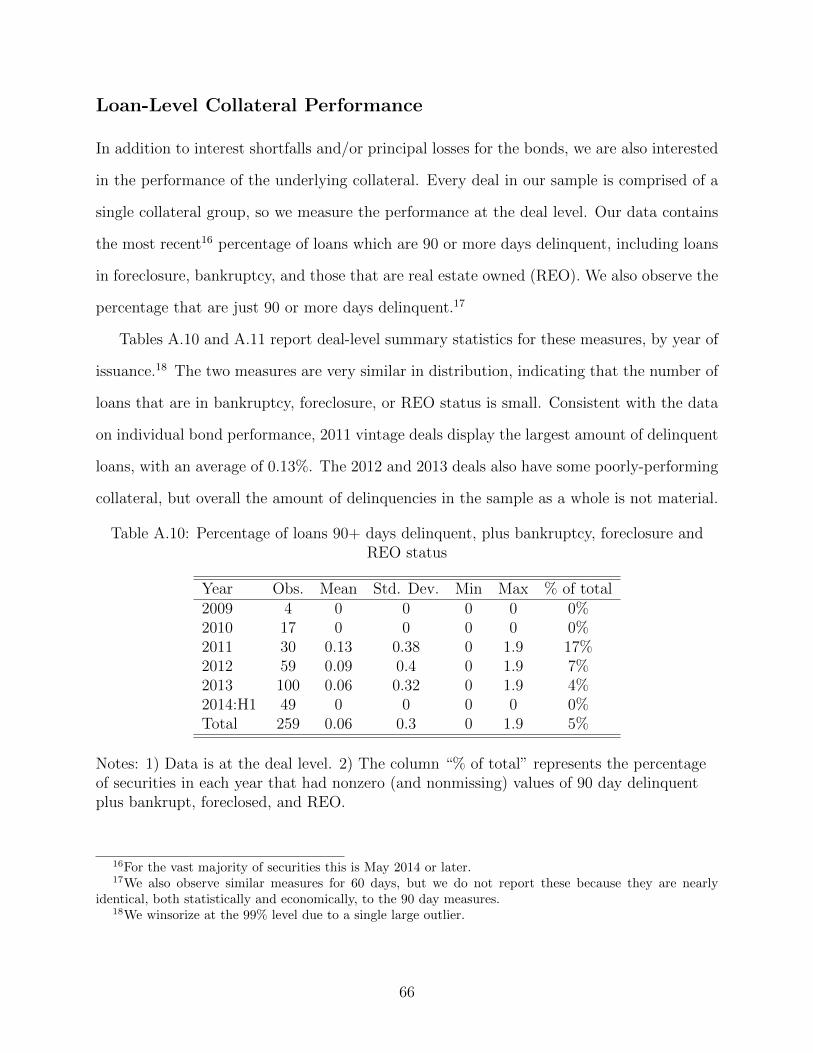
Loan-Level Collateral Performance
In addition to interest shortfalls and/or principal losses for the bonds, we are also interested
in the performance of the underlying collateral. Every deal in our sample is comprised of a
single collateral group, so we measure the performance at the deal level. Our data contains
the most recent16 percentage of loans which are 90 or more days delinquent, including loans
in foreclosure, bankruptcy, and those that are real estate owned (REO). We also observe the
percentage that are just 90 or more days delinquent.17
Tables A.10 and A.11 report deal-level summary statistics for these measures, by year of
issuance.18 The two measures are very similar in distribution, indicating that the number of
loans that are in bankruptcy, foreclosure, or REO status is small. Consistent with the data
on individual bond performance, 2011 vintage deals display the largest amount of delinquent
loans, with an average of 0.13%. The 2012 and 2013 deals also have some poorly-performing
collateral, but overall the amount of delinquencies in the sample as a whole is not material.
Table A.10: Percentage of loans 90+ days delinquent, plus bankruptcy, foreclosure andREO status
Year Obs. Mean Std. Dev. Min Max % of total2009 4 0 0 0 0 0%2010 17 0 0 0 0 0%2011 30 0.13 0.38 0 1.9 17%2012 59 0.09 0.4 0 1.9 7%2013 100 0.06 0.32 0 1.9 4%2014:H1 49 0 0 0 0 0%Total 259 0.06 0.3 0 1.9 5%
Notes: 1) Data is at the deal level. 2) The column “% of total” represents the percentageof securities in each year that had nonzero (and nonmissing) values of 90 day delinquentplus bankrupt, foreclosed, and REO.
16For the vast majority of securities this is May 2014 or later.17We also observe similar measures for 60 days, but we do not report these because they are nearly
identical, both statistically and economically, to the 90 day measures.18We winsorize at the 99% level due to a single large outlier.
66

Table A.11: Percentage of loans 90+ days delinquent
Year Obs. Mean Std. Dev. Min Max % of total2009 2 0 0 0 0 0%2010 15 0 0 0 0 0%2011 28 0.11 0.35 0 1.77 13%2012 55 0.03 0.22 0 1.64 2%2013 99 0.06 0.31 0 1.77 4%2014:H1 49 0 0 0 0 0%Total 248 0.04 0.25 0 1.77 4%
Notes: 1) Data is at the deal level. 2) The column “% of total” represents the percentageof securities in each year that had nonzero (and nonmissing) values of 90 days delinquent.
References Specific to Supplementary Material
DBRS, 2013. Rating Scales: Long Term Obligations Scale.
FitchRatings, 2014. Definitions of Ratings and Other Forms of Opinion.
Kroll Bond Ratings, 2014. Rating Scales: Long-Term Credit. No date provided on html
document; last accessed on August 18, 2014 at
https://www.krollbondratings.com/ratings/scales.
Moody’s Investors Service, 2009. Moody’s Rating Symbols & Definitions.
Moody’s Investors Service, 2014. Rating Symbols and Definitions.
Morningstar Credit Ratings, LLC, 2012. Form NRSRO Exhibit 2.
Standard & Poor’s, 2009. General Criteria: Understanding Standard & Poor’s Rating
Definitions.
67