compensation and benefits study - missouri office of ... · pdf file1 state of missouri...
TRANSCRIPT

1
State of Missouri
Compensation & Benefits Study Report July 29, 2016
Presented By:
CBIZ Human Capital Services

Table of Contents
2
I. Executive Summary ................................................................................................................................................ 3
II. Objectives and Scope of the Study ......................................................................................................................... 4
III. Methodology ........................................................................................................................................................... 5
A. Definitions B. Market Pricing
IV. Compensation Study Results ................................................................................................................................. 9
A. Market Analysis B. Salary Structure Development C. Salary Analysis D. Benefits Analysis E. Compression Analysis F. State Government Pay Ranking Analysis G. Financial Wellness
V. Summary of Findings .............................................................................................................................................. 24 VI. Recommendations .................................................................................................................................................. 25

I. Executive Summary
3
CBIZ Human Capital Services (“CBIZ”) was engaged by the State of Missouri (“State”) to conduct a comprehensive compensation study for its employees, including a review of current compensation practices, an update of the compensation plan, and a benefits analysis. In order to assist the State in implementing a compensation system that considers both market and internal factors, CBIZ matched the State’s positions to positions in the market, developed a new salary structure, and calculated the cost of implementing the recommendations. In addition to evaluating base salaries at the State, CBIZ assessed total cash compensation and competitive benefits levels. As a part of this process, the employee data reflects the 2% general structure adjustment that took effect on July 1, 2016. This report details CBIZ’s findings and recommendations, the summary of which indicates that the State’s current compensation practices are, in the aggregate, below market-competitive levels as evidenced by the following:
Base salary is, on average, 10.4% below the recommended salary range midpoints, which approximates the published survey data market median. (See Exhibit 5A for additional detail.)
Total cash compensation (the sum of base salary and incentives, the latter of which the State does not provide) is, on average, 12.6% below market. (See Exhibit 8 for additional detail.)
The benefits offered by the State are 19.7% above market and improve the overall market position of the State. However, State employees remain 4.6% below market when totaling base salary, incentives, and benefits. (See Exhibit 8 for additional detail.)
The cost to adjust compensation to the threshold of market competiveness, identified as the minimum of the proposed pay ranges, is $13,690,388 as the result of 5,050 State employees being paid below the proposed pay range minimums. (See Exhibit 5A for additional detail.)
Missouri ranks last among the 50 states in average employee pay. (See Exhibit 10 for additional detail.) For reasons detailed later in this report, this analysis has limited utility. CBIZ focused on the broader market for most of the analysis.
The remainder of this report will explain the methodology and expand on this summary in order to clearly document the comprehensive approach taken to analyze the State’s current compensation practices and develop its new compensation plan.

II. Objectives and Scope of the Study
4
The objective of the compensation and benefits study is to provide the State with a plan that:
Enhances the State’s ability to attract, retain, and motivate qualified individuals;
Establishes structures that are flexible in order to meet changing needs; and
Is well-aligned with the State’s broader goals and strategies.
The scope of the study included:
A competitive market analysis of base salary, total cash compensation, and benefits;
Development of a salary structure;
Reconciliation of actual compensation with market-competitive compensation;
Calculation of plan implementation costs;
Analysis of market-competitive benefits levels;
“Total Rewards” analysis;
Overall program recommendations; and
A financial wellness review.

III. Methodology
5
A. Definitions Base Salary: the annual fixed rate that an individual is paid for performing a job, including any differential pay. Bonus/Annual Incentive: the actual direct compensation paid under a bonus, commission, profit-sharing, or other short-term cash compensation plan that provides awards based on established criteria or management discretion, such as the overall performance of the organization or achievement of individual goals. Total Cash Compensation: the sum of base salary and annual incentive compensation payments from variable pay programs.
Employee Benefits: non-cash compensation provided to an employee. Some benefits are required by law (e.g., payroll taxes, unemployment compensation, and workers compensation), while others may be provided at the discretion of an employer (e.g., life insurance, paid time off, retirement plans). Total Compensation: the sum of total cash compensation and employee benefits. Data Points:
─ 25th percentile: the value in an array that falls at the first quarter of the sampled data (75% or ¾ of the values in the sample are greater than the 25th percentile value).
─ 50th percentile: the value in an array that falls in the middle or median of the sampled data (half of the values in the sample fall above this value and half fall below it). This is the data point of reference for the proposed pay grade assignments.
─ 75th percentile: the value in an array that falls at the third quarter of the sampled data (25% or ¼ of the values in the sample are greater than the 75th percentile value).
Compa-ratio: the employee's current salary divided by a market comparison point, which is usually the market 50th percentile or the midpoint of the salary range. An employee whose salary equals the 50th percentile of the market has a compa-ratio of 100%. A compa-ratio of less than 100% indicates that the employee's salary is less than the 50th percentile of the market, and a compa-ratio greater than 100% indicates that the employee's salary is greater than the 50th percentile of the market.

III. Methodology
6
B. Market Pricing
Competitive Market Analysis According to a recent WorldatWork1 survey of market pricing practices, the vast majority of organizations (approximately 85%) utilize a compensation philosophy that strives to compensate employees at the median of the competitive labor market. Median pay is the point at which half of the employers pay more and half pay less. Based on CBIZ’s discussions with the State, it intends to be competitive with its level of pay, which generally corresponds to setting the pay structure at the market median. The labor market influences described below were considered for the jobs included in the scope of the study. Job descriptions provided by the State were also utilized to ensure relevant market matches. Labor Market Influences The three most important labor market characteristics are the size of the organization, geographic scope, and industries from which the State recruits talent. Because surveys focus on different market characteristics (e.g., some focus on size, others focus on geography or industry), CBIZ determined each characteristic as it relates to each position at the State before conducting the market analysis, as follows:
Size of Organization A key factor to be considered in determining the market-competitive compensation, particularly for senior management positions, is the size of the organization. While compensation for many positions is based primarily upon location, industry, job tasks, and responsibilities, compensation for upper-level positions is also significantly affected by the size of the organization. CBIZ considered size factors such as operating budget and team headcount when proposing the compensation for department directors and division directors.
Geographic Influence Many jobs in an organization are recruited locally. Professional jobs may be recruited statewide or regionally. Because individuals who work in senior management positions often relocate solely to accept a new job, national searches are commonly conducted for these positions. In contrast, lower-paid salaried employees seldom relocate primarily on the basis of a job. To accurately reflect this market place characteristic, the survey data must be
1 WorldatWork (formerly the American Compensation Association) is a compensation and total rewards industry association group. Their surveys and publications are widely accepted for use in the field of compensation analysis.

III. Methodology
7
comprised of participants who reflect the geographic scope of the position in question. Too narrow or broad a market area scope either does not consider all necessary factors or introduces irrelevant factors.
However, when considering senior management positions, it is most reasonable to geographically adjust the data to the higher of the local or national market. This is due to the fact that organizations in locations that have greater comparative salaries will provide higher salaries to employees. In addition, the higher (local) rates would be required to compensate an employee moving from an area with a lower cost of living. Conversely, although executives are often recruited on a national basis, in practical application executives rarely are open to reductions in pay, even if they are moving to a lower-cost area. CBIZ primarily utilized data specific to the Missouri statewide average since it is expected that Missouri is the primary market for recruiting employees under the scope of the analysis.
Industry Influence Industry is the final key consideration for matching jobs to the market. Some jobs only exist within a certain industry and are most accurately priced to that industry exclusively. Conversely, some jobs are found in all organizations, and the true market for these jobs usually considers this broader market. For example, most clerical and trade jobs can be found in any organization. For this reason, CBIZ focused on government and state support services or the broader labor market, as appropriate.
Salary Surveys The first step in ascertaining the competitiveness of compensation was to determine what competitors pay for jobs comparable to those at the State. CBIZ used its proprietary survey database that aggregates data from thousands of valid and reliable published salary surveys and includes specific data based on geographic area, size of organization, years of experience, and industry—including government-specific surveys. In addition, CBIZ relied on the National Compensation Association of State Governments (NCASG) survey for data specific to state governments. Data from the database and NCASG survey were reported separately.
Aging Data Survey data must be adjusted to account for market pay movement between the time of publication and when the data are to be used. For example, a survey may have been conducted to report salaries effective as of September 1, 2015. In order to market-price the jobs at the State as of July 1, 2016, CBIZ had to age the survey data ten months. In addition, different surveys have different publication dates, and they must be aged to a common point in time. Put simply, aging the

III. Methodology
8
data provides up-to-date salary data and allows for an "apples to apples" comparison of survey data. All salary data were aged to reflect estimated market pay as of July 1, 2016. Data were aged using a factor of 2.80%, which is the anticipated salary growth rate. This figure reflects the value for projected pay movement as reported by WorldatWork's Salary Budget Survey.
Job Matching CBIZ reviewed the content of each job description provided by the State and searched the salary survey job descriptions to find the best possible match. When a valid match was found, the corresponding salary survey market data were recorded. CBIZ recorded the 25th, 50th, and 75th percentiles for both base salary and total cash compensation.

IV. Compensation Study Results
9
A. Market Analysis Exhibit 1A displays the composite market data for the State. The analysis is a comprehensive review of the included positions compared to the market base salary and market total cash compensation. The 25th, 50th, and 75th percentiles are reported. This exhibit provides a summary look at how the State’s positions compare to the labor market. A detailed analysis with associated implementation costs is provided later in this report. Exhibit 1A also displays comparison base salary data for positions matched to peer roles for the surrounding eight states (i.e., Illinois, Kentucky, Tennessee, Arkansas, Oklahoma, Kansas, Nebraska, and Iowa) as reported in the NCASG survey. Exhibit 1B provides summary results for the Department Director and Division Director roles. The exhibit shows both the executive level within the State system as well as the proposed grade. For these positions, CBIZ analyzed the established hierarchy of roles within the existing compensation structure. CBIZ used market data to recommend new pay ranges for the respective executive levels in the proposed salary structure.

IV. Compensation Study Results
10
Market data were also compared graphically to the State’s current average compensation by position. Exhibit 2A reveals the trendline for actual and market 50th percentile base salary.
As evidenced by the number of blue markers below the market trendline, there are a significant number of positions at lower salary levels paid below the market rate. However, base salaries provided by the State are closer to the market rate for lower-level positions than for higher-level positions.

IV. Compensation Study Results
11
Exhibit 2B provides the trendline for actual and market 50th percentile total cash compensation.
This chart is similar to the previous chart, but the gap to market data widens slightly because the State does not provide incentive compensation.

IV. Compensation Study Results
12
Finally, Exhibit 2C provides the trendline for actual and market 50th percentile total compensation.
A review of the three charts reveals that while compensation provided by the State is more competitive for lower-level than higher-level positions, compensation for each level generally lags the market. The State’s benefits package narrows the total compensation wage gap to the market. However, the gap remains significant in the aggregate at the top of the pay scale.
IV. Compensation Study Results
13
B. Salary Structure Development
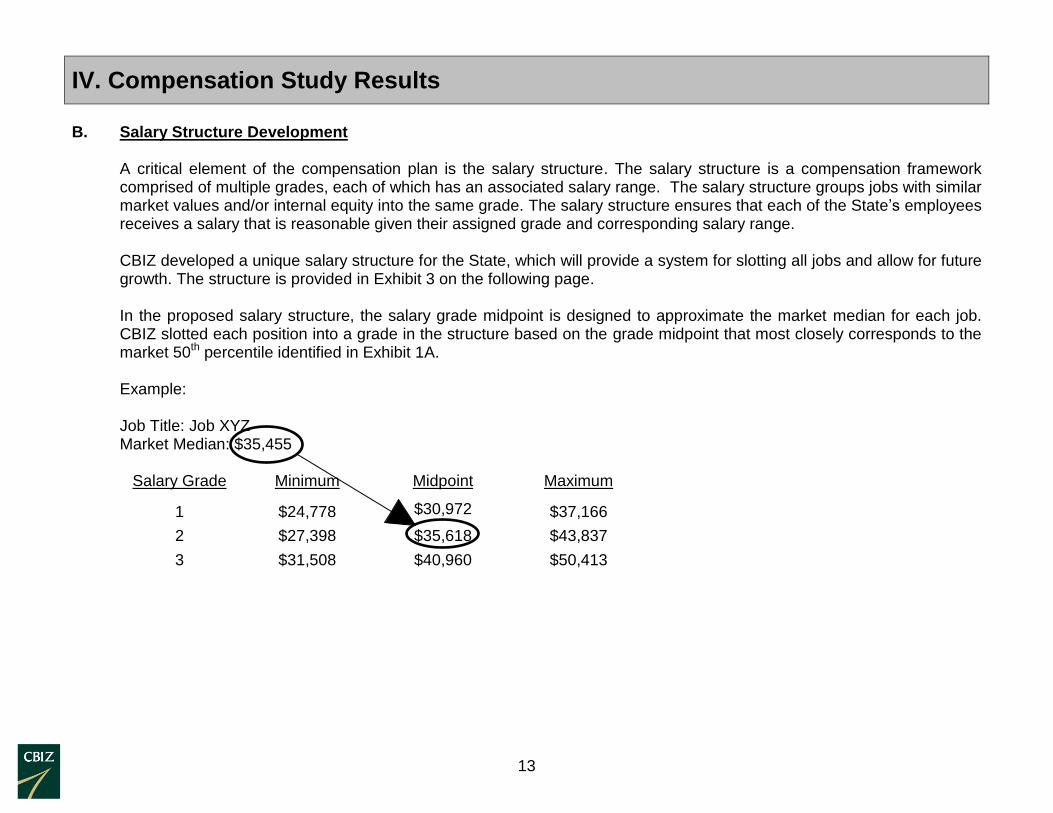
A critical element of the compensation plan is the salary structure. The salary structure is a compensation framework comprised of multiple grades, each of which has an associated salary range. The salary structure groups jobs with similar market values and/or internal equity into the same grade. The salary structure ensures that each of the State’s employees receives a salary that is reasonable given their assigned grade and corresponding salary range. CBIZ developed a unique salary structure for the State, which will provide a system for slotting all jobs and allow for future growth. The structure is provided in Exhibit 3 on the following page. In the proposed salary structure, the salary grade midpoint is designed to approximate the market median for each job. CBIZ slotted each position into a grade in the structure based on the grade midpoint that most closely corresponds to the market 50th percentile identified in Exhibit 1A. Example: Job Title: Job XYZ Market Median: $35,455
Salary Grade Minimum Midpoint Maximum
1 $24,778 $30,972 $37,166
2 $27,398 $35,618 $43,837
3 $31,508 $40,960 $50,413

IV. Compensation Study Results
14
Exhibit 3 - Proposed Salary Structure
Midpoint Range
Grade Minimum Midpoint Maximum Differential Spread
1 $15,912 $18,697 $21,481 35%
2 $16,708 $19,631 $22,555 5.0% 35%
3 $17,543 $20,613 $23,683 5.0% 35%
4 $18,420 $21,644 $24,867 5.0% 35%
5 $19,802 $23,267 $26,732 7.5% 35%
6 $21,287 $25,012 $28,737 7.5% 35%
7 $22,407 $26,888 $31,369 7.5% 40%
8 $24,087 $28,904 $33,722 7.5% 40%
9 $25,894 $31,072 $36,251 7.5% 40%
10 $27,902 $34,179 $40,457 10.0% 45%
11 $30,692 $37,597 $44,503 10.0% 45%
12 $33,761 $41,357 $48,953 10.0% 45%
13 $37,137 $45,493 $53,849 10.0% 45%
14 $40,034 $50,042 $60,051 10.0% 50%
15 $44,037 $55,046 $66,056 10.0% 50%
16 $49,542 $61,927 $74,313 12.5% 50%
17 $55,734 $69,668 $83,602 12.5% 50%
18 $62,701 $78,377 $94,052 12.5% 50%
19 $70,539 $88,174 $105,808 12.5% 50%
20 $77,800 $99,195 $120,590 12.5% 55%
21 $89,470 $114,075 $138,679 15.0% 55%
22 $102,891 $131,186 $159,481 15.0% 55%
23 $118,325 $150,864 $183,403 15.0% 55%
24 $136,073 $173,493 $210,914 15.0% 55%
25 $153,475 $199,517 $245,560 15.0% 60%
26 $181,100 $235,431 $289,761 18.0% 60%
27 $213,698 $277,808 $341,918 18.0% 60%
Salary Range
Definitions Grade: This is the identifier for the placement of a job within the salary structure. Salary Range: This is the range of pay established for each grade. Range Minimum: This is the lowest salary point within the salary range and represents attractive entry-level pay. The minimum should be considered the minimum level of market-competitive pay. Employees paid below this level may be at immediate risk of leaving due to pay and offering salaries below this level would create difficulties in attracting new employees. Range Midpoint: This is the midpoint of the salary range, which approximates the market median. The median represents market-competitive pay and is the point at which half of the market is paid above and half below. Range Maximum: This is the highest salary point within the salary range and should be considered the maximum level of market-appropriate pay. Midpoint Differential: This is the percent difference from one range midpoint to the next. Midpoint differentials grow as the grades escalate to reflect that expectations and responsibilities tend to rise at an increasing rate as market values increase. Range Spread: This is the percent difference between the range maximum and the range minimum. Range spreads grow wider as the grades escalate because the variability of market pay increases as the market value increases. In addition, this effect allows for more flexibility in pay setting as responsibilities increase.

IV. Compensation Study Results
15
C. Salary Analysis
The market rate for a given job does not exist uniformly across the state due to local labor market dynamics. The table on the following page, which is expanded in more detail in Exhibit 4, examines the cost of labor differences among counties across the state of Missouri compared to the statewide average. The analysis shows that St. Louis County market-competitive wages are 104.63% of the statewide market-competitive rate. This suggests that a statewide salary of $44,000 would need to be multiplied by the geographic differential 104.63% and converted to $46,037 to align with competitive wages in St. Louis County. Conversely, Ripley County shows a geographic differential of 91.5%. The same $44,000 statewide salary would be competitive at $40,260 in Ripley County. Chapter 36 of the Missouri Revised Statutes prohibits geographic differentials in compensation.2 CBIZ analysis suggests that if this prohibition were removed, the State could implement geography-based wage structures to better align with the respective work location labor markets, many of which are considerably below the statewide average.
2 Director to prepare pay plan.
36.140. 1. After consultation with appointing authorities and the state fiscal officers, and after a public hearing, the director shall prepare and recommend to the board a pay plan for all classes subject to this chapter. The pay plan shall include, for each class of positions, a minimum and a maximum rate, and such provision for intermediate rates as the director considers necessary or equitable. The pay plan may include provision for grouping of management positions with similar levels of responsibility or expertise into broad classification bands for purposes of determining compensation and for such salary differentials and other pay structures as the director considers necessary or equitable. In establishing the rates, the director shall give consideration to the experience in recruiting for positions in the state service, the rates of pay prevailing in the state for the services performed, and for comparable services in public and private employment, living costs, maintenance, or other benefits received by employees, and the financial condition and policies of the state. These considerations shall be made on a statewide basis and shall not make any distinction based on geographical areas or urban and rural conditions…
2. Any change in the pay plan shall be made on a uniform statewide basis. No employee in a position subject to this chapter shall receive more or less compensation than another employee solely because of the geographical area in which the employee lives or works.
(L. 1945 p. 1157 § 15, A.L. 1957 p. 498, A.L. 1973 H.B. 133, A.L. 1996 H.B. 1146)

IV. Compensation Study Results
16
Exhibit 4 - Geographic Analysis
Work County
Geographic
Differential Work County
Geographic
Differential Work County
Geographic
Differential
ST. LOUIS COUNTY 104.63% JOHNSON 93.82% PETTIS 92.88%
ST. LOUIS CITY 104.63% BATES 93.82% BENTON 92.88%
ST. CHARLES 104.38% HENRY 93.82% STE. GENEVIEVE 92.88%
LINCOLN 104.27% WEBSTER 93.82% SALINE 92.85%
WARREN 104.13% CHRISTIAN 93.82% PIKE 92.77%
FRANKLIN 104.10% CALLAWAY 93.78% MARION 92.77%
JEFFERSON 103.82% CAPE GIRARDEAU 93.60% GRUNDY 92.67%
CLAY 103.70% MONITEAU 93.58% HARRISON 92.67%
PLATTE 103.70% MILLER 93.58% SULLIVAN 92.67%
JACKSON 103.28% CAMDEN 93.58% MERCER 92.67%
RAY 102.88% HICKORY 93.58% RANDOLPH 92.65%
CARROLL 102.88% MORGAN 93.58% HOWARD 92.65%
LAFAYETTE 102.85% NODAWAY 93.43% CHARITON 92.65%
CLINTON 102.73% GENTRY 93.43% BOLLINGER 92.63%
DEKALB 102.73% HOLT 93.43% MACON 92.58%
CALDWELL 102.73% ATCHISON 93.43% ADAIR 92.58%
CASS 102.33% WORTH 93.43% SCOTLAND 92.58%
BUCHANAN 97.35% MADISON 93.33% KNOX 92.58%
ANDREW 97.35% REYNOLDS 93.33% PUTNAM 92.58%
LEWIS 97.10% IRON 93.33% SCHUYLER 92.58%
BOONE 96.02% TANEY 93.30% PERRY 92.47%
COLE 94.88% STONE 93.28% MISSISSIPPI 92.05%
OSAGE 94.88% PHELPS 93.27% SCOTT 92.05%
JASPER 94.80% DENT 93.27% NEW MADRID 92.05%
VERNON 94.80% PULASKI 93.27% STODDARD 91.97%
LAWRENCE 94.80% LIVINGSTON 93.03% TEXAS 91.67%
BARTON 94.80% LINN 93.03% HOWELL 91.67%
CRAWFORD 94.42% DAVIESS 93.03% OZARK 91.67%
GASCONADE 94.42% LACLEDE 93.00% DOUGLAS 91.67%
MARIES 94.42% WRIGHT 93.00% CARTER 91.67%
GREENE 94.30% AUDRAIN 92.97% SHANNON 91.67%
POLK 93.97% MONTGOMERY 92.97% OREGON 91.67%
CEDAR 93.97% ST. FRANCOIS 92.92% DUNKLIN 91.55%
DALLAS 93.97% WASHINGTON 92.92% PEMISCOT 91.55%
ST. CLAIR 93.97% MONROE 92.92% BUTLER 91.50%
DADE 93.97% SHELBY 92.92% WAYNE 91.50%
BARRY 93.88% RALLS 92.92% RIPLEY 91.50%
NEWTON 93.88% CLARK 92.90%
MCDONALD 93.88% COOPER 92.88%

IV. Compensation Study Results
17
Exhibits 5A, 5B, and 5C compare the market data (and corresponding proposed salary ranges) to actual base salary at the State. Exhibit 5A presents results by grade, while 5B presents results sorted and subtotaled by department, and 5C is sorted and subtotaled by division. The first several columns of each exhibit are tied to State employee census data. The CBIZ analysis begins with the column Market 50th Percentile, which is the market median as identified in Exhibit 1A. Proposed Grade, Proposed Range Minimum, Proposed Range Midpoint, and Proposed Range Maximum tie back to the proposed salary structure in Exhibit 3 based on the methodology described on page 13 of this report. The Compa-Ratio is the Annualized Salary divided by the Proposed Range Midpoint. Actual Below Minimum calculates the difference between Annualized Salary and the Proposed Range Minimum when the Annualized Salary is less than the Proposed Range Minimum. This number is then adjusted based on the FTE%, which stands for full-time equivalent, to account for reduced schedules (e.g., an employee working half-time would be a 50% FTE). Actual Above Maximum performs a similar calculation for salaries above the Proposed Range Maximum. The State’s average compa-ratio is 89.6% of the midpoint of the proposed market-competitive salary ranges. This indicates that, on average, base pay is approximately 10.4% below market. The cost to implement the revised structure would be $13,690,388, approximately 1.0% of the reviewed population payroll. This is the cost to bring all employees to the minimum of their respective proposed ranges. CBIZ does not recommend changing salaries for any employees paid above the minimum. Among the 37,906 employees included in the scope of the pay study3, there are 5,050 employees below the salary grade minimum, and 261 above the maximum. Some records will not display market data and proposed salary structure information because either an appropriate market match was not found or job documentation was unavailable.
3 Practical constraints, including the financial limitations of the study and the lack of comparable private sector employment for certain public sector jobs, prevented a comprehensive evaluation
of all statewide job titles. The following positions were not included in the pay study:
All of the positions within the legislative and judicial branches of government;
All of the positions within the offices of the statewide elected officials (Governor, Lt. Governor, Secretary of State, State Auditor, State Treasurer, and Attorney General);
All of the positions within the Department of Conservation;
All of the positions within the various State colleges and universities;
All of the positions within MOSERS, MCHCP, and other benefit administrators.
Positions outside of the Uniform Classification and Pay (UCP) System in the following agencies: DIFP, OA/Ethics Commission, and DNR/Petroleum Storage Tank Insurance Board;
Certain positions within DOLIR/Division of Worker’s Compensation (Administrative Law Judge, Chief Administrative Law Judge, and Chief Legal Counsel);
The majority of unclassified and exempt positions within Merit agencies and UCP Non-Merit agencies, respectively (for many of these titles, individual positions within the same job title are used in a wide variety of ways, making it impracticable to gather salary data and complete an effective analysis);
Certain job classes within the following agencies: DESE, Higher Education, DPS/Missouri State Highway Patrol, MODOT, and the State Public Defender’s Office. A comprehensive evaluation of all statewide job titles was not feasible due to financial limits.

IV. Compensation Study Results
18
Exhibits 6A–6E summarize the Exhibit 5A analysis by different criteria. Exhibit 6A displays the summary information by department.4 The table below provides a succinct view of the number of employees below the minimums and above the maximums of the proposed pay ranges, as well as analysis of these figures as a percentage of the broader department population. Exhibit 6B provides similar analysis with the addition of division summary data. Exhibits 6C–6E display summary data reported by job for the entire State, job summary information by department, and job information by division, respectively.
Exhibit 6A - Department Summary Analysis
Department Count Total Payroll
Count Below
Min
Salary Dollars
Below Min
Below Min as a
% of Total
Payroll
Count Above
Max
Salary Dollars
Above Max
Above Max as
a % of Total
Payroll
DEPT OF CORRECTIONS 10,791 355,430,956 1,194 3,983,594 1.1% 117 135,659 0.0%
DEPT OF SOCIAL SERVICES 6,575 227,503,531 1,150 2,464,651 1.1% 5 75,185 0.0%
DEPT OF MENTAL HEALTH 6,453 227,352,330 639 1,754,119 0.8% 57 123,957 0.1%
MO DEPT. OF TRANSPORTATION 2,934 117,162,833 8 2,716 0.0% 12 29,597 0.0%
DEPT OF PUBLIC SAFETY 2,480 87,249,045 212 421,861 0.5% 13 22,527 0.0%
OFFICE ADMINISTRATION 1,685 77,412,038 435 1,079,021 1.4% 11 15,716 0.0%
DEPT OF HEALTH & SENIOR SVS. 1,682 70,887,949 452 1,842,217 2.6% 1 1,318 0.0%
DEPT OF NATURAL RESOURCES 1,398 57,969,687 393 816,218 1.4% 9 26,055 0.0%
DEPARTMENT OF REVENUE 989 31,923,306 89 181,729 0.6% 2 3,692 0.0%
DEPT OF ECONOMIC DEVELOP 714 31,719,813 216 370,743 1.2% 5 17,798 0.1%
DEPT LABOR & INDUSTRIAL REL 646 24,633,038 58 231,784 0.9% 8 12,067 0.0%
DEPT ELEM & SEC EDUCATION 406 12,588,553 26 41,956 0.3% 9 14,541 0.1%
PUBLIC DEFENDER 362 20,682,107 0 0 0.0% 0 0 0.0%
DEPT OF AGRICULTURE 315 13,218,668 74 266,637 2.0% 6 3,351 0.0%
DIFP 256 10,240,297 40 121,584 1.2% 2 42,743 0.4%
MO LOTTERY COMMISSION 148 6,401,732 51 87,178 1.4% 1 2,505 0.0%
DEPT OF HIGHER EDUCATION 40 1,511,457 1 1,730 0.1% 3 7,131 0.5%
STATE TAX COMMISSION 32 1,441,674 12 22,651 1.6% 0 0 0.0%
Totals 37,906 1,375,329,015 5,050 13,690,388 1.0% 261 533,842 0.0%
4 Please note that in Exhibit 6A, and all other exhibits, decimals for numbers are not formatted to display, but they are present. As a result, rounding occurs.

IV. Compensation Study Results
19
D. Benefits Analysis
The table on the following page and in Exhibit 7 outlines the results of the benefits analysis among two different comparator groups. The first comparison assesses the market-competitive benefit levels provided by the broad labor market in comparison to those of the State. The second comparison displays data for state governments as reported in the NCASG survey where available. In some minor instances, the data for this second comparison were supplemented with broad labor market benefits data. CBIZ determined the market-competitive benefits value based on a combination of fixed dollar values and percentages of base salary. For some benefits, namely medical and medical-related benefits, it is most accurate to utilize a fixed cost per employee because the cost incurred by the organization typically does not depend on the salary level of the employee. For example, healthcare benefits provided to an executive and a clerk would be expected to cost the employer the same amount. Other benefits, including paid time off and retirement and savings, are most accurately represented as a percent of the incumbent’s base salary. The data points highlighted in yellow indicate whether the data point is assessed as a fixed cost or as a percentage. State benefits data, aggregated for State employees across multiple state agencies and covered under multiple medical and retirement plans, is displayed. Medical comparisons to the NCASG data in Exhibit 7 display an asterisk (*). This is because the NCASG data were not collected in a way that allowed CBIZ to draw a reliable comparison of medical benefits. Nevertheless, by using the NCASG data in a vacuum, some measure of comparison can be extrapolated. Specifically, the average employer share of medical premiums across participating states was 85.7%. The State’s reported employer share was 87.8%, so by this metric the State’s medical benefits are competitive. The NCASG also provides an average medical cost per employee, with $10,685 as the average among participating states. The State’s average cost was $9,279, which may indicate that the State is better at controlling plan costs, provides less medical plan coverage, or a combination of the two. The table then shows compa-ratios for how the State compares to the specific comparator group. The State’s compa-ratio for the fixed-cost per employee items and the items assessed as a percent of base salary is 91.66% and 178.73%, respectively, when compared to the broader market comparator group. For the state government comparator analysis, the fixed-cost analysis is excluded for the reasons mentioned above, and the compa-ratio for the percent of salary items is 91.24%. Overall, the analysis indicates that the State’s benefits program, when compared to the broader market, is competitive with medical benefits and substantially above market in other areas, primarily with paid time off and retirement benefits.

IV. Compensation Study Results
20
Exhibit 7 - Benefits Analysis Data
Average
Annual
Dollars/EE
Percent of
Payroll
Average
Annual
Dollars/EE
Percent of
Payroll
Average
Annual
Dollars/EE
Total Annual
Dollars/All EE
Percent of
Payroll
Average
Annual
Dollars/EE
Percent of
Payroll
Average
Annual
Dollars/EE
Percent of
Payroll
Payments for Time Not Worked 5,442 7.08% 7,109 11.71% 6,280 452,721,977 12.90% 182.25% 110.15%
Payments for Holidays 1,008 1.29% 2,015 4.15% 2,434 175,424,210 5.00%
Paid Time Off 1,524 1.92% 1,524 1.92% 1,024 73,801,972 2.10%
Payments for Vacations 1,565 2.00% 1,565 2.00% 1,690 121,830,283 3.47%
Sick Leave Pay 728 1.07% 1,388 2.84% 876 63,111,121 1.80%
Family and Medical Leave Pay 409 0.53% 409 0.53% 257 18,554,391 0.53%
Other 207 0.27% 207 0.27% 0 0 0.00%
Medical and Medically-Related Payments 7,494 9.61% * * 6,869 495,148,207 14.11% 91.66% *STD, Sickness or Accident Insurance 363 0.37% 363 0.37% 0 0 0.00%
LTD or Wage Continuation 142 0.16% 142 0.16% 130 9,364,140 0.27%
Medical Insurance Premiums 5,493 7.30% * * 5,776 416,387,008 11.87%
Dental Insurance Premiums 258 0.33% 258 0.33% 0 0 0.00%
Vision Care 8 0.00% 8 0.00% 0 0 0.00%
Retiree Medical Insurance Premiums 617 0.62% 617 0.62% 688 49,628,230 1.41%
Life Insurance and Death 99 0.16% 99 0.16% 96 6,890,721 0.20%
Prescription Drug Coverage 475 0.64% 475 0.64% 68 4,900,000 0.14%
Administration Costs 22 0.01% 22 0.01% 98 7,099,201 0.20%
Other (EAP, Other Emp Welfare) 17 0.02% 17 0.02% 12 878,907 0.03%
Retirement and Savings 5,329 6.69% 7,922 15.90% 6,276 452,387,091 12.89% 192.74% 81.08%
401(K) and Similar 1,350 1.70% 0 0 0.00%
Defined Benefit Pension Plan 2,898 2.97% 6,276 452,387,091 12.89%
Cash Balance or Other Hybrid Plan 21 0.03% 21 0.03% 0 0 0.00%
Administration Costs 115 0.14% 115 0.14% 0 0 0.00%
Profit-Sharing 18 0.02% 18 0.02% 0 0 0.00%
Stock Bonus/ESOP 396 1.16% 396 1.16% 0 0 0.00%
Other 531 0.67% 531 0.67% 0 0 0.00%
Miscellaneous Benefit Pay 546 0.67% 546 0.67% 6 398,815 0.01% 1.70% 1.70%
Severance Pay 85 0.09% 85 0.09% 0 0 0.00%
Dependent Care 18 0.02% 18 0.02% 0 0 0.00%
Employee Tuition Reimbursement 169 0.21% 169 0.21% 0 12,690 0.00%
Employee Relocation Reimbursement 202 0.28% 202 0.28% 5 386,125 0.01%
Other 71 0.07% 71 0.07% 0 0 0.00%
Total Highlighted $7,494 14.44% * 28.29% $6,869 1,400,656,090 25.81% 91.66% 178.73% * 91.24%
6,842 13.88%
Benefits
Average Market Data Average State Data Actual Missouri Benefits Compa-Ratios (Market) Compa-Ratios (State)
While a full pension analysis is outside the scope of this project, it came to CBIZ’s attention that the retirement plan vesting schedule was shifted from five years to ten years. The State is not the only state among the NCASG participants to offer ten-year vesting for retirement. However, the majority of states and the competitive labor market offer a shorter vesting period. The NCASG data reveal that the median time required to achieve full vesting is five years.

IV. Compensation Study Results
21
Finally, Exhibit 8 incorporates both actual and market data for base pay, total cash compensation, and benefits to provide a “Total Rewards” compa-ratio analysis. The MOSERS Retirement Plan is identified in the analysis to highlight that participants in the Missouri State Employees’ Plan 2011 (MSEP 2011) contribute 4% to the MOSERS trust fund. CBIZ used the broader market benefits data for purposes of the Total Rewards comparison. Exhibit 8 reveals the State’s compa-ratio for the respective compensation categories, including total compensation (i.e., the sum of total cash compensation and benefits). The State’s total compensation compa-ratio is 95.4%, which is approximately 4.6% below the market median.
E. Compression Analysis CBIZ’s primary emphasis was to assign market-competitive ranges. As a secondary consideration, the State may consider alleviating compression within grades. Compression exists when inexperienced employees within a grade are paid an identical or similar rate as those with greater tenure. Exhibit 9 provides an interactive tool that will allow the State to model different scenarios to identify and alleviate compression by identifying a budget and working backwards into a scenario that fits within a budget.
F. State Government Pay Ranking Analysis
The data on the following page, provided in more detail in Exhibit 10, illustrates the results of a ranking analysis conducted to assess the average annual pay of the State’s employees in comparison with other states. CBIZ determined the Average Annual Pay (AAP) of state employees, and then adjusted the results to a national scope by quantifying each state’s AAP with the respective state’s average cost of labor. The adjusted figure is listed as Adjusted Average Annual Pay (AAAP). Using this methodology, Iowa shows an AAP of $64,209, which ranks 7th nationally. The statewide cost of labor in Iowa is 91.13% of the national average. The Iowa AAAP is calculated by dividing $64,209 by 91.13%, resulting in an AAAP of $70,458. This creates a national level of pay number and provides an "apples to apples" comparison to other states. In the final AAAP, Iowa moves to the top of the list. Conversely, a state like Connecticut, which has a cost of labor above the national level at 110.9%, moves down in ranking from 3rd in AAP at $68,185 to 6th in AAAP at $61,484. In this analysis, Missouri ranked last in terms of both AAP and AAAP. CBIZ strongly cautions against basing decisions on this comparison alone. Average pay may be impacted more by staffing strategies than actual market competitiveness. For example, a state may contract with a services organization for cafeteria and custodial functions, thereby eliminating a

IV. Compensation Study Results
22
Exhibit 10 - State Governments Pay Ranking
State
Average Annual
Pay (AAP)
AAP
Rank
Adjusted Average
Annual Pay (AAAP)
AAAP
Rank State
Average Annual
Pay (AAP)
AAP
Rank
Adjusted Average
Annual Pay (AAAP)
AAAP
Rank
Iowa $64,209 7 $70,458 1 South Dakota $44,135 39 $51,614 26
California $75,229 1 $67,325 2 Utah $47,110 32 $51,023 27
Illinois $67,845 5 $65,343 3 New Mexico $46,367 36 $51,004 28
Rhode Island $67,177 6 $63,729 4 Maryland $54,221 17 $50,835 29
New York $68,173 4 $62,054 5 North Carolina $46,819 34 $50,441 30
Connecticut $68,185 3 $61,484 6 Alabama $45,830 37 $50,192 31
New Jersey $68,362 2 $59,972 7 North Dakota $47,477 30 $50,176 32
Ohio $57,914 11 $59,940 8 Arizona $46,797 35 $50,018 33
Massachusetts $63,849 8 $58,804 9 Texas $46,860 33 $49,457 34
Michigan $58,586 10 $58,110 10 Oklahoma $42,504 43 $49,268 35
Minnesota $57,107 12 $56,552 11 Arkansas $42,609 42 $49,202 36
Oregon $55,621 14 $56,143 12 Nebraska $43,646 40 $49,117 37
Alaska $63,074 9 $55,887 13 New Hampshire $49,497 23 $48,675 38
Wisconsin $54,457 16 $55,619 14 Tennessee $43,159 41 $48,330 39
Idaho $50,000 22 $55,599 15 Virginia $48,101 28 $47,414 40
Colorado $55,636 13 $55,398 16 Indiana $44,207 38 $46,914 41
Wyoming $50,750 21 $54,400 17 Kentucky $42,349 44 $46,768 42
Vermont $51,903 19 $54,145 18 Hawaii $48,377 27 $46,543 43
Montana $48,529 26 $53,748 19 Delaware $47,545 29 $46,286 44
Louisiana $48,695 25 $53,329 20 Mississippi $39,387 47 $45,445 45
Kansas $47,227 31 $52,352 21 Florida $40,875 45 $43,186 46
Maine $49,151 24 $52,311 22 West Virginia $38,102 49 $43,082 47
Nevada $53,823 18 $52,129 23 Georgia $40,562 46 $42,919 48
Washington $55,277 15 $51,986 24 South Carolina $38,979 48 $42,707 49
Pennsylvania $51,880 20 $51,958 25 Missouri $37,476 50 $39,682 50
significant portion of their lower-wage workforce and raising the average pay for the remaining employees. In addition, the State primarily competes against Missouri private industry and local governments for talent. The data used were sourced from the US Census Bureau’s Census of Governments. The data were last revised on April 26, 2016. Higher Education payroll was disregarded as higher education pay is often attributed to the caliber of local state universities and university administration rather than state government salary spending. Only Full Time Equivalent employees were considered in the analysis.

IV. Compensation Study Results
23
G. Financial Wellness
A recent study by PwC LLP shows that many Americans struggle with personal finance management, and that this difficulty affects these individuals’ health and workplace performance.5 While CBIZ did not perform an employee wellness survey for the State, CBIZ did perform a high-level review of the State’s employee wellness resources in light of the nation-wide challenges that, among other Americans, these employees confront. As part of that review, CBIZ assessed the State’s current wellness offerings. Exhibit 11 contains a summary of current prominent offerings and recommendations for improving the financial health of the State’s workforce.
5 PricewaterhouseCoopers Employee Financial Wellness Survey, April 2015.

V. Summary of Findings
24
The State’s average base salary compa-ratio is 89.6%. This indicates that on average base pay is approximately 10.4% below the recommended salary range midpoints, which approximates the published survey data market median.
There are many reasons that an individual employee’s pay may be above or below market median pay levels. New employees or poor performers should be paid below the market, while experienced employees with excellent performance should be paid well above the market.
As presented in Exhibits 5A–5C, the initial cost to implement the new structures would be approximately $13,690,388. This is the cost to bring all employees to the minimum of their respective proposed ranges and represents 1.0% of payroll.
The State’s benefits are above-market when compared to the broader labor market. However, these benefits do not overcome the deficiencies of below-market base pay and zero bonus opportunity.

VI. Recommendations
25
Increase the compensation of all employees to the minimum of their respective proposed salary ranges. The range minimum represents the level at which entry-level pay can be considered market-competitive.
Implementation of the compensation plan should occur uniformly across all positions. While different implementation scenarios may recognize budget constraints, partial or sporadic implementation can result in pay equity issues.
Update structures annually. In order to reduce the administrative burden associated with salary structure maintenance, CBIZ will provide update factors that will allow the State to update the recommended salary structures for five years after the study.
Temporarily freeze pay for employees above the maximum of their respective proposed grade. The pay freeze should remain in place until the point at which the range maximum surpasses actual pay.
Conduct a comprehensive market review every three to five years to ensure that the ranges remain market-competitive.
The State should reduce the ten-year vesting requirement because it is out of step with trends in the market. Specifically, most employers are shortening their vesting schedules; the millennial generation has shown a willingness to change jobs often and typically places a much higher value on benefits that vest quickly and are transportable. Additionally, the ten-year vesting creates a challenge in attracting “second career” employees, who may be deterred by the ten-year requirement.
Move away from steps to open ranges. Open ranges align with market norms, offer less administrative burden, and can even provide cost savings to the State. Step systems are a rigid, antiquated approach to compensation administration that offer limited flexibility and can be expensive due to rounding pay to the nearest step.
As reported in Exhibit 4, pay levels in different areas of the State vary dramatically. Current prohibitions on geographic differentials may result in over- or under-compensation in different locations. The State should remove this restriction.
We recommend that the State focus on the broader market data comparisons. Direct comparisons to pay at other states are provided in both Exhibit 1A and Exhibit 10 for information purposes.