compass-1 flight results flight results.… · a. scholz, f. könig, s. fröhlich, j. piepenbrock 1...
TRANSCRIPT

A. Scholz, F. König, S. Fröhlich, J. Piepenbrock 1 Flight Results of the COMPASS-1 Mission
Flight Results of the COMPASS-1 Mission
Artur Scholz1, Felix König2, Steve Fröhlich2, Johannes Piepenbrock2
1Department of Astronautics and Aeronautics, National Cheng Kung University, Taiwan 2Department of Aerospace Engineering, FH Aachen University of Applied Sciences, Germany
Abstract The mission of COMPASS-1 is to take pictures of the earth, to validate a GPS receiver from DLR (German Aerospace Center), and to verify the proper operation of the newly developed magnetic attitude control system in orbit. The spacecraft was launched at April 28, 2008 from the Indian space port Sriharikota, as part of the PSLV-C9 world record launch that simultaneously brought ten satellites into orbit. The first weeks of the mission operation was carried out from the affiliated ground stations in Aachen and Tainan. Arising difficulties in the communication link were overcome with the great support of individuals from the amateur radio community, who generously continued to support the mission. After almost nine month of mission operation, abundant housekeeping and mission data has been commanded, received and analyzed. Following the regular mission operations, the operation of the satellite will be opened to the public.
1. INTRODUCTION COMPASS-1 is the first satellite developed by the FH Aachen University of Applied Sciences in Germany (FHAC) [1]. Support was provided by the German Aerospace Center (DLR) and financial support came from the state of North-Rhine Westphalia (NRW). The entire life-cycle of the project was managed and carried out by students driven by their enthusiasm and interest for space technology and systems engineering. The project started in October 2003 and cumulated in the space-ready Flight Model in July 2007. The launch finally took place in April 2008. 1.1 Technical Objectives The COMPASS-1 mission is primarily a technology demonstration, driven by the needs to develop and verify novel miniaturized system solutions for the application in pico- and nanosatellites.
The technical objectives are: - earth observation with a miniature camera; - in-orbit qualification of DLR Phoenix GPS receiver; - Technology demonstration of newly developed
spacecraft bus, including a pure magnetic attitude control system, AFSK/MSK communication system operating in amateur frequency band, an Electrical Power System using Lithium-Polymer battery for power storage, and various other equipment.
The remote sensing objective of the mission was purposely chosen as it poses high requirements on the spacecraft bus, such as data handling capability, data transmission and attitude control. 1.2 Educational Objectives The main educational goal of this project is to provide valuable hands-on experience in the design and manufacturing of an entire satellite from begin to mission operation. This also includes the establishment

A. Scholz, F. König, S. Fröhlich, J. Piepenbrock 2 Flight Results of the COMPASS-1 Mission
of contacts to the industry, space organizations, the radio amateur community, and other CubeSat groups. 2. SPACE SEGMENT COMPASS-1 is built in accordance with the CubeSat standard [2] and makes extensive use of commercial off-the-shelf (COTS) components to reduce the costs of the spacecraft development. The dimensions of the satellite are 10x10x10 cm3 at a weight of less than one kilogram. During launch the satellite is carried in a dedicated launch container and deployed from it when the upper stage of the rocket reaches the destination orbit.
Figure 1: The COMPASS-1 Flight Model 2.1 Structure and Mechanisms (STR) The satellite structure is made by 5-axes machining of Al-6061 to ensure the required tolerances and offer a rigid housing for all other subsystems. The hard-anodized corner bars are the gliding guidance for the ejection from the storage container. These bars also include the shutdown switch mechanism. After ejection from the container, the contact closes the main power circuit causing the satellite to boot its system for operation. Another important mechanism is the deployment of the antennas following the separation from the launch container. This is achieved by melting of a nylon wire that holds the ends of the stowed
antennas together (see Figure 1). Once the wire is melt, the antennas release into their flight configuration. 2.2 Electrical Power System (EPS) A pair of solar cells is attached to each side of the cube, except at the front side, at which the antennas are located. The solar cells are high-efficient Gallium-Arsenide TJ cells donated by RWE Space Solar Power GmbH. All five strings are connected to the EPS board, which measures the currents delivered by each pair and connects them as parallel input to a dc-dc boost converter for direct energy transfer (DET) to the semi-regulated power bus. This power bus connects to the battery charger and to the voltage regulators. The battery charger takes care of recharging the two Lithium-Polymer accumulators, which are potted with epoxy into a solid aluminum box. The encapsulation was designed to minimize the expansion of the cell, which had been reported to have caused battery damages on other CubeSats [3]. The nominal operation of the EPS is to supply continues power to the satellite systems during all times of the mission. During eclipse, the satellite is solely powered from the batteries, whereas during sun times the solar cells recharge the batteries and supply the system with power. 2.3 Thermal Control System (TCS) The thermal control of the satellite components is mainly based on passive techniques. The main assumption for the design is that the temperature of the satellite would be rather too cold than too hot. Thus, care is taken to avoid any heat loss. The side panels are in black color to radiate heat into the inner side of the cube. The electronic boards inside the satellite only have limited conductive contact to the satellite structure to prevent cooling. The only component that was considered to generate excessive heat is the transceiver board. It is therefore thermally coupled with the battery box (which acts as a heat sink for it). Thermal analyses had shown that for the configuration of the satellite (see Figure 2) the temperatures in orbit would still be too low for the batteries. For this reason two heater foils are placed between the batteries, together with three temperature sensors. The control loop for this heating system had been implemented in the software of the EPS.

A. Scholz, F. König, S. Fröhlich, J. Piepenbrock 3 Flight Results of the COMPASS-1 Mission
Magnetic Coil
Transceiver Board
Modem Board
Battery BoxPower Board
GPSAttitude Control Board
Sun Sensor
Kill Switch
Command and Data Board
Dipole and Monopole Antennas
GPS Antenna
Access Port
Separation Spring
Figure 2: Configuration of the satellite 2.4 Communications System (COM) COMPASS-1 occupies frequencies in the 2m band for the uplink of commands (145.980 MHz) and in the 70cm band for the downlink of data and the beacon (437.405 MHz and 437.275 MHz respectively). A 50cm steel tape monopole antenna is used for the uplink and two 19cm dipole antennas are used for the downlink. A custom-built transceiver (Holger Eckardt, DF2FQ) is providing an output power of about 200mW for the beacon and about 870mW for the data. The uplink commands are encoded in a self-defined DTMF tone sequence and interpreted by the COM microcontroller. The CDHS system continuously checks the status of COM to look whether new commands from ground are available. Sending of the beacon is done via Morse code at a low speed to allow for direct interpretation at reception. The data on the other hand is encapsulated in Ax.25 packets and sent on AFSK 1k2 or MSK 4k8 depending on the on-board settings. 2.5 Command and Data Handling System (CDHS) The CDHS nominally controls the operation mode and monitors and stores the satellite’s health and system information. It interprets and executes the commands received from the ground station. The CDHS directly interfaces to the camera payload and stores the image
data, as well as the data gathered from the system monitoring in a non-volatile 32 Mbyte Flash memory. 2.6 Attitude Determination and Control System (ADCS) The ADCS uses five MOEMS sun sensors (developed by Denmark Technical University) and a COTS magnetometer for the determination of its attitude. The attitude is calculated from the vector measurements using a QUEST algorithm. The onboard software provides reference models for the sun-line and the earth magnetic field. These models are based on the satellite’s position, which is obtained via an on-board orbit propagator. The propagator takes as input the absolute time and orbit information, both of which must be uploaded to the satellite from ground. For the control of the satellite’s attitude three magnetic coils are employed, each placed along one of the three body axis. A LQR constant-coefficient controller is implemented, for which simulations have shown to achieve the desired nadir-pointing reference orientation for any initial orientation. Prior to the activation of the control mode, the satellite’s kinetic energy is reduced via a B-Dot controller. 3. GROUND SEGMENT For the operation of the satellite the primary ground station was established at the FH Aachen University of Applied Sciences. The radio shack consists of an ICOM IC-820H, IC-821H, and IC-910H and two PCs. The antenna set consists of four cross-Yagi antennas for UHF (receiving) and two cross-Yagi antennas for VHF (sending), both right turning polarized, controlled via an Egis Rotor with full horizontal coverage. For the secondary station FHAC partnered with the National Cheng Kung University in Tainan, Taiwan to make use of their already existing small ground station for amateur radio bands. The NCKU ground station consists of one Yagi antenna for UHF and one for VHF, and an IC-910 radio. For the tracking of the satellite and the antenna rotor control both stations use SATPC32 software from Erich Eichmann (DK1TB), which also adjusts the radios frequency to compensate the Doppler shift. In addition to the two ground stations, many private Ham radio stations joined as backup stations later on during the mission operation. The commands for the satellite are produced with a self made DMTF tone dialer from Mike Rupprecht (DK3WN), whereas the received packets are decoded by soundcard with MixW software and decoding software written by Mike Rupprecht.
A. Scholz, F. König, S. Fröhlich, J. Piepenbrock 4 Flight Results of the COMPASS-1 Mission
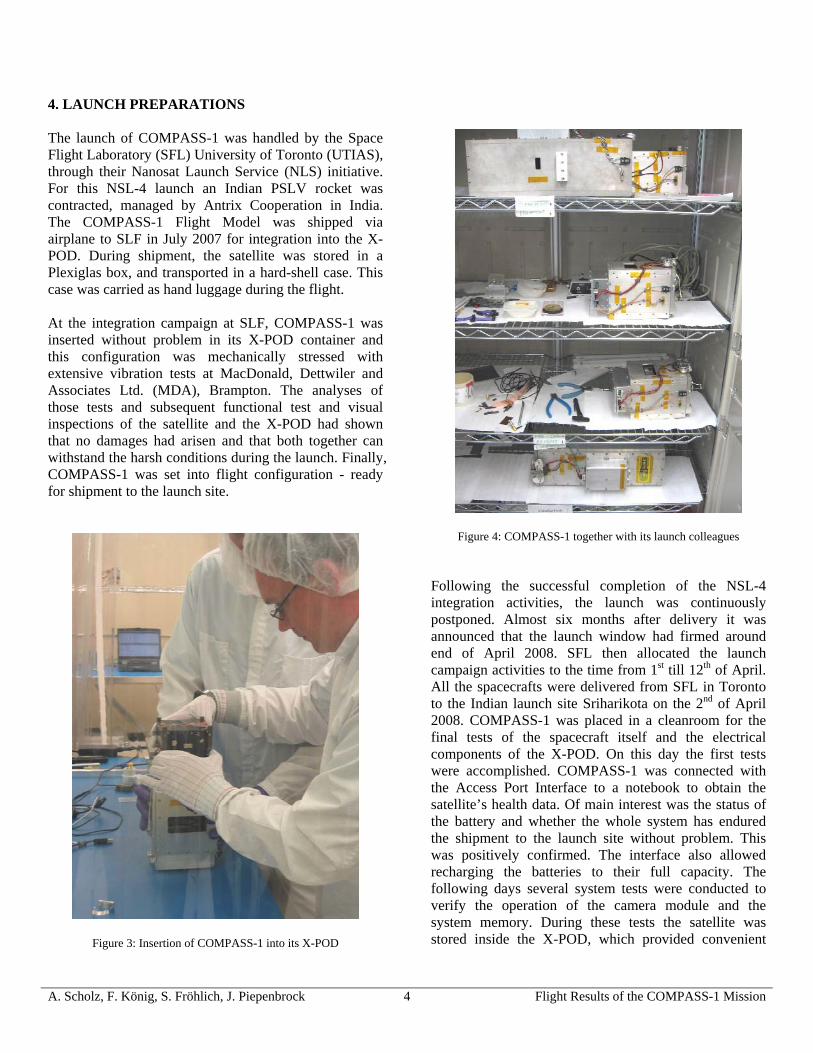
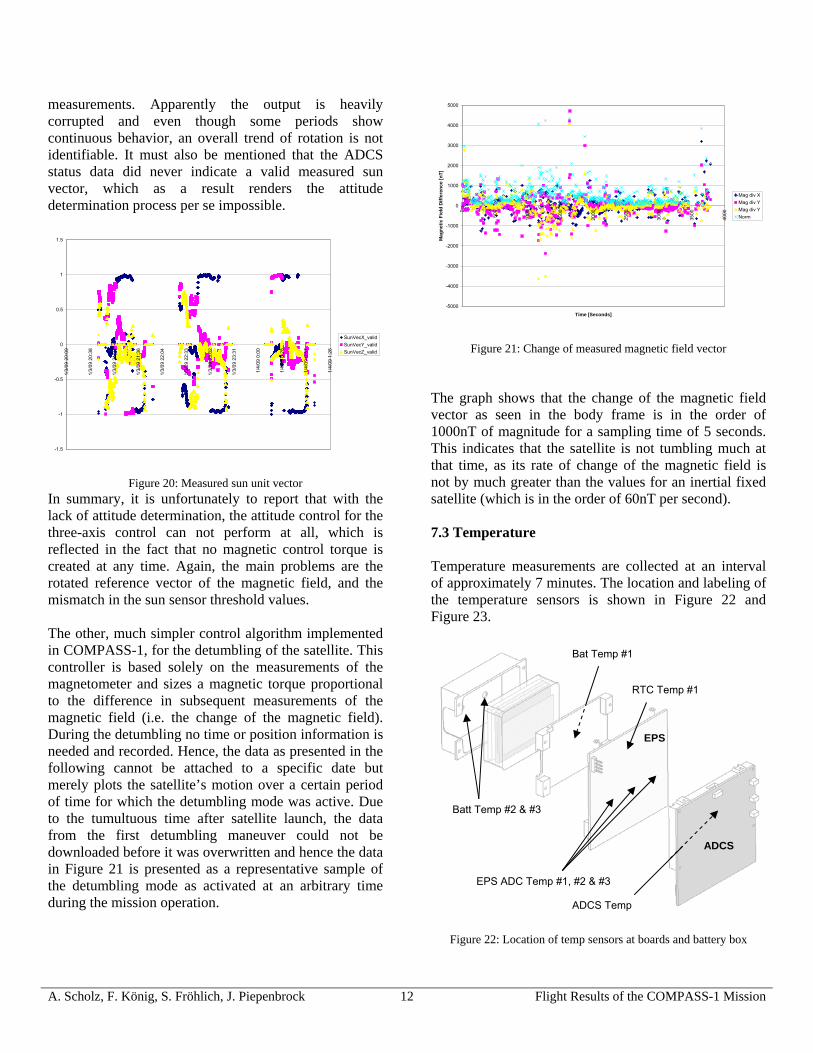
4. LAUNCH PREPARATIONS The launch of COMPASS-1 was handled by the Space Flight Laboratory (SFL) University of Toronto (UTIAS), through their Nanosat Launch Service (NLS) initiative. For this NSL-4 launch an Indian PSLV rocket was contracted, managed by Antrix Cooperation in India. The COMPASS-1 Flight Model was shipped via airplane to SLF in July 2007 for integration into the X-POD. During shipment, the satellite was stored in a Plexiglas box, and transported in a hard-shell case. This case was carried as hand luggage during the flight. At the integration campaign at SLF, COMPASS-1 was inserted without problem in its X-POD container and this configuration was mechanically stressed with extensive vibration tests at MacDonald, Dettwiler and Associates Ltd. (MDA), Brampton. The analyses of those tests and subsequent functional test and visual inspections of the satellite and the X-POD had shown that no damages had arisen and that both together can withstand the harsh conditions during the launch. Finally, COMPASS-1 was set into flight configuration - ready for shipment to the launch site.
Figure 3: Insertion of COMPASS-1 into its X-POD
Figure 4: COMPASS-1 together with its launch colleagues Following the successful completion of the NSL-4 integration activities, the launch was continuously postponed. Almost six months after delivery it was announced that the launch window had firmed around end of April 2008. SFL then allocated the launch campaign activities to the time from 1st till 12th of April. All the spacecrafts were delivered from SFL in Toronto to the Indian launch site Sriharikota on the 2nd of April 2008. COMPASS-1 was placed in a cleanroom for the final tests of the spacecraft itself and the electrical components of the X-POD. On this day the first tests were accomplished. COMPASS-1 was connected with the Access Port Interface to a notebook to obtain the satellite’s health data. Of main interest was the status of the battery and whether the whole system has endured the shipment to the launch site without problem. This was positively confirmed. The interface also allowed recharging the batteries to their full capacity. The following days several system tests were conducted to verify the operation of the camera module and the system memory. During these tests the satellite was stored inside the X-POD, which provided convenient

A. Scholz, F. König, S. Fröhlich, J. Piepenbrock 5 Flight Results of the COMPASS-1 Mission
access to the interface connector. Meetings took place about every second day for all the satellite teams, to clarify about the vibration behavior and the electrical components of each spacecraft, in order to ensure a faultless launch and orbit injection. The 12th of April 2008 was the last day to access the spacecraft. All tests were completed successfully, and so the COMPASS-1 personal left the launch site to join the team at home, eagerly awaiting the forthcoming launch.
Figure 5: PSLV-C9 upper stage with satellites 5. FLIGHT OPERATIONS 5.1 Launch and Early Operations (LEOP) The PSLV-C9 rocket successfully took off from its pad at 03:53 UTC on April 28, 2008. At 04:12 COMPASS-1 was ejected from its X-POD and subsequently went into boot mode of the system, which included a delay of 20 minutes in order to allow for separation of the satellites before antenna deployment and start of transmission.
The first contact was made by the CalPoly ground station about 30 minutes later when the satellite cluster group first passed over California, picking up a beacon that was quickly identified to belong to COMPASS-1. The first pass over Aachen occurred about 4.5 hours after the launch. The ground station successfully picked up the beacon and continued to do so for the subsequent two passes. Almost 9 hours after launch, the first pass took place over the Tainan ground station, which also clearly received and recorded the beacons. The first TLE (two-line elements) sets for this launch were published by NORAD on the next day Due to the small spatial distance between the satellites after injection into orbit it was a trial-and-error to find out which TLE set is associated to which satellite. Over time, the separation between the satellites increased, and after several days the unique element number could be addressed to COMPASS-1 (TLE 32788). According to the mission planning the housekeeping data should have been downloaded on the day following the launch. However, the satellite beacons indicated abnormalities in the power budget, which was soon confirmed when picking up emergency beacons during the passes on April 29. Apparently the heater system was active for almost all the time, which resulted in a negative power balance causing the batteries to run empty. The reason why the heater had this unexpected high duty ratio was that the temperature of the batteries constantly felt below zero degrees Celsius during eclipse and rising to less than 5 ºC in the sun phase. Once the problem was identified, recovery actions were carried out, which consisted mainly of an adjustment of the heater threshold values and a temporary rise of the powersafe mode threshold to recharge the batteries more quickly. There were big concerns about the survivability of the batteries when lowering the thresholds too much, as the datasheet would prohibit operation below zero degree. Former tests with the cells had however indicated that the cells worked well even in much lower temperature regions, and thus the thresholds were lowered on an iterative basis. Finally the settings completely disabled the use of the heater, which still resulted in an acceptable temperature region over an entire orbit; hence the heater was effectively rendered unnecessary. The days and weeks thereafter saw a stable satellite orbiting in space, but now the primary ground station was giving problems. The pickup of signals degraded quickly and command uplink almost never showed

A. Scholz, F. König, S. Fröhlich, J. Piepenbrock 6 Flight Results of the COMPASS-1 Mission
effect. Investigations had shown that the antenna cabling and the HPAs were the main source of the corrupted RF link. Unfortunately the backup station was also not able to uplink commands due to the extremely high noise and interference levels surrounding the station. As the uplink to the satellite from both stations was blocked, the beacons were the only data collected during the first six weeks. The beacons were analyzed and monitored carefully to observe the satellite’s well-being in orbit, while at the same time the primary ground station was repaired and additional help was sought. A great deal of help came from the local amateur radio community (DARC e.V. Distrikt Köln-Aachen), which supported in our attempt to repair the ground station. After a couple of unsuccessful tries and several weeks of problem searching, we got into contact with Mike Rupprecht (DK3WN), a private amateur radio operator. According to his assessment, our ground station was in a worse condition than expected. While he was always able to decode the data packets with an old self-made TNC (Terminal Node Controller), our brand-new off-the-shelf TNCs did not work at all for the received packets. That was so because the new models had a much narrower band for the decoding. Thus, in order to allow the decoding of packets independent of the TNCs hardware, we switched to PC based packet decoding, using the soundcard and the MixW software from Nick Fedoseev (UT2UZ) and Denis Nechitailov (UU9JDR), and a self written program from Mike Rupprecht which converts the raw data into the more useful KISS data file format. This approach was very successful and data rates up to 4800 kb/s were flawlessly decoded - the maximum transfer rate of COMPASS-1. This approach made it also more feasible for other amateur radio stations to join for the decoding of packets. With the MixW software an anomaly in the FSK signal was unveiled: COMPASS-1 was not encoding at its nominal frequencies. Somehow the modem oscillator must have been affected by the space conditions, which resulted in a shift of the mark and space frequencies. Nonetheless, the decoding of the packets was from then on highly successful. Many Ham radio operators joined the COMPASS-1 mission operation and uplinked commands and collected and shared received satellite data. In fact, the further mission progress was marked by the steady and enduring effort of these people. The partnership between the Aachen ground station and the Ham community ensured the continuous progress of the
mission, which might have been led to a premature end otherwise. 5.2 Power Problems and Recovery After numerous packets of mission data had been downloaded and the satellite had been commanded into different attitude control modes, a serious problem arouse in early August, which was triggered by a hard reset of the satellite system. It is still unclear what caused this reset but the tragedy was that the satellite’s parameters were completely reset as well, and hence the operation of the heater was activated again. This happened after a lengthy operation of the transceiver and at a time where the satellite was not observed for several hours, and led to a dramatic decrease of battery capacity. The satellite then entered emergency mode and remained there for several days. Here a major weak point of the system was revealed, because it was not possible to reset the heater activation during emergency mode (as this was handled by the CDHS, which was deactivated in this mode). Hence the only chance of rescue was to catch the short moment when the satellite comes out from eclipse (causing a switch into nominal mode) and before the heater would force the system again back into emergency mode. This left a window of a few minutes, where the appropriate commands must be sent by a ground station in view. Over fifty hams all over the world had been informed by Mike Rupprecht and were on stand-by for this operation. This strategy showed success. It is remarkable to report that an almost dead satellite had been brought back into nominal operation, by the use of the small chances that were left. Again, the importance of the Ham community support cannot be overemphasized. In the days thereafter the satellite was commanded into powersafe mode in order to let the batteries fully recharge. From end of August onwards the satellite operation continued smoothly. Beacons were picked up on a daily basis and the download of mission data and health data was significantly accelerated by switching from AFSK 1k2 into MSK 4k8 communication mode. 5.3 Sporadic Abnormal Phenomena Although the satellite operated nominally after the incident in August for almost all of the time, the same sporadic system reset happened again in October and November. Both cases were taken care of immediately and did not lead to a critical depletion of battery capacity.

A. Scholz, F. König, S. Fröhlich, J. Piepenbrock 7 Flight Results of the COMPASS-1 Mission
In late January 2009 however another strange phenomena was observed when the satellite apparently was not able to switch on its FM transmission link. The first belief was that a failure in the transmitter appeared but as the beacon was still working fine, this opinion was dropped. It was also noted that COMPASS-1 acknowledge the reception of commands, but still the FM channel kept silent. Finally, a hard-reset command was issued to the satellite, followed by the usual adjustment of the on-board settings. This resolved the problem and indicated that the software probably hung-up. 6. MISSION EVALUATION 6.1 Earth Observation Several images from the on-board camera located on the bottom panel of the cubic spacecraft have been received. Due to the strong illumination conditions in space, the automatic exposure (AE) of the camera is unfortunately not able to adjust the exposure time to a level that would yield an acceptable image of the earth. The camera system had been equipped with a neutral density (gray) filter and provided pictures of satisfactorily quality on ground. Assumingly the operation of the camera module in space requires a longer duration for the AE loop, which had not been accounted for in the flight software. Nonetheless, contours of clouds are observable on some pictures. Also the enfolded monopole antenna can be seen in some of the images.
Figure 6: Images as obtained by the on-board camera
6.2 GPS Payload The GPS receiver was activated several times. The receiver initializes and operates without malfunction but fails to establish contact to any GPS satellites. The problem is traced back to an improper integration of the patch antenna at the front panel that, combined with a mismatch in the antenna connection, causes a severe limitation of the antennas field of view such that a link cannot be established. The problems of the integration of the patch antenna into the COMPASS-1 CubeSat had have regrettably rendered the evaluation of the GPS unfeasible. 6.3 Spacecraft Bus Performance In general, all the spacecraft bus has been verified to operate satisfactorily in space. No single-point failure or malfunction appeared that resulted in a significant degradation of the mission operation. This is particularly a great success, as most of the systems are engineered with COTS components, which were designed for use in terrestrial applications, most dominantly in industrial applications. The testing campaign of COMPASS-1 (conducted in the design and development phase) was comprised of vibration testing, vacuum testing and thermal testing, and had verified the components survivability to the tested environmental conditions. The fact that the satellite up to present still operates nominally, verifies that the spacecraft is well suitable for low earth orbit missions. In particular, the use of a total of eight 8051 microcontrollers (on CDHS, EPS, COM and each sun sensor), a HCS12 microcontroller (on ADCS), Flash memory for data storage, a FIFO buffer for images, a real-time clock IC, Lithium-Polymer batteries and associated charger and power converter ICs, and many other COTS parts was confirmed a success. The transceiver (developed by DF2FQ), which carried some heritage from previous amateur satellite missions, provided performance precisely to specification. The space-qualified solar cells from RWE also performed as expected. The differences in measured solar current output for different cells as discussed in the following section are attributed solely to not well-calibrated measurements sensors. The MOEMS sun sensors from DTU were confirmed to operate successfully during pre-flight calibration with the solar simulator at FHAC. Unfortunately however, a mismatch in the expected solar flux for calibration had led to problems of in-flight use

A. Scholz, F. König, S. Fröhlich, J. Piepenbrock 8 Flight Results of the COMPASS-1 Mission
of the sun sensors, which is a result of the fixed value threshold programmed in the ADCS flight software. Also the self-made magnetic coils, monopole and dipole antennas, battery casing, structural parts, and electronic boards were confirmed to operate well in space. 7. MISSION DATA ANALYSIS Telemetry of the satellite’s health is recorded by the CDHS at intervals of approximately 7 minutes. The allocated 80 Kbyte memory block for health data allows for a continuous recording of almost forty hours until a download of the data becomes necessary. The large interval between the recordings allows to compactly store data over a long duration and results in qualitative diagrams of the satellites’ health status over the course of the mission operation. The accumulation of downloaded data is illustrated in Figure 7. During the time from August to early September 2008 no system health data could be downloaded from the satellite for the reasons explained earlier. From then onwards the downloading of data became more routinely and continuous, which resulted in an almost linear accumulation of data. At around November, the downlink was switched to a higher transmission rate, observable as a buckling in the curve. The ADCS also continuously records information about the satellite. The interval of data recording is 10 or 2.5 seconds during sun time or detumbling, respectively. Naturally, the ADCS data is focused on attitude determination and control parameters, such as attitude sensor readings. However, also the temperatures of the ADCS board and the sun sensors are recorded, which are useful for a more quantitative evaluation of the satellites’ thermal behavior.
0
2000
4000
6000
8000
10000
12000
7/11/08 7/31/08 8/20/08 9/9/08 9/29/08 10/19/08 11/8/08 11/28/08 12/18/08 1/7/09 1/27/09
Date
Syst
em D
ata
Pake
ts
Figure 7: Accumulated system data
7.1 Power Measurements of the output voltages of the solar cell strings on side 2 to 5 are depictured in Figure 8. The voltage measurement sensor for the SC string on panel 6 was erroneous and did not deliver measurements. (See Figure 12 for the numeration of the side panels). For each string the output voltage measurements are fairly evenly distributed within the range from about 0.8 Volt (the diode forward voltage drop of the string) to about 5 Volt (the open circuit voltage of the string). This is so because the solar cells are body-mounted and are illuminated under minutely changing incident angles.
0
1
2
3
4
5
6
7/11/08 7/31/08 8/20/08 9/9/08 9/29/08 10/19/08 11/8/08 11/28/08 12/18/08 1/7/09 1/27/09
Date
Volta
ge [V
] SC Panel 2 VoltageSC Panel 3 VoltageSC Panel 4 VoltageSC Panel 5 Voltage
Figure 8: Solar cell voltages
0
100
200
300
400
500
600
7/11/08 7/31/08 8/20/08 9/9/08 9/29/08 10/19/08 11/8/08 11/28/08 12/18/08 1/7/09 1/27/09
Date
Cur
rent
[mA
] SC Panel 5 CurrentSC Panel 3 CurrentSC Panel 6 CurrentSC Panel 4 CurrentSC Panel 2 Current
Figure 9: Solar cell currents

A. Scholz, F. König, S. Fröhlich, J. Piepenbrock 9 Flight Results of the COMPASS-1 Mission
Figure 9 plots the current measurements for all solar cell strings over the mission time. What strikes the eye first is the high range of the SC string output on panel 3 and 5 (both reaching the maximum specified output current). The SC strings on panel 6 is in the mid range (about half the maximum current), whereas those on panel 4 and 2 have the lowest current output range (less than 50% of maximum). This is assumed to be caused by improper calibration. Shown next is the status of the battery over time. The battery voltage does not fall below 3.4 Volt in the diagram, since this is the threshold for the emergency mode during which no measurements are recorded. Hence, during nominal operation the battery voltage is in the range of 3.4 to 4.2 Volts. The output currents from the battery pack go up to approximately 330 mA, with a few peaks going up to more than 1 Ampere.
0
0.5
1
1.5
2
2.5
3
3.5
4
4.5
5
7/11/08 7/31/08 8/20/08 9/9/08 9/29/08 10/19/08 11/8/08 11/28/08 12/18/08 1/7/09 1/27/09
Date
Volta
ge [V
]
0
100
200
300
400
500
600
700
800
900
Cur
rent
[mA
]
Battery VoltsBattery Curr
Figure 10: Battery voltage and output currents
0
200
400
600
800
1000
1200
1400
1600
1800
7/11/08 7/31/08 8/20/08 9/9/08 9/29/08 10/19/08 11/8/08 11/28/08 12/18/08 1/7/09 1/27/09
Date
Cur
rent
[m
A]
3.3V line Curr5V line CurrUnreg line Curr
Figure 11: Supply currents
The supply currents on the other hand provide a better insight about where the electrical power is consumed. In Figure 11 the currents on the regulated 3.3 V and 5 V line, as well as on the unregulated supply is shown. The regulated supplies are used for the CDHS and ADCS, whereas the unregulated line is used for the supply of the power regulators for heater, EPS and COM. The consumption on the 3.3V supply remains evenly within a maximum of about 260mA, with an average consumption 76mA. The loads on the 5 Volt supply have an average of just 5.5mA, with peaks up to almost 1A. This is due to the fact this line is used for the attitude control actuators and the GPS system, both drawing high currents for short durations. Finally, the current on the unregulated supply (i.e. the loads from EPS, TCS and COM) are on an average of 160mA, with peaks up to 1.6A. Apparently these high currents are caused by the operation of the heaters, the FM transmission and beacon. 7.2 Attitude Determination and Control The objective of the ADCS is to align the satellite’s body axes (see Figure 12) with the orbit reference frame. Therefore the system must measure its current attitude and produce appropriate magnetic control moments if a deviation between actual orientation and reference orientation is detected. The following discussions on the attitude determination performance is using satellite attitude information data recorded between 3rd of January 2009, UTC 20:48 till 4th of January, UTC 01:07. The data from other dates lead to similar results.
Side 1 Side 2
Side 5
Side 3Side 4
X
Z
Y
Figure 12: Side panel numeration and body axes definition

A. Scholz, F. König, S. Fröhlich, J. Piepenbrock 10 Flight Results of the COMPASS-1 Mission
For the attitude determination, knowledge about the position of the satellite in its orbit is needed. This knowledge is generated from two pieces of information that are uploaded to the satellite and updated once in a while: the general orbit information (Kepler elements), and the actual time (in UTC). Figure 13 plots the on-board generated inertial position of the satellite during sun times for a selected time interval of about three orbits. The difference between the estimated and the real position coordinates are plotted in Figure 14, which shows that the errors are less than 100 km in magnitude for the second and third orbit in that plot. (Note that only during sunlit times data is available and plotted in the graph). This is an acceptable result given the limited accuracy of the on-board time-keeping and processing capabilities. However, for the first orbit in that plot the errors are too high and will result in a degraded accuracy of the attitude determination during that specific orbit.
-8000
-6000
-4000
-2000
0
2000
4000
6000
8000
1/3/
09 2
0:09
1/3/
09 2
0:38
1/3/
09 2
1:07
1/3/
09 2
1:36
1/3/
09 2
2:04
1/3/
09 2
2:33
1/3/
09 2
3:02
1/3/
09 2
3:31
1/4/
09 0
:00
1/4/
09 0
:28
1/4/
09 0
:57
1/4/
09 1
:26
Time [UTC]
Posi
tion
in E
CI [
km]
-10
-8
-6
-4
-2
0
2
4
6
8
Velo
city
in E
CI [
km/s
ec]
Inertial Position XInertial Position YInertial Position ZInertial Velocity XInertial Velocity YInertial Velocity Z
Figure 13: Output of the satellite’s orbit propagator
-500
-400
-300
-200
-100
0
100
200
300
400
500
1/3/
09 2
0:09
1/3/
09 2
0:38
1/3/
09 2
1:07
1/3/
09 2
1:36
1/3/
09 2
2:04
1/3/
09 2
2:33
1/3/
09 2
3:02
1/3/
09 2
3:31
1/4/
09 0
:00
1/4/
09 0
:28
1/4/
09 0
:57
1/4/
09 1
:26
Time [UTC]
Abs
olut
e Er
ror i
n Po
sitio
n [k
m]
∆X∆Y∆Z
Figure 14: Absolute errors of position determination
Since the satellite knows its orbital position quite well, the accuracy of the reference models for the sun vector and the magnetic field vector as seen in the orbit frame are subject mainly to the accuracy of the model itself. The implementation of the earth magnetic field model on COMPASS-1 comprises of the geomagnetic main field spherical harmonics expansion IGRF-10 and its secular variation to full degree and order (13 and 8, respectively) evaluated in 0.5° increments in longitude and latitude, stored in an on-board Flash memory. Figure 15 shows the on-board earth magnetic field unit vector, as generated from the stored look-up table. As a comparison figure 16 plots the same vector as generated by the STK software, by direct evaluation of a full order IGRF model. The striking difference is the apparent flip of the X axis, and the offset in the Y axis. The cause for this is unknown to the authors and might be explained as an erroneous rotation of the magnetic field model for 180º around the Z axis. Unfortunately this dooms the magnetometer useless for the attitude determination.
-1.5
-1
-0.5
0
0.5
1
1.5
1/3/
09 2
0:09
1/3/
09 2
0:38
1/3/
09 2
1:07
1/3/
09 2
1:36
1/3/
09 2
2:04
1/3/
09 2
2:33
1/3/
09 2
3:02
1/3/
09 2
3:31
1/4/
09 0
:00
1/4/
09 0
:28
1/4/
09 0
:57
1/4/
09 1
:26
Time [UTC]
Mag(o)_XMag(o)_YMag(o)_Z
Figure 15: On-board model of the earth magnetic field unit vector

A. Scholz, F. König, S. Fröhlich, J. Piepenbrock 11 Flight Results of the COMPASS-1 Mission
-1.5
-1
-0.5
0
0.5
1
1.5
1/3/
09 2
0:09
1/3/
09 2
0:38
1/3/
09 2
1:07
1/3/
09 2
1:36
1/3/
09 2
2:04
1/3/
09 2
2:33
1/3/
09 2
3:02
1/3/
09 2
3:31
1/4/
09 0
:00
1/4/
09 0
:28
1/4/
09 0
:57
1/4/
09 1
:26
Time [UTC]
Mag(o)_X (STK)Mag(o)_Y (STK)Mag(o)_Z (STK)
Figure 16: Full IGRF model of the earth magnetic field unit vector as
generated with STK The sun vector is more easily generated and follows directly from the knowledge about the earth’s orbital position (i.e. the time information), as the distance between earth and sun is by magnitudes greater than the distance of satellite to earth, and hence remains virtually constant at the time of interest. Figure 17 plots the on-orbit sun vector elements as compared to the generated sun vector using STK in Figure 18. Although the on-board model is greatly simplified, it agrees quite well with the more precise model.
-1
-0.8
-0.6
-0.4
-0.2
0
0.2
0.4
0.6
0.8
1
1/3/
09 2
0:09
1/3/
09 2
0:38
1/3/
09 2
1:07
1/3/
09 2
1:36
1/3/
09 2
2:04
1/3/
09 2
2:33
1/3/
09 2
3:02
1/3/
09 2
3:31
1/4/
09 0
:00
1/4/
09 0
:28
1/4/
09 0
:57
1/4/
09 1
:26
Time [UTC]
Sun(o)_XSun(o)_YSun(o)_Z
Figure 17: On-board model of the sun line unit vector
-1
-0.8
-0.6
-0.4
-0.2
0
0.2
0.4
0.6
0.8
1
1/3/
09 2
0:09
1/3/
09 2
0:38
1/3/
09 2
1:07
1/3/
09 2
1:36
1/3/
09 2
2:04
1/3/
09 2
2:33
1/3/
09 2
3:02
1/3/
09 2
3:31
1/4/
09 0
:00
1/4/
09 0
:28
1/4/
09 0
:57
1/4/
09 1
:26
Sun(o)_X (STK)Sun(o)_Y (STK)Sun(o)_Z (STK)
Figure 18: Sun-line unit vector as generated with STK The reference models provide vectors in the orbit frame, whereas the measurements from the sun sensors and the magnetometer are taken in the body frame. The QUEST algorithm aims to find the quaternion that rotates the measured vectors with the reference vectors, hence yielding the attitude of the satellite. The measurements of the magnetic field provided by the magnetometer are shown in Figure 19. Note that the measurements are already unitized and are corrected from predetermined offsets. The measurements look very reasonable and indicate a slow rotation (about 1 rotation per orbit) about the Z axis and nutations about the X and Y axes.
-1.2
-1
-0.8
-0.6
-0.4
-0.2
0
0.2
0.4
0.6
0.8
1/3/
09 2
0:09
1/3/
09 2
0:38
1/3/
09 2
1:07
1/3/
09 2
1:36
1/3/
09 2
2:04
1/3/
09 2
2:33
1/3/
09 2
3:02
1/3/
09 2
3:31
1/4/
09 0
:00
1/4/
09 0
:28
1/4/
09 0
:57
1/4/
09 1
:26
Mag(b)_XMag(b)_YMag(b)_Z
Figure 19: Measured earth magnetic field unit vector The sun vector as obtained from the five sun sensors (the sun sensor with highest output wins the voting) is shown in Figure 20. The data is taken from the raw
A. Scholz, F. König, S. Fröhlich, J. Piepenbrock 12 Flight Results of the COMPASS-1 Mission
measurements. Apparently the output is heavily corrupted and even though some periods show continuous behavior, an overall trend of rotation is not identifiable. It must also be mentioned that the ADCS status data did never indicate a valid measured sun vector, which as a result renders the attitude determination process per se impossible.
-1.5
-1
-0.5
0
0.5
1
1.5
1/3/
09 2
0:09
1/3/
09 2
0:38
1/3/
09 2
1:07
1/3/
09 2
1:36
1/3/
09 2
2:04
1/3/
09 2
2:33
1/3/
09 2
3:02
1/3/
09 2
3:31
1/4/
09 0
:00
1/4/
09 0
:28
1/4/
09 0
:57
1/4/
09 1
:26
SunVecX_validSunVecY_validSunVecZ_valid
Figure 20: Measured sun unit vector In summary, it is unfortunately to report that with the lack of attitude determination, the attitude control for the three-axis control can not perform at all, which is reflected in the fact that no magnetic control torque is created at any time. Again, the main problems are the rotated reference vector of the magnetic field, and the mismatch in the sun sensor threshold values. The other, much simpler control algorithm implemented in COMPASS-1, for the detumbling of the satellite. This controller is based solely on the measurements of the magnetometer and sizes a magnetic torque proportional to the difference in subsequent measurements of the magnetic field (i.e. the change of the magnetic field). During the detumbling no time or position information is needed and recorded. Hence, the data as presented in the following cannot be attached to a specific date but merely plots the satellite’s motion over a certain period of time for which the detumbling mode was active. Due to the tumultuous time after satellite launch, the data from the first detumbling maneuver could not be downloaded before it was overwritten and hence the data in Figure 21 is presented as a representative sample of the detumbling mode as activated at an arbitrary time during the mission operation.
-5000
-4000
-3000
-2000
-1000
0
1000
2000
3000
4000
5000
0
500
1000
1500
2000
2500
3000
3500
4000
Time [Seconds]
Mag
netic
Fie
ld D
iffer
ence
[nT]
Mag div XMag div YMag div YNorm
Figure 21: Change of measured magnetic field vector The graph shows that the change of the magnetic field vector as seen in the body frame is in the order of 1000nT of magnitude for a sampling time of 5 seconds. This indicates that the satellite is not tumbling much at that time, as its rate of change of the magnetic field is not by much greater than the values for an inertial fixed satellite (which is in the order of 60nT per second). 7.3 Temperature Temperature measurements are collected at an interval of approximately 7 minutes. The location and labeling of the temperature sensors is shown in Figure 22 and Figure 23.
Figure 22: Location of temp sensors at boards and battery box
EPS
ADCS
Batt Temp #2 & #3
Bat Temp #1
EPS ADC Temp #1, #2 & #3
RTC Temp #1
ADCS Temp
A. Scholz, F. König, S. Fröhlich, J. Piepenbrock 13 Flight Results of the COMPASS-1 Mission
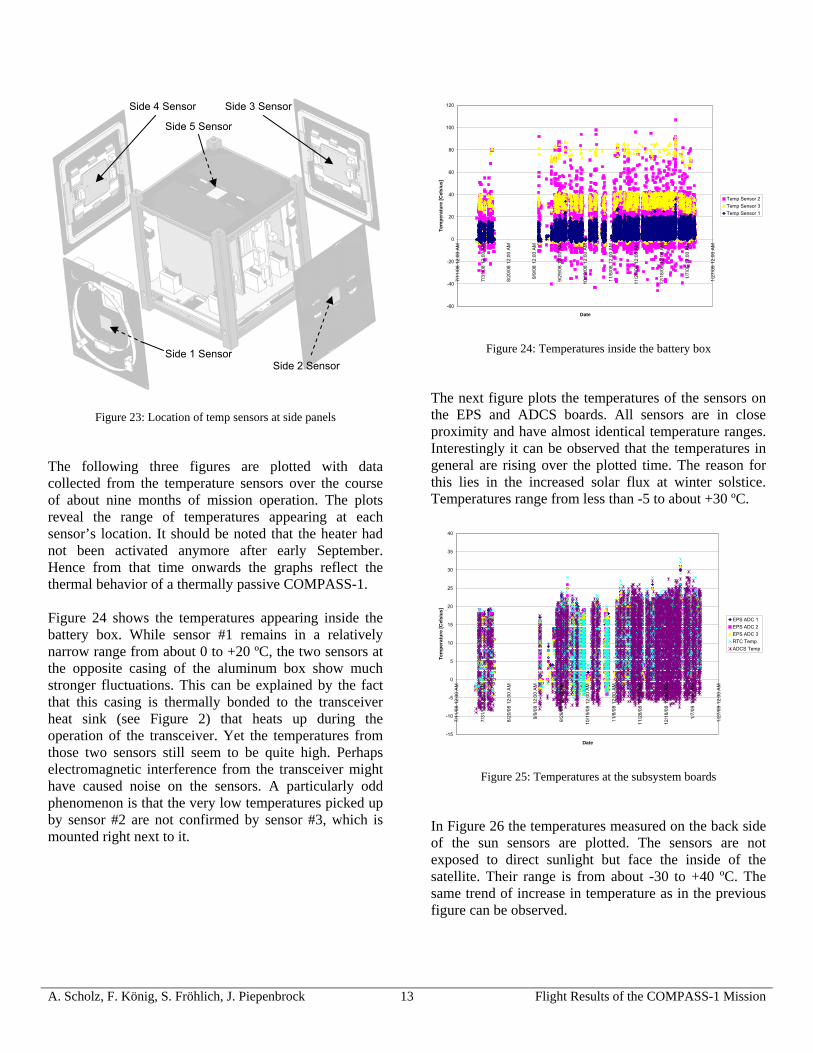
Figure 23: Location of temp sensors at side panels The following three figures are plotted with data collected from the temperature sensors over the course of about nine months of mission operation. The plots reveal the range of temperatures appearing at each sensor’s location. It should be noted that the heater had not been activated anymore after early September. Hence from that time onwards the graphs reflect the thermal behavior of a thermally passive COMPASS-1. Figure 24 shows the temperatures appearing inside the battery box. While sensor #1 remains in a relatively narrow range from about 0 to +20 ºC, the two sensors at the opposite casing of the aluminum box show much stronger fluctuations. This can be explained by the fact that this casing is thermally bonded to the transceiver heat sink (see Figure 2) that heats up during the operation of the transceiver. Yet the temperatures from those two sensors still seem to be quite high. Perhaps electromagnetic interference from the transceiver might have caused noise on the sensors. A particularly odd phenomenon is that the very low temperatures picked up by sensor #2 are not confirmed by sensor #3, which is mounted right next to it.
-60
-40
-20
0
20
40
60
80
100
120
7/11
/08
12:0
0 AM
7/31
/08
12:0
0 AM
8/20
/08
12:0
0 AM
9/9/
08 1
2:00
AM
9/29
/08
12:0
0 AM
10/1
9/08
12:
00 A
M
11/8
/08
12:0
0 AM
11/2
8/08
12:
00 A
M
12/1
8/08
12:
00 A
M
1/7/
09 1
2:00
AM
1/27
/09
12:0
0 AM
Date
Tem
pera
ture
[Cel
sius
]
Temp Sensor 2Temp Sensor 3Temp Sensor 1
Figure 24: Temperatures inside the battery box The next figure plots the temperatures of the sensors on the EPS and ADCS boards. All sensors are in close proximity and have almost identical temperature ranges. Interestingly it can be observed that the temperatures in general are rising over the plotted time. The reason for this lies in the increased solar flux at winter solstice. Temperatures range from less than -5 to about +30 ºC.
-15
-10
-5
0
5
10
15
20
25
30
35
40
7/11
/08
12:0
0 AM
7/31
/08
12:0
0 AM
8/20
/08
12:0
0 AM
9/9/
08 1
2:00
AM
9/29
/08
12:0
0 AM
10/1
9/08
12:
00 A
M
11/8
/08
12:0
0 AM
11/2
8/08
12:
00 A
M
12/1
8/08
12:
00 A
M
1/7/
09 1
2:00
AM
1/27
/09
12:0
0 AM
Date
Tem
pera
ture
[Cel
sius
]
EPS ADC 1EPS ADC 2EPS ADC 3RTC TempADCS Temp
Figure 25: Temperatures at the subsystem boards In Figure 26 the temperatures measured on the back side of the sun sensors are plotted. The sensors are not exposed to direct sunlight but face the inside of the satellite. Their range is from about -30 to +40 ºC. The same trend of increase in temperature as in the previous figure can be observed.
Side 3 Sensor Side 4 Sensor
Side 5 Sensor
Side 1 Sensor Side 2 Sensor

A. Scholz, F. König, S. Fröhlich, J. Piepenbrock 14 Flight Results of the COMPASS-1 Mission
-40
-20
0
20
40
60
80
100
7/11
/08
12:0
0 AM
7/31
/08
12:0
0 AM
8/20
/08
12:0
0 AM
9/9/
08 1
2:00
AM
9/29
/08
12:0
0 AM
10/1
9/08
12:
00 A
M
11/8
/08
12:0
0 AM
11/2
8/08
12:
00 A
M
12/1
8/08
12:
00 A
M
1/7/
09 1
2:00
AM
1/27
/09
12:0
0 AM
Date
Tem
pera
ture
[Cel
sius
]
X+ Panel TempY+ Panel TempX- Panel TempY- Panel TempZ- Panel Temp
Figure 26: Temperatures at the inside facing surface of the sun sensor
boards The ADCS system is also recording its temperature measurements of the ADCS board and at the sun sensor boards. The time step between each measurement is 10 seconds and so the plot in Figure 27 for the time interval of about three orbits provides a good insight into the thermal behavior during transitions from eclipse into sun.
-30
-20
-10
0
10
20
30
40
50
1/3/
09 2
0:09
1/3/
09 2
0:38
1/3/
09 2
1:07
1/3/
09 2
1:36
1/3/
09 2
2:04
1/3/
09 2
2:33
1/3/
09 2
3:02
1/3/
09 2
3:31
1/4/
09 0
:00
1/4/
09 0
:28
1/4/
09 0
:57
1/4/
09 1
:26
Time [UTC]
Tem
pera
ture
[Cel
sius
]
X+ Panel TemperatureY+ Panel TemperatureX- Panel TemperatureY- Panel TemperatureZ- Panel TemperatureADCS Temperature
Figure 27: Temperatures as measured by the ADCS during a period
of approximately three orbits. The temperatures in Figure 28 and Figure 29 were recorded during detumbling maneuvers at an interval of 5 seconds. The data is recorded continuously over a period of about 60 minutes. In both plots the transition from sunlight into eclipse is observable as an abrupt falling of the measured temperatures. It is also noticeable that the temperature decrease in eclipse is quite
homogenous for all side panels reaching a minimum of about -26 ºC, whereas the ADCS board preserves its temperature much better. Finally, at the end of the plot in Figure 28 it can be seen that the satellite is just entering the sun phase again.
-30
-20
-10
0
10
20
30
40
0 500 1000 1500 2000 2500 3000 3500 4000
Time [Seconds]
Tem
pera
ture
[Cel
sius
]
X+ Panel TemperatureY+ Panel TemperatureX- Panel TemperatureY- Panel TemperatureZ- Panel TemperatureADCS Temperature
Figure 28: Temperatures recorded during detumbling (#1)
-30
-20
-10
0
10
20
30
40
0 500 1000 1500 2000 2500 3000 3500 4000
Time [Seconds]
Tem
pera
ture
[Cel
sius
]
X+ Panel TemperatureY+ Panel TemperatureX- Panel TemperatureY- Panel TemperatureZ- Panel TemperatureADCS Temperature
Figure 29: Temperatures recorded during detumbling (#2) 8. SUMMARY AND CONCLUSIONS This paper gave a review on the COMPASS-1 picosatellite project of the FH Aachen University of Applied Sciences from mission goal statement until launch. The activities and events of the flight operation were outlined. The last part of this paper then presented the key findings obtained from the evaluation of the downloaded health and mission data. In summary the mission can be stated as a success, although not all objectives were accomplished.

A. Scholz, F. König, S. Fröhlich, J. Piepenbrock 15 Flight Results of the COMPASS-1 Mission
A number of recommendations can be made as a result from the problems that were faced during the mission operation. To make it short, it is important to have as much information about the satellite state available as possible. More sensors (e.g. for temperature) should have been implemented and carefully calibrated to produce reliable output. It would be also desirable to be able to adjust the measurement interval frequency, such as to be able to observe long-term and short-term behaviors in space. It cannot be overemphasized that intensive functional testing of the mission scenario prior to launch may reveal unthought-of weaknesses in the design, in particular the flight software. The heritage of the COMPASS-1 mission will hopefully be of meaning for future satellite mission at the FH Aachen University of Applied Sciences. In particular the infrastructure for the satellite design, development, and testing is a key ingredient for the autonomous in-house development of small satellites. ACKNOWLEDGMENTS The authors would like to acknowledge the great effort of all involved students over the course of the entire project. More than 30 students have worked on COMPASS-1, either as their study project, their diploma thesis, or completely voluntary in addition to their studies. We hope that all of them find their satisfaction in the knowledge that their effort is orbiting the space now for several years. The project received important technical and programmatic support from the professors and staff of the FH Aachen University of Applied Sciences. In particular we would like to mention the support and guidance from Prof. Wilfried Ley, Prof. Hans-Joachim Blome, Prof. Bernd Dachwald and Dipl.-Ing. Engelbert Plescher. Many thanks also go to Dipl.-Ing. Lutz Bernstein, Walter Nieren, Dipl.-Ing. Bela Kazay and M. Backhaus for their support in technical matters and/or the production of system prototypes. The authors are also very thankful to Prof. Jiun-Jih Miau and Prof. Jyh-Ching Juang from National Cheng Kung University for their kind support, such as the free use of the ground station. Partial funding and in particular valuable technical support in the form of review meetings and design recommendations came from the DLR German Space
Center. We are especially indebted and thankful to Prof. Klaus Wittmann and Dipl.-Ing. Christian Arbinger for their lasting interest and support of the mission. We are thankful beyond words to the many radio amateur operators that freely supported us in the mission operation phase. In fact, without their help we and COMPASS-1 would have surely been lost in the struggles that came up. Thanks go to the DARC Distrikt Aachen-Köln, namely Uli (KD2BJ), Norbert (DK5WO) and Karl-Heinz (DZ0KV). Special thanks must of course go to Mike Rupprecht! Without him we wouldn’t have our mission accomplished and we wouldn’t have got into contact with such an amount of private amateur radio controllers that all dedicated their free time to support the COMPASS-1 mission. Mike also developed all the controlling and analyzing programs for our ground station for a better operability, and even gave great support in the mission evaluation. His engagement also gave us encouragement to go further at times when we would have almost given up. The following is an incomplete list of the hams that gave us support during the mission: Mike Rupprecht (DK3WN), Alan Cresswell (ZL2BX), Bob DeVarney (W1ICW), Colin Hurst (VK5HI), Henk Hamoen (PA3GUO) and Robert Smith (NH7WN). Daily beacon and housekeeping data reporters were Toshio Kasei (JA1GDE), Iji Yoshitomo (JA6PL) and Tetsurou Satou (JA0CAW). Up to now we were able to take more than 30 pictures and collected over 800 files of housekeeping (HK) and extended housekeeping (XHK) data with their help. Thanks so much! REFERENCES [1] Ley, W., Plescher, E., Scholz, A., Piepenbrock, J.
COMPASS-1 Picosatellite Project. 6th IAA Symposium on Small Satellites for Earth Observation. Berlin, Germany, 2007.
[2] S. Lee, et al. CubeSat Design Specification (Rev.10). California Polytechnic State University, San Luis Obispo, 2007.
[3] Alminde, L., Bisgaard, M., Vinther, D., Viscor, T., and Østergaard, K. AAU-CubeSat Architectural Overview and Lessons Learned. IFAC, 2004. Proceedings of the 16th IFAC Symposium on Automatic Control in Aerospace, 2004, Sct. Petersburg, Russia.