comparisons of estimates of annual exceedance-probability
TRANSCRIPT

U.S. Department of the InteriorU.S. Geological Survey
Scientific Investigations Report 2015–5055
Prepared in cooperation with the Iowa Department of Transportation and the Iowa Highway Research Board (Project TR-678)
Comparisons of Estimates of Annual Exceedance-Probability Discharges for Small Drainage Basins in Iowa, Based on Data through Water Year 2013

Cover photograph: View looking northeast at West Branch at Parkside Drive bridge at Hoover Creek. Bridge is located about 0.25 miles downstream from streamgage Hoover Creek at Hoover National Historic Site at West Branch (05464942), Iowa. Photograph taken June 3, 2008; courtesy of National Park Service.
Comparisons of Estimates of Annual Exceedance-Probability Discharges for Small Drainage Basins in Iowa, Based on Data through Water Year 2013
By David A. Eash
Prepared in cooperation with the Iowa Department of Transportation and the Iowa Highway Research Board (Project TR-678)
Scientific Investigations Report 2015–5055
U.S. Department of the InteriorU.S. Geological Survey

U.S. Department of the InteriorSALLY JEWELL, Secretary
U.S. Geological SurveySuzette M. Kimball, Acting Director
U.S. Geological Survey, Reston, Virginia: 2015
For more information on the USGS—the Federal source for science about the Earth, its natural and living resources, natural hazards, and the environment—visit http://www.usgs.gov or call 1–888–ASK–USGS.
For an overview of USGS information products, including maps, imagery, and publications, visit http://www.usgs.gov/pubprod/.
Any use of trade, firm, or product names is for descriptive purposes only and does not imply endorsement by the U.S. Government.
Although this information product, for the most part, is in the public domain, it also may contain copyrighted materials as noted in the text. Permission to reproduce copyrighted items must be secured from the copyright owner.
Suggested citation:Eash, D.A., 2015, Comparisons of estimates of annual exceedance-probability discharges for small drainage basins in Iowa, based on data through water year 2013: U.S. Geological Survey Scientific Investigations Report 2015–5055, 37 p., http://dx.doi.org/10.3133/sir20155055.
ISBN 978-1-4113-3917-0ISSN 2328-031X (print)ISSN 2328-0328 (online)
iii
Acknowledgments
The author gratefully acknowledges Julie Kiang and Andrea Veilleux (U.S. Geological Survey) for their assistance in recommending the use of two evaluation metrics to compare estimates from annual exceedance-probability discharge methods and for their considerations of the evaluation results. The author also expresses gratitude to the many U.S. Geological Survey employees who assisted with the collection and analysis of flood data used in this report. The flood data often were collected during adverse conditions, and the efforts of these individuals made this report possible.
The information contained herein also is based on data collected by the U.S. Army Corps of Engi-neers, the National Weather Service, and several State and local agencies who were involved with the collection of flood data.

iv
Contents
Acknowledgments ........................................................................................................................................iiiAbstract ...........................................................................................................................................................1Introduction.....................................................................................................................................................2
Purpose and Scope ..............................................................................................................................2Description of Study Area ...................................................................................................................8
Methods of Estimation for Annual Exceedance-Probability Discharges .............................................8Expected Moments Algorithm/Multiple Grubbs-Beck Test Analysis Method ............................82013 Multivariable Regional-Regression Equations .....................................................................102013 Single-Variable Regional-Regression Equations ..................................................................101987 Single-Variable Regional-Regression Equations ..................................................................12TR-55 Rainfall-Runoff Model .............................................................................................................14Iowa Runoff Chart ...............................................................................................................................15
Comparisons of Estimates of Annual Exceedance-Probability Discharges .....................................15Drainage Basins with Areas less than 2 Square Miles ................................................................17
Evaluation of Comparisons of Estimates for Selected Annual Exceedance- Probability Discharges of 4, 2, and 1 percent ..........................................................17
Evaluation of Comparisons of Estimates for All Annual Exceedance-Probability Discharges ....................................................................................................................22
Drainage Basins with Areas Between 2 and 20 Square Miles ...................................................22Evaluation of Comparisons of Estimates for Selected Annual Exceedance-
Probability Discharges of 4, 2, and 1 percent ..........................................................23Evaluation of Comparisons of Estimates for All Annual Exceedance-Probability
Discharges ....................................................................................................................23Examination of the 1987 Single-Variable Regional-Regression Equations ........................................24
Use of Hydrologic Regions for the 1987 Single-Variable Regional-Regression Equations ................................................................................................................................24
Comparison of Annual Exceedance-Probability Discharges Estimated by Using the Expected Moments Algorithm/Multiple Grubbs-Beck Test Analysis Method, Based on Data through Water Years 2013 and 2010 ........................................................29
Comparisons of Regional-Regression Lines for 1-Percent Annual Exceedance- Probability Discharges .........................................................................................................30
Considerations for Flood-Estimation Studies .................................................................................32Summary........................................................................................................................................................34References Cited..........................................................................................................................................35

v
Figures 1. Map showing location of 2013 flood regions and U.S. Geological Survey
streamgages included in this study, Iowa ................................................................................3 2. Map showing location of landform regions in Iowa and U.S. Geological Survey
streamgages included in this study, Iowa ................................................................................9 3. Map showing location of 1987 hydrologic regions and U.S. Geological Survey
streamgages included in this study, Iowa ..............................................................................13 4. Graph showing relation between 1-percent annual exceedance-probability
discharges and drainage area less than or equal to 20 square miles for 1987 and 2013 single-variable regional-regression equations ............................................................31
5. Graph showing relation between 1-percent annual exceedance-probability discharges and all sizes of drainage area for 1987 and 2013 single-variable regional-regression equations .................................................................................................33
Tables 1. Data for streamgages in Iowa used for analysis in this study ..............................................4 2. Annual exceedance probability and equivalent flood-recurrence interval for
selected probabilities. ..................................................................................................................8 3. Estimates of annual exceedance-probability discharges for selected streamgages
in Iowa, based on data through water year 2013, using the expected moments algo-rithm/multiple Grubbs-Beck test (EMA/MGB) analysis method .........................................10
4. Estimates of annual exceedance-probability discharges for selected streamgages in Iowa, using 2013 multivariable regional-regression equations. .....................................10
5. Single-variable regression equations (2013) for estimating annual exceedance- probability discharges for unregulated streams in flood region 1, Iowa ..........................11
6. Single-variable regression equations (2013) for estimating annual exceedance- probability discharges for unregulated streams in flood region 2, Iowa ..........................11
7. Single-variable regression equations (2013) for estimating annual exceedance- probability discharges for unregulated streams in flood region 3, Iowa ..........................12
8. Estimates of annual exceedance-probability discharges for selected streamgages in Iowa, using 2013 single-variable regional-regression equations. .................................12
9. Estimates of annual exceedance-probability discharges for selected streamgages in Iowa, using 1987 single-variable regional-regression equations. .................................12
10. Estimates of annual exceedance-probability discharges for selected stream- gages in Iowa, using the WinTR-55 rainfall-runoff model. ..................................................14
11. Estimates of annual exceedance-probability discharges for selected streamgages in Iowa, using the Iowa Runoff Chart method ........................................................................16
12. Comparisons of mean percent relative errors for estimates of annual exceedance-probability discharge for drainage basins with areas less than 2 square miles, Iowa ..............................................................................................................................................18
13. Comparisons of mean ratios for estimates of annual exceedance-probability discharge for drainage basins with areas less than 2 square miles, Iowa ......................19
14. Comparisons of mean percent relative errors for estimates of annual exceedance-probability discharge for drainage basins with areas between 2 and 20 square miles, Iowa ...................................................................................................................................20

vi
15. Comparisons of mean ratios for estimates of annual exceedance-probability discharge for drainage basins with areas between 2 and 20 square miles, Iowa ..........21
16. Comparisons of mean percent relative errors for estimates of annual exceedance-probability discharge for drainage basins with areas less than 2 square miles that do not include the re-assignment of hydrologic regions or the use of a mixed landform calculation for the 1987 single-variable regional-regression equations ..........25
17. Comparisons of mean ratios for estimates of annual exceedance-probability discharge for drainage basins with areas less than 2 square miles that do not include the re-assignment of hydrologic regions or the use of a mixed landform calculation for the 1987 single-variable regional-regression equations ...........................26
18. Comparisons of mean percent relative errors for estimates of annual exceedance-probability discharge for drainage basins with areas between 2 and 20 square miles that do not include the re-assignment of hydrologic regions or the use of a mixed landform calculation for the 1987 single-variable regional-regression equations ..........27
19. Comparisons of mean ratios for estimates of annual exceedance-probability discharge for drainage basins with areas between 2 and 20 square miles that do not include the re-assignment of hydrologic regions or the use of a mixed landform calculation for the 1987 single-variable regional-regression equations ...........................28
20. Standard errors of estimate and average standard errors of prediction from 1987 and 2013 U.S. Geological Survey flood-estimation reports .................................................33
Conversion Factors
Inch/Pound to International System of Units
Multiply By To obtain
Length
foot (ft) 0.3048 meter (m)mile (mi) 1.609 kilometer (km)
Area
square mile (mi2) 2.590 square kilometer (km2)acre 4,047 square meter (m2)
Flow rate
cubic foot per second (ft3/s) 0.02832 cubic meter per second (m3/s)
Supplemental InformationWater year is the 12-month period from October 1 through September 30. The water year is designated by the calendar year in which the water year ends and includes 9 of the 12 months of that year. Thus, the water year ending September 30, 2013, is the “2013 water year.”
Slope; to convert Inch/Pound units to International System of units, multiply feet per mile (ft/mi) by 0.1894 to get meters per kilometer (m/km).
DatumHorizontal coordinate information is referenced to the North American Datum of 1983 (NAD 83).
Map projections are Universal Transverse Mercator, Zone 15.

vii
Abbreviations
1987 single-variable RREs
single-variable regional-regression equations from 1987 U.S. Geological Survey (USGS) report by Lara
2013 multivariable RREs
multivariable regional-regression equations from 2013 USGS report by Eash and others
2013 single-variable RREs
single-variable regional-regression equations from 2013 USGS report by Eash and others
AEP annual exceedance probabilityAEP1 AEP of 50 percentAEP2 AEP of 0.5 and 0.2 percentAEP5 AEPs of 20, 10, 4, 2, and 1 percentAEP6 AEPs of 50, 20, 10, 4, 2, and 1 percentAEPD annual exceedance-probability dischargeBSLDEM10M average basin slope calculated from 10-meter digital elevation model
(DEM)Bulletin 17B Bulletin 17B annual exceedance-probability analysis with standard
Grubbs-Beck low-outlier testCCM constant of channel maintenanceCN curve numberCSG crest-stage gageCSL100 stream slope calculated as entire LENGTH CSL1085LFP stream slope calculated as the change in elevation between points
located at 10 and 85 percent of the length along the longest flow path that was determined by geographic information system (GIS), then divided by the length between the points
DEM digital elevation modelDRNAREA GIS-determined drainage areaEMA/MGB expected moments algorithm annual exceedance-probability analysis
with multiple Grubbs-Beck low-outlier testGIS geographic information systemGLS generalized-least-squares regressionIowa DOT Iowa Department of TransportationIowa Runoff Chart method used in Iowa to estimate AEPDs for small basins IRC Iowa Runoff ChartLENGTH main-channel length as measured from basin outlet to basin divideLF land-use and slope-description factor for a watershedLog logarithm (base 10)mean ratio an evaluation metric that gives an indication of the degree of bias of
an AEPD-estimation methodMGB multiple Grubbs-Beck low-outlier testMPRE mean percent relative error, an evaluation metric that gives an
indication of the overall accuracy of an AEPD-estimation methodn number of streamgages in the comparison dataset

viii
NWIS National Water Information SystemOLS ordinary-least-squares regressionPseudo-R2 pseudo coefficient of determinationQ discharge, in cubic feet per secondQ50% annual exceedance-probability discharge of 50 percent (2-year
recurrence-interval flood discharge)Q20% annual exceedance-probability discharge of 20 percent (5-year
recurrence-interval flood discharge)Q10% annual exceedance-probability discharge of 10 percent (10-year
recurrence-interval flood discharge)Q4% annual exceedance-probability discharge of 4 percent (25-year
recurrence-interval flood discharge)Q2% annual exceedance-probability discharge of 2 percent (50-year
recurrence-interval flood discharge)Q1% annual exceedance-probability discharge of 1 percent (100-year
recurrence-interval flood discharge)Q0.5% annual exceedance-probability discharge of 0.5 percent (200-year
recurrence-interval flood discharge)Q0.2% annual exceedance-probability discharge of 0.2 percent (500-year
recurrence-interval flood discharge)RI recurrence intervalRMSE root mean square error, also referred to as SEEROWCROP percent of area of cultivated cropsRRE regional-regression equationSEE average standard error of estimate, also referred to as RMSESEP average standard error of predictionSLOP30 percent of area with slopes greater than 30 percentSOILASSURGO percent area underlain by hydrologic soil type ASOILBSSURGO percent area underlain by hydrologic soil type BSOILCSSURGO percent area underlain by hydrologic soil type CSOILDSSURGO percent area underlain by hydrologic soil type DStreamStats USGS Web-based GIS tool (http://water.usgs.gov/osw/streamstats/
index.html)STRMTOT total length of all mapped streams in basinTc time of concentrationTR-55 a single-event rainfall runoff model for small watersheds from the
Natural Resources Conservation ServiceUSDA U.S. Department of AgricultureUSGS U.S. Geological SurveyWIE weighted independent estimates

Abstract Traditionally, the Iowa Department of Transportation
has used the Iowa Runoff Chart and single-variable regional-regression equations (RREs) from a U.S. Geological Survey report (published in 1987) as the primary methods to estimate annual exceedance-probability discharge (AEPD) for small (20 square miles or less) drainage basins in Iowa. With the publication of new multi- and single-variable RREs by the U.S. Geological Survey (published in 2013), the Iowa Depart-ment of Transportation needs to determine which methods of AEPD estimation provide the best accuracy and the least bias for small drainage basins in Iowa. In response to this need, the U.S. Geological Survey, in cooperation with the Iowa Department of Transportation and the Iowa Highway Research Board, initiated a statewide study in 2014 to compare and evaluate AEPD estimates from five different AEPD-estimation methods.
Twenty five streamgages with drainage areas less than 2 square miles (mi2) and 55 streamgages with drainage areas between 2 and 20 mi2 were selected for the comparisons that used two evaluation metrics. Estimates of AEPDs calculated for the streamgages using the expected moments algorithm/multiple Grubbs-Beck test analysis method were compared to estimates of AEPDs calculated from the 2013 multivari-able RREs; the 2013 single-variable RREs; the 1987 single-variable RREs; the TR-55 rainfall-runoff model; and the Iowa Runoff Chart.
For the 25 streamgages with drainage areas less than 2 mi2, results of the comparisons indicate that estimates of AEPDs calculated from the 2013 multi- and single-variable RREs, the 1987 single-variable RREs, and the TR-55 method tend to overestimate AEPDs and that estimates calculated from the Iowa Runoff Chart method tend to primarily underestimate AEPDs. The comparisons seem to indicate the best overall accuracy and the least bias may be achieved by using the TR-55 method for flood regions 1 and 3 (published in 2013) and by using the 1987 single-variable RREs for flood region 2 (published in 2013).
For drainage basins with areas between 2 and 20 mi2, results of the comparisons indicate that estimates of AEPDs
from the 2013 multi- and single-variable RREs and the TR-55 method tend to overestimate AEPDs, and that estimates calcu-lated from the 1987 single-variable RREs tend to overestimate and underestimate AEPDs. The comparisons seem to indicate the best overall accuracy and the least bias may be achieved by using the 1987 single-variable RREs for the Southern Iowa Drift Plain landform region and for flood region 3 (published in 2013), by using the 2013 multivariable RREs for the Iowan Surface landform region, and by using the 2013 or 1987 sin-gle-variable RREs for flood region 2 (published in 2013). For all other landform or flood regions in Iowa, use of the 2013 single-variable RREs may provide the best overall accuracy and the least bias.
Comparison results seem to indicate that the best accu-racy and the least bias may be achieved by the use of different estimation methods of AEPD for different annual exceed-ance probabilities. The use of different estimation methods of AEPD for different annual exceedance probabilities is not appropriate because this approach could lead to inconsisten-cies with predictions of AEPDs. The number of streamgages included in the dataset comparisons range from 10 to 55. Information in this report needs to be used with caution because comparisons for datasets with a small number of streamgages provide limited information on the accuracy of the AEPD estimates for different AEPD-estimation methods. Thus, larger datasets may provide different results from those presented in this study.
An examination was conducted to understand why the 1987 single-variable RREs seem to provide better accu-racy and less bias than either of the 2013 multi- or single-variable RREs. The re-assignment of hydrologic regions for streamgages and the use of a mixed landform calculation for the 1987 single-variable RREs seem to have had no substantial effect regarding the relative accuracy and bias compared to the 2013 multi- or single-variable RREs for drainage basins with areas less than 20 mi2. Re-assignments of hydrologic regions defined in the 1987 U.S. Geological Survey report may be subjective for ungaged sites if users do not use a quantitative method to guide the re-assignment. A comparison of expected moments algorithm/multiple Grubbs-Beck estimates calcu-lated through the 2013 water year to those calculated through
Comparisons of Estimates of Annual Exceedance-Probability Discharges for Small Drainage Basins in Iowa, Based on Data through Water Year 2013
By David A. Eash

2 Comparisons of Estimates of Annual Exceedance-Probability Discharges for Small Drainage Basins in Iowa
the 2010 water year does not indicate a general increase or decrease in 2013 estimates when compared to 2010 estimates.
A comparison of 1-percent annual exceedance-probability regression lines for hydrologic regions 1–4 from the 1987 single-variable RREs and for flood regions 1–3 from the 2013 single-variable RREs indicates that the 1987 single-variable regional-regression lines generally have steeper slopes and lower discharges when compared to 2013 single-variable regional-regression lines for corresponding areas of Iowa. The combination of the definition of hydrologic regions, the lower discharges, and the steeper slopes of regression lines associ-ated with the 1987 single-variable RREs seem to provide bet-ter accuracy and less bias when compared to the 2013 multi- or single-variable RREs; better accuracy and less bias was determined particularly for drainage areas less than 2 mi2, and also for some drainage areas between 2 and 20 mi2. The 2013 multi- and single-variable RREs are considered to provide bet-ter accuracy and less bias for larger drainage areas.
Results of this study indicate that additional research is needed to address the curvilinear relation between drain-age area and AEPDs for areas of Iowa. The development of two sets of RREs for large and small drainage areas, and the development of a method to resolve the problem of transition-ing estimates of AEPDs between the two sets of RREs, may need to be reconsidered in future research for flood-estimation studies in Iowa.
IntroductionWith the publication of the U.S. Geological Survey
(USGS) annual exceedance-probability discharge (AEPD) estimation report, “Methods for Estimating Annual Exceed-ance-Probability Discharges for Streams in Iowa, Based on Data through Water Year 2010” (Eash and others, 2013) and with the implementation of regional-regression equations (RREs) from the report in Iowa StreamStats (U.S. Geological Survey, 2015a) in 2013, the Iowa Department of Transporta-tion (Iowa DOT) needs information on the relative accuracy and the amount of bias of AEPD-estimation methods that can be used for drainage basins with areas less than 2 square miles (mi2) and for drainage basins with areas between 2 and 20 mi2. The USGS StreamStats AEPD-estimation equations are appli-cable to drainage basins with areas as small as 0.05 to 0.08 mi2 depending on where an ungaged site is located in the three flood regions of Iowa (Eash and others, 2013). Traditionally, Iowa DOT has used the Iowa Runoff Chart method (Bureau of Public Roads, 1950) for drainage basins with areas less than 2 mi2. The RREs from the USGS report, “Method for Estimat-ing the Magnitude and Frequency of Floods at Ungaged Sites on Unregulated Rural Streams in Iowa” (Lara, 1987), have also been used by Iowa DOT as a primary AEPD-estimation method for small drainage basins in Iowa. In response to the need to determine which AEPD-estimation methods provide
the best estimates for small drainage basins in Iowa, the USGS, in cooperation with the Iowa DOT and the Iowa High-way Research Board, initiated a statewide study in 2014.
Purpose and Scope
This report presents two comparisons of estimates of AEPDs for small drainage basins in Iowa. First, AEPDs were estimated from five different AEPD-estimation methods for streamgages with drainage areas less than 2 mi2 and were compared to AEPDs that were estimated from observed data from the same streamgages using a streamgage probability-analysis method named the expected moments algorithm/multiple Grubbs-Beck test, hereafter referred to as the EMA/MGB analysis method (Cohn and others, 1997, 2001, 2013; Eash and others, 2013). The five AEPD-estimation methods include (1) StreamStats multivariable RREs from a 2013 USGS AEPD-estimation report (tables 9–11 in Eash and oth-ers, 2013), hereafter referred to as the 2013 multivariable RRE method; (2) single-variable RREs also from the 2013 USGS AEPD-estimation report (table 15 in Eash and others, 2013), hereafter referred to as the 2013 single-variable RRE method; (3) single-variable RREs from a 1987 USGS AEPD-estimation report (table 2 in Lara, 1987), hereafter referred to as the 1987 single-variable RRE method; (4) the TR-55 rainfall-runoff model (Natural Resources Conservation Service, 2009), and (5) the Iowa Runoff Chart method (Bureau of Public Roads, 1950).
Second, AEPDs estimated from four different AEPD-esti-mation methods for streamgages in Iowa with drainage areas between about 2 and 20 mi2 were compared to AEPDs that were estimated from observed data from the same streamgages using the EMA/MGB analysis method. With the exception of the Iowa Runoff Chart method, the four other AEPD-estima-tion methods included in the first set of comparisons also were included in the second set of comparisons for streamgages in Iowa with drainage areas between about 2 and 20 mi2.
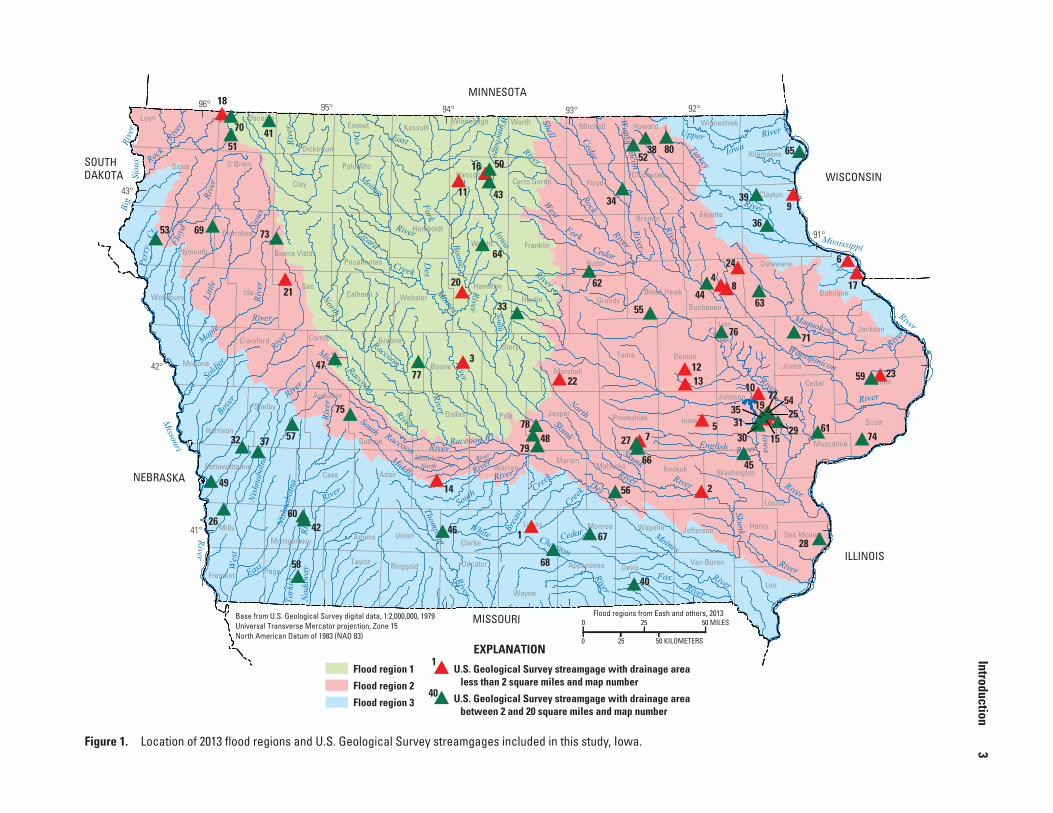
Streamgages listed in table 1 and shown in figure 1, that were used in this study, meet all USGS requirements for the EMA/MGB analysis method and data from these 80 streamgages were included in the development of the 2013 multi- and single-variable RREs. Of these 80 streamgages, 25 of them have drainage areas less than 2 mi2 and 55 of them have drainage areas between about 2 and 20 mi2.
Estimates of AEPDs were compared for eight selected flood-discharge estimates that have annual exceedance prob-abilities (AEPs) of 50, 20, 10, 4, 2, 1, 0.5, and 0.2 percent, which are equivalent to annual flood-frequency recurrence intervals (RIs) of 2, 5, 10, 25, 50, 100, 200, and 500 years, respectively (table 2); hereafter, these eight selected AEP sta-tistics are referred to as Q50-percent (%), Q20%, Q10%, Q4%, Q2%, Q1%, Q0.5%, and Q0.2%, respectively. Estimates of AEPDs for Q50%, Q0.5%, and Q0.2% are not applicable for the Iowa Runoff Chart method and estimates of AEPDs for Q0.5%, and Q0.2% are not applicable for the 1987 single-variable RREs.
Introduction
3
MISSOURI
WISCONSIN
MINNESOTA
ILLINOIS
NEBRASKA
SOUTH DAKOTA
Lyon Osceola
Dickinson
Emmet KossuthWinnebago Worth
Sioux O'Brien
Clay
Palo AltoHancock
Cerro Gordo
Plymouth
Cherokee
Buena VistaPocahontas
Humboldt
Wright Franklin
WebsterWoodburyIda
SacCalhoun
Hamilton
Hardin
Monona
Crawford Carroll Greene
Boone
Story
Harrison
ShelbyAudubon
Guthrie
Dallas Polk Jasper
Allamakee
WinneshiekHowardMitchell
ChickasawFloyd
Clayton
FayetteBremer
Butler
Dubuque
Delaware
Buchanan
Black HawkGrundy
Jackson
Jones
Linn
BentonTama
MarshallClintonCedar
Johnson
Poweshiek Iowa Scott
Muscatine
WashingtonKeokukMahaskaWarrenMarion
Louisa
HenryJefferson
Clarke
WapelloLucas MonroeDes Moines
Decatur DavisVan Buren
Wayne
Appanoose
Lee
PottawattamieCass Adair
Madison
Mills
Montgomery Adams Union
Fremont PageTaylor Ringgold
Rock
Rive
r
Rive
r Des East
MoinesRive
r
Siou
x
Perr
y Floy
d
Cr.
Littl
e
Rive
r
River
North
Maple
River
Middle
Raccoon
Missouri
Soldi
er
Boyer
River
RiverRiver
South
River
Nish
nabo
tna
Nish
nabo
tna
Wes
t
East
Tark
ioN
odaw
ayRi
ver
River
Raccoon
RiverSouth RaccoonMiddle
North
Thompson
River
South
White
River
Creek
Brea
st
Chariton
River
RiverRaccoon
River
R.
Des
Rive
rSi
oux
Big
Winnebago
Shell
River
Cedar
Wapsipinicon
Rock
Upper
Turkey
IowaRiver
RiverForkMoines
Boone
Iowa
River
West
ForkCedar
RiverRiver
River Mississippi
Rive
r
River
North
Skunk
SkunkRiver
Cedar
Creek
Des
River River
Moines
FoxRiver
River
River
Skunk
River
RiverEnglish
Iowa
Cedar
RiverRiver
Wapsipinicon
Maquoketa
River
River
River
Creek
Lizard
Base from U.S. Geological Survey digital data, 1:2,000,000, 1979Universal Transverse Mercator projection, Zone 15North American Datum of 1983 (NAD 83)
0 50 MILES25
0 50 KILOMETERS25 EXPLANATION
96° 95° 94° 93° 92°
91°
43°
42°
41°
Figure 1
Flood regions from Eash and others, 2013
o o
#
###
#
##
#
####
###
#
#
#
#
#
#
#
#
#
#
#
###
#
#
#
#
#
#
#
#
##
#
####### #
#
#
#
#
#
##
##
#
#
#
##
###
#
#
#
#
#
#
#
##
#
##
#
#
##
o o
#
#
18
70
51
6953 73
21
75
573732
49
2660
42
58
46
14
1
1
68
67
40
40
28
45
6174
59 23
71
63
76
10
353130 15
29
25
121322
55
66
56
27
7848
797
5
2
4777
3
33
62
34
5238 80 65
9
6
17
244
844
39
36
20
64
11 43
5016
41
547219
Flood region 1
Flood region 2
Flood region 3
U.S. Geological Survey streamgage with drainage area less than 2 square miles and map number
U.S. Geological Survey streamgage with drainage area between 2 and 20 square miles and map number
Figure 1. Location of 2013 flood regions and U.S. Geological Survey streamgages included in this study, Iowa.

4 Comparisons of Estimates of Annual Exceedance-Probability Discharges for Small Drainage Basins in Iowa
Map no. (fig. 1)
Streamgage number
Streamgage name
Type
of
stre
amga
ge
Syst
emat
ic p
eaks
in
EM
A/M
GB
an
alys
is (y
ears
)
His
tori
cal p
erio
d o
f EM
A/M
GB
an
alys
is
His
tori
cal p
erio
d le
ngth
of E
MA
/M
GB
ana
lysi
s (y
ears
)
Iow
a la
ndfo
rm
regi
on
Publ
ishe
d dr
ain-
age
area
(mi2 )
GIS
dra
inag
e ar
ea,
DRN
ARE
A (m
i2 )
Dra
inag
e ar
ea
used
for c
alcu
lat-
ing
AEP
est
imat
es
(mi2 )
LEN
GTH
(mi)
BSL
DEM
10M
(p
erce
nt)
ROW
CRO
P (p
erce
nt a
rea)
SOIL
ASS
URG
O
(per
cent
are
a)
SOIL
BSS
URG
O
(per
cent
are
a)
SOIL
CSSU
RGO
(p
erce
nt a
rea)
SOIL
DSS
URG
O
(per
cent
are
a)
CSL1
085L
FP
(ft/m
i)
CSL1
00 (f
t/mi)
SLO
P30
(p
erce
nt a
rea)
1 05487825 Little White Breast Creek Tributary near Chariton CSG 24 1990–2013 24 SIDP 0.05 0.05 0.05 0.255 4.200 0 0 0 92.952 7.105 137.097 125.433 02 05472555 Skunk River Tributary near Richland CSG 24 1990–2013 24 SIDP 0.18 0.18 0.18 0.666 3.903 78.235 0 82.009 17.967 0 85.415 77.657 03 05481528 Peas Creek Tributary at Boone CSG 13 1990–2003 14 DML 0.30 0.27 0.27 0.950 2.704 73.967 0 100 0 0 61.840 59.817 0.0144 05421100 Pine Creek Tributary near Winthrop CSG 62 1952–2013 62 IS 0.33 0.32 0.32 0.914 3.649 86.639 0 99.975 0 0 87.662 95.821 05 05454180 Clear Creek Tributary near Williamsburg CSG 24 1990–2013 24 SIDP 0.37 0.37 0.37 1.033 4.008 95.902 0 87.661 11.623 0 69.561 60.527 06 05414605 Bloody Run Tributary near Sherrill CSG 23 1991–2013 23 PP 0.59 0.59 0.59 1.038 7.017 23.115 0 99.978 0 0 92.068 114.329 07 05455350 South English River Tributary No. 2 near Montezuma CSG 28 1953–80 28 SIDP 0.52 0.64 0.64 1.311 1.549 94.961 0 64.526 35.462 0 32.554 31.656 08 05421300 Wapsipinicon Tributary at Winthrop CSG 58 1953–2012 60 IS 0.70 0.67 0.67 1.555 2.820 79.122 1.042 94.483 0 0 47.729 52.018 09 05389501 Mississippi River Tributary at McGregor CSG 23 1990–2013 24 PP 0.72 0.69 0.69 1.714 17.768 0 0 99.839 0 0 215.155 202.343 17.606
10 05453430 North Fork Tributary to Mill Creek near Solon CSG 17 1997–2013 17 IS 0.78 0.73 0.73 1.670 5.247 84.712 4.634 95.325 0 0 48.588 64.123 011 0548065350 Drainage Ditch 97 Tributary near Britt CSG 19 1991–2013 23 DML 0.94 0.92 0.92 2.436 1.764 93.583 0 99.996 0 0 32.570 33.370 012 05464535 Prairie Creek Tributary near Van Horne CSG 24 1990–2013 24 IS 0.94 0.94 0.94 1.594 2.366 77.383 0 99.641 0 0 41.208 32.789 013 05464562 Thunder Creek at Blairstown CSG 21 1977–2013 37 IS 0.96 0.96 0.96 1.507 3.981 69.131 2.287 97.609 0 0 53.777 62.335 014 05485940 Cedar Creek Tributary No. 2 near Winterset CSG 15 1990–2004 15 SIDP 1.02 0.99 0.99 1.524 1.111 82.126 0 69.209 30.787 0 26.774 21.767 015 05453900 Rapid Creek Tributary near Oasis CSG 42 1951–92 42 SIDP 0.97 1.01 1.01 2.004 5.879 89.657 0 99.051 0.303 0 52.111 45.002 016 05448600 East Branch Iowa River above Hayfield CSG 58 1953–2013 61 DML 2.23 1.54 1.54 2.214 1.288 90.537 16.004 81.133 2.763 0 12.625 14.689 017 05414600 Little Maquoketa River Tributary at Dubuque CSG 49 1951–2002 52 PP 1.54 1.54 1.54 2.749 14.128 7.089 0 99.413 0 0.472 102.236 124.949 4.77318 06483420 Schutte Creek near Sibley CSG 21 1952–73 22 NWIP 1.43 1.59 1.59 3.526 1.269 95.245 0 100 0 0 23.730 22.752 019 05453850 Rapid Creek Tributary No. 3 near Oasis CSG 39 1951–92 42 SIDP 1.62 1.63 1.63 2.267 7.707 41.298 0 97.350 2.477 0 41.023 49.899 020 05480993 Brewers Creek Tributary near Webster City CSG 24 1990–2013 24 DML 1.58 1.71 1.71 2.211 0.759 89.072 0 99.879 0 0 18.560 14.396 021 0660683710 Halfway Creek at Schaller CSG 24 1990–2013 24 NWIP 1.74 1.74 1.74 2.403 2.462 91.396 0 89.545 10.317 0 39.330 38.476 022 0547209280 Snipe Creek Tributary at Melbourne CSG 24 1977–2013 37 SIDP 1.61 1.76 1.76 2.096 3.760 85.689 0 97.074 0.929 1.549 47.326 38.811 023 05418645 Williams Creek near Charlotte CSG 19 1989–2013 25 ECIDP 1.77 1.77 1.77 1.884 6.163 90.724 0 98.663 1.043 0 43.794 61.317 024 05416200 Lamont Creek Tributary near Lamont CSG 20 1991–2013 23 IS 1.78 1.78 1.78 2.307 2.216 93.143 0.513 84.533 13.735 1.086 33.068 44.693 025 05453700 Rapid Creek Tributary No. 4 near Oasis CSG 24 1951–74 24 SIDP 1.95 1.94 1.94 2.327 4.772 83.564 0 99.563 0.311 0 26.777 31.338 026 06805849 Keg Creek Tributary near Mineola CSG 23 1991–2013 23 SIDP 2.01 2.07 2.07 2.208 11.378 68.268 0 99.512 0 0 91.775 117.899 0.01127 05455280 South English River Tributary near Barnes City CSG 23 1953–76 24 SIDP 2.51 2.36 2.36 2.532 3.097 86.636 0 71.174 25.265 3.553 39.980 32.489 028 05469350 Haight Creek at Kingston CSG 24 1990–2013 24 SIDP 2.67 2.57 2.57 2.780 8.817 33.588 0 52.466 46.880 0 72.270 71.203 0.63129 05464942 Hoover Creek at Hoover National Historic Site, West Branch CON 12 1967–2013 47 SIDP 2.58 2.59 2.59 3.822 5.870 61.097 0 97.074 2.645 0 25.254 29.592 030 05455010 South Branch Ralston Creek at Iowa City CON 17 1964–80 17 SIDP 2.94 2.94 2.94 4.100 5.873 18.833 0 99.835 0.082 0 22.218 34.050 031 05455000 Ralston Creek at Iowa City CON 58 1925–82 58 SIDP 3.01 3.11 3.11 4.419 8.925 16.321 0 99.834 0.118 0 30.354 34.868 0.05132 06610581 Mosquito Creek Tributary near Neola CSG 23 1979–2013 35 SIDP 3.22 3.24 3.24 3.617 8.371 89.417 0 99.446 0.269 0 43.665 64.487 0.04833 0545129280 Honey Creek Tributary near Radcliffe CSG 22 1991–2013 23 DML 3.29 3.40 3.40 4.140 1.983 89.988 0.036 99.848 0 0 16.027 15.983 034 545776680 Gizzard Creek Tributary near Bassett CSG 24 1990–2013 24 IS 3.42 3.47 3.47 4.694 1.564 72.352 1.151 98.593 0.246 0 16.981 17.014 035 05453950 Rapid Creek Tributary near Iowa City CSG 39 1951–92 42 SIDP 3.43 3.49 3.49 4.481 8.525 39.214 0 98.878 0.968 0 30.575 31.503 0.05436 05412030 French Hollow Creek near Elkader CSG 24 1990–2013 24 PP 3.56 3.50 3.50 3.887 12.457 14.355 0 92.406 7.457 0 73.433 112.079 1.31637 06807720 Middle Silver Creek near Avoca CSG 32 1953–86 34 SIDP 3.21 4.10 4.10 3.683 4.736 80.840 0 99.467 0 0 31.231 31.496 0
Table 1. Data for streamgages in Iowa used for analysis in this study.
[no. and No., number; EMA/MGB, expected moments algorithm/multiple Grubbs-Beck test; mi2, square miles; GIS, geographic information system; DRNAREA, geographic-information-system drainage area; AEP, annual exceedance probability; LENGTH, main-channel length as measured from the basin outlet to the basin divide; mi, mile; BSLDEM10M, average basin slope computed from 10-meter digital elevation model (DEM); ROWCROP, percent area of cultivated crops; SOILASSURGO, hydrologic soil type A; SOILBSSURGO, hydrologic soil type B; SOILCSSURGO, hydrologic soil type C; SOILDSSURGO, hydrologic soil type D; CSL1085LFP, stream slope computed as the change in elevation between points 10 and 85 percent of length along LENGTH divided by the length between the points; ft/mi, feet per mile; CSL100, stream slope computed as entire LENGTH; SLOP30, percent area with slopes greater than 30 percent; CSG, crest-stage gage; SIDP, Southern Iowa Drift Plain; DML, Des Moines Lobe; IS, Iowan Surface; PP, Paleozoic Plateau; NWIP, Northwest Iowa Plains; ECIDP, East-Central Iowa Drift Plain; CON, continuous-record streamgage; LH, Loess Hills]

Introduction 5
Map no. (fig. 1)
Streamgage number
Streamgage name
Type
of
stre
amga
ge
Syst
emat
ic p
eaks
in
EM
A/M
GB
an
alys
is (y
ears
)
His
tori
cal p
erio
d o
f EM
A/M
GB
an
alys
is
His
tori
cal p
erio
d le
ngth
of E
MA
/M
GB
ana
lysi
s (y
ears
)
Iow
a la
ndfo
rm
regi
on
Publ
ishe
d dr
ain-
age
area
(mi2 )
GIS
dra
inag
e ar
ea,
DRN
ARE
A (m
i2 )
Dra
inag
e ar
ea
used
for c
alcu
lat-
ing
AEP
est
imat
es
(mi2 )
LEN
GTH
(mi)
BSL
DEM
10M
(p
erce
nt)
ROW
CRO
P (p
erce
nt a
rea)
SOIL
ASS
URG
O
(per
cent
are
a)
SOIL
BSS
URG
O
(per
cent
are
a)
SOIL
CSSU
RGO
(p
erce
nt a
rea)
SOIL
DSS
URG
O
(per
cent
are
a)
CSL1
085L
FP
(ft/m
i)
CSL1
00 (f
t/mi)
SLO
P30
(p
erce
nt a
rea)
1 05487825 Little White Breast Creek Tributary near Chariton CSG 24 1990–2013 24 SIDP 0.05 0.05 0.05 0.255 4.200 0 0 0 92.952 7.105 137.097 125.433 02 05472555 Skunk River Tributary near Richland CSG 24 1990–2013 24 SIDP 0.18 0.18 0.18 0.666 3.903 78.235 0 82.009 17.967 0 85.415 77.657 03 05481528 Peas Creek Tributary at Boone CSG 13 1990–2003 14 DML 0.30 0.27 0.27 0.950 2.704 73.967 0 100 0 0 61.840 59.817 0.0144 05421100 Pine Creek Tributary near Winthrop CSG 62 1952–2013 62 IS 0.33 0.32 0.32 0.914 3.649 86.639 0 99.975 0 0 87.662 95.821 05 05454180 Clear Creek Tributary near Williamsburg CSG 24 1990–2013 24 SIDP 0.37 0.37 0.37 1.033 4.008 95.902 0 87.661 11.623 0 69.561 60.527 06 05414605 Bloody Run Tributary near Sherrill CSG 23 1991–2013 23 PP 0.59 0.59 0.59 1.038 7.017 23.115 0 99.978 0 0 92.068 114.329 07 05455350 South English River Tributary No. 2 near Montezuma CSG 28 1953–80 28 SIDP 0.52 0.64 0.64 1.311 1.549 94.961 0 64.526 35.462 0 32.554 31.656 08 05421300 Wapsipinicon Tributary at Winthrop CSG 58 1953–2012 60 IS 0.70 0.67 0.67 1.555 2.820 79.122 1.042 94.483 0 0 47.729 52.018 09 05389501 Mississippi River Tributary at McGregor CSG 23 1990–2013 24 PP 0.72 0.69 0.69 1.714 17.768 0 0 99.839 0 0 215.155 202.343 17.606
10 05453430 North Fork Tributary to Mill Creek near Solon CSG 17 1997–2013 17 IS 0.78 0.73 0.73 1.670 5.247 84.712 4.634 95.325 0 0 48.588 64.123 011 0548065350 Drainage Ditch 97 Tributary near Britt CSG 19 1991–2013 23 DML 0.94 0.92 0.92 2.436 1.764 93.583 0 99.996 0 0 32.570 33.370 012 05464535 Prairie Creek Tributary near Van Horne CSG 24 1990–2013 24 IS 0.94 0.94 0.94 1.594 2.366 77.383 0 99.641 0 0 41.208 32.789 013 05464562 Thunder Creek at Blairstown CSG 21 1977–2013 37 IS 0.96 0.96 0.96 1.507 3.981 69.131 2.287 97.609 0 0 53.777 62.335 014 05485940 Cedar Creek Tributary No. 2 near Winterset CSG 15 1990–2004 15 SIDP 1.02 0.99 0.99 1.524 1.111 82.126 0 69.209 30.787 0 26.774 21.767 015 05453900 Rapid Creek Tributary near Oasis CSG 42 1951–92 42 SIDP 0.97 1.01 1.01 2.004 5.879 89.657 0 99.051 0.303 0 52.111 45.002 016 05448600 East Branch Iowa River above Hayfield CSG 58 1953–2013 61 DML 2.23 1.54 1.54 2.214 1.288 90.537 16.004 81.133 2.763 0 12.625 14.689 017 05414600 Little Maquoketa River Tributary at Dubuque CSG 49 1951–2002 52 PP 1.54 1.54 1.54 2.749 14.128 7.089 0 99.413 0 0.472 102.236 124.949 4.77318 06483420 Schutte Creek near Sibley CSG 21 1952–73 22 NWIP 1.43 1.59 1.59 3.526 1.269 95.245 0 100 0 0 23.730 22.752 019 05453850 Rapid Creek Tributary No. 3 near Oasis CSG 39 1951–92 42 SIDP 1.62 1.63 1.63 2.267 7.707 41.298 0 97.350 2.477 0 41.023 49.899 020 05480993 Brewers Creek Tributary near Webster City CSG 24 1990–2013 24 DML 1.58 1.71 1.71 2.211 0.759 89.072 0 99.879 0 0 18.560 14.396 021 0660683710 Halfway Creek at Schaller CSG 24 1990–2013 24 NWIP 1.74 1.74 1.74 2.403 2.462 91.396 0 89.545 10.317 0 39.330 38.476 022 0547209280 Snipe Creek Tributary at Melbourne CSG 24 1977–2013 37 SIDP 1.61 1.76 1.76 2.096 3.760 85.689 0 97.074 0.929 1.549 47.326 38.811 023 05418645 Williams Creek near Charlotte CSG 19 1989–2013 25 ECIDP 1.77 1.77 1.77 1.884 6.163 90.724 0 98.663 1.043 0 43.794 61.317 024 05416200 Lamont Creek Tributary near Lamont CSG 20 1991–2013 23 IS 1.78 1.78 1.78 2.307 2.216 93.143 0.513 84.533 13.735 1.086 33.068 44.693 025 05453700 Rapid Creek Tributary No. 4 near Oasis CSG 24 1951–74 24 SIDP 1.95 1.94 1.94 2.327 4.772 83.564 0 99.563 0.311 0 26.777 31.338 026 06805849 Keg Creek Tributary near Mineola CSG 23 1991–2013 23 SIDP 2.01 2.07 2.07 2.208 11.378 68.268 0 99.512 0 0 91.775 117.899 0.01127 05455280 South English River Tributary near Barnes City CSG 23 1953–76 24 SIDP 2.51 2.36 2.36 2.532 3.097 86.636 0 71.174 25.265 3.553 39.980 32.489 028 05469350 Haight Creek at Kingston CSG 24 1990–2013 24 SIDP 2.67 2.57 2.57 2.780 8.817 33.588 0 52.466 46.880 0 72.270 71.203 0.63129 05464942 Hoover Creek at Hoover National Historic Site, West Branch CON 12 1967–2013 47 SIDP 2.58 2.59 2.59 3.822 5.870 61.097 0 97.074 2.645 0 25.254 29.592 030 05455010 South Branch Ralston Creek at Iowa City CON 17 1964–80 17 SIDP 2.94 2.94 2.94 4.100 5.873 18.833 0 99.835 0.082 0 22.218 34.050 031 05455000 Ralston Creek at Iowa City CON 58 1925–82 58 SIDP 3.01 3.11 3.11 4.419 8.925 16.321 0 99.834 0.118 0 30.354 34.868 0.05132 06610581 Mosquito Creek Tributary near Neola CSG 23 1979–2013 35 SIDP 3.22 3.24 3.24 3.617 8.371 89.417 0 99.446 0.269 0 43.665 64.487 0.04833 0545129280 Honey Creek Tributary near Radcliffe CSG 22 1991–2013 23 DML 3.29 3.40 3.40 4.140 1.983 89.988 0.036 99.848 0 0 16.027 15.983 034 545776680 Gizzard Creek Tributary near Bassett CSG 24 1990–2013 24 IS 3.42 3.47 3.47 4.694 1.564 72.352 1.151 98.593 0.246 0 16.981 17.014 035 05453950 Rapid Creek Tributary near Iowa City CSG 39 1951–92 42 SIDP 3.43 3.49 3.49 4.481 8.525 39.214 0 98.878 0.968 0 30.575 31.503 0.05436 05412030 French Hollow Creek near Elkader CSG 24 1990–2013 24 PP 3.56 3.50 3.50 3.887 12.457 14.355 0 92.406 7.457 0 73.433 112.079 1.31637 06807720 Middle Silver Creek near Avoca CSG 32 1953–86 34 SIDP 3.21 4.10 4.10 3.683 4.736 80.840 0 99.467 0 0 31.231 31.496 0

6 Comparisons of Estimates of Annual Exceedance-Probability Discharges for Small Drainage Basins in Iowa
Map no. (fig. 1)
Streamgage number
Streamgage name
Type
of
stre
amga
ge
Syst
emat
ic p
eaks
in
EM
A/M
GB
an
alys
is (y
ears
)
His
tori
cal p
erio
d o
f EM
A/M
GB
an
alys
is
His
tori
cal p
erio
d le
ngth
of E
MA
/M
GB
ana
lysi
s (y
ears
)
Iow
a la
ndfo
rm
regi
on
Publ
ishe
d dr
ain-
age
area
(mi2 )
GIS
dra
inag
e ar
ea,
DRN
ARE
A (m
i2 )
Dra
inag
e ar
ea
used
for c
alcu
lat-
ing
AEP
est
imat
es
(mi2 )
LEN
GTH
(mi)
BSL
DEM
10M
(p
erce
nt)
ROW
CRO
P (p
erce
nt a
rea)
SOIL
ASS
URG
O
(per
cent
are
a)
SOIL
BSS
URG
O
(per
cent
are
a)
SOIL
CSSU
RGO
(p
erce
nt a
rea)
SOIL
DSS
URG
O
(per
cent
are
a)
CSL1
085L
FP
(ft/m
i)
CSL1
00 (f
t/mi)
SLO
P30
(p
erce
nt a
rea)
38 05411650 Crane Creek Tributary near Saratoga CSG 23 1953–75 23 IS 4.06 4.13 4.13 3.638 1.850 89.282 0 46.901 53.037 0 18.232 22.863 039 05412060 Silver Creek near Luana, Iowa (L-23S) CON 11 1980–2003 24 PP 4.39 4.37 4.37 4.225 5.220 83.510 0.088 98.001 1.839 0 30.035 39.223 040 05495600 South Wyaconda River near West Grove CSG 23 1953–75 23 SIDP 4.69 4.57 4.57 4.436 3.176 44.932 0 7.913 43.409 46.984 24.532 20.776 041 06604584 Dry Run Creek near Harris CSG 19 1990–2013 24 DML 4.30 4.84 4.84 4.914 1.424 94.145 0.192 96.983 2.816 0 9.530 11.046 042 06811800 East Tarkio Creek near Stanton CSG 55 1958–2013 56 SIDP 4.66 5.02 5.02 4.973 5.024 88.668 0 81.948 3.204 14.682 18.155 22.217 043 05448900 East Branch Iowa River Tributary near Garner CSG 34 1952–86 35 DML 5.98 5.63 5.63 5.100 1.989 90.499 10.308 78.176 11.341 0 4.018 13.981 044 05420960 Harter Creek near Independence CSG 12 1952–63 12 IS 6.17 6.16 6.16 5.931 2.690 85.865 1.458 98.443 0 0 20.416 23.706 045 05455550 Bulgers Run near Riverside CSG 48 1965–2013 49 SIDP 6.31 6.31 6.31 6.162 6.616 45.912 0 86.498 13.138 0.315 20.411 23.326 046 06897858 Sevenmile Creek near Thayer CSG 19 1991–2013 23 SIDP 6.61 6.60 6.60 4.778 6.657 26.103 0 24.495 67.060 7.723 28.100 32.316 0.05047 05483349 Middle Raccoon River Tributary at Carroll CSG 47 1948–2013 66 SIDP 6.58 6.72 6.72 4.619 6.575 91.452 0.150 99.148 0.579 0 29.064 40.604 048 05487540 Walnut Creek near Prairie City CON 10 1996–2005 10 SIDP 6.78 6.77 6.77 3.925 4.379 83.793 0 92.020 7.582 0.230 31.781 33.070 049 06610500 Indian Creek at Council Bluffs CON 22 1942–2013 72 LH 7.99 6.95 6.95 5.719 12.331 17.437 0 98.537 0 0 34.045 47.529 0.81550 05448700 East Branch Iowa River near Hayfield CSG 37 1952–91 40 DML 7.94 7.34 7.34 6.278 1.404 91.397 6.056 87.170 6.747 0 6.706 8.555 051 06483450 Wagner Creek near Ashton CSG 22 1952–73 22 NWIP 7.09 7.35 7.35 6.385 1.421 91.053 0 99.823 0.193 0 15.000 14.202 052 05420620 Little Wapsipinicon River near Acme CSG 41 1953–93 41 IS 7.76 8.02 8.02 7.989 2.726 78.833 0.051 93.296 6.578 0 16.218 22.525 053 06599800 Perry Creek near Merrill CSG 56 1953–2013 61 NWIP 8.17 8.14 8.14 5.936 3.775 87.883 0 99.875 0 0 17.766 22.684 054 05453600 Rapid Creek below Morse CSG 40 1951–92 42 SIDP 8.12 8.21 8.21 5.152 5.797 73.396 0 99.450 0.346 0 17.034 23.824 055 05464025 Miller Creek near Eagle Center CSG 23 1990–2013 24 IS 9.14 8.75 8.75 5.307 2.505 92.816 0 99.017 0.840 0 16.041 18.924 056 05489150 Little Muchakinock Creek at Oskaloosa CSG 23 1966–88 23 SIDP 9.12 9.30 9.30 6.833 3.755 62.695 0 60.370 33.624 3.452 17.530 20.303 0.00557 0680737930 Elm Creek near Jacksonville CSG 23 1991–2013 23 SIDP 9.43 9.53 9.53 6.400 7.494 89.277 0 96.819 3.171 0 23.147 32.464 058 06811875 Snake Creek near Yorktown CSG 30 1966–2013 48 SIDP 9.10 9.59 9.59 6.648 6.549 68.126 0 76.498 21.179 1.810 20.290 27.532 0.00259 05421890 Silver Creek at Welton CSG 47 1966–2013 48 ECIDP 9.03 9.97 9.97 4.327 5.812 76.251 0 99.139 0.630 0 21.289 39.943 060 06811760 Tarkio River near Elliott CSG 59 1952–2013 62 SIDP 10.70 10.68 10.70 8.955 4.197 88.371 0 93.498 2.613 3.789 14.156 13.756 061 05464880 Otter Creek at Wilton CSG 27 1966–93 28 SIDP 10.70 10.76 10.80 7.997 4.055 83.416 0.137 99.151 0.684 0 11.487 13.736 062 05462750 Beaver Creek Tributary near Aplington CSG 26 1966–91 26 IS 11.60 11.07 11.10 6.664 2.359 89.023 0.160 99.822 0 0 15.898 21.564 063 05416972 Sand Creek near Manchester CSG 23 1991–2013 23 IS 11.00 11.07 11.10 6.939 2.924 92.332 1.537 92.661 1.714 4.044 16.675 24.884 064 05480930 White Fox Creek at Clarion CSG 47 1966–2013 48 DML 13.30 11.37 11.40 7.264 2.201 83.110 0.946 91.782 2.568 0 11.041 13.775 065 05388400 Wexford Creek near Harpers Ferry CSG 35 1953–89 37 PP 11.90 11.42 11.40 7.223 14.777 18.171 0.346 79.272 19.771 0.558 69.071 77.884 12.21966 05455300 South English River near Barnes City CSG 35 1953–88 36 SIDP 11.50 12.05 12.10 7.821 3.828 80.890 0.006 73.718 23.281 2.822 12.551 15.886 067 05488620 Coal Creek near Albia CSG 26 1951–92 42 SIDP 13.50 13.27 13.30 7.065 8.800 19.521 0 16.019 65.509 17.532 19.034 27.889 0.03968 06903500 Honey Creek near Russell CON 11 1952–62 11 SIDP 13.20 13.30 13.30 9.209 5.834 40.999 0 1.850 86.501 10.407 10.358 14.034 069 06601480 Big Whiskey Slough near Remsen CSG 28 1967–98 32 NWIP 12.90 13.45 13.50 9.862 1.838 91.373 0 98.982 0.520 0 10.401 10.730 070 06483410 Otter Creek north of Sibley CSG 36 1952–88 37 NWIP 11.90 13.81 13.80 9.647 1.226 86.957 0.137 93.272 6.018 0 4.427 10.503 071 05417590 Kitty Creek near Langworthy CSG 26 1966–92 27 IS 14.40 14.03 14.00 6.709 4.840 79.563 2.183 96.540 1.057 0.003 20.903 34.852 072 05453750 Rapid Creek south west of Morse CSG 40 1951–92 42 SIDP 15.20 15.18 15.20 6.689 5.564 74.934 0 99.405 0.388 0 14.226 21.455 0.00173 06606790 Maple Creek near Alta CSG 24 1955–90 36 NWIP 15.50 15.46 15.50 10.326 1.943 91.265 0.138 96.509 3.301 0 10.250 15.541 074 05422560 Duck Creek at 110th Avenue at Davenport CON 20 1994–2013 20 SIDP 16.10 15.52 15.50 7.257 4.202 82.510 0 92.037 7.755 0 18.951 18.242 0.00275 06808880 Bluegrass Creek at Audubon CSG 31 1967–2013 47 SIDP 15.40 15.69 15.70 9.856 6.533 82.457 0.464 89.583 9.084 0.191 15.682 24.240 076 05464318 East Blue Creek at Center Point CSG 28 1966–93 28 IS 17.60 17.00 17.00 10.259 3.167 75.084 21.825 77.804 0.052 0 12.303 15.899 0.00177 05481690 West Beaver Creek at Grand Junction CSG 24 1966–89 24 DML 12.60 18.22 18.20 13.430 1.295 89.914 0.245 97.793 0.977 0 10.333 9.537 078 05471040 Squaw Creek near Colfax CON 10 1996–2005 10 SIDP 18.40 18.40 18.40 8.374 5.503 80.758 1.868 94.297 3.068 0.592 11.283 15.770 0.00579 05487550 Walnut Creek near Vandalia CON 11 1995–2005 11 SIDP 20.30 20.25 20.20 10.206 5.533 63.555 0 86.138 13.088 0.551 12.112 16.833 0.01080 05411530 North Branch Turkey River near Cresco CSG 28 1966–93 28 IS 19.50 20.44 20.40 9.708 1.957 85.119 0.829 92.033 6.540 0.105 11.090 13.719 0
Table 1. Data for streamgages in Iowa used for analysis in this study.—Continued

Introduction 7
Map no. (fig. 1)
Streamgage number
Streamgage name
Type
of
stre
amga
ge
Syst
emat
ic p
eaks
in
EM
A/M
GB
an
alys
is (y
ears
)
His
tori
cal p
erio
d o
f EM
A/M
GB
an
alys
is
His
tori
cal p
erio
d le
ngth
of E
MA
/M
GB
ana
lysi
s (y
ears
)
Iow
a la
ndfo
rm
regi
on
Publ
ishe
d dr
ain-
age
area
(mi2 )
GIS
dra
inag
e ar
ea,
DRN
ARE
A (m
i2 )
Dra
inag
e ar
ea
used
for c
alcu
lat-
ing
AEP
est
imat
es
(mi2 )
LEN
GTH
(mi)
BSL
DEM
10M
(p
erce
nt)
ROW
CRO
P (p
erce
nt a
rea)
SOIL
ASS
URG
O
(per
cent
are
a)
SOIL
BSS
URG
O
(per
cent
are
a)
SOIL
CSSU
RGO
(p
erce
nt a
rea)
SOIL
DSS
URG
O
(per
cent
are
a)
CSL1
085L
FP
(ft/m
i)
CSL1
00 (f
t/mi)
SLO
P30
(p
erce
nt a
rea)
38 05411650 Crane Creek Tributary near Saratoga CSG 23 1953–75 23 IS 4.06 4.13 4.13 3.638 1.850 89.282 0 46.901 53.037 0 18.232 22.863 039 05412060 Silver Creek near Luana, Iowa (L-23S) CON 11 1980–2003 24 PP 4.39 4.37 4.37 4.225 5.220 83.510 0.088 98.001 1.839 0 30.035 39.223 040 05495600 South Wyaconda River near West Grove CSG 23 1953–75 23 SIDP 4.69 4.57 4.57 4.436 3.176 44.932 0 7.913 43.409 46.984 24.532 20.776 041 06604584 Dry Run Creek near Harris CSG 19 1990–2013 24 DML 4.30 4.84 4.84 4.914 1.424 94.145 0.192 96.983 2.816 0 9.530 11.046 042 06811800 East Tarkio Creek near Stanton CSG 55 1958–2013 56 SIDP 4.66 5.02 5.02 4.973 5.024 88.668 0 81.948 3.204 14.682 18.155 22.217 043 05448900 East Branch Iowa River Tributary near Garner CSG 34 1952–86 35 DML 5.98 5.63 5.63 5.100 1.989 90.499 10.308 78.176 11.341 0 4.018 13.981 044 05420960 Harter Creek near Independence CSG 12 1952–63 12 IS 6.17 6.16 6.16 5.931 2.690 85.865 1.458 98.443 0 0 20.416 23.706 045 05455550 Bulgers Run near Riverside CSG 48 1965–2013 49 SIDP 6.31 6.31 6.31 6.162 6.616 45.912 0 86.498 13.138 0.315 20.411 23.326 046 06897858 Sevenmile Creek near Thayer CSG 19 1991–2013 23 SIDP 6.61 6.60 6.60 4.778 6.657 26.103 0 24.495 67.060 7.723 28.100 32.316 0.05047 05483349 Middle Raccoon River Tributary at Carroll CSG 47 1948–2013 66 SIDP 6.58 6.72 6.72 4.619 6.575 91.452 0.150 99.148 0.579 0 29.064 40.604 048 05487540 Walnut Creek near Prairie City CON 10 1996–2005 10 SIDP 6.78 6.77 6.77 3.925 4.379 83.793 0 92.020 7.582 0.230 31.781 33.070 049 06610500 Indian Creek at Council Bluffs CON 22 1942–2013 72 LH 7.99 6.95 6.95 5.719 12.331 17.437 0 98.537 0 0 34.045 47.529 0.81550 05448700 East Branch Iowa River near Hayfield CSG 37 1952–91 40 DML 7.94 7.34 7.34 6.278 1.404 91.397 6.056 87.170 6.747 0 6.706 8.555 051 06483450 Wagner Creek near Ashton CSG 22 1952–73 22 NWIP 7.09 7.35 7.35 6.385 1.421 91.053 0 99.823 0.193 0 15.000 14.202 052 05420620 Little Wapsipinicon River near Acme CSG 41 1953–93 41 IS 7.76 8.02 8.02 7.989 2.726 78.833 0.051 93.296 6.578 0 16.218 22.525 053 06599800 Perry Creek near Merrill CSG 56 1953–2013 61 NWIP 8.17 8.14 8.14 5.936 3.775 87.883 0 99.875 0 0 17.766 22.684 054 05453600 Rapid Creek below Morse CSG 40 1951–92 42 SIDP 8.12 8.21 8.21 5.152 5.797 73.396 0 99.450 0.346 0 17.034 23.824 055 05464025 Miller Creek near Eagle Center CSG 23 1990–2013 24 IS 9.14 8.75 8.75 5.307 2.505 92.816 0 99.017 0.840 0 16.041 18.924 056 05489150 Little Muchakinock Creek at Oskaloosa CSG 23 1966–88 23 SIDP 9.12 9.30 9.30 6.833 3.755 62.695 0 60.370 33.624 3.452 17.530 20.303 0.00557 0680737930 Elm Creek near Jacksonville CSG 23 1991–2013 23 SIDP 9.43 9.53 9.53 6.400 7.494 89.277 0 96.819 3.171 0 23.147 32.464 058 06811875 Snake Creek near Yorktown CSG 30 1966–2013 48 SIDP 9.10 9.59 9.59 6.648 6.549 68.126 0 76.498 21.179 1.810 20.290 27.532 0.00259 05421890 Silver Creek at Welton CSG 47 1966–2013 48 ECIDP 9.03 9.97 9.97 4.327 5.812 76.251 0 99.139 0.630 0 21.289 39.943 060 06811760 Tarkio River near Elliott CSG 59 1952–2013 62 SIDP 10.70 10.68 10.70 8.955 4.197 88.371 0 93.498 2.613 3.789 14.156 13.756 061 05464880 Otter Creek at Wilton CSG 27 1966–93 28 SIDP 10.70 10.76 10.80 7.997 4.055 83.416 0.137 99.151 0.684 0 11.487 13.736 062 05462750 Beaver Creek Tributary near Aplington CSG 26 1966–91 26 IS 11.60 11.07 11.10 6.664 2.359 89.023 0.160 99.822 0 0 15.898 21.564 063 05416972 Sand Creek near Manchester CSG 23 1991–2013 23 IS 11.00 11.07 11.10 6.939 2.924 92.332 1.537 92.661 1.714 4.044 16.675 24.884 064 05480930 White Fox Creek at Clarion CSG 47 1966–2013 48 DML 13.30 11.37 11.40 7.264 2.201 83.110 0.946 91.782 2.568 0 11.041 13.775 065 05388400 Wexford Creek near Harpers Ferry CSG 35 1953–89 37 PP 11.90 11.42 11.40 7.223 14.777 18.171 0.346 79.272 19.771 0.558 69.071 77.884 12.21966 05455300 South English River near Barnes City CSG 35 1953–88 36 SIDP 11.50 12.05 12.10 7.821 3.828 80.890 0.006 73.718 23.281 2.822 12.551 15.886 067 05488620 Coal Creek near Albia CSG 26 1951–92 42 SIDP 13.50 13.27 13.30 7.065 8.800 19.521 0 16.019 65.509 17.532 19.034 27.889 0.03968 06903500 Honey Creek near Russell CON 11 1952–62 11 SIDP 13.20 13.30 13.30 9.209 5.834 40.999 0 1.850 86.501 10.407 10.358 14.034 069 06601480 Big Whiskey Slough near Remsen CSG 28 1967–98 32 NWIP 12.90 13.45 13.50 9.862 1.838 91.373 0 98.982 0.520 0 10.401 10.730 070 06483410 Otter Creek north of Sibley CSG 36 1952–88 37 NWIP 11.90 13.81 13.80 9.647 1.226 86.957 0.137 93.272 6.018 0 4.427 10.503 071 05417590 Kitty Creek near Langworthy CSG 26 1966–92 27 IS 14.40 14.03 14.00 6.709 4.840 79.563 2.183 96.540 1.057 0.003 20.903 34.852 072 05453750 Rapid Creek south west of Morse CSG 40 1951–92 42 SIDP 15.20 15.18 15.20 6.689 5.564 74.934 0 99.405 0.388 0 14.226 21.455 0.00173 06606790 Maple Creek near Alta CSG 24 1955–90 36 NWIP 15.50 15.46 15.50 10.326 1.943 91.265 0.138 96.509 3.301 0 10.250 15.541 074 05422560 Duck Creek at 110th Avenue at Davenport CON 20 1994–2013 20 SIDP 16.10 15.52 15.50 7.257 4.202 82.510 0 92.037 7.755 0 18.951 18.242 0.00275 06808880 Bluegrass Creek at Audubon CSG 31 1967–2013 47 SIDP 15.40 15.69 15.70 9.856 6.533 82.457 0.464 89.583 9.084 0.191 15.682 24.240 076 05464318 East Blue Creek at Center Point CSG 28 1966–93 28 IS 17.60 17.00 17.00 10.259 3.167 75.084 21.825 77.804 0.052 0 12.303 15.899 0.00177 05481690 West Beaver Creek at Grand Junction CSG 24 1966–89 24 DML 12.60 18.22 18.20 13.430 1.295 89.914 0.245 97.793 0.977 0 10.333 9.537 078 05471040 Squaw Creek near Colfax CON 10 1996–2005 10 SIDP 18.40 18.40 18.40 8.374 5.503 80.758 1.868 94.297 3.068 0.592 11.283 15.770 0.00579 05487550 Walnut Creek near Vandalia CON 11 1995–2005 11 SIDP 20.30 20.25 20.20 10.206 5.533 63.555 0 86.138 13.088 0.551 12.112 16.833 0.01080 05411530 North Branch Turkey River near Cresco CSG 28 1966–93 28 IS 19.50 20.44 20.40 9.708 1.957 85.119 0.829 92.033 6.540 0.105 11.090 13.719 0

8 Comparisons of Estimates of Annual Exceedance-Probability Discharges for Small Drainage Basins in Iowa
Comparisons for the two sizes of drainage area were evaluated two different ways to determine which of the four or five AEPD-estimation methods provides the best accuracy. First, the AEPD-estimation method that provides the best accuracy for AEPs, or RIs, selected by Iowa DOT was deter-mined. The Iowa DOT selected AEPDs of 4, 2, and 1 percent, or flood RIs of 25, 50, and 100 years for this comparison because these AEPDs are used most frequently by Iowa DOT for flood estimation. Second, the AEPD-estimation method that provides the best accuracy for the greatest number of AEPs, or greatest number of RIs, also was determined.
Description of Study Area
The study area (fig. 1) includes the entire State of Iowa. There are 10 landform regions in Iowa, each having distinctive topography and geology (fig. 2). A brief descrip-tion of the landform regions in Iowa is presented in Eash and Barnes (2012) and a detailed description is presented by Prior (1991). Prior and others (2009) describe updates to landform regions in Iowa.
Most precipitation in the study area results from storms moving inland primarily from the Gulf of Mexico and secondarily from the Pacific Ocean (Soenksen and Eash, 1991). Annual precipitation, which is mostly rain, ranges from 26 inches (in.) in the extreme northwest to as much as 38 in. in the southeast; the statewide average is around 34 in. (National Climatic Data Center, 2012). About 75 percent of the annual precipitation is received during April through September. Typically, during August through February, streamflow in most unregulated streams in the study area is base flow; dur-ing March through July, streamflow is substantially greater, primarily as a result of snowmelt during late February through early April and rainfall during May through July. Annual maximum streamflows are typically during April through July.
Methods of Estimation for Annual Exceedance-Probability Discharges
The AEPDs derived from the EMA/MGB analy-sis method are considered the best estimates for the 80 streamgages because they were calculated using observed annual peak-discharge data collected for at least 10 years and the USGS PeakFQ streamgage probability-analysis program (Veilleux and others, 2014). AEPDs estimated from the other four or five AEPD-estimation methods were evaluated for overall accuracy and bias relative to the AEPDs estimated by the EMA/MGB analysis method for the comparisons of the two sizes of drainage area.
The streamgage datasets included in this study are not independent of those used in the development of the 2013 multivariable RREs and the 2013 single-variable RREs, except for the addition of three more years of annual peak-discharge data. The streamgage datasets included in this study also may not be independent of those used to develop the 1987 single-variable RREs, or possibly even the TR-55 rainfall-runoff model or the Iowa Runoff Chart method, because these meth-ods may have used some of these same streamgage datasets in their development. Therefore, conclusions regarding the rela-tive quality of the AEPD-estimation methods may or may not be extended to ungaged sites. The relative quality of the esti-mates of AEPDs calculated for streamgages from the AEPD-estimation methods compared in this study are assumed to extend to all conclusions referencing ungaged sites.
Drainage-area values for each streamgage included in this study are listed in table 1. Each streamgage has a drainage area that is listed in the USGS National Water Information System (NWIS) database (U.S. Geological Survey, 2015b), which is referred to as the “published” drainage area. Published drain-age areas were determined primarily from 1:24,000-scale top-ographic maps by manual methods (planimeter) or digitizing methods (geographic information system [GIS]) at the time streamgage operation began. Drainage-area values listed in table 1 as “GIS” drainage areas (DRNAREA) were measured as part of the 2013 USGS AEPD-estimation study (Eash and others, 2013). Generally, GIS-delineated drainage-area values are believed to be more accurate than the published drainage-area values (Eash and others, 2013). The GIS measurements of drainage area (DRNAREA), rounded to the same number of significant figures as output from StreamStats, were used in this study to calculate estimates of AEPDs because users will likely use StreamStats to determine drainage-area values for ungaged stream sites in Iowa.
Expected Moments Algorithm/Multiple Grubbs-Beck Test Analysis Method
Crest-stage gages (CSGs) are the primary source of annual peak-discharge data for small drainage basins in Iowa (U.S. Geological Survey, Iowa Water Science Center, Flood
Table 2. Annual exceedance probability and equivalent flood- recurrence interval for selected probabilities.
Annual exceedance probability (percent)
Recurrence interval (years)
50 2
20 5
10 10
4 25
2 50
1 100
0.5 200
0.2 500

Methods of Estim
ation for Annual Exceedance-Probability Discharges
9
#
###
#
##
#
####
###
#
#
#
#
#
#
#
#
#
#
#
#
MISSOURI
WISCONSIN
MINNESOTA
ILLINOIS
NEBRASKA
SOUTH DAKOTA
Lyon Osceola
Dickinson
Emmet KossuthWinnebago Worth
Sioux O'Brien
Clay
Palo AltoHancock
Cerro Gordo
Plymouth
Cherokee
Buena VistaPocahontas
Humboldt
Wright Franklin
WebsterWoodburyIda
SacCalhoun
Hamilton
Hardin
Monona
Crawford Carroll Greene
Boone
Story
Harrison
ShelbyAudubon
Guthrie
Dallas Polk Jasper
Allamakee
WinneshiekHowardMitchell
ChickasawFloyd
Clayton
FayetteBremer
Butler
Dubuque
Delaware
Buchanan
Black HawkGrundy
Jackson
Jones
Linn
BentonTama
MarshallClintonCedar
Johnson
Poweshiek Iowa Scott
Muscatine
WashingtonKeokukMahaskaWarrenMarion
Louisa
HenryJefferson
Clarke
WapelloLucas MonroeDes Moines
Decatur DavisVan Buren
Wayne
Appanoose
Lee
PottawattamieCass Adair
Madison
Mills
Montgomery Adams Union
Fremont PageTaylor Ringgold
Rock
Rive
r
Rive
r Des East
MoinesRive
r
Siou
x
Perr
y Floy
d
Cr.
Littl
e
Rive
r
River
North
Maple
River
Middle
Raccoon
Missouri
Soldi
er
Boyer
River
RiverRiver
South
River
Nish
nabo
tna
Nish
nabo
tna
Wes
t
East
Tark
ioN
odaw
ayRi
ver
River
Raccoon
RiverSouth RaccoonMiddle
North
Thompson
River
South
White
River
Creek
Brea
st
Chariton
River
RiverRaccoon
River
R.
Des
Rive
rSi
oux
Big
Winnebago
Shell
River
Cedar
Wapsipinicon
Rock
Upper
Turkey
IowaRiver
RiverForkMoines
Boone
Iowa
River
West
ForkCedar
RiverRiver
River Mississippi
Rive
r
River
North
Skunk
SkunkRiver
Cedar
Creek
Des
River River
Moines
FoxRiver
River
River
Skunk
River
RiverEnglish
Iowa
Cedar
RiverRiver
Wapsipinicon
Maquoketa
River
River
River
Creek
Lizard
Base from U.S. Geological Survey digital data, 1:2,000,000, 1979Universal Transverse Mercator projection, Zone 15North American Datum of 1983 (NAD 83)
0 50 MILES25
0 50 KILOMETERS25EXPLANATION
96° 95° 94° 93° 92°
91°
43°
42°
41°
o o
###
#
#
#
#
#
#
#
#
##
#
####### #
#
#
#
#
#
#
##
#
#
#
##
###
#
#
#
#
#
#
#
##
#
##
#
#
##
o o
#
#
18
70
51
6953 73
21
75
573732
49
2660
42
58
46
14
1
1
68
67
40
40
28
45
6174
59 23
71
63
76
10
353130 15
29
25
121322
55
66
56
27
7848
797
5
2
47
77
3
33
62
34
5238 80 65
9
6
17
244
844
39
36
20
64
11 43
5016
41
547219
Loess Hills
Mississippi River Alluvial Plain
Missouri River Alluvial Plain
Northwest Iowa Plains
Paleozoic Plateau
Southern Iowa Drift Plain
Des Moines Lobe
East-Central Iowa Drift Plain
Iowa-Cedar Lowland
Iowan Surface
U.S. Geological Survey streamgage with drainage area less than 2 square miles and map number
U.S. Geological Survey streamgage with drainage area between 2 and 20 square miles and map number
Figure 2
Landform regions from Prior, 1991; Prior and others, 2009
Figure 2. Location of landform regions in Iowa and U.S. Geological Survey streamgages included in this study, Iowa.
10 Comparisons of Estimates of Annual Exceedance-Probability Discharges for Small Drainage Basins in Iowa
Information at Selected Bridge and Culvert Sites; http://ia.water.usgs.gov/projects/ia006.html). Annual peak dis-charges are computed for continuous-record streamgages and CSGs by use of a stage-discharge relation (Rantz and oth-ers, 1982). The stage-discharge relation, or rating, is used to determine discharges for all recorded stages at streamgages with the exception for some types of flow conditions at CSG culverts (Bodhaine, 1968); peak discharges are determined independently of a stage-discharge rating using the USGS Culvert Analysis Program (Fulford, 1998). The largest dis-charge during a water year is the annual peak discharge, and the annual peak-discharge record is the compilation of all recorded annual peak discharges.
Water year is the 12-month period from October 1 through September 30. The water year is designated by the calendar year in which the water year ends and that includes 9 of the 12 months of that year. Thus, the water year ending September 30, 2013, is the “2013 water year.” Annual peak-discharge records collected through the 2013 water year were retrieved from the USGS NWIS database (U.S. Geological Survey, 2015b) for the 80 streamgages included in this study (table 1) to estimate the EMA/MGB AEPDs. The number of annual peak discharges, or systematic peaks, collected at the 25 streamgages with drainage areas less than 2 mi2 that were used in the EMA/MGB analyses ranged from 13 to 62 years, with an average of 29 years and a median of 24 years (table 1). The number of systematic peaks collected at the 55 streamgages with drainage areas between 2 and 20 mi2 that were used in the EMA/MGB analyses ranged from 10 to 59 years, with an average of 29 years and a median of 24 years (table 1).
AEPDs for a streamgage are calculated from an AEP analysis that relates observed annual peak discharges to AEPs. The EMA/MGB analysis method within the USGS PeakFQ, (version 7.1) program (Cohn and others, 1997, 2001, 2013; Eash and others, 2013; Veilleux and others, 2014) and the results of a new statewide regional skew study (Veilleux and others, 2012; Eash and others, 2013) were used to estimate AEPDs for data at the 80 streamgages (table 1). EMA/MGB AEP analyses provide a new alternative method to standard (hereafter referred to as Bulletin 17B) AEP analyses (Inter-agency Advisory Committee on Water Data, 1982; Veilleux and others, 2014). EMA/MGB estimates calculated through the 2013 water year at the 80 streamgages for AEPs of 50, 20, 10, 4, 2, 1, 0.5, and 0.2 percent are listed in table 3 (link to Excel file). A minimum of 10 years of annual peak-discharge record is recommended by the Interagency Advisory Commit-tee on Water Data (1982) to estimate AEPDs using the Bulle-tin 17B analysis method. The EMA/MGB estimates of AEPDs were not weighted with RRE estimates of AEPDs using the Weighted Independent Estimates (WIE) method (Cohn and others, 2012; Eash and others, 2013) to provide some measure of independence to this dataset.
AEPs formerly were reported as flood RIs expressed in years (Holmes and Dinicola, 2010). Estimates of AEPDs at streamgages change as additional annual peak discharges are
measured; EMA/MGB estimates of AEPDs are updated and become more statistically reliable.
2013 Multivariable Regional-Regression Equations
Multivariable RREs from Eash and others (2013) were developed for three new flood regions defined for Iowa (fig. 1). Each set of regression equations for each flood region requires the measurement of three basin characteristics. The RREs were developed using GIS measurements of the basin characteristics as the independent variables and EMA/MGB estimates of AEPDs as the dependent variables in the regression analyses. The basin characteristics were measured from high-resolution (1:24,000 scale) elevation, stream, and watershed-boundary data (Eash and others, 2013). Information on the GIS measurements of basin characteristics, basin-characteristic values for the 80 streamgages, the definition of the three flood regions in Iowa, and the development of the multivariable RREs is presented in Eash and others (2013).
The GIS data layers used to measure the basin charac-teristics along with the 2013 multivariable RREs developed for Iowa (Eash and others, 2013) were included in the USGS National StreamStats Program (U.S. Geological Survey, 2015a). In June 2013, the Iowa StreamStats implementation was released, which allows users to interactively delineate drainage-basin boundaries, measure basin-characteristic values, and solve RREs for ungaged stream sites in Iowa. The multivariable RREs presented in tables 9–11 in Eash and oth-ers (2013) are applicable for drainage basins:
• With areas as small as 0.06 mi2 for flood region 1,
• As small as 0.08 mi2 for flood region 2, and
• As small as 0.05 mi2 for flood region 3. Average standard errors of prediction (SEP, in percent)
for the multivariable RREs from Eash and others (2013) range from 31.8 to 45.2 percent for flood region 1, from 19.4 to 46.8 percent for flood region 2, and from 26.5 to 43.1 per-cent for flood region 3. The 2013 multivariable RRE estimates for AEPs of 50, 20, 10, 4, 2, 1, 0.5, and 0.2 percent (table 4 in Eash and others, 2013) are listed in table 4 (link to Excel file) for the 80 streamgages.
2013 Single-Variable Regional-Regression Equations
Single-variable RREs also were developed for the three new flood regions defined for Iowa (fig. 1) by Eash and oth-ers (2013). The single-variable RREs, which only require drainage-area measurements (DRNAREA), were not formally published as equations by Eash and others (2013). Rather, the exponents and constants of the 2013 single-variable RREs were published (table 15 in Eash and others, 2013) so that the exponents from the single-variable RREs would be available

Methods of Estimation for Annual Exceedance-Probability Discharges 11
for calculating area-weighted estimates of AEPDs for ungaged sites on gaged streams. Thus, estimates of AEPDs could be calculated at ungaged stream sites using drainage area only.
The 2013 single-variable RREs for flood region 1 were implemented in Iowa StreamStats for use when the basin-char-acteristic value for the total length of all streams (determined at the 1:24,000 scale) in a drainage basin (STRMTOT; table 2 in Eash and others, 2013) equals zero or when the constant of channel maintenance (CCM) basin-characteristic value is greater than 3.87. The STRMTOT basin-characteristic value is used to compute the CCM basin-characteristic value (CCM is equal to DRNAREA divided by STRMTOT). Because small drainage basins in flood region 1 may have STRMTOT values of zero or CCM values greater than 3.87, for which the 2013 multivariable RREs cannot be used, the single-variable RREs
were implemented in Iowa StreamStats as an alternative set of RREs for flood region 1.
The 2013 single-variable RREs (table 15 in Eash and others, 2013) are presented in tables 5–7 (this report). The 2013 single-variable RREs were developed using generalized least-squares (GLS) regression. The constant values listed in table 15 in Eash and others (2013) are in logarithm (log) units and are rounded to three significant figures. The coefficients of the RREs listed in tables 5–7 are untransformed from the same constants (in log units as listed in table 15 of Eash and others, 2013), except the constants are rounded to four significant figures. Thus, untransforming a constant value (table 15 in Eash and others, 2013) will produce a slightly different coef-ficient value than that listed in tables 5–7. Because the same streamgages used to develop the 2013 multivariable RREs
Table 5. Single-variable regression equations (2013) for estimating annual exceedance-probability discharges for unregulated streams in flood region 1, Iowa.1
[SEP, average standard error of prediction; Pseudo-R2, pseudo coefficient of determination; SEM, average standard error of model; AVP, average variance of prediction; log, logarithm; Qx%, annual exceedance-probability discharge of x percent; %, percent; DRNAREA, geographic-information-system drainage area]
Annual exceedance-probability equation
SEP (percent)
Pseudo-R 2 (percent)
SEM (percent)
AVP (log ft3/s)2
(91 streamgages used to develop equations)Q50%=45.5 DRNAREA0.641 51.9 91.9 50.5 0.045Q20%=116 DRNAREA0.592 42.9 93.3 41.5 0.032Q10%=181 DRNAREA0.569 42.4 92.9 40.8 0.031Q4%=282 DRNAREA0.548 44.4 91.7 42.6 0.034Q2%=369 DRNAREA0.535 46.6 90.5 44.7 0.037Q1%=462 DRNAREA0.524 48.9 89.2 46.8 0.040Q0.5%=564 DRNAREA0.516 51.8 87.7 49.6 0.045Q0.2%=708 DRNAREA0.506 55.8 85.5 53.4 0.051
1From Eash and others (2013).
Table 6. Single-variable regression equations (2013) for estimating annual exceedance-probability discharges for unregulated streams in flood region 2, Iowa.1
[SEP, average standard error of prediction; Pseudo-R2, pseudo coefficient of determination; SEM, average stan-dard error of model; AVP, average variance of prediction; log, logarithm; Qx%, annual exceedance-probability discharge of x percent; %, percent; DRNAREA, geographic-information-system drainage area]
Annual exceedance- probability equation
SEP (percent)
Pseudo-R 2 (percent)
SEM (percent)
AVP (log ft3/s)2
(176 streamgages used to develop equations)Q50%=143 DRNAREA0.579 47.4 91.3 46.4 0.038Q20%=376 DRNAREA0.525 28.2 95.9 27.1 0.014Q10%=598 DRNAREA0.499 23.6 96.9 22.4 0.010Q4%=931 DRNAREA0.476 24.0 96.5 22.6 0.011Q2%=1,210 DRNAREA0.463 25.4 95.9 24.0 0.012Q1%=1,510 DRNAREA0.453 26.9 95.2 25.4 0.013Q0.5%=1,820 DRNAREA0.445 29.1 94.3 27.5 0.015Q0.2%=2,250 DRNAREA0.436 32.6 92.6 30.9 0.019
1From Eash and others (2013).

12 Comparisons of Estimates of Annual Exceedance-Probability Discharges for Small Drainage Basins in Iowa
were used to develop the 2013 single-variable RREs, the same range of DRNAREA values are applicable for the 2013 single-variable RREs as for the 2013 multivariable RREs (table 12 in Eash and others, 2013). For the 24 single-variable RREs developed for estimating AEPDs for flood regions 1–3, an average standard error of prediction, a pseudo-R2 (in percent), an average error of model (in percent), and an average vari-ance of prediction (in log units) are reported in tables 5–7 as performance metrics. A description of GLS regression and the performance metrics is presented in Eash and others (2013). The SEPs for the 2013 single-variable RREs range from 42.4 to 55.8 percent for flood region 1, from 23.6 to 47.4 percent for flood region 2, and from 33.2 to 44.0 percent for flood region 3 (tables 5–7). The 2013 single-variable RRE estimates for AEPs of 50, 20, 10, 4, 2, 1, 0.5, and 0.2 percent at the 80 streamgages (tables 5–7; table 15 in Eash and others, 2013) are listed in table 8 (link to Excel file).
1987 Single-Variable Regional-Regression Equations
Single-variable RREs developed by Lara (1987) for five flood regions defined for Iowa (fig. 3) were used to estimate AEPDs for the 80 selected streamgages. The 1987 single-variable RREs only require the measurement of drainage area and these RREs are used by Iowa DOT to estimate AEPDs for small drainage basins in Iowa (Iowa Department of Transpor-tation, 2014a; see section 3.2.2, “Stream and river crossings”). Lara (1987) assigned some streamgages to a different hydro-logic region than the region where the streamgage is present [fig. 3 and table 9 (link to Excel file) streamgages with map numbers 8, 40, 68, and 73]; thus, for this study, streamgages that were included in the development of the 1987 single-vari-able RREs are assigned to the same hydrologic region as used by Lara (1987) (table 9).
In a two-page addendum to Lara (1987) (Oscar Lara, U.S. Geological Survey, written commun., 1987), Lara noted the importance of recognizing that within the hydrologic regions, small watersheds may have landform characteristics that produce peak discharges typical of other hydrologic regions; professional judgment may be needed when selecting and using the appropriate set of equations and ultimately select-ing the AEPDs. An example of a calculation of AEPDs that encompass mixed landforms for drainage basins with areas of 20 mi2 or less was presented in the addendum. After inspecting the location (using 1:24,000-scale topographic maps) of each of the 80 streamgages, the calculation of mixed landform pre-sented in the addendum to Lara (1987) was used to estimate AEPDs for two streamgages that were representative of mixed landform regions (table 9, streamgages with map numbers 13 and 59 shown on fig. 3).
Forty-three of the 80 streamgages listed in table 9 were not included in the development of the 1987 single-variable RREs and were not assigned to a hydrologic region by Lara (1987). Thus, for this study, these 43 streamgage needed to be evaluated to determine if any of them should be assigned to a different hydrologic region than the region where the streamgage is present. The GIS-measured basin characteristics (table 1 in this report; table 2 in Eash and others, 2013) were evaluated for streamgages within each hydrologic region. The 80 streamgages were sorted into hydrologic regions 1 to 4 (none of the streamgages are located in hydrologic region 5, fig. 3) as previously assigned by Lara (1987) for 37 of the streamgages or to the region where the streamgage is present for the 43 streamgages that were not included in the development of the 1987 single-variable RREs (fig. 3). Mean, median, minimum, and maximum basin-characteristic values were then calculated for the streamgages within each hydro-logic region:
Table 7. Single-variable regression equations (2013) for estimating annual exceedance-probability discharges for unregulated streams in flood region 3, Iowa.1
[SEP, average standard error of prediction; Pseudo-R2, pseudo coefficient of determination; SEM, average stan-dard error of model; AVP, average variance of prediction; log, logarithm; Qx%, annual exceedance-probability discharge of x percent; %, percent; DRNAREA, geographic-information-system drainage area]
Annual exceedance- probability equation
SEP (percent)
Pseudo-R 2 (percent)
SEM (percent)
AVP (log ft3/s)2
(127 streamgages used to develop equations)Q50%=205 DRNAREA0.579 44.0 91.9 43.1 0.033Q20%=488 DRNAREA0.528 34.4 93.8 33.5 0.021Q10%=741 DRNAREA0.503 33.2 93.7 32.2 0.020Q4%=1,120 DRNAREA0.479 33.6 93.0 32.5 0.020Q2%=1,440 DRNAREA0.466 35.6 91.9 34.5 0.023Q1%=1,770 DRNAREA0.455 37.6 90.7 36.4 0.025Q0.5%=2,120 DRNAREA0.447 39.7 89.5 38.4 0.028Q0.2%=2,590 DRNAREA0.438 43.2 87.3 41.9 0.032
1From Eash and others (2013).

Methods of Estim
ation for Annual Exceedance-Probability Discharges
13
#
###
#
##
#
####
###
#
#
#
#
#
#
#
#
#
#
#
#
MISSOURI
WISCONSIN
MINNESOTA
ILLINOIS
NEBRASKA
SOUTH DAKOTA
Lyon Osceola
Dickinson
Emmet KossuthWinnebago Worth
Sioux O'Brien
Clay
Palo AltoHancock
Cerro Gordo
Plymouth
Cherokee
Buena VistaPocahontas
Humboldt
Wright Franklin
WebsterWoodburyIda
SacCalhoun
Hamilton
Hardin
Monona
Crawford Carroll Greene
Boone
Story
Harrison
ShelbyAudubon
Guthrie
Dallas Polk Jasper
Allamakee
WinneshiekHowardMitchell
ChickasawFloyd
Clayton
FayetteBremer
Butler
Dubuque
Delaware
Buchanan
Black HawkGrundy
Jackson
Jones
Linn
BentonTama
MarshallClintonCedar
Johnson
Poweshiek Iowa Scott
Muscatine
WashingtonKeokukMahaskaWarrenMarion
Louisa
HenryJefferson
Clarke
WapelloLucas MonroeDes Moines
Decatur DavisVan Buren
Wayne
Appanoose
Lee
PottawattamieCass Adair
Madison
Mills
Montgomery Adams Union
Fremont PageTaylor Ringgold
RockRi
ver
Rive
r Des East
MoinesRive
r
Siou
x
Perr
y Floy
d
Cr.
Littl
e
Rive
r
River
North
Maple
River
Middle
Raccoon
Missouri
Soldi
er
Boyer
River
RiverRiver
South
River
Nish
nabo
tna
Nish
nabo
tna
Wes
t
East
Tark
ioN
odaw
ayRi
ver
River
Raccoon
RiverSouth RaccoonMiddle
North
Thompson
River
South
White
River
Creek
Brea
st
Chariton
River
RiverRaccoon
River
R.
Des
Rive
rSi
oux
Big
Winnebago
Shell
River
Cedar
Wapsipinicon
Rock
Upper
Turkey
IowaRiver
RiverForkMoines
Boone
Iowa
River
West
ForkCedar
RiverRiver
River Mississippi
Rive
r
River
North
Skunk
Skunk
River
Cedar
Creek
Des
River River
Moines
FoxRiver
River
River
Skunk
River
RiverEnglish
Iowa
Cedar
RiverRiver
Wapsipinicon
Maquoketa
River
River
River
Creek
Lizard
Base from U.S. Geological Survey digital data, 1:2,000,000, 1979Universal Transverse Mercator projection, Zone 15North American Datum of 1983 (NAD 83)
Hydrologic regions from Lara, 19870 50 MILES25
0 50 KILOMETERS25 EXPLANATION
96° 95° 94° 93° 92°
91°
43°
42°
41°
o o
###
#
#
#
#
#
#
#
#
##
#
####### #
#
#
#
#
#
#
##
#
#
#
##
###
#
#
#
#
#
#
#
##
#
##
#
#
##
o o
#
#
18
70
51
6953 73
21
75
573732
49
2660
42
58
46
14
1
1
68
67
40
40
28
45
6174
59 23
71
63
76
10
353130 15
29
25
121322
55
66
56
27
7848
797
5
2
47
77
3
33
62
34
5238 80 65
9
6
17
244
844
39
36
20
64
11 43
5016
41
547219
Hydrologic region 4
Hydrologic region 5
Undefined area
Hydrologic region 1
Hydrologic region 2
Hydrologic region 3
U.S. Geological Survey streamgage with drainage area less than 2 square miles and map number
U.S. Geological Survey streamgage with drainage area between 2 and 20 square miles and map number
Figure 3Figure 3. Location of 1987 hydrologic regions and U.S. Geological Survey streamgages included in this study, Iowa.
14 Comparisons of Estimates of Annual Exceedance-Probability Discharges for Small Drainage Basins in Iowa
1. For average basin slope (BSLDEM10M).
2. For stream slope calculated as the change in eleva-tion between points located at 10 and 85 percent of the length along the longest flow path that was determined by GIS, then divided by the length between the points (CSL1085LFP).
3. For stream slope calculated from the entire main-channel length from basin outlet to basin divide (CSL100).
4. For percent of area with slopes greater than 30 percent (SLOP30).
CSL1085LFP (listed as “10–85 stream slope method” in Iowa StreamStats) is a basin characteristic that is currently (2015) available in Iowa StreamStats. Six of the 43 streamgages that were not included in the development of the 1987 single-variable RREs were identified with basin-characteristic values that seem to be more representative of a different hydrologic region than the region where the streamgage is present and they were assigned to a different hydrologic region (table 9 and fig. 3, streamgages with map numbers 3, 9, 10, 28, 36, and 69). Thus, AEPDs for 12 of 80, or 15 percent, of the streamgages were calculated using RREs for a different hydrologic region than the region where the streamgage is present.
The 1987 single-variable RREs are applicable for drain-age basins:
• With areas as small as 0.7 mi2 for hydrologic region 1,
• As small as 0.08 mi2 for hydrologic region 2,
• As small as 0.04 mi2 for hydrologic region 3,
• As small as 7.9 mi2 for hydrologic region 4, and
• As small as 45 mi2 for hydrologic region 5. For this study, 1987 single-variable RREs were applied
to data from streamgages with drainage areas smaller than the applicable limits of the equations for comparison purposes. Standard errors of estimates (SEE, in percent) are unknown for the equations when drainage-area values are used in the equa-tions that are outside of the range of values used to develop the equations. Standard errors of estimate for the 1987 single-vari-able RREs range from 21 to 61 percent for hydrologic region 1, from 32 to 55 percent for hydrologic region 2, from 35 to 44 percent for hydrologic region 3, from 29 to 40 percent for hydrologic region 4, and from 20 to 27 percent for hydrologic region 5 (table 2 in Lara, 1987). The 1987 single-variable RRE estimates for AEPs of 50, 20, 10, 4, 2, and 1 percent at the 80 streamgages are listed in table 9.
TR-55 Rainfall-Runoff Model
The WinTR-55 rainfall-runoff model (Natural Resources Conservation Service, 2009) was used in this study to estimate AEPDs. The WinTR-55 model is a single-event rainfall-runoff model for small watersheds. The model can be used to analyze watersheds with drainage areas as large as 25 mi2 and
with time of concentration (Tc) values from 0.1 to 10 hours. Bradley and others (2009) determined that use of the TR-55 method tends to underestimate AEPDs when compared to those calculated using the Bulletin 17B AEP analysis (Inter-agency Advisory Committee on Water Data, 1982) for 46 streamgage watersheds in the Midwest with drainage areas less than 200 acres (0.31 mi2).
The Tc is the time required for runoff to travel from the most distant point in the watershed to its outlet. The watershed-lag method (Natural Resources Conservation Service, 2010) was used to calculate Tc values for input to the WinTR-55 model. The watershed-lag method requires values for the longest flow-path length, the average land slope of the watershed, and a curve number (CN). The CN is defined as a dimensionless number of 98 or less that relates runoff to the soil-cover complex of a watershed; the CN indicates the runoff potential of a soil-cover complex during periods when the soil is not frozen; higher values of CN indicate greater runoff (Natural Resources Conservation Service, 2012). The main-channel length was measured by using a GIS (table 2 in Eash and others, 2013); the main-channel length (LENGTH) was measured from the basin outlet to the basin divide and was used for the longest flow-path length. The average land slope of the watershed (BSLDEM10M) was calculated by using a GIS and a 10-meter digital elevation model (DEM). Measure-ments of LENGTH and BSLDEM10M were used for each of the 80 selected streamgages to calculate Tc (tables 1 and 10, link to Excel file). The WinTR-55 model was used to calculate CN in the land-use details module of the model after areas, in square miles, for each land-use type for each hydrologic soil group (table 1) were entered in the module. The GIS measure-ments of the percent area of cultivated crops (ROWCROP), proportioned by the percent area of hydrologic soils groups (SOILASSURGO, SOILBSSURGO, SOILCSSURGO, and SOILDSSURGO) (Eash and others, 2013), provided most of the information needed for calculating CN values (tables 1 and 10). SOILASSURGO, SOILBSSURGO, SOILCS-SURGO, AND SOILDSSURGO are basin characteristics that will be available in version 3 of Iowa StreamStats (U.S. Geo-logical Survey, 2015a), which is anticipated to be released in 2015. The percent area of pasture and woods, proportioned by hydrologic soil-group areas, were estimated from topographic maps (1:24,000 scale) and aerial photography to account for the remaining non-row crop areas within each of the 80 streamgage watersheds. For this study, CN values (table 10) were calculated by the WinTR-55 model on the basis of three land-use types for each watershed: row crop (straight row, good condition), pasture (fair condition), and woods (fair condition). A residential land-use type of one-quarter acre was used for small areas within a few watersheds to account for urban areas. The CN values calculated by the WinTR-55 model ranged from 68 to 83 with an average value of 76 (table 10). Because Tc values calculated for 4 streamgages (table 10, streamgages with map numbers 69, 70, 73, and 77) exceeded 10 hours, AEPDs could not be estimated for these four streamgages using the WinTR-55 model; thus,

Comparisons of Estimates of Annual Exceedance-Probability Discharges 15
data for 76 streamgages were included in the comparisons for the TR-55 method.
Values for the 24-hour rainfall frequency (table 10) were input to the WinTR-55 model as user-provided, custom storm data in the storm data module of the model after the values were calculated for each watershed by using “Atlas 14” (Perica and others, 2013). Statewide GIS data layers of pre-cipitation frequency grids were downloaded from “Atlas 14” for 24-hour rainfalls that have AEPs of 50, 20, 10, 4, 2, 1, 0.5, and 0.2 percent using the Precipitation Frequency Data Server (U.S. Department of Commerce, National Oceanic and Atmo-spheric Administration, and National Weather Service, 2014). The zonal statistics tool within ArcGIS (version 10.0; Esri, 2012) was used to calculate eight rainfall-frequency values for each streamgage (table 10); WinTR-55 rainfall-runoff model estimates for AEPs of 50, 20, 10, 4, 2, 1, 0.5, and 0.2 percent at 76 streamgages are listed in table 10.
Iowa Runoff Chart
The Iowa Runoff Chart method of calculating AEPDs was adapted in the 1950s by the Iowa State Highway Commis-sion (now the Iowa DOT) from the Bureau of Public Roads’ Chart 1021.1 (Bureau of Public Roads, 1950). A document presenting the Iowa Runoff Chart is provided by the Iowa Department of Transportation (2014b). The Iowa Runoff Chart method has been widely used by Iowa DOT for small drain-age basins with areas of 2 mi2 or less (Iowa Department of Transportation, 2014a; see section 3.2.2, “Stream and river crossings”). Bradley and others (2009) determined that use of the Iowa Runoff Chart method tends to underestimate AEPDs when compared to those calculated using the Bulletin 17B AEP analysis (Interagency Advisory Committee on Water Data, 1982) for 46 streamgage watersheds in the Midwest with drainage areas less than 200 acres. In this study, the Iowa Runoff Chart method was used for streamgages with drainage areas as large as 1.94 mi2 or 1,242 acres (table 1). The Iowa Runoff Chart method calculation for estimating AEPDs is shown in the following equation:
Qdesign = LF × FF × Q, (1)
where Qdesign is the estimated peak discharge, in cubic feet
per second; LF is a land-use and slope-description factor for
the watershed; FF is a frequency factor applied for specific AEPs
or flood RIs; and Q is discharge, in cubic feet per second, and is
calculated as Q = 8.124 A0.739;where A is the drainage area in acres.
For this study, LF values were determined for the drain-age basins of 25 streamgages with drainage areas less than 2 mi2 (tables 1 and 11) on the basis of GIS measurements
(table 2 in Eash and others, 2013) of DRNAREA, BSLDEM10M, CSL1085LFP, CSL100, SLOP30, and ROWCROP. DRNAREA and CSL1085LFP (“10–85 stream slope method” in Iowa StreamStats) are the only basin characteristics that are currently (2015) available in Iowa StreamStats. Slight adjustments were applied to the LF values initially determined by the USGS for 12 of the 25 streamgage watersheds following a review of the LF values by Iowa DOT (David Claman, Iowa Department of Transportation, written commun., 2014) to ensure that LF values used in this study are consistent with Iowa DOT values. Iowa Runoff Chart estimates for AEPs of 20, 10, 4, 2, and 1 percent at the 25 streamgages are listed in table 11.
Comparisons of Estimates of Annual Exceedance-Probability Discharges
AEPDs estimated by using the EMA/MGB analysis method were compared to estimates calculated using the different AEPD-estimation methods on the basis of two evaluation metrics as recommended by the USGS Office of Surface Water (A.G. Veilleux and J.E. Kiang, U.S. Geological Survey, written commun., 2014). The mean percent relative error (MPRE) provides an indication of the overall accuracy of an AEPD-estimation method and the mean ratio of the AEPD-estimation method (AEPD estimate to the EMA/MGB AEPD estimate) gives an indication of the degree of bias of an AEPD-estimation method (Haddad and others, 2012). MPRE is calculated using the following equation:
(2)
where MPRE is the mean percent relative error, which
indicates the overall accuracy between the values estimated by using the EMA/MGB AEPD and the AEPD-estimation method;
n is the number of streamgages in the comparison dataset;
abs is the absolute value of the term that follows; QAEPD-estimation method is the AEPD estimate determined by using
the AEPD-estimation method, in cubic feet per second, for the 2013 multivariable RREs, the 2013 single-variable RREs, the 1987 single-variable RREs, the TR-55 rainfall-runoff model, or the Iowa Runoff Chart; and
QEMA/MGB is the EMA/MGB AEPD estimate, in cubic feet per second.
The AEPD-estimation method with the lowest MPRE value is considered to provide the most accurate estimates of AEPDs in comparison to the EMA/MGB estimates of AEPDs. The mean ratio is calculated using the following equation:
MPRE = abs100 QAEPD-estimation method - QEMA/MGB
QEMA/MGBn Σ i =1
n

16 Comparisons of Estimates of Annual Exceedance-Probability Discharges for Small Drainage Basins in Iowa
(3)
where Mean Ratio gives an indication of the degree of bias
between the EMA/MGB AEPD estimate and the AEPD estimate determined by using the AEPD-estimation method;
n is described in equation 2; QAEPD-estimation method is described in equation 2; and QEMA/MGB is described in equation 2.
The mean ratio provides an indication of systematic overestimation or underestimation of an AEPD-estimation method, where a value of 1 indicates a good average agree-ment between the QAEPD-estimation method and QEMA/MGB. A mean ratio value in the range of 0.5 to 2 may be regarded as an accept-able estimate, a value less than 0.5 may be regarded as a large underestimation and a value greater than 2.0 may be regarded
as a large overestimation. The values are only arbitrary limits and would provide a reasonable guide about the relative accu-racy of the AEPD-estimation methods regarding their practical use (Haddad and others, 2012). In applying these evaluation metrics to compare AEPD-estimation methods, factors such as data error (measurement error and error because of rating-curve extrapolation) and error because of EMA/MGB analysis were not considered.
Different datasets were compared and evaluated for this study for streamgages within the two sizes of drainage areas (1) 5 datasets were compared and evaluated for streamgages with drainage areas less than 2 mi2 (tables 12 and 13), and (2) 8 datasets were compared and evaluated for streamgages with drainage areas between 2 and 20 mi2 (tables 14 and 15). Datasets were compiled for 6 general types of comparisons for each size of drainage areas if at least 10 streamgages were available to form a dataset:
Mean Ratio = 1 QAEPD-estimation method
QEMA/MGBn Σ i =1
n
Table 11. Estimates of annual exceedance-probability discharges for selected streamgages in Iowa, using the Iowa Runoff Chart method.
[no. and No., number; LF, land factor representing land use and slope of the watershed (Iowa Department of Transportation, 2014b)]
Map no.
(fig. 1)
Streamgage number
Streamgage name LFEstimates of annual exceedance-probability discharges,
in cubic feet per second
20 percent 10 percent 4 percent 2 percent 1 percent
1 05487825 Little White Breast Creek Tributary near Chariton 0.6 31.6 44.2 50.5 63.1 75.82 05472555 Skunk River Tributary near Richland 0.5 67.8 94.9 108 136 1633 05481528 Peas Creek Tributary at Boone 0.4 73.2 102 117 146 1764 05421100 Pine Creek Tributary near Winthrop 0.6 124 174 199 249 2995 05454180 Clear Creek Tributary near Williamsburg 0.6 139 194 222 277 3326 05414605 Bloody Run Tributary near Sherrill 0.8 261 365 417 522 6267 05455350 South English River Tributary No. 2 near
Montezuma0.5 173 242 277 346 415
8 05421300 Wapsipinicon Tributary at Winthrop 0.5 179 251 286 358 4309 05389501 Mississippi River Tributary at McGregor 1.0 366 512 586 732 87810 05453430 North Fork Tributary to Mill Creek near Solon 0.8 305 427 488 610 73211 0548065350 Drainage Ditch 97 Tributary near Britt 0.4 181 253 290 362 43512 05464535 Prairie Creek Tributary near Van Horne 0.6 276 386 441 552 66213 05464562 Thunder Creek at Blairstown 0.5 234 327 374 467 56114 05485940 Cedar Creek Tributary No. 2 near Winterset 0.4 191 268 306 382 45915 05453900 Rapid Creek Tributary near Oasis 0.7 339 475 543 679 81516 05448600 East Branch Iowa River above Hayfield 0.2 132 185 212 265 31817 05414600 Little Maquoketa River Tributary at Dubuque 1.0 662 927 1,060 1,320 1,59018 06483420 Schutte Creek near Sibley 0.4 271 380 434 543 65119 05453850 Rapid Creek Tributary No. 3 near Oasis 0.6 414 580 663 829 99520 05480993 Brewers Creek Tributary near Webster City 0.2 143 200 229 286 34421 0660683710 Halfway Creek at Schaller 0.6 435 609 696 870 1,04022 0547209280 Snipe Creek Tributary at Melbourne 0.6 439 614 702 877 1,05023 05418645 Williams Creek near Charlotte 0.8 587 822 940 1,170 1,41024 05416200 Lamont Creek Tributary near Lamont 0.6 442 619 708 885 1,06025 05453700 Rapid Creek Tributary No. 4 near Oasis 0.6 471 660 754 943 1,130

Comparisons of Estimates of Annual Exceedance-Probability Discharges 17
1. For all streamgages statewide.
2. For all streamgages statewide with more than 22 years of systematic annual peaks that were included in the EMA/MGB analysis.
3. For all streamgages statewide with annual peak-dis-charge records through the 2012 or 2013 water year.
4. For all streamgages statewide with more than 22 years of systematic annual peaks that were included in the EMA/MGB analysis and with annual peak-discharge records through the 2012 or 2013 water year.
5. For streamgages within the flood region areas (fig. 1) defined for Iowa (Eash and others, 2013).
6. For streamgages within the landform regions (fig. 2) defined for Iowa (Prior, 1991; Prior and others, 2009).
The number of streamgages evaluated for each dataset comparison (tables 12–15) is noted with “n.” Values of n in the dataset comparisons range from 10 to 55. Information in these tables needs to be used with caution because comparisons for datasets with small values of “n” provide limited information on the accuracy of the AEPD estimates for different AEPD-estimation methods.
The AEPD-estimation methods that provide results for the best overall accuracy (tables 12 and 14) and the least overall bias (tables 13 and 15) are highlighted to compare the 13 datasets:1. Tables 12 and 14 show the lowest MPRE values (high-
lighted in gold) and show MPRE values that are within a magnitude of 5 percent of the lowest MPRE value (highlighted in yellow) for each AEP to indicate the AEPD-estimation method with the best overall accuracy when compared to the EMA/MGB AEPD.
2. Tables 13 and 15 show mean ratio values that are the closest value to 1.0 (highlighted in gold) and show mean ratio values with an absolute value difference from 1.0 that is determined by adding 0.05 to the absolute value difference between the closest value and 1.0 (highlighted in yellow) for each AEP to indicate the AEPD-estimation method with the least overall bias when compared to the EMA/MGB AEPD. For example, if the closest value to 1.0 is 1.12 (value highlighted in gold), which has an absolute value difference from 1.0 of 0.12, then adding 0.05 to 0.12 equals 0.17; thus mean ratio values within a range from 0.83 to 1.17 are highlighted in yellow.
The 5-percent threshold for MPRE, and the 0.05 thresh-old for mean ratio, are arbitrary and are used to indicate other AEPD-estimation methods that also are considered to provide reasonable accuracy or less bias. Three AEPDs (4, 2, and 1 percent) were specifically selected by the Iowa DOT for comparison because these AEPDs are used most frequently by Iowa DOT for flood estimation (bold red text in tables 12–15).
Drainage Basins with Areas less than 2 Square Miles
Comparisons of estimates of AEPDs for drainage basins with areas less than 2 mi2 are listed in tables 12 and 13 for 25 streamgages in Iowa (figs. 1–3). All 25 of these streamgages are CSGs (table 1).
Evaluation of Comparisons of Estimates for Selected Annual Exceedance-Probability Discharges of 4, 2, and 1 percent
Three AEPDs of 4, 2, and 1 percent were specifically selected because these AEPDs are used most frequently by Iowa DOT for flood estimation (as noted with bold red text in tables 12 and 13).
On the basis of the mean ratio results for all 25 streamgages for AEPs of 4, 2, and 1 percent (first comparison in table 13):1. The 2013 multi- and single-variable RREs tend to over-
estimate AEPDs with mean ratios of 1.34 to 1.36, and 1.45 to 1.56, respectively.
2. The 1987 single-variable RREs tend to overestimate AEPDs with mean ratios of 1.11 to 1.12.
3. The TR-55 method tends to overestimate AEPDs with mean ratios of 1.09 to 1.11.
4. The Iowa Runoff Chart method tends to underestimate AEPDs with mean ratios of 0.73 to 0.74.
Results of the four statewide comparisons for MPRE and mean ratio (first four comparisons in tables 12 and 13) indicate that the TR-55 method provides the best overall accuracy and that the TR-55 method and the 1987 single-variable RREs provide the least bias of the five AEPD-estimation methods evaluated.
Flood region 2 (last comparison in tables 12 and 13) is the only flood region or landform region dataset with at least 10 streamgages in which data could be compiled for compari-sons. Results for flood region 2 for MPRE and mean ratio indi-cate that the 1987 single-variable RREs and the TR-55 method seem to provide the best overall accuracy and the least bias.
The best overall accuracy and the least overall bias for AEPD estimation for ungaged drainage basins in Iowa with areas less than 2 mi2 may be achieved for AEPDs of 4, 2, and 1 percent:1. Use of the TR-55 method for sites in flood regions 1 and
3 (fig. 1).
2. Use of the 1987 single-variable RREs for sites in flood region 2 (fig. 1).
In the Des Moines Lobe landform region (fig. 2), the 1987 single-variable RREs are not applicable for drainage
18
Comparisons of Estim
ates of Annual Exceedance-Probability Discharges for Small Drainage Basins in Iow
aTable 12. Comparisons of mean percent relative errors for estimates of annual exceedance-probability discharge for drainage basins with areas less than 2 square miles, Iowa.
[Annual exceedance probabilities (AEPs) of 4, 2, and 1 percent specifically selected by the Iowa Department of Transportation for comparison are noted with bold red text; water year, is the 12-month period from October 1 through September 30. The water year is designated by the calendar year in which the water year ends and includes 9 of the 12 months of that year; %, percent; n, number of streamgages included in comparison mean; MRRE20131; SRRE20132; SRRE19873; ND, not determined; TR-554; MPRE–EMA/MGB5; IRC6. Cells highlighted in gold indicate the lowest MPRE value for each AEP and cells highlighted in yellow indicate a value that is within a magnitude of 5 percent of the lowest MPRE value]
Flood-estimation
method
Annual exceedance probability Flood-estimation
method
Annual exceedance probability
50% 20% 10% 4% 2% 1% 0.5% 0.2% n 50% 20% 10% 4% 2% 1% 0.5% 0.2% n
MPRE-EMA/MGB for all streamgages statewide (%)MPRE-EMA/MGB for all streamgages statewide with more than 22 years of systematic peaks included in the EMA/MGB analysis and with annual
peak-discharge record through the 2012 or 2013 water year (%) MRRE2013 66.0 42.9 41.0 46.5 49.8 53.5 65.5 62.5 25 MRRE2013 82.8 44.0 40.7 44.4 47.8 52.5 63.9 62.8 12SRRE2013 61.7 50.4 53.2 62.8 70.6 79.1 86.4 94.6 25 SRRE2013 76.7 56.8 60.9 72.5 81.5 92.7 103.0 114.1 12SRRE1987 75.0 45.7 41.3 41.8 44.0 46.7 ND ND 25 SRRE1987 92.4 50.5 46.0 46.7 49.1 52.7 ND ND 12TR-55 100.9 40.5 31.6 31.4 34.5 38.9 42.2 47.4 25 TR-55 120.9 40.2 29.6 31.1 34.3 39.8 43.6 49.3 12IRC ND 36.8 33.1 40.1 42.8 45.3 ND ND 25 IRC ND 36.8 34.1 43.1 44.9 46.5 ND ND 12
MPRE-EMA/MGB for all streamgages statewide with more than 22 years of systematic peaks included in the EMA/MGB analysis (%)
MPRE-EMA/MGB for streamgages within flood region 2 (fig. 1) (%)
MRRE2013 77.3 46.5 43.1 45.4 46.9 49.5 59.9 56.1 17 MRRE2013 80.2 52.7 49.8 57.6 60.9 64.9 82.5 76.4 16SRRE2013 72.2 55.6 57.1 65.1 72.1 80.3 87.5 95.2 17 SRRE2013 71.1 55.6 55.4 63.7 71.2 80.3 88.3 97.5 16SRRE1987 81.2 45.5 40.6 40.3 42.1 44.5 ND ND 17 SRRE1987 81.7 41.2 32.1 29.7 30.9 33.6 ND ND 16TR-55 111.6 44.0 32.8 31.1 31.9 34.8 36.6 40.0 17 TR-55 98.6 41.3 31.6 32.8 35.6 40.3 43.6 49.5 16IRC ND 34.9 31.8 39.6 40.6 41.4 ND ND 17 IRC ND 33.6 30.7 37.0 38.7 40.7 ND ND 16
MPRE-EMA/MGB for all streamgages statewide with annual peak-discharge records through the 2012 or 2013 water year (%)
MRRE2013 69.5 41.3 39.0 46.3 51.9 58.1 72.5 72.0 17SRRE2013 62.3 50.4 55.2 69.0 79.9 92.0 102.8 115.2 17SRRE1987 73.1 47.5 46.0 49.8 54.4 59.4 ND ND 17TR-55 103.0 38.8 31.7 35.3 40.9 48.0 53.5 61.4 17IRC ND 38.6 35.5 43.9 47.3 50.6 ND ND 17
1StreamStats 2013 multivariable RREs method (tables 9–11 in Eash and others, 2013).22013 single-variable RREs method (table 15 in Eash and others, 2013). 31987 single-variable RREs (table 2 in Lara, 1987).4TR-55 rainfall-runoff model (Natural Resources Conservation Service, 2009).5Mean percent relative error (MPRE) between flood-estimation method estimates and expected moments algorithm/multiple Grubbs-Beck test (EMA/MGB) estimates (Cohn and others, 1997, 2001, 2013;
Eash and others, 2013).6Iowa Runoff Chart (IRC) method (Iowa Department of Transportation, 2014b).

Comparisons of Estim
ates of Annual Exceedance-Probability Discharges
19Table 13. Comparisons of mean ratios for estimates of annual exceedance-probability discharge for drainage basins with areas less than 2 square miles, Iowa.
[Annual exceedance probabilities (AEPs) of 4, 2, and 1 percent specifically selected by the Iowa Department of Transportation for comparison are noted with bold red text; water year, is the 12-month period from October 1 through September 30. The water year is designated by the calendar year in which the water year ends and includes 9 of the 12 months of that year; %, percent; n, number of streamgages included in comparison mean; MRRE20131; SRRE20132; SRRE19873; ND, not determined; TR-554; mean-ratio EMA/MGB5; IRC6. Cells highlighted in gold indicate the mean ratio value closest to 1.0 for each AEP and cells highlighted in yellow indicate values within an absolute value difference from 1.0 that is determined by adding 0.05 to the absolute value difference between the closest value (cell highlighted in gold) and 1.0. For example, if the closest value to 1.0 is 1.12 (cell highlighted in gold), which has an absolute value difference from 1.0 of 0.12, then adding 0.05 to 0.12 equals 0.17; thus mean ratio values within a range from 0.83 to 1.17 are highlighted in yellow]
Flood-estimation
method
Annual exceedance probability Flood-estimation
method
Annual exceedance probability
50% 20% 10% 4% 2% 1% 0.5% 0.2% n 50% 20% 10% 4% 2% 1% 0.5% 0.2% n
Mean-ratio EMA/MGB for all streamgages statewideMean-ratio EMA/MGB for all streamgages statewide with more than 22 years of systematic peaks included in the EMA/MGB analysis and
with annual peak-discharge record through the 2012 or 2013 water year MRRE2013 1.47 1.30 1.31 1.36 1.35 1.34 1.45 1.36 25 MRRE2013 1.69 1.37 1.34 1.36 1.33 1.31 1.41 1.32 12SRRE2013 1.33 1.31 1.37 1.45 1.51 1.56 1.61 1.66 25 SRRE2013 1.58 1.46 1.52 1.60 1.67 1.74 1.80 1.86 12SRRE1987 1.54 1.20 1.13 1.11 1.11 1.12 ND ND 25 SRRE1987 1.66 1.20 1.11 1.09 1.10 1.11 ND ND 12TR-55 1.89 1.23 1.12 1.09 1.09 1.11 1.13 1.17 25 TR-55 2.10 1.27 1.14 1.09 1.10 1.12 1.14 1.18 12IRC ND 1.04 0.95 0.74 0.73 0.73 ND ND 25 IRC ND 1.00 0.90 0.69 0.69 0.68 ND ND 12
Mean-ratio EMA/MGB for all streamgages statewide with more than 22 years of systematic peaks included in the EMA/MGB analysis
Mean-ratio EMA/MGB for streamgages within flood region 2 (fig. 1)
MRRE2013 1.61 1.37 1.35 1.37 1.33 1.31 1.40 1.30 17 MRRE2013 1.54 1.37 1.43 1.53 1.53 1.52 1.70 1.59 16SRRE2013 1.51 1.45 1.50 1.56 1.61 1.66 1.70 1.74 17 SRRE2013 1.39 1.40 1.49 1.59 1.66 1.72 1.78 1.85 16SRRE1987 1.60 1.21 1.12 1.09 1.08 1.09 ND ND 17 SRRE1987 1.59 1.23 1.16 1.14 1.14 1.16 ND ND 16TR-55 1.99 1.25 1.13 1.08 1.08 1.09 1.11 1.14 17 TR-55 1.84 1.24 1.15 1.12 1.13 1.16 1.19 1.23 16IRC ND 1.02 0.93 0.71 0.70 0.69 ND ND 17 IRC ND 1.00 0.95 0.75 0.76 0.77 ND ND 16
Mean-ratio EMA/MGB for all streamgages statewide with annual peak-discharge records through the 2012 or 2013 water year
MRRE2013 1.48 1.28 1.29 1.35 1.35 1.36 1.49 1.42 17SRRE2013 1.35 1.32 1.40 1.51 1.60 1.68 1.75 1.84 17SRRE1987 1.45 1.13 1.09 1.10 1.12 1.15 ND ND 17TR-55 1.90 1.22 1.12 1.11 1.13 1.17 1.21 1.27 17IRC ND 1.00 0.94 0.74 0.75 0.76 ND ND 17
1StreamStats 2013 multivariable RREs method (tables 9–11 in Eash and others, 2013).22013 single-variable RREs method (table 15 in Eash and others, 2013). 31987 single-variable RREs (table 2 in Lara, 1987).4TR-55 rainfall-runoff model (Natural Resources Conservation Service, 2009).5Mean ratio between flood-estimation method estimates and expected moments algorithm/multiple Grubbs-Beck test (EMA/MGB) estimates (Cohn and others, 1997, 2001, 2013; Eash and others, 2013).6Iowa Runoff Chart (IRC) method (Iowa Department of Transportation, 2014b).

20
Comparisons of Estim
ates of Annual Exceedance-Probability Discharges for Small Drainage Basins in Iow
aTable 14. Comparisons of mean percent relative errors for estimates of annual exceedance-probability discharge for drainage basins with areas between 2 and 20 square miles, Iowa.
[Annual exceedance probabilities (AEPs) of 4, 2, and 1 percent specifically selected by the Iowa Department of Transportation for comparison are noted with bold red text; water year, is the 12-month period from October 1 through September 30. The water year is designated by the calendar year in which the water year ends and includes 9 of the 12 months of that year; %, percent; n, number of streamgages included in comparison mean; MRRE20131; SRRE20132; SRRE19873; ND, not determined; TR-554; MPRE–EMA/MGB5. Cells highlighted in gold indicate the lowest MPRE value for each AEP and cells highlighted in yellow indicate a value that is within a magnitude of 5 percent of the lowest MPRE value]
Flood-estimation
method
Annual exceedance probability Flood-estimation
method
Annual exceedance probability
50% 20% 10% 4% 2% 1% 0.5% 0.2% n 50% 20% 10% 4% 2% 1% 0.5% 0.2% n
MPRE-EMA/MGB for all streamgages statewide (%) MPRE-EMA/MGB for streamgages within flood region 2 (fig. 1) (%)
MRRE2013 73.1 41.0 35.9 37.2 39.6 42.8 48.7 51.3 55 MRRE2013 70.8 34.3 30.6 34.6 39.0 43.7 52.2 55.1 32SRRE2013 69.1 39.4 33.7 35.7 39.0 42.8 46.9 51.8 55 SRRE2013 64.9 33.8 29.2 33.8 38.9 44.0 48.8 54.5 32SRRE1987 82.2 41.6 35.4 35.0 37.2 40.8 ND ND 55 SRRE1987 79.5 36.7 31.7 32.0 34.4 38.3 ND ND 32TR-55 110.0 55.8 50.2 52.0 55.7 60.7 65.9 73.0 51 TR-55 60.4 35.1 35.0 40.9 46.8 53.0 59.0 67.2 30
MPRE-EMA/MGB for all streamgages statewide with more than 22 years of systematic peaks included in the EMA/MGB analysis (%)
MPRE-EMA/MGB for streamgages within flood region 3 (fig.1) (%)
MRRE2013 80.4 42.0 34.3 33.1 35.3 37.8 41.3 44.0 41 MRRE2013 76.4 50.4 42.8 41.5 42.5 44.2 46.7 48.8 16SRRE2013 78.0 42.6 34.2 34.1 36.4 38.8 42.0 45.6 41 SRRE2013 70.4 42.1 36.1 35.5 36.9 38.6 41.2 44.5 16SRRE1987 94.8 45.7 36.1 32.7 33.5 35.9 ND ND 41 SRRE1987 66.8 34.0 28.5 29.3 32.2 36.7 ND ND 16TR-55 121.4 57.8 50.4 50.1 52.0 55.5 59.4 64.7 37 TR-55 131.1 52.3 41.9 38.5 38.4 41.0 44.2 48.4 16
MPRE-EMA/MGB for all streamgages statewide with annual peak-discharge record through the 2012 or 2013 water year (%)
MPRE-EMA/MGB for streamgages within the Southern Iowa Drift Plain landform region (fig. 2) (%)
MRRE2013 62.9 39.4 32.0 30.1 31.1 33.3 36.6 40.0 23 MRRE2013 51.2 37.5 37.1 44.0 48.7 53.4 63.5 65.8 29SRRE2013 61.9 36.2 28.7 29.0 31.3 33.7 36.8 40.8 23 SRRE2013 49.4 33.8 32.6 38.9 44.9 50.5 56.0 62.4 29SRRE1987 61.5 41.1 38.1 39.5 42.3 45.4 ND ND 23 SRRE1987 45.5 29.3 29.7 33.5 37.2 41.3 ND ND 29TR-55 105.3 46.7 39.8 38.5 40.7 44.8 49.6 55.6 23 TR-55 98.1 46.3 42.7 45.1 50.0 56.8 63.9 73.3 29
MPRE-EMA/MGB for all streamgages statewide with more than 22 years of systematic peaks included in the EMA/MGB analysis and with annual peak-
discharge record through the 2012 or 2013 water year (%)
MPRE-EMA/MGB for streamgages within the Iowan Surface landform region (fig. 2) (%)
MRRE2013 70.1 44.6 33.9 30.0 31.0 32.6 33.8 37.4 17 MRRE2013 49.1 24.5 19.3 19.2 22.3 25.7 27.1 31.2 10SRRE2013 71.8 42.2 32.3 29.5 30.2 31.3 33.5 36.5 17 SRRE2013 45.6 24.8 20.4 23.3 25.4 26.9 29.1 32.0 10SRRE1987 66.8 43.5 36.9 35.2 37.4 39.3 ND ND 17 SRRE1987 54.4 33.2 31.6 34.6 38.0 39.8 ND ND 10TR-55 116.7 45.9 36.7 33.0 33.4 36.3 39.8 44.0 17 TR-55 62.2 32.1 31.2 35.4 37.9 39.3 40.3 42.0 10
1StreamStats 2013 multivariable RREs method (tables 9–11 in Eash and others, 2013).22013 single-variable RREs method (table 15 in Eash and others, 2013). 31987 single-variable RREs (table 2 in Lara, 1987).4TR-55 rainfall-runoff model (Natural Resources Conservation Service, 2009).5Mean percent relative error (MPRE) between flood-estimation method estimates and expected moments algorithm/multiple Grubbs-Beck test (EMA/MGB) estimates (Cohn and others, 1997, 2001, 2013;
Eash and others, 2013).
Comparisons of Estim
ates of Annual Exceedance-Probability Discharges
21Table 15. Comparisons of mean ratios for estimates of annual exceedance-probability discharge for drainage basins with areas between 2 and 20 square miles, Iowa.
[Annual exceedance probabilities (AEPs) of 4, 2, and 1 percent specifically selected by the Iowa Department of Transportation for comparison are noted with bold red text; water year, is the 12-month period from October 1 through September 30. The water year is designated by the calendar year in which the water year ends and includes 9 of the 12 months of that year; %, percent; n, number of streamgages included in comparison mean; MRRE20131; SRRE20132; SRRE19873; ND, not determined; TR-554; mean-ratio EMA/MGB5. Cells highlighted in gold indicate the mean ratio value closest to 1.0 for each AEP and cells highlighted in yellow indicate values within an absolute value difference from 1.0 that is determined by adding 0.05 to the absolute value difference between the closest value (cell highlighted in gold) and 1.0. For example, if the closest value to 1.0 is 1.12 (cell highlighted in gold), which has an absolute value difference from 1.0 of 0.12, then adding 0.05 to 0.12 equals 0.17; thus mean ratio values within a range from 0.83 to 1.17 are highlighted in yellow]
Flood-estimation
method
Annual exceedance probability Flood-estimation
method
Annual exceedance probability
50% 20% 10% 4% 2% 1% 0.5% 0.2% n 50% 20% 10% 4% 2% 1% 0.5% 0.2% n
Mean-ratio EMA/MGB for all streamgages statewide Mean-ratio EMA/MGB for streamgages within flood region 2 (fig. 1)
MRRE2013 1.50 1.21 1.15 1.15 1.12 1.10 1.17 1.10 55 MRRE2013 1.39 1.07 1.08 1.13 1.12 1.11 1.23 1.14 32SRRE2013 1.39 1.14 1.09 1.06 1.06 1.05 1.05 1.05 55 SRRE2013 1.21 1.03 1.02 1.04 1.05 1.07 1.09 1.11 32SRRE1987 1.60 1.12 1.00 0.93 0.90 0.88 ND ND 55 SRRE1987 1.49 1.00 0.91 0.86 0.84 0.84 ND ND 32TR-55 1.99 1.36 1.26 1.24 1.26 1.29 1.32 1.37 51 TR-55 1.44 1.09 1.06 1.08 1.12 1.16 1.21 1.27 30
Mean-ratio EMA/MGB for all streamgages statewide with more than 22 years of systematic peaks included in the EMA/MGB analysis
Mean-ratio EMA/MGB for streamgages within flood region 3 (fig. 1)
MRRE2013 1.58 1.19 1.10 1.07 1.03 1.00 1.04 0.97 41 MRRE2013 1.69 1.43 1.26 1.19 1.13 1.10 1.08 1.03 16SRRE2013 1.48 1.14 1.06 1.01 0.99 0.97 0.96 0.95 41 SRRE2013 1.63 1.27 1.15 1.05 1.00 0.95 0.92 0.88 16SRRE1987 1.72 1.12 0.97 0.87 0.82 0.80 ND ND 41 SRRE1987 1.59 1.17 1.05 0.93 0.89 0.85 ND ND 16TR-55 2.10 1.35 1.23 1.19 1.19 1.20 1.22 1.26 37 TR-55 2.27 1.38 1.20 1.11 1.08 1.07 1.07 1.08 16
Mean-ratio EMA/MGB for all streamgages statewide with annual peak-discharge record through the 2012 or 2013 water year
Mean-ratio EMA/MGB for streamgages within the Southern Iowa Drift Plain landform region (fig. 2)
MRRE2013 1.30 1.13 1.06 1.05 1.02 1.00 1.04 0.98 23 MRRE2013 1.25 1.18 1.18 1.24 1.25 1.26 1.37 1.30 29SRRE2013 1.22 1.03 0.98 0.94 0.93 0.92 0.91 0.90 23 SRRE2013 1.15 1.08 1.10 1.12 1.15 1.17 1.20 1.22 29SRRE1987 1.29 1.00 0.93 0.87 0.85 0.84 ND ND 23 SRRE1987 1.21 1.01 0.97 0.95 0.95 0.96 ND ND 29TR-55 1.93 1.26 1.15 1.12 1.13 1.14 1.17 1.21 23 TR-55 1.87 1.33 1.26 1.26 1.29 1.34 1.38 1.45 29
Mean-ratio EMA/MGB for all streamgages statewide with more than 22 years of systematic peaks included in the EMA/MGB analysis and with annual peak-
discharge record through the 2012 or 2013 water year
Mean-ratio EMA/MGB for streamgages within the Iowan Surface landform region (fig. 2)
MRRE2013 1.36 1.13 1.03 0.99 0.95 0.92 0.94 0.87 17 MRRE2013 1.22 0.96 0.94 0.94 0.90 0.87 0.94 0.84 10SRRE2013 1.31 1.05 0.98 0.92 0.88 0.86 0.84 0.81 17 SRRE2013 1.07 0.91 0.88 0.86 0.85 0.84 0.83 0.81 10SRRE1987 1.30 0.95 0.85 0.77 0.73 0.71 ND ND 17 SRRE1987 1.18 0.81 0.72 0.65 0.62 0.60 ND ND 10TR-55 2.00 1.22 1.09 1.02 1.01 1.01 1.02 1.04 17 TR-55 1.45 0.93 0.85 0.81 0.80 0.81 0.81 0.82 10
1StreamStats 2013 multivariable RREs method (tables 9–11 in Eash and others, 2013).22013 single-variable RREs method (table 15 in Eash and others, 2013). 31987 single-variable RREs (table 2 in Lara, 1987).4TR-55 rainfall-runoff model (Natural Resources Conservation Service, 2009).5Mean ratio between flood-estimation method estimates and expected moments algorithm/multiple Grubbs-Beck test (EMA/MGB) estimates (Cohn and others, 1997, 2001, 2013; Eash and others, 2013).
22 Comparisons of Estimates of Annual Exceedance-Probability Discharges for Small Drainage Basins in Iowa
basins with areas less than 7.9 mi2 in hydrologic region 4 and for areas less than 45 mi2 in hydrologic region 5 (fig. 3).
Evaluation of Comparisons of Estimates for All Annual Exceedance-Probability Discharges
Although eight AEPs were estimated for three AEPD-estimation methods (tables 4, 8, and 10), comparisons of esti-mates of AEPDs are limited to six AEPs for the 1987 single-variable RREs (table 9) and to five AEPs for the Iowa Runoff Chart method (table 11). Thus, comparisons were evaluated for the different AEPD-estimation methods according to the available AEPs. First, comparisons were evaluted for five AEPs (20, 10, 4, 2, and 1 percent) for all five AEPD-estima-tion methods, (hereafter, these five comparisons are referred to as “AEP5”). Second, comparisons were evaluated for one AEP (50 percent) for four AEPD-estimation methods that did not include the Iowa Runoff Chart method (hereafter, these comparisons are referred to as “AEP1”). Third, comparisons were evaluated for two AEPs (0.5 and 0.2 percent) for three AEPD-estimation methods that did not include the Iowa Run-off Chart method or the 1987 single-variable RREs (hereafter, these comparisons are referred to as “AEP2”).
On the basis of the mean ratio results for all 25 streamgages for all estimates of AEPDs (first comparison in table 13):1. The 2013 multi- and single-variable RREs tend to
overestimate AEPDs with mean ratios of 1.47 and 1.33, respectively, for an AEP of 50 percent and with mean ratios of 1.36 and 1.66, respectively, for an AEP of 0.2 percent.
2. The 1987 single-variable RREs tend to overestimate AEPDs with mean ratios of 1.54 for an AEP of 50 per-cent and 1.12 for an AEP of 1 percent.
3. The TR-55 method tends to overestimate AEPDs with mean ratios of 1.89 for an AEP of 50 percent and 1.17 for an AEP of 0.2 percent.
4. The Iowa Runoff Chart Method tends to primarily under-estimate AEPDs with mean ratios of 1.04 for an AEP of 20 percent and 0.73 for an AEP of 1 percent.
Results of the four statewide comparisons for MPRE and mean ratio (first four comparisons in tables 12 and 13), indi-cate that the TR-55 method provides the best overall accuracy and that the 1987 single-variable RREs and the TR-55 method provide the least bias of the five AEPD-estimation methods evaluated for the AEP5 comparisons. The Iowa Runoff Chart method seems to provide the best overall accuracy and the least bias for an AEP of 20 percent and reasonable accuracy and the least bias for an AEP of 10 percent.
For flood region 2 (fig. 1; last comparison in tables 12 and 13), which is the only flood region or landform region dataset with at least 10 streamgages in which data could be compiled for comparisons:
1. The 1987 single-variable RREs seem to provide the best overall accuracy and the third overall least bias for the AEP5 comparisons.
2. The TR-55 method seems to provide the third overall best accuracy and the second overall least bias for the AEP5 comparisons.
3. The Iowa Runoff Chart method seems to provide the second best overall accuracy and the least overall bias for the AEP5 comparisons.
4. Results for AEPs of 20 and 10 percent indicate that the Iowa Runoff Chart method provides the best accuracy and the least bias.
For the AEP1 comparisons, the 2013 single-variable RREs seem to provide the best overall accuracy and the least bias for the statewide and flood region 2 (fig.1) comparisons (tables 12 and 13). For the AEP2 comparisons, the TR-55 method seems to provide the best overall accuracy and the least bias for the statewide and flood region 2 comparisons (tables 12 and 13).
Comparison of results for AEP5, AEP1, and AEP2 seem to indicate that the best accuracy and the least bias may be achieved by the use of different AEPD-estimation methods for different AEPs. The use of different AEPD-estimation methods for different AEPs is not appropriate because this approach could lead to predictive inconsistencies. For example, a 10-percent AEPD estimate could be greater than a 4-percent AEPD estimate.
The best overall accuracy and the least overall bias for AEPD estimation for ungaged drainage basins in Iowa with areas less than 2 mi2 may be achieved for all AEPDs: 1. Use of the TR-55 method for sites in flood regions 1 and
3 (fig. 1).
2. Use of the 1987 single-variable RREs for sites in flood region 2 (fig. 1).
In the Des Moines Lobe landform region (fig. 2), the 1987 single-variable RREs are not applicable for drainage basins with areas less than 7.9 mi2 in hydrologic region 4 and for areas less than 45 mi2 in hydrologic region 5 (fig. 3).
Drainage Basins with Areas Between 2 and 20 Square Miles
Comparisons of estimates of AEPDs for drainage basins with areas between 2 and 20 mi2 are listed in tables 14 and 15 for 55 streamgages in Iowa (figs. 1–3). Forty-five of these streamgages are CSGs and 10 are continuous-record streamgages (table 1). Because Tc values calculated for 4 streamgages exceeded 10 hours (table 10, streamgages with map numbers 69, 70, 73, and 77), estimates of AEPDs were not calculated using the WinTR-55 model for these four streamgages; thus, data for 51 streamgages were included in the comparisons for the TR-55 method (tables 14 and 15).

Comparisons of Estimates of Annual Exceedance-Probability Discharges 23
Four AEPD-estimation methods were compared for drainage basins with areas between 2 and 20 mi2. The Iowa Runoff Chart method is not applicable for drainage areas greater that 2 mi2.
Evaluation of Comparisons of Estimates for Selected Annual Exceedance-Probability Discharges of 4, 2, and 1 percent
Three AEPDs of 4, 2, and 1 percent were specifically selected because these AEPDs are used most frequently by Iowa DOT for flood estimation (as noted with bold red text in tables 14 and 15). On the basis of the mean ratio results for all 55 streamgages for AEPs of 4, 2, and 1 percent (51 streamgages for the TR-55 method, first comparison in table 15):1. The 2013 multi- and single-variable RREs tend to over-
estimate AEPDs with mean ratios of 1.10 to 1.15, and 1.05 to 1.06, respectively.
2. The 1987 single-variable RREs tend to underestimate AEPDs with mean ratios of 0.88 to 0.93.
3. The TR-55 method tends to overestimate AEPDs with mean ratios of 1.24 to 1.29.
Results of the four statewide comparisons for MPRE and mean ratio (first four comparisons in tables 14 and 15) indicate that each of the four AEPD-estimation methods may provide the best (or reasonable) accuracy, and that each of the four AEPD-estimation methods may provide the least (or reason-ably low) bias dependent on the statewide dataset evaluated for AEPDs of 4, 2, and 1 percent.
For the four regional comparisons (last four compari-sons in tables 14 and 15), which are the only flood region or landform region (Prior, 1991; Prior and others, 2009) datasets with at least 10 streamgages in which data could be compiled for comparions:1. The 1987 single-variable RREs seem to provide the best
overall accuracy and the least bias for the Southern Iowa Drift Plain landform region (fig. 2).
2. The 2013 multivariable RREs seem to provide the best overall accuracy and the least bias for the Iowan Surface landform region (fig. 2).
3. For flood regions 2 and 3 (fig. 1), the 1987 single-vari-able RREs seem to provide the best overall accuracy; the 2013 single-variable RREs seem to provide the second best accuracy and the least overall bias.
The best overall accuracy and the least overall bias for AEPD estimation for ungaged drainage basins in Iowa with areas between 2 and 20 mi2 may be achieved for AEPDs of 4, 2, and 1 percent: 1. Use of the 1987 single-variable RREs for sites in the
Southern Iowa Drift Plain landform region (fig. 2).
2. Use of the 2013 multivariable RREs for sites in the Iowan Surface landform region (fig. 2).
3. Use of the 1987 single-variable RREs may provide the best overall accuracy and use of the 2013 single-variable RREs may provide the second best overall accuracy and the least overall bias for sites in all other landform regions in Iowa.
In the Des Moines Lobe landform region, the 1987 single-variable RREs are not applicable for drainage basins with areas less than 7.9 mi2 in hydrologic region 4 and for areas less than 45 mi2 in hydrologic region 5 (fig. 3).
Evaluation of Comparisons of Estimates for All Annual Exceedance-Probability Discharges
Although eight AEPs were estimated for three AEPD-estimation methods (tables 4, 8, and 10), comparisons of esti-mates of AEPDs are limited to six AEPs for the 1987 single-variable RREs (table 9). Thus, comparisons were evaluated for the different AEPD-estimation methods according to the available AEPs. First, comparisons were evaluted for six AEPs (50, 20, 10, 4, 2, and 1 percent) for all four AEPD-estimation methods (hereafter, these four comparisons are referred to as “AEP6”). Second, comparisons were evaluated for two AEPs (0.5 and 0.2 percent) for three AEPD-estimation methods that did not include the 1987 single-variable RREs; as noted previously in this report, these comparisons are referred to as “AEP2.”
On the basis of the mean ratio results for all 55 streamgages for all estimates of AEPDs (51 streamgages for the TR-55 method, first comparison in table 15):1. The 2013 multi- and single-variable RREs tend to
overestimate AEPDs with mean ratios of 1.50 and 1.39, respectively, for an AEP of 50 percent and with mean ratios of 1.10 and 1.05, respectively, for an AEP of 0.2 percent.
2. The 1987 single-variable RREs tend to overestimate and underestimate AEPDs with mean ratios of 1.60 for an AEP of 50 percent and 0.88 for an AEP of 1 percent.
3. The TR-55 method tends to overestimate AEPDs with mean ratios of 1.99 for an AEP of 50 percent and 1.37 for an AEP of 0.2 percent.
Results of the four statewide comparisons for MPRE and mean ratio (51 streamgages for the TR-55 method, first four comparisons in tables 14 and 15), seem to indicate that each of the four AEPD-estimation methods may provide the best (or reasonable) accuracy, and that each of the four AEPD-estima-tion methods may provide the least (or a reasonably low) bias dependent on the statewide dataset evaluated for the AEP6 comparisons, with the exception of the TR-55 method for an AEP of 50 percent.
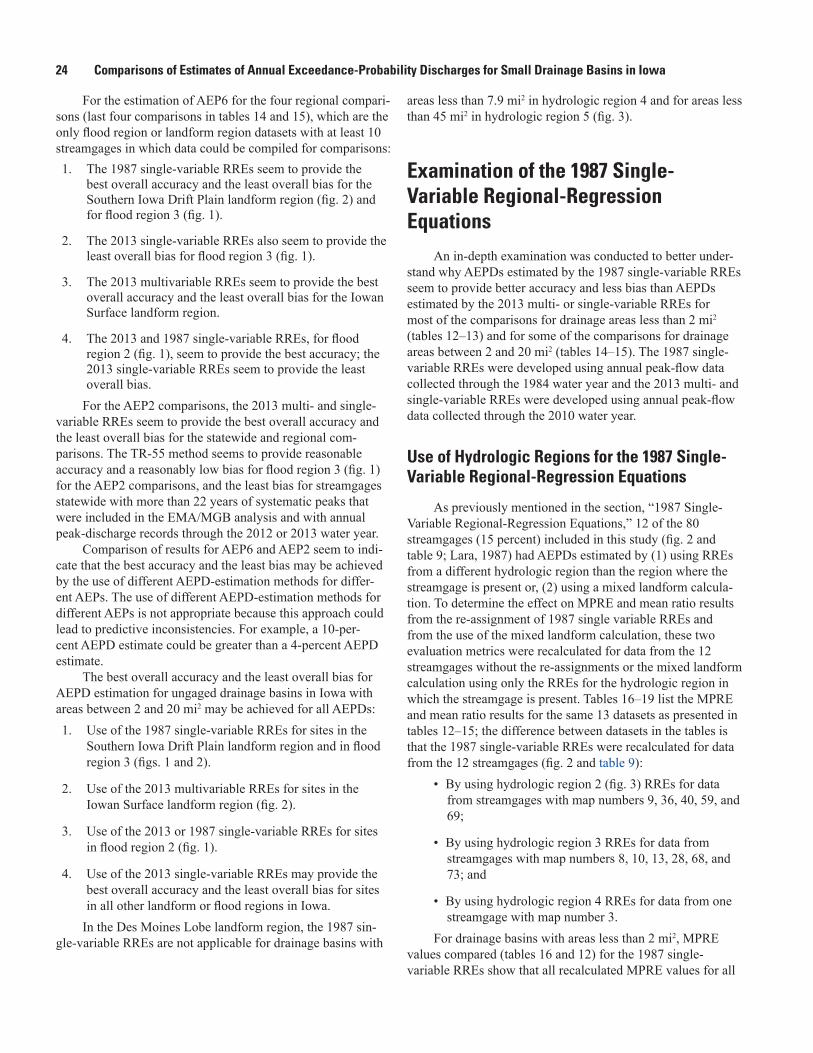
24 Comparisons of Estimates of Annual Exceedance-Probability Discharges for Small Drainage Basins in Iowa
For the estimation of AEP6 for the four regional compari-sons (last four comparisons in tables 14 and 15), which are the only flood region or landform region datasets with at least 10 streamgages in which data could be compiled for comparisons:1. The 1987 single-variable RREs seem to provide the
best overall accuracy and the least overall bias for the Southern Iowa Drift Plain landform region (fig. 2) and for flood region 3 (fig. 1).
2. The 2013 single-variable RREs also seem to provide the least overall bias for flood region 3 (fig. 1).
3. The 2013 multivariable RREs seem to provide the best overall accuracy and the least overall bias for the Iowan Surface landform region.
4. The 2013 and 1987 single-variable RREs, for flood region 2 (fig. 1), seem to provide the best accuracy; the 2013 single-variable RREs seem to provide the least overall bias.
For the AEP2 comparisons, the 2013 multi- and single-variable RREs seem to provide the best overall accuracy and the least overall bias for the statewide and regional com-parisons. The TR-55 method seems to provide reasonable accuracy and a reasonably low bias for flood region 3 (fig. 1) for the AEP2 comparisons, and the least bias for streamgages statewide with more than 22 years of systematic peaks that were included in the EMA/MGB analysis and with annual peak-discharge records through the 2012 or 2013 water year.
Comparison of results for AEP6 and AEP2 seem to indi-cate that the best accuracy and the least bias may be achieved by the use of different AEPD-estimation methods for differ-ent AEPs. The use of different AEPD-estimation methods for different AEPs is not appropriate because this approach could lead to predictive inconsistencies. For example, a 10-per-cent AEPD estimate could be greater than a 4-percent AEPD estimate.
The best overall accuracy and the least overall bias for AEPD estimation for ungaged drainage basins in Iowa with areas between 2 and 20 mi2 may be achieved for all AEPDs: 1. Use of the 1987 single-variable RREs for sites in the
Southern Iowa Drift Plain landform region and in flood region 3 (figs. 1 and 2).
2. Use of the 2013 multivariable RREs for sites in the Iowan Surface landform region (fig. 2).
3. Use of the 2013 or 1987 single-variable RREs for sites in flood region 2 (fig. 1).
4. Use of the 2013 single-variable RREs may provide the best overall accuracy and the least overall bias for sites in all other landform or flood regions in Iowa.
In the Des Moines Lobe landform region, the 1987 sin-gle-variable RREs are not applicable for drainage basins with
areas less than 7.9 mi2 in hydrologic region 4 and for areas less than 45 mi2 in hydrologic region 5 (fig. 3).
Examination of the 1987 Single-Variable Regional-Regression Equations
An in-depth examination was conducted to better under-stand why AEPDs estimated by the 1987 single-variable RREs seem to provide better accuracy and less bias than AEPDs estimated by the 2013 multi- or single-variable RREs for most of the comparisons for drainage areas less than 2 mi2 (tables 12–13) and for some of the comparisons for drainage areas between 2 and 20 mi2 (tables 14–15). The 1987 single-variable RREs were developed using annual peak-flow data collected through the 1984 water year and the 2013 multi- and single-variable RREs were developed using annual peak-flow data collected through the 2010 water year.
Use of Hydrologic Regions for the 1987 Single-Variable Regional-Regression Equations
As previously mentioned in the section, “1987 Single-Variable Regional-Regression Equations,” 12 of the 80 streamgages (15 percent) included in this study (fig. 2 and table 9; Lara, 1987) had AEPDs estimated by (1) using RREs from a different hydrologic region than the region where the streamgage is present or, (2) using a mixed landform calcula-tion. To determine the effect on MPRE and mean ratio results from the re-assignment of 1987 single variable RREs and from the use of the mixed landform calculation, these two evaluation metrics were recalculated for data from the 12 streamgages without the re-assignments or the mixed landform calculation using only the RREs for the hydrologic region in which the streamgage is present. Tables 16–19 list the MPRE and mean ratio results for the same 13 datasets as presented in tables 12–15; the difference between datasets in the tables is that the 1987 single-variable RREs were recalculated for data from the 12 streamgages (fig. 2 and table 9):
• By using hydrologic region 2 (fig. 3) RREs for data from streamgages with map numbers 9, 36, 40, 59, and 69;
• By using hydrologic region 3 RREs for data from streamgages with map numbers 8, 10, 13, 28, 68, and 73; and
• By using hydrologic region 4 RREs for data from one streamgage with map number 3.
For drainage basins with areas less than 2 mi2, MPRE values compared (tables 16 and 12) for the 1987 single-variable RREs show that all recalculated MPRE values for all

Examination of the 1987 Single-Variable Regional-Regression Equations
25
Table 16. Comparisons of mean percent relative errors for estimates of annual exceedance-probability discharge for drainage basins with areas less than 2 square miles that do not include the re-assignment of hydrologic regions or the use of a mixed landform calculation for the 1987 single-variable regional-regression equations.
[Annual exceedance probabilities (AEPs) of 4, 2, and 1 percent specifically selected by the Iowa Department of Transportation for comparison are noted with bold red text; water year, is the 12-month period from October 1 through September 30. The water year is designated by the calendar year in which the water year ends and includes 9 of the 12 months of that year; %, percent; n, number of streamgages included in comparison mean; MRRE20131; SRRE20132; SRRE19873; ND, not determined; TR-554; MPRE–EMA/MGB5; IRC6. Cells highlighted in gold indicate the lowest MPRE value for each AEP and cells highlighted in yellow indicate a value that is within a magnitude of 5 percent of the lowest MPRE value]
Flood-estimation
method
Annual exceedance probability Flood-estimation
method
Annual exceedance probability
50% 20% 10% 4% 2% 1% 0.5% 0.2% n 50% 20% 10% 4% 2% 1% 0.5% 0.2% n
MPRE-EMA/MGB for all streamgages statewide (%)MPRE-EMA/MGB for all streamgages statewide with more than 22 years of systematic peaks included in the EMA/MGB analysis and with annual
peak-discharge record through the 2012 or 2013 water year (%) MRRE2013 66.0 42.9 41.0 46.5 49.8 53.5 65.5 62.5 25 MRRE2013 82.8 44.0 40.7 44.4 47.8 52.5 63.9 62.8 12SRRE2013 61.7 50.4 53.2 62.8 70.6 79.1 86.4 94.6 25 SRRE2013 76.7 56.8 60.9 72.5 81.5 92.7 103.0 114.1 12SRRE1987 64.6 39.0 35.4 38.1 41.4 44.6 ND ND 25 SRRE1987 66.3 34.4 32.5 38.7 43.6 48.4 ND ND 12TR-55 100.9 40.5 31.6 31.4 34.5 38.9 42.2 47.4 25 TR-55 120.9 40.2 29.6 31.1 34.3 39.8 43.6 49.3 12IRC ND 36.8 33.1 40.1 42.8 45.3 ND ND 25 IRC ND 36.8 34.1 43.1 44.9 46.5 ND ND 12
MPRE-EMA/MGB for all streamgages statewide with more than 22 years of systematic peaks included in the EMA/MGB analysis (%)
MPRE-EMA/MGB for streamgages within flood region 2 (fig. 1) (%)
MRRE2013 77.3 46.5 43.1 45.4 46.9 49.5 59.9 56.1 17 MRRE2013 80.2 52.7 49.8 57.6 60.9 64.9 82.5 76.4 16SRRE2013 72.2 55.6 57.1 65.1 72.1 80.3 87.5 95.2 17 SRRE2013 71.1 55.6 55.4 63.7 71.2 80.3 88.3 97.5 16SRRE1987 62.8 34.1 31.0 34.6 38.2 41.5 ND ND 17 SRRE1987 62.4 29.1 22.3 24.5 28.0 32.3 ND ND 16TR-55 111.6 44.0 32.8 31.1 31.9 34.8 36.6 40.0 17 TR-55 98.6 41.3 31.6 32.8 35.6 40.3 43.6 49.5 16IRC ND 34.9 31.8 39.6 40.6 41.4 ND ND 17 IRC ND 33.6 30.7 37.0 38.7 40.7 ND ND 16
MPRE-EMA/MGB for all streamgages statewide with annual peak-discharge records through the 2012 or 2013 water year (%)
MRRE2013 69.5 41.3 39.0 46.3 51.9 58.1 72.5 72.0 17SRRE2013 62.3 50.4 55.2 69.0 79.9 92.0 102.8 115.2 17SRRE1987 54.4 33.7 33.4 40.5 46.4 52.1 ND ND 17TR-55 103.0 38.8 31.7 35.3 40.9 48.0 53.5 61.4 17IRC ND 38.6 35.5 43.9 47.3 50.6 ND ND 17
1StreamStats 2013 multivariate RREs method (tables 9–11 in Eash and others, 2013).22013 single-variable RREs method (table 15 in Eash and others, 2013). 31987 single-variable RREs (table 2 in Lara, 1987).4TR-55 rainfall-runoff model (Natural Resources Conservation Service, 2009).5Mean percent relative error (MPRE) between flood-estimation method estimates and expected moments algorithm/multiple Grubbs-Beck test (EMA/MGB) estimates (Cohn and others, 1997, 2001, 2013;
Eash and others, 2013).6Iowa Runoff Chart (IRC) method (Iowa Department of Transportation, 2014b).

26
Comparisons of Estim
ates of Annual Exceedance-Probability Discharges for Small Drainage Basins in Iow
aTable 17. Comparisons of mean ratios for estimates of annual exceedance-probability discharge for drainage basins with areas less than 2 square miles that do not include the re-assignment of hydrologic regions or the use of a mixed landform calculation for the 1987 single-variable regional-regression equations.
[Annual exceedance probabilities (AEPs) of 4, 2, and 1 percent specifically selected by the Iowa Department of Transportation for comparison are noted with bold red text; water year, is the 12-month period from October 1 through September 30. The water year is designated by the calendar year in which the water year ends and includes 9 of the 12 months of that year; %, percent; n, number of streamgages included in comparison mean; MRRE20131; SRRE20132; SRRE19873; ND, not determined; TR-554; mean-ratio EMA/MGB5; IRC6. Cells highlighted in gold indicate the mean ratio value closest to 1.0 for each AEP and cells highlighted in yellow indicate values within an absolute value difference from 1.0 that is determined by adding 0.05 to the absolute value difference between the closest value (cell highlighted in gold) and 1.0. For example, if the closest value to 1.0 is 1.12 (cell highlighted in gold), which has an absolute value difference from 1.0 of 0.12, then adding 0.05 to 0.12 equals 0.17; thus mean ratio values within a range from 0.83 to 1.17 are highlighted in yellow]
Flood-estimation
method
Annual exceedance probability Flood-estimation
method
Annual exceedance probability
50% 20% 10% 4% 2% 1% 0.5% 0.2% n 50% 20% 10% 4% 2% 1% 0.5% 0.2% n
Mean-ratio EMA/MGB for all streamgages statewideMean-ratio EMA/MGB for all streamgages statewide with more than 22 years of systematic peaks included in the EMA/MGB analysis and
with annual peak-discharge record through the 2012 or 2013 water year MRRE2013 1.47 1.30 1.31 1.36 1.35 1.34 1.45 1.36 25 MRRE2013 1.69 1.37 1.34 1.36 1.33 1.31 1.41 1.32 12SRRE2013 1.33 1.31 1.37 1.45 1.51 1.56 1.61 1.66 25 SRRE2013 1.58 1.46 1.52 1.60 1.67 1.74 1.80 1.86 12SRRE1987 1.58 1.14 1.04 0.99 0.96 0.96 ND ND 25 SRRE1987 1.40 1.04 0.98 0.97 0.97 0.98 ND ND 12TR-55 1.89 1.23 1.12 1.09 1.09 1.11 1.13 1.17 25 TR-55 2.10 1.27 1.14 1.09 1.10 1.12 1.14 1.18 12IRC ND 1.04 0.95 0.74 0.73 0.73 ND ND 25 IRC ND 1.00 0.90 0.69 0.69 0.68 ND ND 12
Mean-ratio EMA/MGB for all streamgages statewide with more than 22 years of systematic peaks included in the EMA/MGB analysis
Mean-ratio EMA/MGB for streamgages within flood region 2 (fig. 1)
MRRE2013 1.61 1.37 1.35 1.37 1.33 1.31 1.40 1.30 17 MRRE2013 1.54 1.37 1.43 1.53 1.53 1.52 1.70 1.59 16SRRE2013 1.51 1.45 1.50 1.56 1.61 1.66 1.70 1.74 17 SRRE2013 1.39 1.40 1.49 1.59 1.66 1.72 1.78 1.85 16SRRE1987 1.41 1.09 1.03 1.00 0.99 1.00 ND ND 17 SRRE1987 1.35 1.07 1.03 1.03 1.04 1.06 ND ND 16TR-55 1.99 1.25 1.13 1.08 1.08 1.09 1.11 1.14 17 TR-55 1.84 1.24 1.15 1.12 1.13 1.16 1.19 1.23 16IRC ND 1.02 0.93 0.71 0.70 0.69 ND ND 17 IRC ND 1.00 0.95 0.75 0.76 0.77 ND ND 16
Mean-ratio EMA/MGB for all streamgages statewide with annual peak-discharge records through the 2012 or 2013 water year
MRRE2013 1.48 1.28 1.29 1.35 1.35 1.36 1.49 1.42 17SRRE2013 1.35 1.32 1.40 1.51 1.60 1.68 1.75 1.84 17SRRE1987 1.21 0.97 0.93 0.95 0.96 0.99 ND ND 17TR-55 1.90 1.22 1.12 1.11 1.13 1.17 1.21 1.27 17IRC ND 1.00 0.94 0.74 0.75 0.76 ND ND 17
1StreamStats 2013 multivariate RREs method (tables 9–11 in Eash and others, 2013).22013 single-variable RREs method (table 15 in Eash and others, 2013). 31987 single-variable RREs (table 2 in Lara, 1987).4TR-55 rainfall-runoff model (Natural Resources Conservation Service, 2009).5Mean ratio between flood-estimation method estimates and expected moments algorithm/multiple Grubbs-Beck test (EMA/MGB) estimates (Cohn and others, 1997, 2001, 2013; Eash and others, 2013).6Iowa Runoff Chart (IRC) method (Iowa Department of Transportation, 2014b).
Examination of the 1987 Single-Variable Regional-Regression Equations
27
Table 18. Comparisons of mean percent relative errors for estimates of annual exceedance-probability discharge for drainage basins with areas between 2 and 20 square miles that do not include the re-assignment of hydrologic regions or the use of a mixed landform calculation for the 1987 single-variable regional-regression equations.
[Annual exceedance probabilities (AEPs) of 4, 2, and 1 percent specifically selected by the Iowa Department of Transportation for comparison are noted with bold red text; water year, is the 12-month period from October 1 through September 30. The water year is designated by the calendar year in which the water year ends and includes 9 of the 12 months of that year; %, percent; n, number of streamgages included in comparison mean; MRRE20131; SRRE20132; SRRE19873; ND, not determined; TR-554; MPRE–EMA/MGB5. Cells highlighted in gold indicate the lowest MPRE value for each AEP and cells highlighted in yellow indicate a value that is within a magnitude of 5 percent of the lowest MPRE value]
Flood-estimation
method
Annual exceedance probability Flood-estimation
method
Annual exceedance probability
50% 20% 10% 4% 2% 1% 0.5% 0.2% n 50% 20% 10% 4% 2% 1% 0.5% 0.2% n
MPRE-EMA/MGB for all streamgages statewide (%) MPRE-EMA/MGB for streamgages within flood region 2 (fig. 1) (%)
MRRE2013 73.1 41.0 35.9 37.2 39.6 42.8 48.7 51.3 55 MRRE2013 70.8 34.3 30.6 34.6 39.0 43.7 52.2 55.1 32SRRE2013 69.1 39.4 33.7 35.7 39.0 42.8 46.9 51.8 55 SRRE2013 64.9 33.8 29.2 33.8 38.9 44.0 48.8 54.5 32SRRE1987 74.5 40.2 35.4 37.7 40.9 44.2 ND ND 55 SRRE1987 67.5 33.3 30.3 34.7 38.2 41.4 ND ND 32TR-55 110.0 55.8 50.2 52.0 55.7 60.7 65.9 73.0 51 TR-55 60.4 35.1 35.0 40.9 46.8 53.0 59.0 67.2 30
MPRE-EMA/MGB for all streamgages statewide with more than 22 years of systematic peaks included in the EMA/MGB analysis (%)
MPRE-EMA/MGB for streamgages within flood region 3 (fig. 1) (%)
MRRE2013 80.4 42.0 34.3 33.1 35.3 37.8 41.3 44.0 41 MRRE2013 76.4 50.4 42.8 41.5 42.5 44.2 46.7 48.8 16SRRE2013 78.0 42.6 34.2 34.1 36.4 38.8 42.0 45.6 41 SRRE2013 70.4 42.1 36.1 35.5 36.9 38.6 41.2 44.5 16SRRE1987 85.2 44.1 36.2 36.0 37.8 39.7 ND ND 41 SRRE1987 64.1 35.9 31.5 33.0 37.4 42.0 ND ND 16TR-55 121.4 57.8 50.4 50.1 52.0 55.5 59.4 64.7 37 TR-55 131.1 52.3 41.9 38.5 38.4 41.0 44.2 48.4 16
MPRE-EMA/MGB for all streamgages statewide with annual peak-discharge record through the 2012 or 2013 water year (%)
MPRE-EMA/MGB for streamgages within the Southern Iowa Drift Plain landform region (fig. 2) (%)
MRRE2013 62.9 39.4 32.0 30.1 31.1 33.3 36.6 40.0 23 MRRE2013 51.2 37.5 37.1 44.0 48.7 53.4 63.5 65.8 29SRRE2013 61.9 36.2 28.7 29.0 31.3 33.7 36.8 40.8 23 SRRE2013 49.4 33.8 32.6 38.9 44.9 50.5 56.0 62.4 29SRRE1987 63.2 43.2 40.3 41.5 44.6 47.7 ND ND 23 SRRE1987 44.2 30.2 31.1 35.3 39.6 43.8 ND ND 29TR-55 105.3 46.7 39.8 38.5 40.7 44.8 49.6 55.6 23 TR-55 98.1 46.3 42.7 45.1 50.0 56.8 63.9 73.3 29
MPRE-EMA/MGB for all streamgages statewide with more than 22 years of systematic peaks included in the EMA/MGB analysis and with annual peak-
discharge record through the 2012 or 2013 water year (%)
MPRE-EMA/MGB for streamgages within the Iowan Surface landform region (fig. 2) (%)
MRRE2013 70.1 44.6 33.9 30.0 31.0 32.6 33.8 37.4 17 MRRE2013 49.1 24.5 19.3 19.2 22.3 25.7 27.1 31.2 10SRRE2013 71.8 42.2 32.3 29.5 30.2 31.3 33.5 36.5 17 SRRE2013 45.6 24.8 20.4 23.3 25.4 26.9 29.1 32.0 10SRRE1987 69.1 46.2 39.8 38.0 40.4 42.4 ND ND 17 SRRE1987 54.4 33.2 31.6 34.6 38.0 39.8 ND ND 10TR-55 116.7 45.9 36.7 33.0 33.4 36.3 39.8 44.0 17 TR-55 62.2 32.1 31.2 35.4 37.9 39.3 40.3 42.0 10
1StreamStats 2013 multivariable RREs method (tables 9–11 in Eash and others, 2013).22013 single-variable RREs method (table 15 in Eash and others, 2013). 31987 single-variable RREs (table 2 in Lara, 1987).4TR-55 rainfall-runoff model (Natural Resources Conservation Service, 2009).5Mean percent relative error (MPRE) between flood-estimation method estimates and expected moments algorithm/multiple Grubbs-Beck test (EMA/MGB) estimates (Cohn and others, 1997, 2001, 2013;
Eash and others, 2013).

28
Comparisons of Estim
ates of Annual Exceedance-Probability Discharges for Small Drainage Basins in Iow
aTable 19. Comparisons of mean ratios for estimates of annual exceedance-probability discharge for drainage basins with areas between 2 and 20 square miles that do not include the re-assignment of hydrologic regions or the use of a mixed landform calculation for the 1987 single-variable regional-regression equations.
[Annual exceedance probabilities (AEPs) of 4, 2, and 1 percent specifically selected by the Iowa Department of Transportation for comparison are noted with bold red text; water year, is the 12-month period from October 1 through September 30. The water year is designated by the calendar year in which the water year ends and includes 9 of the 12 months of that year; %, percent; n, number of streamgages included in comparison mean; MRRE20131; SRRE20132; SRRE19873; ND, not determined; TR-554; mean-ratio EMA/MGB5. Cells highlighted in gold indicate the mean ratio value closest to 1.0 for each AEP and cells highlighted in yellow indicate values within an absolute value difference from 1.0 that is determined by adding 0.05 to the absolute value difference between the closest value (cell highlighted in gold) and 1.0. For example, if the closest value to 1.0 is 1.12 (cell highlighted in gold), which has an absolute value difference from 1.0 of 0.12, then adding 0.05 to 0.12 equals 0.17; thus mean ratio values within a range from 0.83 to 1.17 are highlighted in yellow]
Flood-estimation
method
Annual exceedance probability Flood-estimation
method
Annual exceedance probability
50% 20% 10% 4% 2% 1% 0.5% 0.2% n 50% 20% 10% 4% 2% 1% 0.5% 0.2% n
Mean-ratio EMA/MGB for all streamgages statewide Mean-ratio EMA/MGB for streamgages within flood region 2 (fig. 1)
MRRE2013 1.50 1.21 1.15 1.15 1.12 1.10 1.17 1.10 55 MRRE2013 1.39 1.07 1.08 1.13 1.12 1.11 1.23 1.14 32SRRE2013 1.39 1.14 1.09 1.06 1.06 1.05 1.05 1.05 55 SRRE2013 1.21 1.03 1.02 1.04 1.05 1.07 1.09 1.11 32SRRE1987 1.51 1.07 0.97 0.91 0.87 0.86 ND ND 55 SRRE1987 1.35 0.95 0.88 0.84 0.83 0.83 ND ND 32TR-55 1.99 1.36 1.26 1.24 1.26 1.29 1.32 1.37 51 TR-55 1.44 1.09 1.06 1.08 1.12 1.16 1.21 1.27 30
Mean-ratio EMA/MGB for all streamgages statewide with more than 22 years of systematic peaks included in the EMA/MGB analysis Mean-ratio EMA/MGB for streamgages within flood region 3 (fig. 1)
MRRE2013 1.58 1.19 1.10 1.07 1.03 1.00 1.04 0.97 41 MRRE2013 1.69 1.43 1.26 1.19 1.13 1.10 1.08 1.03 16SRRE2013 1.48 1.14 1.06 1.01 0.99 0.97 0.96 0.95 41 SRRE2013 1.63 1.27 1.15 1.05 1.00 0.95 0.92 0.88 16SRRE1987 1.61 1.07 0.94 0.85 0.80 0.77 ND ND 41 SRRE1987 1.55 1.12 1.00 0.89 0.83 0.80 ND ND 16TR-55 2.10 1.35 1.23 1.19 1.19 1.20 1.22 1.26 37 TR-55 2.27 1.38 1.20 1.11 1.08 1.07 1.07 1.08 16
Mean-ratio EMA/MGB for all streamgages statewide with annual peak-discharge record through the 2012 or 2013 water year
Mean-ratio EMA/MGB for streamgages within the Southern Iowa Drift Plain landform region (fig. 2)
MRRE2013 1.30 1.13 1.06 1.05 1.02 1.00 1.04 0.98 23 MRRE2013 1.25 1.18 1.18 1.24 1.25 1.26 1.37 1.30 29SRRE2013 1.22 1.03 0.98 0.94 0.93 0.92 0.91 0.90 23 SRRE2013 1.15 1.08 1.10 1.12 1.15 1.17 1.20 1.22 29SRRE1987 1.27 0.98 0.91 0.85 0.83 0.82 ND ND 23 SRRE1987 1.19 0.99 0.95 0.93 0.92 0.93 ND ND 29TR-55 1.93 1.26 1.15 1.12 1.13 1.14 1.17 1.21 23 TR-55 1.87 1.33 1.26 1.26 1.29 1.34 1.38 1.45 29
Mean-ratio EMA/MGB for all streamgages statewide with more than 22 years of systematic peaks included in the EMA/MGB analysis and with annual peak-
discharge record through the 2012 or 2013 water year
Mean-ratio EMA/MGB for streamgages within the Iowan Surface landform region (fig. 2)
MRRE2013 1.36 1.13 1.03 0.99 0.95 0.92 0.94 0.87 17 MRRE2013 1.22 0.96 0.94 0.94 0.90 0.87 0.94 0.84 10SRRE2013 1.31 1.05 0.98 0.92 0.88 0.86 0.84 0.81 17 SRRE2013 1.07 0.91 0.88 0.86 0.85 0.84 0.83 0.81 10SRRE1987 1.28 0.93 0.82 0.74 0.70 0.68 ND ND 17 SRRE1987 1.18 0.81 0.72 0.65 0.62 0.60 ND ND 10TR-55 2.00 1.22 1.09 1.02 1.01 1.01 1.02 1.04 17 TR-55 1.45 0.93 0.85 0.81 0.80 0.81 0.81 0.82 10
1StreamStats 2013 multivariable RREs method (tables 9–11 in Eash and others, 2013).22013 single-variable RREs method (table 15 in Eash and others, 2013). 31987 single-variable RREs (table 2 in Lara, 1987).4TR-55 rainfall-runoff model (Natural Resources Conservation Service, 2009).5Mean ratio between flood-estimation method estimates and expected moments algorithm/multiple Grubbs-Beck test (EMA/MGB) estimates (Cohn and others, 1997, 2001, 2013; Eash and others, 2013).
Examination of the 1987 Single-Variable Regional-Regression Equations 29
AEPs for all five comparisons are lower. These comparisons indicate better overall accuracy without the re-assignments of 1987 single-variable RREs and the use of the mixed landform calculation for the 12 streamgages. Lower MPRE values for most AEPs of 50, 20, and 10 percent (table 16) indicate that the 1987 single-variable RREs provide better accuracy when compared to the MPRE values listed in table 12 from the 2013 single-variable RREs or from the Iowa Runoff Chart method, except for the first statewide dataset of all 25 streamgages. Mean ratio values compared (tables 17 and 13) for the 1987 single-variable RREs show that mean ratio values are closer to 1.0 for all AEPs for all five comparisons listed in table 17 indicating less overall bias, except for AEPs of 50 percent in the first statewide dataset of 25 streamgages. Mean ratio val-ues listed in table 17 indicate the 1987 single-variable RREs have less bias when compared to the TR-55 method for AEPs of 4, 2, and 1 percent. For drainage basins with areas less than 2 mi2, overall results (tables 16 and 17) seem to indicate better accuracy and less bias for the 1987 single-variable RREs when the 12 streamgages are not re-assigned to different hydro-logic regions and when the mixed landform calculation is not applied.
For drainage basins with areas between 2 and 20 mi2, MPRE values compared (tables 18 and 14) for the 1987 single-variable RREs show that most of the recalculated MPRE values increased for the eight comparisons, except for some AEPs of 50, 20, and 10 percent for which MPRE values decreased for some of the comparisons. In general, MPRE values in table 18 seem to indicate the 1987 single-variable RREs have less accuracy without the re-assignment of the 12 streamgages and without the use of the mixed landform cal-culation. Because none of the 12 streamgages with re-assigned 1987 single-variable RREs and with drainage areas between 2 and 20 mi2 are located in the Iowan Surface landform region (fig. 2), MPRE and mean ratio values (tables 18 and 19) for the Iowan Surface landform region are the same as those listed in tables 14 and 15. Overall MPRE results in table 18 are simi-lar to those in table 14, except that estimates from the 2013 multi- and single-variable RREs indicated better accuracy for AEPs of 4, 2, and 1 percent for the first two statewide datasets when compared to estimates from the 1987 single-variable RREs. Mean ratio values compared (tables 19 and 15) for the 1987 single-variable RREs show that most of the mean ratio values are numerically farther from 1.0 for the eight comparisons, except for some AEPs of 50, 20, and 10 percent for which mean ratio values are closer to 1.0 for some of the comparisons. In general, mean ratio values in table 19 seem to indicate the 1987 single-variable RREs have more bias without the re-assignment of the 12 streamgages and without the use of the mixed landform calculation. Overall mean ratio results in table 19 are similar to those in table 15. For drainage basins with areas between 2 and 20 mi2, overall results (tables 18 and 19) seem to indicate less accuracy and more bias for the 1987 single-variable RREs when the 12 streamgages are not re-assigned to different hydrologic regions and when the mixed landform calculation is not used.
This examination of the re-assignment of the 1987 single-variable RREs and the use of the mixed landform calculation for 12 streamgages indicates different results for the two sizes of drainage areas that were evaluated. The re-assignment of the 1987 single-variable RREs and use of the mixed landform calculation seem to have had no substantial effect regarding the relative accuracy and bias of estimates of AEPDs when comparing the 2013 multi- and single-variable RREs to the 1987 single-variable RREs for drainage basins with areas less than 2 mi2, except for AEPs of 50 percent. For drainage basins with areas between 2 and 20 mi2, the re-assignment of the 1987 single-variable RREs and use of the mixed landform calculation also seem to have had no substantial effect regard-ing the relative accuracy and bias of estimates of AEPDs when comparing the 2013 multi- and single-variable RREs to the 1987 single-variable RREs. The MPRE results from the first two statewide datasets (table 18) indicate better accuracy for estimates from the 2013 multi- and single-variable RREs for AEPs of 4, 2, and 1 percent, when compared to estimates from the 1987 single-variable RREs that do not include re-assign-ment and or the use of the mixed landform calculation.
The re-assignment of 1987 single-variable RREs to a dif-ferent hydrologic region than the region where the streamgage is present may be a subjective re-assignment for ungaged sites if users do not use a quantitative method similar to the one used in this study. In this study, mean, median, minimum, and maximum basin-characteristic values were calculated for data from streamgages within each hydrologic region for four selected basin characteristics (BSLDEM10M, CSL1085LFP, CSL100, and SLOP30). Basin-characteristic values measured for streamgages, that represent ungaged sites, were then com-pared to the mean, median, minimum, and maximum regional values to quantitatively re-assign 1987 single-variable RREs.
Comparison of Annual Exceedance-Probability Discharges Estimated by Using the Expected Moments Algorithm/Multiple Grubbs-Beck Test Analysis Method, Based on Data through Water Years 2013 and 2010
A comparison of estimates from the EMA/MGB AEP method calculated through the 2013 water year (table 3) to those calculated through the 2010 water year (table 4 in Eash and others, 2013) was performed to determine if 2013 esti-mates have generally increased or decreased when compared to 2010 estimates. Because estimates from the 2013 multi- and single-variable RREs are generally greater than estimates from the 1987 single-variable RREs (tables 13 and 15), an overall decrease in 2013 EMA/MGB estimates when compared to 2010 EMA/MGB estimates could indicate why the estimates from the 1987 single-variable RREs seem to provide better accuracy and less bias for some comparisons (tables 12–15). For an AEP of 1 percent, 2013 estimates have increased for 41 streamgages, have decreased for 33 streamgages, and have

30 Comparisons of Estimates of Annual Exceedance-Probability Discharges for Small Drainage Basins in Iowa
remained the same for 6 streamgages (table 3). For an AEP of 10 percent, 2013 estimates have increased for 36 streamgages, have decreased for 37 streamgages, and have remained the same for 7 streamgages. Overall, increases and decreases (from 2013 EMA/MGB estimates) seem to be about the same when compared to 2010 EMA/MGB estimates.
Comparisons of Regional-Regression Lines for 1-Percent Annual Exceedance-Probability Discharges
The 1-percent AEPD regression lines for hydrologic regions 1–4 (fig. 3) from the 1987 single-variable RREs and for flood regions 1–3 (fig. 1) from the 2013 single-variable RREs (tables 5–7 in this report; Eash and others, 2013) are shown in figure 4. The regression lines are displayed from the minimum drainage area size applicable for each RRE to 20 mi2. A regression line is not displayed for hydrologic region 5 because the minimum drainage area size applicable for this RRE is 45 mi2 (Lara, 1987). Hydrologic regions 4 and 5 (fig. 3) and flood region 1 (fig. 1) are nearly identical areas corresponding to the Des Moines Lobe landform region (fig. 2). Because a dataset with at least 10 streamgages could not be compiled for comparisons of AEPDs representing the Des Moines Lobe landform region for either size of drainage areas, direct comparisons of the two evaluation metrics for the Des Moines Lobe landform region are not available for this study. The four statewide comparison datasets listed in tables 12–19 may provide an indication of comparison results as noted in the previous sections. The 1-percent AEPD regres-sion lines shown in figure 4 for hydrologic region 4 (fig. 3) (light brown line) and for flood region 1 (fig. 1) (dark green line) are comparable because they were developed for about the same area in the Des Moines Lobe landform region. These two regression lines show that estimates of 1-percent AEPDs for flood region 1 (fig. 1) are larger when compared to those for hydrologic region 4 (fig. 3) for drainage areas between 7.9 and 20 mi2. The slope of the regression line for hydrologic region 4 (light brown line in fig. 4) is slightly steeper than the slope for the regression line for flood region 1 (dark green line in fig. 4). Regression lines with steeper slopes produce a greater “vertical change,” or a greater change in discharge for a given “horizontal change,” or change in drainage area, when compared to regression lines with flatter slopes.
Tables 12–13 and 16–17 list the results of a compari-son for 16 streamgages located in flood region 2 (fig. 1) and tables 14–15 and 18–19 list the results of a comparison for 32 streamgages located in flood region 2 (fig. 1). The area of flood region 2 corresponds most closely statewide to hydrologic region 3 (fig. 3), and also includes some areas of hydrologic region 2 (fig. 3). A comparison of the regression lines (fig. 4) for flood region 2 (fig. 1) (black line) and for hydrologic region 3 (fig. 3) (blue line) shows that estimates of 1-percent AEPDs for flood region 2 are larger and the slope of the regression line is flatter when compared to hydrologic
region 3 for drainage areas less than 20 mi2. Thus, there is a greater difference in estimates of 1-percent AEPDs between these two RREs for smaller drainage areas, such as those less than 2 mi2.
Tables 14–15 and 18–19 list the results of a comparison for 16 streamgages located in flood region 3 (fig. 1). The area of flood region 3 corresponds most closely statewide to hydro-logic regions 1 and 2 (fig. 3), and also includes some areas of hydrologic region 3 (fig. 3). A comparison of the regression lines (fig. 4) for flood region 3 (fig. 1) (orange line) and for hydrologic region 2 (fig. 3) (red line) shows that estimates of 1-percent AEPDs for flood region 3 are larger and the slope of the regression line is flatter when compared to hydrologic region 2 for drainage areas less than 20 mi2. Thus, there is a greater difference in estimates of 1-percent AEPDs between these two RREs for smaller drainage areas, such as those less than 2 mi2. A comparison of the regression lines (fig. 4) for flood region 3 (fig. 1) (orange line) and for hydrologic region 1 (fig. 3) (light green line) shows that estimates of 1-percent AEPDs for flood region 3 are smaller and the slope of the regression line is flatter when compared to hydrologic region 1 for drainage areas less than 20 mi2. Thus, there is less dif-ference in estimates of 1-percent AEPDs between these two RREs for smaller drainage areas, such as those less than 2 mi2.
The regression lines shown in figure 4 indicate that the 1987 single-variable RREs have steeper slopes when com-pared to the 2013 single-variable RREs for flood regions 2 (black line) and 3 (orange line). The 2013 single-variable RRE for flood region 1 (dark green line) has about the same slope as the 1987 single-variable RREs for hydrologic regions 2 (red line) and 3 (blue line). The magnitude of the 1-percent AEPDs are larger for the 2013 single-variable RREs when compared to those for the 1987 single-variable RREs for corresponding areas of Iowa, except for the 1987 single-variable RRE for hydrologic region 1 (light green line) for which the magnitude of 1-percent AEPDs exceeds all of those for 2013 single-variable RREs.
The 1987 single-variable RREs were developed using annual peak-flow data through the 1984 water year (Lara, 1987) and the 2013 multi- and single-variable RREs were developed using annual peak-flow data through the 2010 water year (Eash and others, 2013). Both sets of RREs were fit to all sizes of drainage areas for all streamgages included in each of these flood-estimation studies. Maximum drainage areas included in the development of the 1987 single-variable RREs range from 1,670 to 5,146 mi2 for hydrologic regions 2–5 (maximum drainage area for hydrologic region 1 RREs is 374 mi2) and for the 2013 single-variable RREs range from 2,809 to 7,783 mi2. Because there were many more streamgages with drainage areas greater than 20 mi2, than streamgages with drainage areas less than 20 mi2, used in the development of 1987 and 2013 single-variable RREs, the fit of the regional-regression lines for both methods were predomi-nately caused by the relation of AEPDs and drainage areas for streamgages with drainage areas greater than 20 mi2. Thus, the magnitude of AEPDs and slope of the regional-regression

Examination of the 1987 Single-Variable Regional-Regression Equations 31
lines (fig.4) were developed predominately using streamgages with drainage areas greater than 20 mi2. Of the 251 stream-gages used to develop the 1987 single-variable RREs, 68 of 251 streamgages, or 27 percent, had drainage areas less than 20 mi2 (Lara, 1987). Likewise, of the 394 streamgages included in the development of the 2013 multi- and single-variable RREs, 137 of 394 streamgages, or 35 percent, had drainage areas less than 20 mi2 (Eash and others, 2013).
For AEPs of 4, 2, and 1 percent for drainage areas less than 2 mi2, MPRE and mean ratio results of this study seem to indicate that the definition of hydrologic regions, the magni-tude of AEPDs, and the slope of the regression lines of the 1987 single-variable RREs provide better accuracy when compared to either the 2013 multi- or single-variable RREs for three of the five comparisons (table 12) and provide less bias for all five comparisons (table 13). For AEPs of 4, 2, and 1 percent for drainage areas between 2 and 20 mi2, MPRE and mean ratio results of this study seem to indicate that the definition of hydrologic regions, the magnitude of AEPDs, and the slope of the regression lines of the 1987 single-variable RREs provide better accuracy when compared to either the 2013 multi- or single-variable RREs for five of the eight com-parisons (table 14) and provide less bias for one of the eight comparisons (table 15). The combination of the definition of hydrologic regions, the lower discharges, and the steeper
slopes of the regression lines of the 1987 single-variable RREs seem to provide better accuracy and less bias when compared to the 2013 multi- or single-variable RREs, particularly for drainage areas less than 2 mi2, and also for some drainage areas between 2 and 20 mi2. For most of the 1-percent AEPD datasets (tables 12–15) for flood regions 2 and 3 (fig. 1), bet-ter accuracy and less bias are indicated for the 1987 single-variable RREs. The 1987 single-variable RREs were devel-oped with steeper slopes and lower magnitude discharges for 1-percent AEPs, when compared to either the 2013 multi- or single-variable RREs that were developed with flatter slopes and higher magnitude AEPDs. This comparison of 2013 and 1987 single-variable RREs indicates a curvilinear relation for 1-percent AEPDs for drainage areas less than 2 mi2 , and also for some drainage areas between 2 and 20 mi2 (fig. 4). A cur-vilinear relation indicates that linear regression lines, such as those developed for 1-percent AEPs for flood regions 2 and 3 (fig. 1), may overestimate 1-percent AEPDs for small drainage areas.
Although AEPDs estimated by the 1987 single-variable RREs seem to provide better accuracy and less bias than AEPDs estimated by the 2013 multi- or single-variable RREs for most of the comparisons for drainage areas less than 2 mi2 (tables 12–13) and for some of the comparisons for drain-age areas between 2 and 20 mi2 (tables 14–15), the 2013
Drainage area, in square miles
Figure 4
Annu
al e
xcee
danc
e pr
obab
ility
(1-p
erce
nt A
EP),
in c
ubic
feet
per
sec
ond
0.01 0.1 1 2 10 20 30100
200
500
1,000
2,000
5,000
10,000
15,000
EXPLANATION
Hydrologic region 1 Hydrologic region 2 Hydrologic region 3Hydrologic region 4Flood region 1Flood region 2Flood region 3
(Lara, 1987)
(Eash and others, 2013)
1414.040.0
2 sq
uare
mile
s
20 sq
uare
mile
s
Figure 4. Relation between 1-percent annual exceedance-probability discharges and drainage area less than or equal to 20 square miles for 1987 and 2013 single-variable regional-regression equations.
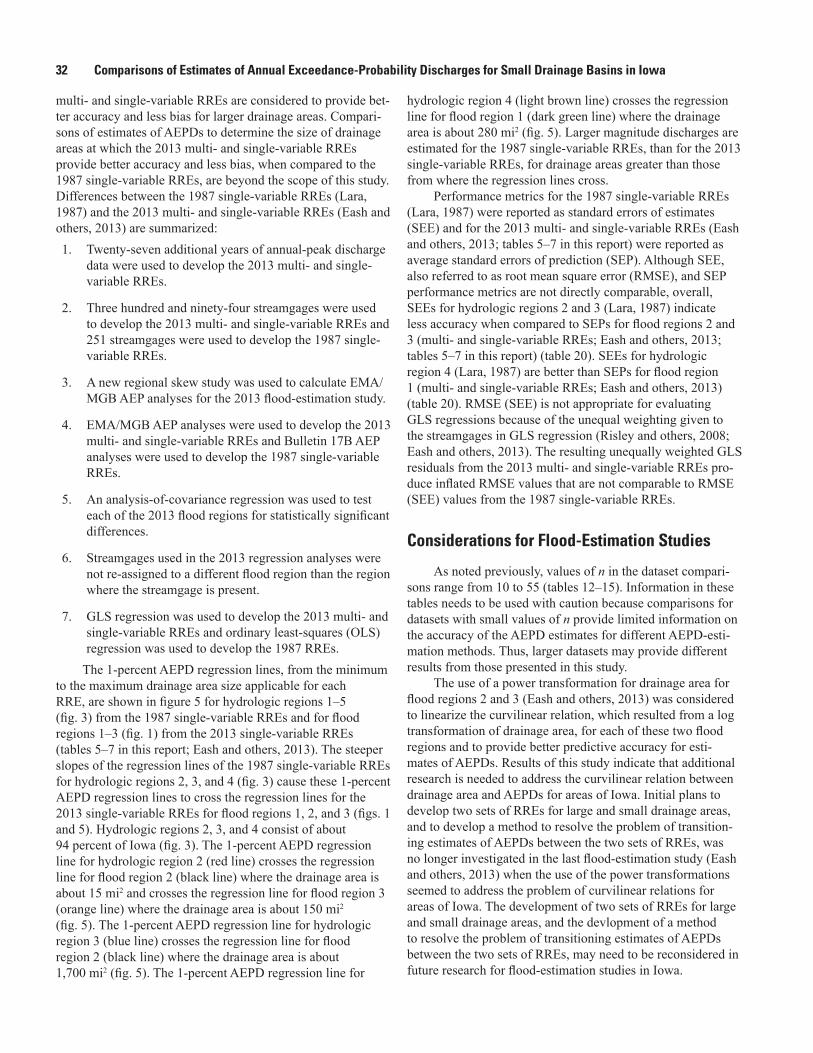
32 Comparisons of Estimates of Annual Exceedance-Probability Discharges for Small Drainage Basins in Iowa
multi- and single-variable RREs are considered to provide bet-ter accuracy and less bias for larger drainage areas. Compari-sons of estimates of AEPDs to determine the size of drainage areas at which the 2013 multi- and single-variable RREs provide better accuracy and less bias, when compared to the 1987 single-variable RREs, are beyond the scope of this study. Differences between the 1987 single-variable RREs (Lara, 1987) and the 2013 multi- and single-variable RREs (Eash and others, 2013) are summarized:1. Twenty-seven additional years of annual-peak discharge
data were used to develop the 2013 multi- and single-variable RREs.
2. Three hundred and ninety-four streamgages were used to develop the 2013 multi- and single-variable RREs and 251 streamgages were used to develop the 1987 single-variable RREs.
3. A new regional skew study was used to calculate EMA/MGB AEP analyses for the 2013 flood-estimation study.
4. EMA/MGB AEP analyses were used to develop the 2013 multi- and single-variable RREs and Bulletin 17B AEP analyses were used to develop the 1987 single-variable RREs.
5. An analysis-of-covariance regression was used to test each of the 2013 flood regions for statistically significant differences.
6. Streamgages used in the 2013 regression analyses were not re-assigned to a different flood region than the region where the streamgage is present.
7. GLS regression was used to develop the 2013 multi- and single-variable RREs and ordinary least-squares (OLS) regression was used to develop the 1987 RREs.
The 1-percent AEPD regression lines, from the minimum to the maximum drainage area size applicable for each RRE, are shown in figure 5 for hydrologic regions 1–5 (fig. 3) from the 1987 single-variable RREs and for flood regions 1–3 (fig. 1) from the 2013 single-variable RREs (tables 5–7 in this report; Eash and others, 2013). The steeper slopes of the regression lines of the 1987 single-variable RREs for hydrologic regions 2, 3, and 4 (fig. 3) cause these 1-percent AEPD regression lines to cross the regression lines for the 2013 single-variable RREs for flood regions 1, 2, and 3 (figs. 1 and 5). Hydrologic regions 2, 3, and 4 consist of about 94 percent of Iowa (fig. 3). The 1-percent AEPD regression line for hydrologic region 2 (red line) crosses the regression line for flood region 2 (black line) where the drainage area is about 15 mi2 and crosses the regression line for flood region 3 (orange line) where the drainage area is about 150 mi2 (fig. 5). The 1-percent AEPD regression line for hydrologic region 3 (blue line) crosses the regression line for flood region 2 (black line) where the drainage area is about 1,700 mi2 (fig. 5). The 1-percent AEPD regression line for
hydrologic region 4 (light brown line) crosses the regression line for flood region 1 (dark green line) where the drainage area is about 280 mi2 (fig. 5). Larger magnitude discharges are estimated for the 1987 single-variable RREs, than for the 2013 single-variable RREs, for drainage areas greater than those from where the regression lines cross.
Performance metrics for the 1987 single-variable RREs (Lara, 1987) were reported as standard errors of estimates (SEE) and for the 2013 multi- and single-variable RREs (Eash and others, 2013; tables 5–7 in this report) were reported as average standard errors of prediction (SEP). Although SEE, also referred to as root mean square error (RMSE), and SEP performance metrics are not directly comparable, overall, SEEs for hydrologic regions 2 and 3 (Lara, 1987) indicate less accuracy when compared to SEPs for flood regions 2 and 3 (multi- and single-variable RREs; Eash and others, 2013; tables 5–7 in this report) (table 20). SEEs for hydrologic region 4 (Lara, 1987) are better than SEPs for flood region 1 (multi- and single-variable RREs; Eash and others, 2013) (table 20). RMSE (SEE) is not appropriate for evaluating GLS regressions because of the unequal weighting given to the streamgages in GLS regression (Risley and others, 2008; Eash and others, 2013). The resulting unequally weighted GLS residuals from the 2013 multi- and single-variable RREs pro-duce inflated RMSE values that are not comparable to RMSE (SEE) values from the 1987 single-variable RREs.
Considerations for Flood-Estimation Studies
As noted previously, values of n in the dataset compari-sons range from 10 to 55 (tables 12–15). Information in these tables needs to be used with caution because comparisons for datasets with small values of n provide limited information on the accuracy of the AEPD estimates for different AEPD-esti-mation methods. Thus, larger datasets may provide different results from those presented in this study.
The use of a power transformation for drainage area for flood regions 2 and 3 (Eash and others, 2013) was considered to linearize the curvilinear relation, which resulted from a log transformation of drainage area, for each of these two flood regions and to provide better predictive accuracy for esti-mates of AEPDs. Results of this study indicate that additional research is needed to address the curvilinear relation between drainage area and AEPDs for areas of Iowa. Initial plans to develop two sets of RREs for large and small drainage areas, and to develop a method to resolve the problem of transition-ing estimates of AEPDs between the two sets of RREs, was no longer investigated in the last flood-estimation study (Eash and others, 2013) when the use of the power transformations seemed to address the problem of curvilinear relations for areas of Iowa. The development of two sets of RREs for large and small drainage areas, and the devlopment of a method to resolve the problem of transitioning estimates of AEPDs between the two sets of RREs, may need to be reconsidered in future research for flood-estimation studies in Iowa.
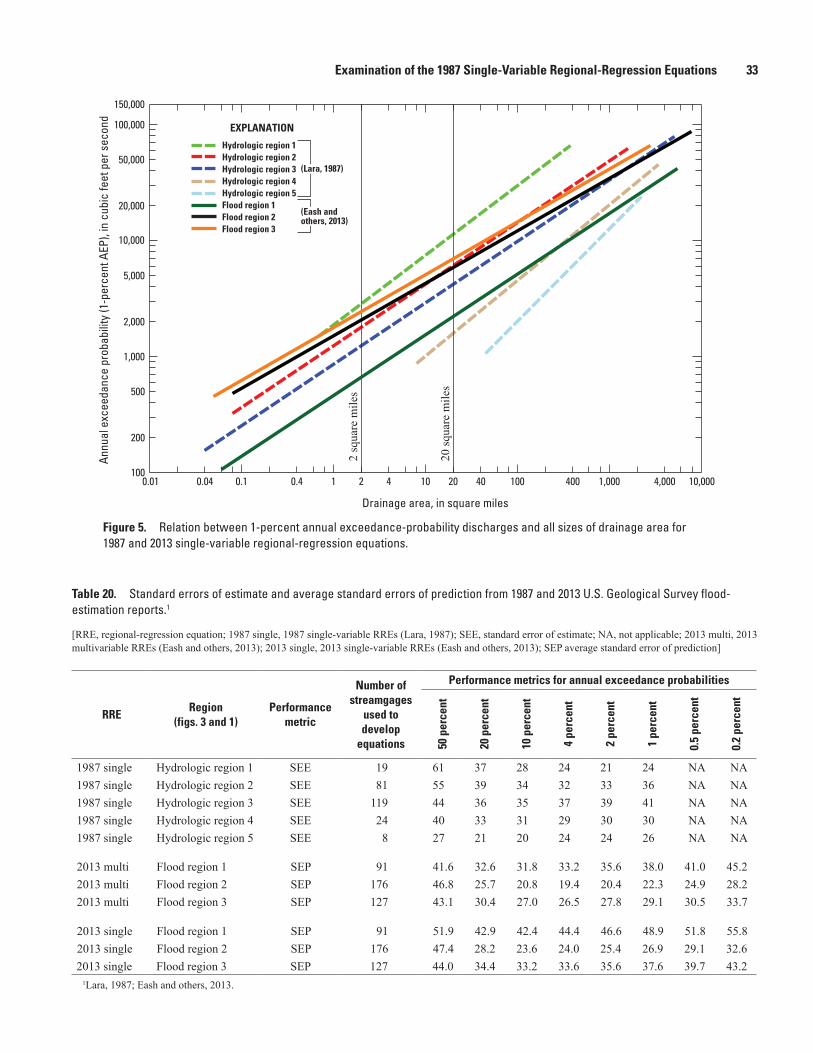
Examination of the 1987 Single-Variable Regional-Regression Equations 33
Table 20. Standard errors of estimate and average standard errors of prediction from 1987 and 2013 U.S. Geological Survey flood-estimation reports.1
[RRE, regional-regression equation; 1987 single, 1987 single-variable RREs (Lara, 1987); SEE, standard error of estimate; NA, not applicable; 2013 multi, 2013 multivariable RREs (Eash and others, 2013); 2013 single, 2013 single-variable RREs (Eash and others, 2013); SEP average standard error of prediction]
RRERegion
(figs. 3 and 1)Performance
metric
Number of streamgages
used to develop
equations
Performance metrics for annual exceedance probabilities
50 p
erce
nt
20 p
erce
nt
10 p
erce
nt
4 pe
rcen
t
2 pe
rcen
t
1 pe
rcen
t
0.5
perc
ent
0.2
perc
ent
1987 single Hydrologic region 1 SEE 19 61 37 28 24 21 24 NA NA1987 single Hydrologic region 2 SEE 81 55 39 34 32 33 36 NA NA1987 single Hydrologic region 3 SEE 119 44 36 35 37 39 41 NA NA1987 single Hydrologic region 4 SEE 24 40 33 31 29 30 30 NA NA1987 single Hydrologic region 5 SEE 8 27 21 20 24 24 26 NA NA
2013 multi Flood region 1 SEP 91 41.6 32.6 31.8 33.2 35.6 38.0 41.0 45.22013 multi Flood region 2 SEP 176 46.8 25.7 20.8 19.4 20.4 22.3 24.9 28.22013 multi Flood region 3 SEP 127 43.1 30.4 27.0 26.5 27.8 29.1 30.5 33.7
2013 single Flood region 1 SEP 91 51.9 42.9 42.4 44.4 46.6 48.9 51.8 55.82013 single Flood region 2 SEP 176 47.4 28.2 23.6 24.0 25.4 26.9 29.1 32.62013 single Flood region 3 SEP 127 44.0 34.4 33.2 33.6 35.6 37.6 39.7 43.2
1Lara, 1987; Eash and others, 2013.
100
200
500
1,000
2,000
5,000
10,000
20,000
50,000
100,000
150,000
Drainage area, in square miles
Figure 5
Annu
al e
xcee
danc
e pr
obab
ility
(1-p
erce
nt A
EP),
in c
ubic
feet
per
sec
ond
0.01 0.04 0.1 1 20.4 4 10 20 40 100 400 1,000 4,000 10,000
EXPLANATION
Hydrologic region 1 Hydrologic region 2 Hydrologic region 3Hydrologic region 4Hydrologic region 5Flood region 1Flood region 2Flood region 3
(Lara, 1987)
(Eash and others, 2013)
2 sq
uare
mile
s
20 sq
uare
mile
s
Figure 5. Relation between 1-percent annual exceedance-probability discharges and all sizes of drainage area for 1987 and 2013 single-variable regional-regression equations.
34 Comparisons of Estimates of Annual Exceedance-Probability Discharges for Small Drainage Basins in Iowa
SummaryWith the publication of a U.S. Geological Survey (USGS)
annual exceedance-probability discharge (AEPD) estimation report in 2013 and with the implementation of regional-regres-sion equations (RREs) from the report in Iowa StreamStats in 2013, the USGS, in cooperation with the Iowa Department of Transportation (Iowa DOT) and the Iowa Highway Research Board, initiated a statewide study in 2014. This report pro-vides information on the relative accuracy and the amount of bias of AEPD estimation methods that can be used for drainage basins with areas less than 2 square miles (mi2) and for drainage basins with areas between 2 and 20 mi2. Traditionally, Iowa DOT has used the Iowa Runoff Chart method for drainage basins with areas less than 2 mi2. RREs from a USGS AEPD-estimation report published in 1987 have also been used by Iowa DOT as a primary AEPD-estimation method for small drainage basins in Iowa. Eighty streamgages that were included in the development of the RREs implemented in Iowa StreamStats were selected for inclusion in this comparison study. Of these 80 streamgages, 25 of them have drainage areas less than 2 mi2 and 55 of them have drainage areas between about 2 and 20 mi2.
This report presents two comparisons of estimates of AEPDs. First, AEPDs were estimated from five different AEPD-estimation methods for streamgages with drainage areas less than 2 mi2 and were compared to AEPDs that were estimated from observed data from the same streamgages using a streamgage probability-analysis method named the expected moments algorithm/multiple Grubbs-Beck test (EMA/MGB analysis method). The five AEPD-estimation methods include (1) multivariable RREs from the 2013 report (2013 multivariable RRE method); (2) single-variable RREs from the 2013 report (2013 single-variable RRE method); (3) single-variable RREs from the 1987 report (1987 single-vari-able RRE method); (4) the TR-55 rainfall-runoff model, and (5) the Iowa Runoff Chart method. Second, AEPDs estimated from four different AEPD-estimation methods for streamgages in Iowa with drainage areas between about 2 and 20 mi2 were compared to AEPDs that were estimated from observed data from the same streamgages using the EMA/MGB analysis method. With the exception of the Iowa Runoff Chart method, the four other AEPD-estimation methods included in the first set of comparisons also were included in the second set of comparisons for streamgages in Iowa with drainage areas between about 2 and 20 mi2.
The AEPD-estimation comparisons were performed using two evaluation metrics for annual exceedance probabilities (AEPs) of 50, 20, 10, 4, 2, 1, 0.5, and 0.2 percent. Estimates of AEPDs for Q50%, Q0.5%, and Q0.2% are not applicable for the Iowa Runoff Chart method and estimates of AEPDs for Q0.5% and Q0.2% are not applicable for the 1987 single-variable RREs. Comparisons for the two sizes of drainage area were evalu-ated first for AEPD-estimation methods that provide the best accuracy for Iowa DOT selected AEPs of 4, 2, and 1 percent
and second for AEPD-estimation methods that provide the best accuracy for the greatest number of AEPs.
The streamgage datasets included in this study are not independent of those used in the development of the 2013 multivariable RREs and the 2013 single-variable RREs, except for the addition of three more years of annual peak-discharge data. The streamgage datasets included in this study also may not be independent of those used to develop the 1987 single-variable RREs, or possibly even the TR-55 rainfall-runoff model or the Iowa Runoff Chart method, because these meth-ods may have used some of these same streamgage datasets in their development. Therefore, conclusions regarding the rela-tive quality of the AEPD-estimation methods may or may not be extended to ungaged sites. The relative quality of the esti-mates of AEPDs calculated for streamgages from the AEPD-estimation methods compared in this study can be assumed to extend to all conclusions referencing ungaged sites.
For ungaged drainage basins in Iowa with areas less than 2 square miles, results of the comparisons indicate that estimates of AEPDs calculated from the 2013 multi- and single-variable regional-regression equations, the 1987 single-variable RREs, and the TR-55 method tend to overestimate AEPDs, and that estimates of AEPDs calculated from the Iowa Runoff Chart method tend to primarily underestimate AEPDs. Results of the comparisons seem to indicate the best overall AEPD-estimation accuracy and the least overall bias may be achieved with the use of the TR-55 method for sites in flood regions 1 and 3 and with the use of the 1987 single-variable RREs for sites in flood region 2. In the Des Moines Lobe land-form region, the 1987 single-variable RREs are not applicable for drainage basins with areas less than 7.9 mi2 in hydrologic region 4 and for areas less than 45 mi2 in hydrologic region 5.
For ungaged drainage basins in Iowa with areas between 2 and 20 square miles, results of the comparisons indicate that estimates of AEPDs from the 2013 multi- and single-variable regional-regression equations and the TR-55 method tend to overestimate AEPDs, and that estimates of AEPDs calculated from the 1987 single-variable RREs tend to overestimate and underestimate AEPDs. Results of the AEPD comparisons seem to indicate the best overall AEPD-estimation accuracy and the least overall bias may be achieved with the use of the 1987 single-variable RREs for sites in the Southern Iowa Drift Plain landform region and in flood region 3, with the use of the 2013 multivariable RREs for sites in the Iowan Surface landform region, and with the use of the 2013 or 1987 single-variable RREs for sites in flood region 2. For sites in all other landform and flood regions in Iowa, use of the 2013 single-variable RREs may provide the best overall accuracy and the least bias. In the Des Moines Lobe landform region, the 1987 single-variable RREs are not applicable for drainage basins with areas less than 7.9 mi2 in hydrologic region 4 and for areas less than 45 mi2 in hydrologic region 5.
Comparison results seem to indicate that the best accu-racy and the least bias may be achieved by the use of dif-ferent estimation methods of AEPD for different AEPs. The

References Cited 35
use of different estimation methods of AEPD for different AEPs is not appropriate because this approach could lead to inconsistencies with predictions of AEPDs. The number of streamgages included in the dataset comparisons range from 10 to 55. Information in this report needs to be used with caution because comparisons for datasets with small values of “n” provide limited information on the accuracy of the AEPD estimates for different AEPD-estimation methods. Thus, larger datasets may provide different results from those presented in this study.
An in-depth examination was conducted to better under-stand why the 1987 single-variable RRE estimates seem to provide better accuracy and less bias than the 2013 multi- or single-variable RRE estimates for most of the comparisons for drainage areas less than 2 mi2 and for some of the comparisons for drainage areas between 2 and 20 mi2. The re-assignment of the 1987 single-variable RREs and use of the mixed landform calculation seem to have had no substantial effect regarding the relative accuracy and bias of estimates of AEPDs when comparing the 2013 multi- and single-variable RREs to the 1987 single-variable RREs for drainage basins with areas less than 2 mi2 or with areas between 2 and 20 mi2. The re-assign-ment of 1987 single-variable RREs to a different hydrologic region than the region where the streamgage is present may be a subjective re-assignment for ungaged sites if users do not use a quantitative method similar to the one used in this study.
A comparison of EMA/MGB estimates calculated through the 2013 water year to those calculated through the 2010 water year was performed to determine if 2013 estimates have generally increased or decreased when compared to 2010 estimates. An overall decrease in 2013 EMA/MGB estimates when compared to 2010 EMA/MGB estimates could indicate why the 1987 single-variable RRE estimates seem to provide better accuracy and less bias for some comparisons. Overall, increases and decreases (from 2013 EMA/MGB estimates) seem to be about the same when compared to 2010 EMA/MGB estimates.
The 1-percent AEPD regression lines for hydrologic regions 1–4 from the 1987 single-variable RREs and for flood regions 1–3 from the 2013 single-variable RREs indicate that the 1987 single-variable RREs have steeper slopes when compared to the 2013 single-variable RREs for flood regions 2 and 3. Regression lines with steeper slopes produce a greater change in discharge for a given change in drainage area, when compared to regression lines with flatter slopes. The 2013 single-variable RRE for flood region 1 has about the same slope as the 1987 single-variable RREs for hydrologic regions 2 and 3. The magnitude of the 1-percent AEPDs are larger for the 2013 single-variable RREs when compared to those for the 1987 single-variable RREs for corresponding areas of Iowa, except for the 1987 single-variable RRE for hydrologic region 1 for which the magnitude of 1-percent AEPDs exceeds all of those for the 2013 single-variable RREs. The combination of the definition of hydrologic regions, the lower discharges, and the steeper slopes of the
regression lines for the 1987 single-variable RREs seem to provide better accuracy and less bias when compared to either the 2013 multi- or single-variable RREs, particularly for drain-age areas less than 2 mi2, and also for some drainage areas between 2 and 20 mi2. The 2013 multi- and single-variable RREs are considered to provide better accuracy and less bias for larger drainage areas.
Results of this study indicate that additional research is needed to address the curvilinear relation between drain-age area and AEPDs for areas in Iowa. The development of two sets of RREs for large and small drainage areas, and the development of a method to resolve the problem of transition-ing estimates of AEPDs between the two sets of RREs, may need to be reconsidered in future research for flood-estimation studies in Iowa.
References Cited
Bodhaine, G.L., 1968, Measurement of peak discharge at culverts by indirect methods: U.S. Geological Survey Tech-niques of Water-Resources Investigations, book 3, chap. A3, 60 p. [Also available at http://pubs.usgs.gov/twri/twri3-a3/pdf/TWRI_3-A3.pdf.]
Bradley, A.A., Wehmeyer, L.L., and Chen, L.C., 2009, Evalu-ation of design flood frequency methods for Iowa Streams: Iowa Institute of Hydraulic Engineering, Hydroscience and Engineering, IIHR Report No. 473. 94 p., accessed March 9, 2015, at http://www.iihr.uiowa.edu/wp-content/uploads/2013/06/IIHR473.pdf.
Bureau of Public Roads, 1950, Highway drainage manual: Washington, D.C., Bureau of Public Roads. [pagination unknown].
Cohn, T.A., Berenbrock, Charles, Kiang, J.E., and Mason, R.R., Jr., 2012, Calculating weighted estimates of peak streamflow statistics: U.S. Geological Survey Fact Sheet 2012–3038, 4 p. [Also available at http://pubs.usgs.gov/fs/2012/3038/pdf/fs2012-3038.pdf.); also see http://water.usgs.gov/usgs/osw/swstats/freq.html.]
Cohn, T.A., England, J.F., Berenbrock, C.E., Mason, R.R., Stedinger, J.R., and Lamontagne, J.R., 2013, A generalized Grubbs-Beck test statistic for detecting multiple potentially influential low outliers in a flood series: Water Resources Research, v. 49, no. 8, p. 5047–5058, accessed March 9, 2015, at http://onlinelibrary.wiley.com/doi/10.1002/wrcr.20392/pdf.

36 Comparisons of Estimates of Annual Exceedance-Probability Discharges for Small Drainage Basins in Iowa
Cohn, T.A., Lane, W.L., and Baier, W.G., 1997, An algo-rithm for computing moments-based flood quantile esti-mates when historical flood information is available: Water Resources Research, v. 33, no. 9, p. 2089–2096, accessed March 9, 2015, at http://onlinelibrary.wiley.com/doi/10.1029/97WR01640/pdf.
Cohn, T.A., Lane, W.L., and Stedinger, J.R., 2001, Confidence intervals for expected moments algorithm flood quantile estimates: Water Resources Research, v. 37, no. 6, p. 1695–1706, accessed March 9, 2015, at http://timcohn.com/Publications/CohnLaneSted2001WR900016.pdf.
Eash, D.A., and Barnes, K.K., 2012, Methods for estimating low-flow frequency statistics and harmonic mean flows for streams in Iowa: U.S. Geological Survey Scientific Inves-tigations Report 2012–5171, 94 p. [Also available at http://pubs.usgs.gov/sir/2012/5171/.]
Eash, D.A., Barnes, K.K., and Veilleux, A.G., 2013, Methods for estimating annual exceedance-probability discharges for streams in Iowa, based on data through water year 2010: U.S. Geological Survey Scientific Investigations Report 2013–5086, 63 p. with appendix. [Also available at http://pubs.usgs.gov/sir/2013/5086/.]
Esri, 2012, ArcGIS Resource Center, Desktop 10, accessed March 9, 2015, at http://help.arcgis.com/en/arcgisdesk-top/10.0/help/index.html.
Fulford, J.M., 1998, User’s guide to the U.S. Geological Survey Culvert Analysis Program, Version 97–08: U.S. Geological Survey Water-Resources Investigations Report 98–4166, 70 p. [Also available at http://pubs.usgs.gov/wri/1998/4166/report.pdf.]
Haddad, Khaled, Rahman, Ataur, and Stedinger, J.R., 2012, Regional flood frequency analysis using Bayesian general-ized least squares—A comparison between quantile and parameter regression techniques: Hydrological Processes, v. 26, p. 1008–1021, accessed March 9, 2015, at http://onlinelibrary.wiley.com/doi/10.1002/hyp.8189/pdf.
Holmes, R.R., Jr., Dinicola, Karen, 2010, 100-year flood—It’s all about chance: U.S. Geological Survey General Informa-tion Product 106, 4 p. [Also available at http://pubs.usgs.gov/gip/106/pdf/100-year-flood-handout-042610.pdf.]
Interagency Advisory Committee on Water Data, 1982, Guide-lines for determining flood flow frequency: U.S. Geological Survey, Office of Water Data Coordination, Bulletin 17B of the Hydrology Subcommittee, 28 p., plus appendixes. [Also available at http://water.usgs.gov/osw/bulletin17b/bulletin_17B.html.]
Iowa Department of Transportation, 2014a, LRFD design manual: Iowa Department of Transportation, accessed April 13, 2015, at http://www.iowadot.gov/bridge/manuallrfd.htm.
Iowa Department of Transportation, 2014b, Guidelines for preliminary design of culverts, appendix A, Iowa Runoff Chart: Iowa Department of Transportation, accessed March 9, 2015, at http://www.iowadot.gov/bridge/policy/03-PDG_App_A_Jan13.pdf.
Lara, O.G., 1987, Methods for estimating the magnitude and frequency of floods at ungaged sites on unregulated rural streams in Iowa: U.S. Geological Survey Water-Resources Investigation Report 87–4132, 34 p. [Also available at http://pubs.usgs.gov/wri/1987/4132/report.pdf; for two-page addendum, see http://publications.iowa.gov/16015/1/IADOT_hr268_Method_Estimating_Magnitude_Fre-quency_Floods_Rural_Streams_1987.pdf.]
National Climatic Data Center, Climate of Iowa, 2012, accessed March 9, 2015, at http://www.crh.noaa.gov/images/dvn/downloads/Clim_IA_01.pdf.
Natural Resources Conservation Service, 2009, Small water-shed hydrology—Win TR-55 user guide: U. S. Department of Agriculture, Natural Resources Conservation Service, Conservation Engineering Division, 139 p., with appen-dixes, accessed March 9, 2015, at ftp://ftp.wcc.nrcs.usda.gov/wntsc/H&H/WinTR55/WinTR55UserGuide.pdf.
Natural Resources Conservation Service, 2010, Time of concentration: U. S. Department of Agriculture, Natural Resources Conservation Service, National Engineering Handbook, Part 630, chap. 15, 22 p., accessed March 9, 2015, at ftp://ftp.wcc.nrcs.usda.gov/wntsc/H&H/NEHhy-drology/ch15.pdf.
Natural Resources Conservation Service, 2012, Glossary: U.S. Department of Agriculture, Natural Resources Conser-vation Service, National Engineering Handbook, Part 630, chap. 22, 15 p., accessed March 9, 2015, at ftp://ftp.wcc.nrcs.usda.gov/wntsc/H&H/NEHhydrology/ch22.pdf.
Perica, Sanja, Martin, Deborah, Pavlovic, Sandra, Roy, Ishani, St. Laurent, Michael, Trypaluk, Carl, Unruh, Dale, Yekta, Michael, Bonnin, Geoffrey, 2013, Precipitation-Frequency Atlas of the United States: U.S. Department of Commerce, National Oceanic and Atmospheric Administration, National Weather Service, v. 8, version 2.0—Midwestern States, Sil-ver Springs, Md, 292 p., accessed March 9, 2015, at http://www.nws.noaa.gov/oh/hdsc/PF_documents/Atlas14_Vol-ume8.pdf.
Prior, J.C., 1991, Landforms of Iowa: Iowa City, Iowa, Uni-versity of Iowa Press, 154 p.
Prior, J.C., Kohrt, C.J., and Quade, D.J., 2009, The landform regions of Iowa, vector digital data: Iowa City, Iowa, Iowa Geological Survey, Iowa Department of Natural Resources, accessed March 9, 2015, at ftp://ftp.igsb.uiowa.edu/gis_library/ia_state/geologic/landform/landform_regions.zip.

References Cited 37
Rantz, S.E., and others, 1982, Measurement and computa-tion of streamflow— Measurement of stage and discharge, volume 1, and Computation of discharge volume 2: U.S. Geological Survey Water-Supply Paper 2175, 631 p. [Also available at http://pubs.usgs.gov/wsp/wsp2175/.]
Risley, John, Stonewall, Adam, and Haluska, Tana, 2008, Estimating flow-duration and low-flow frequency statistics for unregulated streams in Oregon: U.S. Geological Survey Scientific Investigations Report 2008–5126, 22 p. [Also available at http://pubs.usgs.gov/sir/2008/5126/.]
Soenksen, P.J., and Eash, D.A., 1991, Iowa floods and droughts, in Paulson, R.W., ed., National Water Summary 1988–89—Hydrologic events and floods and droughts: U.S. Geological Survey Water-Supply Paper 2375, 591 p. [Also available at http://pubs.er.usgs.gov/publication/wsp2375.]
U.S. Department of Commerce, National Oceanic and Atmo-spheric Administration, and National Weather Service, 2014, Precipitation frequency data server: U.S. Department of Commerce, National Oceanic and Atmospheric Admin-istration, and National Weather Service, accessed March 9, 2015, at http://hdsc.nws.noaa.gov/hdsc/pfds/.
U.S. Geological Survey, 2015a, Welcome to StreamStats—The Streamstats Program: U.S. Geological Survey, accessed April 30, 2015, at http://water.usgs.gov/osw/streamstats/index.html.
U.S. Geological Survey, 2015b, National Water Information System (NWISWeb): U.S. Geological Survey database, accessed April 30, 2015, at http://waterdata.usgs.gov/nwis/sw.
Veilleux, A.G., Cohn, T.A., Flynn, K.M., Mason, R.R., Jr., and Hummel, P.R., 2014, Estimating magnitude and frequency of floods using the PeakFQ 7.0 program: U.S. Geologi-cal Survey Fact Sheet 2013–3108, 2 p. [Also available at: http://dx.doi.org/10.3133/fs20133108.]
Veilleux, A.G., Stedinger, J.R., and Eash, D.A., 2012, Bayes-ian WLS/GLS regression for regional skewness analysis for crest stage gage networks, in Loucks, E.D., ed., Pro-ceedings of the World Environmental and Water Resources Congress—Crossing boundaries, May 20–24, 2012 [abs.]: Albuquerque, N. Mex., American Society of Civil Engi-neering, paper 227, p. 2253–2263, accessed March 9, 2015. [Also available at http://ia.water.usgs.gov/media/pdf/report/Veilleux-Stedinger-Eash-EWRI-2012-227R.pdf.]
Publishing support provided by:Rolla Publishing Service Center
For more information concerning this publication, contact:Director, USGS Iowa Water Science CenterP.O. Box 1230Iowa City, IA 52244(319) 337–4191
Or visit the Iowa Water Science Center Web site at:http://ia.water.usgs.gov/


David A. Eash—Com
parisons of Estimates of Annual Exceedance-Probability Discharges for Sm
all Drainage Basins in Iowa—
Scientific Investigations Report 2015–5055
ISSN 2328-031X (print)ISSN 2328-0328 (online)http://dx.doi.org/10.3133/sir20155055