comparison of various classification techniques … comparison of various classification techniques...
TRANSCRIPT

Journal of Software Engineering and Applications, 2013, 6, 85-97 http://dx.doi.org/10.4236/jsea.2013.63013 Published Online March 2013 (http://www.scirp.org/journal/jsea)
85
Comparison of Various Classification Techniques Using Different Data Mining Tools for Diabetes Diagnosis
Rashedur M. Rahman, Farhana Afroz
Department of Electrical Engineering and Computer Science, North South University, Dhaka, Bangladesh. Email: [email protected], [email protected] Received December 21st, 2012; revised January 20th, 2013; accepted January 30th, 2013
ABSTRACT
In the absence of medical diagnosis evidences, it is difficult for the experts to opine about the grade of disease with af- firmation. Generally many tests are done that involve clustering or classification of large scale data. However many tests could complicate the main diagnosis process and lead to the difficulty in obtaining the end results, particularly in the case where many tests are performed. This kind of difficulty could be resolved with the aid of machine learning techniques. In this research, we present a comparative study of different classification techniques using three data min- ing tools named WEKA, TANAGRA and MATLAB. The aim of this paper is to analyze the performance of different classification techniques for a set of large data. A fundamental review on the selected techniques is presented for intro- duction purpose. The diabetes data with a total instance of 768 and 9 attributes (8 for input and 1 for output) will be used to test and justify the differences between the classification methods. Subsequently, the classification technique that has the potential to significantly improve the common or conventional methods will be suggested for use in large scale data, bioinformatics or other general applications. Keywords: Classification; Neural Network; Fuzzy Logic; Decision Tree; Performance Measurement
1. Introduction
The aim of this study is to investigate the performance of different classification methods using WEKA, TANA- GRA and MATLAB tool on Diabetes Dataset, specifi- cally Pima Indian Diabetes Dataset. A major problem in bioinformatics analysis or medical science is to attain the correct diagnosis of certain important information. For the ultimate diagnosis, generally many tests are done that involve clustering or classification of large scale data. All of these test procedures are said to be necessary in order to reach the ultimate diagnosis. However, on the other hand, too many tests could complicate the main diagnosis process and lead to the difficulty in obtaining the end results, particularly in the case where many tests are per- formed. This kind of difficulty could be resolved with the aid of machine learning which could be used directly to obtain the end result with the aid of several artificial in- telligence techniques. Machine learning covers such a broad range of processes that it is difficult to define it precisely. A dictionary definition includes phrases such as to gain knowledge or understanding of or skill by studying the instruction or experience and modification of a behavioral tendency by experienced zoologists and psychologists study learning in animals and humans [1]. The extraction of important information from a large pile
of data and its correlations is often the advantage of us- ing machine learning. New knowledge about tasks is constantly being discovered by humans. There is a con- stant stream of new events in the world and continuing redesign of Artificial Intelligent systems to conform to new knowledge is impractical but machine learning methods might be able to track much of it [1].
There is a substantial amount of research has been done with machine learning algorithms such as Bayes network, Multilayer Perceptron, Decision tree and prun- ing like J48graft, C4.5, Single Conjunctive Rule Learner like FLR, JRip and Fuzzy Inference System and Adap- tive Neuro-Fuzzy Inference System.
2. Related Work
A good number of researches have been reported in lit- erature on diagnosis of different deceases. Sapna and Tamilarasi [2] proposed a technique based on neuropathy diabetics. Nerve disorder is caused by diabetic mellitus. Long term diabetic patients could have diabetic neu- ropathies very easily. There is fifty (50%) percent prob- ability to have such diseases which affect many nerves system of the body. For example, body wall, limbs (which is called as somatic nerves) could be affected. On the other hand, internal organ like heart, stomach, etc.,
Copyright © 2013 SciRes. JSEA
Comparison of Various Classification Techniques Using Different Data Mining Tools for Diabetes Diagnosis 86
are known as automatic nerves. In this paper the risk factors and symptoms of diabetic neuropathy are used to make the fuzzy relation equation. Fuzzy relation equation is linked with the perception of composition of binary relations that means they used Multilayer Perceptron NN using Fuzzy Inference System.
Leonarda and Antonio [3] proposed automatic detec- tion of diabetic symptoms in retinal images by using a multilevel perceptron neural network. The network is trained using algorithms for evaluating the optimal global threshold which can minimize pixel classification errors. System performances are evaluated by means of an ade- quate index to provide percentage measure in the detec- tion of eye suspect regions based on neuro-fuzzy subsys- tem.
Radha and Rajagopalan [4] introduced an application of fuzzy logic to diagnosis of diabetes. It describes the fuzzy sets and linguistic variables that contribute to the diagnosis of disease particularly diabetes. As we all know fuzzy logic is a computational paradigm that pro- vides a tool based on mathematics which deals with un- certainty. At the same time this paper also presents a computer-based Fuzzy Logic with maximum and mini- mum relationship, membership values consisting of the components, specifying fuzzy set frame work. Forty pa- tients’ data have been collected to make this relationship more strong.
Jeatrakul and Wong [5] presented a comparison of neural network techniques for binary classification prob- lems. The classification performance obtained by five different types of neural networks, i.e., Back Propagation Neural Network (BPNN), Radial Basis Function Neural Network (RBFNN), General Regression Neural Network (GRNN), Probabilistic Neural Network (PNN), and Complementary Neural Network (CMTNN). The com- parison is done based on three benchmark data sets ob- tained from UCI machine learning repository.
Zhou, Purvis and Kasabov [6] described a general method based on the statistical analysis of training data to select fuzzy membership functions to be used in con- nection with fuzzy neural networks. The technique is first described and then illustrated by means of two experi- mental examinations for medical data.
Ten-Ho Lin and Von-Wun Soo [7] proposed alterna- tive pruning method based on the Minimal Description Length (MDL) principle. The MDL principle can be viewed as a tradeoff between theory complexity and data prediction accuracy given the theory. A greedy search algorithm of the minimum description length to prune the
fuzzy ARTMAP categories one by one was proposed. The experiments showed that fuzzy ARTMAP pruned with the MDL principle gave better performance with fewer categories created compared to original fuzzy ARTMAP and other machine learning systems. They tested those techniques on a number of benchmark clini- cal databases such as heart disease, breast cancer and diabetes databases.
Faezeh, Hossien, Ebrahim [8] proposed a fuzzy clus- tering technique (FACT) which determined the number of appropriate clusters based on the pattern essence. Dif- ferent experiments for algorithm evaluation were per- formed which showed a better performance compared to the typical widely used K-means clustering algorithm. Data was taken from the UCI Machine Learning Reposi- tory [9].
Santi Waulan et al. [10] proposed a new SSVM for classification problems. It is called Multiple Knot Spline SSVM (MKS-SSVM). To evaluate the effectiveness of their method, they carried out an experiment on Pima Indian diabetes dataset. First, theoretical of MKS-SSVM was presented. Then, application of MKS-SSVM and comparison with SSVM in diabetes disease diagnosis was given. The results of this study showed that the MKS-SSVM was effective to detect diabetes disease diagnosis.
3. Data Set Description
The characteristics of the data set used in this research are summarized in following Table 1. The detailed de- scriptions of the data set are available at UCI repository [9].
The objective of this data set was diagnosis of diabetes of Pima Indians. Based on personal data, such as age, number of times pregnant, and the results of medical examinations, e.g., blood pressure, body mass index, result of glucose tolerance test, etc., it is tried to decide whether a Pima Indian individual was diabetes positive or not.
Pima Indian Diabetes Data (PIDD) set is publicly available from the machine learning database at UCI. All patients represented in this data set are females with at least 21 years old of Pima Indian heritage living near Phoenix, Arizona. The problem posed here is to predict whether a person would test positive given a number of physiological measurements and medical test results. This is a two-class problem with class value 1 being in- terpreted as “tested positive for diabetes”. There are 500
Table 1. Characteristics of data sets.
Data set No. of example Input attributes Output classesTotal No. of
attributes Missing attributes status
Noisy attributes status
Pima 768 8 2 9 No No
Copyright © 2013 SciRes. JSEA
Comparison of Various Classification Techniques Using Different Data Mining Tools for Diabetes Diagnosis 87
examples of class 1 and 268 of class 2.
This data set is extracted from a larger database origin- nally owned by the National Institute of Diabetes and Digestive and Kidney Diseases. The purpose of the study is to investigate the relationship between the diabetes diagnostic result and a list of variables that represent physiological measurements and medical attributes. The data set in the UCI repository contains 768 observations and 9 variables with no missing values reported. How- ever, as some researchers point out, there are a number of impossible values, such as 0 body mass index and 0 plasma glucose. Furthermore, one attribute (2-hour se- rum insulin) contains almost 50% impossible values. To keep the sample size reasonably large, this attribute is removed from analysis. There are 236 observations that have at least one impossible value of glucose, blood pressure, triceps skin thickness, and body mass index. There are nine variables, including the binary response variable, in this data set; all other attributes are numeric- valued. The attributes are given below:
1) Number of times pregnant 2) Plasma glucose concentration a 2 hours in an oral
glucose tolerance test 3) Diastolic blood pressure (mm Hg) 4) Triceps skin fold thickness (mm) 5) 2-hour serum insulin (mu U/ml) 6) Body mass index (weight in kg/(height in m)^2) 7) Diabetes pedigree function 8) Age (years) 9) Class variable (0 or 1)
4. Methodology
We use different classification techniques in this research. Those techniques with running parameters are given below:
4.1. Multilayer Perceptron
Multilayer perceptron (MLP) [11] is one of the most commonly used neural network classification algorithms. The architecture used for the MLP during simulations with PIDD dataset consisted of a three layer feed-for- ward neural network: one input, one hidden, and one output layer. Selected parameters for the model are: learningRate = 0.3/0.15; momentum = 0.2; randomSeed = 0; validationThreshold = 20, Number of Epochs = 500.
4.2. BayesNet
BayesNet [12] learns Bayesian networks under the pre- sumptions: nominal attributes (numeric one are pre-de- scretized) and no missing values (any such values are replaced globally). There are two different parts for es- timating the conditional probability tables of the network. In this study we run BayesNet with the SimpleEstimator
and K2 search algorithm without using ADTree. K2 al- gorithm is a greedy search algorithm that works as fol- lows. Suppose we know the total ordering of the nodes. Initially each node has no parents. The algorithm then incrementally adds the parent whose addition increases most of the score of the resulting structure. When no ad- dition of a single parent can increase the score, it stops adding parents to the node. Since an ordering of the nodes is known beforehand, the search space under this constraint is much smaller than the entire space. And we do not need to check for cycles, since the total ordering guarantees that there is no cycle in the deduced structures. Furthermore, based on some appropriate assumptions, we can choose the parents for each node independently.
4.3. Naïve Byes
The Naïve Bayes [12] classifier provides a simple ap- proach, with clear semantics, representing and learning probabilistic knowledge. It is termed naïve because is relies on two important simplifying assumes that the pre- dictive attributes are conditionally independent given the class, and it assumes that no hidden or latent attributes influence the prediction process.
4.4. J48graft (C4.5 Decision Tree Revision 8)
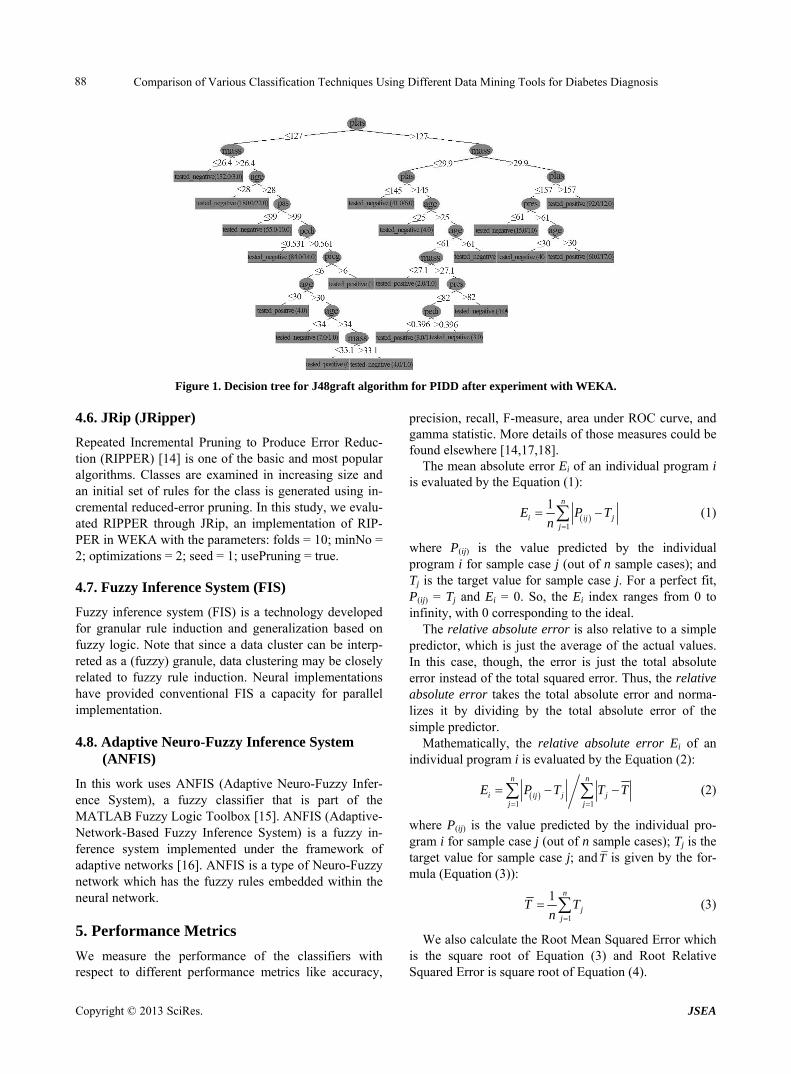
Perhaps C4.5 algorithm which was developed by Quinlan [13] is the most popular tree classifier till today. Weka classifier package has its own version of C4.5 known as J48 or J48graft. For this study, C4.5 classifier used in TANAGRA platform and J48graft classifier used in WEKA platform. J48graft is an optimized implemen- tation of C4.5 rev. 8. J48graft is experimented is this study with the parameters: confidenceFactor = 0.25; minNumObj = 2; subtreeRaising = True; unpruned = False. C4.5 is experimented in this study with the pa- rameters: Min size of leaves = 5; Confidence-Level for pessimistic = 0.25. Final decision tree built from the al- gorithm is depicted in Figure 1.
4.5. Fuzzy Lattice Reasoning (FLR)
The Fuzzy Lattice Reasoning (FLR) classifier is pre- sented for inducing descriptive, decision-making knowl- edge (rules) in a mathematical lattice data domain in- cluding space RN. Tunable generalization is possible based on non-linear (sigmoid) positive valuation func- tions; moreover, the FLR classifier can deal with missing data. Learning is carried out both incrementally and fast by computing disjunctions of join-lattice interval con- junctions, where a join-lattice interval conjunction cor- responds to a hyperbox in RN. In this study we evaluated FLR classifier in WEKA with the parameters: Rhoa = 0.5; Number of Rules = 2.
Copyright © 2013 SciRes. JSEA
Comparison of Various Classification Techniques Using Different Data Mining Tools for Diabetes Diagnosis 88
Figure 1. Decision tree for J48graft algorithm for PIDD after experiment with WEKA. 4.6. JRip (JRipper)
Repeated Incremental Pruning to Produce Error Reduc- tion (RIPPER) [14] is one of the basic and most popular algorithms. Classes are examined in increasing size and an initial set of rules for the class is generated using in- cremental reduced-error pruning. In this study, we evalu- ated RIPPER through JRip, an implementation of RIP- PER in WEKA with the parameters: folds = 10; minNo = 2; optimizations = 2; seed = 1; usePruning = true.
4.7. Fuzzy Inference System (FIS)
Fuzzy inference system (FIS) is a technology developed for granular rule induction and generalization based on fuzzy logic. Note that since a data cluster can be interp- reted as a (fuzzy) granule, data clustering may be closely related to fuzzy rule induction. Neural implementations have provided conventional FIS a capacity for parallel implementation.
4.8. Adaptive Neuro-Fuzzy Inference System (ANFIS)
In this work uses ANFIS (Adaptive Neuro-Fuzzy Infer- ence System), a fuzzy classifier that is part of the MATLAB Fuzzy Logic Toolbox [15]. ANFIS (Adaptive- Network-Based Fuzzy Inference System) is a fuzzy in- ference system implemented under the framework of adaptive networks [16]. ANFIS is a type of Neuro-Fuzzy network which has the fuzzy rules embedded within the neural network.
5. Performance Metrics
We measure the performance of the classifiers with respect to different performance metrics like accuracy,
precision, recall, F-measure, area under ROC curve, and gamma statistic. More details of those measures could be found elsewhere [14,17,18].
The mean absolute error Ei of an individual program i is evaluated by the Equation (1):
1
1 n
i ijj
E Pn
jT (1)
where P(ij) is the value predicted by the individual program i for sample case j (out of n sample cases); and Tj is the target value for sample case j. For a perfect fit, P(ij) = Tj and Ei = 0. So, the Ei index ranges from 0 to infinity, with 0 corresponding to the ideal.
The relative absolute error is also relative to a simple predictor, which is just the average of the actual values. In this case, though, the error is just the total absolute error instead of the total squared error. Thus, the relative absolute error takes the total absolute error and norma- lizes it by dividing by the total absolute error of the simple predictor.
Mathematically, the relative absolute error Ei of an individual program i is evaluated by the Equation (2):
1 1
n n
i jijj j
E P T T
j T (2)
where P(ij) is the value predicted by the individual pro- gram i for sample case j (out of n sample cases); Tj is the target value for sample case j; and T is given by the for- mula (Equation (3)):
1
1 n
jj
Tn
T (3)
We also calculate the Root Mean Squared Error which is the square root of Equation (3) and Root Relative Squared Error is square root of Equation (4).
Copyright © 2013 SciRes. JSEA
Comparison of Various Classification Techniques Using Different Data Mining Tools for Diabetes Diagnosis 89
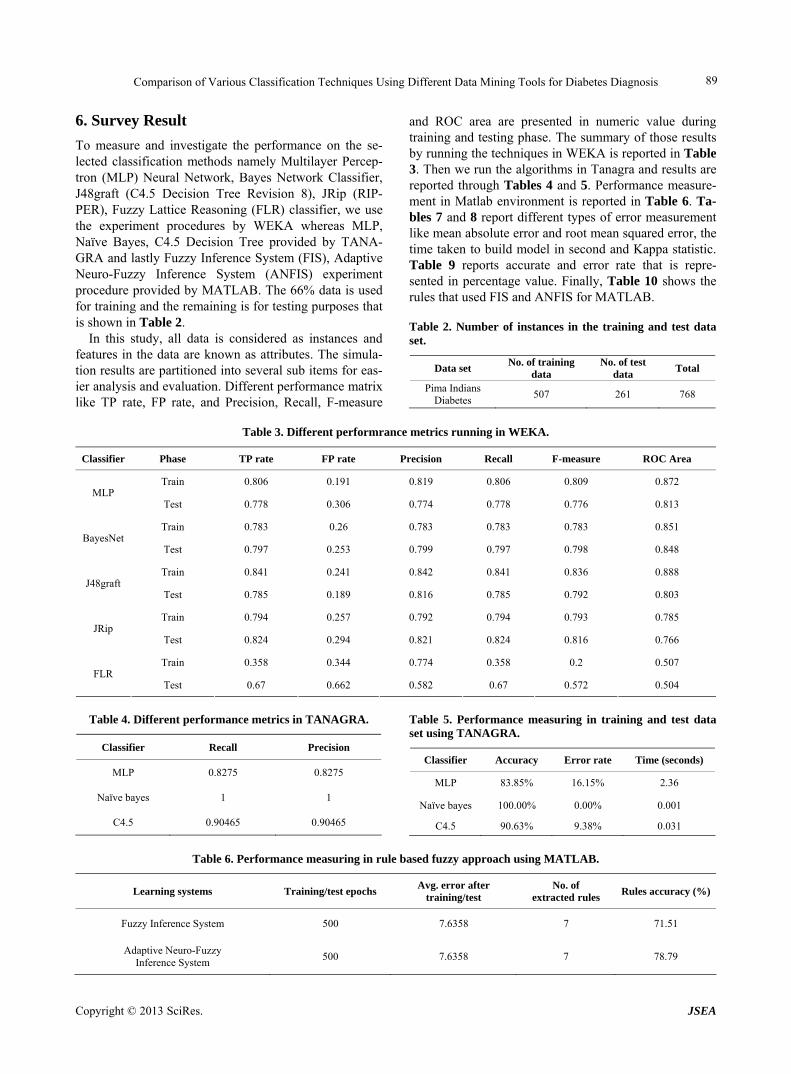
6. Survey Result
To measure and investigate the performance on the se- lected classification methods namely Multilayer Percep- tron (MLP) Neural Network, Bayes Network Classifier, J48graft (C4.5 Decision Tree Revision 8), JRip (RIP- PER), Fuzzy Lattice Reasoning (FLR) classifier, we use the experiment procedures by WEKA whereas MLP, Naïve Bayes, C4.5 Decision Tree provided by TANA- GRA and lastly Fuzzy Inference System (FIS), Adaptive Neuro-Fuzzy Inference System (ANFIS) experiment procedure provided by MATLAB. The 66% data is used for training and the remaining is for testing purposes that is shown in Table 2.
In this study, all data is considered as instances and features in the data are known as attributes. The simula- tion results are partitioned into several sub items for eas- ier analysis and evaluation. Different performance matrix like TP rate, FP rate, and Precision, Recall, F-measure
and ROC area are presented in numeric value during training and testing phase. The summary of those results by running the techniques in WEKA is reported in Table 3. Then we run the algorithms in Tanagra and results are reported through Tables 4 and 5. Performance measure- ment in Matlab environment is reported in Table 6. Ta- bles 7 and 8 report different types of error measurement like mean absolute error and root mean squared error, the time taken to build model in second and Kappa statistic. Table 9 reports accurate and error rate that is repre- sented in percentage value. Finally, Table 10 shows the rules that used FIS and ANFIS for MATLAB. Table 2. Number of instances in the training and test data set.
Data set No. of training
data No. of test
data Total
Pima Indians Diabetes
507 261 768
Table 3. Different performrance metrics running in WEKA.
Classifier Phase TP rate FP rate Precision Recall F-measure ROC Area
Train 0.806 0.191 0.819 0.806 0.809 0.872 MLP
Test 0.778 0.306 0.774 0.778 0.776 0.813
Train 0.783 0.26 0.783 0.783 0.783 0.851 BayesNet
Test 0.797 0.253 0.799 0.797 0.798 0.848
Train 0.841 0.241 0.842 0.841 0.836 0.888 J48graft
Test 0.785 0.189 0.816 0.785 0.792 0.803
Train 0.794 0.257 0.792 0.794 0.793 0.785 JRip
Test 0.824 0.294 0.821 0.824 0.816 0.766
Train 0.358 0.344 0.774 0.358 0.2 0.507 FLR
Test 0.67 0.662 0.582 0.67 0.572 0.504
Table 4. Different performance metrics in TANAGRA.
Classifier Recall Precision
MLP 0.8275 0.8275
Naïve bayes 1 1
C4.5 0.90465 0.90465
Table 5. Performance measuring in training and test data set using TANAGRA.
Classifier Accuracy Error rate Time (seconds)
MLP 83.85% 16.15% 2.36
Naïve bayes 100.00% 0.00% 0.001
C4.5 90.63% 9.38% 0.031
Table 6. Performance measuring in rule based fuzzy approach using MATLAB.
Learning systems Training/test epochs Avg. error after
training/test No. of
extracted rules Rules accuracy (%)
Fuzzy Inference System 500 7.6358 7 71.51
Adaptive Neuro-Fuzzy Inference System
500 7.6358 7 78.79
Copyright © 2013 SciRes. JSEA

Comparison of Various Classification Techniques Using Different Data Mining Tools for Diabetes Diagnosis 90
Table 7. Error measurement for different classifiers in WEKA.
Classifier Phase Mean absolute
error Avg. MAE
Root mean squared error
Avg. RMSE
Relative absolute error
Avg. RAE Root relative squared error
Avg. RrSE
Training 0.2852 0.3815 62.75% 80.05% MLP
Testing 0.2892 0.2872
0.4007 0.3911
64.08% 63.42%
85.44% 82.75%
Training 0.2707 0.3878 59.55% 81.36% BayesNet
Testing 0.2816 0.2762
0.3867 0.3873
62.40% 60.98%
82.44% 81.9%
Training 0.2383 0.3452 52.43% 72.42% J48graft
Testing 0.2914 0.2649
0.4013 0.3733
64.57% 58.50%
85.57% 79%
Training 0.3091 0.3931 68.02% 82.48% JRip
Testing 0.3165 0.3128
0.3842 0.3887
70.17% 69.1%
82.07% 82.28%
Training 0.6419 0.8012 141.24% 168.09% FLR
Testing 0.3295 0.4857
0.5740 0.6876
73.06% 107.15%
122.63% 145.36%
Table 8. Performance measuring in training and test data set using WEKA.
Classifier Phase Accuracy Avg. AC Error Rate Avg. ER Time (seconds) Avg. TT Kappa statistic Avg. KS
Training 80.60% 19.40% 101.08 0.5904 MLP
Testing 77.78% 79.19%
22.22% 20.81%
25.17 63.13
0.4812 0.5358
Training 78.26% 21.74% 0.03 0.5218 BayesNet
Testing 79.69% 78.98%
20.31% 21.03%
0.05 0.04
0.5391 0.5305
Training 84.11% 15.89% 0.19 0.6319 J48graft
Testing 78.54% 81.33%
21.46% 18.68%
0.08 0.135
0.5481 0.59
Training 79.43% 20.57% 0.3 0.5425 JRip
Testing 82.38% 80.91%
17.62% 19.10%
0.28 0.29
0.5658 0.5542
Training 35.81% 64.19% 0.03 0.0098 FLR
Testing 67.05% 51.43%
32.95% 48.57%
0.02 0.025
0.0115 0.0107
Table 9. Accuracy in percentage for different classification comparing three tools.
Tool MLP BayesNet/Naïve bayes C4.5/J48graft JRip FLR FIS ANFIS Average
WEKA 79.19% 78.98% 81.33% 80.91% 51.43% nill nill 74.37%
TANAGRA 83.85% 100% 90.63% nill nill nill nill 91.49%
MATLAB nill nill nill nill nill 71.51% 78.79% 75.15%
Table 10. Sample rules framed for the proposed FIS and ANFIS.
IF THEN
Rule No. preg. plas bp skin insl bmi dpf age class 0 (weight) class 1 (weight)
1 0 ≤103 >40 ≤26 ≤156 ≤35.3 ≤0.179 ≤34 0.955 0.5
2 ≤3 not define not define ≤35 >156 ≤35.3 ≤0.787 not define 0.5 0.928
3 not define not define not define not define not define not define ≤0.179 ≤34 0.955 0.5
4 not define ≤103 not define not define not define not define ≤0.787 not define 0.944 0.5
5 not define not define not define not define ≤156 ≤35.3 not define >34 or ≤37 0.912 0.5
6 not define >135 not define not define ≤185 >33.7 ≤1.096 >37 0.5 0.928
7 6 >103 not define not define not define >35.3 ≤1.096 >34 0.5 0.909
Copyright © 2013 SciRes. JSEA
Comparison of Various Classification Techniques Using Different Data Mining Tools for Diabetes Diagnosis
Copyright © 2013 SciRes. JSEA
91
7. Result Analysis and Discussion
In this study, we examine the performance of different classification methods that could generate accuracy and some error to diagnosis the data set.
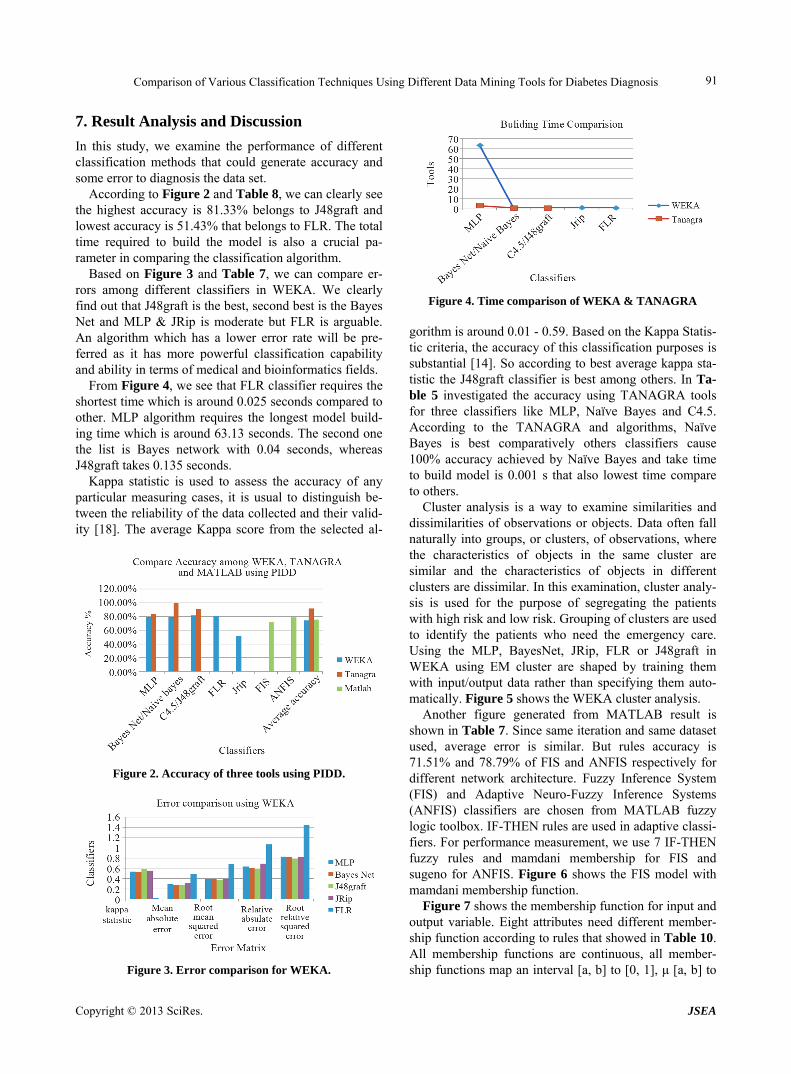
According to Figure 2 and Table 8, we can clearly see the highest accuracy is 81.33% belongs to J48graft and lowest accuracy is 51.43% that belongs to FLR. The total time required to build the model is also a crucial pa-rameter in comparing the classification algorithm.
Based on Figure 3 and Table 7, we can compare er-rors among different classifiers in WEKA. We clearly find out that J48graft is the best, second best is the Bayes Net and MLP & JRip is moderate but FLR is arguable. An algorithm which has a lower error rate will be pre- ferred as it has more powerful classification capability and ability in terms of medical and bioinformatics fields.
Figure 4. Time comparison of WEKA & TANAGRA gorithm is around 0.01 - 0.59. Based on the Kappa Statis- tic criteria, the accuracy of this classification purposes is substantial [14]. So according to best average kappa sta- tistic the J48graft classifier is best among others. In Ta- ble 5 investigated the accuracy using TANAGRA tools for three classifiers like MLP, Naïve Bayes and C4.5. According to the TANAGRA and algorithms, Naïve Bayes is best comparatively others classifiers cause 100% accuracy achieved by Naïve Bayes and take time to build model is 0.001 s that also lowest time compare to others.
From Figure 4, we see that FLR classifier requires the shortest time which is around 0.025 seconds compared to other. MLP algorithm requires the longest model build- ing time which is around 63.13 seconds. The second one the list is Bayes network with 0.04 seconds, whereas J48graft takes 0.135 seconds.
Kappa statistic is used to assess the accuracy of any particular measuring cases, it is usual to distinguish be- tween the reliability of the data collected and their valid- ity [18]. The average Kappa score from the selected al-
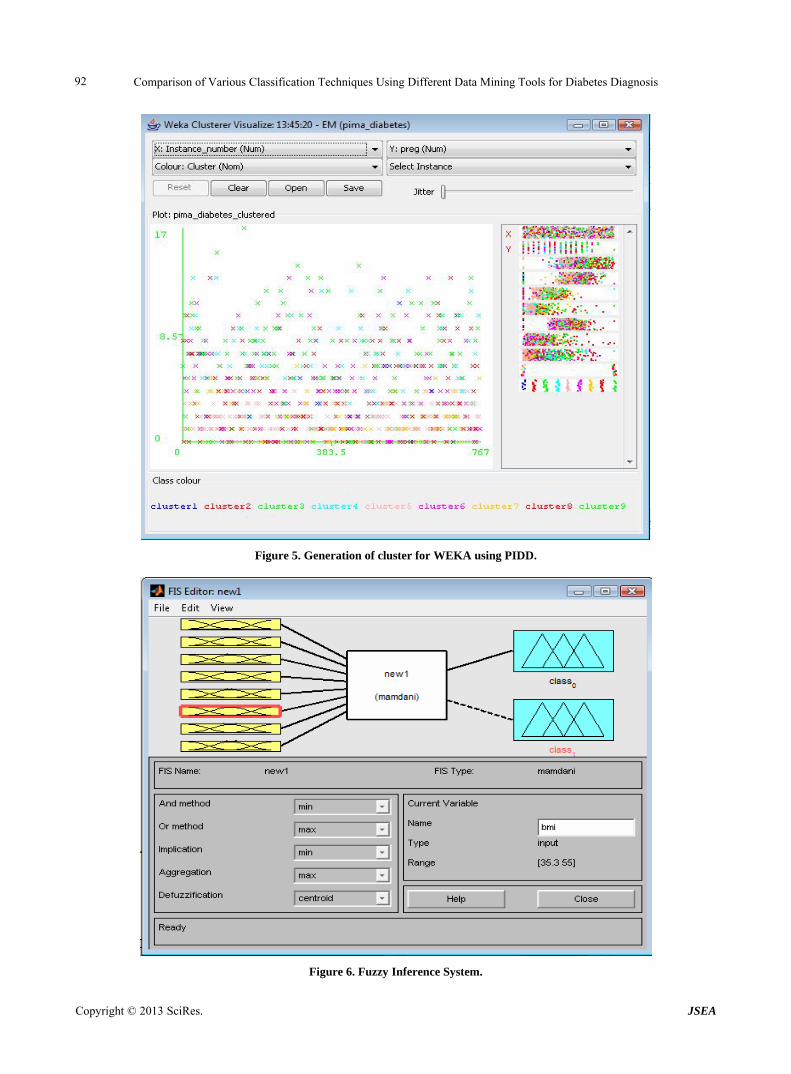
Cluster analysis is a way to examine similarities and dissimilarities of observations or objects. Data often fall naturally into groups, or clusters, of observations, where the characteristics of objects in the same cluster are similar and the characteristics of objects in different clusters are dissimilar. In this examination, cluster analy- sis is used for the purpose of segregating the patients with high risk and low risk. Grouping of clusters are used to identify the patients who need the emergency care. Using the MLP, BayesNet, JRip, FLR or J48graft in WEKA using EM cluster are shaped by training them with input/output data rather than specifying them auto- matically. Figure 5 shows the WEKA cluster analysis.
Another figure generated from MATLAB result is shown in Table 7. Since same iteration and same dataset used, average error is similar. But rules accuracy is 71.51% and 78.79% of FIS and ANFIS respectively for different network architecture. Fuzzy Inference System (FIS) and Adaptive Neuro-Fuzzy Inference Systems (ANFIS) classifiers are chosen from MATLAB fuzzy logic toolbox. IF-THEN rules are used in adaptive classi-fiers. For performance measurement, we use 7 IF-THEN fuzzy rules and mamdani membership for FIS and sugeno for ANFIS. Figure 6 shows the FIS model with mamdani membership function.
Figure 2. Accuracy of three tools using PIDD.
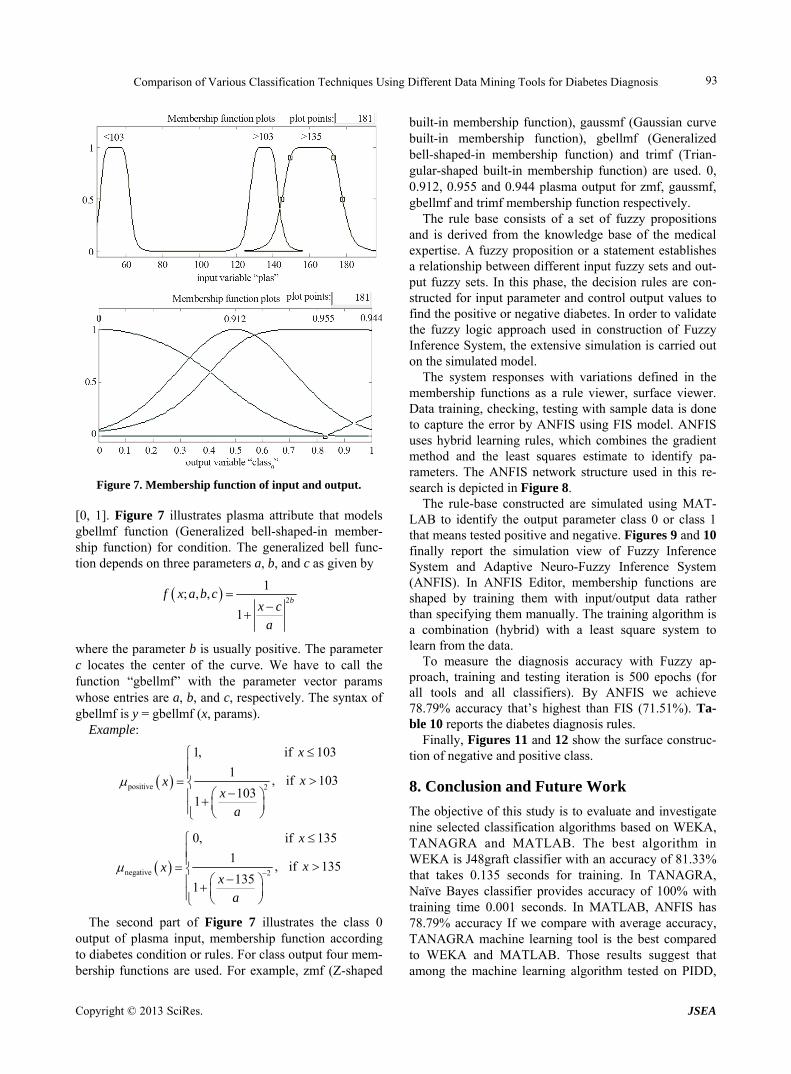
Figure 7 shows the membership function for input and output variable. Eight attributes need different member- ship function according to rules that showed in Table 10. All membership functions are continuous, all member- ship functions map an interval [a, b] to [0, 1], μ [a, b] to Figure 3. Error comparison for WEKA.
Comparison of Various Classification Techniques Using Different Data Mining Tools for Diabetes Diagnosis 92
Figure 5. Generation of cluster for WEKA using PIDD.
Figure 6. Fuzzy Inference System.
Copyright © 2013 SciRes. JSEA
Comparison of Various Classification Techniques Using Different Data Mining Tools for Diabetes Diagnosis 93
Figure 7. Membership function of input and output.
[0, 1]. Figure 7 illustrates plasma attribute that models gbellmf function (Generalized bell-shaped-in member- ship function) for condition. The generalized bell func- tion depends on three parameters a, b, and c as given by
2
1; , ,
1b
f x a b cx c
a
where the parameter b is usually positive. The parameter c locates the center of the curve. We have to call the function “gbellmf” with the parameter vector params whose entries are a, b, and c, respectively. The syntax of gbellmf is y = gbellmf (x, params).
Example:
positive 2
1, if 103
1, if 103
1031
x
xxx
a
negative 2
0, if 135
1, if 135
1351
x
xxx
a
The second part of Figure 7 illustrates the class 0 output of plasma input, membership function according to diabetes condition or rules. For class output four mem- bership functions are used. For example, zmf (Z-shaped
built-in membership function), gaussmf (Gaussian curve built-in membership function), gbellmf (Generalized bell-shaped-in membership function) and trimf (Trian- gular-shaped built-in membership function) are used. 0, 0.912, 0.955 and 0.944 plasma output for zmf, gaussmf, gbellmf and trimf membership function respectively.
The rule base consists of a set of fuzzy propositions and is derived from the knowledge base of the medical expertise. A fuzzy proposition or a statement establishes a relationship between different input fuzzy sets and out- put fuzzy sets. In this phase, the decision rules are con- structed for input parameter and control output values to find the positive or negative diabetes. In order to validate the fuzzy logic approach used in construction of Fuzzy Inference System, the extensive simulation is carried out on the simulated model.
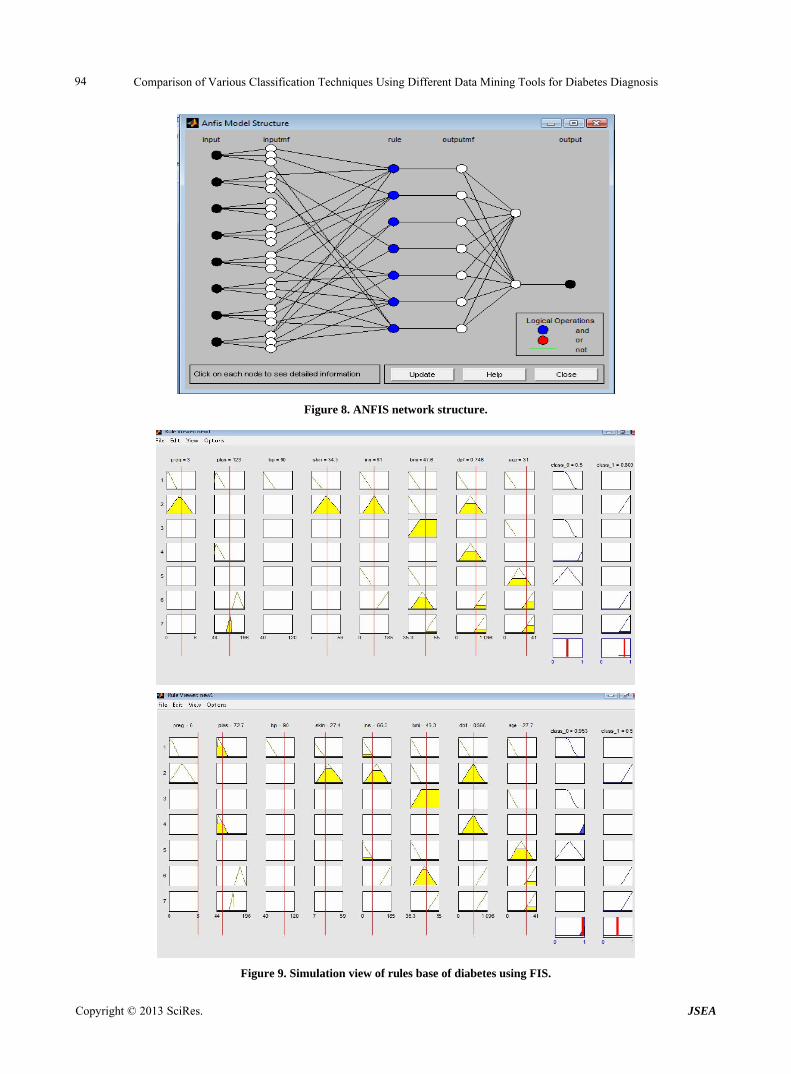
The system responses with variations defined in the membership functions as a rule viewer, surface viewer. Data training, checking, testing with sample data is done to capture the error by ANFIS using FIS model. ANFIS uses hybrid learning rules, which combines the gradient method and the least squares estimate to identify pa- rameters. The ANFIS network structure used in this re- search is depicted in Figure 8.
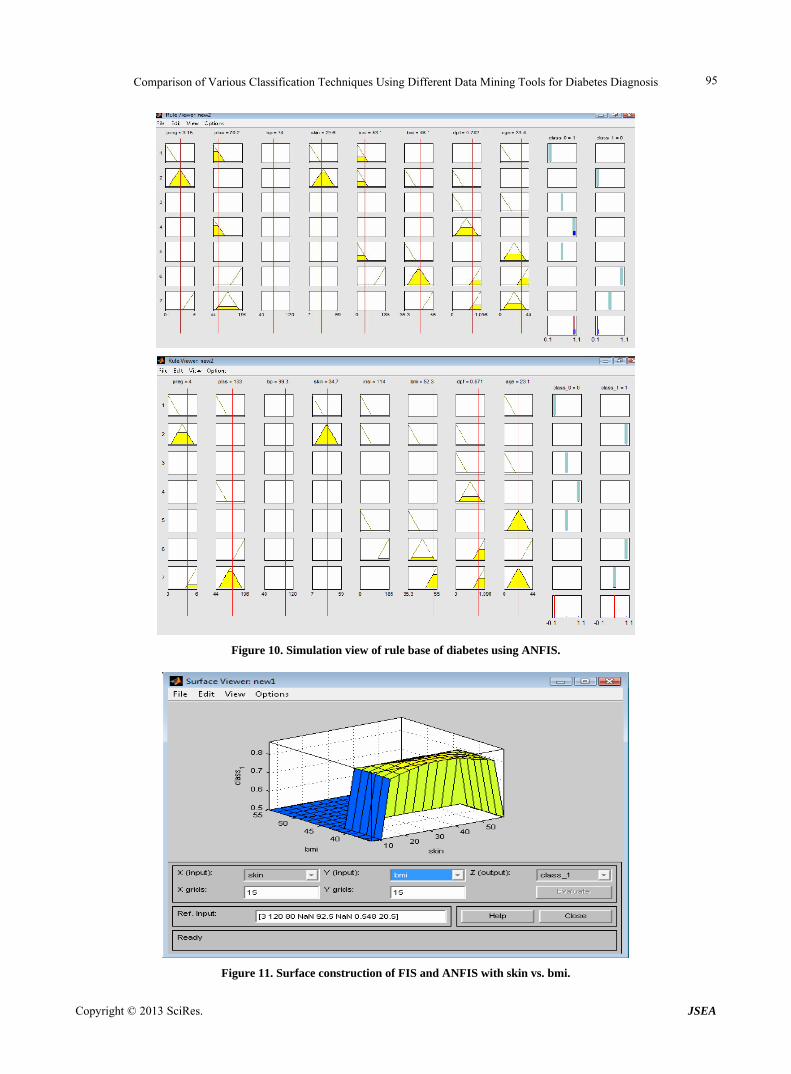
The rule-base constructed are simulated using MAT- LAB to identify the output parameter class 0 or class 1 that means tested positive and negative. Figures 9 and 10 finally report the simulation view of Fuzzy Inference System and Adaptive Neuro-Fuzzy Inference System (ANFIS). In ANFIS Editor, membership functions are shaped by training them with input/output data rather than specifying them manually. The training algorithm is a combination (hybrid) with a least square system to learn from the data.
To measure the diagnosis accuracy with Fuzzy ap- proach, training and testing iteration is 500 epochs (for all tools and all classifiers). By ANFIS we achieve 78.79% accuracy that’s highest than FIS (71.51%). Ta- ble 10 reports the diabetes diagnosis rules.
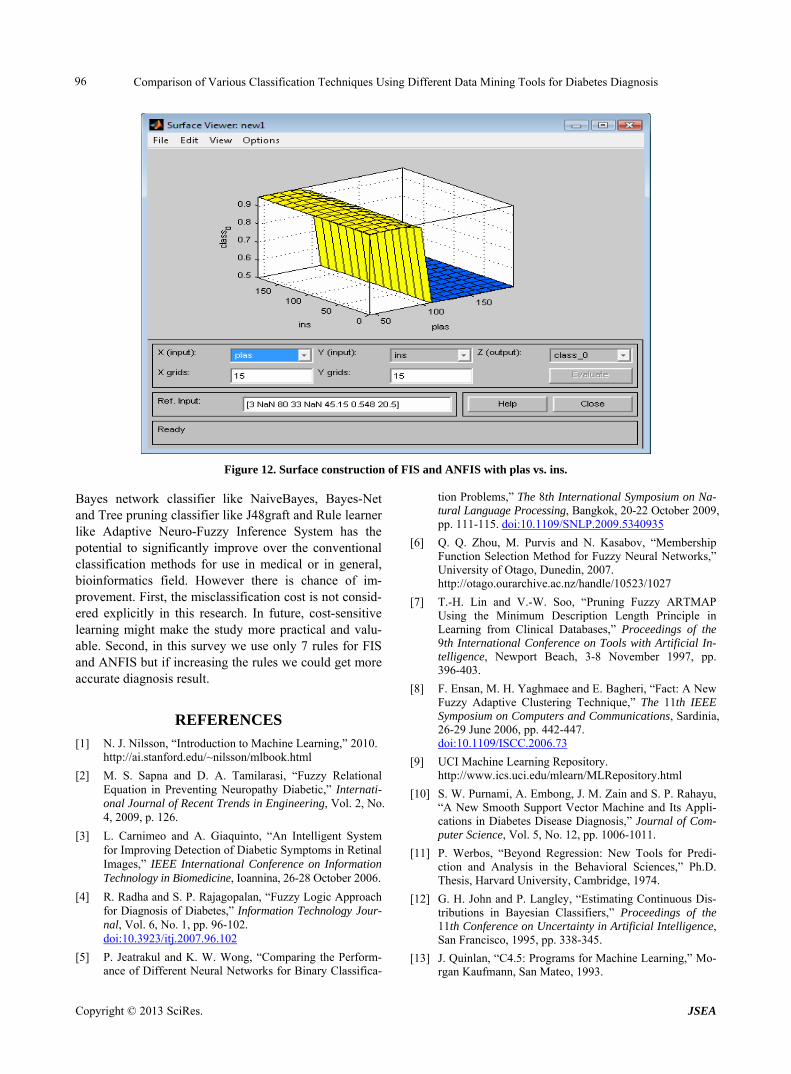
Finally, Figures 11 and 12 show the surface construc-tion of negative and positive class.
8. Conclusion and Future Work
The objective of this study is to evaluate and investigate nine selected classification algorithms based on WEKA, TANAGRA and MATLAB. The best algorithm in WEKA is J48graft classifier with an accuracy of 81.33% that takes 0.135 seconds for training. In TANAGRA, Naïve Bayes classifier provides accuracy of 100% with training time 0.001 seconds. In MATLAB, ANFIS has 78.79% accuracy If we compare with average accuracy, TANAGRA machine learning tool is the best compared to WEKA and MATLAB. Those results suggest that among the machine learning algorithm tested on PIDD,
Copyright © 2013 SciRes. JSEA
Comparison of Various Classification Techniques Using Different Data Mining Tools for Diabetes Diagnosis 94
Figure 8. ANFIS network structure.
Figure 9. Simulation view of rules base of diabetes using FIS.
Copyright © 2013 SciRes. JSEA
Comparison of Various Classification Techniques Using Different Data Mining Tools for Diabetes Diagnosis 95
Figure 10. Simulation view of rule base of diabetes using ANFIS.
Figure 11. Surface construction of FIS and ANFIS with skin vs. bmi.
Copyright © 2013 SciRes. JSEA
Comparison of Various Classification Techniques Using Different Data Mining Tools for Diabetes Diagnosis
Copyright © 2013 SciRes. JSEA
96
Figure 12. Surface construction of FIS and ANFIS with plas vs. ins.
Bayes network classifier like NaiveBayes, Bayes-Net and Tree pruning classifier like J48graft and Rule learner like Adaptive Neuro-Fuzzy Inference System has the potential to significantly improve over the conventional classification methods for use in medical or in general, bioinformatics field. However there is chance of im- provement. First, the misclassification cost is not consid- ered explicitly in this research. In future, cost-sensitive learning might make the study more practical and valu- able. Second, in this survey we use only 7 rules for FIS and ANFIS but if increasing the rules we could get more accurate diagnosis result.
REFERENCES
[1] N. J. Nilsson, “Introduction to Machine Learning,” 2010. http://ai.stanford.edu/~nilsson/mlbook.html
[2] M. S. Sapna and D. A. Tamilarasi, “Fuzzy Relational Equation in Preventing Neuropathy Diabetic,” Internati- onal Journal of Recent Trends in Engineering, Vol. 2, No. 4, 2009, p. 126.
[3] L. Carnimeo and A. Giaquinto, “An Intelligent System for Improving Detection of Diabetic Symptoms in Retinal Images,” IEEE International Conference on Information Technology in Biomedicine, Ioannina, 26-28 October 2006.
[4] R. Radha and S. P. Rajagopalan, “Fuzzy Logic Approach for Diagnosis of Diabetes,” Information Technology Jour-nal, Vol. 6, No. 1, pp. 96-102. doi:10.3923/itj.2007.96.102
[5] P. Jeatrakul and K. W. Wong, “Comparing the Perform- ance of Different Neural Networks for Binary Classifica-
tion Problems,” The 8th International Symposium on Na- tural Language Processing, Bangkok, 20-22 October 2009, pp. 111-115. doi:10.1109/SNLP.2009.5340935
[6] Q. Q. Zhou, M. Purvis and N. Kasabov, “Membership Function Selection Method for Fuzzy Neural Networks,” University of Otago, Dunedin, 2007. http://otago.ourarchive.ac.nz/handle/10523/1027
[7] T.-H. Lin and V.-W. Soo, “Pruning Fuzzy ARTMAP Using the Minimum Description Length Principle in Learning from Clinical Databases,” Proceedings of the 9th International Conference on Tools with Artificial In-telligence, Newport Beach, 3-8 November 1997, pp. 396-403.
[8] F. Ensan, M. H. Yaghmaee and E. Bagheri, “Fact: A New Fuzzy Adaptive Clustering Technique,” The 11th IEEE Symposium on Computers and Communications, Sardinia, 26-29 June 2006, pp. 442-447. doi:10.1109/ISCC.2006.73
[9] UCI Machine Learning Repository. http://www.ics.uci.edu/mlearn/MLRepository.html
[10] S. W. Purnami, A. Embong, J. M. Zain and S. P. Rahayu, “A New Smooth Support Vector Machine and Its Appli- cations in Diabetes Disease Diagnosis,” Journal of Com-puter Science, Vol. 5, No. 12, pp. 1006-1011.
[11] P. Werbos, “Beyond Regression: New Tools for Predi- ction and Analysis in the Behavioral Sciences,” Ph.D. Thesis, Harvard University, Cambridge, 1974.
[12] G. H. John and P. Langley, “Estimating Continuous Dis-tributions in Bayesian Classifiers,” Proceedings of the 11th Conference on Uncertainty in Artificial Intelligence, San Francisco, 1995, pp. 338-345.
[13] J. Quinlan, “C4.5: Programs for Machine Learning,” Mo- rgan Kaufmann, San Mateo, 1993.

Comparison of Various Classification Techniques Using Different Data Mining Tools for Diabetes Diagnosis 97
[14] I. H. Witten and E. Frank, “Data Mining: Practical Ma- chine Learning Tools and Techniques,” 2nd Edition, Morgan Kaufmann, San Francisco, 2005.
[15] The Mathworks-Fuzzy Logic Toolbox, 2006. http://www.mathworks.ch/access/helpdeskr13/help/toolbox/fuzzy/fuzzy.html
[16] Jang and J.-S. Roger, “Anfis: Adaptive-Network-Based Fuzzy Inference System,” IEEE Transactions on Systems,
Man, and Cybernetics, Vol. 23, No. 3, 1993, pp. 665-685. doi:10.1109/21.256541
[17] J. W. Han and M. Kanber, “Data Mining Concept and Techniques,” Morgan Kaufmann Publishers, Burlington, 2000.
[18] Kappa Statistic. http://www.dmi.columbia.edu/homepages/chuangj/kappa
Copyright © 2013 SciRes. JSEA