comparison of three angle of attack (aoa) indicators: a
TRANSCRIPT

Dissertations and Theses
11-2013
Comparison of Three Angle of Attack (AOA) Indicators: A Usability Comparison of Three Angle of Attack (AOA) Indicators: A Usability
Study Study
Camilo Jimenez Embry-Riddle Aeronautical University - Daytona Beach
Follow this and additional works at: https://commons.erau.edu/edt
Part of the Aviation Commons, and the Psychology Commons
Scholarly Commons Citation Scholarly Commons Citation Jimenez, Camilo, "Comparison of Three Angle of Attack (AOA) Indicators: A Usability Study" (2013). Dissertations and Theses. 85. https://commons.erau.edu/edt/85
This Thesis - Open Access is brought to you for free and open access by Scholarly Commons. It has been accepted for inclusion in Dissertations and Theses by an authorized administrator of Scholarly Commons. For more information, please contact [email protected].

i
COMPARISON OF THREE ANGLE OF ATTACK (AOA) INDICATORS: A
USABILITY STUDY
By
Camilo Jimenez
A Thesis Submitted to the College of Arts and Sciences in Partial Fulfillment of the
Requirements for the Degree of Master in Science in Human Factors and Systems

ii
Embry-Riddle Aeronautical University
Daytona Beach, Florida
November 2013


iv
ABSTRACT Researcher: Camilo Jimenez
Title: COMPARISON OF THREE ANGLE OF ATTACK (AOA) INDICATORS: A
USABILITY STUDY
Institution: Embry-Riddle Aeronautical University
Degree: Master in Science in Human Factors and Systems
Year: 2013
Angle of Attack (AOA) is an important aeronautical concept used to understand the performance
status of an aircraft during different flight stages. The Federal Aviation Administration (FAA)
has indicated the importance of developing and encouraging the use of affordable AOA based
systems to increase inflight safety. Embry-Riddle Aeronautical University’s flight department
decided to install AOA indicators in its fleet of Cessna 172S, to increase safety and to help
student pilots better understand this important concept. This paper presents a review of AOA,
visual display design principles, and usability. This experimental study examined three different
AOA indicators provided by the flight department. The goal was to conduct a usability study in
order to understand which of these indicators was better suited for student training. Instructor
pilots were used as participants in a series of flights, in which they were asked to perform
different maneuvers in which using AOA indicators was thought to help increasing stall
awareness and performance. At the end of each flight participants were asked to complete a
series of surveys (including an adaptation of the system usability scale) and to provide comments
in order to understand their preferences related to AOA indicators. The analysis of the data
shows significant differences between the indicators. Discussion of the results and
recommendations for future studies are also covered.

v
TABLE OF CONTENTS
Review Committee Signature Page .............................................................................................................. iii
Abstract ........................................................................................................................................................ iv
List of Tables .............................................................................................................................................. vii
List of Figures ............................................................................................................................................ viii
Introduction ................................................................................................................................................... 1
Significance of the Study .......................................................................................................................... 6
Purpose Statement ..................................................................................................................................... 7
Hypotheses ................................................................................................................................................ 7
Limitations and Assumptions ................................................................................................................... 8
Definition of Terms ................................................................................................................................... 8
List of Acronyms ...................................................................................................................................... 9
Review of the Relevant Literature .............................................................................................................. 10
Angle of attack ........................................................................................................................................ 10
Usability .................................................................................................................................................. 12
Methods ...................................................................................................................................................... 20
Research Approach ................................................................................................................................. 20
Sample .................................................................................................................................................... 20
Apparatus and Materials ......................................................................................................................... 21
Design and Procedures ............................................................................................................................ 22
Sources of the Data ................................................................................................................................. 25
Data Collection Device ........................................................................................................................... 25
Instrument reliability and validity ....................................................................................................... 25
Treatment of the Data ............................................................................................................................. 26
Results ......................................................................................................................................................... 27
Discussion, Conclusion, and Limitations .................................................................................................... 38
Discussion ............................................................................................................................................... 38
Conclusion .............................................................................................................................................. 45
Limitations .............................................................................................................................................. 48
References ................................................................................................................................................... 51

vi
Appendices
A Approximate AOA Indications for Each Flight Maneuver ...................................................... 56
B Informed Consent Form ........................................................................................................... 58
C Pre-Flight Questionnaire .......................................................................................................... 61
D Post-Flight Questionnaire......................................................................................................... 67

vii
LIST OF TABLES
Table 1 Mean and Standard Deviation for SUS............................................................................ 28
Table 2 Mean and Standard Deviation for Visual Representation ............................................... 28
Table 3 Pairwise Comparisons for Visual Representation ........................................................... 29
Table 4 Mean and Standard Deviation for Enhanced Performance .............................................. 29
Table 5 Pairwise Comparisons for Enhanced Performance .......................................................... 30
Table 6 Mean and Standard Deviation for Enhanced Stall Awareness ........................................ 30
Table 7 Pairwise Comparisons for Enhanced Stall Awareness .................................................... 31
Table 8 Mean and Standard Deviation for Crosschecked Indicator During Maneuvers .............. 31
Table 9 Mean and Standard Deviation for Indicator would Enhance Students’ Performance ..... 32
Table 10 Ranks for Crosschecking the Indicator helped in Flying a More Stable Approach on
Final (Normal Approach and Landing)......................................................................................... 32
Table 11 Ranks for Crosschecking the Indicator helped in Flying a More Stable Approach on
Final (Short Field Approach and Landing) ................................................................................... 33
Table 12 Ranks for Crosschecking Indicator Enhanced Landing Performance (Normal Approach
and Landing) ................................................................................................................................. 33
Table 13 Ranks for Crosschecking Indicator Enhanced Landing Performance (Short Field
Approach and Landing) ................................................................................................................ 34
Table 14 Overall Satisfaction Ranks............................................................................................. 34
Table 15 Observer A * Observer B Comments Crosstabulation………………………………...36
viii
LIST OF FIGURES
Figure 1. Relationship of lift to AOA. ......................................................................................... 11
Figure 2. The three AOA indictors preselected by the flight department for the proposed study.
vertical bar, horizontal, bar, and legacy indicators. ...................................................................... 21
Figure 3. Interrater agreement by indicator type separated by type of comment. ........................ 37
Figure 4. Interrater agreement on the instrument location in the cockpit by indicator. ................ 38
Figure 5. Location of the AOA indicators in relation to the airspeed tape on the G1000 and
standalone airspeed indicator. ....................................................................................................... 44

1
Introduction
Angle of attack (AOA) is an important concept used to understand basic aerodynamics
principles in aviation, as well as to understand some aspects of an aircraft’s performance
capabilities (Boeing, 2000). Angle of attack, in its simplest form, could be defined as the angle at
which the aircraft’s wing chord lines meet the relative wind (the direction of the airflow with
respect to the airfoil) (Flach, Patrick, Amelink, & Mulder, 2003; Federal Aviation
Administration, 2008). In most military and commercial aircraft, there is either a dedicated
instrument that shows AOA, or a warning stall system that, even though it does not explicitly
depict AOA information, uses this aeronautical concept to warn pilots of a potential stall. In
general aviation (GA) the use of AOA indicators is almost nonexistent and most GA aircraft lack
such an indicator. Even though the concept of angle of attack has been around since the first
years of aviation (Langewiesche & Collins, 1972; Aarons, 2006), and is currently widely used by
military pilots, especially naval aviators (Boeing, 2000; Dunn, 2011; Aarons, 2006), its
importance among commercial and general aviation pilots has been undervalued or simply
ignored due to the lack of knowledge and/or training on the value of the information a dedicated
AOA indicator can provide to airmen (Aarons, 2006; Flach et al., 2003). One of the reasons why
many pilots do not value angle of attack is because, even though at some point during their flying
career they have been exposed to this concept and its relation to the lift curves, AOA is usually
displaced by the airspeed as a primary indicator of performance (Aarons, 2006). Flach et al.
(2003) mentioned that during a landing simulation task, experienced pilots seemed to be more
interested in final approach speeds rather than angle of attack. Pilots are trained to use airspeed
as a source of performance data, and when airspeed is available to the pilot, AOA should only be
used as a supplementary or advisory source, but never as a primary source of performance data

2
(Aarons, 2006, Boeing, 2000). Even though airspeed is used as a primary source of information
for pilots to measure the aircraft’s capabilities, it is important to note that “a stall can occur at
any airspeed, in any attitude, at any power setting” (FAA, 2000, p.1); the FAA’s Supplement # 1
to the upset recovery training aid (2008) mentions that even though an airplane is in a descending
pattern with ample airspeed, the wing surface could potentially stall if the AOA is greater than
the stall angle for the wing setting. A fully integrated AOA indicator can warn pilots of a
potential stall regardless of the aircraft’s airspeed, attitude, and power setting (Dunn, 2011). It is
important to note that even though an AOA indicator may be useful at different flight stages, it is
most valuable during those stages in which the aircraft is at an airspeed and at an angle of attack
close to stall (e.g. during final approach, go around maneuvers, and take off) (Hoadley &
Vanderbok, 1987; Boeing, 2000; Dunn, 2011, Federal Aviation Administration, 2000). Despite
the importance that the aviation community has given to airspeed over AOA, the Federal
Aviation Administration (FAA) has stressed; a) that it is important to train GA pilots on the
concept of AOA and its potential benefit in understanding aircraft performance capabilities, and
b) the importance to manufacture AOA indicators that can be afforded by the GA community
(FAA, 2012). This new interest in training pilots on the use of dedicated angle of attack
indicators and making these instruments easily available to them is due to the fact that at least
40% of the accidents in GA between 2001 and 2010 were related to loss of control-in flight
(LOC-I) (FAA, 2012). LOC-I is defined as “an extreme manifestation of a deviation from
intended flightpath,” including stalls and spins (International Civil Aviation Organization
(ICAO), 2013, p. 13). For this reason, the FAA’s general aviation steering committee (2012)
recommended that in order to reduce the risk of potential stalls resulting in LOC-I related
accidents, the general aviation community should install and use AOA systems to aid pilots to
3
identify aircraft stall margins. In the commercial aviation community, LOC-I is a serious concern
as well. Boeing (2011) reported that during the time period covering the years 2001 through
2010, twenty commercial jet flight accidents were related to LOC-I (accounting for 23% of all
commercial jet accidents worldwide during this time period). Jacobson (2010) pointed out that
LOC-I accidents have generated attention in the aviation community, not only because of the
high number of accidents, but also because of the high number of fatalities they produce; the
author also reported that “more than half of LOC-I events result in an accident and more than
half of those accidents are fatal” (p.7). A review of the reports involving LOC-I accidents during
the period 1987-2009 conducted by Ancel and Shih (2012) revealed that over 10% of accidents
in the U.S. were LOC-I related, which, at the same time, produced more than 50% of the
fatalities in commercial airline accidents. The analysis of the accident data revealed that around
20% percent of these accidents were due to flight crew errors. Boeing (2011) reported that LOC-
I related accidents ranked as the principal contributor of fatalities in accidents involving
commercial jets (1,841 [or 36.78%] out of 5,005 fatalities worldwide). On a report created for
the National Aeronautics and Space Administration (NASA), Jacobson (2010) reported that 81%
of commercial aircraft accidents that were categorized as LOC-I, occurred during flight stages in
which the aircraft was fairly close to the ground where chances to react are limited due to the
aircraft’s low altitude. This same report also mentioned that aerodynamic stalls are a significant
contributor to LOC-I related accidents.
As it was mentioned before, several organizations, including the FAA, have stressed the
importance of training pilots on procedures that help to minimize the conditions that could result
in a loss of control in flight situations. For this purpose, some of the mitigation options they
suggest include the installation of safety devices that can detect unsafe conditions and warn

4
pilots of the presence of such hazards (e.g. AOA based systems); training pilots on how to deter,
detect, and react to hazardous conditions that could trigger a LOC-I situation (e.g. reaching stall
margins); and the implementation of standardized safety procedures to be applied during
emergency situations (FAA, 2000; Jacobson, 2010). The FAA (2000) stressed on the importance
of flight instructors being capable of giving stall training to future pilots. At the same time, the
FAA warned that a stall cannot be avoided unless the aircraft’s AOA is reduced. For this reason,
a dedicated instrument that can inform pilots of the aircraft’s current AOA and how close the
aircraft is from stalling should be considered of great importance. Due to the benefits that an
understanding of angle of attack has on avoiding LOC-I incidents and accidents, exposing
student pilots (SP) to the AOA concept and making it a meaningful aspect of their training
should be considered a top priority. Embry-Riddle Aeronautical University (ERAU), as a leader
in aviation, has decided to install AOA indicators in the cockpit of its Cessna 172 Skyhawk
(172S) fleet to help students better understand AOA from an applied and more practical
perspective. Teaching ERAU student pilots this important concept could have a direct impact on
the improvement of air safety, as ERAU student pilots will be future commercial pilots and/or
flight instructors, and the knowledge they acquire during their training can be later passed on to
other future pilots.
The importance of introducing SPs to the AOA concept in order to increase flight safety
has been discussed in this paper. Another fundamental aspect is the design of the AOA indicator
chosen to teach SPs. It is important that the instrument used to teach and get SPs familiarized
with AOA comply with certain design characteristics. Wickens, Lee, Liu, and Gordon-Becker
(2004), discussed the importance of visual displays and their characteristics. One of the
important features that would make a display user friendly includes the discriminability of the

5
elements presented by the display; in the case of AOA indicators, it is important that an indicator
clearly informs the pilot when the aircraft is in a high, low, or optimum AOA. Another important
characteristic includes the principle of the moving part or the dynamics of the information
presented by the display, which means that those moving elements presented on the display
match the mental model and expectations of the user (Roscoe, 1968). In this particular case, it is
important that the information presented by the AOA indicator matches the pilot’s expectations,
helping them to react in a proper way and in a timely manner to the information provided by the
instrument.
As it was previously stated, the flight department at ERAU decided to install AOA
indicators in order to better train its SPs. The flight department preselected three different types
of AOA indicators. In essence, they all provide the same information, but the way the
information is presented to the pilot differs (vertically vs. horizontally, many round lights vs. few
lights and different symbols). The department needed to select one of these three indicators in
order to be installed in its fleet of Cessna 172S. The flight department was interested in knowing
which indicator was the best option to train ERAU’s SPs. The current investigation evaluated the
differences of these three types of AOA indicators. In essence, this was an applied usability
study in which subjective measures were used to assess the differences between the three AOA
indicators that were pre-selected by the Flight Department and their usefulness as a teaching tool.
The final purpose of the study was to determine which indicator could most benefit the training
of ERAU’s student pilots regarding the importance of AOA and its relationship to the lift curves.
The three AOA indictors were manufactured by Alpha Systems, Inc. The first indicator is
a vertical bar indicator, the second is a horizontal bar indicator, and the last one is a Legacy
indicator (which is also a type of vertical indicator). Some important differences exist in the way
6
the information is presented to pilots. The differences between these indicators will be explained
in more detail in the methods section of this paper. It is important to note that the preselected
indicators were not fully integrated into the aircrafts’ systems. This means that the indicators
were not able to recognize different trim configurations during different flight stages. Therefore,
the instruments were calibrated to a specific configuration. Specifically, the pilots had to learn
and memorize different light combinations presented by the AOA indicators according to
different trim configurations of the aircraft in order to identify the proper AOA for any given
maneuver.
Significance of the Study
Since the university’s flight department decided to install AOA indicators in the Cessna
172S fleet, the present study will have a direct impact on the university’s flying community.
Making sure that the proper AOA indicator was selected could greatly benefit both safety and
training for the university’s SPs. A better training will translate to the pilots’ future professional
career, enhancing air safety in general by producing better qualified pilots and instructor pilots
(IPs) capable of making better informed decisions while inflight situations required them to react
to unexpected conditions. The study asked the opinion of IPs to determine which instrument they
considered was the best option to help train their student pilots. The study also asked them about
different possibilities for instrument placement inside the cockpit.
Statement of the Problem
The flight department decided to install AOA indicators in their fleet of Cessna 172S. In
order to determine which indicator was the most adequate option, the human factors department
was asked to conduct a usability study using instructor pilots to test the instruments in a series of
7
inflight maneuvers and provide feedback about each indicator. By the end of the study, the flight
department was expecting to have enough data in order to decide which indicator was the most
suitable for SP training.
Purpose Statement
The purpose of the present study was to help the university’s flight department to make
an informed decision about the most suitable AOA indicator to install in their fleet of planes used
to train SPs. This was a usability study in which subjective measures were used to determine
which indicator IPs consider to be the most suitable for SP training. At the same time, the study
tried to determine the best location for the AOA indicator inside the cockpit.
Hypotheses
For this study there were three basic hypotheses that were developed and tested during
the experiment, these statements are related to pilot’s preferences:
: There is a significant difference between the indicator that presents AOA information in a
horizontal fashion and indicators that present AOA in a vertical fashion.
: There is a significant difference between the vertical bar indicator and the Legacy
indicator.
: The current location where the AOA indicator is placed (to the left of the magnetic
compass on the dashboard) will be disliked by IPs.
8
Limitations and Assumptions
There were several limitations to the proposed study. The researchers had no control over
the type of AOA indicators that were preselected by the flight department, these indicators were
preselected by the university’s flight department alone without previous consultation with the
investigators. The flight department provided all participants for the study, thus the investigators
were unable to randomly select from the instructor pilot pool.
Definition of Terms
Angle of Attack Angle at which the aircraft’s wing chord line of the wing
meets the relative wind (FAA, 2000, p.1).
Chord line A straight line drawn through the profile of the wing
connecting the extremities of the leading edge and trailing
edge (FAA, 2000, p.1).
Loss of Control Inflight An extreme manifestation of a deviation from intended
flightpath (ICAO, 2013, p. 13).
Relative Wind The direction of the airflow with respect to the airfoil.
Spin A controlled or uncontrolled maneuver in which the aircraft
descends in a helical path while flying at an angle of attack
greater than the critical AOA (FAA, 2000, p.5).
Stall A loss of lift and increase in drag that occurs when an
aircraft is flown at an angle of attack greater than the angle
for maximum lift (FAA, 2000, p. 1).

9
Trim/Configuration Refers to employing adjustable aerodynamic devices on the
aircraft to adjust forces so the pilot does not have to
manually hold pressure on the controls (FAA, 2008, p. 2-
8).
List of Acronyms
ADI Attitude Display Indicator
AOA Angle of Attack
ERAU Embry-Riddle Aeronautical University
GA General Aviation
FAA Federal Aviation Administration
HUD Heads Up Display
ICAO International Civil Aviation Organization
IP Instructor Pilot
LOC-I Loss of Control-in Flight
MCA Minimum Controllable Airspeed
NASA National Aeronautics and Space Administration
SME Subject Matter Expert
SP Student Pilot
10
SUS System Usability Scale
Review of the Relevant Literature
Angle of attack
A general explanation of AOA and its importance in aviation safety was presented in the
introduction of the study. In this section, a more detailed description of the concept will be
provided in order to create a better understanding of the principles governing angle of attack and
how it relates to aircraft performance. The reason why AOA is an important concept to
understand aircraft’s performance is related to lift. In other words, the AOA should be high
enough to let airflow over and under the wing in order to produce lift. As the wing’s AOA
increases, the pressure difference between the upper and lower sections of the wing will be
higher (FAA, 2012; Sadraey, 2013). If the AOA is too high, a separation of airflow from the
wing is produced; this separation of airflow causes the wing to stall (FAA, 2000). If the AOA is
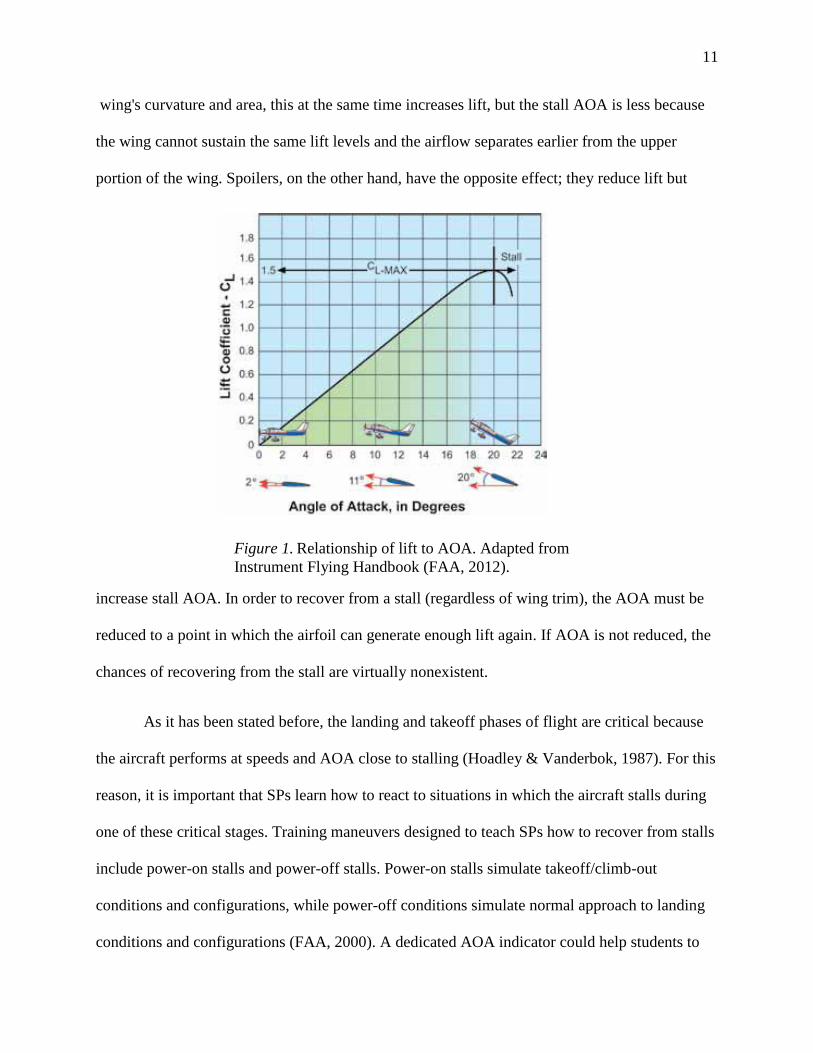
not reduced, the stall could develop into a spin. Figure 1 depicts the relationship between AOA
and lift at a constant speed. As it can be seen, lift increases as the angle of attack increases to
approximately twenty degrees; any angle higher than that will cause the airfoil, or part of it, to
stall. Sadraey (2013) explained that most airfoils stall at angles between twelve to sixteen
degrees. Stall angles are influenced by different factors such as type of wing, configuration, and
contamination of the airfoil (e.g. ice buildup). It is important to note that even though wing type
and contamination are important factors that influence AOA stall margins, it is wing
configuration that is of the most interest for the present study. Boeing (2000) mentioned that lift
and stall margins change as the airfoil configuration changes. For instance, the position of flaps
and spoilers affect the angle at which the airfoil stalls. When flaps are extended, they increase the
11
wing's curvature and area, this at the same time increases lift, but the stall AOA is less because
the wing cannot sustain the same lift levels and the airflow separates earlier from the upper
portion of the wing. Spoilers, on the other hand, have the opposite effect; they reduce lift but
increase stall AOA. In order to recover from a stall (regardless of wing trim), the AOA must be
reduced to a point in which the airfoil can generate enough lift again. If AOA is not reduced, the
chances of recovering from the stall are virtually nonexistent.
As it has been stated before, the landing and takeoff phases of flight are critical because
the aircraft performs at speeds and AOA close to stalling (Hoadley & Vanderbok, 1987). For this
reason, it is important that SPs learn how to react to situations in which the aircraft stalls during
one of these critical stages. Training maneuvers designed to teach SPs how to recover from stalls
include power-on stalls and power-off stalls. Power-on stalls simulate takeoff/climb-out
conditions and configurations, while power-off conditions simulate normal approach to landing
conditions and configurations (FAA, 2000). A dedicated AOA indicator could help students to
Figure 1. Relationship of lift to AOA. Adapted from
Instrument Flying Handbook (FAA, 2012).

12
better understand AOA and stall margins. At the same time AOA indicators can aid pilots to
better understand the aircraft’s performance capabilities, regardless of airspeed, trim, and load
factors (Alpha Systems, 2010). Angle of attack indicators should comply with a number of
characteristics that facilitate both the learning process and the integration of the instrument with
the overarching system. In other words, the selected AOA indicator should be usable.
Usability
It is important to understand that the tools with which humans interact should not only be
functional, but also usable. Usability can be defined as the degree to which a system is easy to
use by the intended operator, or how user friendly such a system is (Wickens et al., 2004).
Usability studies focus on the assessment of the difficulties that users encounter when interacting
with products in applied settings. At the same time, usability studies also try to find ways to
improve the manner users interact with products (Chamorro-Koc, Popovic & Emmison, 2009).
Usability studies are of great interest because it is essential to understand the interaction between
humans and systems (Ziegler & Kortum, 2012). This is very important in aviation because the
use of poorly designed devices at the usability level is more hazardous, since pilots depend on
avionics to fly their aircraft in a safe manner (Hamblin, Miller & Naidu, 2006). It is important
that aviation information systems not only comply with regulations, but also provide reliable
information in a user-friendly manner (Schvaneveldt, Beringer & Leard, 2003). Another reason
why the use of user-friendly avionics is important is because the operation of an aircraft is a
complex task that requires the pilot to distribute its attention to different sub-tasks, such as
communication, monitoring of systems, and of course, operation of the aircraft. In the specific
case of AOA indicators, it is important that such a device not only presents the information in an

13
accurate fashion, but also does it in a way that aids pilots to react to the information depicted by
the indicator in a timely manner using as few cognitive resources as possible (Zhang, 1997).
In visual displays such as AOA indicators, certain characteristics should be taken into
consideration when evaluating the usability aspects of the device. Wickens et al. (2004)
discussed the characteristics that an optimally designed visual display should have; they
presented these characteristics as principles of usability design. Some of these principles include
legibility: the consideration of features such as contrast, illumination, and visual angle at which
the display is located from the operator’s line of sight. Redundancy: a good display should be
able to express the information more than once, redundant information is better when different
sources are used to get the operator’s attention (i.e. combination of visual and aural sources of
information). Discriminability: the information presented by the display should be clearly
discernible from the information presented on other displays, for instance the elements used for
any given display should be clearly differentiable from the elements used for other displays in
order to eliminate confusion. Pictorial realism: a display ideally should look like the variable it
represents. Congruency of dynamic information (principle of the moving part): this principle
refers to the need of having elements in the display that moves in accordance with the direction
that is compatible with the mental models and expectations of the user. Elicitation of top-down
processes: refers to the importance of a display to provide information that is in synchrony with
the expectations of the operator. Minimization of information access costs: refers to the
importance of having displays that aid the pilot in processing and integrating information from
multiple displays in a way that helps the user to move selective attention when the task demands
him/her to do so. Consistency: this principle refers to a display providing reliable information in
a constant format whenever the information is transmitted to the operator. Predictive aiding: the

14
need to design displays that can effectively predict what is going to happen and that can transmit
this information to the user, prediction is important because it can support performance while
replacing cognitive resources with pure perception. Wickens et al. (2004) also emphasized the
importance of replacing memory with visual aids. In the case of AOA indicators, the system
should reduce the need for the pilot to memorize important information critical for the operation
of the aircraft. This is a critical point because, as it has been mentioned before, the operation of
an aircraft is a demanding complex task. Consequently, displays that work as memory aids help
to reduce the number of cognitive resources used by the pilot allowing for safer and more
efficient flight.
Besides the principles explained above, there are some other characteristics that are
important to take into consideration in the design of usable visual displays. It is clear that poorly
designed systems are deployed every day. Time after time, we see the outcome of using systems
that are poorly designed and possess low levels of usability. These poorly designed and unusable
systems are difficult to operate, and users tend to have a difficult time trying to figure out how to
use these complicated systems. Training users/operators on how to use systems low in usability
tend to be complicated, expensive and sometimes futile. As a consequence of a poor design and
low levels of usability, the system will more likely be misused or disused, forcing users to keep
their current working methods (Maguire, 2001; Chamorro-Koc et al., 2009). Maguire (2001)
discussed the benefits of designing usable systems. The first benefit is increased productivity: a
user friendly system allows users to concentrate in the task rather than figuring out how to
operate the system. The second benefit is error reduction: eliminating inconsistencies,
ambiguities, and other design faults will effectively reduce human error due to poorly designed
systems. The third benefit is the reduction of training and support needed to generate adequate
15
performance levels, as a usable system is capable of reinforcing learning and reducing the time
needed to train people on how to operate and effectively interact with a tool or system. The final
benefit is improved acceptance: users will be more likely to use and trust a system that presents
information in a format that is easy to understand and that supports the user’s mental models.
Trust is an important feature of a usable system. Lee and Nass (2010) explained that trust in
relation to technological systems can be defined as the level of confidence the operator has in the
system, particularly when the achievement of a goal in an uncertain situation is necessary.
Acemyan and Kortum (2012) discussed the relationship between usability and trust. They
explained that lack of trust in a system causes significant problems for the system’s user,
especially when a system is designed to support the user’s decision-making process. When a
system is not trusted, the operator may refuse to use it and instead, it will find different sources
to achieve a goal. In this aspect, Acemyan and Kortum pointed out that if an operator does not
trust a system, the user may take three different approaches. The first one is avoiding the system,
the second one is limiting the interaction with the system, and the third one is using the system
until a better system is provided. At the same time, if a system is perceived as reliable, the
operator will trust it, depend on it, and use it frequently. In the study conducted by Acemyan and
Kortum on trust and the usability of technological systems, participants had to rate their level of
trust and perceived usability on popular systems such as ATMs, DVRs, GPS devices, and
software systems such as Microsoft Office. Results of the study showed a linear correlation
between usability and trust. Higher scores of perceived usability of the system translated into
higher levels of trust. This relationship is even stronger when the user is given no choice and is
required to use a specific system. This is an important finding because there are many
circumstances in which operators have no choice but to interact with the tools that have been
16
provided to them to execute a task. This is exactly the case in flying an aircraft. Pilots usually
don’t have the option to pick among a selection of gauges, controls, and displays. They need to
use the system that is installed in the aircraft’s cockpit. The goal should be to design and install
instruments that pilots can perceive as usable, in order to increase their level of trust in the
systems and subsystems provided to them to operate an aircraft.
It was discussed earlier in this section how a visual display should match the mental
models of the operator in order to enhance performance. Tlauka (2004) explained that the visual
relationship between displays and controls should be considered in their spatial functional
relationship and that a compatible display-control arrangement could enhance performance and
increase user satisfaction. In other words, a display should aid operators to enhance their ability
to respond to a stimulus, reducing the stimulus-response time by being in accordance with the
controls needed to perform the task. This is an important aspect in aviation, especially when it
comes to displays that show information relevant to AOA. When an airfoil is close to stalling,
the display will warn the pilot that the airplane is about to or that it is already stalling. The only
way to recover the aircraft from a stall is by reducing the AOA. If the airfoil has already stalled,
a reduction in the AOA will necessarily translate into a loss of altitude (FAA, 2000). An
adequate stimulus response time in a stall situation is critical, especially when the aircraft is in
close proximity to the ground where any loss of altitude can be hazardous. In the implementation
of an AOA indicator for the school’s fleet, it was important that the chosen instrument was an
AOA indicator that not only would help pilots to react faster, but that would also indicate in
which direction the controls should be applied. It is not sufficient that the display warns the pilot
of a potential stall; a usable display should aid the pilot to apply controls in an effective manner
while lowering the usage of cognitive resources. Korblum, Hasbroucq, and Osman (1990)

17
proposed what they called a dimensional overlap model. This model claims that when a
stimulus-response ensemble shares a number of characteristics, the stimulus will activate an
automatic response thanks to the features shared by both the stimulus set and the response set,
thus reducing not only reaction times, but also increasing the probabilities of a correct response.
When the stimulus sets and the response sets do not share characteristics, response times may be
slower and error prone. In a series of experiments performed by Eimer (1995), it was found that
participants’ reaction times when a cue (arrow) indicating in which direction a target letter would
appear on a computer screen were faster compared to situations in which the cue alerted the
participant of the appearance of the target letter but not of its potential location on the screen.
These series of experiments indicated that cues that effectively alerted the participant of the
direction in which the letter would appear on the screen, elicited automatic responses. These
findings were in accordance with Korblum et al.’s (1990) dimensional overlap model. In a
different study conducted by McDougall, Curry, and Brujin (2001), participants were presented
with a series of problem-solving tasks. To solve the problems participants had to resort to a
series of functions. These functions were represented by a series of icons. Participants were
exposed to one of three different types of icons: the first set presented icons that depicted
concrete information, the second one presented abstract information, and the last set used
arbitrary information that was not connected with the functionality of the icons. Results of the
study showed that performance was best for those who used concrete icons, followed by those
who used abstract icons. Nevertheless, as the number of trials increased, the significant
performance differences between the three sets of icons disappeared. Even though this study
reveals that performance is influenced by the level of exposure to the icon set, this study does not
show how performance is affected by a secondary task and how concreteness may or may not aid

18
operators in decision making. However, the authors of the study suggested that concrete icons
are more useful when an immediate understanding of the icon is necessary, such as in emergency
situations. A different study by Geiselman and Osgood (1992) in which non-pilot participants
were exposed to three different types of attitude display indicators (ADI), showed that those
participants who were exposed to attitude displays that showed concrete information needed
significantly less numbers of trials to reach acceptable performance levels than those exposed to
a heads up display (HUD) that showed attitude information in an abstract manner.
It is important to understand that AOA indicators are not considered primary sources of
information regarding aircraft performance, even though such an indicator can increase safety.
There are many different instruments and cues outside the cockpit that provide information to
pilots to notify them on the current operational condition of the aircraft. In this sense, pilots need
to distribute their attention to all different kind of cues in the environment. Zhang (1997) referred
to distributed cognitive tasks, such as flying an aircraft, as a task that requires operators to
process the information coming from the external environment and integrate it with information
retrieved from internal interpretations in a dynamic manner. In this sense, Zhang argued that
external representations are picked up through perceptual processes, while internal
representations come from cognitive processes that involve schemas, mental images, and neural
networks. To perform distributed cognitive tasks, it is necessary that the information from
internal and external representations are integrated and exchanged, not only in a dynamic manner
but in an integrative way. In this aspect, it is important to understand that visual displays for
complex tasks should allow operators to switch between focused attention and divided attention
whenever needed. Parasuraman and Davies (1984) discussed the importance that these two types
of attention have on performance. While focused attention allows operators to fixate and process
19
certain characteristics of a display, divided attention allows operators to integrate the information
perceived from different sources. The goal with divided attention and complex tasks in properly
designed displays is to create subsystems (individual displays) that allow operators to integrate
these sources of information while maintaining efficient levels of performance (Parasuraman &
Davies, 1984; Zhang, 1997; Tlauka, 2004). Bennet and Flach (1992) explained that in integrated
tasks, attention must be distributed among different information sources that need to be
considered in order to reach a decision. It is important then that when designing displays not only
the type of information transmitted to the operator should be considered, but also how this
information will be presented. Woods (1991) discussed the importance of designing not only for
data availability but also designing for information extraction. Systems that have been designed
only considering data availability usually force the operator to maintain the data in the memory,
while, at the same time, forcing them to retrieve information from long term memory, causing an
exhaustion of limited cognitive resources. Thus, displays that replace memory with perception
are considered to improve performance because they do not use the cognitive resources involved
in information processing (Bennett & Flach, 1992). As stated by Hall, Shattuck and Bennett
(2012), “The ultimate goal is to design interfaces that (a) are tailored to specific work demands,
(b) leverage the powerful perception-action skills of the human, and (c) use powerful interface
technologies wisely.” (p. 166). Thus, an AOA indicator that facilitates the crosscheck of
instruments should be considered of high importance. It has been argued that introducing new
instruments in the cockpit only adds to the already high workload experienced by pilots while
operating an aircraft. However, a dedicated AOA indicator that complies with good usability
characteristics can increase a pilot’s awareness of an aircraft’s performance at any given point,
20
without interfering with the continuous and dynamic examination of other instruments inside the
cockpit.
Methods
This was a usability study that employed subjective measures to ask participants about
their opinion on the three different AOA indicators that were preselected by the flight
department. By the end of the study, the experimenters expected to have enough information to
aid the flight department to choose one of the three instruments. The experiment was conducted
in the operational environment in which pilots perform their work on a daily basis. Proper steps
were taken to avoid biases by both the experimenter and the participants.
Research Approach
This was a within subjects experimental study in which participants were exposed to
three different types of AOA indicators. Participants were asked to fill out a number of surveys
and provide feedback on each of the AOA instruments they had used during the experiment.
Sample
Ten instructor pilots (IP) (9 male and 1 female) that worked at ERAU participated in the
study, the average age of the participants was 22.3 (SD = 3.2). The average total number of hours
as pilots for the participants was 424 (SD = 111.3), the average experience as IPs in hours was
141.5 (SD = 120.7). None of the participants had experience as military pilots, and none of the
participants had previous practical experience with AOA indicators. These participants were
selected by the flight department. The experimenter was subject to work with IPs selected by the
flight department at ERAU. Participants were compensated at the same rate they usually are
when they work for the university as IPs.
21
Apparatus and Materials
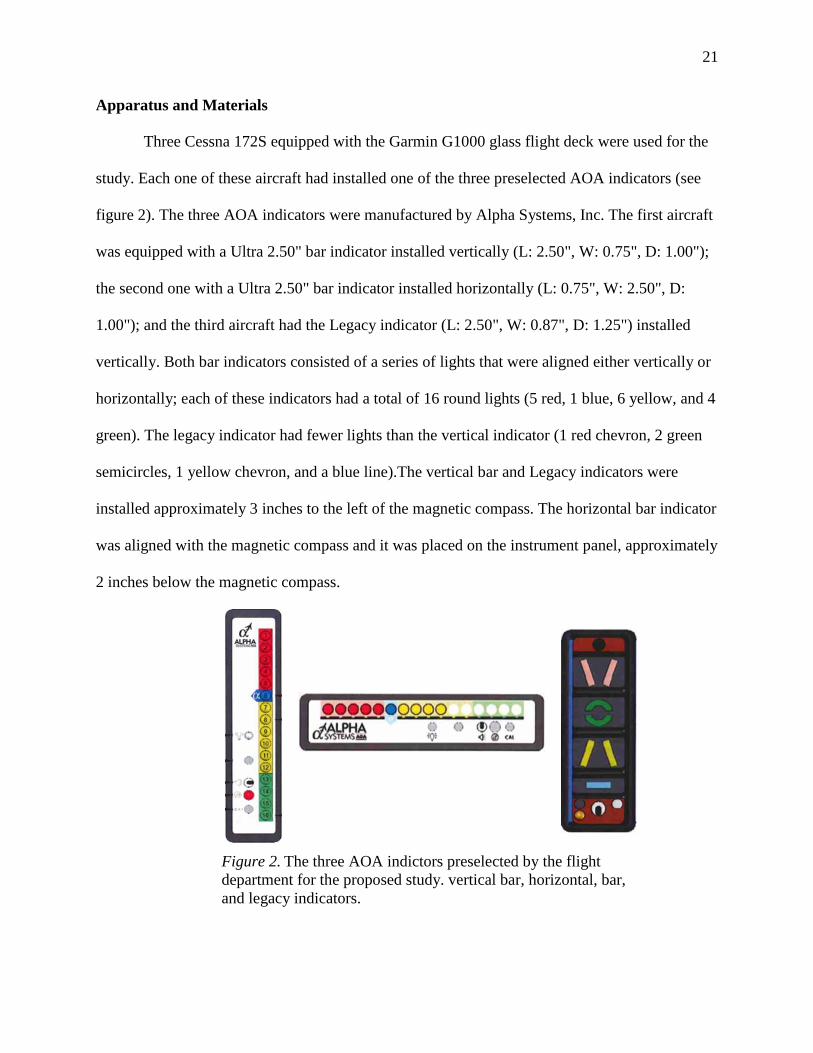
Three Cessna 172S equipped with the Garmin G1000 glass flight deck were used for the
study. Each one of these aircraft had installed one of the three preselected AOA indicators (see
figure 2). The three AOA indicators were manufactured by Alpha Systems, Inc. The first aircraft
was equipped with a Ultra 2.50" bar indicator installed vertically (L: 2.50", W: 0.75", D: 1.00");
the second one with a Ultra 2.50" bar indicator installed horizontally (L: 0.75", W: 2.50", D:
1.00"); and the third aircraft had the Legacy indicator (L: 2.50", W: 0.87", D: 1.25") installed
vertically. Both bar indicators consisted of a series of lights that were aligned either vertically or
horizontally; each of these indicators had a total of 16 round lights (5 red, 1 blue, 6 yellow, and 4
green). The legacy indicator had fewer lights than the vertical indicator (1 red chevron, 2 green
semicircles, 1 yellow chevron, and a blue line).The vertical bar and Legacy indicators were
installed approximately 3 inches to the left of the magnetic compass. The horizontal bar indicator
was aligned with the magnetic compass and it was placed on the instrument panel, approximately
2 inches below the magnetic compass.
Figure 2. The three AOA indictors preselected by the flight
department for the proposed study. vertical bar, horizontal, bar,
and legacy indicators.

22
Some differences exist in the way these indicators displayed information about AOA. For
instance, during slow flight and landing flare, the bar indicators (both horizontal and vertical)
showed all red lights plus the blue light on. On the other hand, the Legacy indicator showed the
complete green doughnut. For cruise climb and final approach, the bar indicators displayed all
red, one blue, and all yellow lights, while the Legacy indicator displayed the bottom half green
doughnut and yellow chevron. During a stall warning, the bar indicators displayed all red lights,
while the Legacy indicator displayed the red chevron and the top half of the green doughnut (see
Appendix A for a complete list of indications according to the type of maneuver/flight stage).
An informed consent form (see Appendix B) was created for the study and it was
distributed to the participants before the experiment began. A pre-flight questionnaire (see
Appendix C) designed to collect demographic information, as well as previous experience using
AOA indicators, was used prior to the experimental portion of the study. In order to capture the
participants’ opinions on the usability of the AOA indicators, a post-flight questionnaire was
developed. This questionnaire included an adaptation of the Systems Usability Scale (Brooke,
1996) for the purposes of this study. A series of surveys were created in order to ask IPs their
opinions about the following topics: visual representation and location of the instrument inside
the cockpit, effect of the AOA indicator in performing maneuvers, and advantage of the
instrument for pilot training (see Appendix D).
Design and Procedures
This was a within subjects study. Each participant was exposed to all three AOA
indicators. In order to reduce learning bias and carryover effects, the presentation of the
instruments was counterbalanced.

23
The study was divided into four different sessions and the study had an approximate
duration of two weeks. The first portion was an informative/training session. Participants were
scheduled to appear at the flight department in order to be briefed on the purpose of the study. At
this point participants filled out and signed the informed consent (Appendix B), a copy of the
informed consent was provided to participants for their records. After the briefing, participants
filled out the first portion of the pre-flight questionnaire (Appendix C). After participants
answered questions about demographics and previous experience with AOA indicators, they
received a one hour training session. The training consisted of a brief explanation of the AOA
concept and an introduction to the functions embedded in the indicator (such as buttons and
dials). Participants were provided with a copy of the approximate indications form, which told
pilots what information the instrument would show on each of the flight maneuver they would be
performing during the experimental portion of the study (see Appendix A). The training session
and all the training material was designed and provided by the flight department. At the end of
the training session, participants were encouraged to ask any questions regarding the instruments
or what to expect while using the indicators during the experimental flights. After the training
session, participants filled out the portion of the pre-flight questionnaire to rate the effectiveness
of the training received. After questions were answered, the pre-flight questionnaires were
collected and participants were told that they would receive a flight schedule via e-mail during
the following days in order to begin the three experimental flights.
In the first experimental session, participants received a copy of the post-flight
questionnaire that they would fill out right after the completion of the first session. Each of the
experimental sessions had an approximate duration of an hour. The flight was divided into five
different stages in which participants were to use the assigned AOA indicator to aid them in

24
performing each maneuver. The five maneuvers (stages) selected for this study were: slow flight,
power-on stall, power-off stall, normal approach and landing, and short-field approach and
landing. The reason why these five maneuvers were selected for the study is because AOA
indicators are more useful in warning pilots of possible aerodynamic stalls during the takeoff and
landing phases of flight. During takeoff and landing, the pilot needs to maneuver the aircraft
under a high AOA and low airspeeds. Slow flight is a maneuver used to show SPs the flight
characteristics and the amount of control they would have when the aircraft is at a minimum
flying speed. Power-on stall is a maneuver performed at high altitude that simulates a takeoff
using the appropriate aircraft’s trim and power conditions for this stage of flight. Power-off stall
is a maneuver performed at high altitude that simulates a landing using the aircraft’s appropriate
trim and power conditions during a landing procedure. These two maneuvers are used to train
pilots on proper stall recovering techniques. Short field approach and landing is a maneuver that
requires pilots to approach the runway at a high rate of descent while maintaining a low airspeed;
this maneuver is performed when runways are relatively short and/or an obstacle is on the final
approach path to the airstrip. After each participant completed this first flight, they filled out the
first post-flight questionnaire and they dropped it off at the office of the university’s assistant
chief flight instructor. This same procedure was used for flights two and three of the
experimental stage. After completion of the three flights, participants were thanked for their
participation in the study and were dismissed from the experiment. Participants were told that
they could contact the experimenter in case they had any questions, concerns or if they wanted to
know the results of the study.

25
Sources of the Data
The data collected during this study was of a qualitative nature; all the data was
subjective (with the exception of the demographics questionnaire). This data was divided into
two sections. First, a number of items that had been developed specifically to ask participants
about the ability of the instrument to assist them on performing the five flight maneuvers that
were selected for this experiment and how they thought the indicators could help training SPs.
These items had been developed using seven point Likert scales. An adaptation of the SUS
developed by Brooke (1996) was also used to ask pilots about their opinion on the usability of
each instrument. The second source of data was the comments pilots wrote on the survey about
their opinions on each AOA indicator.
Data Collection Device
The pre-flight questionnaire was an instrument designed for this study that collected data
about participants’ demographics, previous experience using AOA indicators, and their opinion
of the usefulness of an AOA indicator for student training. The post-flight questionnaire was
divided into two sections; an adaptation of the System Usability Scale (Brooke, 1996) and a
survey that asked participants about the usefulness of the instrument for each of the five
maneuvers. This survey also asked participants about their opinions about the chosen location of
the instrument in the cockpit and how beneficial they thought the instrument would be for SP
training.
Instrument reliability and validity.
The SUS has been used extensively to measure a wide range of products and services
including, websites, computer hardware, voice systems, mobile applications, among others
(Kortum & Bangor, 2013). According to Bangor, Kortum, and Miller (2009), the SUS has been
26
used in over 206 studies; they also mentioned that this survey is an easy and quick way to collect
usability data. At the same time, the survey has been shown to be effective in surveying
participants about the usability of a variety of technological systems. The last item of the post-
flight questionnaire was developed by Bangor, Kortum and Miller (2008) and was adapted for
this study to ask participants about their overall experience with the indicator; this is a seven
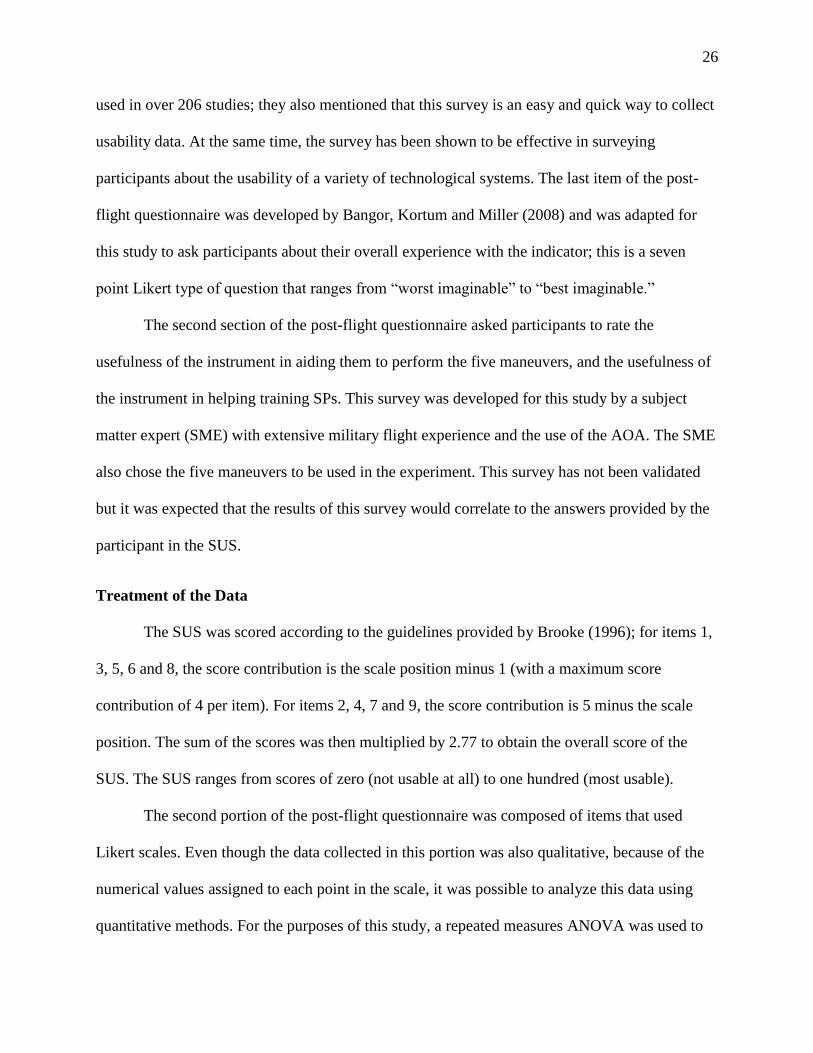
point Likert type of question that ranges from “worst imaginable” to “best imaginable.”
The second section of the post-flight questionnaire asked participants to rate the
usefulness of the instrument in aiding them to perform the five maneuvers, and the usefulness of
the instrument in helping training SPs. This survey was developed for this study by a subject
matter expert (SME) with extensive military flight experience and the use of the AOA. The SME
also chose the five maneuvers to be used in the experiment. This survey has not been validated
but it was expected that the results of this survey would correlate to the answers provided by the
participant in the SUS.
Treatment of the Data
The SUS was scored according to the guidelines provided by Brooke (1996); for items 1,
3, 5, 6 and 8, the score contribution is the scale position minus 1 (with a maximum score
contribution of 4 per item). For items 2, 4, 7 and 9, the score contribution is 5 minus the scale
position. The sum of the scores was then multiplied by 2.77 to obtain the overall score of the
SUS. The SUS ranges from scores of zero (not usable at all) to one hundred (most usable).
The second portion of the post-flight questionnaire was composed of items that used
Likert scales. Even though the data collected in this portion was also qualitative, because of the
numerical values assigned to each point in the scale, it was possible to analyze this data using
quantitative methods. For the purposes of this study, a repeated measures ANOVA was used to

27
test the experimenter’s hypotheses related to differences between the three indicators; a
Friedman’s Rank test for correlated samples was also used to analyze the data.
All comments about the indicators were coded and divided into four categories; positive,
negative, mixed, and other comments. Consideration was taken on the type of feedback provided
by each participant (positive or negative); the number of positive and negative comments for
each category was then summed up for each indicator.
Results
The different subjective scales containing Likert items were analyzed using a repeated
measures analysis of variance (ANOVA), which assumes the data is continuous and normally
distributed. Likert (1932) recommended using a parametric data analysis approach on composite
scales, he pointed out that surveys containing five point scale items or more tend to follow a
fairly normal distribution, and that the sum of the numerical scores of individual items in the
scale should be obtained for each participant before analyzing the data. The Friedman’s rank test
for correlated samples was used to analyze some individual items that were of especial interest
for the study. This technique assumes that samples are not continuous and not normally
distributed, and it can be thought of as the non-parametric alternative to the repeated measures
ANOVA. This test is normally used when analyzing individual items of a scale containing
nonparametric data, such as Likert items.
The first scale that was analyzed was the adaptation of the system usability scale (SUS)
composed of 9 Likert type items. In this scale the minimum possible score is 0 and the maximum
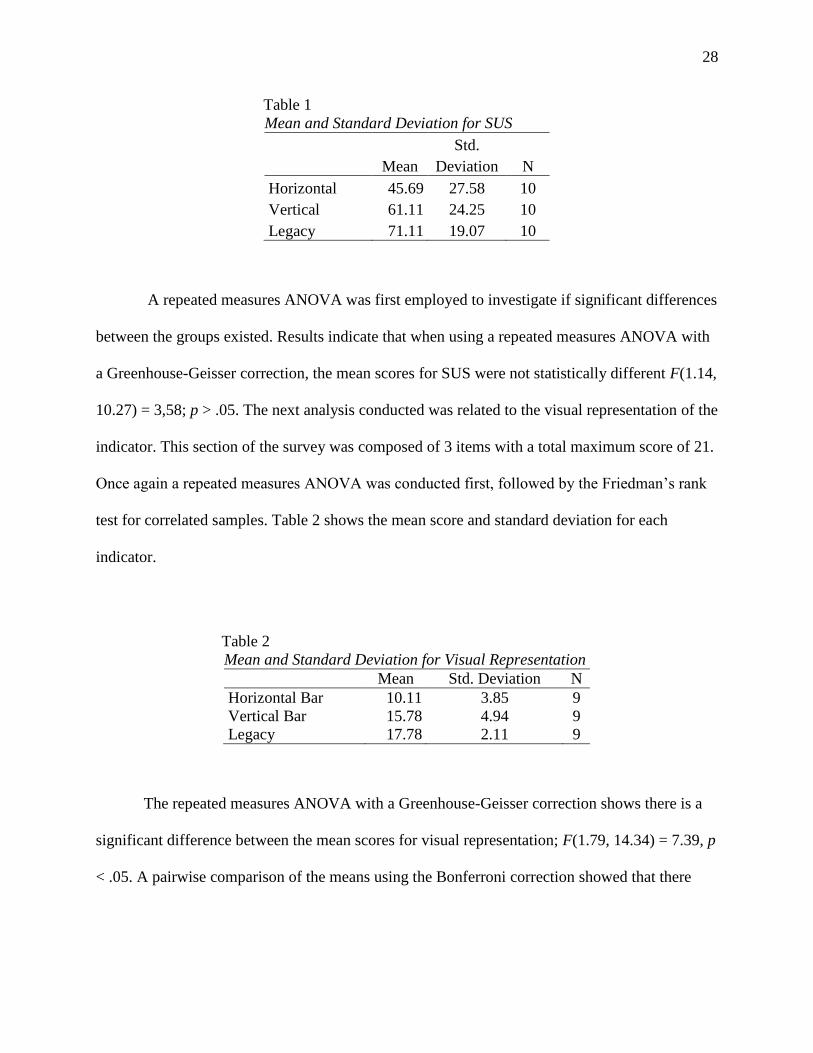
possible score is 100. Table 1 shows the mean and standard deviation for each AOA indicator.
28
Table 1
Mean and Standard Deviation for SUS
Mean
Std.
Deviation N
Horizontal 45.69 27.58 10
Vertical 61.11 24.25 10
Legacy 71.11 19.07 10
A repeated measures ANOVA was first employed to investigate if significant differences
between the groups existed. Results indicate that when using a repeated measures ANOVA with
a Greenhouse-Geisser correction, the mean scores for SUS were not statistically different F(1.14,
10.27) = 3,58; p > .05. The next analysis conducted was related to the visual representation of the
indicator. This section of the survey was composed of 3 items with a total maximum score of 21.
Once again a repeated measures ANOVA was conducted first, followed by the Friedman’s rank
test for correlated samples. Table 2 shows the mean score and standard deviation for each
indicator.
Table 2
Mean and Standard Deviation for Visual Representation
Mean Std. Deviation N
Horizontal Bar 10.11 3.85 9
Vertical Bar 15.78 4.94 9
Legacy 17.78 2.11 9
The repeated measures ANOVA with a Greenhouse-Geisser correction shows there is a
significant difference between the mean scores for visual representation; F(1.79, 14.34) = 7.39, p
< .05. A pairwise comparison of the means using the Bonferroni correction showed that there

29
was a significant difference between the horizontal bar indicator and the legacy indicator, all
other comparisons were not significant (see Table 3).
Table 3
Pairwise Comparisons for Visual Representation
Indicator Mean Difference Std. Error Sig.
Horizontal Bar Vertical Bar -5.67 2.27 .11
Legacy -7.67 1.68 .01
Vertical Bar Horizontal Bar 5.67 2.27 .11
Legacy -2.00 2.19 1.00
The section of the survey related to the indicators ability to enhancing IPs’ personal
performance was also analyzed following the procedures shown above. The maximum possible
score for this section was 35. Table 4 shows the mean and standard deviation for each indicator.
Table 4
Mean and Standard Deviation for Enhanced Performance
Mean Std. Deviation N
Horizontal Bar 17.22 7.43 9
Vertical Bar 21.22 6.26 9
Legacy 22.33 6.18 9
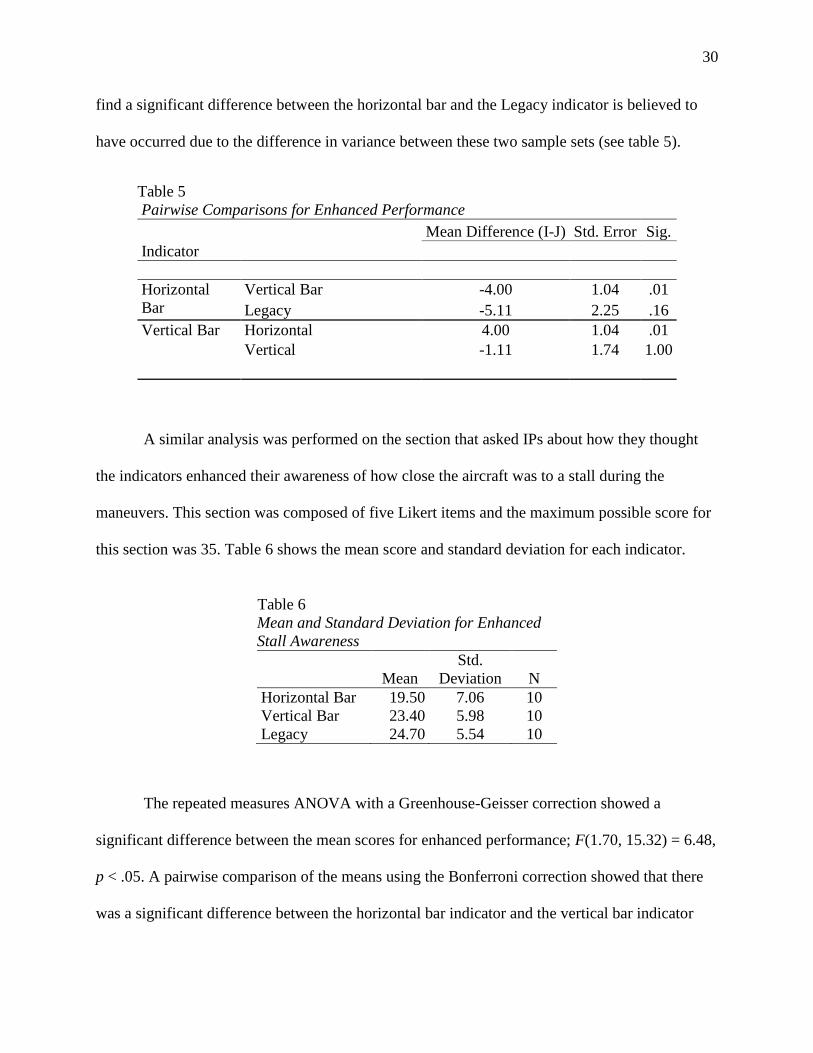
The repeated measures ANOVA with a Greenhouse-Geisser correction showed a
significant difference between the mean scores for enhanced performance; F(1.27, 10.21) = 4.73,
p < .05. A pairwise comparison of the means using the Bonferroni correction showed a
significant difference between the horizontal bar indicator and the vertical bar indicator, all other
comparisons were not significant. It is important to note that the mean difference between the
horizontal bar indicator and the Legacy indicator (not significant) is greater than the mean
difference between the horizontal bar and the vertical bar indicator (significant). This inability to
30
find a significant difference between the horizontal bar and the Legacy indicator is believed to
have occurred due to the difference in variance between these two sample sets (see table 5).
Table 5
Pairwise Comparisons for Enhanced Performance
Indicator
Mean Difference (I-J) Std. Error Sig.
Horizontal
Bar
Vertical Bar -4.00 1.04 .01
Legacy -5.11 2.25 .16
Vertical Bar Horizontal 4.00 1.04 .01
Vertical -1.11 1.74 1.00
A similar analysis was performed on the section that asked IPs about how they thought
the indicators enhanced their awareness of how close the aircraft was to a stall during the
maneuvers. This section was composed of five Likert items and the maximum possible score for
this section was 35. Table 6 shows the mean score and standard deviation for each indicator.
Table 6
Mean and Standard Deviation for Enhanced
Stall Awareness
Mean
Std.
Deviation N
Horizontal Bar 19.50 7.06 10
Vertical Bar 23.40 5.98 10
Legacy 24.70 5.54 10
The repeated measures ANOVA with a Greenhouse-Geisser correction showed a
significant difference between the mean scores for enhanced performance; F(1.70, 15.32) = 6.48,
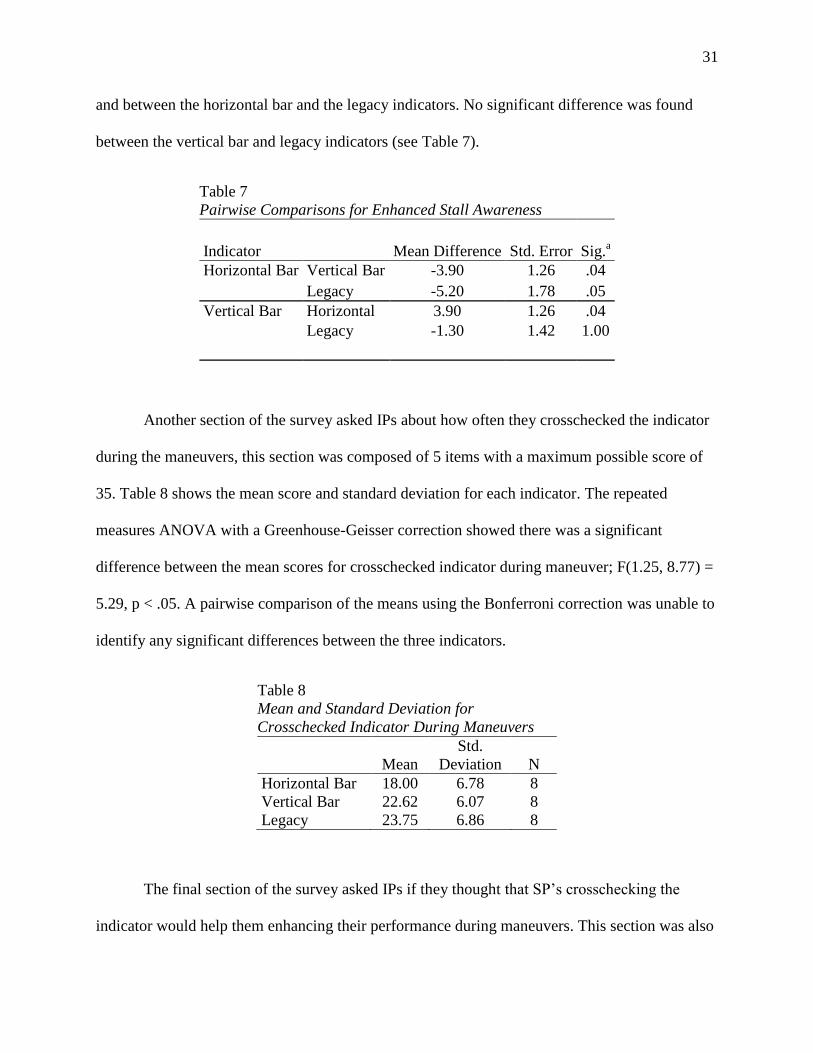
p < .05. A pairwise comparison of the means using the Bonferroni correction showed that there
was a significant difference between the horizontal bar indicator and the vertical bar indicator
31
and between the horizontal bar and the legacy indicators. No significant difference was found
between the vertical bar and legacy indicators (see Table 7).
Table 7
Pairwise Comparisons for Enhanced Stall Awareness
Indicator Mean Difference Std. Error Sig.a
Horizontal Bar Vertical Bar -3.90 1.26 .04
Legacy -5.20 1.78 .05
Vertical Bar Horizontal 3.90 1.26 .04
Legacy -1.30 1.42 1.00
Another section of the survey asked IPs about how often they crosschecked the indicator
during the maneuvers, this section was composed of 5 items with a maximum possible score of
35. Table 8 shows the mean score and standard deviation for each indicator. The repeated
measures ANOVA with a Greenhouse-Geisser correction showed there was a significant
difference between the mean scores for crosschecked indicator during maneuver; F(1.25, 8.77) =
5.29, p < .05. A pairwise comparison of the means using the Bonferroni correction was unable to
identify any significant differences between the three indicators.
Table 8
Mean and Standard Deviation for
Crosschecked Indicator During Maneuvers
Mean
Std.
Deviation N
Horizontal Bar 18.00 6.78 8
Vertical Bar 22.62 6.07 8
Legacy 23.75 6.86 8
The final section of the survey asked IPs if they thought that SP’s crosschecking the
indicator would help them enhancing their performance during maneuvers. This section was also

32
composed of five items with a maximum possible score of 35. Table 9 shows the mean score and
standard deviation for each indicator. The repeated measures ANOVA with a Greenhouse-
Geisser correction showed there was a significant difference between the mean scores for
enhanced performance; F(1.37, 10.98) = 5.29, p < .05. A pairwise comparison of the means
using the Bonferroni correction was unable to identify any significant differences between the
three indicators.
Table 9
Mean and Standard Deviation for Indicator would Enhance Students’ Performance
Mean Std. Deviation N
Horizontal Bar 18.78 8.24 9
Vertical Bar 22.56 6.17 9
Legacy 24.11 5.64 9
Five individual Likert items were also analyzed using the Friedman’s rank test for
correlated samples. The first item asked participants if crosschecking the indicator helped them
to fly a more stable approach on final during normal approach and landing. This seven point
Likert item ranged from, 1 strongly disagree, to 7 strongly agree. The Friedman’s rank test for
correlated samples showed there wasn’t a significant difference between the sample ranks; (2)
= 4.22; p > .05. Table 10 shows the mean ranks for this item.
Table 10
Ranks for Crosschecking the Indicator helped in Flying a More Stable Approach on Final
(Normal Approach and Landing)
Mean Rank
Horizontal Bar 1.56
Vertical Bar 2.06
Legacy 2.39
The second item asked participants if crosschecking the indicator helped them to fly a
more stable approach on final during short field approach and landing. This seven point Likert

33
item ranged from, 1 strongly disagree, to 7 strongly agree. The Friedman’s rank test for
correlated samples showed there wasn’t a significant difference between the sample ranks; (2)
= 2.85; p > .05. Table 11 shows the mean ranks for this item.
Table 11
Ranks for Crosschecking the Indicator helped in Flying a More Stable Approach on Final
(Short Field Approach and Landing)
Mean Rank
Horizontal Bar 1.78
Vertical Bar 1.83
Legacy 2.39
The third item asked IPs if crosschecking the indicator enhanced their landing
performance during normal approach and landing. This was also a seven point Likert item like
the ones described above. The Friedman’s rank test for correlated samples showed there was a
significant difference between the sample ranks; (2) = 11.08; p < .01. Table 12 shows the
ranks for this particular item.
Table 12
Ranks for Crosschecking Indicator Enhanced Landing Performance (Normal Approach and
Landing)
Mean
Rank
Crosschecking this Horizontal AOA indicator enhanced my landing performance
during normal approach and Landing
1.33
Crosschecking this Vertical AOA indicator enhanced my landing performance
during normal approach and landing
2.00
Crosschecking this Legacy AOA indicator enhanced my landing performance during
normal approach and landing
2.67
The fourth item asked IPs if crosschecking the indicator enhanced their landing
performance during short field approach and landing (seven point Likert item). The Friedman’s

34
rank test for correlated samples showed there was a significant difference between the sample
ranks; (2) = 8.82; p < .05. Table 13 shows the ranks for this particular item.
Table 13
Ranks for Crosschecking Indicator Enhanced Landing Performance (Short Field Approach and
Landing)
Mean
Rank
Crosschecking this horizontal AOA indicator enhanced my landing performance
during short field approach and landing
1.56
Crosschecking this Vertical AOA indicator enhanced my landing performance
during short field approach and landing
1.83
Crosschecking this Legacy AOA indicator enhanced my landing performance during
short field approach and landing
2.61
The final item asked participants about their overall satisfaction with the indicator (worst
imaginable to best imaginable) using a seven point Likert item. Friedman’s rank test showed a
significant difference between the indicators; (2) = 6.06; p < .05. Table 14 shows the ranks for
this item. Through a visual inspection of the ranks it can be concluded that there was a
significant difference between the horizontal bar and legacy indicators.
Table 14
Overall Satisfaction Ranks
Mean Rank
Horizontal Bar 1.40
Vertical Bar 2.25
Legacy 2.35
Another important aspect of the data collected during the study was the comments that
participants provided during the experimental stage of the study. As it was explained before, IPs
had the option to provide their own thoughts for each of the items on the post-flight
35
questionnaire. It is important to clarify that participants were not required to provide comments,
this was an option provided to them in case participants felt the need to support their answers
while using the Likert type items. There were a total of five hundred seventy six comments
collected during the study. There were one hundred sixty three comments about the horizontal
bar indicator, two hundred twenty one about the vertical bar indicator, and one hundred ninety
two comments for the legacy indicator. Two raters coded independently each comment into one
of four different categories; Positive, negative, mixed, and other comments. Examples of positive
comments include: “[it] would help in setting proper climb angle after recovery” or “good
location and representation, the lights are easy to understand.” Examples of negative comments
include: “hard to integrate into scan” or “the indications are not that simple. May require
frequent review for students.” Examples of mixed comments include: “I like the number of red
lights. Like counting down until stall, but so many yellow and green, too complex, sometimes all
light up during/after maneuvers which is just distracting” or “it really helped for landings, not so
much slow flight/stalls.” Examples for other comments include: “gusty crosswinds made
crosschecking hard” or “Flew slow flight at MCA [minimum controllable airspeed] and got
different indications from published. Flew at published indications and airspeed was 10 knots
above MCA [minimum controllable airspeed].” A Cohen’s Kappa was used to analyze interrater
reliability. The interrater reliability for the observers was found to be Kappa = 0.80, p < .001,
95%CI (0.759, 0.842). Table 15 shows the cross-tabulation of all the comments between
observers. This table shows the number of comments in which both observers agreed on for each

36
category, the expected value for each category (chance), and the number and type of comments
in which both raters disagreed on. The number of comments in which both raters agreed on was
then separated according to the type of indicator. Thus, for the horizontal bar indicator, both
raters agreed on 147 of the 163 comments. The comments were divided as follows; 62 positive,
60 negative, 19 mixed, and 6 other. For the vertical indicator, raters agreed on 189 of the 221
comments. The comments were divided as follows; 88 positive, 63 negative, 23 mixed, and 15
other. For the Legacy indicator, raters agreed on 164 of the 192 comments provided by the
participants. The comments were divided as follows; 94 positive, 37 negative, 17 mixed, and 16
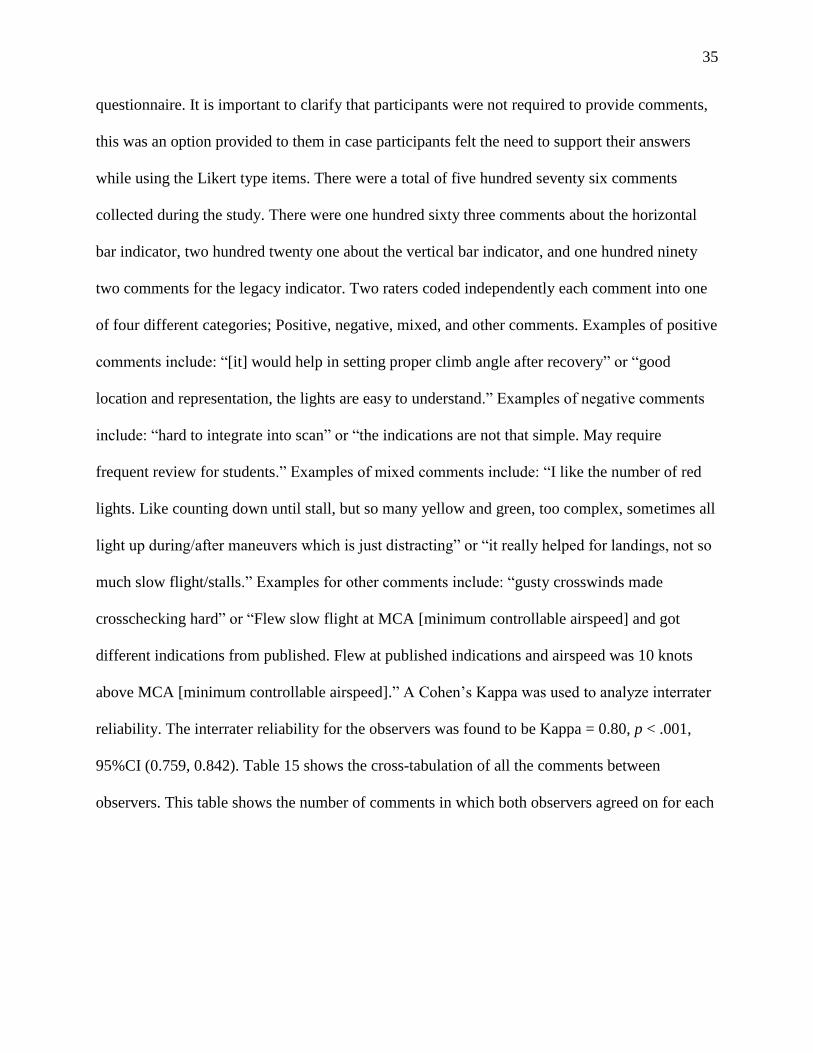
other. Figure 3 shows the interrater agreement by indicator type. As it can be seen on this figure,
the Legacy received the highest number of positive comments and the lowest number of negative
comments, followed by the vertical bar indicator. The horizontal bar indicator had the highest
number of negative comments and the lowest number of positive comments.
Table 15
Observer A * Observer B Comments Crosstabulation
Observer B
Total Positive Negative Mixed Other
Observer A Positive Count 244 5 14 8 271
Expected Count 123.3 84.7 38.1 24.9 271
Negative Count 6 160 8 3 177
Expected Count 80.5 55.3 24.9 16.3 177
Mixed Count 10 13 59 5 87
Expected Count 39.6 27.2 12.2 8.0 87
Other Count 2 2 0 37 41
Expected Count 18.6 12.8 5.8 3.8 41
Total Count 262 180 81 53 576
Expected Count 262 180 81 53 576
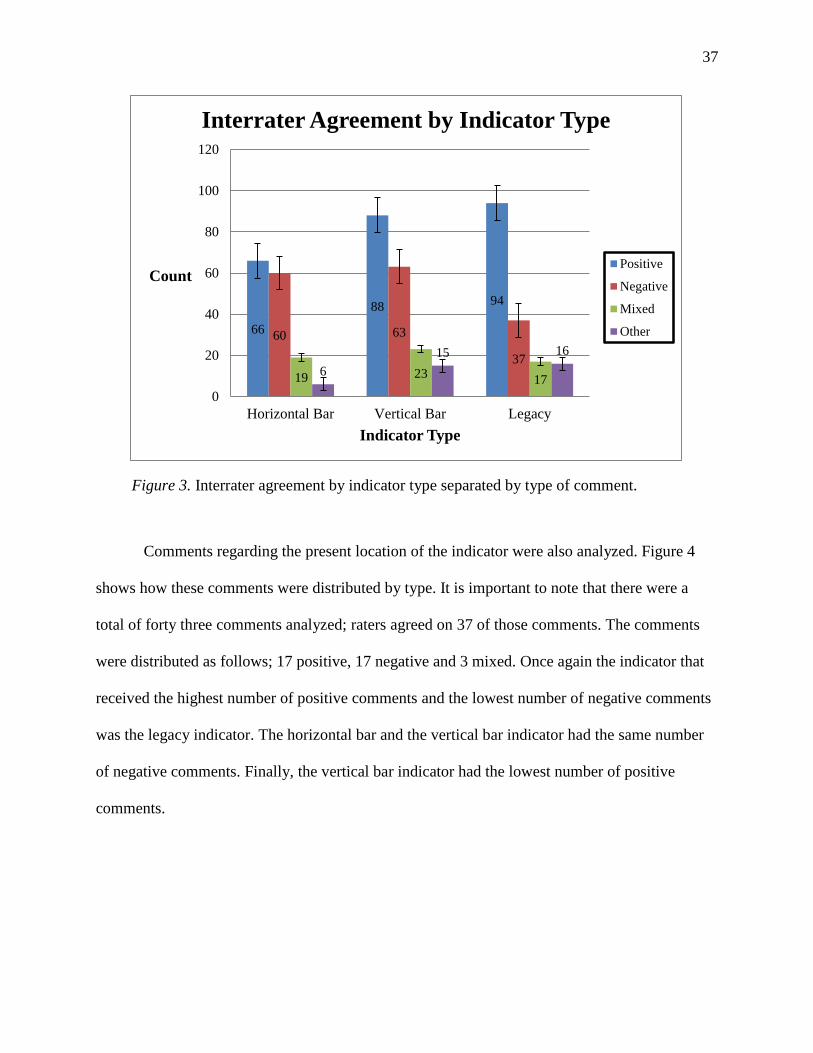
37
Figure 3. Interrater agreement by indicator type separated by type of comment.
Comments regarding the present location of the indicator were also analyzed. Figure 4
shows how these comments were distributed by type. It is important to note that there were a
total of forty three comments analyzed; raters agreed on 37 of those comments. The comments
were distributed as follows; 17 positive, 17 negative and 3 mixed. Once again the indicator that
received the highest number of positive comments and the lowest number of negative comments
was the legacy indicator. The horizontal bar and the vertical bar indicator had the same number
of negative comments. Finally, the vertical bar indicator had the lowest number of positive
comments.
66
88 94
60 63
37
19 23 17
6
15 16
0
20
40
60
80
100
120
Horizontal Bar Vertical Bar Legacy
Count
Indicator Type
Interrater Agreement by Indicator Type
Positive
Negative
Mixed
Other
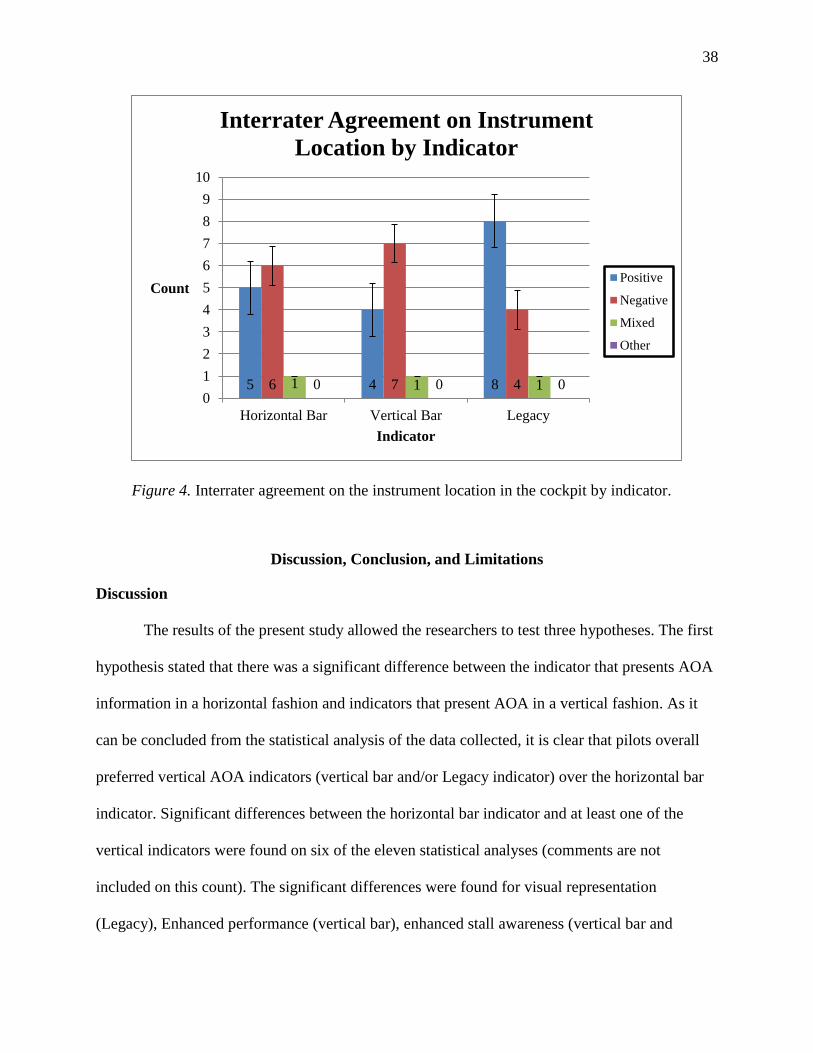
38
Figure 4. Interrater agreement on the instrument location in the cockpit by indicator.
Discussion, Conclusion, and Limitations
Discussion
The results of the present study allowed the researchers to test three hypotheses. The first
hypothesis stated that there was a significant difference between the indicator that presents AOA
information in a horizontal fashion and indicators that present AOA in a vertical fashion. As it
can be concluded from the statistical analysis of the data collected, it is clear that pilots overall
preferred vertical AOA indicators (vertical bar and/or Legacy indicator) over the horizontal bar
indicator. Significant differences between the horizontal bar indicator and at least one of the
vertical indicators were found on six of the eleven statistical analyses (comments are not
included on this count). The significant differences were found for visual representation
(Legacy), Enhanced performance (vertical bar), enhanced stall awareness (vertical bar and
5 4 8 6 7 4 1 1 1 0 0 0 0
1
2
3
4
5
6
7
8
9
10
Horizontal Bar Vertical Bar Legacy
Count
Indicator
Interrater Agreement on Instrument
Location by Indicator
Positive
Negative
Mixed
Other

39
Legacy), enhanced landing performance for normal approach and landing (Legacy), enhanced
landing performance for short field approach and landing (Legacy), and overall satisfaction with
the indicator (Legacy). It is important to note that the horizontal bar indicator had the lowest
score on all of the subsections of the post-flight questionnaire, including the system usability
scale (SUS) in which it only achieved a mean score of 45.69 compared to the legacy indicator
which had a mean score of 71.11, and the vertical bar indicator with a mean of 61.11. The results
of the statistical analysis of the Likert items on the post flight questionnaire are in accordance
with the number of positive versus negative comments that the participants gave to each type of
indicator. The horizontal bar indicator received the lowest number of positive comments (66)
compared to the Legacy indicator (94) and the vertical bar indicator (88). Reading the type of
positive and negative comments about each indicator, it was evident the reasons why participants
liked vertical indicators better than the horizontal bar indicator; when commenting about the
horizontal bar indicator, one of the participants stated “when pitching for angle of attack we use
the vertical plane. Horizontal display counter-intuitive.” Another participant commented “total
negative transfer of learning, horizontal indication has no relevance to pitch.” In contrast, some
of the comments about the vertical indicators support the idea that the indicator should match the
pilot’s mental expectations. One of the participants commented about the Legacy indicator that
“as pitch (should hopefully be) is in the vertical axis, the AOA indicator felt more "naturalized."”
Another participant commented about the vertical bar indicator stating, “the vertical bar
represents the vertical force making it simple to understand.” These comments are in accordance
with some of the design principles discussed earlier on this paper. The principles of pictorial
realism and the principle of congruency of dynamic information, where Wickens et al. (2004)
discussed the importance of designing displays that comply with the mental models and
40
expectations of the operator, this includes having realistic visual representations of the
information that is intended for the operator. These comments are also in accordance with the
importance of designing visual displays that take into consideration the display-control
arrangement (Tlauka, 2004). As it was mentioned several times on the comments, pilots liked the
vertical displays better because they were in accordance with their mental expectations. Also,
because the way the controls need to be applied in order to increase or decrease AOA is
vertically (by pulling or pushing the yoke control). A horizontal bar indicator violates both, the
mental models and expectations of the pilot and the idea of a synchronized display-control
arrangement; while the horizontal bar indicator is providing information about angle of attack in
a fashion that violates mental models, the pilot is expected to apply the controls in a vertical
fashion while looking at indications displayed horizontally.
The second hypothesis stated that there was a significant difference between the vertical
bar and legacy indicators. The statistical analyses do not show any significant difference between
these two indicators. It is important to note that for the eleven sections of the post-flight
questionnaire that were analyzed, the Legacy indicator obtained the highest mean scores and the
smallest standard deviations on all of the repeated measures analyses. On the Friedman’s rank
test for correlated samples, the Legacy indicator ranked higher than the vertical indicator on
eight of the sections (visual representation, enhanced performance, would enhance students’
performance, helped in flying a more stable approach on final (normal approach/landing and
short field approach/landing), enhanced landing performance (normal approach/landing and short
field approach/landing), and overall satisfaction. The Legacy and vertical bar indicators had the
same rank on two of the sections (system usability scale, and enhanced stall awareness). The
vertical bar indicator achieved a higher rank in only one of the categories (crosschecked indicator

41
during maneuvers). The number of positive comments also favors the Legacy indicator (94)
when compared to the vertical indicator (88). The number of negative comments for the Legacy
indictor is almost half of the total number of negative comments for the vertical indicator (37
versus 63). When reading the comments about both indicators, most of the negative comments
for the vertical indicator refer to the high number of lights used for each of the indications. Some
examples include: “too many lights to be able to quickly scan,” and “need to count all lights to
be on glidepath, very sensitive.” One of the comments that best reflects how most participants
felt about the vertical bar indicator’s light arrangement and indications was provided by one of
the participants when asked about his overall experience with the indicator, the participant stated
that “the indicator uses too many lights and can be distracting, especially on takeoff and
climbout. Also when transitioning from cruise to higher AOA, the sudden illumination of all 16
lights from just one green would grab my attention, which I did find distracting.” Negative
comments about the Legacy indicator were not as consistent as for the vertical indicator. Few
participants complained about the symbols and the number of lights on the indicator. Some
examples include: “Colors/symbols less intuitive compared to light bar indicator,” “not as
accurate as other ones (due to the limited number of indications),” and “hard to integrate. Stall
horn works just fine.” This last participant produced twenty two of the thirty seven negative
comments for the legacy, his comments concentrated on how hard it was to integrate the
indicator into the visual scan, and how much easier it was for him to just listen to the stall
warning horn. On the other hand, positive comments for the vertical indicator concentrated on
the fact that the indicator was easier to understand and more intuitive than the horizontal bar
indicator; some examples include: “the vertical bar represents the vertical force making it simple
to understand,” and “unlike horizontal, vertical makes more sense.” Some other positive

42
comments emphasized on the ability of the indicator to help participants to perform maneuvers in
an efficient manner, and to support decision-making. Some examples include: “I felt more
confident with a higher AOA and slower airspeed during final approach,” and “complemented
maintaining slow flight.” For the Legacy indicator, positive comments in general focused on the
simplicity of the indications and the discriminability of the lights displayed on the indicator
(chevrons and doughnut) compared to the multiple bulbs on the bar indicators. Some examples
include: “Very simple, clean, and quick to read,” “with different symbols, it was much easier to
see critical AOA in peripheral vision,” and “Intuitive. Easy to understand and interpret. Few
large symbols are much easier to use than many lights in close proximity.” As with the vertical
bar indicator, many positive comments about the Legacy indicator also referred to the indicator’s
ability to support decision making and improve performance. Some examples include: “allows
me to know I am on speed quickly without having to look down at airspeed,” and “if the normal
indication [green doughnut] wasn't there, I knew something had changed (alt, airspeed).” Most
participants commented on how useful the Legacy indicator was during landings. Some of the
comments that best describes what participants thought about the instrument during these landing
maneuvers include: “Helps to not overcorrect on pitch changes, keep the ball [green doughnut]
and the airplane lands super smooth,” and “in these landings I was less apprehensive about my
slower airspeeds during final approach, I also knew I was doing it correctly because of the green
doughnut.” For comments regarding the overall experience with the indicator (in which all
participants commented), independent raters agreed on 6 positive comments for the Legacy
indicator versus 1 positive comment for the vertical indicator. Both indicators received one bad
comment; for mixed comments, the Legacy indicator received 2 comments versus 5 for the
vertical bar indicator. Even though the statistical analyses failed to support our hypothesis that
43
there was a significant difference between the vertical bar and the Legacy indicator, the high
number of negative comments received by the vertical bar indicator suggests that participants felt
more comfortable performing maneuvers (especially final approaches and landings) with the
Legacy indicator.
Our third hypothesis stated that the current location where the AOA indicator is placed,
to the left of the magnetic compass on the dashboard (vertical bar and Legacy indicators) and
below the magnetic compass (horizontal bar indicator) would be disliked by IPs (see figure 5).
One item on the post flight questionnaire asked participants if the particular AOA indicator’s
physical location in the cockpit facilitated a crosscheck of AOA. This was a seven point Likert
item that ranged from strongly disagree to strongly agree. The horizontal bar indicator received 3
negative ratings (below 4 on the Likert Scale), 1 neutral rating (4 on the scale), and 6 positive
ratings (5 or higher on the scale). The vertical bar indicator received 1 negative rating, and 8
positive ratings. The Legacy indicator received 1 negative rating and 9 positive. This means that
across indicators, participants acknowledged that the indicators’ current location facilitated the
crosscheck of AOA. On the other hand, the analysis of the comments indicated that there was a
high number of negative comments (see figure 4). It is interesting to see how the vertical bar
indicator received the highest number of negative comments and the lowest number of positive
comments. While the comments for the Legacy indicator seems to be consistent with the ratings
it received on the Likert item discussed above. The comments for the horizontal bar indicator
seem also to be somehow inconsistent with the ratings received on the Likert item. When
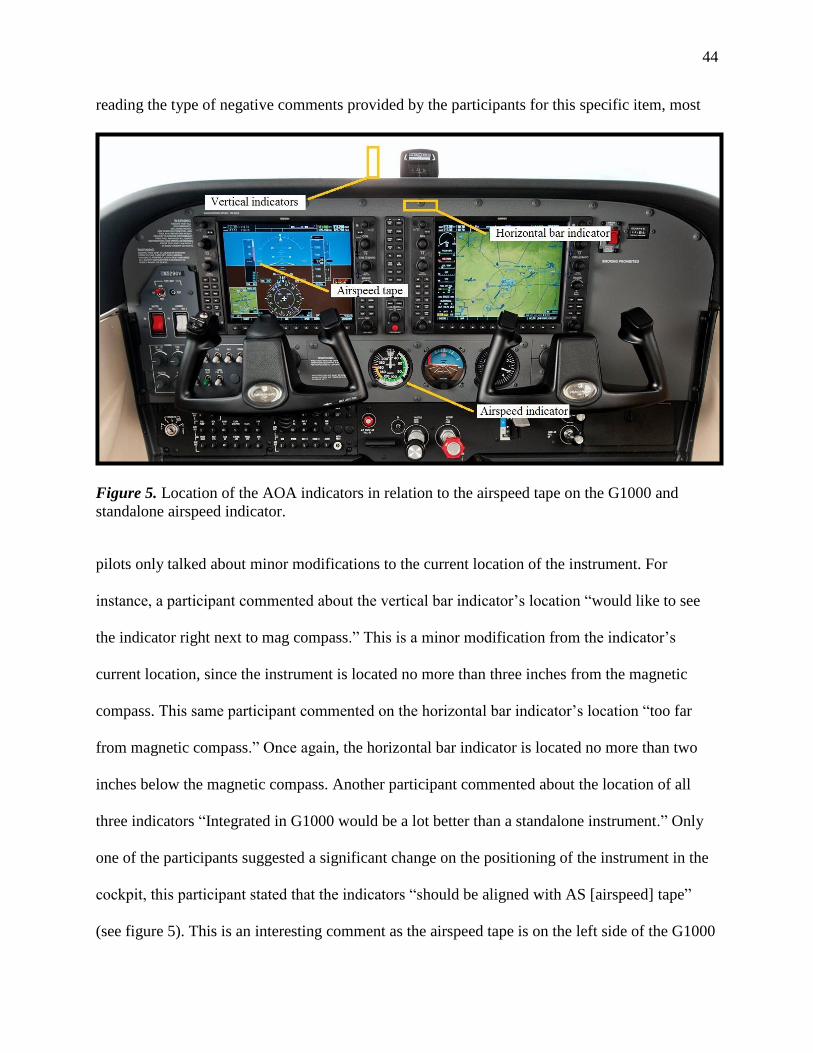
44
reading the type of negative comments provided by the participants for this specific item, most
Figure 5. Location of the AOA indicators in relation to the airspeed tape on the G1000 and
standalone airspeed indicator.
pilots only talked about minor modifications to the current location of the instrument. For
instance, a participant commented about the vertical bar indicator’s location “would like to see
the indicator right next to mag compass.” This is a minor modification from the indicator’s
current location, since the instrument is located no more than three inches from the magnetic
compass. This same participant commented on the horizontal bar indicator’s location “too far
from magnetic compass.” Once again, the horizontal bar indicator is located no more than two
inches below the magnetic compass. Another participant commented about the location of all
three indicators “Integrated in G1000 would be a lot better than a standalone instrument.” Only
one of the participants suggested a significant change on the positioning of the instrument in the
cockpit, this participant stated that the indicators “should be aligned with AS [airspeed] tape”
(see figure 5). This is an interesting comment as the airspeed tape is on the left side of the G1000

45
display on the pilot’s side of the cockpit. The researchers of this study believed that participants
would not like the current location of the instrument because traffic patterns are usually
performed turning to the left. As stated by the FAA (2013), “If not otherwise authorized or
directed by the tower, pilots of fixed-wing aircraft approaching to land must circle the airport to
the left.” These types of maneuvers require pilots to check for other aircraft in the area while
checking the aircraft’s position in reference to the runway (which is normally to their left). For
these reasons, the researchers of the present study hypothesized that the present location of the
indicators would be disliked by the participants and that they (or at least some) would suggest the
indicator to be installed on the left side of the dashboard as it would facilitate the crosscheck
with the airspeed tape and the outside scan of traffic in the pattern while maintaining awareness
of the aircraft’s position in reference to the runway.
Conclusion
The present study was intended to find the difference between three different angle of
attack indicators. The multiple analyses of the data and the comments allowed the researchers to
reach several conclusions about the usability of the three preselected indicators. It can be
concluded that vertical indicators are better representations of AOA, because they support the
expectations and mental models of pilots. The horizontal bar indicator is not intuitive and it can
create confusion, especially for SPs who do not fully understand all the aeronautical concepts
related to operating an aircraft. Even though the statistical analysis didn’t show a significant
difference between the vertical bar and the Legacy indicator, it can be concluded according to the
comments provided by the participants of the study, that the Legacy is a simple tool that aids
pilots to perform landing maneuvers better than the vertical bar indicator. The reason why the
Legacy indicator seems to be a better instrument is because it relies more on perception than in
46
higher order metal processes. While the Legacy indicator displays few lights and different
shapes, the vertical bar indicator relies on a series of 16 lights that push pilots to count the
number of red lights remaining to know how close they are to stalling. The Legacy indicator on
the other hand, shows fewer indications; a red chevron and the upper half of the green doughnut
would warn pilots of a potential stall, also the red chevron pointing downwards tells pilots that
the AOA should be decreased by lowering the nose in order to avoid a stall. The Legacy’s visual
layout seems to be in accordance with compatible display-control arrangements discussed by
Tlauka (2004) and with Korblum et al.’s (1990) dimensional overlap model; which claims that
when a stimulus-response ensemble shares a number of characteristics, the stimulus can trigger
an automatic response due to the similarities between the stimulus and the mental expectations of
the operator. On the other hand, some pilots commented on the vertical bar indicator during the
stalls and slow flight maneuvers; that they liked counting the lights or seeing the lights disappear
as they were approaching the critical AOA until stalling. This exercise (counting lights) requires
the utilization of multiple cognitive resources, including memory. This would indicate that
during these types of maneuvers in which the aircraft is several hundred feet above the ground,
pilots can afford to count lights in order to know when a stall would happen; they would have
plenty of time to react in order to recover the aircraft from the stall without worrying about
hitting the ground. This same approach (counting lights) is both inefficient and dangerous while
performing landings because pilots cannot waste time or cognitive resources on counting lights
in order to figure out the aerodynamic status of the aircraft. During landings pilots need to be
aware of multiple cues inside and outside the cockpit. As a matter of fact, some of the
participants commented on how they decided to disregard the vertical bar indicator while
landing. On the other hand, the Legacy indicator received positive comments about its ability to

47
assist pilots during landings. This is because the few indications and the different shape of the
symbols on the display can effectively inform pilots of the aerodynamic status of the aircraft. A
green doughnut indicates pilots that the aircraft is in an optimal AOA, while the red and yellow
chevrons inform pilots of whether the AOA is too high or too shallow, there is no counting lights
involved, just perception; a red chevron pointing downwards tells pilots to decrease AOA, a
yellow chevron pointing upwards tells the pilot that the AOA is too shallow, and a full green
doughnut tells the pilot the aircraft is in a safe aerodynamic attitude. As for the location of the
indicator inside the cockpit, it is unclear whether or not pilots favored the present location. As it
was seen in the discussion section, both bar indicators received a high number of negative
comments, while the Legacy indicator received a high number of positive comments and very
few negative ones. It is important to remember that the type of negative comments for the
indicators only mention minimum modifications to the present location of the instrument. It can
be speculated that the reason why participants favored a central location of the instrument rather
than a leftward position was because perhaps, they disregarded the indicator during most parts of
the traffic pattern, and only focused on it during final approach and landing when the aircraft was
already aligned with the runway’s centerline. Perhaps this central position of the indicator helps
pilots to concentrate on the widening of the runway while they are preparing for landing, while
crosschecking the AOA indicator without having to shift their eyes away from the runway. This
same reasoning could be applied to slow flight and stalls; pilots didn’t necessarily need to scan
for traffic by looking to the left of the aircraft, and while performing the maneuvers they were
looking forward and outside the cockpit. This would explain the high ratings on the Likert item
that asked participants about the current location of the instrument inside the cockpit.

48
Nevertheless, the difference in the number of positive and negative comments for the location
suggests there might be a relationship between indicator type and its location in the cockpit.
Based on the analyses of the data collected throughout the study and visual display design
principles and theoretical background discussed in this study, the researchers of the present paper
believe that the Legacy indicator is the most usable indicator in comparison with the Ultra 2.5”
bar indicators (vertical and horizontal). The results show a significant difference between the
Legacy indicator and the horizontal bar indicator in six of the eleven analyses, including overall
satisfaction with the indicator. Even though the statistical analyses did not show a significant
difference between the vertical bar indicator and the Legacy indicator, the difference in the
number of negative comments between these two indicators (66 for the vertical bar vs. 37 for the
Legacy), and the nature of the positive comments for the Legacy indicator, indicates that
participants, in general, preferred the latter indicator. This preference is more evident during
landings. While the Legacy indicator received many positive comments on its ability to support
decision making during landings, the vertical bar indicator was disregarded for most pilots
during this maneuver. It is important to note that AOA indicators are most usable in flight phases
in which the aircraft is at high AOA and low airspeeds (e.g. during landings). For this reason the
researchers of this study believe the Legacy indicator should be the instrument to be installed in
the university’s fleet of Cessna 172S.
Limitations
The present study has a number of different limitations that should be addressed in future
studies. The first limitation that we encountered was the small number of participants provided
by the flight department. If a larger subject pool had been made available from the same pilot
population, the probabilities of finding significant differences between the AOA indicators in the
49
SUS scale would have been highly probable. The second limitation we encountered was the
nature of the sample, participants were relatively inexperienced IPs. Maybe using experienced
IPs could help to clarify if there is a significant difference between vertical indicators; at the
same time, more experienced participants could have a different opinion about the location of the
indicator in the cockpit. Perhaps a study with a larger sample that combines both types of pilots
could help to clarify differences between experienced and inexperienced IPs. Another limitation
of the present study was the type of data collected. Due to time limitations, our study was
constrained to collect subjective data. Future studies should consider using objective measures.
For instance, it is possible to collect flight data from the fleet of Cessna 172S. This data, if
properly analyzed, could help researchers understand if there is a clear relationship between
indicator preference and performance. Another important limitation of the study was the location
of the indicator in the cockpit; it would be interesting to manipulate the location of the
instrument in order to see if participants blindly agree with the location of the instrument, or if on
the other hand, they suggest a different location for the instrument based on their past
experiences and aviation knowledge. Finally, it would be interesting to have the students’
perspective on AOA indicators. A study using SPs would help researchers better understand the
preferences and needs of SPs while using AOA as part of their training.
As for the tools used in the present study, there are a few recommendations for future
research. First, future studies that use the SUS are encouraged to use the format that was
developed for the present study. More importantly, future studies should include the ten items on
the original SUS instead of nine items as it was used for the present study. Researchers of the
present study consider that the selected maneuvers used for the flights were appropriate as they
are directly related to AOA. Future studies should incorporate these same five maneuvers and the

50
corresponding sections of the post-flight questionnaire to test the usability of AOA indicators.
Overall, we consider that the post-flight questionnaire designed for the present study was an
appropriate tool to test for differences between the indicators. Researchers interested in
conducting usability studies on AOA based systems should use the post-flight questionnaire as a
base to develop a strong testing tool that could eventually be validated.

51
References
Aarons, R. N. (2006) Using angle-of-attack indicators. Business and commercial aviation,98 46-
48.
Acemyan, C. Z., & Kortum, P. (2012, September). The Relationship Between Trust and
Usability in Systems. In Proceedings of the Human Factors and Ergonomics Society
Annual Meeting (Vol. 56, No. 1, pp. 1842 – 1846). SAGE Publications.
Alpha Systems. (2010) installation and operations manual for electronic angle of attack (A.O.A)
indicator. Depotstar, Inc.
Ancel, Ersin, and Ann T. Shih, “The Analysis of the Contribution of Human Factors to the In-
flight Loss of Control Accidents,” Paper for the 12th AIAA Aviation Technology,
Integration and Operations (ATIO) Conference, (September 2012), Indianapolis, IN.
Bangor, A., Kortum, P., & Miller, J. (2008). An empirical evaluation of the system usability
scale. International Journal of Human-Computer Interaction24(6), 574 – 594.
Bangor, A., Kortum, P., & Miller, J. (2009). Determining what individual SUS scores mean:
Adding an adjective rating scale. Journal of usability studies, 4(3), 114 – 123.
Bennett, K. B., & Flach, J. M. (1992). Graphical displays: Implications for divided attention,
focused attention, and problem solving. Human Factors: The Journal of the Human
Factors and Ergonomics Society, 34(5), 513 – 533.
Boeing (2000). Operational use of angle of attack on modern commercial jet airplanes. Aero, No.
12, 11 – 23.
52
Boeing (2011). Commercial Airplanes, Statistical Summary of Commercial Jet Airplane
Accidents, Worldwide Operations 1959 – 2010. Aviation Safety.
Brooke, J. (1996). SUS-A quick and dirty usability scale. Usability evaluation in industry, 189,
194.
Chamorro-Koc, M., Popovic, V., & Emmison, M. (2009). Human experience and product
usability: Principles to assist the design of user–product interactions. Applied
Ergonomics, 40, 648 – 656.
Dunn, R. F. (2011) The aoa indicator: small device, huge impact. Approach, 56, 9 – 10
Eimer, M. (1995). Stimulus-response compatibility and automatic response activation: evidence
from psychophysiological studies. Journal of Experimental Psychology: Human
Perception and Performance, 21(4), 837 – 854.
Federal Aviation Administration (2000). Stall and spin awareness training (Publication No. AC
61-67C). Washington, DC: U.S. Government Printing Office.
Federal Aviation Administration (2008). High altitude operations: supplement # 1 to the airplane
upset recovery training aid. Washington, DC: U.S. Government Printing Office.
Federal Aviation Administration (FAA). Instrument Flying Handbook : FAA-H-8083-15B
Effective 2012 (2013 Edition). Renton, WA, USA: Aviation Supplies & Academics, Inc.,
2013. p 3.http://site.ebrary.com/lib/erau/Doc?id=10641737&ppg=3Copyright © 2013.
Aviation Supplies & Academics, Inc.. All rights reserved.
Federal Aviation Administration (2012). General aviation joint steering committee (GAJSC) loss
of control work group approach and landing.

53
Federal Aviation Administration (2013). Aeronautical information manual: Official guide to
basic flight information and ATC procedures.
Flach, J. M., Jacques, P. F., Patrick, D. L., Amelink, M. H. J., van Paassen, M. M.,&Mulder, M.
(2003). Asearch for meaning:Acase study of the approach-to-landing. In E. Hollnagel
(Ed.), The handbook of cognitive task design (pp. 171 – 192). Mahwah, NJ: Lawrence
Erlbaum Associates, Inc.
Geiselman, E. E., & Osgood, R. K. (1992, October). A Comparison of Three Attitude Display
Symbology Structures during an Attitude Maintenance Task. In Proceedings of the
Human Factors and Ergonomics Society Annual Meeting (Vol. 36, No. 18, pp. 1450 –
1454). SAGE Publications.
Hall, D. S., Shattuck, L. G., & Bennett, K. B. (2012). Evaluation of an ecological interface
design for military command and control. Journal of Cognitive Engineering and Decision
Making, 6(2), 165 – 193.
Hamblin, C. J., Miller, C., & Naidu, S. (2006, October). Comparison of Three Avionics Systems
Based upon Information Availability, Priorities and Accessibility. In Proceedings of the
Human Factors and Ergonomics Society Annual Meeting (Vol. 50, No. 17, pp. 1825 –
1828). SAGE Publications.
Hoadley, A. W. and VanderBok, R. S.(1987). “Stall Margin Indication,” Journal of Aircraft,
25(4) 380 – 383.
International Civil Aviation Organization. (2013) Aviation occurrence categories: definitions and
usage notes.

54
Jacobson, S., Foster, J., Casner, S., Reehorst, A., Addy, E., Shah, G., and Nowinski, J., “Aircraft
Loss of Control Study,” NASA Internal Report, Feb. 2010.
Jacobson S. (2010). Aircraft loss of control causal factors and mitigation challenges. AIAA
Guidance, Navigation, and Control Conference 2 - 5 August 2010, Toronto, Ontario
Canada.
Kornblum, S., Hasbroucq, T., & Osman, A. (1990). Dimensional overlap: cognitive basis for
stimulus-response compatibility--a model and taxonomy. Psychological review, 97(2),
253 – 270.
Kortum, P. T., & Bangor, A. (2013). Usability Ratings for Everyday Products Measured With
the System Usability Scale. International Journal of Human-Computer Interaction,
29(2), 67 – 76.
Langewiesche, W., & Collins, L. H. (1972). Stick and rudder: An explanation of the art of flying.
McGraw-Hill.
Lee, J. R., & Nass, C. I. (2010) Trust in computers: the computers-are-social-actors (CASA)
paradigm and trustworthiness perception in human-computer communication. In D.
Latusek, & A. Gerbais (Eds.), Trust and technology in a ubiquituosmodern environment:
Theoretical and methodological perspectives (pp. 1 – 15).
Likert, R. (1932). A technique for the measurement of attitudes. Archives of psychology.
Maguire, M. (2001). Methods to support human-centred design. International journal of human-
computer studies, 55(4), 587 – 634.

55
McDougall, S. J., Curry, M. B., & de Bruijn, O. (2001). The effects of visual information on
users' mental models: An evaluation of Pathfinder analysis as a measure of icon usability.
International Journal of Cognitive Ergonomics, 5(1), 59 – 84.
Parasuraman, R., & Davies, D. R. (Eds.). (1984). Varieties of attention (Vol. 40, pp. 47 – 52).
New York: Academic Press.
Roscoe, S. N. (1968) Airborne displays for flight and navigation. Human Factors, 10, 321-332.
Sadraey, M. H. (2013). Aircraft Design: A System Engineering Approach (179 – 189). Wiley &
Sons Ltd. United Kingdom.
Schvaneveldt, R. W., Beringer, D. B., & Leard, T. M. (2003). Evaluating aviation information
systems: The role of information priorities. Final Report, Federal Aviation
Administration, Arizona State University.
Tlauka, M. (2004). Display-control compatibility: The relationship between performance and
judgments of performance. Ergonomics, 47(3), 281 – 295.
Wickens, C.D., Gordon, S.E., Liu, Y. An introduction to human factors engineering. Reading
(MA): Addison Wesley; 2004.
Woods, D.D. (1991). The cognitive engineering of problem representations. In G.R.S. Weir and
J.L. Alty (Eds.), Human computer interaction and complex systems (pp. 169 – 188).
London: Academic.
Zhang, J. (1997). Distributed representation as a principle for the analysis of cockpit information
displays. The International Journal of Aviation Psychology, 7(2), 105 – 121.

56
APPENDIX A
Approximate AOA Indications for Each Flight Maneuver
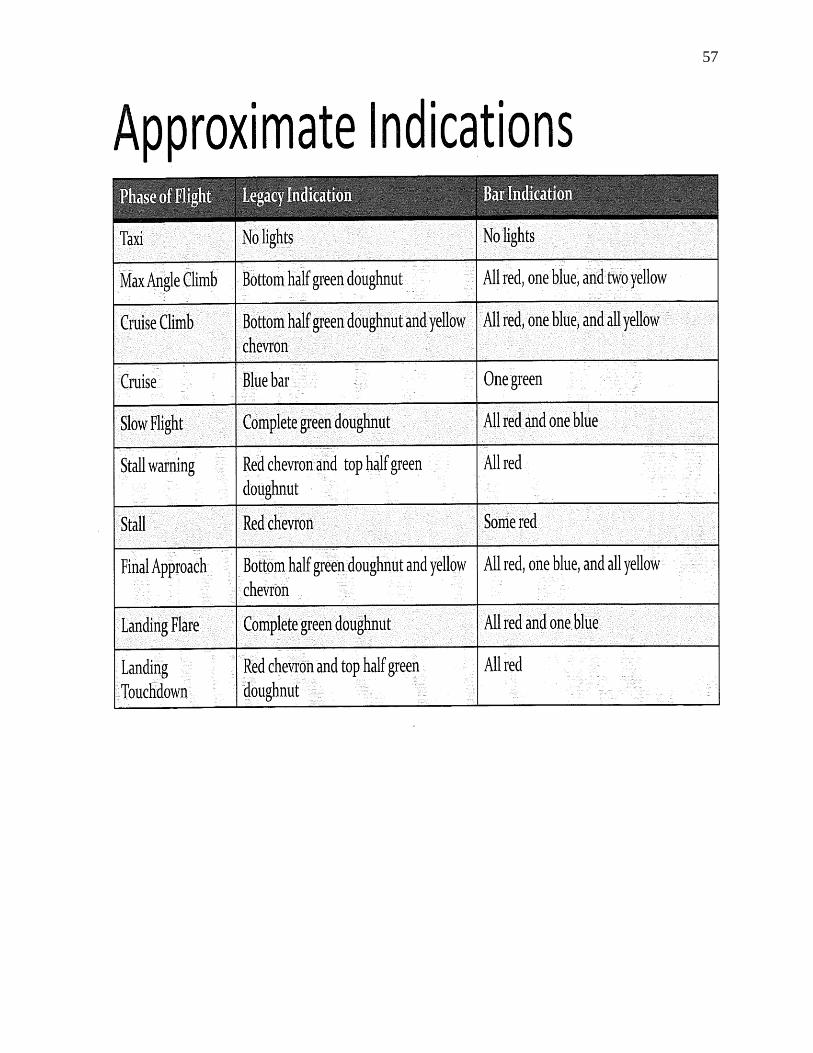
57

58
APPENDIX B
Informed Consent Form

59
Usability Testing of Angle of Attack (AOA) Indicators
Principal Investigator: Dr. Albert Boquet
Research Assistants: Camilo Jimenez and Claas Tido Boesser,
[email protected] [email protected]
Embry-Riddle Aeronautical University
Human Factors Laboratory
600 S. Clyde Morris Blvd.
Daytona Beach, FL 32114
Purpose of the study
You are participating in a usability study. The purpose of this research is to collect data on a
series of three flights, each flown with a different type of AOA indicator, in order to assess
which type of AOA indicator is best suited for installment on the fleet of Cessna 172s at Embry-
Riddle.
During the sessions, you will perform a series of predetermined maneuvers while referencing an
AOA indicator. At the end of each flight, you will fill out a post-flight questionnaire, providing
feedback on the usability of the AOA indicator during flight, and in particular during the pre-
determined maneuvers.
Through this study, you will have a unique opportunity to help us enhance overall flight safety
and the flying experience of our aviation community.
Risks associated with the study
The risks associated with this study are the same as what you face in everyday activities as an
instructor pilot. There are no known additional risks to those who take part in this experiment.
Flights will always be conducted with another instructor pilot acting as the safety pilot
Compensation
You will be compensated for your flying duties the same way that you would during regular
flying sorties at Embry-Riddle. There will be no additional compensation but your feedback will
have a direct impact on future instrumentation of Embry-Riddle’s fleet of aircraft and student
pilot training.

60
Participation
Your participation in the study is voluntary; you should only take part in this study if you want to
volunteer. You should not feel that there is any pressure to take part in the study. You are free to
participate in this research or withdraw at any time.
Confidentiality
We will collect data through a series of questionnaires at the end of each flight and a one-time
questionnaire before you begin the flight series. We will keep your personal records private and
confidential. Any information collected during this study will only be used for scientific
purposes. We may publish the results of this study. If we do, we will not include your name. We
will not publish anything that would let people know who you are or how you are connected to
this study.
Other questions, concerns, or complaints
If you have any questions, concerns or complaints about this study, or experience an adverse
event or unanticipated problem, contact Dr. Albert Boquet, [email protected].
If you would like to know the results of this study please contact any of the researchers listed on
page one of this form.
Statement of Consent
I acknowledge that my participation in this research experiment is entirely voluntary and that I
have the freedom to withdraw from the study at any time. I have been informed about the
general scientific nature of the research. If I choose to withdraw from the study, I shall be
compensated for the amount of time that I invested into the experiment.
Participant’s name (print):__________________________________
Signature of participant: ____________________________________ Date: __________
Experimenter: _____________________________________________ Date: __________

61
APPENDIX C
Pre-Flight Questionnaire

62
AOA Pre-Flight Questionnaire
Demographics
1. Last four digits of your ERAU ID number ____________________________________
2. What is your age? ____________ years
3. What is your gender? ☐ Male ☐ Female
4. Rating currently held ____________________________________
5. How many years have you been working as an
instructor pilot? ____________ years
6. Total number of flight hours as an instructor
pilot ____________
7. Total number of flight hours (including those
before becoming an instructor) ____________
8. Of the total flight hours, approximately how
many hours were flown with a “glass-cockpit”? ____________
9. Have you flown in the military? ☐ Yes ☐ No
9a. Number of hours flown in the military ____________
9b. Type of aircraft flown in the military
_______________________________________ _______________________________________ _______________________________________
10. How many hours per week (on average) do you
work as an instructor pilot? ____________
11. How may years have you worked as an
instructor pilot for ERAU? ____________ years
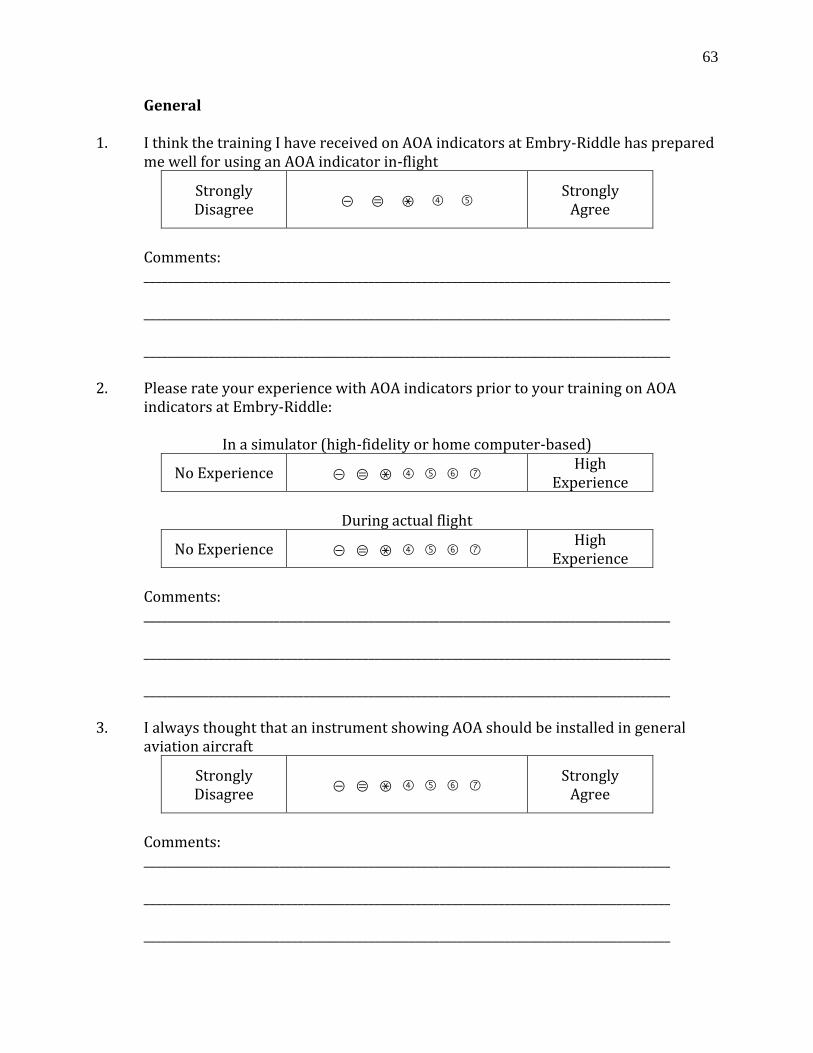
63
General 1. I think the training I have received on AOA indicators at Embry-Riddle has prepared
me well for using an AOA indicator in-flight
Strongly Disagree
① ② ③ ④ ⑤
Strongly Agree
Comments: _________________________________________________________________________________________
_________________________________________________________________________________________
_________________________________________________________________________________________
2. Please rate your experience with AOA indicators prior to your training on AOA
indicators at Embry-Riddle:
In a simulator (high-fidelity or home computer-based)
No Experience ① ② ③ ④ ⑤ ⑥ ⑦ High
Experience
During actual flight
No Experience ① ② ③ ④ ⑤ ⑥ ⑦ High
Experience
Comments: _________________________________________________________________________________________
_________________________________________________________________________________________
_________________________________________________________________________________________
3. I always thought that an instrument showing AOA should be installed in general
aviation aircraft
Strongly Disagree
① ② ③ ④ ⑤ ⑥ ⑦
Strongly Agree
Comments: _________________________________________________________________________________________
_________________________________________________________________________________________
_________________________________________________________________________________________

64
4. I think that using an AOA indicator can improve my performance during the following maneuvers
Slow-Flight
Not at all ① ② ③ ④ ⑤ ⑥ ⑦ Extremely
Comments: _________________________________________________________________________________________
_________________________________________________________________________________________
Power-On Stalls
Not at all ① ② ③ ④ ⑤ ⑥ ⑦ Extremely
Comments: _________________________________________________________________________________________
_________________________________________________________________________________________
Power-Off Stalls
Not at all ① ② ③ ④ ⑤ ⑥ ⑦ Extremely
Comments: _________________________________________________________________________________________
_________________________________________________________________________________________
Normal Approach and Landing
Not at all ① ② ③ ④ ⑤ ⑥ ⑦ Extremely
Comments: _________________________________________________________________________________________
_________________________________________________________________________________________
Short-field Approach and Landing
Not at all ① ② ③ ④ ⑤ ⑥ ⑦ Extremely
Comments: _________________________________________________________________________________________
_________________________________________________________________________________________
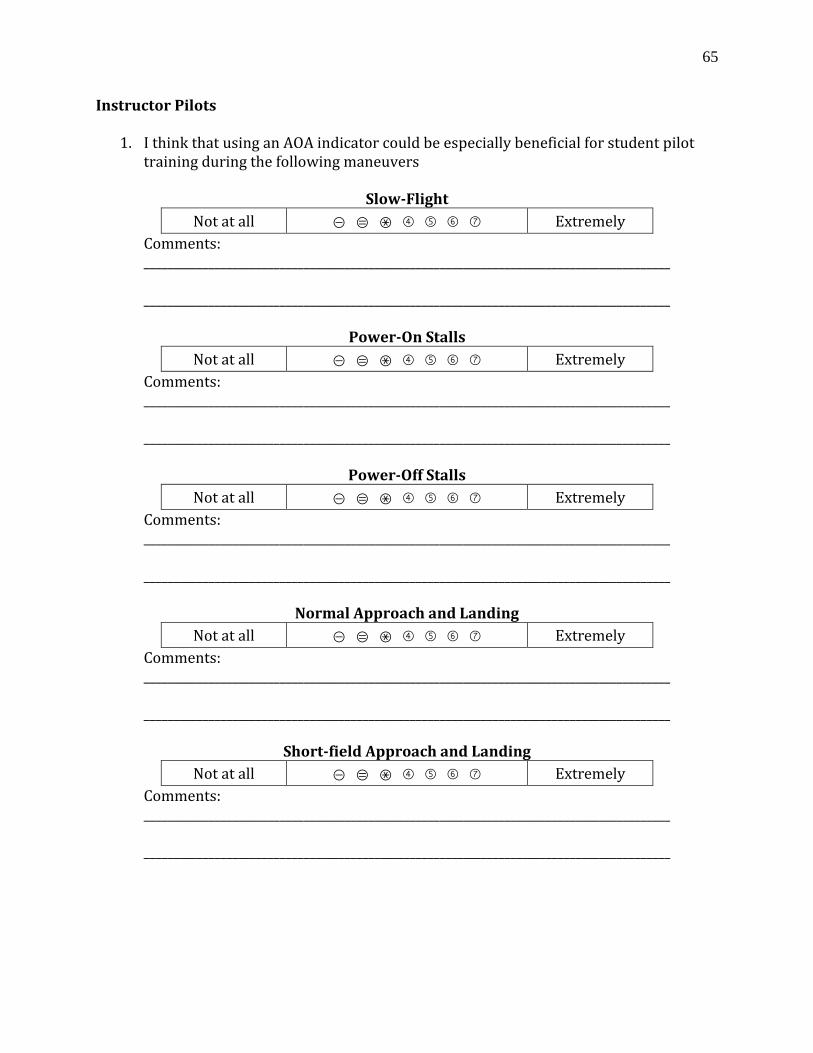
65
Instructor Pilots
1. I think that using an AOA indicator could be especially beneficial for student pilot training during the following maneuvers
Slow-Flight
Not at all ① ② ③ ④ ⑤ ⑥ ⑦ Extremely
Comments: _________________________________________________________________________________________
_________________________________________________________________________________________
Power-On Stalls
Not at all ① ② ③ ④ ⑤ ⑥ ⑦ Extremely
Comments: _________________________________________________________________________________________
_________________________________________________________________________________________
Power-Off Stalls
Not at all ① ② ③ ④ ⑤ ⑥ ⑦ Extremely
Comments: _________________________________________________________________________________________
_________________________________________________________________________________________
Normal Approach and Landing
Not at all ① ② ③ ④ ⑤ ⑥ ⑦ Extremely
Comments: _________________________________________________________________________________________
_________________________________________________________________________________________
Short-field Approach and Landing
Not at all ① ② ③ ④ ⑤ ⑥ ⑦ Extremely
Comments: _________________________________________________________________________________________
_________________________________________________________________________________________

66
Overall Comments: _________________________________________________________________________________________________ _________________________________________________________________________________________________ _________________________________________________________________________________________________ _________________________________________________________________________________________________ _________________________________________________________________________________________________ _________________________________________________________________________________________________ _________________________________________________________________________________________________ _________________________________________________________________________________________________ _________________________________________________________________________________________________

67
APPENDIX D
Post-Flight Questionnaire
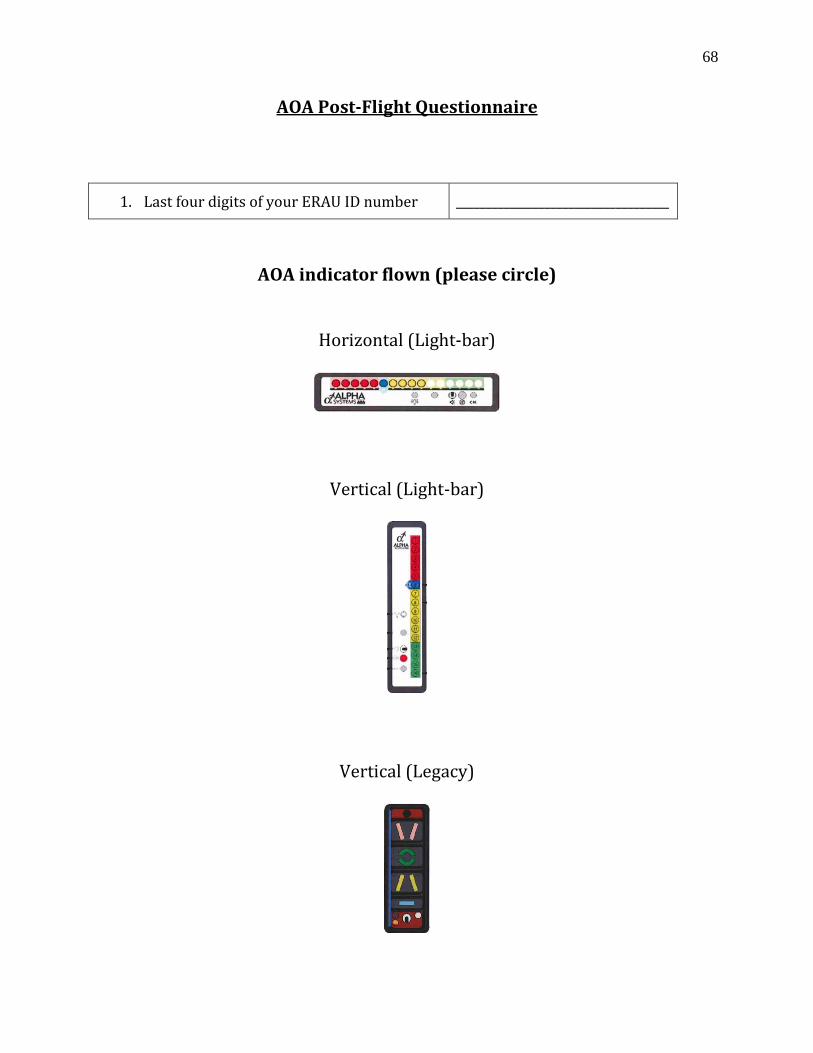
68
AOA Post-Flight Questionnaire
1. Last four digits of your ERAU ID number ____________________________________
AOA indicator flown (please circle)
Horizontal (Light-bar)
Vertical (Light-bar)
Vertical (Legacy)
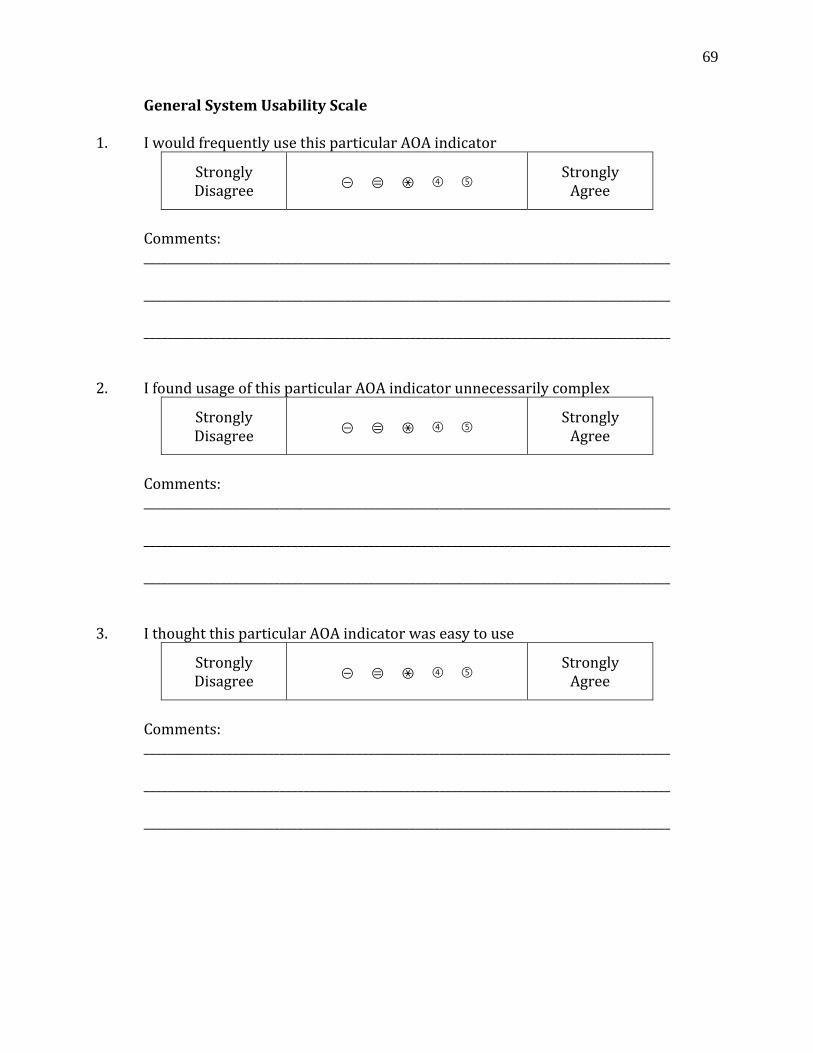
69
General System Usability Scale 1. I would frequently use this particular AOA indicator
Strongly Disagree
① ② ③ ④ ⑤
Strongly Agree
Comments: _________________________________________________________________________________________
_________________________________________________________________________________________
_________________________________________________________________________________________
2. I found usage of this particular AOA indicator unnecessarily complex
Strongly Disagree
① ② ③ ④ ⑤
Strongly Agree
Comments: _________________________________________________________________________________________
_________________________________________________________________________________________
_________________________________________________________________________________________
3. I thought this particular AOA indicator was easy to use
Strongly Disagree
① ② ③ ④ ⑤
Strongly Agree
Comments: _________________________________________________________________________________________
_________________________________________________________________________________________
_________________________________________________________________________________________

70
4. I think that I would need more training to effectively use this particular AOA indicator
Strongly Disagree
① ② ③ ④ ⑤
Strongly Agree
Comments: _________________________________________________________________________________________
_________________________________________________________________________________________
_________________________________________________________________________________________
5. I found this particular AOA indicator to be a well-integrated representation of AOA
Strongly Disagree
① ② ③ ④ ⑤
Strongly Agree
Comments: _________________________________________________________________________________________
_________________________________________________________________________________________
_________________________________________________________________________________________
6. I would learn the use of this particular AOA indicator quickly
Strongly Disagree
① ② ③ ④ ⑤
Strongly Agree
Comments: _________________________________________________________________________________________
_________________________________________________________________________________________
_________________________________________________________________________________________

71
7. I found this particular AOA indicator very awkward to use
Strongly Disagree
① ② ③ ④ ⑤
Strongly Agree
Comments: _________________________________________________________________________________________
_________________________________________________________________________________________
_________________________________________________________________________________________
8. I felt very confident using this particular AOA indicator
Strongly Disagree
① ② ③ ④ ⑤
Strongly Agree
Comments: _________________________________________________________________________________________
_________________________________________________________________________________________
_________________________________________________________________________________________
9. I will need a lot of time before effectively using this particular AOA indicator
Strongly Disagree
① ② ③ ④ ⑤
Strongly Agree
Comments: _________________________________________________________________________________________
_________________________________________________________________________________________
_________________________________________________________________________________________

72
Visual representation and location 1. This particular AOA indicator’s visual representation of AOA was intuitive and easy
to understand
Strongly Disagree
① ② ③ ④ ⑤ ⑥ ⑦
Strongly Agree
Comments: _________________________________________________________________________________________
_________________________________________________________________________________________
_________________________________________________________________________________________
2. This particular AOA indicator’s orientation (horizontal/vertical) was well suited for
a visual representation of AOA
Strongly Disagree
① ② ③ ④ ⑤ ⑥ ⑦
Strongly Agree
Comments: _________________________________________________________________________________________
_________________________________________________________________________________________
_________________________________________________________________________________________
3. This particular AOA indicator’s physical location in the cockpit facilitated a
crosscheck of AOA
Strongly Disagree
① ② ③ ④ ⑤ ⑥ ⑦
Strongly Agree
Comments: _________________________________________________________________________________________
_________________________________________________________________________________________
_________________________________________________________________________________________

73
4. If you could place this particular AOA indicator anywhere in the cockpit, given the rough cockpit layout below, please outline the position where you would like the indicator to be placed. If you are 100% satisfied with the current position, leave blank.
Note: You can mark anywhere on the dashboard or free space on the instrument panel. Please outline the AOA indicator.
Comments: _________________________________________________________________________________________
_________________________________________________________________________________________
_________________________________________________________________________________________

74
Maneuvers 1. I think that crosschecking this particular AOA indicator enhanced my personal
performance on the following maneuvers
Slow-Flight
Not at all ① ② ③ ④ ⑤ ⑥ ⑦ Extremely
Comments: _________________________________________________________________________________________
_________________________________________________________________________________________
Power-On Stalls
Not at all ① ② ③ ④ ⑤ ⑥ ⑦ Extremely
Comments: _________________________________________________________________________________________
_________________________________________________________________________________________
Power-Off Stalls
Not at all ① ② ③ ④ ⑤ ⑥ ⑦ Extremely
Comments: _________________________________________________________________________________________
_________________________________________________________________________________________
Normal Approach and Landing
Not at all ① ② ③ ④ ⑤ ⑥ ⑦ Extremely
Comments: _________________________________________________________________________________________
_________________________________________________________________________________________
Short-field Approach and Landing
Not at all ① ② ③ ④ ⑤ ⑥ ⑦ Extremely
Comments: _________________________________________________________________________________________
_________________________________________________________________________________________

75
2. This particular AOA indicator enhanced my awareness of how close the aircraft is to a stall at all times during the following maneuvers
Slow-Flight
Not at all ① ② ③ ④ ⑤ ⑥ ⑦ Extremely
Comments: _________________________________________________________________________________________
_________________________________________________________________________________________
Power-On Stalls
Not at all ① ② ③ ④ ⑤ ⑥ ⑦ Extremely
Comments: _________________________________________________________________________________________
_________________________________________________________________________________________
Power-Off Stalls
Not at all ① ② ③ ④ ⑤ ⑥ ⑦ Extremely
Comments: _________________________________________________________________________________________
_________________________________________________________________________________________
Normal Approach and Landing
Not at all ① ② ③ ④ ⑤ ⑥ ⑦ Extremely
Comments: _________________________________________________________________________________________
_________________________________________________________________________________________
Short-field Approach and Landing
Not at all ① ② ③ ④ ⑤ ⑥ ⑦ Extremely
Comments: _________________________________________________________________________________________
_________________________________________________________________________________________

76
3. During the following maneuvers, I crosschecked this particular AOA indicator
Slow-Flight
Not at all ① ② ③ ④ ⑤ ⑥ ⑦ Very frequently
Comments: _________________________________________________________________________________________
_________________________________________________________________________________________
Power-On Stalls
Not at all ① ② ③ ④ ⑤ ⑥ ⑦ Very frequently
Comments: _________________________________________________________________________________________
_________________________________________________________________________________________
Power-Off Stalls
Not at all ① ② ③ ④ ⑤ ⑥ ⑦ Very frequently
Comments: _________________________________________________________________________________________
_________________________________________________________________________________________
Normal Approach and Landing
Not at all ① ② ③ ④ ⑤ ⑥ ⑦ Very frequently
Comments: _________________________________________________________________________________________
_________________________________________________________________________________________
Short-field Approach and Landing
Not at all ① ② ③ ④ ⑤ ⑥ ⑦ Very frequently
Comments: _________________________________________________________________________________________
_________________________________________________________________________________________
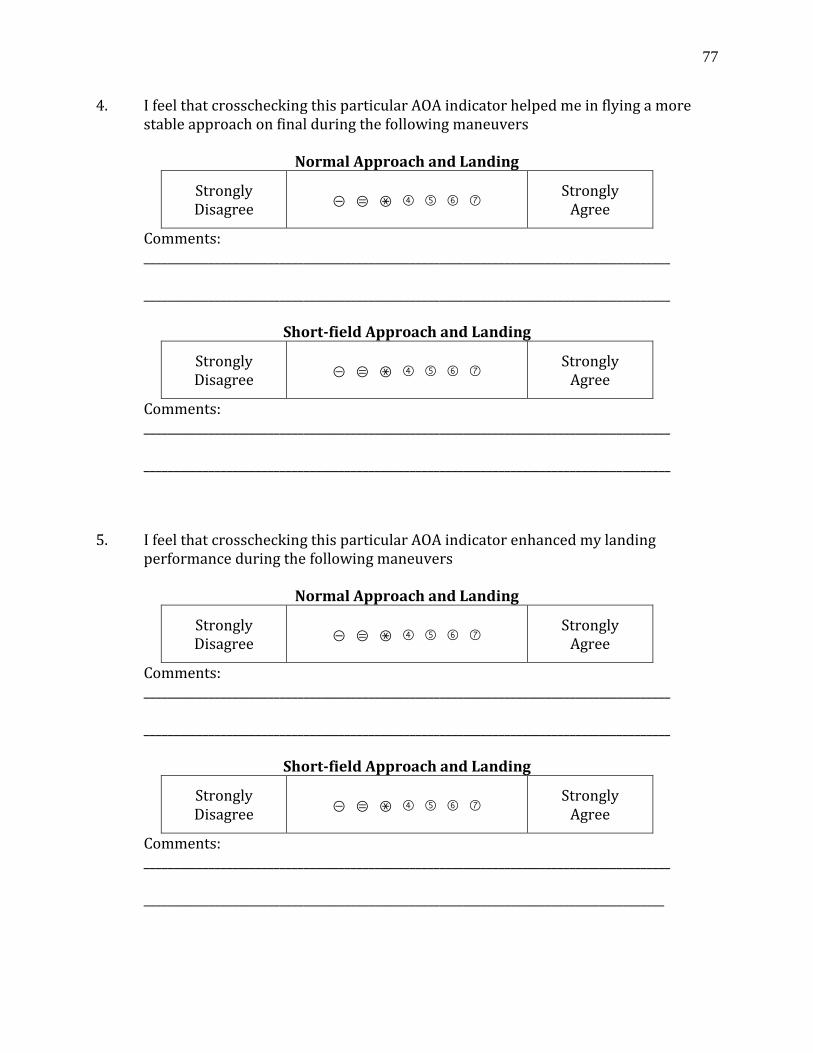
77
4. I feel that crosschecking this particular AOA indicator helped me in flying a more stable approach on final during the following maneuvers
Normal Approach and Landing
Strongly Disagree
① ② ③ ④ ⑤ ⑥ ⑦
Strongly Agree
Comments: _________________________________________________________________________________________
_________________________________________________________________________________________
Short-field Approach and Landing
Strongly Disagree
① ② ③ ④ ⑤ ⑥ ⑦
Strongly Agree
Comments: _________________________________________________________________________________________
_________________________________________________________________________________________
5. I feel that crosschecking this particular AOA indicator enhanced my landing
performance during the following maneuvers
Normal Approach and Landing
Strongly Disagree
① ② ③ ④ ⑤ ⑥ ⑦
Strongly Agree
Comments: _________________________________________________________________________________________
_________________________________________________________________________________________
Short-field Approach and Landing
Strongly Disagree
① ② ③ ④ ⑤ ⑥ ⑦
Strongly Agree
Comments: _________________________________________________________________________________________
________________________________________________________________________________________

78
Instructor Pilots 1. I can see advantages of this particular AOA indicator for training student pilots in
flight
Strongly Disagree
① ② ③ ④ ⑤ ⑥ ⑦
Strongly Agree
Comments: _________________________________________________________________________________________
_________________________________________________________________________________________
_________________________________________________________________________________________
2. I think this particular AOA indicator can improve student’s conceptual
understanding of AOA
Strongly Disagree
① ② ③ ④ ⑤ ⑥ ⑦
Strongly Agree
Comments: _________________________________________________________________________________________
_________________________________________________________________________________________
_________________________________________________________________________________________
3. I would integrate this particular AOA indicator in my training of student pilots
Strongly Disagree
① ② ③ ④ ⑤ ⑥ ⑦
Strongly Agree
Comments: _________________________________________________________________________________________
_________________________________________________________________________________________
_________________________________________________________________________________________

79
4. I think student’s crosschecking of this particular AOA indicator could particularly enhance student pilot training during the following maneuvers
Slow-Flight
Not at all ① ② ③ ④ ⑤ ⑥ ⑦ Extremely
Comments: _________________________________________________________________________________________
_________________________________________________________________________________________
Power-On Stalls
Not at all ① ② ③ ④ ⑤ ⑥ ⑦ Extremely
Comments: _________________________________________________________________________________________
_________________________________________________________________________________________
Power-Off Stalls
Not at all ① ② ③ ④ ⑤ ⑥ ⑦ Extremely
Comments: _________________________________________________________________________________________
_________________________________________________________________________________________
Normal Approach and Landing
Not at all ① ② ③ ④ ⑤ ⑥ ⑦ Extremely
Comments: _________________________________________________________________________________________
_________________________________________________________________________________________
Short-field Approach and Landing
Not at all ① ② ③ ④ ⑤ ⑥ ⑦ Extremely
Comments: _________________________________________________________________________________________
_________________________________________________________________________________________

80
Overall satisfaction 1. Overall I would rate my experience with this particular AOA indicator as:
Worst Imaginable
Awful Poor Fair Good Excellent Best Imaginable
Overall Comments: _________________________________________________________________________________________________ _________________________________________________________________________________________________ _________________________________________________________________________________________________ _________________________________________________________________________________________________ _________________________________________________________________________________________________ _________________________________________________________________________________________________ _________________________________________________________________________________________________ _________________________________________________________________________________________________ _________________________________________________________________________________________________