comparison of the kentucky nutrition education program
TRANSCRIPT

University of Kentucky University of Kentucky
UKnowledge UKnowledge
Theses and Dissertations--Dietetics and Human Nutrition Dietetics and Human Nutrition
2019
COMPARISON OF THE KENTUCKY NUTRITION EDUCATION COMPARISON OF THE KENTUCKY NUTRITION EDUCATION
PROGRAM HEALTHY EATING INDEX PRE- AND POST- TEST DATA PROGRAM HEALTHY EATING INDEX PRE- AND POST- TEST DATA
FOR 2012-2013 FOR 2012-2013
Corey Joe Shepherd University of Kentucky, [email protected] Digital Object Identifier: https://doi.org/10.13023/etd.2019.103
Right click to open a feedback form in a new tab to let us know how this document benefits you. Right click to open a feedback form in a new tab to let us know how this document benefits you.
Recommended Citation Recommended Citation Shepherd, Corey Joe, "COMPARISON OF THE KENTUCKY NUTRITION EDUCATION PROGRAM HEALTHY EATING INDEX PRE- AND POST- TEST DATA FOR 2012-2013" (2019). Theses and Dissertations--Dietetics and Human Nutrition. 69. https://uknowledge.uky.edu/foodsci_etds/69
This Master's Thesis is brought to you for free and open access by the Dietetics and Human Nutrition at UKnowledge. It has been accepted for inclusion in Theses and Dissertations--Dietetics and Human Nutrition by an authorized administrator of UKnowledge. For more information, please contact [email protected].

STUDENT AGREEMENT: STUDENT AGREEMENT:
I represent that my thesis or dissertation and abstract are my original work. Proper attribution
has been given to all outside sources. I understand that I am solely responsible for obtaining
any needed copyright permissions. I have obtained needed written permission statement(s)
from the owner(s) of each third-party copyrighted matter to be included in my work, allowing
electronic distribution (if such use is not permitted by the fair use doctrine) which will be
submitted to UKnowledge as Additional File.
I hereby grant to The University of Kentucky and its agents the irrevocable, non-exclusive, and
royalty-free license to archive and make accessible my work in whole or in part in all forms of
media, now or hereafter known. I agree that the document mentioned above may be made
available immediately for worldwide access unless an embargo applies.
I retain all other ownership rights to the copyright of my work. I also retain the right to use in
future works (such as articles or books) all or part of my work. I understand that I am free to
register the copyright to my work.
REVIEW, APPROVAL AND ACCEPTANCE REVIEW, APPROVAL AND ACCEPTANCE
The document mentioned above has been reviewed and accepted by the student’s advisor, on
behalf of the advisory committee, and by the Director of Graduate Studies (DGS), on behalf of
the program; we verify that this is the final, approved version of the student’s thesis including all
changes required by the advisory committee. The undersigned agree to abide by the statements
above.
Corey Joe Shepherd, Student
Dr. Sandra Bastin, Major Professor
Dr. Alison Gustafson, Director of Graduate Studies

COMPARISON OF THE KENTUCKY NUTRITION
EDUCATION PROGRAM HEALTHY EATING INDEX
PRE- AND POST- TEST DATA FOR 2012-2013
____________________________________
THESIS
____________________________________
A thesis submitted in partial fulfillment of the
requirements for the degree of Master of Science in the
College of Agriculture, Food and Environment at the
University of Kentucky
By:
Corey Joe Shepherd, RD, LD
Lima, OH
Director: Sandra Bastin, PhD, RDN, LD
Lexington, Kentucky
2019
Copyright© Corey Joe Shepherd 2019

ABSTRACT OF THESIS
COMPARISON OF THE KENTUCKY NUTRITION EDUCATION PROGRAM
HEALTHY EATING INDEX PRE- AND POST- TEST DATA FOR 2012-2013
Nutrition education has become a topic of significant concern in today’s society. An area
prominent in the interest of nutrition is the battle against food security. Programs like the
Supplemental Nutrition Assistance Program – Education (SNAP-Ed) is helping to
improve its participants’ food security by providing nutrition education. Kentucky
SNAP-Ed participants were asked to complete a survey and a 24-hour food recall to
evaluate their knowledge in the following areas: Healthy Eating Index (HEI) scores, food
resource management and nutrition practices. Each participant completed an average of
7-12 nutrition education lessons throughout the year. To graduate from the program
participants were required to complete the same survey and food recall, applying
knowledge gained from the program. Responses from 2,868 participants were analyzed
to assess the impact of the SNAP-Ed program. Results demonstrated an improvement of
average post-mean responses in all three areas (p-value < 0.001). In conclusion, this
research supports that those who participated in the 2012 – 2013 SNAP-Ed program
graduated with an overall positive change in nutrition behavior, promoting enhanced food
security in low-income families.
KEYWORDS: Kentucky, SNAP-Ed, HEI, Food Resource Management, Nutrition
Practices
Corey Joe Shepherd, RD, LD
April 18, 2019

COMPARISON OF THE KENTUCKY NUTRITION
EDUCATION PROGRAM HEALTHY EATING INDEX
PRE- AND POST- TEST DATA FOR 2012-2013
By
Corey Joe Shepherd, RD, LD
Sandra Bastin, PhD, RDN, LD
Director of Thesis
Alison Gustafson, PhD, MPH, RD, LD
Director of Graduate Studies
Date: April 18, 2019

ACKNOWLEDGEMENTS
I would like to give a special thanks to those who helped me throughout
this entire process. Dr. Sandra Bastin for providing me with an excellent opportunity to
work alongside some of the most brilliant minds in this field of study. Thank you to my
thesis committee members, Dr. Alison Gustafson and Dr. Dawn Brewer for helping me
complete my master’s degree. Most of all, thank you to my wife who supported me from
the beginning.
iv
TABLE OF CONTENTS
List of Tables……………………………………………………………………………...vi
List of Figures…………………………………………………………………………….vii
Chapter One: Introduction………………………………………………………………...1
Background………………………………………………………………………..1
Purpose…………………………………………………………………………….2
Problem……………………………………………………………………………3
Research Objectives……………………………………………………………….4
Justifications………………………………………………………………………4
Assumptions……………………………………………………………………….5
Chapter Two: Review of Related Literature………………………………………………6
Background………………………………………………………………………..6
Effectiveness of Nutrition Education Programs………………………………......7
Program Challenges………………………………………………………….......11
Food Resource Management……………………………………………………..12
Nutrition Practices……………………………………………………………….14
Chapter Three: Research Methodology………………………………………………….18
Research Design………………………………………………………………….18
Research Questions………………………………………………………………19
Participants……………………………………………………………………….20
Healthy Eating Index…………………………………………………………….20
Procedures………………………………………………………………………..21
Questionnaire…………………………………………………………………….21
24-Hour Food Recall……………………………………………………………..22
Chapter Four: Results……………………………………………………………………23
HEI Scores……………………………………………………………………….25
Pre- and Post- Test Questions...………………………………………………….29
Chapter Five: Discussion………………………………………………………………...37
HEI Findings……………………………………………………………………..38
Pre- and Post- Test Findings……………………………………………………..40
Strengths, Limitations and Future Research……………………………………..48
Conclusions………………………………………………………………………51
Appendix…………………………………………………………………………………52
Definitions………………………………………………………………………..52
Demographics Worksheet………………………………………………………..54
24 – Hour Food Recall Entry…………………………………………………….56

v
24 – Hour Food Recall Exit………………………………………………….......57
Nutrition Education Program ENTRY Level Behavior Checklist……………….58
Nutrition Education Program EXIT Level Behavior Checklist………………….59
References………………………………………………………………………………..60
Bibliography……………………………………………………………………………..66
VITA……………………………………………………………………………………..74

vi
LIST OF TABLES
Table 4.1, Change in HEI Specific Categories…………………………………………..26
Table 4.2, Chi Square Difference between Meal Planning…………..…………………..31
Table 4.3, Chi Square Difference between Healthy, Food…….………………………...34
vii
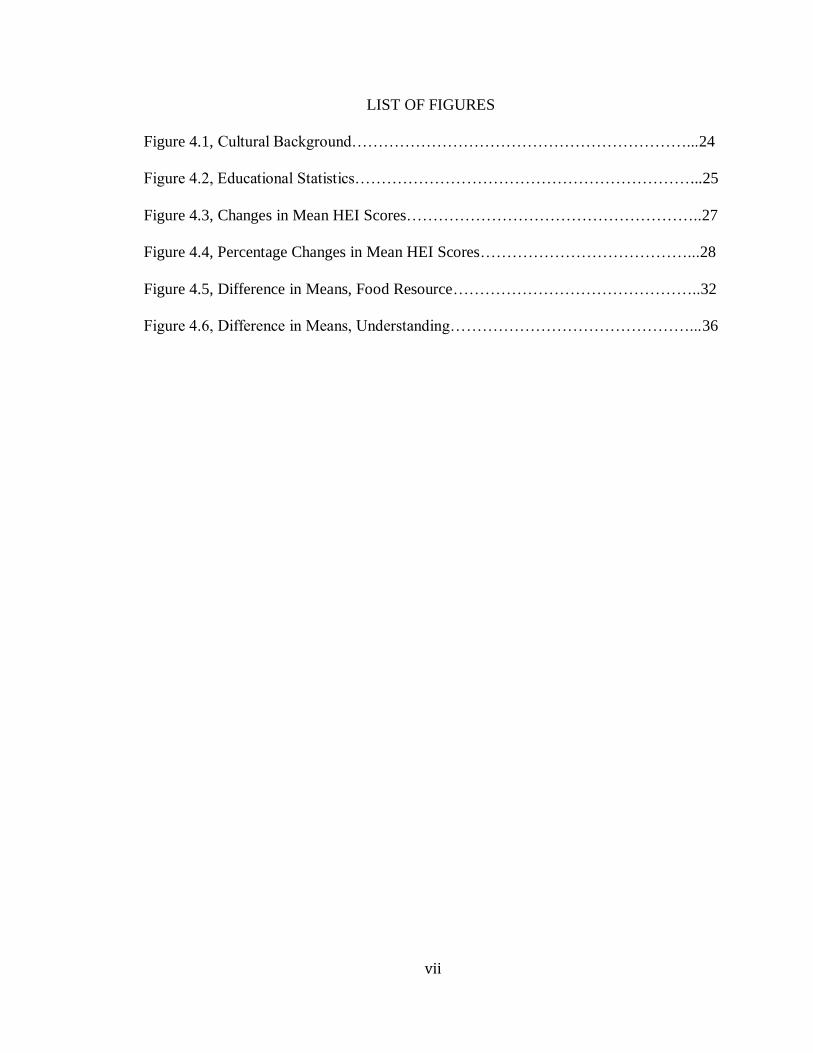
LIST OF FIGURES
Figure 4.1, Cultural Background………………………………………………………...24
Figure 4.2, Educational Statistics………………………………………………………...25
Figure 4.3, Changes in Mean HEI Scores………………………………………………..27
Figure 4.4, Percentage Changes in Mean HEI Scores…………………………………...28
Figure 4.5, Difference in Means, Food Resource………………………………………..32
Figure 4.6, Difference in Means, Understanding………………………………………...36
1
Chapter One
Introduction
Background
Nutrition education has become a topic of significant concern in today’s society.
An area prominent in the interest of nutrition is the battle against food insecurity.
Programs like the Supplemental Nutrition Assistance Program – Education (SNAP-Ed)
are helping improve participant food security through nutrition education. In 2014, the
United States Census Bureau reported 14.8% of all American homes were in poverty,
which equates to 46.7 million Americans (US Census Bureau. 2018). Furthermore,
approximately 21.1 percent of children under the age of eighteen are within the poverty
guidelines (US Census Bureau. 2018). Although there are many other factors that are
incorporated into having access to nutrient dense foods, poverty can be highlighted as one
of the largest contributors to food insecurity. Statistics show one-in-five US children
combat hunger (Feeding America, 2016.) Additional statistics from Feeding America
lists 65% of all Feeding America households reported having Supplemental Nutrition
Assistance Program (formally called Food Stamps) benefits, and 93% of children
participate in the national school lunch program (SLP) (Hunger in Kentucky, 2014).
While food assistance programs have been a great benefit to those who participate
in the programs, many programs lack the time and resources to teach extensive nutrition
education to clients. The country was experiencing sever hunger and federal budget cuts.
As a result, the Food Stamps Act was amended and allowed states to apply for additional
funding. The additional funding provided the development of the SNAP-Ed program,
allowing participants to not only receive nutritional benefits but nutrition education as
2
well. These constraints gave rise to the Supplemental Nutrition Assistance Program –
Education (SNAP-Ed) and the Expanded Food Nutrition Education Program (EFNEP).
The SNAP-Ed program was founded in 1988 by the Wisconsin cooperative extension.
By 2004, all 50 states had adopted the SNAP-Ed program and began educating those at or
below the 185 percent federal poverty level (Dunn, 2013; National Institute of Food and
Agriculture, n.d.).
Both SNAP-Ed and EFNEP use a state and/or federally approved curriculum to
teach a wide range of lessons to qualified participants. Both offer core lessons and
supplemental lessons to address education gaps of participants. Please see Appendix A
for a list of definitions helpful in the better understanding of the program. Core
components include but are not limited to food resource management, nutrition practices,
food safety, meal planning and financial management. Please see Appendix E and F for
the list of questions asked to participants. As participants enter the program, individuals
responsible for offering the training for participants, often referred to as nutrition
education program (NEP) Paraprofessionals, conduct a needs assessment to determine
which lessons will most benefit each participant (koszewski et al., 2011). According to
Kentucky data, the average participant completes nine lessons to graduate with the
necessary skills to improve their lifestyle.
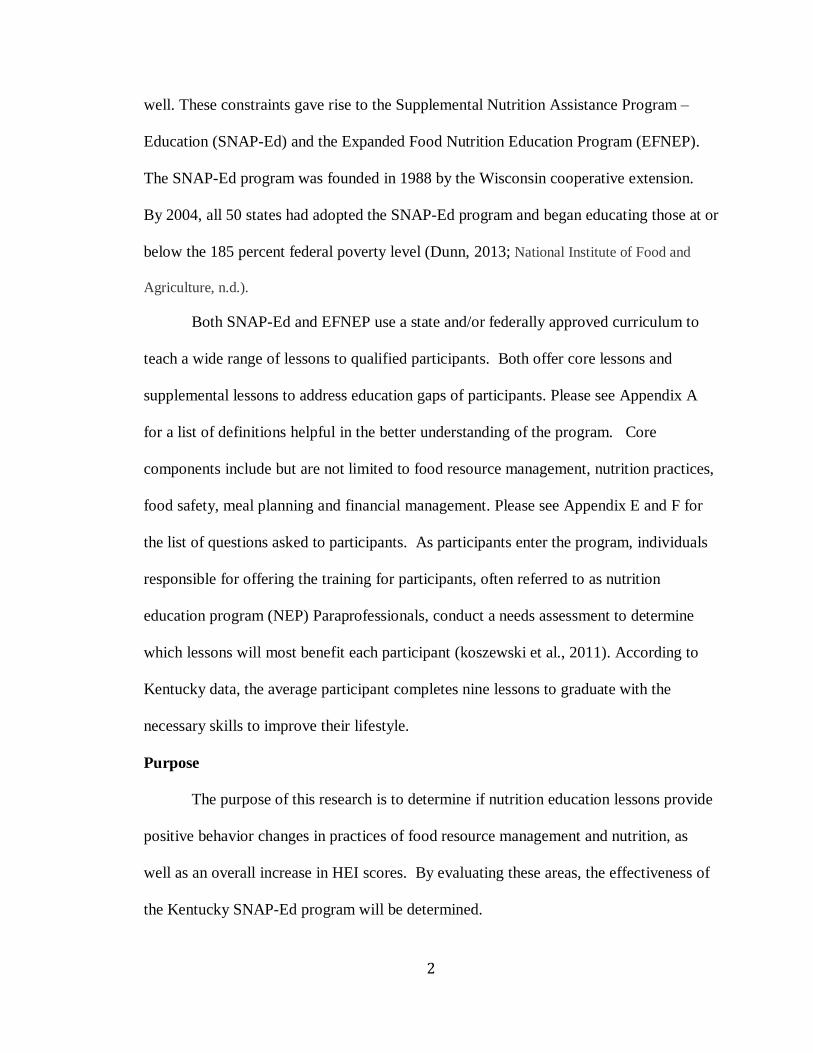
Purpose
The purpose of this research is to determine if nutrition education lessons provide
positive behavior changes in practices of food resource management and nutrition, as
well as an overall increase in HEI scores. By evaluating these areas, the effectiveness of
the Kentucky SNAP-Ed program will be determined.

3
Ultimately, this research will determine if participants experienced a positive
dietary behavior change during their involvement in the Kentucky Snap-Ed program.
The significance of this research indicates the importance of nutrition education within
the state of Kentucky but could be inferred beyond with additional data collection.
Furthermore, this research will contribute to individual communities by providing Snap-
Ed Paraprofessionals an insight into the efficacy of their lessons.
Lastly, the results of this thesis will prove the desired need for the Kentucky
SNAP-Ed programming. While the federal program implementation, has not improved
the hunger and food insecurity issue, this research will support the need for Snap-Ed in
facilitating lasting changes through nutrition education.
Problem
Low-income, Kentucky families typically have fair or poor nutrition, which leads
to a downward tailspin of health-related problems. According to the 2012 Kentucky-
Behavioral Risk Factor Survey, 24% of the citizens of the state of Kentucky reported
their general health as being fair or poor, compared to the 17% national average. This
number has increased from the 22.4% that was reported in the previous year. No
significant differences among the demographics of gender or race were reported
concerning fair or poor health status (KyBRFS, 2012).
In the state of Kentucky, health issues of concern include, but are not limited to,
obesity, diabetes, coronary heart disease and stroke. Forty percent (40%) of those who
reported their health as being fair or poor, indicate that their income is $25,000 or less.
These statistics further indicate the importance of programs like SNAP-Ed and EFNEP
within the state of Kentucky (KyBRFS, 2012).

4
Nutrition impacts the overall wellbeing of an individual and relates to the
reduction in risk of diseases, such as diabetes and obesity. Government funded nutrition
education programs have the potential to help reduce the risks of diseases. These nutrition
education programs are designed to provide nutrition education in order to reduce
nutrition-related education gaps. However, the question still remains; are the lessons
sustaining a permanent behavior change within those who participate in the SNAP-Ed
program? This thesis will seek to determine how effective the Kentucky SNAP-Ed
program is in changing nutrition behavior patterns.
Research Objectives
The objectives of this thesis are:
1. To determine if the Kentucky SNAP-Ed program improved the Healthy Eating
Index (HEI) scores of participants, inferring a positive nutrition behavior change.
2. To determine if the Kentucky SNAP-Ed program provided the participants with a
better understanding in food resource management practices.
3. To determine if the Kentucky SNAP-Ed program provided the participants with a
better understanding of nutrition practices.
Justification
Although SNAP-Ed has been in existence since 1981, no study has been
conducted in the state of Kentucky comparing both the baseline and post-test data in
relation to the HEI scores of those who participated in the program. The conclusion of
this study will determine the Kentucky SNAP-Ed program’s effectiveness in facilitating
behavior change. Furthermore, this thesis will show the importance of public assistance
5
programs and their educational counterparts, to help combat hunger and promote the
consumption of nutrient dense foods.
Assumptions
It is assumed the data collected by the SNAP and EFNEP Paraprofessionals in the
state of Kentucky is accurate. It is also assumed the participants did not falsify their
answers on the forms and gave reliable information – both accurate and precise.
Additionally, the measured data is assumed to not have skewed the statistics within this
study.

6
Chapter Two
Review of Related Literature
This literature review will examine and expand on the background of SNAP-Ed,
past successes the program has experienced and how the program addresses the needs of
its participants.
Background
Research has associated poor health and food quality with limited resources in
low-income populations, having an income cutoff at the 130 percent poverty level (Lin,
2005). According to the 2008 report in the Centers for Disease Control and Prevention,
$147 billion was spent on medical costs related to obesity (Finkelstein et. al, 2009). It
was also reported that no data suggested a difference in obesity rates among men who
had higher education. However, women who had a college education tended to be less
obese than those women who held no college education (Ogden et. al, 2010). Although
SNAP-Ed and EFNEP do not specifically focus on obesity, it does inform its clients on
the importance of mindful eating. The education lessons taught by SNAP-Ed are specific
to the demographics of the participants of the program. Moreover, educating participants
on the importance of nutrition may give rise to mindful eating and increase quality of life.
The required components to complete the Kentucky SNAP-Ed program are set by
the institution itself. This is done because there are no official USDA requirements to
meet in order for a participant to complete or graduate from the program. The USDA
does however, set particular core objectives that must be met for completion of the
program. Teaching the first six lessons and an additional supplemental lesson allows the
participant to become familiar with core components. These guidelines help to ensure the
7
participants have an understanding of the many nutritional components within completion
of the program. The first few lessons that are taught to the participants encompass the
following components: MyPlate, Fruits, Vegetables, Dairy, Protein and Whole Grains
(SNAP-Ed Strategies and Interventions, 2016)
Using core and supplemental components, the SNAP-Ed Program attempts to
change knowledge and behaviors related to diet. The current measurement tools used for
individual behavior changes are the 24-hour recall and behavior checklists. Each of these
tools are adopted and modified at the state level. After the data is collected it is logged
into the web-based Nutrition Education Evaluation and Reporting System or Web-
NEERS for short (Chipman, 2013; National Institute of Food and Agriculture). Once the
data is collected, it is examined and categorized by the answers provided on the checklist
and food provided. Recently NEERS has been updated from a paper format to an
internet-based system, called Web-NEERS. The new Internet database decreases the
amount of time required to input the data. The database also optimizes the availability of
statistical data.
Effectiveness of Nutrition Education Programs
SNAP-Ed and EFNEP use a national curriculum that is adopted by the state and
then implemented by individual county SNAP-Ed Paraprofessional. The curriculum
promotes the USDA MyPlate (previously MyPyramid) and recommendations for eating
balanced meals, weight-loss and increased fruits, vegetables and dairy intake. Behavior
changes are determined by using a behavioral checklist. These checklists are
administered at the beginning of the first SNAP-Ed and EFNEP lesson and again after the
participants have graduated from the program. A participant can graduate with a

8
minimum of six completed EFNEP and SNAP-Ed lessons. However, twelve lessons are
preferred and recommended for graduation (Koszewski, et. al, 2011).
The research conducted by Koszewski and partners (2011) examined the 2007-
2009 SNAP-Ed and EFNEP data to determine if the participants maintained their dietary
behavior changes six-months after graduation. This data was collected by asking the
participants at the beginning and end of their six core lessons to complete a ten-fifteen
question survey. Upon graduating the program the paraprofessionals asked the
participants for their contact information for a follow-up questionnaire. Six months after
the participants graduated the Nutrition Education Program(s) (NEP) the
paraprofessionals sent out the follow up questionnaire. The researcher’s data consisted of
4,400 graduated participants. The NEP paraprofessionals were able to obtain about 25%
of those 4,400 to a follow up questionnaire; n=1,100 participants. The participants were
then asked to complete a follow up questionnaire and return it to the paraprofessional in a
prepaid return letter, which was provided (Koszewski, et. al, 2011).
The results of their findings proved the effectiveness of both programs, SNAP-Ed
and EFNEP, resulting in lasting positive behavior changes. Longitudinal studies in both
SNAP-Ed and EFNEP are important to show the effectiveness of programming. Since
this study had a similar research design with similar research questions and
methodologies, it can serve as the model study for this thesis. Furthermore, the data
collected in this thesis found similar results, aiding in the validation of Koszewski and
researchers’ results.
In a separate study, researchers from the Department of Nutritional Sciences at
Oklahoma State University wanted to determine how to hire the best paraprofessionals.

9
The researchers developed a study using a three-round Delphi methodology to conduct
their study. The sample size consisted of 20 county and 14 state professionals. The
professionals were then asked to rank a series of questions on a scale ranging from 1 to 5,
representing being not important to very important. These questions were asked in three
separate rounds and contributed to the following categories: job attributes, job
competencies prior to hire and job competencies after training (Wakou, 2003).
The results of this study determined that professionals from the county tend to
report personal attributes and job competencies higher than the state professionals. The
thought behind this is due to the professionals from the county wanting to hire
paraprofessionals faster than those at the state level. The implication of this can be used
as a guide when hiring paraprofessionals. Although SNAP-Ed and EFNEP uses an
excellent curriculum to educate its participants, it truly depends on the person delivering
the message. The ability of the paraprofessional to convey the lessons greatly impacts
the success of the program (Wakou, 2003).
Another study examined the benefits of SNAP-Ed and EFNEP participants, as
well as the educators. Auld and researchers (2013) examined if the lessons impacted the
quality of life for both the participants and the educator. The researchers used ANOVA
and ANCOVA to determine the statistical significance of their findings. Using a
longitudinal design, the researchers sampled 128 participants and 16 educators from eight
different states. Each of the participants was given a $10 or $15 gift card for
participating in the program. The researchers measured the Quality of Life (QOL) of the
participants for up to one year after the classes.

10
The findings of this research were significant enough to make the assumption that
both programs did in fact increase the quality of life scores. It was noted in this study
that the QOL of both the participants and the educators were positively impacted up to a
year after the lessons. This leads to the view that SNAP-Ed and EFNEP’s is effective in
other methods of utilization. Moreover, this research study broadens the impression of
SNAP-Ed and EFNEP lessons, impacting the quality of life of the participants and those
who are giving the educational lessons. This is a vital piece of evidence when evaluating
SNAP-Ed and EFNEP data, because many of the paraprofessionals are from the same
area as the participants being educated. So while changing the behaviors of the
participants, the lives of the paraprofessionals are also being enriched as well. (Auld,
2013).
SNAP-Ed and EFNEP paraprofessionals are those who are responsible for
delivering the educational lessons to program participants. Paraprofessionals with an
interest in nutrition and local to the area they will be teaching in, seem to have more
successful families (Dollahite et al., 2003). This aids the paraprofessionals in relating to
the same individuals who they are educating. Additionally, by residing in the community
the paraprofessional would potentially have a greater impact in setting an example within
that population (Wakou, 2003).
According to the April 2003 issue of the Journal of Extension, Nutrition
Education Programs began to change from one-on-one education style to a group delivery
system. This method allows the participant and clients to approach the topic of nutrition
as a team, rather than individually. Additionally, the change to a group setting is safer for
the paraprofessionals and ads to the cost-effectiveness of the program.
11
Cornell researchers Dollahite, Olson and Michelle Scott-Pierce wanted to
determine what appropriate methods and strategies are needed to amplify the
participants’ nutrition education while in a group setting. The researchers used a pre- and
post- test checklist to evaluate behavior changes between two separate sample sizes of
EFNEP participants. Dollahite and others then examined statewide data collected from
the past 3 years, consisting of approximately 17,000 participants. The researchers
subdivided the total participants into two categories, one for the entire state of New York,
and the other consisting of only 14 counties, n=9,523 and n=924 respectively. They then
compared the information to those who reported using either an individual or group
method of delivery for the nutrition education lessons. The researchers concluded, for
both state and selected counties, those who had reported to receive individual rather than
group instruction resulted in having a more significant increase in behavior change
(Dollahite et al., 2003).
Program Challenges
As in many other programs there is always room for improvements in curricula,
which is what researchers Cunningham-Sabo and others investigated in their 2016 Food
and Nutrition Conference and Expo (FNCE) poster project. The researchers examined
EFNEP/SNAP-Ed curricula used for 3rd – 5th grade students. They asked two questions.
1. What were the extent of student cooking experiences? 2. What barriers and support did
students have for being included in EFNEP/SNAP-Ed cooking activities? The in-depth
review of curricula which included nutrition, food safety, food resource management and
cooking/food preparation was conducted. After a review of commonly used curricula
(n=6), researchers determined few participants had experiences with actual cooking

12
and/or safe food handling. Program leaders were also interviewed to evaluate their
understandings with current curricula. A total of 54 surveys, having a 74% response rate,
showed that program leaders wanted 6-8 lessons that addressed grade specific standards,
had evaluation goals and encompassed cooking and tasting activities. (Cunningham-
Sabo, 2016). By incorporating the previously mentioned items in a nutrition curricula no
curricula gap for those who are of low-income status occurs (Cunningham-Sabo, 2016).
Determining how various components are incorporated into a curriculum can help
close the gaps to educational barriers. Because participants in SNAP-Ed lessons are of
low-income households and have different resources available to them, insight into the
needs of curricula target audiences are important. The University of Kentucky’s SNAP-
Ed program has examined other programs allowing for expansion of their own curricula
by integrating cooking and food handling skills.
Food Resource Management
In an article published by the USDA, food insecurity is described as the inability
to afford foods for their family due to not having enough resources (Rabbitt et al., 2017).
Food insecurity accounts for approximately 14.9% (2011) of all US households who have
an income less than the federal poverty level and is associated with inadequate nutrient
intake, poor mental health, increased risk of chronic disease and obesity to name a few
(Hartline-Grafton, 2015; Coleman-Jensen et al., 2016). Some of the issues associated with
US households being food insecure are attributed to poverty levels, having poor access to
education and conflicts with reliable transportation. The Supplemental Nutrition Assistance
Program is one of a few agencies that strive to meet the nutritional needs of low-income
populations by providing monthly monetary benefits for its participants to use at
13
Researches from the University of California at Davis examined the California
SNAP-Ed program called Plan, Shop Save and Cook (PSSC). The closes were created to
educate its participants in resource management. Kaiser and others then studied the pre
and post-evaluation from the year 2011 – 2013 and determined the average food resource
management scores (RMS), and running out of food (ROM) indicators. The four
categories of the RMS were planning meals, using a list, comparing prices, reading
labels, thinking about healthy choices, and eating varied meals. The RMS was evaluated
by asking participants to complete a frequency ranging from never to always, having a
range from “0” to “4”. Kaiser and others used Pearson’s chi square to evaluate the
differences between both years the program was piloted, financial years (FY) 2011 –
2012 and 2012 – 2013. The total of participants were n = 1,371 and n = 2,371
respectively. Once the researches compiled their results a chi square test was conducted
(Kaiser, et. al, 2015).
SNAP participants experienced an improvement in the mean RMS and ROF
scores compared to non-SNAP participants, P < 0.001. The authors additionally noted it
can be difficult measuring the long-term application on the PSSC program and other
programs alike. Lastly, the PSSC and SNAP-Ed programs did demonstrated a positive
correlation between purchasing more nutritious foods before and after nutrition lessons
were offered. The results from Kaiser and others will be used to further defend the
positive correlation found in this thesis (Kaiser, et. al, 2015). This shows the importance
of not only access to food, but the knowledge of what to do with it (Leung et al., 2013).

14
Nutrition Practices
In 2014, researchers from the University of Georgia examined the relationship of
SNAP-Ed participants who reported having a high weight status, weight perception and
weight management practices. The researchers used a convenience sample of Georgia
SNAP-Ed Food Talk participants who underwent six lessons. All six lessons were taught
by paraprofessionals in urban areas of Georgia. The Food Talk participants were asked
to complete a pre and post – evaluation. They were asked to record their height and
weight, and report any attempts at weight loss. Researchers then calculated the
participants’ BMI for comparison and found the difference in means of BMI and
percentage of weight loss methods, respectively.
Approximately 31% of the participants had recorded being overweight and 42%
as obese. Bailey and Lee noted 60% of all participants exactly recorded their perceived
weight, while only 39% of overweight participants correctly perceived themselves as
being overweight. Nearly 76% of overweight participants reported using both exercise
and diet in their past weight loss attempts, which differs from the 53% of obese
participants who also used both strategies. The researchers determined those who were
overweight and accurately represented themselves were three-times likely to use both diet
and exercise to lose weight (P = 0.04). It was also noted those who accurately perceived
themselves as being overweight/obese were significantly more likely to combine both
methods to achieve weight loss (P < 0.001).
The insight this study provides to those working in a community setting is
exceedingly valuable. Bailey and Lee’s research explains the correlation between self-
perception of body awareness and the willingness to lose weight. This information can

15
be applied to this research paper by relating the findings to some of the barriers a SNAP-
Ed paraprofessional may experience while working with participants. Ultimately, the
success of weight loss might not exclusively depend on the quality of the lessons and
teaching styles, but how a person psychologically perceives their body image.
Furthermore, it may benefit the SNAP-Ed program to incorporate these findings into its
curricula to increase its effectiveness.
Researchers in 2016 Molitor and others conducted a study examining low-income
mothers living in areas in-range of a SNAP-Ed program, and how it relates to the
consumption of fruits, vegetables and fat, and the intake of sugar-sweetened beverages.
An automated self-administered telephone survey was conducted to gather participants’
24 – hour food recall (ASA24). The participants were also mailed reinforcement items
and a booklet on serving sizes; future phone calls referenced these materials during the
conducting of this study. The ASA24 did not include any identifying participant
information, however the participants could provide their information if desired. The
participants were sent nutrition education and reinforcement items through the mail
(Molitor et. al, 2016). The SNAP-Ed intervention was determined by using a census tract
among all 6,355 low-income mothers. The total number of participants ranged between
the ages of 6 – 65, n = 2,907. The participant data was then separated into no/low,
moderate and high reach groups (Molitor et. al, 2016).
The results published my Dr. Molitor and others suggested a positive correlation
between of low-income mothers who consumed fruits, vegetables and fat, and the intake
of sugar-sweetened beverages and who lived near SNAP-Ed programs. A 1-way ANOVA

16
was preformed and these were the following p-values for fruits and vegetables, high fat
foods and sugar-sweetened beverages, P < 0.1, P < 0.1, P < 0.5 respectively.
It was noted in the article that a positive behavior change did occur between the
Dietary Behavior categories – fruits, vegetables, high-fat and sugar-sweetened beverages.
However, it was noted in the study there was no true correlation between living in
proximity to a SNAP-Ed program and having an overall increase in HEI scores (Molitor
et. al, 2016). This study is an excellent representation of how individual sections of diets
are influents by the SNAP-Ed program, even if their HEI scores were not completely
effected by the SNAP-Ed program.
In a study lead by researchers Cullen and others, the impact of goal setting
amount low-income women who participated in Texas EFNEP classes were examined. A
total of six classes were taught, and after each class the participants were asked to
complete weekly goal sheets. Researchers were interested in measuring the participant’s
autonomous behavior changes through their own goal setting (Cullen, 2010). The
researchers used past research collected by Cullen and others to compare previous
intervention information to use in the follow-up data collection. The researchers
determined those how had a higher goal attainment also had a greater improvement in
fiber consumption and low fat/fat free milk intake, and had a lower consumption of fruit
juice and water, lastly the regular intake of vegetables stayed constant (Cullen, 2010).
Although researchers Cullen and others were only examining the participant’s
goal attainment, the data does elude to participants having an overall positive correlation
with food intake post EFNEP lessons. Participants showed having a 39.2% achievable
goal to increase fiber intake, and a 59.8% achievable goal in shopping smart (Cullen,

17
2010). While this thesis uses HEI scores to compare the nutrition practices of pre- and
post- test data of SNAP-Ed participants, the research conducted by many of these
scholars contains very similar methodologies and have relatable findings.

18
Chapter Three
Research Methodology
The purpose of this study is to determine if those who participated in the
Kentucky SNAP-Ed programs showed signs of behavior change upon completion of the
program. By using the previously collected (2012 – 2013) data, a series of statistical tests
was used to determine the efficacy of the program. This thesis uses a cross-sectional,
retrospective format for the design of this study. Baseline and post-test results, along
with the computed HEI scores, were examined in order to determine the effectiveness of
the Kentucky SNAP-Ed program.
Questions from the pre and post - evaluation checklist were used to determine
meal planning and nutrition practices. The behavior checklists measure the change in
HEI scores. Using the HEI method to evaluate food consumption make computing the
diet recalls more effective.
Determining the HEI scores of those who participated in the NEP lessons will
prove the effectiveness of nutrition education within the state of Kentucky. Moreover, it
can be determined if NEP lessons are effective in facilitating dietary behavior changes.
This information will be useful in determining the success of the SNAP-Ed program
within the state of Kentucky and lay the groundwork for future lessons.
Research Design
The University of Kentucky’s Institutional Review Board gave its permission to
use the 2012 – 2013 SNAP-Ed data for the use of this thesis. This thesis used
quantitative data with a pre-and post-test design. The research design allowed the
investigator to compare data sets to evaluate the research objectives. The baseline
19
questionnaires were administered by the SNAP-Ed paraprofessional to each of the
participants in the SNAP-Ed class. This was done during the first SNAP-Ed class. Once
the participant(s) met the minimum core competencies, on average this was by the ninth
class, a second questionnaire was administered. If the participant then decided to leave
the class at that time, the paraprofessional would then have enough data to graduate the
participant from the program. A total of 2,868 pre-and post-test questionnaires were
collected and examined. The data used in this thesis contains no identifying markers and
is therefore protective of personal information.
Research Questions
The following questions were formulated in order to meet the previously stated
research objectives. Please see Appendix B through F for an exact copy of the
demographics, pre and post survey, and 24 – hour food recall used within this study.
1. Does SNAP-Ed lessons improve the participant’s HEI scores after participation?
a. Determined by the use of HEI scores, acquired from baseline and post-
intervention dietary recalls
2. Did the lessons provide the participants with a better understanding in food
resource management practices?
a. Determined by using baseline and post-intervention checklists (Questions 1,
2, 3, 4)
3. Did the lessons provide the participants with a better understanding of nutrition
practices?
a. Determined by using baseline and post-intervention checklist (Questions 7,
8, 9, 10)
20
Participants
The sample populations are those who participated in NEP classes and who have
completed both the pre- and post- test diet recalls as well as the pre- and post- test
checklist. The sample population is from the state of Kentucky and contains no
identifying markers. Each participant must complete all core requirements, on average
nine classes, before they can complete the program. The complete data set included
4,982 participants, however not all participants answered both the entry and exit
questions. After all exclusions were made, there were 2,868 participants who
participated in this study.
Healthy Eating Index
According to the United States Department of Agriculture, the HEI is defined as
“a measure of diet quality that assesses conformance to federal dietary guidance”
(Healthy Eating Index, 2015). The practical use of the HEI system in this thesis is to
determine the quality of the foods being consumed by those of low-income populations
(Guenther, 2012). The HEI system is conducted every five years by the USDA and the
US Department of Health and Human Services (DHHS) and was last updated in 2005.
This updated HEI score is now used in the Healthy People 2010. (New NCCOR, 2013)
The total HEI score is comprised of twelve different dietary components, totaling
to 100 in value. Each component is assigned a value that contributes to the overall HEI
score. These averaged values are a weighted mean, thus the reasoning behind some
variables given a “5” “10” or “20” in value. Fruits, vegetables, and protein is given a
value of 5, whereas dairy and whole grain consumption is given a value of 10 (Guenther

21
et al., 2005; Basiotis, 2002). Once the data is computed for the sample population, a
percentage can then be calculated. For example, in 2002 the USDA published a report
card on the quality of American’s diet and examined the diet quality for children between
the ages two and seventeen; one of the HEI scores determined in that study was a 4.0 for
“Total Fruits”. After taking the “obtained” HEI score and dividing by the “given” HEI
score, a total of 80% is obtained (Report Card on the Quality of Americans’ Diets, 2002).
Researchers Guenther and others describe the following ranges as having a good diet,
needs improvement or poor diet; 80% - 100%, 51% - 80%, 0% - 51% respectively
(Guenther et al., 2005; Basiotis, 2002).
Procedures
The procedures used in this research include using a demographics-evaluation
sheet, a diet summary and a questionnaire, in the form of a checklist. Each of these items
are currently being used by, both, SNAP-Ed and NEP. The data is entered into a web-
based reporting systems knows as Nutrition Education Evaluation and Reporting System
(NEERS). This reporting system assures the diet recalls and checklists are accurate, and
effective, in monitoring nutrition behavior within those participants. Demographic
information was collected by the paraprofessionals, but the data received to conduct this
study had no identifying markers. Please see Appendix B for and exact copy of the
demographics questions used within this study.
Questionnaire
The questionnaire includes two sections. The first sets of questions asked on the
checklist are based on a national evaluation system. These questions are twelve in total,
and inquire the following: meal planning, food safety and nutrition practices. The second

22
sets of questions are five in total, and are supplementary, statewide inquires. The
questionnaire uses a Likert scale to measure participant answers. This scale ranges from
zero to five consisting of six distinctive answers to select from. These ranges are from
Non Applicable (N/A) to Almost Always. The following questions represent the
participants’ understanding in food resource management: “How often do you plan meals
ahead of time?” “How often do you compare prices before you buy food?” “How often
do you run out of food before the end of the month?” “How often do you shop with a
grocery list?” Please see Appendix E and F for the exact copy of the questionnaire used
in this study.
24-Hour Food Recall
In addition to the checklist, a 24-hour food recall is used in order to monitor
behavior change. The 24-hour food recall helps determine the HEI scores based from the
food previously reported. The food recall inquires all of the food consumed in a 24-hour
period of time: from breakfast to dinner, including snacks. Please see Appendix C and D
for the exact copy of the diet recall used in this study.

23
Chapter Four
Results
This thesis used the software R-Studio and STATA, and Microsoft Office: Excel to
conduct the statistical analysis for this project (RStudio Team, 2016; StataCorp, 2017). It
is assumed all information within this section uses accurate data to base its findings.
After refining the number of participants within this study, the sample size consisted of
SNAP-Ed participants (n=2,868) for the state of Kentucky, between the years of 2012
and 2013. Out of the 2,868 participants, 2,232 were female and 634 were male and had
an average age of 43.5, ranging between the ages of 28 and 60. A mean of nine lessons
were conducted, ranging from 7 – 12 lessons per individual. The average monthly
household-income was between the ranges of $500 and $1,050 and had a mean of
$822.80 per month. A total of 64 women reported being pregnant during the time of the
lessons and eight reported breastfeeding.
The following pie chart depicts the ethnic demographics of the sample population.

24
Figure 4.1 – Cultural Background
As shown in the above chart, most of the participants were comprised of
Caucasian and African American, 91.5% and 6.3%, respectively. These statistics match
that of national data for the state of Kentucky. According to the US 2010 Census,
approximately 88% of Kentucky’s population reported being Caucasian and 8% reported
being African American (U.S. Census Bureau QuickFacts: Kentucky (2010).
The following chart depicts the educational demographics for the 2,868
participants.
91.5%
6.3%
1.8%0.5%
0.3%
Caucasian (91.5%)
African American (6.3%)
Hispanic (1.8%)
Other (0.5%)
Not Provided (0.3%)

25
Figure 4.2 - Educational Statistics
As depicted in Figure 4.2, 1,542 (53.8%) of the participants had either a high
school education or lower. This demographical statistic, paired with the household
income, is an accurate reflection of the SNAP-Ed’s target audience. Furthermore, is can
be assumed those 256 (8.9%) participants who reported having “Some College” were
either currently in college or had dropped out at some point. Lastly, approximately 536
(18.7%) participants had actually completed a college degree. Although college educated
participants are not the SNAP-Ed program’s target population, it does not mean they are
not financially stable. These participants may have similar needs as those of lower-
educational status.
HEI Scores
This section examines the data collected from the participant’s mean HEI scores
in the following areas: Total Fruits, Total Vegetables, Dairy, Protein and Whole Grains.
These HEI scores were selected for measurement because they fall within the first six
core lessons taught by the SNAP-Ed classes. These six classes encompass the following
constituents: Overview of USDA MyPlate, Fruits, Vegetables, Dairy, Protein and Whole
30.4%
23.4%18.6%
13.4%
8.9%
4.1% 1.2%
Grade 12 or GED
Lower than Grade 12
Not Supplied
2 Years of College
Some College
College Graduate
Post-Graduate

26
Grains. The baseline mean score was compared to the post-intervention mean score,
resulting in either an increase or decrease in an overall HEI Score for that category.
Again, a mean of nine lessons were conducted, ranging between seven and twelve
lessons.
The following statistics were calculated using the following variables, fruits,
vegetables, diary, protein, and whole grains. Pearson’s Chi Square test was conducted to
determine if the data was statistically significant in improving HEI scores within the
2013-2014 SNAP-Ed participants. Pearson’s Chi Square was used to for two reasons; the
first being due to multiple environmental factors at play between the beginning and end
lesson; second was stratifying the data to more evenly distribute. A paired t-test was then
used to determine if the change in pre- and post- test means were significant in their
changes. The following tables and figures depicts those changes.
Table 4.1 – Change in HEI Specific Categories
Mean HEI Scores
Category Pre Test (SE) Post Test (SE) Difference (SE) X2 p-value
Fruits 1.46 (1.39, 1.53) 2.71 (2.63, 2.79) 1.24 (1.15, 1.34) < 0.0001
Vegetables 3.07 (3.01, 3.14) 3.64 (3.59, 3.71) 0.57 (0.49, 0.65) < 0.0001
Dairy 4.54 (4.14, 4.68) 5.98 (5.85, 6.12) 1.44 (1.26, 1.61) < 0.0001
Protein 7.88 (7.77, 7.99) 8.40 (8.30, 8.5) 0.52 (0.37, 0.66) < 0.0001
Whole Grains 0.87 (0.82, 0.93) .89 (0.84, 0.94) 0.01 (-0.05, 0.08) < 0.72

27
As shown in Table 4.1, the mean entry and mean exit data points were all
statistically significant for the exception of whole grains. The standard deviations can be
seen in the parenthesis to the right of the average means. For most variables there was a
noticeable difference in average mean values with having an x2 p-value < 0.0001, for the
exceptions of the whole grains category.
Figure 4.3 illustrates these changes in average mean scores.
Figure 4.3 - Changes in Mean HEI Scores
The above graph illustrates the comparison of pre- and post-test mean HEI scores.
A paired t-test was used in comparing the mean values, t-test p-value < 0.001. The pre-
and post- test mean values are depicted in the above graph. The following changes in the
pre- and-post-test, mean HEI scores were determined: Fruit Intake (1.46 to 2.71),
Vegetable Intake (3.07 to 3.64), Dairy Intake (4.54 to 5.98), Protein Intake (7.88 to 8.4),
0
1
2
3
4
5
6
7
8
9
10
Fruits Vegetable Dairy Protein Whole
Grains
HE
I S
core
Categories
Pre Test
Post Test

28
Whole Grain Intake (0.87 to 0.89). These numbers represent an overall increase in diet
quality for the represented variables. A paired t-test was used to determine if the variation
in mean values was statistically significant, t-test p-value < 0.001. To further explain the
significance of these values, they must first be divided by the total points possible. A
percentage is then given to each category. The following math was used to determine
these percentiles; mean value divided by HEI upper range multiplied by 100. For
example, pre-test mean for fruits was 1.46 divided by an HEI score of 5, then multiplied
by 100, 29.2% meaning that section of the diet is in the poor diet range. The same
calculations were done for the all HEI datasets and is represented in Figure 4.4.
Figure 4.4 - Percentage Changes in Mean HEI Scores
The total HEI score is calculated from all twelve categories and ranked from the
following ranges: 80% or greater represents a high quality diet, 51% - 80% represents
improvement, and below 50% represents poor diet quality. Although each of the HEI
Fruits Vegetable Dairy ProteinWhole
Grains
Pre Test 29% 61% 45% 158% 9%
Post Test 54% 73% 60% 168% 9%
0%
20%
40%
60%
80%
100%
120%
140%
160%
180%
HE
I S
core
Per
centa
ges
Category
29
categories is not calculated in this study, a similar approach can be taken to calculate the
average in each category.
The Fruit Intake section of this chart shows an increase from 29% to 54%,
meaning before the participant had undergone the program their diet was of poor quality
and later advanced to the needs improvement classification. Similar outcomes occurred
in the vegetable and dairy categories, increasing from 61% to 73%, and 45% to 60%
respectively. These changes kept the vegetable category in the needs improvement
classification, but raised diary from poor diet to needs improvement classification. The
percentage of the protein category was about 1.5 times that of recommended percentages,
but also increased in number, from 158% to 168%. Lastly, the whole grains diet section
did not change in percentages and staying in the poor diet category. While these values
are not statistically proven to be an exact representation of the participant’s quality of
diet, they still prove to show increases in diet quality within those particular variables.
Pre- and Post- Test Questions
This section will examine the pre- and-post-test questions given to the participants
prior to receiving the nutrition education intervention and upon completion of the
program. The questions given to the participants were scored on a scale of 0 – 5,
representing the following answers: N/A, Never, Seldom, Sometimes, Most of the Time,
and Almost Always.
The following questions represent the participant’s understanding in food
resource management: “How often do you plan meals ahead of time?” “How often do
you compare prices before you buy food?” “How often do you run out of food before the
end of the month?” “How often do you shop with a grocery list?” Again, the average

30
number of lessons taught to the participants was nine in total.
Each of the variables in the pre- and post- test surveys were set to evenly
distribute and given a High, Medium, Low range. These were acquired by giving the N/A
and Never a value of “0” and “1” respectively and calling that a Low range. The same
was done for Seldom and Sometimes, “2” and “3”, and Most of the Time and Almost
Always, “4” and “5”. Once evenly distributed, the data could then have a Pearson’s Chi
Square test preformed to generate a frequency table to show how many participant’s
responses improved, stayed the same or decreased.
Again, Pearson’s Chi Square test was conducted to determine if the data was
statistically significant in improving food resource management and nutrition practices
within the 2013-2014 SNAP-Ed participants. Similarly, Pearson’s Chi Square was used
to for two reasons; the first being due to multiple environmental factors at play between
the beginning and end lesson; second was stratifying the data to more evenly distribute.
A paired t-test was then used to determine if the change in pre- and post- test means were
significant in their changes. The following tables and figures depicts those changes.

31
Table 4.2 – Chi Square Difference between Meal Planning, Price, Running out of
Food and Shopping, Pre-and Post-Test Data
Question Post-Test, n
Low Medium High x2 p-value
How often do you plan
meals ahead of time? Pre-Test, n
Low
Medium
High
65
43
6
316
651
86
200
879
622
< 0.001
How often do you
compare prices before
you buy food?
Pre-Test, n
Low
Medium
High
50
20
18
192
295
104
193
702
1294
< 0.001
How often do you run
out of food before the
end of the month?
Pre-Test, n
Low
Medium
High
920
471
101
137
784
238
23
77
117
< 0.001
How often do you shop
with a grocery list? Pre-Test, n
Low
Medium
High
92
42
28
210
419
108
235
753
981
< 0.001

32
As depicted in Table 4.2, participants in the Low-Low, Medium-Medium, and
High-High category fell into the same group from both pre- and post- test results.
Reading from the left of the table those participants either improved, decreased or stayed
the same. Similarly, reading from the top of the chart downwards participants could
improve, decrease or stay the same. For example, in the question “How often do you
plan meals ahead of time?” the pre-test participants in the Low-Low (n = 65) categories
improved their results to the Low-High (n=200), x2 p-value < 0.001. When conducting a
paired t-test there is an observed increase in overall mean values. Figure 4.2 illustrates
the difference in average means of questions in the Food Resource Management section
of the questionnaire.
Figure 4.5 – Difference in Means, Food Resource Management Questions
As represented in Figure 4.5, the pre-test mean value are shown in the dark-blue
columns and the post-test mean values are depicted by the light-blue columns. A paired
t-test was used in comparing the mean values. Upon completion of the SNAP-Ed
Plan Price Out of Food Shop List
Pre Test 2.672 3.268 2.211 3.003
Post Test 3.629 4.074 1.786 3.85
0
0.5
1
1.5
2
2.5
3
3.5
4
4.5
Mea
n R
espo
nse
s
Category

33
program, participants showed an increase in the following: meal planning (2.672 to
3.629), comparing food prices (3.268 to 4.074) and using a list prior to shopping (3.003
to 3.85), paired t-test p-value < 0.001. Additionally, all of the participants showed a
decrease in running out of food at the end of the month (2.211 to 1.786), paired t-test p-
value < 0.001. The interpretation of this data shows an improvement in all areas of the
food resource management area, rejecting the null hypothesis and accepting the proposed
research question.
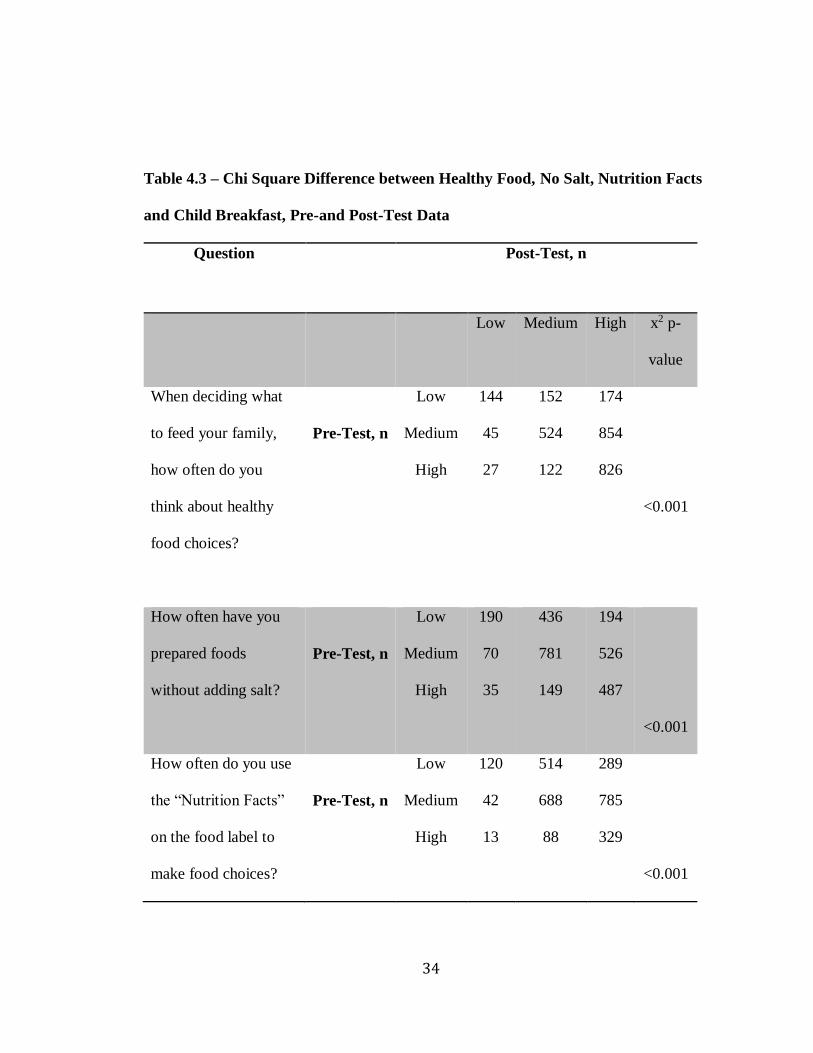
The following questions represent the participant’s understanding of nutritional
practices: “When deciding what to feed your family, how often do you think about
healthy food choices?” “How often have you prepared foods without adding salt?”
“How often do you use the Nutrition Facts on the food label to make food choices?” and
“How often do your children eat something in the morning within two hours of waking
up?” Table 4.3 illustrates these findings.
Again, each of the variables in the pre- and post- test surveys were set to evenly
distribute and given a High, Medium, Low range. These were acquired by giving the N/A
and Never a value of “0” and “1” respectively and calling that a Low range. The same
was done for Seldom and Sometimes, “2” and “3”, and Most of the Time and Almost
Always, “4” and “5”. Once evenly distributed, the data could then have a Pearson’s Chi
Square test preformed to ensure the data’s variables reflected a true p-value of
statistically significant value.
34
Table 4.3 – Chi Square Difference between Healthy Food, No Salt, Nutrition Facts
and Child Breakfast, Pre-and Post-Test Data
Question Post-Test, n
Low Medium High x2 p-
value
When deciding what
to feed your family,
how often do you
think about healthy
food choices?
Pre-Test, n
Low
Medium
High
144
45
27
152
524
122
174
854
826
<0.001
How often have you
prepared foods
without adding salt?
Pre-Test, n
Low
Medium
High
190
70
35
436
781
149
194
526
487
<0.001
How often do you use
the “Nutrition Facts”
on the food label to
make food choices?
Pre-Test, n
Low
Medium
High
120
42
13
514
688
88
289
785
329
<0.001

35
How often do your
children eat something
in the morning within
2 hours of waking up?
Pre-Test, n
Low
Medium
High
1424
66
122
34
41
35
140
215
791
<0.001
As previously discussed, Table 4.3 depicts participants in the Low-Low, Medium-
Medium, and High-High category fell into the same group from both pre- and post- test
results. Reading from the left of the table those participants either improved, decreased
or stayed the same. Similarly, reading from the top of the chart downwards participants
could improve, decrease or stay the same. For example, in the question “When deciding
what to feed your family, how often do you think about healthy food choices?” many of
the pre-test participants who were Medium-Medium (n = 524) categories improved their
results to the Medium-High (n=854), x2 p-value < 0.001. When conducting a paired t-test
there is an observed increase in overall mean values. Figure 4.6 illustrates the difference
in average means of questions in the Food Resource Management section of the
questionnaire.

36
Figure 4.6 – Difference in Means, Understanding Nutritional Practices Questions
The pre-test mean value is shown in dark blue and the post-test mean value is
represented by the light blue columns. Upon completion of the SNAP-Ed program,
participants showed an increase in the following: healthy food choices (2.901 to 3.627),
avoidance of adding salt (2.506 to 3.205), use of nutrition facts label (2.31 to 3.415), and
children eating in the morning (1.893 to 2.052). Again, a paired t-test was used in the
comparison of the baseline and post-intervention average mean values showing statistical
significance, have a p-value < 0.001. The interpretation of this data shows an
improvement in all areas of the participant’s understanding of nutritional practices,
rejecting the null hypothesis.
Healthy No Salt Food Label Child Eat
Pre Test 2.901 2.506 2.31 1.893
Post Test 3.627 3.205 3.415 2.052
0
0.5
1
1.5
2
2.5
3
3.5
4
4.5
Mea
n R
espo
nse
s
Category

37
Chapter Five
Discussion
This study was designed to determine if the Kentucky SNAP-Education classes
resulted in positive behavior changes. The changes in behavior were measured by the use
of three objectives. The first objective that will be covered is increase in the participant’s
post-intervention HEI scores. As depicted in the data, it was determined that the
participants had a statistically significant increase in the following HEI categories; Fruits,
Vegetables, Dairy, Protein. This was shown by having an overall increase in their HEI
scores x2 p-value > 0.0001. However, the Whole Grains category did not experience an
improvement x2 p-value > 0.72. Although an overall increase in the participant’s HEI
score was expected, it was not expected that all categories would increase.
The second objective looked at questions one through four on the questionnaire
and asked if SNAP-Ed lessons provided the participants with a better understanding in
food resource management practices. Please see Appendix F and G for a list of those
questions. Each question was directed toward shopping on a budget, determining if the
nutrition education lessons impacted the participant’s ability to make their food dollars
last throughout the month. The importance of this question is reflective of the population
as a whole and impacts communities at large. Although programs like SNAP give
participants funds to buy food, many of those participants do not fully understand the
type of preparation required to properly use their food dollars. Which is why this
objective is a vital piece of this study.
Skills in food resource management not only impact the individual participant but

38
the community as a whole. It begins at home, making food dollars last longer so the
participant can feed their family more cost effectively. However, this principle can also
be applied to the entire community. If the family is no longer spending excessive
amounts of money on food, they can then apply those funds to other things like
education, transportation and other needs. This will potentially better the participant’s
prosperity and ultimately the community.
The third and final objective asked, if the lessons provided the participants with a
better understanding of nutrition practices. This objective looks at questions seven
through ten of the questionnaire and exclusively focuses on the participant’s nutrition
knowledge and practices. Three of the four questions ask what types of nutrition
decisions the participants are making, and the last question is in regards to a child feeding
practice. The importance behind these questions signifies how well the participants truly
understand nutrition practices.
The SNAP-Ed program is designed to teach the participants how to properly use
the food that is provided by other supplemental nutrition agencies. Other agencies supply
participants with food but provide them with very little nutrition education. Although
SNAP-Ed is not the issuing agency of the benefits, they do provided many nutritional
lessons for the participants.
HEI Findings
1. Positive Changes in HEI Scores
The first research question asked in this study was, “Do SNAP-Ed lessons
improve the participant’s HEI scores during, and after participation?” This question is
important in understanding the relationship between the participants and their nutrition
39
and if the participants are putting their knowledge into practice. After reviewing the data,
it was determined that the participants had a statistically significant increase in the
following categories, Fruits, Vegetables, Dairy, Protein, and Whole Grains.
In the Fruits category, participants had an 85.6% increase in diet quality post –
intervention, P < 0001. This percentage was a significant increase in the consumption of
fruits and is important due to the benefits fruits provide in the prevention of chronic
disease (Boeing et. al., 2012). Before the participant had undergone the program their
diet was of poor quality and later advanced to the needs improvement classification. In
regards to the Vegetables category, participants experienced 18.6% increase in vegetable
consumption. Although this percentage increase does not appear to be plentiful in
difference, it is statistically significant, P < 0.001. Because many Americans do not eat
enough fruits and vegetables in their diet (Molitor et al., 2016), there is a great need to
encourage their intake. Both increases in the fruits and vegetable categories are
representative of the effectiveness of the Kentucky SNAP-Ed program. These increased
percentages might not have occurred if the 2012 - 2013 KY SNAP-Ed program did not
facilitate the foundational classes to its participants.
The Protein, Dairy and Whole Grains sections experienced similar results.
Participants experienced a 6.6% increase in protein consumption, giving participants
more protein than needed. The amount of protein being consumed was higher than the
required daily amount prior to the SNAP lessons. However, the increase in total protein
consumption could be linked to the received nutrition classes. The core classes often
teach to consume protein with every meal and with each snack. It is possible that the
participants applied this information to their current eating habits, thus increasing the
40
amount of protein within their current diet. It anticipated if the lessons progressed with
the comparisons of additional diet recalls, this percentage would decrease to within a
normal range. The Dairy and Whole grains section were examined. Dairy consumption
faced a 31.7% increase in average mean values, elevating the mean participant HEI score
from the poor diet to the needs improvement categories. Lastly, the whole grains section
increased by only 2.3%, and was not statistically significant x2 < 0.72.
The data collected and analyzed from the 2012 – 2013 Kentucky SNAP-
Education program, proves the program is effective in producing behavior changes in the
following HEI score categories: fruits, vegetables, protein, whole grains and dairy.
SNAP-Ed makes excellent teaching points in their lessons and also provides
reinforcement items to help encourage behavior changes. Some of the reinforcement
items include vegetable peelers and scrubbers, calendars, recipe books with examples,
just to name a few. The program also offers food demonstrations, grocery store tours,
cooking classes and group food preparations. The participants can then use each of these
items and demonstrations to assist in their daily operations. For example, SNAP-Ed may
teach a lesson on vegetables that incorporates cooking a soup with fresh vegetables and
requires the participants to clean and peel the vegetables. By providing the participants
with a vegetable peeler, and the accompanied visual of using one, they can now mimic
this behavior at home.
Pre- and Post- Test Findings
The baseline data was compared to the collected post-test data. These questions
were all taken from the 2012 – 2013 KY SNAP-Ed and KY EFNEP Web NEERS
questionnaires. The questionnaires serve as a means to not only collect data, but help to

41
better access the participants. Each paraprofessional is able to read the questionnaires
and focus on areas that are lower in value. For example, if the majority of the
participants reported having never used a shopping list for groceries, then the
paraprofessional may want to emphasize more on that topic. As shown in the results
section of this thesis, a positive behavior change did occur. The impact of these findings
was another testament to the effectiveness of this program. When paralleled to the
changes that were shown in the HEI scores, an overall picture can begin to come into
existence of the effectiveness of this program.
2. Participants’ Understanding in Food Resource Management
The first question asked to participants was “How often do you plan meals ahead
of time?” This question was looking to determine if the participants actually did plan
ahead, and if they did, how often were meal preparations made. It is understood by the
researcher this questions is trying to determine how effective the participants are using
their current food products to help make the most of their food-money. Furthermore, this
question is only one of four associated with meal planning, which the other questions will
later be discussed.
Not only does the SNAP-Ed program teach general nutrition education, but also
has many fundamental and supplemental lessons that focus on meal planning. These
educational classes and tips teach its participants how to make shopping lists, taking
inventory of current food that is in stock and food that is needed for purchase. The
lessons also describe ways to plan out meals in advance to aid in reducing time spent in
the kitchen. Lastly, these classes emphasize the importance of food waste, food storage,
and accidentally buying duplicated products. Participants went from Average meal

42
planning (2.672) to having reported Sometimes planning for meals (3.629) P < 0.001.
Meaning, on average those who participated in the SNAP-Ed program experienced an
entire category change in how they plan for meals.
Question number two asked “How often do you compare prices before you buy
food?” Because companies often times change box sizes, net weight and packaging,
shopping can be very difficult for those who do not examine prices and compare them to
net weight. The SNAP-Ed program teaches its participants to not fall into such
marketing traps, educating on how to compare prices between store and name brand
items. Moreover, the program encourages the use of coupons, store discounts, buying in
bulk and using whole proteins to save on costs. Not only do these lessons help establish
guidelines for the participants to follow, but allow for long-lasting nutrition education
practices that can be used time-and-time again. After comparison of the pre- and-post-test
data the mean participants’ scores went from sometimes (3.268) to most of the time
(4.074). Although the increase was only by about a half a point, it was still a statistically
significant increase in behavioral practices, P > 0.001.
Questions three and four inquired, “How often do you run out of food at the end
of the month” and “How often do you shop with a grocery list”? Again, these two
questions help to better understand how SNAP-Ed participants are practicing food
resource management. Shopping with a grocery list is an excellent way to monitor and
track the exact foods needed for the house. Furthermore, lists can help prevent a family
from running out of food each month. The purpose of question number three is to
determine how the SNAP-Ed lessons can be tailored to better assist the participants from
becoming at risk for a limited diet. The SNAP-Ed program also encourages those who

43
shop to not do it on an empty stomach; this helps prevent the shoppers from buying foods
that look and sound appealing.
As reported in the results section of this paper, the participants’ “How often do
you run out of food” decreased from seldom (2.211) running out of food to never (1.786)
running out, P < 0.001. Those who reported having experienced a decrease in running out
of food at the end of the month is a great testimony to the effectiveness of the program.
Although the change was only a slight drop it still holds enough statistical significance to
be considered a change in behavior. Besides, having a decrease in the mean number of
those who reported having run out of food by the end of the month is great
acknowledgment to the strength of this program.
The last contributing question to establishing a behavior change in meal planning
skills has to do with grocery shopping with a list. As previously discussed, shopping
with a grocery list can make shopping for food easier and place less of a financial burden
on patrons. Furthermore, it gives consumers time to conduct research on products prior
to the shopping excursion. SNAP-Ed takes this information into account and provides
many reinforcement items to help encourage good shopping practices. Some of these
incentive items include shopping lists, vegetable peelers, meat thermometers, insulated
grocery bags and colanders, just to name a few. To attest to the programs’ successfulness
in establishing the use of a grocery list when shopping, the program experienced an
increase in the mean participant response. When first asked how often a grocery list was
used when shopping the participants reported only sometimes having used one (3.003),
but after they completed the program that response increased to using one most of the
time (3.850), P < 0.001.

44
Overall, the participants of the 2012 – 2013 SNAP-Ed program did experience a
positive behavior change in every aspect in food resource management, rejecting the null
hypothesis. Although having a concrete knowledge of nutrition is a goal of the SNAP-Ed
program, but without applying that knowledge it becomes irrelevant. The information
provided within this section of this thesis proves that those participants not only had a
great knowledge of nutrition information, but also was able to apply it in their daily lives.
This is just one example of how the SNAP-Ed program allows its participants to truly
experience behavior changes, demonstrating it through meal preparation and food
resource management.
3. Participants’ Understanding of Nutritional Practices
It all starts with having a solid understanding in proper nutrition, which is the
primary goal of the SNAP-Ed program. Nutritional practices are comprised of four
questions, all of which accessing the different aspects in the participants nutritional
habits. These questions include feeding your family, preparing foods without salt, using
the nutritional facts label, and how often their children eat within two hours of waking.
They represent questions seven through ten on the questionnaire checklist. Each of the
four questions is asked in a way to determine if the participants are actually applying
nutritional knowledge.
Inquiry number seven asked participants “When deciding what to feed your
family, how often do you think about healthy food choices?” Healthy food choices should
be the first type of foods that come to mind when deciding on what to feed a family, but
that is not always the case. The SNAP-Ed program offers many classes to help
participants to better understand why eating nutrient dense foods are superior to those of

45
empty calories. Many of the nutrition lesson follow cohesive and thorough guidelines
which are based on the Dietary Guidelines for Americans (SNAP-Ed Strategies…2015).
By keeping the classes consistent and concise, the information does not become scattered
and confused. This also allows the participants to build on the information that was
learned in the previous lessons.
According to the pre-test results the mean participant score for deciding on what
to feed their family was a sometimes (2.901). By the completion of the program the
participants’ mean answer increased to the almost always (3.627) category, P < 0.001.
The gravity of this increase is just another demonstration to in how the SNAP-Ed
program helps improve the quality of peoples’ diet. A change in behavior can only occur
by changing the way individuals think about their relationship to food (Maccroy, 1999).
Question number eight asked participants “How often have you prepared foods
without adding salt?” Salt is often times over used as a flavoring agent, and should be
discouraged because of its effects on high blood pressure, myocardial infarctions, strokes
and even heart failure (Health Risks…, 2016). Furthermore, salt can potentially mask the
many different flavors of food and therefore should not be overly used. There are many
other ways to flavor food instead of the use of salt. The SNAP-Ed program encourages
other flavoring agents be used instead of salt and pepper, and teaches its participants
about herbs, garlic and other seasonings.
Once the participants completed the program their mean answers to question
number eight increased from seldom (2.506) to sometimes (3.205), P < 0.001. Although
slight, this increase was enough to take the average answer to a higher category. The
increased mean score helped proves that most of the participants now only occasionally

46
use salt as a means to season their foods. This slight change in behavior may potentially
lead to a reduction in heart-related diseases.
The ninth question asked participants “How often do you use the Nutrition Facts
on the food label to make food choices?” Using the Nutrition Facts Label to help decide
what foods to consume is an extremely measureable question to ask SNAP-Ed
participants. Obviously, participants should always use the Nutrition Facts Label when
deciding on what to feed their family, but that does not always happen. The curriculum
that is used in the SNAP-Ed program uses the Nutrition Facts Label on many of the
lessons to encourage its use for food purchasing. This single question might hold the
most insight in determining if the program was successful in establishing a nutritional
behavior changes. To determine if participants had more success with using the Nutrition
Facts Label while shopping, the researcher compared the pre- and-post-test test scores.
The results of the data showed the participants’ mean responses experienced a
1.105 growth in categories; increasing from seldom using the facts (2.31) to sometimes
(3.415) using the Nutrition Facts Label when deciding on what to purchase, P < 0.001.
This standalone questions is a great achievement for the KY SNAP-Ed program, because
it truly encompasses the nutrition practices section of the questionnaire. Not only does
this question evaluate the participant’s understanding of nutrition knowledge, but it also
describes the understanding in food resource management. The answer to this question is
proof that the participants are now thinking about what they are eating, and not making
purchases on a whim.
The last question in the Nutrition Practices category asked participants “How
often do your children eat something in the morning within 2 hours of waking up?” This
47
question is important when establishing proper parenting behaviors from the participants.
Because the SNAP-Ed program targets providers of families, teaching nutritional food
preparation skills is an important subject to cover. The SNAP-Ed program teaches
material that can be applied in the home setting; proper child feeding habits are one of
these teachings. This question also assesses the parent’s knowledge of the importance of
breakfast. Although the SNAP-Ed program does not thoroughly cover how soon a child
should eat breakfast within waking up, it does however touch upon the subject.
After comparing the pre- and-post-test results of this question, there was only a
slight increase in means participant response. At the beginning of the program the
participants reported having never-seldom (1.893) fed their children within two hours of
waking. Once completed the program, the means response increased to seldom (2.052)
feeding their children breakfast, P < 0.001. This answer could have been only marginally
increased for various reasons. The first cause that could be associated with the slight
variation in the increase could have to do with the reporting system. Each participant has
an option to select a value from “0” to “5”. These results were then computed to
determine the mean participant answer; unfortunately when averaging all of the responses
the “0” value is also averaged. For example, if a participant does not have any children,
but is pregnant, she could have selected N/A (0) on the checklist. Of course all answers
in this thesis are subject to this averaging, but it is possible this questions was effected the
most. This will be covered in more depth in the Limitations section of this paper.
Naturally, all of these lessons are not always taught at an individual level but in
combination with other lessons, encompassing the importance of proper nutrition. For
example, using the Nutrition Facts Label might be taught alongside meal prep and using

48
a grocery list to shop for foods. Moreover, these lessons are often times mentioned
throughout the course of the program to help reinforce these themes. It is apparent the
2012 – 2013 Kentucky SNAP-Ed program was effective in establishing a better
understanding in nutritional practices among its participants.
Overall, the participants who were a part of the 2012 – 2013 SNAP-Ed program
all experienced behavior changes in the Understanding Nutritional Practices research
question. Even though some of the improvements between the pre- and-post-test data
were slight in changes, they were all statistically significant in their values. At this time
the null hypothesis can be rejected, proving this program is effective in establishing
positive behavior changes among its participants in the Understanding Nutritional
Practices category.
Strengths, Limitations and Future Research
This thesis has numerous strengths and successes. One of the greatest
achievements in this research paper is the support from the results in the successfulness
of the proposed hypotheses. Each of the hypotheses were supported by the results,
ultimately confirming the 2012-2013 KYSNAP-Ed participants did facilitate behavior
changes while participating in the program. The p-value obtained from all statistical
analysis suggests a positive correlation does exist among the 2012 – 2013 SNAP-Ed
lessons and behavior changes (P < 0.001). Another success this thesis offers is the
awareness and necessity of the KYSNAP-Ed program. The results reported within this
thesis are evidence that without the program the potential participants would have much
lower nutritional knowledge and application.

49
This research study is subject to various limitations that may limit the accuracy of
the results. The largest limitation in this study can be associated with the data. Within
this study the value “0” was given to those who answered N/A on the questionnaire.
When factored into the data set the “0” will lower the total mean score, ultimately slightly
screwing the answers. Although each participant may have chosen not to answer that
particular question, it does not guarantee the impact of all questions within the study. As
previously mentioned, some questions might be affected at a greater impact than others.
There was no way to eliminate the data sets that included a “0” in the response.
Furthermore, the pre- and post- test may have included a “0” but did not reflect that in
other results, thus diminishing the possibility of excluding that data set.
Another possible limitation includes response bias of the questionnaire, and the
reading level of the participants. For example, if the questions were too long, the
participants may have circled the answers without thoroughly reading the questions.
Another limitation is some participants may have was the feeling of peer pressure.
Because most of the classes are taught in a group setting some participants may have felt
pressured to answer the questions as quickly as their peers, causing them to miss out on
some of the information. Another strength and limitation was the denoted sample size
(Kentucky) is not a full representation of the population within the United States.
However, the sample size was large enough and statistically significant to assume that the
2012 – 2013 KYSNAP-Ed lessons are associated with positive behavior changes, making
this a success within this paper.
The last notable limitation found within this study is the time in which it took
participants to complete the SNAP-Ed program. It was determined from the given data

50
each participant completed, on average, between seven and twelve lessons. However, it
is not clear as to how long each participant was enrolled in the program upon completion.
Future research could examine this variable, but it would require further data coding.
Future researchers could examine the differences between the participants’ responses to
the questionnaire and food recall and compare it to the findings of those who were
enrolled in the program for longer periods of time. It would be assumed those who
participated in the program the longest would have the greatest improvements in
nutritional behavior changes.
Additional future research might include an increase in the average number of
lessons completed by the participants was only nine in total. It would have been
interesting to measure these same variables with more lessons completed. Similar results
would be expected to those found in the article published by Koszewski and others.
Koszewski and researchers conducted follow contact hours with their population, and
proved that 10 – 15 nutrition questions showed improvement. If a similar study were to
be conducted with the data set used in this study, researchers should also include the
questions about Solid Fats and Added Sugars (SoFAs) to depict a better representation of
the participants’ diets (Koszewski et al., 2011).
As previously stated, other future research should examine the amount of SoFAs
that were consumed to determine if those who participated in the program lessened their
consumption of empty calories. This could also aid the state and local staff in how to
better address what issues, concerning SoFAs, the KY SNAP-Ed participants is
struggling with. Furthermore, this would be helpful in establishing future nutrition
education classes and materials to assist in reducing the amount of SoFAs consumed.

51
Conclusions
After examining the results, it can be determined that the Kentucky SNAP-Ed
program did establish an improvement in behavior changes in all of the following areas:
having an overall increase in HEI scores, having an increase in the participants
understanding in food resource management, and experiencing an increase in the
participants understanding of nutritional practices. Those who participated in the lessons
showed an increase in nutritional understanding in all measured areas. All null
hypotheses can be rejected, accepting all hypotheses as evidence the program is effective
in establishing nutritional behavior changes among its participants. Although the
increase in whole grains was too little to have a significant x2 p-value, it can still be stated
that the overall HEI scores this thesis measured had a positive outcome.
These findings are not only a great testament to the successfulness of the 2012 –
2013 SNAP-Ed program, but also to those who worked at the state and federal level, and
the paraprofessionals who taught the classes. Countless hours and thought was placed
into the KY SNAP-Ed program, and this thesis is proof the program is working in the
community and helping all those who participate. Both participants, educators and law
makers can now find reassurance of their time, funding and efforts are not going to waste.
After completing the KY SNAP-Ed classes, the participants can now rely on their own
knowledge and skills to prepare food for themselves and their family. Furthermore, the
participants will have an enriched understanding in the three domains measured within
this thesis. Having this comprehension can then help to eliminated food insecurity and
promote wellbeing among the low-income population with the state of Kentucky.
52
Appendix A
Definitions
Expanded Food Nutrition Education Program (EFNEP) – EFNEP was developed in
1969 by the United States Department of Agriculture. EFNEP’s objective is to provide
nutrition information for those of limited resources and low-income status (Dunn, 2013;
National Institute of Food and Agriculture).
Kentucky Behavioral Risk Factor Survey (KyBRFS) – is an ongoing, yearly survey
illustrating the collective behavioral information of those who are citizens for the state of
Kentucky (KyBRFS, 2017).
Nutrition Education Paraprofessionals (Assistants) – those who are hired by SNAP-
Ed and EFNEP for the sole purpose of teaching nutrition education lessons to program
participants. These paraprofessionals are typically hired from the county where they are
educating families (Koszewski, et. al, 2011).
Supplemental Nutrition Assistance Program (SNAP) – SNAP, formally titled Food
Stamp Program, is a countrywide program designed to instruct families, of low-income
status, the skills necessary to provide more nutrient dense foods (Dunn, 2013).
Supplemental Nutrition Assistance Program Education (SNAP-Ed) – The objective
of SNAP-Ed is to provide nutrition information for those of limited resources and low-
income status. SNAP-Ed uses the same curriculum as EFNEP, however their target
population is slightly different. SNAP-ED and EFNEP both focuses on those of limited
resources, but SNAP-Ed can reach out to those of Pre-School age and above the age of
retirement (Dunn, 2013; National Institute of Food and Agriculture).

53
Web-based Nutrition Education Evaluation Reporting System (Web-NEERS) –
web-based computing program used to collect and report data for the local and federal
agencies (Chipman, 2013).

54
Appendix B
Demographics Worksheet
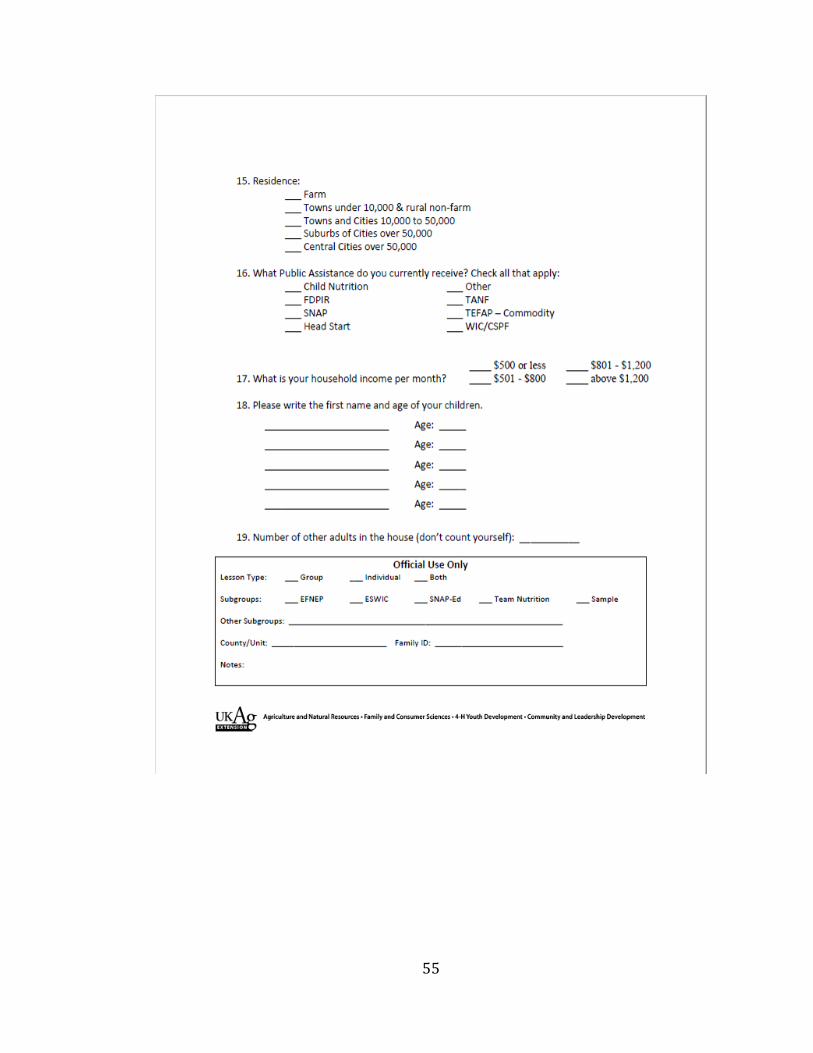
55

56
Appendix C
24- Hour Food Recall Entry

57
Appendix D
24- Hour Food Recall Exit

58
Appendix E
Nutrition Education Program ENTRY Level Behavior Checklist
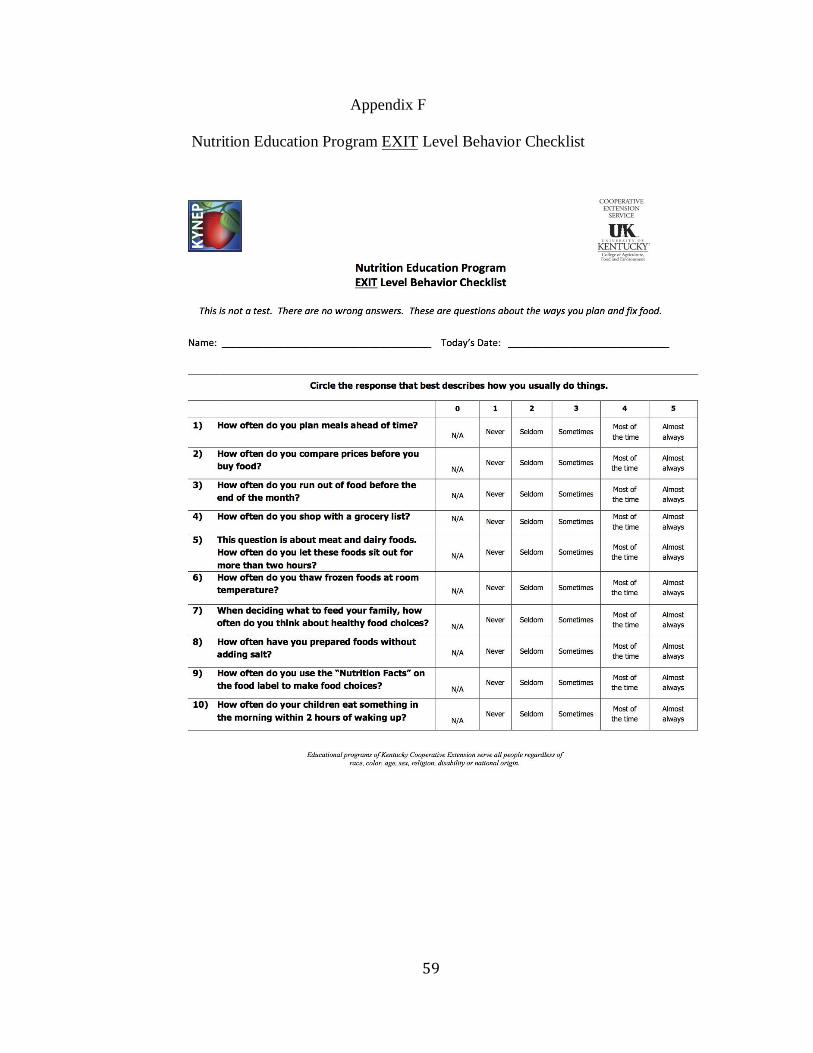
59
Appendix F
Nutrition Education Program EXIT Level Behavior Checklist

60
References
Auld, G., Baker, S., Bauer, L. Koszewski, W., Procter, S., Steger, M. F. (2013). EFNEP’s
Impact on the Quality of Life of Its Participants and Educators. Journal of
Nutrition Education and Behavior. 2013 Nov; 45(6): 482-289 Retrieved from:
http://www.ncbi.nlm.nih.gov/pubmed/23981711
Basiotis, P.P., Carlson, A., Gerrior, S.A., Juan, W.Y., & Lino, M. (2002, December).
Report Card on the Quality of Americans’ Diets. Retrieved from
https://www.cnpp.usda.gov/sites/default/files/nutrition_insights_uploads/Insight2
8.pdf
Boeing, H. et. al., (2012). Critical review: Vegetables and fruit in the prevention of
chronic diseases. European Journal of Nutrition Eur J Nutr, 51(6), 637-663.
doi:10.1007/s00394-012-0380-y
Chipman, H. (2013, June 12). Nutrition. Retrieved from
http://www.nifa.usda.gov/nea/food/efnep/efnep.html
Coleman-Jensen, A., Rabbitt, M., Gregory, C., & Singh, A. (2016). Household Food
Security in the United States in 2015, Economic Research Report Number 215.
Core Nutrition Messages. (2016, August 16). Retrieved August 22, 2016, from
http://www.fns.usda.gov/core-nutrition/core-nutrition-messages
Cullen, Thompson, Scott, Lara-Smalling, Watson, & Konzelmann. (2010). The impact of
goal attainment on behavioral and mediating variables among low income women
participating in an Expanded Food and Nutrition Education Program intervention
study. Appetite, 55(2), 305-310.

61
Cunningham-Sabo, Baker, Mcdonnell, Clifford, Lohse, & Smith. (2016). Challenges and
Opportunities for Integrating Cooking Experiences into EFNEP and SNAP-Ed
Nutrition Education for Children and Youth. Journal of the Academy of Nutrition
and Dietetics, 116(9), A45.
Dollahite, J., Olson, C., & Scott‐Pierce, M. (2003). The Impact of Nutrition Education on
Food Insecurity among Low‐Income Participants in EFNEP. Family and
Consumer Sciences Research Journal, 32(2), 127-139.
Dunn, J. (2013, December 11). Supplemental nutrition assistance program (snap)
(formerly food stamps). Retrieved from
http://chfs.ky.gov/dcbs/dfs/foodstampsebt.htm
Feeding America: Hunger in Kentucky. (2016). Retrieved from
https://www.feedingamerica.org/hunger-in-america/kentucky
Finkelstein, E. A., Trogdon, J. G., Cohen, J. W., & Dietz, W. (2009). Annual Medical
Spending Attributable To Obesity: Payer-And Service-Specific Estimates. Health
Affairs, 28, no.5 :w822-w831
Guenther, P. M., Krebs-Smith, S. M., Reedy, J., Britten, P., Juan, W. Y., Lino, M.,
Carlson, A., & Basiotis, P. P. (2005). Healthy eating index-2005. Retrieved from
website:
http://www.cnpp.usda.gov/Publications/HEI/healthyeatingindex2005factsheet.pdf
Hartline-Grafton, DrPH, RD., H. (2015, October). Understanding the Connections: Food
Insecurity and Obesity. FRAC: Food Research & Action Center. Retrieved from
http://frac.org/wp-content/uploads/frac_brief_understanding_the_connections.pdf
62
Health Risks and Disease Related to Salt and Sodium. (2016, July 06). Retrieved from
https://www.hsph.harvard.edu/nutritionsource/salt-and-sodium/sodium-health-
risks-and-disease/
Hunger in Kentucky 2014 Feeding America. (n.d.). Retrieved from
https://daretocare.org/assets/uploads/2016/09/Hunger-in-Kentucky-Study.pdf
Kaiser, Chaidez, Algert, Horowitz, Martin, Mendoza, . . . Ginsburg. (2015). Food
Resource Management Education With SNAP Participation Improves Food
Security. Journal of Nutrition Education and Behavior, 47(4), 374-378.e1.
Kentucky Behavioral Risk Factor Survey: 2012 Annual Report. (2012). BRFSS:
Behavioral Risk Factor Surveillance System. Retrieved Spring, 2015, from
Kentucky Behavioral Risk Factor Survey
Koszewski, W., Sehi, N., Behrends, D., & Tuttle, E. (2011). The Impact of SNAP-Ed and
EFNEP on Program Graduates 6 Months after Graduation. Journal of Extension
49(5), n5.
Leung, W. C, Blumenthal, J. S., Hoffnagle, E. E., Jensen, H. H., Foerster, B. S., Nestle,
M., Cheung, W. Y. L., Mozaffarian, D., Willett, C. W. (2013) Associations of
Food Stamp Participation With Dietary Quality and Obesity in Children.
PEDIATRICS Volume 131, Number 3, March 2013. Retrieved from
http://pediatrics.aappublications.org.ezproxy.uky.edu/content/131/3/463.full.pdf+
html.
Lin, B., & United States. Department of Agriculture. Economic Research Service, issuing
body. (2005). Nutrition and health characteristics of low income populations.
Healthy eating index (Agriculture information bulletin; 796-1).

63
Mccrory, M. A., Fuss, P. J., Hays, N. P., Vinken, A. G., Greenberg, A. S., & Roberts, S.
B. (1999). Overeating in America: Association between Restaurant Food
Consumption and Body Fatness in Healthy Adult Men and Women Ages 19 to 80.
Obesity Research, 7(6), 564-571. doi:10.1002/j.1550-8528.1999.tb00715.x
Molitor, Sugerman, & Sciortino. (2016). Fruit and Vegetable, Fat, and Sugar-Sweetened
Beverage Intake Among Low-Income Mothers Living in Neighborhoods With
Supplemental Nutrition Assistance Program–Education. Journal of Nutrition
Education and Behavior, 48(10), 683-690.e1.
National Institute of Food and Agriculture. (n.d.). Expanded Food and Nutrition
Education Program (EFNEP). Retrieved July 11, 2016, from
https://nifa.usda.gov/program/expanded-food-and-nutrition-education-program-
efnep
National Institute of Food and Agriculture. (n.d.). Supplemental Nutrition Education
Program –Education (SNAP-Ed) Retrieved July 11, 2016, from
https://nifa.usda.gov/program/supplemental-nutrition-education-program-
education-snap-ed
National Institute of Food and Agriculture. (n.d.). WebNEERS: Planning, Evaluation, and
Reporting. Retrieved July 11, 2016, from https://nifa.usda.gov/tool/webneers
New NCCOR project translates research into applications for the Healthy Eating Index.
(2013, April 25). Retrieved from https://www.nccor.org/2013/04/25/new-nccor-
project-translates-research-into-applications-for-the-healthy-eating-index/
Ogden, C. L., Lamb, M. M., Carroll, M. D., Flegal, K. M. (2010). Obesity and
Socioeconomic Status in Adults: United States, 2005–2008. NCHS Data Brief.

64
December, 2010. No. 50. Retried from:
http://www.cdc.gov/nchs/data/databriefs/db50.pdf
Rabbitt, M., Coleman-Jensen, A., & Gregory, C. (2017). Understanding the Prevalence,
Severity, and Distribution of Food Insecurity in the United States. Amber
Waves, 1-7Report Card on the Quality of Americans’ Diets. (2002, December).
Nutrition Insights. Retrieved April 12, 2016, from
http://www.cnpp.usda.gov/sites/default/files/nutrition_insights_uploads/Insight28.
RStudio Team (2016). RStudio: Integrated Development for R. RStudio, Inc., Boston, M
A URL http://www.rstudio.com/.
SNAP-Ed Strategies and Interventions: An Obesity Prevention Toolkit for States. April,
2015. Retrieved from:
http://www.nccor.org/downloads/SNAPEdStrategiesAndInterventionsTool
kitForStates.pdf
StataCorp. 2017. Stata Statistical Software: Release 15. College Station, TX: StataCorp
LLC
US Census Bureau. (2018, July 25). Income and Poverty in the United States: 2014.
Retrieved from https://www.census.gov/library/publications/2015/demo/p60-
252.html
U.S. Census Bureau QuickFacts: Kentucky. (2010, April). Retrieved from
https://www.census.gov/quickfacts/fact/table/ky/POP010210

65
Wakou, B. A., M.S. (2003, January/February). Personal Attributes and Job Competencies
Needed by EFNEP Paraprofessionals as Perceived by EFNEP Professionals.
Journal of Nutrition Education and Behavior, 35(1), 16-23. Retrieved Fall, 2015.

66
Bibliography
Auld, G., Baker, S., Bauer, L. Koszewski, W., Procter, S., Steger, M. F. (2013). EFNEP’s
Impact on the Quality of Life of Its Participants and Educators. Journal of
Nutrition Education and Behavior. 2013 Nov; 45(6): 482-289 Retrieved from:
http://www.ncbi.nlm.nih.gov/pubmed/23981711
Basiotis, P.P., Carlson, A., Gerrior, S.A., Juan, W.Y., & Lino, M. (2002, December).
Report Card on the Quality of Americans’ Diets. Retrieved from
https://www.cnpp.usda.gov/sites/default/files/nutrition_insights_uploads/Insight2
8.pdf
Boeing, H. et. al., (2012). Critical review: Vegetables and fruit in the prevention of
chronic diseases. European Journal of Nutrition Eur J Nutr, 51(6), 637-663.
doi:10.1007/s00394-012-0380-y
Calculation of mean Healthy Eating Index-2010 component and total scores and
corresponding standard errors and confidence intervals for a population,
subpopulation, or group. (2013, March). Retrieved February, 2016, from
http://www.cnpp.usda.gov/sites/default/files/healthy_eating_index/Readme_HEI2
010_NHANES0708_PopulationScore.pdf
Chipman, H. (2013, June 12). Nutrition. Retrieved from
http://www.nifa.usda.gov/nea/food/efnep/efnep.html
Coleman-Jensen, A., Rabbitt, M., Gregory, C., & Singh, A. (2016). Household Food
Security in the United States in 2015, Economic Research Report Number 215.
Core Nutrition Messages. (2016, August 16). Retrieved August 22, 2016, from
http://www.fns.usda.gov/core-nutrition/core-nutrition-messages
67
Cullen, Thompson, Scott, Lara-Smalling, Watson, & Konzelmann. (2010). The impact of
goal attainment on behavioral and mediating variables among low income women
participating in an Expanded Food and Nutrition Education Program intervention
study. Appetite, 55(2), 305-310.
Cunningham-Sabo, Baker, Mcdonnell, Clifford, Lohse, & Smith. (2016). Challenges and
Opportunities for Integrating Cooking Experiences into EFNEP and SNAP-Ed
Nutrition Education for Children and Youth. Journal of the Academy of Nutrition
and Dietetics, 116(9), A45.
Direktör, Ş., & Özer, E. (2013). Evaluating dietary quality in diabetes by the Healthy
Eating Index. Asia Pacific Journal Of Clinical Nutrition, 22(4), 620-625.
doi:10.6133/apjcn.2013.22.4.03
Dunn, J. (2013, December 11). Supplemental nutrition assistance program (snap)
(formerly food stamps). Retrieved from
http://chfs.ky.gov/dcbs/dfs/foodstampsebt.htm
Feeding America: Hunger in Kentucky. (2016). Retrieved from
https://www.feedingamerica.org/hunger-in-america/kentucky
Finkelstein, E. A., Trogdon, J. G., Cohen, J. W., & Dietz, W. (2009). Annual Medical
Spending Attributable To Obesity: Payer-And Service-Specific Estimates. Health
Affairs, 28, no.5 :w822-w831
Freedman, L.S., Guenther, P.M., Krebs-Smith, S.M., & Kott, P.S. (2009). A population’s
mean Healthy Eating Index-2005 scores are best estimated by the score of the
population ratio when one 24-hour recall is available. Journal of Nutrition, 138,
1725-1729.

68
FRANCIS, S. L., TAYLOR, M. L., & HALDEMAN, L. M. (2009). Nutrition Education
Improves Morale and Self-Efficacy for Middle-Aged and Older Women. Journal
Of Nutrition For The Elderly, 28(3), 272-286.
Guenther, P. M., Krebs-Smith, S. M., Reedy, J., Britten, P., Juan, W. Y., Lino, M.,
Carlson, A., & Basiotis, P. P. (2005). Healthy eating index-2005. Retrieved from
website:
http://www.cnpp.usda.gov/Publications/HEI/healthyeatingindex2005factsheet.pdf
Gustafson, A., Lewis, S., Perkins, S., Wilson, C., Buckner, E., Vail, A., (2013)
Neighbourhood and consumer food environment is associated with dietary intake
among Supplemental Nutrition Assistance Program (SNAP) participants in
Fayette County, Kentucky. Public Health Nutr. 2013 Jul; 6(7):1229-37.
doi:10.1017/S1368980013000505.
Hartline-Grafton, DrPH, RD., H. (2015, October). Understanding the Connections: Food
Insecurity and Obesity. FRAC: Food Research & Action Center. Retrieved from
http://frac.org/wp-content/uploads/frac_brief_understanding_the_connections.pdf
Health Risks and Disease Related to Salt and Sodium. (2016, July 06). Retrieved from
https://www.hsph.harvard.edu/nutritionsource/salt-and-sodium/sodium-health-
risks-and-disease/
Higgins, M., & Barkley, M. (2004). Barriers to nutrition education for older adults, and
nutrition and aging training opportunities for educators, healthcare providers,
volunteers and caregivers. Journal Of Nutrition For The Elderly, 23(4), 99-121
Hunger in Kentucky 2014 Feeding America. (n.d.). Retrieved from
https://daretocare.org/assets/uploads/2016/09/Hunger-in-Kentucky-Study.pdf
69
IBM Corp. Released 2016. IBM SPSS Statistics for Windows, Version 24.0. Armonk,
NY: IBM Corp.
Kaiser, Chaidez, Algert, Horowitz, Martin, Mendoza, . . . Ginsburg. (2015). Food
Resource Management Education With SNAP Participation Improves Food
Security. Journal of Nutrition Education and Behavior, 47(4), 374-378.e1.
Kanotra, PhD, MPH, S., A. O., & S. S. (2011). Kentucky Behavioral Risk Factor Survey.
Kentucky Public Health. Retrieved from
http://chfs.ky.gov/dph/info/dpqi/cd/Kentucky BRFSS Data Reports.htm
Kentucky Behavioral Risk Factor Survey: 2012 Annual Report. (2012). BRFSS:
Behavioral Risk Factor Surveillance System. Retrieved Spring, 2015, from
Kentucky Behavioral Risk Factor Survey
Koszewski, W., Sehi, N., Behrends, D., & Tuttle, E. (2011). The Impact of SNAP-Ed and
EFNEP on Program Graduates 6 Months after Graduation. Journal of Extension
49(5), n5.
Leung, W. C, Blumenthal, J. S., Hoffnagle, E. E., Jensen, H. H., Foerster, B. S., Nestle,
M., Cheung, W. Y. L., Mozaffarian, D., Willett, C. W. (2013) Associations of
Food Stamp Participation With Dietary Quality and Obesity in Children.
PEDIATRICS Volume 131, Number 3, March 2013. Retrieved from
http://pediatrics.aappublications.org.ezproxy.uky.edu/content/131/3/463.full.pdf+
html.
Lin, B., & United States. Department of Agriculture. Economic Research Service, issuing
body. (2005). Nutrition and health characteristics of low income populations.
Healthy eating index (Agriculture information bulletin ; 796-1).
70
McCaughtry, N., Fahlman, M., Martin, J. J., & Shen, B. (2011). Influences of
Constructivist-Oriented Nutrition Education on Urban Middle School Students'
Nutrition Knowledge, Self-Efficacy, and Behaviors. American Journal Of Health
Education, 42(5), 276-285.
Mccrory, M. A., Fuss, P. J., Hays, N. P., Vinken, A. G., Greenberg, A. S., & Roberts, S.
B. (1999). Overeating in America: Association between Restaurant Food
Consumption and Body Fatness in Healthy Adult Men and Women Ages 19 to 80.
Obesity Research, 7(6), 564-571. doi:10.1002/j.1550-8528.1999.tb00715.x
McLeod, S. (2007). [Web log message]. Retrieved from
http://www.simplypsychology.org/maslow.html
Molitor, Sugerman, & Sciortino. (2016). Fruit and Vegetable, Fat, and Sugar-Sweetened
Beverage Intake Among Low-Income Mothers Living in Neighborhoods With
Supplemental Nutrition Assistance Program–Education. Journal of Nutrition
Education and Behavior, 48(10), 683-690.e1.
Moss, A., Smith, S., Null, D., Long Roth, S., & Tragoudas, U. (2013). Farm to School
and Nutrition Education: Positively Affecting Elementary School-Aged Children's
Nutrition Knowledge and Consumption Behavior. Childhood Obesity (Print),
9(1), 51-56. doi:10.1089/chi.2012.0056
National Institute of Food and Agriculture. (n.d.). Expanded Food and Nutrition
Education Program (EFNEP). Retrieved July 11, 2016, from
https://nifa.usda.gov/program/expanded-food-and-nutrition-education-program-
efnep
71
National Institute of Food and Agriculture. (n.d.). Supplemental Nutrition Education
Program –Education (SNAP-Ed). Retrieved July 11, 2016, from
https://nifa.usda.gov/program/supplemental-nutrition-education-program-
education-snap-ed
National Institute of Food and Agriculture. (n.d.). WebNEERS: Planning, Evaluation, and
Reporting. Retrieved July 11, 2016, from https://nifa.usda.gov/tool/webneers
New NCCOR project translates research into applications for the Healthy Eating Index.
(2013, April 25). Retrieved from https://www.nccor.org/2013/04/25/new-nccor-
project-translates-research-into-applications-for-the-healthy-eating-index/
O'Rourke, T., & Iammarino, N. (2012). Health Educators and Nutrition Education: Food
for Thought--A Commentary. American Journal Of Health Education, 43(5), 313-
316.
Ogden, C. L., Lamb, M. M., Carroll, M. D., Flegal, K. M. (2010). Obesity and
Socioeconomic Status in Adults: United States, 2005–2008. NCHS Data Brief.
December, 2010. No. 50. Retried from:
http://www.cdc.gov/nchs/data/databriefs/db50.pdf
Rabbitt, M., Coleman-Jensen, A., & Gregory, C. (2017). Understanding the Prevalence,
Severity, and Distribution of Food Insecurity in the United States. Amber
Waves, 1-7Report Card on the Quality of Americans’ Diets. (2002, December).
Nutrition Insights. Retrieved April 12, 2016, from
http://www.cnpp.usda.gov/sites/default/files/nutrition_insights_uploads/Insight28.
Report Card on the Quality of Americans’ Diets. (2002, December). Nutrition Insights.

72
Retrieved April 12, 2016, from
http://www.cnpp.usda.gov/sites/default/files/nutrition_insights_uploads/Insight28.
Rosenbloom, C. A., Kicklighter, J. R., Patacca, D., & Deshpande, K. (2004). Nutrition
education in six congregate meal sites improves participant's nutrition knowledge.
Journal Of Nutrition For The Elderly, 23(3), 73-83.
RStudio Team (2016). RStudio: Integrated Development for R. RStudio, Inc., Boston, M
A URL http://www.rstudio.com/.
StataCorp. 2017. Stata Statistical Software: Release 15. College Station, TX: StataCorp
LLC
The Healthy Eating Index. (1995, October). Retrieved Fall, 2015, from
http://www.cnpp.usda.gov/sites/default/files/healthy_eating_index/HEI89-
90report.pdf
Unusan, N., Aiba, N., & Yoshiike, N. (2007). Distance Delivery of Nutrition Education
as a Method for Providing Continuing Education. Online Submission,
US Census Bureau. (2018, July 25). Income and Poverty in the United States: 2014.
Retrieved from https://www.census.gov/library/publications/2015/demo/p60-
252.html
U.S. Census Bureau QuickFacts: Kentucky. (2010, April). Retrieved from
https://www.census.gov/quickfacts/fact/table/ky/POP010210
Wakou, B. A., M.S. (2003, January/February). Personal Attributes and Job Competencies
Needed by EFNEP Paraprofessionals as Perceived by EFNEP Professionals.
Journal of Nutrition Education and Behavior, 35(1), 16-23. Retrieved Fall, 2015.

73
Yousefian, A., Leighton, A., Fox, K., Hartley, D. (2011). Understanding the rural food
environment--perspectives of low-income parents. Rural Remote Health.
2011;11(2):1631. Retrieved from:
http://www.ncbi.nlm.nih.gov/pubmed/21513422
Yusoff, H., Wan Daud, W., & Ahmad, Z. (2013). Effectiveness of Nutrition Education
vs. Non-Nutrition Education Intervention in Improving Awareness Pertaining Iron
Deficiency among Anemic Adolescents. Iranian Journal Of Public Health, 42(5),
467-471.

74
VITA
Corey Joe Shepherd, RD, LD
Education:
Bachelor of Science in Dietetics, University of Kentucky, May 2013
o University of Kentucky Didactic Internship, August 2015
Master of Science in Home Economics Hospitality & Dietetics Administration,
University of Kentucky, August 2019 (expected)