comparison of the damaged area caused by an agricultural ... · 2.3. hec-hms and hec-ras model...
TRANSCRIPT

Agricultural Sciences, 2017, 8, 1089-1104 http://www.scirp.org/journal/as
ISSN Online: 2156-8561 ISSN Print: 2156-8553
DOI: 10.4236/as.2017.810079 Oct. 13, 2017 1089 Agricultural Sciences
Comparison of the Damaged Area Caused by an Agricultural Dam-Break Flood Wave Using HEC-RAS and UAV Surveying
Chung-Gil Jung, Seong-Joon Kim
Dept. of Civil, Environmental and Plant Eng., Konkuk University, Seoul, South Korea
Abstract This study examines the usability of unmanned aerial vehicle (UAV) data surveyed just after an agricultural reservoir collapse by comparing the survey results with the simulation results of the HEC-RAS (Hydrologic Engineering Centers River Analysis System) flood wave propagation to the downstream areas. A 61,400 m3 storage dam broken by 89.0 mm (over 30.0 mm/hr rainfall intensity) of rainfall on August 21st, 2014 was considered. The reservoir water capacity curve and downstream damaged areas were estimated by drone sur-veying 3 days after the dam break. The flood wave by the overtopped dam break was propagated using the HEC-HMS (Hydrologic Engineering Centers Hydrological Modeling System) reservoir inflow from the watershed. The model results showed flood inundation depths of 0.1 to 2.2 m, mainly in rice paddy areas along the stream, and the overtopped dam-break scenario exhi-bited 59% correspondence with the drone-surveyed areas.
Keywords Ungauged Agricultural Catchment, Drone Survey, HEC-HMS, HEC-RAS, Inundation Map
1. Introduction
Dam break is a serious devastating disaster that occurs around the world and causes large amounts of damage to people worldwide [1]. In South Korea, there are 17,531 agricultural reservoirs, with 88.4%, 9.1%, and 2.5% having storage capacities of less than 0.1 million m3, between 0.1 and 1.0 million m3, and over 1.0 million m3, respectively. These reservoirs now hold 55% of the irrigation wa-ter among the total supply to 447,000 ha, with a total capacity of 2.78 billion m3.
How to cite this paper: Jung, C.-G. and Kim, S.-J. (2017) Comparison of the Dam-aged Area Caused by an Agricultural Dam- Break Flood Wave Using HEC-RAS and UAV Surveying. Agricultural Sciences, 8, 1089-1104. https://doi.org/10.4236/as.2017.810079 Received: September 6, 2017 Accepted: October 10, 2017 Published: October 13, 2017 Copyright © 2017 by authors and Scientific Research Publishing Inc. This work is licensed under the Creative Commons Attribution International License (CC BY 4.0). http://creativecommons.org/licenses/by/4.0/
Open Access

C.-G. Jung, S.-J. Kim
DOI: 10.4236/as.2017.810079 1090 Agricultural Sciences
However, old reservoirs often do not have adequate structural stability, and the recent record-breaking rainfall events have increased the threats of hydrological stability. Among these reservoirs, 52% are over 70 years old, 22.2% are over 50 years old, and 22.6% are over 30 years old.
Recently, many studies on dam break have been performed, with the resulting damaged areas estimated using many approaches. Carling et al. [2] conducted dam-breach modeling with 1- and 2-dimensional hydraulic models that were specially developed for ice dam failures via piping and overtopping. Sarhadi et al. [3] presented a methodology to assess floodplain mapping at ungauged rivers via 1-dimensional hydraulic inundation modeling. They used high-resolution digital terrain models (DTMs), land use characteristics, and channel properties to iden-tify the critical and vulnerable areas affected by floods in different return pe-riods. You et al. [1] reviewed earth-rock dam safety using high-resolution digital surface model (DSM) data. Evangelista et al. [4] presented the application of a multi-stage first-order centered scheme GMUSTA (Generalized MUlti STAge) to solve a two-phase flow model with four equations. Prakash et al. [5] attempted to simulate the impact of dam-wall failure scenarios using the Smoothed Particle Hydrodynamics (SPH) method on flood inundation, including modeling of dam-wall fragments.
The prediction of flood magnitude at ungauged reaches is an important task in designing river engineering and hydraulic structures and remains a funda-mental challenge for hydrologists [6]. Although considerable research has been conducted based on available information for dam-break problems, the lack of data from ungauged regions still remains an issue in providing accurate predic-tions of flood magnitude, which is a key factor for reliable flood inundation mapping [3]. The most important data required to perform hydrologic and hy-draulic dam-break simulations relate to the topographic relationship between the reservoir water level and storage and the cross sections of the stream, in-cluding protected lowlands.
A high-resolution DTM or DSM is critical to extract the details of the channel topography, obtain the water surface elevations at the cross sections, and simu-late flood inundation and depth [3] [7]. Many studies have considered the HEC-RAS (Hydrologic Engineering Centers River Analysis System) perfor-mance by high-resolution DSM extracted from new data sources, such as Light Detection and Ranging (LiDAR) and Synthetic Aperture Radar (SAR) data [8]-[13]. In addition to these various studies, the unmanned aerial vehicle (UAV) remote sensing is an easy and increasingly popular approach to obtain high-quality terrain data. The UAV, also known as a drone, is an aircraft com-bined with a ground control station and communication support equipment that is flown without a pilot on board and can be remote controlled automatically or semi-automatically by using preprocessed programs or artificial intelligence. Recently, many studies on dam break have been performed, with the resulting damaged areas estimated using many approaches. The technology of UAV remote

C.-G. Jung, S.-J. Kim
DOI: 10.4236/as.2017.810079 1091 Agricultural Sciences
sensing can quickly detect changes in disaster information at the micro and/or mesoscale without the effect of bad or cloudy weather and with a spatial resolu-tion of at least 0.2 m [14]. The potential for the use of UAVs for non-contact flow measurement has been identified [15]. Currently, many researches using UAV are going on now for monitoring of various flow conditions [16] [17]. However, research regarding the use of UAVs for flood mapping caused by dam break is still necessary. If UAV images are overlay with high-resolution DEM data, a rich set of thematic flood data can be more exactly extracted and ex-plored.
The overall goal of this study was to analyze the flood-damaged area by dam break with typical hydrologic and hydraulic modeling in ungagged watershed and identify collapse type in actual broken reservoir. The specific objectives of the study were as follows: 1) to generate DSM and reference inundation map from UAV data within reservoir and downstream topographies of actual dam-aged areas for a 61,400 m3 storage dam that was broken by 92.6 mm rainfall event with rainfall intensity over 30.0 mm/hr on August 21st, 2014 for calibration of watershed parameters in the modelling, 2) to simulate two scenarios (over-topping and piping) using HEC-HMS (Hydrologic Engineering Centers Hydro-logical Modeling System) model, 3) to simulate inundation area using HEC-RAS model from estimated flood discharge, and 4) to identify collapse type compared with inundation map between two scenarios.
2. Materials and Methods 2.1. Study Area and Input Data
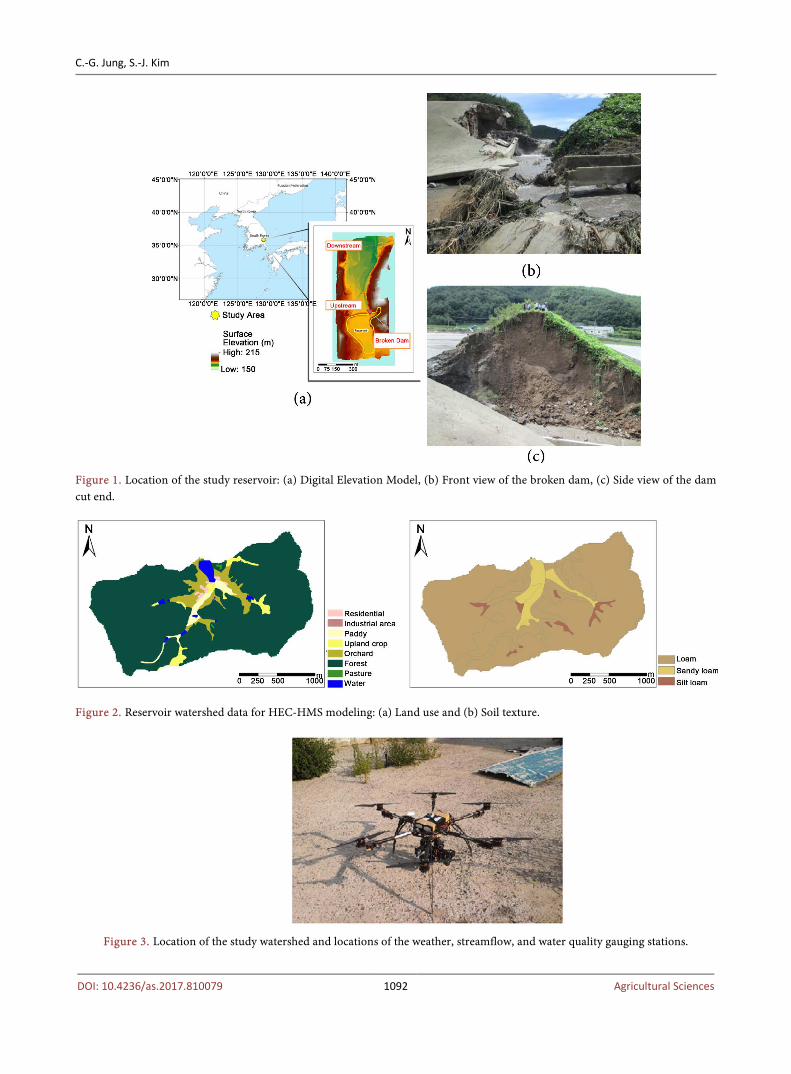
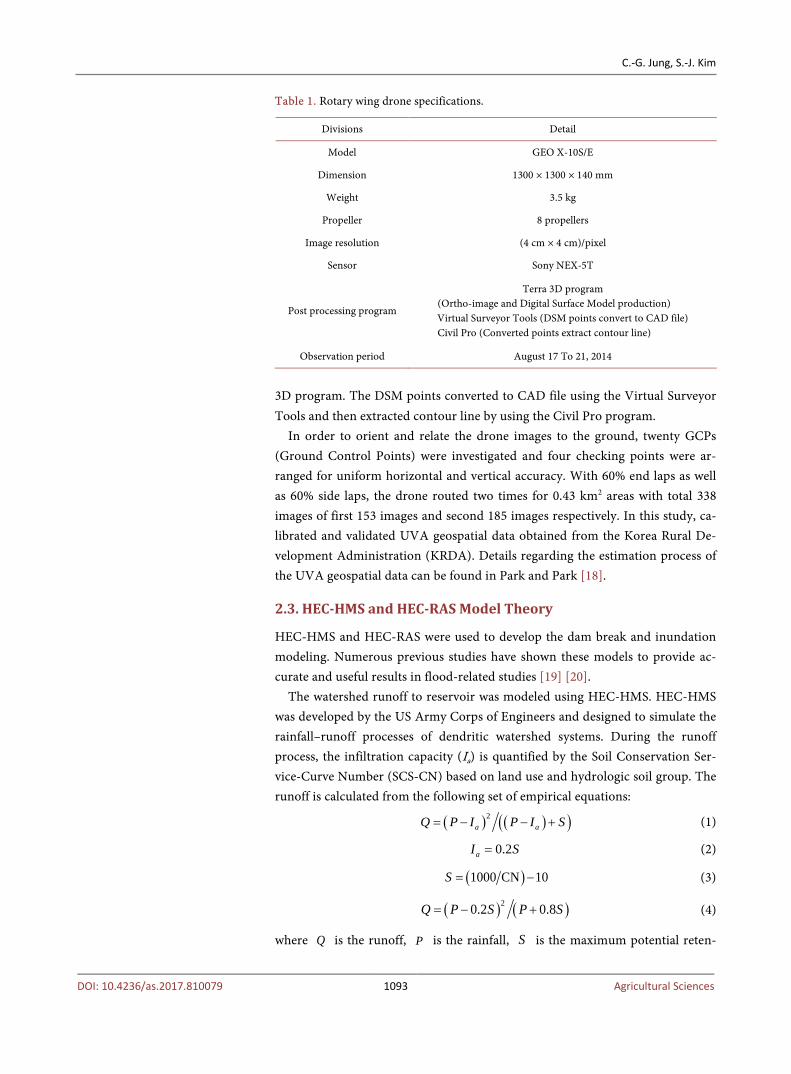
The broken dam is located in the southeastern part of South Korea, with a lati-tude and longitude of 35.895˚N and 128.96˚E, respectively. The Goeyeon reser-voir dam was built in 1945 for rice paddy irrigation water supply to the down-stream area. The dam was broken by the 92.6 mm rainfall event with over 30 mm/hr rainfall intensity in August 21st, 2014 after reaching the maximum water level to the bank top. The cause of reservoir collapse was predicted as overtop-ping by the rain storm, but was not certain with piping possibility. Figure 1 shows the location of the reservoir, the part of the broken dam, and the cut sec-tion of the bank. Figure 2 shows the GIS input data of the upper watershed of the reservoir for the HEC-HMS modeling.
2.2. UAV Specification and Imaging Process
A rotary-wing drone of 3.5 kg weight carried with the Sony NEX-5T sensors was used to acquire the image data (Figure 3). It has 4 cm by 4 cm spatial resolution with JPEG image format. Table 1 shows the specification of the drone. The au-topilot flight was applied by the inertial measurement unit (IMU) and onboard GPS. The integration of sensors with IMU and GPS enabled to obtain the geo-referenced images. For post-processing, the DSM was produced by the terra
C.-G. Jung, S.-J. Kim
DOI: 10.4236/as.2017.810079 1092 Agricultural Sciences
Figure 1. Location of the study reservoir: (a) Digital Elevation Model, (b) Front view of the broken dam, (c) Side view of the dam cut end.
Figure 2. Reservoir watershed data for HEC-HMS modeling: (a) Land use and (b) Soil texture.
Figure 3. Location of the study watershed and locations of the weather, streamflow, and water quality gauging stations.
C.-G. Jung, S.-J. Kim
DOI: 10.4236/as.2017.810079 1093 Agricultural Sciences
Table 1. Rotary wing drone specifications.
Divisions Detail
Model GEO X-10S/E
Dimension 1300 × 1300 × 140 mm
Weight 3.5 kg
Propeller 8 propellers
Image resolution (4 cm × 4 cm)/pixel
Sensor Sony NEX-5T
Post processing program
Terra 3D program (Ortho-image and Digital Surface Model production) Virtual Surveyor Tools (DSM points convert to CAD file) Civil Pro (Converted points extract contour line)
Observation period August 17 To 21, 2014
3D program. The DSM points converted to CAD file using the Virtual Surveyor Tools and then extracted contour line by using the Civil Pro program.
In order to orient and relate the drone images to the ground, twenty GCPs (Ground Control Points) were investigated and four checking points were ar-ranged for uniform horizontal and vertical accuracy. With 60% end laps as well as 60% side laps, the drone routed two times for 0.43 km2 areas with total 338 images of first 153 images and second 185 images respectively. In this study, ca-librated and validated UVA geospatial data obtained from the Korea Rural De-velopment Administration (KRDA). Details regarding the estimation process of the UVA geospatial data can be found in Park and Park [18].
2.3. HEC-HMS and HEC-RAS Model Theory
HEC-HMS and HEC-RAS were used to develop the dam break and inundation modeling. Numerous previous studies have shown these models to provide ac-curate and useful results in flood-related studies [19] [20].
The watershed runoff to reservoir was modeled using HEC-HMS. HEC-HMS was developed by the US Army Corps of Engineers and designed to simulate the rainfall–runoff processes of dendritic watershed systems. During the runoff process, the infiltration capacity (Ia) is quantified by the Soil Conservation Ser-vice-Curve Number (SCS-CN) based on land use and hydrologic soil group. The runoff is calculated from the following set of empirical equations:
( ) ( )( )2 a aQ P I P I S= − − + (1)
0.2aI S= (2)
( )1000 CN 10S = − (3)
( ) ( )20.2 0.8Q P S P S= − + (4)
where Q is the runoff, P is the rainfall, S is the maximum potential reten-

C.-G. Jung, S.-J. Kim
DOI: 10.4236/as.2017.810079 1094 Agricultural Sciences
tion, aI is the initial abstraction, and CN is the runoff curve number. The flood wave propagation by dam breakage was modeled using HEC-RAS. HEC-RAS calculates one-dimensional steady and unsteady flow, and the model equations are described by Horritt and Bates [21]. The system requires the output hydro-graph from the HMS as input, and the parameters are representative cross-sections, including left and right bank locations, Manning’s roughness coefficients, and contraction and expansion coefficients. To develop the flood-plain maps, a digital elevation model (DEM) was formed by channel geometry. The flood wave is calculated by the following kinematic wave equation and wa-tershed parameters (K, Tc) are calculated by Kraven and Sabol equations.
1 1 2 2 Q V A V A= = (5)
fQ C S= (6)
2 31C ARn
= (7)
2 1.46 0.0867
cTK
LA
=−
(8)
0.5150.444cLT
S= (9)
where Q is the flow discharge (m3/s), iV is the average velocity at cross-section i (m/s), iA is the area at cross-section i (m2), R is the hydraulic radius (m), n is Manning’s roughness coefficient, C is the conveyance (m5/3), fS is the av-erage friction slope between adjacent cross-sections, A is the watershed area (km2), L is the river length (km), S is the watershed slope, K is the storage constant (hr) from Kraven equation, and cT is the concentration time (hr) from Sabol equation.
2.4. Dam-Break Simulation Using HEC-HMS
The dam break was established using HEC-HMS, developed by the US Army Corps of Engineers. HEC-HMS allows the modeler to choose two different me-thods for computing outflow through two dam-breach options: overtopping and piping.
Two cases were applied in this study because the break cause was unknown. The ‘overtopping dam break’ is designed to represent failures caused by over-topping of the dam. This failure is most common in earthen dams but may also occur in concrete arch, concrete gravity, or roller-compacted dams as well. The failure begins when the appreciable amount of water begins flowing over or around the dam face. Another method is designed to represent failures caused by piping inside of the dam, called “piping dam-break”. This failure typically occurs only in earthen dams. The failure begins when water naturally seeping through the dam core increases in velocity and a sufficient quantity of fine sediment

C.-G. Jung, S.-J. Kim
DOI: 10.4236/as.2017.810079 1095 Agricultural Sciences
moves out of the soil matrix. If a sufficient amount of material erodes, then a direct piping connection may
be established from the reservoir water to the dam face. Once such a piping connection is formed, it is almost impossible to stop the dam from failing. The method begins the failure at a point in the dam face and expands it as a circular opening. When the opening reaches the top of the dam, it continues expanding as a trapezoidal shape. The flow through the circular opening is modeled as ori-fice flow, whereas it is modeled as weir flow in the second stage [22].
To apply dam break model, we need information on the collapse width, slope, and shape for collapse duration, cause of collapse, inflow hydrograph, and downstream cross section. The Goeyeon reservoir is a small reservoir and has no specifications related to the reservoir. Table 2 summarizes the data of the col-lapse width and slope data collected through various media. According to the Yeongcheon station from the Meteorological Agency, cumulative rainfall from 7:00 am on August 20, 2014 to 9:00 am on August 21, 2014 is 92.6 mm, and it is confirmed that rainfall has ended before 9:00 am on August 21. Therefore, the reservoir level at the time of the collapse was a high water level, and we applied to the dam break model assuming no additional inflow. Figure 4 shows the rainfall hyetograph at Yeongcheon station during the collapse period. In this study, two collapse scenarios such as piping and overtopping were applied by fixing the collapse width (20 m), and slope (1:1) and considering construction year.
Table 2. Reservoir specification and collapse observation information.
Collapse information Reservoir information
Height (m)
Width (m)
Slope Dam Type Dam crest
(EL. m) Storage capacity
(m3) Reservoir length
(m) Drainage area
(ha)
5.5 20.0 1:1 Fill dam 183.7 61,000 160.0 125.0
Figure 4. Location of the study watershed and locations of the weather, streamflow, and water quality gauging stations.

C.-G. Jung, S.-J. Kim
DOI: 10.4236/as.2017.810079 1096 Agricultural Sciences
2.5. Dam-Break Simulation Using HEC-HMS
The one-dimensional hydraulic model of HEC-RAS is widely and commonly used to analyze the water surface profile, flow characteristics, and hydraulic structure. HEC-RAS computes the water surface elevation and velocity at suc-cessive cross-sections by solving continuity, energy, and flow resistance equa-tions in a scheme called the standard step-backwater method [3] [23]. In this study, the excess water from the broken dam calculated by HEC-HMS was ap-plied to HEC-RAS as a boundary condition, and the flood inundation map was visualized using the HEC-GeoRAS module, the extended module of ArcView and ArcMap and developed by Hydrologic Engineering Center of U.S. Army Corps of Engineers and ESRI (Environmental Systems Research Institute). The basic structural dam information, watershed-and reservoir-related data, and downstream topographic data were collected from a national [24]. Figure 5 shows the flowchart of the study.
2.6. Digital Surface Model and Elevation-Storage Curve: UAV Observations
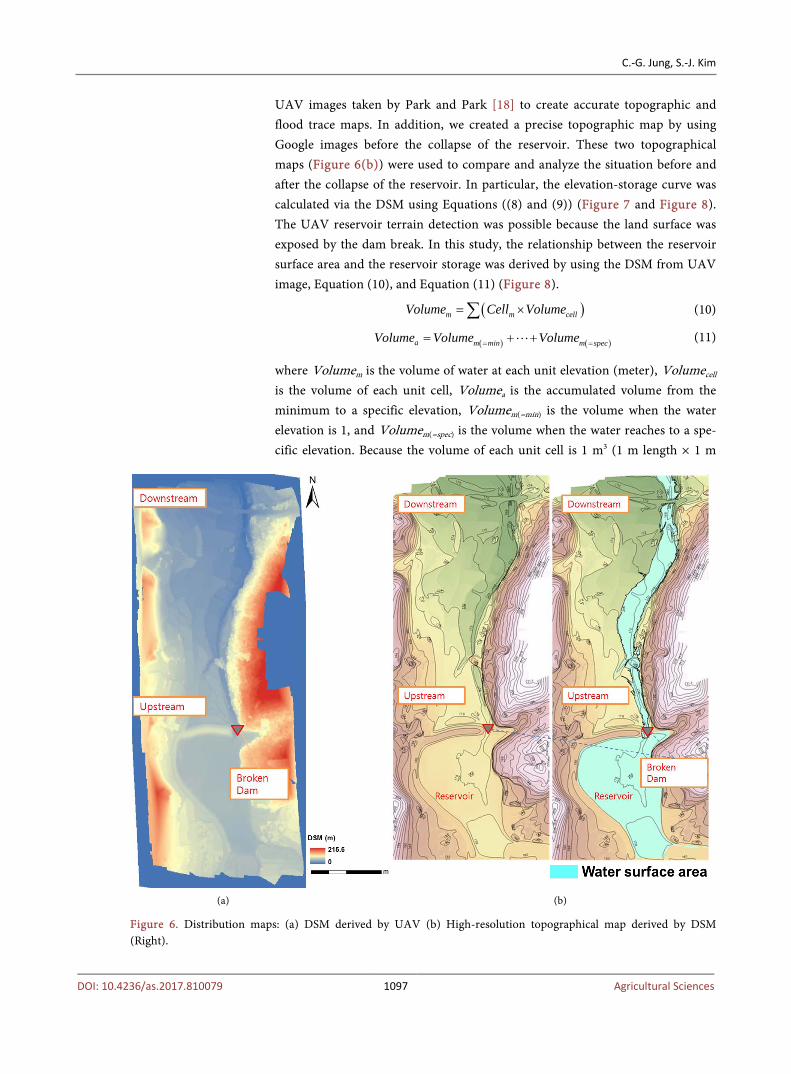
Using the UAV, the DSM (Digital Surface Model) was obtained on August 21st, 2014 under the broken dam with almost empty reservoir and downstream dam-aged area exposed condition. The DSM data were collected from a UAV to ex-tract the detailed topography of the channel and inside the reservoir to ensure reliable hydraulic modeling results (Figure 6). Most of the reservoirs in South Korea were located at valley. These reservoirs of valley type have no actual survey data as well as satellite and aerial image data. Therefore, UAV images have the advantage of being able to accurately analyze the damage situation by capturing the disaster area in a timely manner when it is needed. In this study, we used the
Figure 5. Flow chart of thist study.
C.-G. Jung, S.-J. Kim
DOI: 10.4236/as.2017.810079 1097 Agricultural Sciences
UAV images taken by Park and Park [18] to create accurate topographic and flood trace maps. In addition, we created a precise topographic map by using Google images before the collapse of the reservoir. These two topographical maps (Figure 6(b)) were used to compare and analyze the situation before and after the collapse of the reservoir. In particular, the elevation-storage curve was calculated via the DSM using Equations ((8) and (9)) (Figure 7 and Figure 8). The UAV reservoir terrain detection was possible because the land surface was exposed by the dam break. In this study, the relationship between the reservoir surface area and the reservoir storage was derived by using the DSM from UAV image, Equation (10), and Equation (11) (Figure 8).
( )m m cellVolume Cell Volume= ×∑ (10)
( ) ( )a m min m specVolume Volume Volume= == + + (11)
where Volumem is the volume of water at each unit elevation (meter), Volumecell is the volume of each unit cell, Volumea is the accumulated volume from the minimum to a specific elevation, Volumem(=min) is the volume when the water elevation is 1, and Volumem(=spec) is the volume when the water reaches to a spe-cific elevation. Because the volume of each unit cell is 1 m3 (1 m length × 1 m
(a) (b)
Figure 6. Distribution maps: (a) DSM derived by UAV (b) High-resolution topographical map derived by DSM (Right).
C.-G. Jung, S.-J. Kim
DOI: 10.4236/as.2017.810079 1098 Agricultural Sciences
(a) (b)
(c) (d)
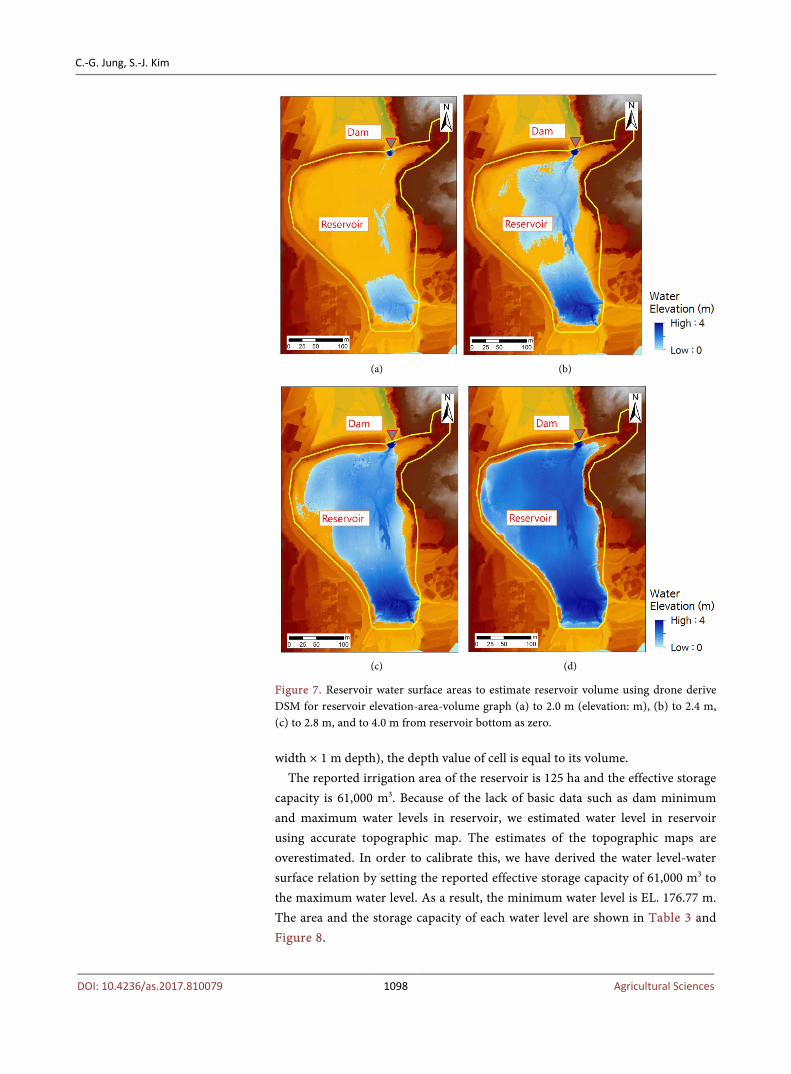
Figure 7. Reservoir water surface areas to estimate reservoir volume using drone derive DSM for reservoir elevation-area-volume graph (a) to 2.0 m (elevation: m), (b) to 2.4 m, (c) to 2.8 m, and to 4.0 m from reservoir bottom as zero.
width × 1 m depth), the depth value of cell is equal to its volume.
The reported irrigation area of the reservoir is 125 ha and the effective storage capacity is 61,000 m3. Because of the lack of basic data such as dam minimum and maximum water levels in reservoir, we estimated water level in reservoir using accurate topographic map. The estimates of the topographic maps are overestimated. In order to calibrate this, we have derived the water level-water surface relation by setting the reported effective storage capacity of 61,000 m3 to the maximum water level. As a result, the minimum water level is EL. 176.77 m. The area and the storage capacity of each water level are shown in Table 3 and Figure 8.

C.-G. Jung, S.-J. Kim
DOI: 10.4236/as.2017.810079 1099 Agricultural Sciences
Table 3. Estimated water level-surface area and storage capacity.
Elevation (EL. m) Storage Area (m2) Storage Capacity (m3)
178.2 1370 1100
178.4 2750 3000
178.6 5500 6000
178.8 8100 10,000
179.0 14,000 19,000
179.2 24,750 35,000
179.4 35,750 50,000
179.6 38,500 61,000
Figure 8. The estimated relationship between reservoir elevation-area-volume a graph using drone derived DSM.
3. Results and Discussion 3.1. Calibration of Watershed Parameters in Ungagged Watershed
from HEC-HMS
Calibration of the model with appropriate data is a crucial step in the creation of a reliable basin representation. Watershed parameters such as infiltration coeffi-cients, time of concentration, and baseflow may need modification to produce a best fit between model and observations. However, this study watershed as un-gagged watershed has not directly measured runoff at reach or reservoir inflow. So, watershed parameters such as CN, K, TC were calculated from Equations ((3), (8), and (9)) without optimization process with observed runoff. Neverthe-less, because the model calibration process is necessary, the watershed parameters

C.-G. Jung, S.-J. Kim
DOI: 10.4236/as.2017.810079 1100 Agricultural Sciences
were adjusted using actual flood map from UAV images. Table 4 shows the final watershed parameters and watershed characteristics.
3.2. HEC-HMS Dam Breach and HEC-RAS Inundation Modeling
Figure 9 shows the discharge of water with 2 dam-break scenarios; (a) overtop-ping and (b) piping. According to the national hazard investigation report [24], the initial reservoir water level was set to 98% of full water level. The duration time of dam failure was set to 30 min. Under the condition of maximum 61,400 m3 reservoir storage amount pouring to the downstream area, the peak discharge was up to 107.9 m3/sec by overtopping and 140.2 m3/sec by piping failure, re-spectively. To calculate the downstream inundation area and depth, HEC-RAS used the HEC-HMS flood wave discharges of Figure 8 as the boundary condi-tions, and the results were represented by HEC-GeoRAS. Figure 9 shows the es-timated flood mapping results with two dam-break scenarios. To evaluate the performance of the model, the F statistic used Equation (12) to compare the drone and HEC-RAS inundation areas [3] [20] [25].
100op
o p op
AF
A A A
= × + − (12)
where oA is the UAV observed area of inundation, pA is the HEC-RAS-predicted area of inundation, and opA is the overlapped area between oA and pA . The
Table 4. Reservoir specification and collapse observation information.
Watershed characteristics Reservoir information
Area (km2) L (km) Slope (%) CN Tc (hr) K (hr)
4.9 3.2 34.9 86.7 2.44 1.91
Figure 9. Flood wave discharge graph by dam-break using HEC-HMS: Case of (a) Overtopping and (b) Piping.

C.-G. Jung, S.-J. Kim
DOI: 10.4236/as.2017.810079 1101 Agricultural Sciences
F statistic varies from “100” when observed and predicted areas coincide per-fectly to “0” when there is no overlap between the predicted and observed areas.
The inundation map indicated using UAV is the actual observation data, so it can be seen as flood trace. Two methods were used to evaluate flood inundation according to the collapse runoff of Goeyeon reservoir for the most suitable floodplain. The first is a simple comparison by area, and the second is the com-parison of the flood trace using the Lee Sallee Shape Index (LSSI) method. The LSSI method is a method of measuring the degree of agreement between two data by overlapping the reference data with the measurement data [26]. In other words, the intersection area between the two data is divided by the union area, and the value is calculated as the generalized index. The index means indicator that measures the degree of spatial alignment between two data. The reference data in this study is flood trace from UAV and the measured data is each scena-rio result (Table 5). Figure 10 shows the UAV observed damaged areas with
Table 5. Results of dam-break scenarios.
Scenario Flood area (m2) F (%) A - B (m2) A∩B (m2) A∪B (m2) A∩B/A∪B
Piping (B) 15,931.3 54.8 3084.9 8857.2 16,398.2 0.54
Overtopping (B) 11,918.4 59.0 2077.9 9864.2 12,552.9 0.79
Observed UAV (A) 11,941.9
A: Inundation trace map using UAV, B: Flood inundation maps by scenario.
(a) (b)
Figure 10. The HEC-RAS simulated inundation areas and depth distributions in case of (a) Overtop-ping and (b) Piping dam break conditions.
C.-G. Jung, S.-J. Kim
DOI: 10.4236/as.2017.810079 1102 Agricultural Sciences
11,941.9 m2 (Ao) and the HEC-RAS dam break simulated damaged areas for (a) overtopping with 11,918.4 m2 (Ap_over) and (b) piping with 15,931.3 m2 (Ap_pipe) respectively. The UAV overlapped areas for overtopping (Aop_over) and piping (Aop_pipe) simulations were 9864 m2 and 8857 m2 with F values of 59.0% and 54.8% respectively.
For overtopping dam break, the flood depth ranged from 0.1 to 2.2 m after the peak discharge of 15 - 20 mins. As seen in Figure 10, the piping dam-break sce-nario simulated more inundation areas especially in the middle of the down-stream area as the peak discharge was 32.3 m3/sec higher than that in the over-topping scenario. Thus, we can infer that the dam would be broken by overtop-ping phenomenon. Looking at the areas between UAV and overtopping dam-aged areas, the difference increased at the end of downstream area. The errors may come from the road location crossing the stream at the end of downstream and the flood discharges along the roads. Otherwise, there is a possibility that the rice paddies at the downstream areas were inundated but they were not damaged by the flood wave attenuation.
4. Summary and Conclusions
In this study, the flood-damaged areas caused by a dam-break accident were in-vestigated using a UAV, and the collected data were compared with the HEC-RAS simulation results. For a small agricultural reservoir of 61,400 m3 wa-ter storage broken by 89.0 mm rainfall event in August 21st, 2014, the 2 dam-break scenarios of overtopping and piping were tested. To estimate the HEC-HMS pa-rameters for the elevation-storage relationship of the reservoir, the high-resolution DSM was collected from drone surveying. The dam-break results by HEC-HMS were transferred to the HEC-RAS as the boundary conditions, and the flood areas and depth were expressed by using the HEC-GeoRAS module over the DSM map.
The peak discharges for overtopping and piping failure were 107.9 m3/sec and 140.2 m3/sec, respectively, with flood inundation depths of 0.1 - 2.2 m in the downstream area. From the distribution of the inundation areas from each dam-break scenario, we could infer that the dam was broken by the overtopping phenomenon. The discordance between the areas increased when it goes to the downstream area. The paddy rice near the dam was lodged by the fast velocity of the flood wave, but the far-downstream rice was less affected by the attenuated flood wave and recovered after drainage. In addition, the UAV surveying proved to be a valuable tool for the identification of flood-damaged areas and for eco-nomic loss evaluation.
The result of the dam-break in this study showed that the reservoir collapsed by overtopping. Overall, we proposed the application method of UAV data in ungagged area such as small reservoir watershed. The result from this study can be used to predict the risk of collapse of old and small reservoirs. Therefore, small and old reservoirs must once again make a safety review in ungagged area
C.-G. Jung, S.-J. Kim
DOI: 10.4236/as.2017.810079 1103 Agricultural Sciences
where flooding has occurred in the past using UAV and modeling to prevent re-servoir collapse. Then, action plan is provided for each reservoir level.
Acknowledgements
This research was supported by a grant (17AWMP-B079625-04) from the Water Management Research Program funded by the Ministry of Land, Infrastructure and Transport of the Korean government.
References [1] You, L., Li, C., Min, X. and Xiaolei, T. (2012) Review of Dam-Break Research of
Earth-Rock Dam Combining with Dam Safety Management. Procedia Engineering, 28, 382-388. https://doi.org/10.1016/j.proeng.2012.01.737
[2] Carling, P., Villanueva, I., Herget, J., Wright, N., Borodavko, P. and Mornav, H. (2010) Unsteady 1D and 2D Hydraulic Models with Ice Dam Break for Quaternary Megaflood, Altia Mountains, Southern Siberia. Global Planet Change, 70, 24-34. https://doi.org/10.1016/j.gloplacha.2009.11.005
[3] Sarhadi, A., Soltani, S. and Modarres, R. (2012) Probabilistic Flood Inundation Mapping of Ungauged Rivers: Linking GIS Techniques and Frequency Analysis. Journal of Hydrology, 458-459, 68-86. https://doi.org/10.1016/j.jhydrol.2012.06.039
[4] Evangelista, S.L., Altinakar, M., Cristo, C.D. and Leopardi, A. (2013) Simulation of Dam-Break Waves on Movable Beds Using a Multi-Stage Centered Scheme. Inter-national Journal of Sediment Research, 28, 269-284. https://doi.org/10.1016/S1001-6279(13)60039-6
[5] Prakash, M., Rothauge, K. and Cleary, P.W. (2014) Modelling the Impact of Dam Failure Scenarios on Flood Inundation Using SPH. Applied Mathematical Model-ling, 38, 5515-5534. https://doi.org/10.1016/j.apm.2014.03.011
[6] Li, M., Shao, Q., Zhang, L. and Chiew, F.H.S. (2010) A New Regionalization Ap-proach and Its Application to Predict Flow Duration Curve in Ungauged Basins. Journal of Hydrology, 389, 137-145. https://doi.org/10.1016/j.jhydrol.2010.05.039
[7] Noman, N.S., Nelson, E.J. and Zundel, A.K. (2001) Review of Automated Flood-plain Delineation from Digital Terrain Models. Journal of Water Resources Plan-ning and Management, 127, 394-402. https://doi.org/10.1061/(ASCE)0733-9496(2001)127:6(394)
[8] Martinez, J.M. and Toan, T.L. (2007) Mapping of Flood Dynamics and Spatial Dis-tribution of Vegetation in the Amazon Floodplain Using Multi-Temporal SAR Da-ta. Remote Sensing of Environment, 108, 209-223. https://doi.org/10.1016/j.rse.2006.11.012
[9] Sanders, B.F. (2007) Evaluation of On-Line DEMs for Flood Inundation Modeling. Advances in Water Resources, 30, 1831-1843. https://doi.org/10.1016/j.advwatres.2007.02.005
[10] Schumann, G. (2007) High-Resolution 3-D Flood Information from Radar Imagery for Flood Hazard Management. IEEE Transactions on Geoscience and Remote Sensing, 45, 1715-1725. https://doi.org/10.1109/TGRS.2006.888103
[11] Aggett, G.R. and Wilson, J.P. (2009) Creating and Computing a High-Resolution DTM with a 1-D Hydraulic Model in GIS for Scenario-Based Assessment of Avul-sion Hazard in Grave-Bed River. Geomorphology, 113, 21-34.
C.-G. Jung, S.-J. Kim
DOI: 10.4236/as.2017.810079 1104 Agricultural Sciences
[12] Chen, Y.D., Hill, A.A. and Urbano, L.D. (2009) A GIS-Based Model for Urban Flood Inundation. Journal of Hydrology, 373, 184-192.
[13] Geerling, G.W., Vreeken-Buijs, M.J., Jesse, P., Ragas, A.M.J. and Smits, A.J. (2009) Mapping River Floodplain Ecotopes by Segmentation of Spectral (CASI) and Struc-tural (LiDAR) Remote Sensing. River Research and Applications, 25, 795-813. https://doi.org/10.1002/rra.1181
[14] Li, Y., Gong, J.H., Zhu, J., Ye, L., Song, Y.Q. and Yue, Y.J. (2012) Efficient Dam Break Flood Simulation Methods for Developing a Preliminary Evacuation Plan af-ter the Wenchuan Earthquake. Natural Hazards and Earth System Sciences, 12, 97-106. https://doi.org/10.5194/nhess-12-97-2012
[15] Kääb, A. and Leprince, S. (2014) Motion Detection using Near-Simultaneous Satel-lite Acquisitions. Remote Sensing of Environment, 154, 164-179.
[16] Tauro, F., Petroselli, A. and Arcangeletti, E. (2015) Assessment of Drone-Based Surface Flow Observations, Hydrological Processes.
[17] Detert, M. and Weitbrecht, V. (2015) A Low-Cost Airborne Velocimetry System: Proof of Concept. Journal of Hydraulic Research, 53, 532-539. https://doi.org/10.1080/00221686.2015.1054322
[18] Park, J.K. and Park, J.H. (2015) Reservoir Failure Monitoring and Identified by the UAV Aerial Images. Journal of Hydraulics Engineering, 11, 155-167. (In Korean)
[19] Ahrens, S.R. and Maidment, D.R. (1999) Flood Forecasting for the Buffalo Bayou using CRWR-PrePro and HEC-HMS (CRWR Report 99-6). Center for Research in Water Resources, Austin.
[20] Anderson, M.L., Chen, Z.Q., Kavvas, M.L. and Feldman, A. (2002) Coupling HEC-HMS with Atmospheric Models for Prediction of Watershed Runoff. Journal of Hydrologic Engineering, 7, 312-318. https://doi.org/10.1061/(ASCE)1084-0699(2002)7:4(312)
[21] Horritt, M.S. and Bates, P.D. (2002) Evaluation of 1D and 2D Numerical Models for Predicting River Flood Inundation. Journal of Hydrology, 268, 87-99.
[22] US Army Corps of Engineers (2010a) HEC-HMS User’s Manual. US Army Corps of Engineers, Davis.
[23] US Army Corps of Engineers (2010b) HEC-RAS User’s Manual. US Army Corps of Engineers, Davis.
[24] Korea Rural Community Corporation (2014) National Hazard Investigation Report. Korea Rural Community Corporation, South Korea. (In Korean)
[25] Bates, P.D. and De Roo, A.P.J. (2000) A Simple Raster-Based Model for Flood In-undation Simulation. Journal of Hydrology, 236, 54-77.
[26] Clarke, K.C., Hoppen, S. and Gaydos, L.J. (1996) Method and Techniques for Ri-gorous Calibration of a Cellular Automaton Model of Urban Growth. Proceedings, 3rd International Conference/Workshop on Integrating Geographic Information Systems and Environmental Modeling, Santa Fe, 21-25 January 1996.