comparison of structural design in high and ultra …
TRANSCRIPT

Lukáš Faturík Libor Trško Slavomír Hrček Otakar Bokůvka
ISSN 1333-1124 eISSN 1849-1391
COMPARISON OF STRUCTURAL DESIGN IN HIGH AND ULTRA-HIGH CYCLE FATIGUE REGIONS
UDC 669.15:539.42
Summary
Ultra-high cycle fatigue of structural materials has been an extensively investigated phenomenon in the last thirty years. Nevertheless, the fact that there is no infinite fatigue life of metallic materials has not been considered in structural design very often. This paper presents the results of 50CrMo4 low alloy steel fatigue tests in the high and the ultra-high cycle region showing a considerable difference in the fatigue strength for N = 107 and N = 109 loading cycles. A comparison of shaft mechanical design for different required fatigue lifetimes is provided showing a necessity of designs changes to achieve safe operation in the ultra-high cycle region, thus leading to a 10 % increase in the weight of the shaft.
Key words: 50CrMo4 steel, ultra-high cycle fatigue, high frequency fatigue testing, mechanical design, shaft
1. Introduction
The present development of new industrial machines which require higher efficiency and cost savings must provide a possibility of higher loadings, higher operating speeds and high reliability with fewer requirements for maintenance. For example, components of the high speed train Shinkanzen have to withstand approximately 109 cycles in 10 years of operation and failure of a main component can have fatal consequences [1]. These facts have imposed requirements for fatigue life testing in the so-called ultra-high cycle (UHC) region. Then, it must be assessed if the fatigue strength of a material could be really considered constant for more than 10 million cycles, which is the usual number of cycles used to determine the so-called fatigue limit. From the first tests performed by exceeding the number of cycles used for the determination of conventional fatigue limit it was obvious that fatigue failures can occur even at lower values of applied stress amplitudes than that of the fatigue limit, which means after a number of cycles much above 107 [2-5].
Except for special applications including aeronautical structures or jet engines, the decrease in fatigue strength after the conventional fatigue limit is not considered in ordinary structural applications. It is assumed that the decrease in the fatigue limit is compensated for by the safety coefficients which are used in mechanical design. However, due to the weight and the cost efficiency, there is a trend towards decreasing these safety coefficients as much as possible. Nowadays, a great number of common structural components often greatly
TRANSACTIONS OF FAMENA XXXVIII-4 (2014) 1
L. Faturík, L. Trško Comparison of Structural Design in High and S. Hrček, O. Bokůvka Ultra-High Cycle Fatigue Region
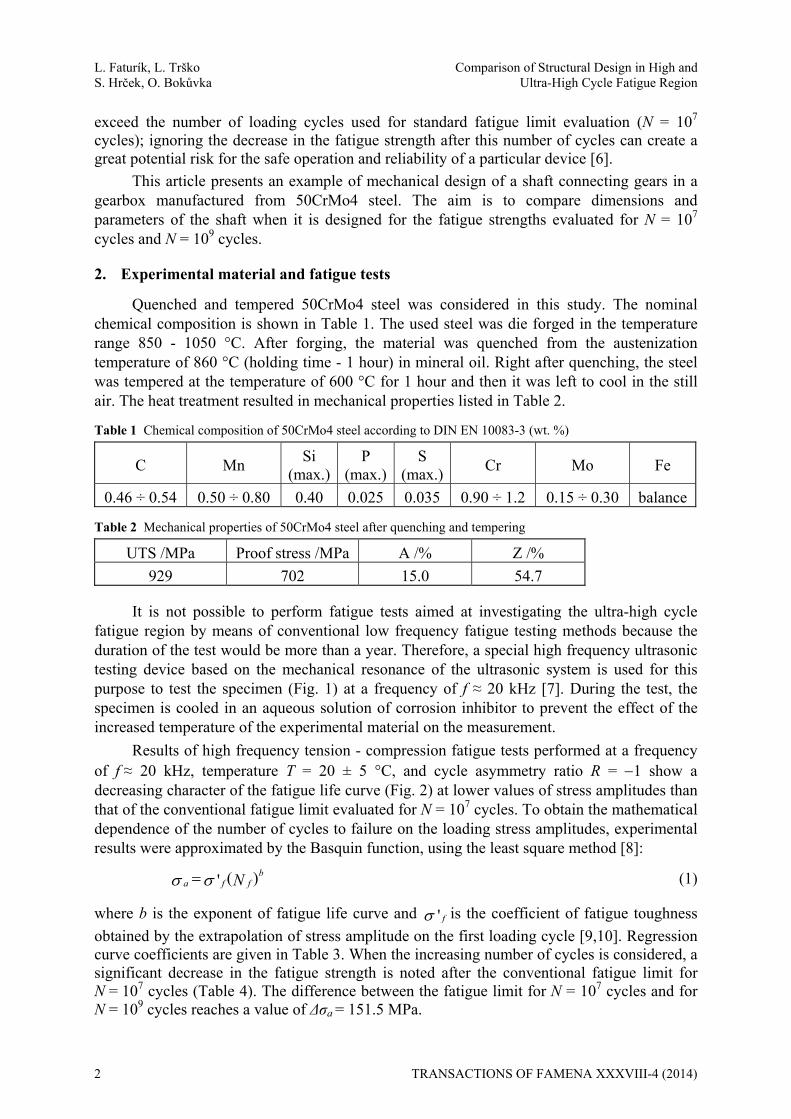
exceed the number of loading cycles used for standard fatigue limit evaluation (N = 107 cycles); ignoring the decrease in the fatigue strength after this number of cycles can create a great potential risk for the safe operation and reliability of a particular device [6].
This article presents an example of mechanical design of a shaft connecting gears in a gearbox manufactured from 50CrMo4 steel. The aim is to compare dimensions and parameters of the shaft when it is designed for the fatigue strengths evaluated for N = 107 cycles and N = 109 cycles.
2. Experimental material and fatigue tests
Quenched and tempered 50CrMo4 steel was considered in this study. The nominal chemical composition is shown in Table 1. The used steel was die forged in the temperature range 850 - 1050 °C. After forging, the material was quenched from the austenization temperature of 860 °C (holding time - 1 hour) in mineral oil. Right after quenching, the steel was tempered at the temperature of 600 °C for 1 hour and then it was left to cool in the still air. The heat treatment resulted in mechanical properties listed in Table 2.
Table 1 Chemical composition of 50CrMo4 steel according to DIN EN 10083-3 (wt. %)
C Mn Si
(max.)P
(max.)S
(max.)Cr Mo Fe
0.46 ÷ 0.54 0.50 ÷ 0.80 0.40 0.025 0.035 0.90 ÷ 1.2 0.15 ÷ 0.30 balance
Table 2 Mechanical properties of 50CrMo4 steel after quenching and tempering
UTS /MPa Proof stress /MPa A /% Z /%
929 702 15.0 54.7
It is not possible to perform fatigue tests aimed at investigating the ultra-high cycle fatigue region by means of conventional low frequency fatigue testing methods because the duration of the test would be more than a year. Therefore, a special high frequency ultrasonic testing device based on the mechanical resonance of the ultrasonic system is used for this purpose to test the specimen (Fig. 1) at a frequency of f ≈ 20 kHz [7]. During the test, the specimen is cooled in an aqueous solution of corrosion inhibitor to prevent the effect of the increased temperature of the experimental material on the measurement.
Results of high frequency tension - compression fatigue tests performed at a frequency of f ≈ 20 kHz, temperature T = 20 ± 5 °C, and cycle asymmetry ratio R = 1 show a decreasing character of the fatigue life curve (Fig. 2) at lower values of stress amplitudes than that of the conventional fatigue limit evaluated for N = 107 cycles. To obtain the mathematical dependence of the number of cycles to failure on the loading stress amplitudes, experimental results were approximated by the Basquin function, using the least square method [8]:
( )'b
a f fN (1)
where b is the exponent of fatigue life curve and ' f is the coefficient of fatigue toughness
obtained by the extrapolation of stress amplitude on the first loading cycle [9,10]. Regression curve coefficients are given in Table 3. When the increasing number of cycles is considered, a significant decrease in the fatigue strength is noted after the conventional fatigue limit for N = 107 cycles (Table 4). The difference between the fatigue limit for N = 107 cycles and for N = 109 cycles reaches a value of Δσa = 151.5 MPa.
2 TRANSACTIONS OF FAMENA XXXVIII-4 (2014)

Comparison of Structural Design in High and L. Faturík, L. Trško Ultra-High Cycle Fatigue Region S. Hrček, O. Bokůvka
Fig. 1 Device for ultrasonic fatigue tests at frequency f ≈ 20 kHz
Fig. 2 S – N curve of 50CrMo4 steel
Table 3 Regression curve coefficients
Material σ’f /MPa b
50CrMo4 1869 -0.0873
Table 4 Fatigue strength for different numbers of loading cycles according to regression curves
Fatigue strength for N = 107 /MPa
Fatigue strength for N = 108 /MPa
Fatigue strength for N = 109 /MPa
457.6 374.3 306.1
TRANSACTIONS OF FAMENA XXXVIII-4 (2014) 3
L. Faturík, L. Trško Comparison of Structural Design in High and S. Hrček, O. Bokůvka Ultra-High Cycle Fatigue Region
3. Mechanical design of a shaft for different fatigue limits
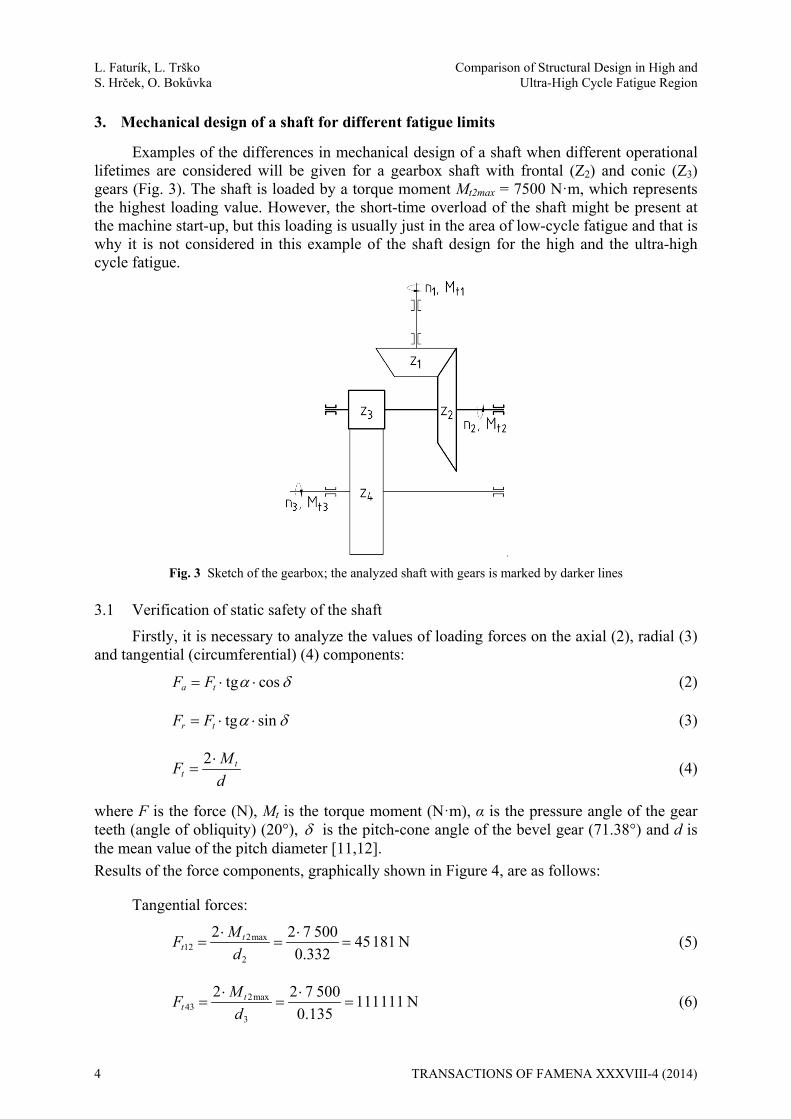
Examples of the differences in mechanical design of a shaft when different operational lifetimes are considered will be given for a gearbox shaft with frontal (Z2) and conic (Z3) gears (Fig. 3). The shaft is loaded by a torque moment Mt2max = 7500 N·m, which represents the highest loading value. However, the short-time overload of the shaft might be present at the machine start-up, but this loading is usually just in the area of low-cycle fatigue and that is why it is not considered in this example of the shaft design for the high and the ultra-high cycle fatigue.
Fig. 3 Sketch of the gearbox; the analyzed shaft with gears is marked by darker lines
3.1 Verification of static safety of the shaft
Firstly, it is necessary to analyze the values of loading forces on the axial (2), radial (3) and tangential (circumferential) (4) components:
tg cosa tF F (2)
tg sinr tF F (3)
2 tt
MF
d
(4)
where F is the force (N), Mt is the torque moment (N·m), α is the pressure angle of the gear teeth (angle of obliquity) (20°), is the pitch-cone angle of the bevel gear (71.38°) and d is the mean value of the pitch diameter [11,12].
Results of the force components, graphically shown in Figure 4, are as follows:
Tangential forces:
2max12
2
2 2 7 50045181 N
0.332t
t
MF
d
(5)
2max43
3
2 2 7 500111111 N
0.135t
t
MF
d
(6)
4 TRANSACTIONS OF FAMENA XXXVIII-4 (2014)

Comparison of Structural Design in High and L. Faturík, L. Trško Ultra-High Cycle Fatigue Region S. Hrček, O. Bokůvka
Radial forces:
12 12 2tg sin 45181 tg 20 sin 71.38 15 584 Nr tF F (7)
43 43 2tg sin 111111 tg 20 sin 71.38 40 441 Nr tF F (8)
Axial forces:
12 12 2tg cos 45181 tg 20 cos 71.38 5 251 Na tF F (9)
043 aF (10)
Fig. 4 Sketch for the analysis of the axial (Fa), radial (Fr) and tangential (Ft) components of the loading forces
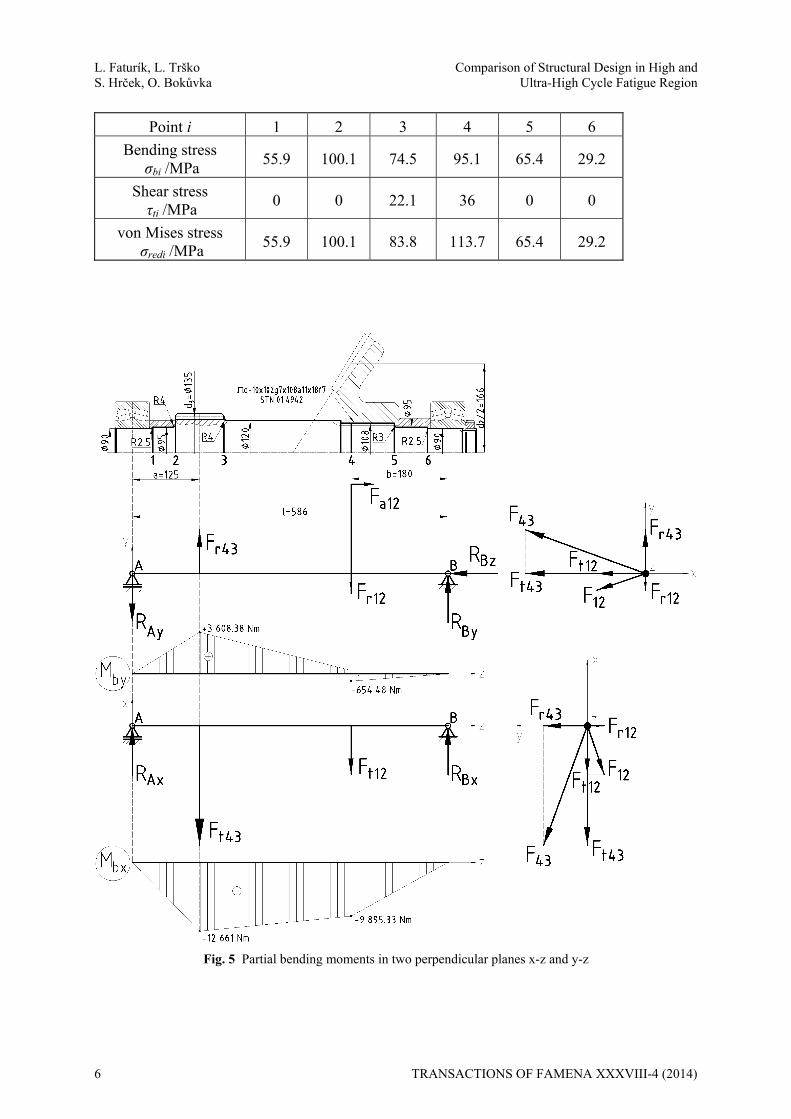
Since the loading forces Ft, Fr and Fa are not oriented in the same plane, it is necessary to analyze the bending moments in two perpendicular planes, x-z and y-z (Fig. 5). The resulting bending moments are obtained by the vector sum of the partial bending moments (Fig. 6). To analyze the stress in the shaft, it is necessary to consider loadings in the points 1-6 (marked in Figs. 5 and 6). Table 5 shows the values of the bending stress (11), shear stress (12) and von Mises stress (13) which are obtained using the following equations:
bibi
bi
M
W (11)
tiki
ti
M
W (12)
2 23red bi ti (13)
where bi is the bending stress (Pa), ki is the shear stress (Pa), red is the von Mises stress,
Mb is the bending moment (N·m), Wb is the bending section modulus (m3), Mt is the torque
moment (N·m), Wt is the torque section modulus (m3), and t is the shear stress (Pa) [13,14].
Table 5 Resulting bending and torque moments in points 1 – 6
Point i 1 2 3 4 5 6
Bending moment Mbi /Nm
4 002.2 8 425.7 12643.1 9 905.3 5 502.9 2 091.1
Torque moment Mt2-i /Nm
0 0 7500 7500 0 0
TRANSACTIONS OF FAMENA XXXVIII-4 (2014) 5
L. Faturík, L. Trško Comparison of Structural Design in High and S. Hrček, O. Bokůvka Ultra-High Cycle Fatigue Region
Point i 1 2 3 4 5 6
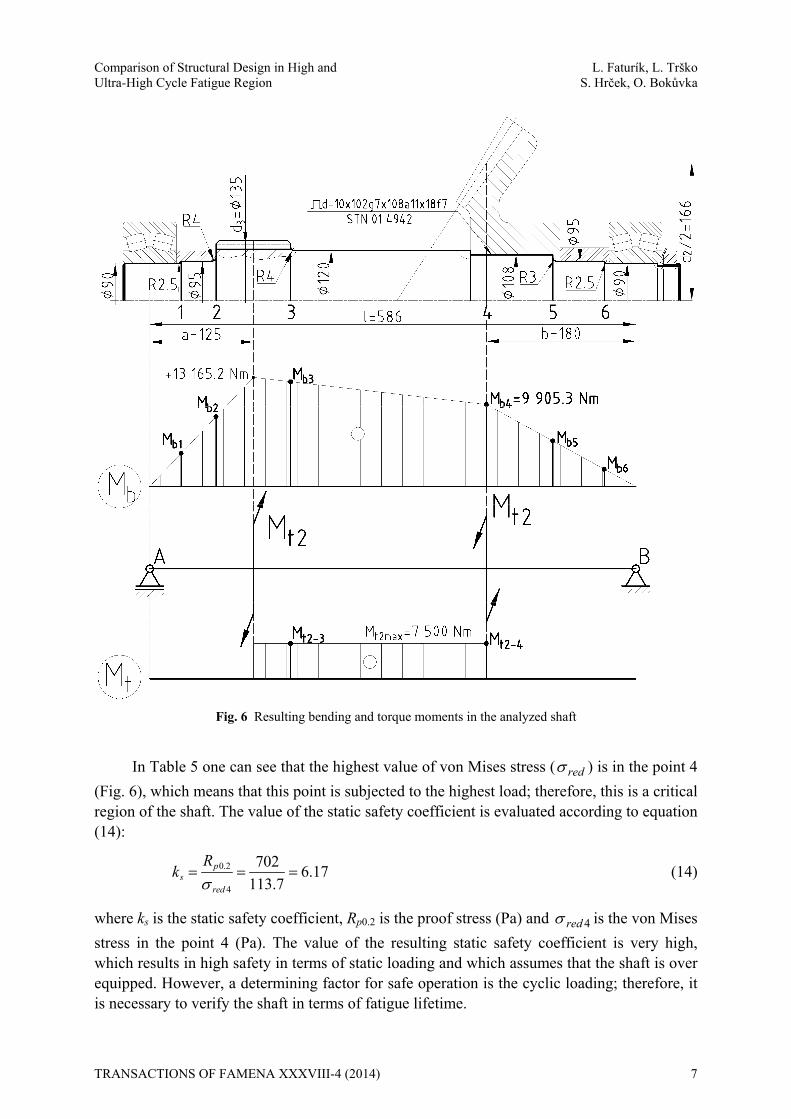
Bending stress σbi /MPa
55.9 100.1 74.5 95.1 65.4 29.2
Shear stress τti /MPa
0 0 22.1 36 0 0
von Mises stress σredi /MPa
55.9 100.1 83.8 113.7 65.4 29.2
Fig. 5 Partial bending moments in two perpendicular planes x-z and y-z
6 TRANSACTIONS OF FAMENA XXXVIII-4 (2014)
Comparison of Structural Design in High and L. Faturík, L. Trško Ultra-High Cycle Fatigue Region S. Hrček, O. Bokůvka
Fig. 6 Resulting bending and torque moments in the analyzed shaft
In Table 5 one can see that the highest value of von Mises stress ( red ) is in the point 4
(Fig. 6), which means that this point is subjected to the highest load; therefore, this is a critical region of the shaft. The value of the static safety coefficient is evaluated according to equation (14):
0.2
4
7026.17
113.7p
sred
Rk
(14)
where ks is the static safety coefficient, Rp0.2 is the proof stress (Pa) and 4red is the von Mises
stress in the point 4 (Pa). The value of the resulting static safety coefficient is very high, which results in high safety in terms of static loading and which assumes that the shaft is over equipped. However, a determining factor for safe operation is the cyclic loading; therefore, it is necessary to verify the shaft in terms of fatigue lifetime.
TRANSACTIONS OF FAMENA XXXVIII-4 (2014) 7
L. Faturík, L. Trško Comparison of Structural Design in High and S. Hrček, O. Bokůvka Ultra-High Cycle Fatigue Region
3.2 Verification of fatigue safety of the shaft
The shaft fatigue safety will be verified in the points 2 and 4 (Fig. 6) where the highest static loadings and also notches are present. The example of verification of point 4 is drawn in detail and the results for both verified points are given in Table 6. To compare the differences in the shaft size, the shaft safety will be verified with respect to the fatigue strength in the regions of high-cycle fatigue (N = 107 cycles) and of ultra-high-cycle fatigue (N = 109 cycles).
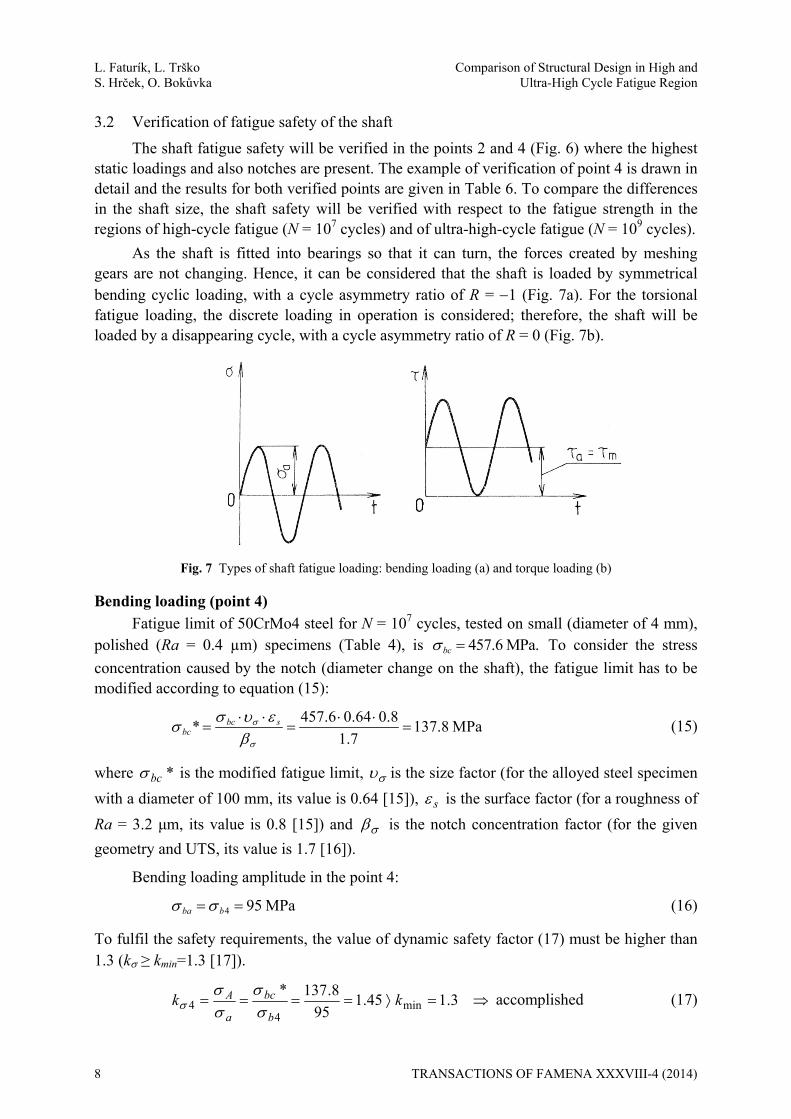
As the shaft is fitted into bearings so that it can turn, the forces created by meshing gears are not changing. Hence, it can be considered that the shaft is loaded by symmetrical bending cyclic loading, with a cycle asymmetry ratio of R = 1 (Fig. 7a). For the torsional fatigue loading, the discrete loading in operation is considered; therefore, the shaft will be loaded by a disappearing cycle, with a cycle asymmetry ratio of R = 0 (Fig. 7b).
Fig. 7 Types of shaft fatigue loading: bending loading (a) and torque loading (b)
Bending loading (point 4)
Fatigue limit of 50CrMo4 steel for N = 107 cycles, tested on small (diameter of 4 mm), polished (Ra = 0.4 µm) specimens (Table 4), is 457.6 MPa.bc To consider the stress
concentration caused by the notch (diameter change on the shaft), the fatigue limit has to be modified according to equation (15):
457.6 0.64 0.8* 137.8 MPa
1.7bc s
bc
(15)
where *bc is the modified fatigue limit, is the size factor (for the alloyed steel specimen
with a diameter of 100 mm, its value is 0.64 [15]), s is the surface factor (for a roughness of
Ra = 3.2 μm, its value is 0.8 [15]) and is the notch concentration factor (for the given
geometry and UTS, its value is 1.7 [16]).
Bending loading amplitude in the point 4:
4 95 MPaba b (16)
To fulfil the safety requirements, the value of dynamic safety factor (17) must be higher than 1.3 (k ≥ kmin=1.3 [17]).
3.145.195
8.137*min
44 kk
b
bc
a
A
accomplished (17)
8 TRANSACTIONS OF FAMENA XXXVIII-4 (2014)

Comparison of Structural Design in High and L. Faturík, L. Trško Ultra-High Cycle Fatigue Region S. Hrček, O. Bokůvka
Torque loading (point 4)
Fatigue limit for the torque loading of 50CrMo4 steel evaluated for N = 107 cycles is
0.57 0.57 457.6 260.8 MPatc bc (18)
However, this value is obtained from the fatigue limit determined by fatigue tests carried out at R = -1 and the torque loading is considered as R = 0. This means that the safety verification according to Eq. 21 must be done using a coefficient of the material sensitivity to the loading cycle asymmetry , which covers a potential difference in the fatigue limits
obtained at different cycle asymmetry ratios.
Fatigue limit for torque loading when the notch is considered:
260.8 0.72 0.8* 96.9 MPa
1.55tc s
tc
(19)
where *tc is the modified fatigue limit, is the size factor (for the alloyed steel specimen
with a diameter of 100 mm, its value is 0.72 [15]), s is the surface factor (for the roughness
Ra = 3.2 μm, its value is 0.8 [15]) and is the notch concentration factor (for the given
geometry and UTS, its value is 1.55 [16]).
Torque loading amplitude in the point 4 is expressed as:
4 3618 MPa
2 2t
ta
(20)
where 4t is the maximal shear stress in the point 4 (Table 5).
Again, in order to fulfill the safety requirements, the value of dynamic safety factor (21) must be higher than 1.3 (k ≥ kmin=1.3 [17]).
4
4 min
* 96.9 0.05 185.33
185.33 1.3 accomplished
A kc m
a ka
k
k k
(21)
where m is the mean shear stress, is the factor representing the material sensitivity to the
loading cycle asymmetry (for shear stress and UTS, it is = 0.05 [17]).
The total safety coefficient under the action of shear and normal stresses (point 4) (22):
min2 2 2 2
1.45 5.331.4 1.3
1.45 5.33red
k kk k
k k
accomplished (22)
where k represents the dynamic safety factor for normal stress and k represents the
dynamic safety factor for tangential stress.
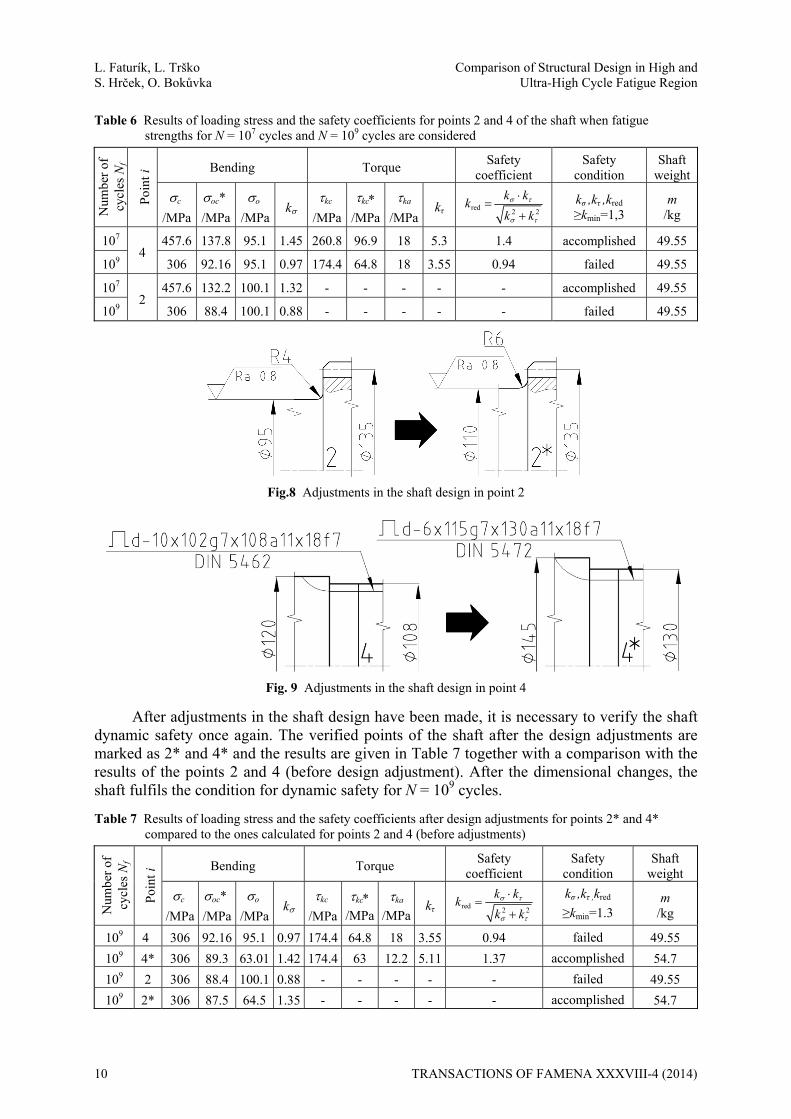
The results given in Table 6 show that the points 4 and 6 fulfil the condition for dynamic safety kred for N = 107 cycles, but not for N = 109 cycles. To satisfy the condition of dynamic safety for the shaft, it is necessary to make adjustments in the shaft design. In the point 2, the diameter size should be increased from 95 mm to 110 mm as well as the notch radius from 4 mm to 6 mm to decrease the notch concentration effect (Fig. 8). In the point 4, the shaft diameters should be increased and also the size of the splining according to Fig. 9.
TRANSACTIONS OF FAMENA XXXVIII-4 (2014) 9
L. Faturík, L. Trško Comparison of Structural Design in High and S. Hrček, O. Bokůvka Ultra-High Cycle Fatigue Region
Table 6 Results of loading stress and the safety coefficients for points 2 and 4 of the shaft when fatigue strengths for N = 107 cycles and N = 109 cycles are considered
Num
ber
of
cycl
es N
f
Poi
nt i Bending Torque
Safety coefficient
Safety condition
Shaft weight
cMPa
oc*MPa
oMPa
k kcMPa
kcMPa
kaMPa
kτ red2 2
k kk
k k
kσ ,kτ ,kred
≥kmin=1,3 m
/kg
107
4 457.6 137.8 95.1 1.45 260.8 96.9 18 5.3 1.4 accomplished 49.55
109 306 92.16 95.1 0.97 174.4 64.8 18 3.55 0.94 failed 49.55
107
2 457.6 132.2 100.1 1.32 - - - - - accomplished 49.55
109 306 88.4 100.1 0.88 - - - - - failed 49.55
Fig.8 Adjustments in the shaft design in point 2
Fig. 9 Adjustments in the shaft design in point 4
After adjustments in the shaft design have been made, it is necessary to verify the shaft dynamic safety once again. The verified points of the shaft after the design adjustments are marked as 2* and 4* and the results are given in Table 7 together with a comparison with the results of the points 2 and 4 (before design adjustment). After the dimensional changes, the shaft fulfils the condition for dynamic safety for N = 109 cycles.
Table 7 Results of loading stress and the safety coefficients after design adjustments for points 2* and 4* compared to the ones calculated for points 2 and 4 (before adjustments)
Num
ber
of
cycl
es N
f
Poi
nt i Bending Torque
Safety coefficient
Safety condition
Shaft weight
cMPa
oc*MPa
oMPa
k kcMPa
kc/MPa
ka/MPa
kτ red2 2
k kk
k k
kσ ,kτ ,kred
≥kmin=1.3 m
/kg
109 4 306 92.16 95.1 0.97 174.4 64.8 18 3.55 0.94 failed 49.55
109 4* 306 89.3 63.01 1.42 174.4 63 12.2 5.11 1.37 accomplished 54.7
109 2 306 88.4 100.1 0.88 - - - - - failed 49.55
109 2* 306 87.5 64.5 1.35 - - - - - accomplished 54.7
10 TRANSACTIONS OF FAMENA XXXVIII-4 (2014)
Comparison of Structural Design in High and L. Faturík, L. Trško Ultra-High Cycle Fatigue Region S. Hrček, O. Bokůvka
4. Discussion
In the engineering practice of mechanical component design the fatigue limit obtained for N = 107 cycles is still often considered as the loading stress amplitude which provides an infinite fatigue life to the component. However, this approach cannot be adopted generally for all materials and the materials with high strength show a continuous decrease in the fatigue strength with respect to higher number of cycles [18]. This was also the case with the 50CrMo4 structural steel, where the ultrasonic fatigue tests (f ≈ 20 kHz, T = 20 ± 5 °C, R = 1) showed a decrease in fatigue strength from σa = 457.6 MPa for N = 107 cycles to σa = 306.1 MPa for N = 109 cycles. This represents a considerable difference in the fatigue strength of Δσa = 151.5 MPa. It can be noted that this data was obtained at high frequency testing conditions, but it has been claimed that, due to the low displacement amplitude, the deformation rate does not differ significantly from conventional tests and the influence of the high frequency is negligible [5].
According to the described conventional mechanical design of a cyclically loaded component, it is obvious that if a component is designed for the fatigue strength evaluated for N = 107 cycles it does not fulfil the safety and reliability requirements for higher numbers of cycles. The difference in fatigue strength for different numbers of loading cycles is not often covered by the safety coefficient and it is necessary to increase the component size and change the geometry of various structural notches to ensure the safe operation of the component. In this particular example, the weight of the shaft was increased by about 10 % (from 49.55 kg to 54.7 kg).
5. Conclusions
According to fatigue tests performed on 50CrMo4 structural steel in the high and the ultra-high cycle region and to the example of shaft structural design for the fatigue strength evaluated at N = 107 and N = 109 cycles, the following can be stated:
the S – N curve of 50CrMo4 steel does not have a flat character after N = 107 cycles and the fatigue strength continuously decreases with the increasing number of cycles,
the decrease in the fatigue strength in the range from N = 107 to N = 109 cycles is Δσa = 151.5 MPa,
the example of cyclically loaded shaft in a gearbox with respect to the dynamic safety coefficient kred = 1.3 shows a considerable difference in the shaft dimensions when N = 107 or N = 109 cycles are considered in the design,
the design of the shaft for N = 109 cycles causes an increase in the shaft weight by about 10 % when compared to the design for N = 107 cycles.
Acknowledgement
The research was supported by the following institutions with projects:
European Regional Development Fund and the Slovak State Budget for the project “Research Centre of University of Žilina”, ITMS 26220220183 (50 %).
Slovak Research and Development Agency under the contract no. APVV-0419-11 - Adaptation of modern computer-simulation methods to the development of rolling bearings and their verification in real conditions (25 %).
Scientific Grant Agency of the Ministry of Education, Science, Research and Sport of the Slovak Republic under the contract no. V-1/0396/14 (25 %).
TRANSACTIONS OF FAMENA XXXVIII-4 (2014) 11

L. Faturík, L. Trško Comparison of Structural Design in High and S. Hrček, O. Bokůvka Ultra-High Cycle Fatigue Region
REFERENCES
[1] Y. Murakami, Metal Fatigue: Effects of Small Defects and Nonmetallic Inclusions. first ed., Elsevier Oxford, 2002.
[2] S.E. Stanzl-Tschegg: Fatigue Fract. Eng. Mater. Struct., 22(7), 1999, pp. 567–579.
[3] C. Bathias: There Is No Infinite Fatigue Life in Metallic Materials. Fatigue Fract. Eng. Mater. Struct., 22(7), 1999, pp. 559–565.
[4] R.O. Ritchie, D.L. Davidson, B. L Boyce, J.P. Campbell, 0. Roder, High-Cycle Fatigue of Ti-6A1-4V, Fatigue Fract. Eng. Mater. Struct., 22(7), 1999, pp. 621–631.
[5] O. Bokůvka et al., Low and High Frequency Fatigue Testing. EDIS ŽU Žilina, 2000.
[6] Nicholas, T. 2006: High Cycle Fatigue: A Mechanics of Materials Perspective. 1. vyd. Oxford: Elsevier, 2006.
[7] Puškár, A. 1997. Vysokofrekvenčná únava materiálov (High frequency fatigue of materials). EDIS ŽU Žilina, 1997.
[8] J. Kohout, S. Věchet: A new function for fatigue curves characterization and its multiple merits. International Journal of Fatigue, 23 (2001), pp.175-183.
[9] Nový, F. – Trško, L. – Bokůvka, O.: Dynamic strength and fatigue lifetime : exercises instructions. EDIS ŽU Žilina, 2013.
[10] Skočovský, P. et al. 2006: Náuka o materiáli pre odbory strojnícke (Material science for students of mechanical engineering). EDIS ŽU Žilina, 2006 (in Slovak).
[11] Bolek, A. et al..: Časti strojů 1. svazek (Machine parts 1. volume). SNTL Praha, 1989 (in Czech).
[12] Bolek, A. et al.: Časti strojů 2. svazek (Machine parts 2. volume). SNTL Praha, 1990 (in Czech).
[13] Várkolyová, B., Dekýš, V., Toth, Ľ.: Pružnosť a pevnosť I (Advanced strength and applied elasticity I). VTS pri ŽU v Žiline, 2006 (in Slovak).
[14] Kohár, R et al.: Aplikácia optimalizačných algoritmov v mechanike telies (Application of optimization algorithms in the mechanics of bodies). VTS Žilina, 2006 (in Slovak).
[15] Leinveber, J., Vávra, P.: Strojnické tabulky (Handbook of mechanical engineering). ALBRA, Úvaly, 2006 (in Czech).
[16] Filo, M. et al.: Časti a mechanizmy strojov, príklady (Parts and machine mechanisms, examples). ALFA Bratislava, 1990 (in Slovak).
[17] Málik, L. et al.: Časti a mechanizmy strojov (Parts and machine mechanisms). EDIS ŽU Žilina, 2003 (in Slovak).
[18] Nový, F. – Bokůvka, O. – Mintách, R. – Trško, L.: Influence of steels strength on the ultra-high cycle fatigue lifetime, In: Perners Contacts Vol. VI, No. 2, May 2011, pp. 131-135.
Submitted: 02.4.2014 Accepted: 10.12.2014
Ing. Lukáš Faturík, PhD. doc. Ing. Slavomír Hrček PhD. Department of Design and Mechanical Elements, Faculty of Mechanical Engineering, University of Žilina, Univerzitná 8215/1, 010 26 Žilina, Slovak Republic. Ing. Libor Trško, PhD. Research Centre of University of Žilina, Univerzitná 8215/1, 010 26 Žilina, Slovak Republic. prof. Ing. Otakar Bokůvka, PhD. Department of Materials Engineering, Faculty of Mechanical Engineering, University of Žilina, Univerzitná 8215/1, 010 26 Žilina, Slovak Republic.
12 TRANSACTIONS OF FAMENA XXXVIII-4 (2014)