comparison of pseudo-static, newmark and dynamic response ... · newmark displacement analysis is a...
TRANSCRIPT
* Corresponding author Tel/Fax: +98-56-32202133. E-mail address: [email protected] (H. Noferesti).
Journal Homepage: ijmge.ut.ac.ir
Comparison of pseudo-static, Newmark and dynamic response analyses of final pit wall of the Sungun Copper Mine
Ayyoob Hazegh a, Hossain Noferesti a, *
a Faculty of Engineering, University of Birjand, Birjand, Iran
A B S T R A C T
The Sungun Copper Mine is located in a highly hazardous seismic area. Most recently, the Ahar-Varzeqan earthquake, M 6.2, occurred on August 11, 2012; at a distance about 40 kilometers away from the mine. Nevertheless, the seismic stability of the final pit wall was not comprehensively reviewed. In this research, the southwestern wall of Sungun’s final pit was investigated through pseudo-static, Newmark and numerical methods. Moreover, some of the difficulties in accomplishing and interpreting the results in dynamic analyses of a mining slope is explained. Pseudo-static analyses revealed that the final pit wall is not safe against the design earthquake, and it is highly prone to failure. The results of Newmark analysis proved that a large failing region would form in the case of design earthquake. Based on a dynamic numerical analysis on the pit wall, continuous forward and downward earthquake-induced movements were observed, as well, which might be a sign of pit wall instability. The effect of underground water drainage on stability of the pit wall was investigated in the numerical model. Resulted time histories of displacements in the drained pit wall proved that only water drainage is sufficient for protecting the pit wall against the design earthquake.
Keywords : Dynamic analysis, Newmark displacement analysis, Seismic stability, Sungun Copper Mine
1. Introduction
Regarding the safety and economy of an open pit mine, the design of the final pit slope is a difficult task. The reason is that rocks are extremely complex materials; their properties change in short distances and often have fractures with weak materials. Other complexities include the presence of water, and static or dynamic loads [1].
Mining slopes may experience vibrations of natural earthquakes or blasting operations. Compared to blasting operations, earthquakes induce large forces and accelerations over a region, and therefore, slope stability assessment against earthquake loading is essentially demanded. Earthquake vibrations can generate large inertial forces that induce significant horizontal and vertical stresses in the pit wall. Large inertial forces backed by pre-existing static forces eventually may lead to instability of the pit wall.
The common methods for slope stability analyses in a seismic zone include:
- Pseudo-static analysis - Newmark displacement analysis - Dynamic numerical analysis Pseudo-static stability analysis is a widely used limit equilibrium
method that replaces the effect of dynamic earthquake loads by a constant equivalent-static acceleration [2, 3].
Newmark displacement analysis is a straightforward method in which an estimation of permanent deformation during an earthquake is made and then compared to what is regarded as acceptable deformation [4].
For large steep slopes located in a seismic area, the use of dynamic numerical analysis is recommended. Dynamic analysis is usually performed with the finite element or finite difference method [5]. An actual dynamic analysis is an exhaustive task that requires an extensive
database and specialized skills [6]. Attempts were made in this paper to explain some of the confusions in performing and understanding the results of a dynamic analysis through a case study.
The area of study is situated in a highly hazardous seismic area. However, the stability of its final slope under dynamic loads has not been comprehensively reviewed. Previous studies on the Sungun Mine focused on stability of the pit wall in static or pseudo-static conditions. Heidari and Taherian (2005) investigated the wall near the concentrator plant by analyzing various 2D FLAC models in a static state. The results showed that if an effective drainage system is implemented, the overall stability of the wall will not cause any particular short-term problems. In long-term stability, the wall must be reinforced by rock support systems [7]. Monjezi and Rezakhah (2007) considered five vertical sections of the pit in different parts of the mine, which were analyzed using the FLAC software in static conditions. They found the mine slopes to be critical in the south and southwest [8]. Using the limit equilibrium method, Abbaszadeh et al. (2011) carried out a probabilistic slope stability analysis on southwest and northwest walls of the mine. Variations in the overall reliability index of the safety factor were observed between the two slopes. These changes were explained by the difference in geological complexity within the section [9].
In this paper, the southwestern wall of the final pit was studied by pseudo-static, Newmark and numerical methods and the results showed that the pit wall is not safe against a major earthquake in a saturated condition.
2. Geological and geotechnical properties of the Mine
The Sungun Copper Mine is located in the northwest of Iran, in Azerbaijan province, 30 kilometers from the Varzeqan and 110 kilometers from Tabriz. Sungun is a porphyry deposit and mostly
Article History: Received: 06 March 2017, Revised: 19 December 2017, Accepted: 03 February 2018.
142 A Hazegh and H. Noferesti / Int. J. Min. & Geo-Eng. (IJMGE), 52-2 (2018) 1-6
includes molybdenum and copper minerals. This mine is the second largest copper producer in Iran. The sum of proven reserves, probable reserves, and possible reserves is equal to 1.7 billion metric tons of copper ore with an average grade of 0.61 percent [10]. The designed mine pit for Sungun is a half circle pit with a short wall on the eastern side and high walls in other directions.
The mine is located in a mountainous region with an average altitude of 2000 meters above sea level. The primary geological structures in the Sungun region include reverse and thrust faults with a northwest-southeast strike and a southwest dip-direction. In addition to the faults, multiple quartz dioritic - granodioritic and dioritic dikes are the other most abundant geological structures in the Sungun region. The main fault of the Sungun region passes through the southern section of the pit, which is a reverse fault and has created a widespread crushed area in the pit wall. The dominant rock type of the mine is Sungun Porphyry, which includes porphyritic copper ores influenced by Potassic, Phyllic, and Argillic alterations [10].
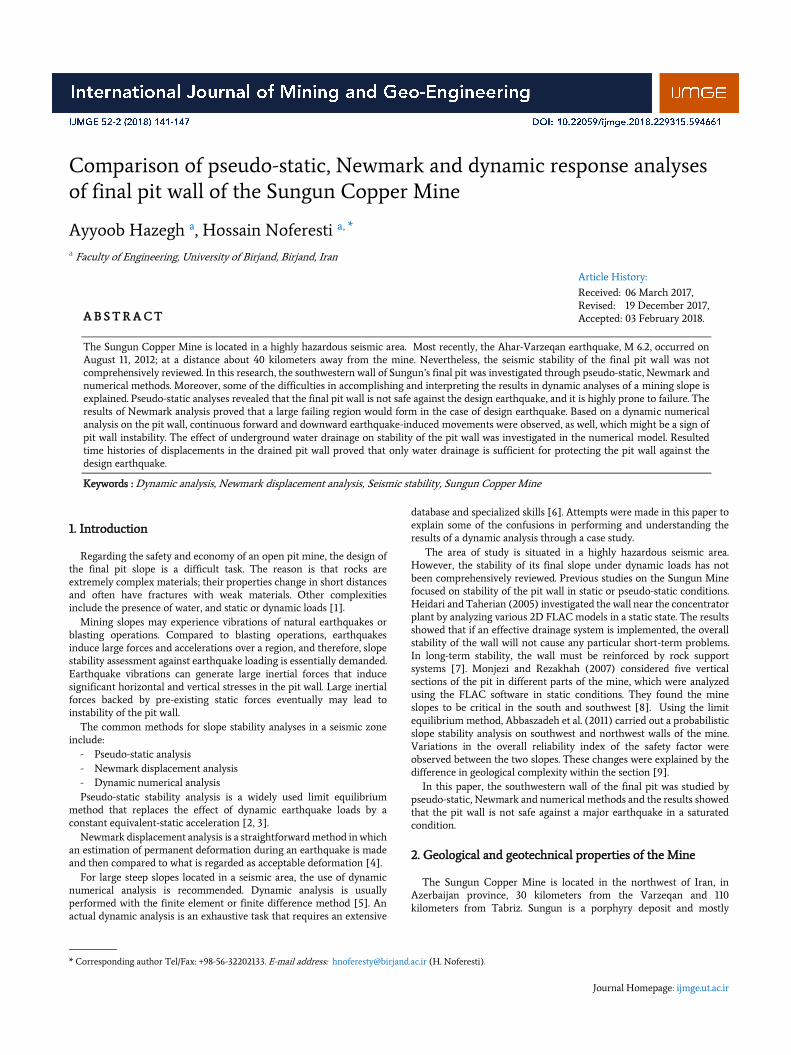
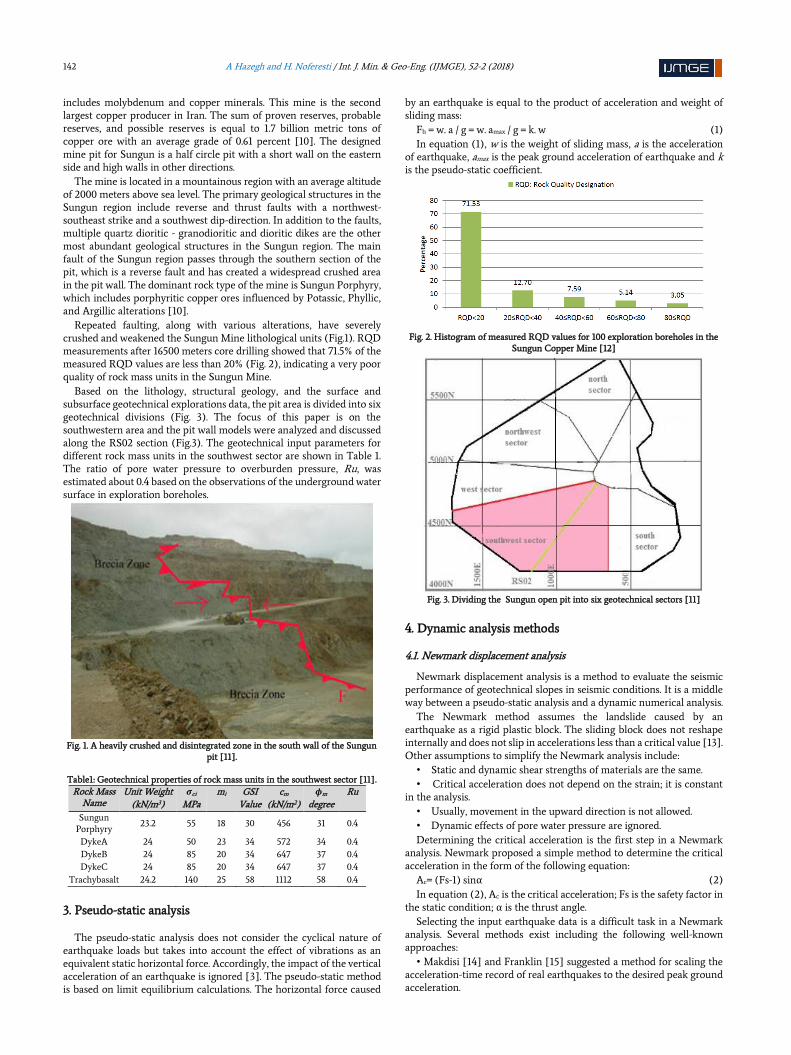
Repeated faulting, along with various alterations, have severely crushed and weakened the Sungun Mine lithological units (Fig.1). RQD measurements after 16500 meters core drilling showed that 71.5% of the measured RQD values are less than 20% (Fig. 2), indicating a very poor quality of rock mass units in the Sungun Mine.
Based on the lithology, structural geology, and the surface and subsurface geotechnical explorations data, the pit area is divided into six geotechnical divisions (Fig. 3). The focus of this paper is on the southwestern area and the pit wall models were analyzed and discussed along the RS02 section (Fig.3). The geotechnical input parameters for different rock mass units in the southwest sector are shown in Table 1. The ratio of pore water pressure to overburden pressure, Ru, was estimated about 0.4 based on the observations of the underground water surface in exploration boreholes.
Fig. 1. A heavily crushed and disintegrated zone in the south wall of the Sungun
pit [11].
Table1: Geotechnical properties of rock mass units in the southwest sector [11]. Rock Mass
Name Unit Weight
(kN/m3) σci
MPa mi GSI
Value cm
(kN/m2) ϕm
degree Ru
Sungun Porphyry
23.2 55 18 30 456 31 0.4
DykeA 24 50 23 34 572 34 0.4 DykeB 24 85 20 34 647 37 0.4 DykeC 24 85 20 34 647 37 0.4
Trachybasalt 24.2 140 25 58 1112 58 0.4
3. Pseudo-static analysis
The pseudo-static analysis does not consider the cyclical nature of earthquake loads but takes into account the effect of vibrations as an equivalent static horizontal force. Accordingly, the impact of the vertical acceleration of an earthquake is ignored [3]. The pseudo-static method is based on limit equilibrium calculations. The horizontal force caused
by an earthquake is equal to the product of acceleration and weight of sliding mass:
Fh = w. a / g = w. amax / g = k. w (1) In equation (1), w is the weight of sliding mass, a is the acceleration
of earthquake, amax is the peak ground acceleration of earthquake and k is the pseudo-static coefficient.
Fig. 2. Histogram of measured RQD values for 100 exploration boreholes in the
Sungun Copper Mine [12]
Fig. 3. Dividing the Sungun open pit into six geotechnical sectors [11]
4. Dynamic analysis methods
4.1. Newmark displacement analysis
Newmark displacement analysis is a method to evaluate the seismic performance of geotechnical slopes in seismic conditions. It is a middle way between a pseudo-static analysis and a dynamic numerical analysis.
The Newmark method assumes the landslide caused by an earthquake as a rigid plastic block. The sliding block does not reshape internally and does not slip in accelerations less than a critical value [13]. Other assumptions to simplify the Newmark analysis include:
• Static and dynamic shear strengths of materials are the same. • Critical acceleration does not depend on the strain; it is constant
in the analysis. • Usually, movement in the upward direction is not allowed. • Dynamic effects of pore water pressure are ignored. Determining the critical acceleration is the first step in a Newmark
analysis. Newmark proposed a simple method to determine the critical acceleration in the form of the following equation:
Ac= (Fs-1) sinα (2) In equation (2), Ac is the critical acceleration; Fs is the safety factor in
the static condition; α is the thrust angle. Selecting the input earthquake data is a difficult task in a Newmark
analysis. Several methods exist including the following well-known approaches:
• Makdisi [14] and Franklin [15] suggested a method for scaling the acceleration-time record of real earthquakes to the desired peak ground acceleration.
A Hazegh and H. Noferesti / Int. J. Min. & Geo-Eng. (IJMGE), 52-2 (2018) -6 143
• The use of simple triangular, rectangular or sinusoidal waves rather than real earthquake waves.
Once the critical acceleration of earthquake determined and the acceleration-time graph selected, Newmark displacements are estimated by double integration of the acceleration-time graph in parts that are higher than the critical acceleration value (Fig. 4).
4.2. Dynamic numerical analysis
Dynamic numerical analysis essentially involves the estimation of deformation behavior of a geotechnical slope using the finite element or finite difference methods [5]. These methods use meshing scheme for modeling slopes deformations during an earthquake. Deformations in all nodes of the mesh are calculated based on the material response to applied external loads. Elements normally used in the two-dimensional numerical methods are triangular with three or six nodes or quadrilateral with four or eight nodes. The dynamic numerical analysis is more accurate compared to the pseudo-static or Newmark methods, yet the accuracy of this approach depends on the type of elements, mesh quality, mesh design and model’s structure [17].
To get reliable results from the dynamic numerical analysis, high quality input data, and an advanced modeling procedure is needed. The important capability of dynamic numerical analysis is the detailed representation of slope behavior during an earthquake. The main parameters required include:
• Damping coefficient • Dynamic boundaries • Deformation modulus of materials
Fig. 4: The procedure of displacement calculation in Newmark analysis [16].
4.2.1. Damping coefficient
Fluctuating dynamic systems gradually lose their kinetic energy to reach a static condition. The amount of energy loss is related to the damping rate of the system. In dynamic geotechnical systems, the damping rate itself is connected to internal friction and slip along weak structural surfaces [18]. In practice, determining the damping data for dynamic simulations is difficult, and in some cases, experimental data obtained from various sources are used. Rayleigh damping is an easy way to determine the damping of fluctuating systems. With this type of damping, the damping matrix, which relates the damping force to velocity, is expressed solely regarding the stiffness and mass matrix of the system. Therefore, the damping (C) becomes proportional to the mass (m) and stiffness (k) of the system:
C = αm × m + βk × k (3) In equation (3), αm and βk are constants with s-1 and s units,
respectively.
In a model with multiple degrees of freedom, the system has a large number of natural frequencies, but due to the nature of the problem, a constant level of damping for all frequencies is not possible [19]. Using the Rayleigh damping, it is feasible to determine a damping ratio for two fixed frequencies, and a damping predictor, like the Lagomarsino model [20], defines the rest of frequencies. In this model, usually, the frequencies between the two fixed frequencies hold a damping ratio below the chosen value and frequencies outside this range are damped more heavily.
By specifying the two fixed frequencies and their associated damping ratios, it is possible to calculate the alpha and beta values. On the other hand, the alpha and beta values may be defined explicitly. Setting alpha and beta to zero cause the system to be undamped, making the transient response of the system never to dissipate [19].
4.2.2. Dynamic boundaries
In a dynamic numerical analysis of geotechnical systems, boundaries of the model are divided into real and fictitious boundaries. Fictitious boundaries do not physically exist but are used to enclose an unlimited volume. Use of these borders in dynamic models prevents the retreating waves to reflect and return to the model. The main employed types of boundaries in dynamic models often include absorbing, transmitting, damper, nodal mass, tied and hydro mass.
5. Seismic stability assessment of southwestern wall of Sungun Copper Mine
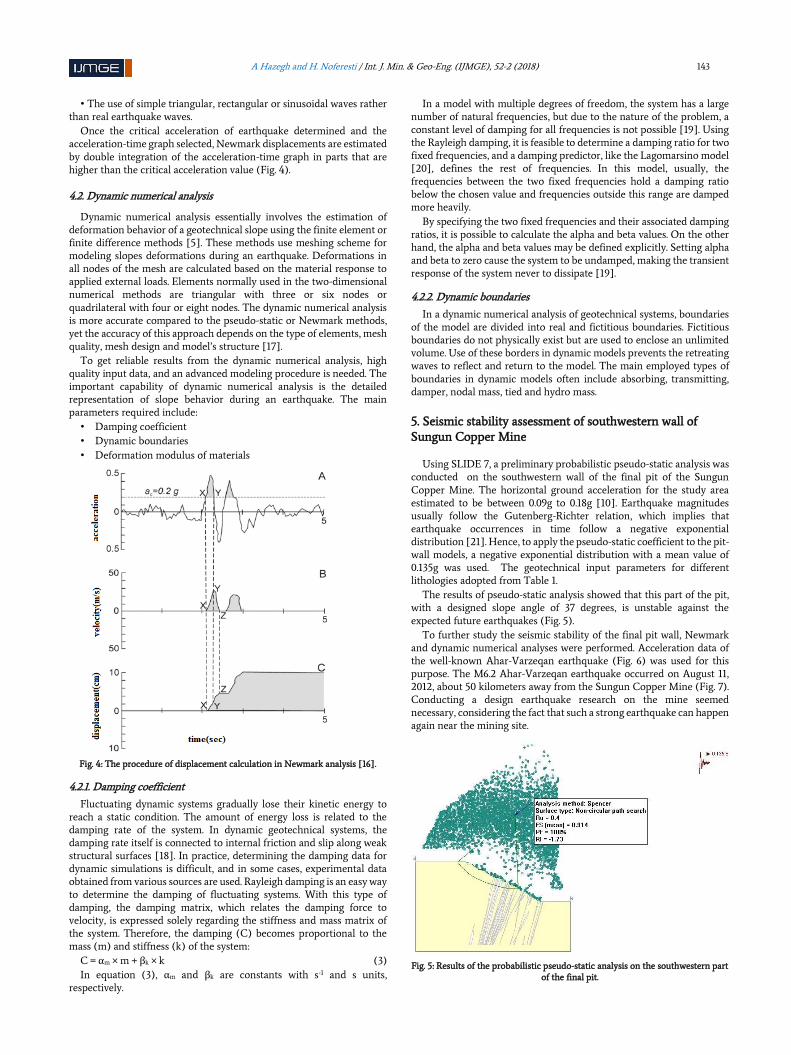
Using SLIDE 7, a preliminary probabilistic pseudo-static analysis was conducted on the southwestern wall of the final pit of the Sungun Copper Mine. The horizontal ground acceleration for the study area estimated to be between 0.09g to 0.18g [10]. Earthquake magnitudes usually follow the Gutenberg-Richter relation, which implies that earthquake occurrences in time follow a negative exponential distribution [21]. Hence, to apply the pseudo-static coefficient to the pit-wall models, a negative exponential distribution with a mean value of 0.135g was used. The geotechnical input parameters for different lithologies adopted from Table 1.
The results of pseudo-static analysis showed that this part of the pit, with a designed slope angle of 37 degrees, is unstable against the expected future earthquakes (Fig. 5).
To further study the seismic stability of the final pit wall, Newmark and dynamic numerical analyses were performed. Acceleration data of the well-known Ahar-Varzeqan earthquake (Fig. 6) was used for this purpose. The M6.2 Ahar-Varzeqan earthquake occurred on August 11, 2012, about 50 kilometers away from the Sungun Copper Mine (Fig. 7). Conducting a design earthquake research on the mine seemed necessary, considering the fact that such a strong earthquake can happen again near the mining site.
Fig. 5: Results of the probabilistic pseudo-static analysis on the southwestern part
of the final pit.

144 A Hazegh and H. Noferesti / Int. J. Min. & Geo-Eng. (IJMGE), 52-2 (2018) 1-6
Fig. 6: Horizontal acceleration data for the Ahar-Varzeqan earthquake recorded
at the Ahar station [22].
Fig. 7: Epicenter of the Ahar-Varzeqan earthquake near the Sungun Copper
Mine. Since the peak horizontal ground acceleration (PHGA) for the
Sungun area is estimated about 0.18g, the original acceleration data scaled down accordingly, and the Newmark analysis of the pit wall was carried out using the scaled data in SLIDE 7. The results, as shown in Fig. 8, forecasted a two-meter-downward displacement for the pit wall if the design earthquake occurs.
In the Newmark analysis on weak geotechnical slopes, like the earth dam slopes, the maximum permissible displacement is usually considered about 1 meter, and in the case of greater displacements, the structure is regarded as failure [5]. Hence, the southwestern pit wall of the Sungun Copper Mine is unstable against the design earthquake.
Complete drainage of the underground water (Ru=0) stabilized the final pit wall. In this case, the maximum displacement reduced to 38.5cm, as shown in Fig. 9; therefore, performing the complete drainage acts as the pit wall safeguard against dynamic earthquake loads.
The RS2 software was used to perform a dynamic numerical analysis on the southwestern pit wall. RS2 is a two-dimensional finite element program with the ability to perform a dynamic analysis on the two-dimensional continuum models of slopes using an acceleration-time record of previous earthquakes. As mentioned in section 2, rock mass units in the Sungun Mine are heavily crushed and disintegrated, especially in the south and southwest. In a completely disintegrated rock mass, the anisotropic effect of joint systems disappears, and the whole mass could be regarded as a weak pseudo-continuum isotropic medium as mentioned by Hoek [23].
The modulus of deformability of rock materials is required for conducting a finite element analysis. Having the results of P-wave velocity measurements in different lithologies of the Sungun Mine [11] and using the Barton relations (Eq. 4 and Eq. 5) [24], the modulus of deformability (Em) for pit wall materials is estimated as shown in Table 2.
Em = 10. Qc1/3 (4) Vp = 3.5+ log Qc
(5) In Eqs. (4-5), Qc is the normalized rock mass quality rating, and Vp is
the P-wave velocity of the rock.
Fig. 8: Results of the Newmark analysis on southwestern final pit wall of the
Sungun Copper Mine
Fig. 9: Results of the Newmark analysis on southwestern part of the final wall
after draining and correcting the slope angle Table2: The estimated modulus of deformability for different lithologies of the
pit wall. Lithology Average P-wave
velocity (m/s) Estimated modulus of
deformability, GPa Sungun porphyry 4437 20.38
Dyke A 4915 29.30 Dyke B 5182 35.88
Before performing a dynamic numerical analysis, three following steps should be completed [19]:
Step one: Deconvolution of the Earthquake Input Earthquake ground motions are usually provided as earth surface
acceleration data. However, for an RS2 earthquake analysis, the seismic input must be applied in the form of velocity data to the base of the model rather than the ground surface. Therefore, “deconvolution” of the given data is needed, such that once it is applied at the base of the model, it correctly simulates the earthquake motion.
The following steps performed in deconvolution of the Ahar-Varzeqan acceleration-time history for a compliant base model:
1. Integration of the acceleration-time history conducted by applying the acceleration-time history to the top of a 1-D column model and measuring the resulting velocity data at a query point on top of the column.
2. Obtained velocity data divided by 2. For a compliant base model, the upward propagating wave train should be used. The upward propagating wave is ½ the outcrop motion [25].
3. The halved velocity data converted to a stress wave and then applied to the base of the slope model.
Step two: Filtering the Input Velocity of Seismic Loading While modeling seismic loading, the numerical accuracy of wave
transmission is determined by the frequency content of the input wave
-2.5
-2
-1.5
-1
-0.5
0
0.5
1
1.5
2
2.5
0 5 10 15 20 25 30
Hor
izon
tal a
ccel
erat
ion,
m/s
2
Time, seconds

A Hazegh and H. Noferesti / Int. J. Min. & Geo-Eng. (IJMGE), 52-2 (2018) -6 145
and the wave speed of the system. For the exact representation of wave transmission within a model, the spatial element size should be [26]:
Element size ≤ λ/10 (6) Where λ is the wavelength related to the highest frequency portion
that holds significant energy. To satisfy the Eq. (6), an unusually fine mesh may be needed that may
lead to an excessive amount of computing time. Fortunately, for most earthquakes, the powerful part of the input velocity wave is carried in the lower-frequency portions [19]. Through filtering the input wave and excluding high-frequency sections, a coarser mesh may be used without significantly influencing the results. Filter frequency for the Ahar-Varzeqan earthquake was selected as 2.9 Hz, and frequencies above this value were excluded from the dynamic analysis (Fig.10).
Fig. 10: Power spectrum of Ahar-Varzeqan earthquake. Filter frequency selected
equal to 2.9 Hz. Step three: Rayleigh Damping For geological materials, damping commonly falls in the range of 2 to
5% of critical [27]. In the present study, considering the weathered condition of the pit wall material, the damping ratio was selected about 5 % for two specified frequencies of the system, i.e., 1Hz and 2Hz.
After completing the above steps, a dynamic analysis was conducted on the southwestern wall of the final pit using the scaled down acceleration data of the Ahar-Varzeqan earthquake. Fig. 11 shows the horizontal displacements of the final pit wall 30 seconds after the design earthquake. According to Fig. 11, maximum horizontal displacements at point A, on the pit wall, reach to 2.6 meters that are relatively large values. The pattern of shear strain development after the design earthquake, as shown in Fig. 12, suggests that a sliding failure has almost occurred.
In Fig. 13, a history of horizontal and vertical displacements is shown, at point A, during the design earthquake. It is seen that continuous forward and downward movements of the pit wall occur. These constant movements toward the pit suggest that a failing region has formed.
Fig. 11: Horizontal displacements of southwestern pit wall 30 seconds after design
earthquake
Fig. 12: Shear strain development in southwestern pit wall 30 seconds after
design earthquake
Fig. 13: Histories of horizontal and vertical displacements at point A on the final
pit wall during the design earthquake Similar to the state of a Newmark analysis, the effect of complete
drainage on stability of the pit wall was investigated by decreasing Ru to zero. Fig. 14 demonstrates the horizontal displacements of the drained pit wall 30 seconds after the design earthquake. As seen in Fig. 14, maximum horizontal displacements reach up to 36 cm that is much less than the displacement values of the undrained pit wall. Fig. 15 shows the contours of shear strain development in the dry pit wall. In contrast to the saturated slope (Fig. 12), it is seen that no sliding surface developed in the case of the drained pit wall. Fig. 16 shows the histories of horizontal and vertical displacements of point A on the drained pit wall. In contrast to Fig. 13, no constant directional movement was observed. Instead, the pit wall is nearly stable and oscillating with the earthquake wave.
The complete drainage of the pit wall may not be practical in a real mining situation; hence, the effect of partial drainage on stability of the pit wall was studied by setting the Ru value to 0.1 in the numerical model. Fig. 17 shows the contours of shear strain development in the semi-dried pit wall. Interestingly, it is seen even the semi-drying of the pit wall leads to a safe condition against the design earthquake.
0.00E+00
5.00E-06
1.00E-05
1.50E-05
2.00E-05
2.50E-05
3.00E-05
3.50E-05
4.00E-05
4.50E-05
5.00E-05
0 2 4 6 8 10
Pow
er
Frequency, Hz
0
0.5
1
1.5
2
2.5
3
0 5 10 15 20 25 30 35
Hor
izon
tal d
ispl
acem
ents
, m
Time, second
-0.35
-0.3
-0.25
-0.2
-0.15
-0.1
-0.05
0
0 5 10 15 20 25 30 35
Ver
tical
dis
plac
emen
ts, m
Time, seconds

146 A Hazegh and H. Noferesti / Int. J. Min. & Geo-Eng. (IJMGE), 52-2 (2018) 1-6
Fig. 14: Horizontal displacements of drained southwest pit wall 30 seconds after
the design earthquake
Fig. 15: Shear strain development in drained pit wall 30 seconds after the design
earthquake
Fig. 16: Histories of horizontal and vertical displacements at point A on the
drained pit wall during the design earthquake
Fig. 17: Shear strain development in semi-dried pit wall 30 seconds after the
design earthquake
6. Conclusion
This paper presents the results of a study on the stability of the final pit wall of the Sungun Mine by pseudo-static, Newmark and dynamic numerical methods. In addition, it was tried to explain some of the complexities in accomplishing and interpreting the results in a dynamic analysis of a mining slope.
Pseudo-static analysis revealed that the final pit wall is unstable against the design earthquake and has a high probability of failure.
Scaled acceleration data of the well-known Ahar-Varzeqan earthquake, happened in August 2012, were used to perform more elaborate analytical methods. The Newmark analysis demonstrated an approximately two-meter-displacement to occur in the final pit wall and a large failing region to form in the case of the design earthquake. The amount of Newmark displacements for the drained pit wall reduced to 38.5cm that could be taken as stable displacements.
A dynamic numerical analysis performed on the southwestern pit wall to further study the stability condition against the design earthquake. Maximum horizontal displacements of the pit wall reached to 2.6 meters, being relatively large values. The pattern of earthquake-induced shear strains in the pit wall suggests that a sliding failure has almost occurred. Time histories of horizontal and vertical displacements of the pit wall indicated constant forward and downward movements, respectively. These constant movements towards the pit suggest that a failing region has already formed.
The effect of complete drainage on stability of the pit wall was investigated by setting the Ru value equal to zero in the numerical model. Consequently, maximum horizontal displacements decreased significantly and reached less than 1 meter. Contours of shear strain development in the dry pit wall proved that no sliding surface has formed. Considering the time histories of the pit wall displacements in drained state reveal that the pit wall is nearly stable and is oscillating with the earthquake wave.
The complete drainage of the pit wall may not be practical in a real mining situation; hence, the effect of partial drainage on stability of the pit wall was studied. It was observed that even semi-drying the pit wall leads to a safe condition against the design earthquake.
REFRENCES
[1] Osanloo, M. (2010). Surface mining methods. Tehran: Amirkabir University of technology press, 2, 845-846.
[2] Rampello, S., & Silvestri, F. (2009). Force-Based Pseudo-static Methods versus Displacement-Based Methods for Slope Stability Analysis. Edited by Cosenza, Eurocode, 8, 249–262.
[3] Terzaghi, K. (1951). Mechanism of landslides. Harvard University, Department of Engineering.
[4] Newmark, N.M.(1965). Effects of earthquakes on dams and embankments. Geotecnique 15, 139-159.
[5] Roy, D., Dayal, U., & Jain, S.K.(2007). IITK- GSDMA Guidelines for seismic design of earth dams and embankments, provision with commentary and explanatory examples. Institute of Technology Kanpur.
[6] Rampello, S., Cascone, E. & Grosso, N. (2009). Evaluation of the seismic response of a homogeneous earth dam. Soil Dynamics and Earthquake Engineering, 29, 782–798.
[7] Heidari, M., & Taherian, A.R. (2005). The slope stability assessment in the wall overlooking the Sungun copper concentrator plant. In Proceedings of 24th International Conference on Ground Control in Mining (Edited by Peng, S.S.), Morgantown, WV, USA.
[8] Monjezi, M., & Rezakhah, M. (2007) Design of stable pit slopes of Sungun Copper Mine. Iranian Journal of Mining Engineering (IRJME), 2(3): 41-49.
[9] Abbaszadeh, M., Shahriar, K., Sharifzadeh, M. & Heidari, M. (2011). Uncertainty and reliability analysis applied to slope stability: a case
0
0.05
0.1
0.15
0.2
0.25
0.3
0.35
0.4
0.45
0 10 20 30 40
Ho
rizo
nta
l dis
pla
cem
ents
, m
Time, seconds
-0.01
-0.005
0
0.005
0.01
0.015
0.02
0.025
0 5 10 15 20 25 30 35
Ve
rtic
al d
isp
lace
men
ts,
m
Time, seconds

A Hazegh and H. Noferesti / Int. J. Min. & Geo-Eng. (IJMGE), 52-2 (2018) -6 147
study from Sungun Copper Mine. Geotechnical and Geological Engineering, 29: 581. https://doi.org/10.1007/s10706-011-9405-1.
[10] Pars Olang consulting Engineers. (2014). Geology report of Sungun Copper Mine.
[11] Pars Olang consulting Engineers. (2005). Report of slope stability studies for Sungun Copper Mine.
[12] Pars Olang consulting Engineers. (2014). Report of hydrogeological studies for Sungun Copper Mine.
[13] Jibson, R. W. (1993). Predicting earthquake-induced landslide displacements using Newmark’s sliding block analysis. Transportation Research Record, 9.
[14] Makdisi, F. I., & Seed, H. B. (1977). Simplified procedure for estimating dam and embankment earthquake-induced deformations. In ASAE Publication No. 4-77. Proceedings of the National Symposium on Soil Erosion and Sediment by Water, Chicago, Illinois, December 12-13.
[15] Franklin, A. G., & Chang, F. K. (1977). Earthquake Resistance of Earth and Rock-Fill Dams. Report 5. Permanent Displacements of Earth Embankments by Newmark Sliding Block Analysis. (tech report).
[16] Jibson, R. W. (2011). Methods for assessing the stability of slopes during earthquakes—A retrospective. Engineering Geology, 122(1), 43–50.
[17] Melo, C., & Sharma, S. (2004). Seismic coefficients for pseudo-static slope analysis. In 13th World Conference on Earthquake Engineering, Vancouver, BC, Canada, Paper.
[18] Bargi, k.(2010). Fundamentals of Earthquake Engineering. Tehran: Tehran university press.
[19] Rocscience Inc. (2015). Phase 2 online help, Dynamic Analysis, https://www.rocscience.com/help/phase2/webhelp9/phase2.htm
[20] Lagomarsino S. (1993) Forecast models for damping and vibration periods of building. Journal of Wind Engineering and Industrial Aerodynamics 1993; 48: 211-239.
[21] Kijko, A. (2011). Seismic hazard. In Encyclopedia of Solid Earth Geophysics, Edited by Harsh K. Gupta, Springer, pp.1110.
[22] BHRC, (2016). Iran Strong Motion Network, Ahar-Varzaqan2, http://smd.bhrc.ac.ir/Portal/en/BigQuakes/Details/35.
[23] Hoek, E. (2006). Rock mass properties. In Practical rock engineering series notes. https://www.rocscience.com/documents/.../Practical-Rock-Engineering-Full-Text.pdf.
[24] Barton, N. (2007). Rock quality, seismic velocity, attenuation and anisotropy. CRC press.
[25] Mejia, L.H. & Dawson, E.M. (2006). Earthquake deconvolution for FLAC. 4th International FLAC Symposium on Numerical Modeling in Geomechanics – 2006 – Hart & Varona (eds.) Paper: 04-10.
[26] Kuhlemeyer, R.L and Lysmer, J. (1973). Finite element method accuracy for wave propagation problems. Journal of Soil Mechanics and Foundation Division. 99:5 (421-427)
[27] Biggs, J. M. (1964). Introduction to Structural Dynamics. New York: McGraw-Hill.