comparison of mwd demand projections, mwd member agency ... · the metropolitan water district of...
TRANSCRIPT

Comparison of MWD Demand Projections, MWD Member Agency UWMPs and Local Water Supply Development Plans
Prepared for: San Diego County Water Authority
Prepared by: Gordon Hess and Associates, Inc. December 2011

ii | P a g e
Table of Contents
1.0 Overview 1
2.0 Scope of Report 1
3.0 Urban Water Management Planning Act 2
4.0 MWD's Regional Urban Water Management Plans – Past and Present 4
5.0 MWD Demands According to MWD’s RUWMP 8
6.0 MWD Demands According to Member Agency UWMPs 15
7.0 Comparison of MWD Demands Projected by MWD and its Member Agencies 20
8.0 Findings 23
Appendix A- Summary of Member Agency Urban Water Management Plans
City of Anaheim A-1
City of Beverly Hills A-3
City of Burbank A-5
Calleguas MWD A-7
Central Basin MWD A-10
City of Compton A-12
Eastern MWD A-14
Foothill MWD A-16
City of Fullerton A-18
City of Glendale A-20
Inland Empire Utilities Agency A-22
Las Virgenes MWD A-24
City of Long Beach A-26
City of Los Angeles A-28
Municipal Water District of Orange County A-31
City of Pasadena A-34
San Diego County Water Authority A-36
City of San Fernando A-39
City of San Marino A-41
City of Santa Ana A-43
City of Santa Monica A-45
Three Valleys MWD A-47
City of Torrance A-49
Upper San Gabriel Valley MWD A-52

iii | P a g e
West Basin MWD A-55
Western MWD A-57
Appendix B- Member Agency Data from Urban Water Management Plans
City of Anaheim B-1
City of Beverly Hills B-2
City of Burbank B-3
Calleguas MWD B-4
Central Basin MWD B-5
City of Compton B-6
Eastern MWD B-7
Foothill MWD B-8
City of Fullerton B-9
City of Glendale B-10
Inland Empire Utilities Agency B-11
Las Virgenes MWD B-12
City of Long Beach B-13
City of Los Angeles B-14
Municipal Water District of Orange County B-15
City of Pasadena B-16
San Diego County Water Authority B-17
City of San Fernando B-18
City of San Marino B-19
City of Santa Ana B-20
City of Santa Monica B-21
Three Valleys MWD B-22
City of Torrance B-23
Upper San Gabriel Valley MWD B-24
West Basin MWD B-25
Western MWD B-26
Cumulative Totals B-27

1 | P a g e
1.0 Overview
Every urban water supplier (supplier), as defined, is required by the California Urban Water
Management Planning Act to update its Urban Water Management Plan (UWMP) and submit a
complete version to the California Department of Water Resources (DWR) every five years. Each
supplier is required to file its 2010 plan with DWR by August 1, 2011. The urban water management
plan is intended to serve as a long-term planning tool for the supplier to ensure adequate water supplies
are available for the city, water district or region it serves.
The Metropolitan Water District of Southern California (MWD) is a regional provider of imported water
to all or portions of six southern California counties, including Ventura, Los Angeles, Orange, San
Bernardino, Riverside and San Diego. MWD is a water wholesaler with no retail customers and provides
treated and untreated water to its member agencies. MWD consists of 26 member agencies, including
14 cities, 11 municipal water districts, and one county water authority. MWD's 26 member agencies
deliver to their customers a combination of local groundwater, surface water, recycled water, and
imported water purchased from MWD or other sources. Roughly half of the water used in MWD's
service area is purchased directly or indirectly from MWD, and therefore MWD plays an important role
in ensuring coordinated planning to meet existing and future demand for water in Southern California.
MWD prepared and approved its Regional Urban Water Management Plan (RUWMP) in November
2010, approximately nine months before it was due to be filed with DWR and prior to its member
agencies finalizing or approving their UWMPs. Although member agencies advise MWD in April of each
year how much water they anticipate they will need during the next five years, and MWD works with its
member agencies to forecast future water demands (RUWMP at page 1-7), MWD’s RUWMP and the
member agencies’ UWMPs are not formally or functionally integrated. MWD did not seek the consent
of its member agencies to include planning elements in its RUWMP that might reduce demand on MWD
water supplies. Rather, MWD limited its RWUMP discussion to activities by its member agencies that
relate to one of MWD's own water demand or supply management programs (RUWMP at page 1-5). For
this reason, assumptions of overall future demands at the member agency level differ from what MWD
has assumed in its RUWMP. Additionally, assumptions by the member agencies regarding the reliability
of existing local supplies in both normal and dry years differ from MWD assumptions. These differences
can, and do, lead to different projected demands on MWD by MWD, on one hand, and by its member
agencies and retail water suppliers, on the other.
2.0 Scope of Report
The San Diego County Water Authority retained the services of Gordon Hess and Associates, Inc. (GHA,
Inc.), to summarize major elements of each MWD member agency UWMP and compare the aggregate
of those plans to MWD's RUWMP. GHA Inc. provides clients with consulting services related to policy,
cost, and water rate impacts of infrastructure and water supply development. Its principal, Gordon
Hess, P.E. ([email protected]), has more than 35 years of public and private sector experience in
integrated water resources planning, design and construction of water infrastructure, and formulating
local, regional and federal water policies.

2 | P a g e
This report provides an overview of data obtained from each MWD member agency UWMP, including
current water demand, supply sources, and population. In addition, each member agency's UWMP
projected future demand, population, and supply sources are presented along with per capita water use
and targets. This report is not intended to be a comprehensive summary of each member agency's
UWMP, but rather, an overview and comparison of certain key information relative to future water
demands on MWD. Notably, this report does not include an analysis of the many other UWMPs filed by
public water suppliers including cities, utilities and agencies throughout Southern California, many of
which have plans to develop local water supplies in order to reduce demand on imported water. See,
generally, http://www.water.ca.gov/urbanwatermanagement/2010uwmps/.
In addition to providing a summary of MWD's and its member agencies’ UWMP supply and demand
projections, the cumulative demand on MWD as included in the member agency plans is presented and
compared to MWD's RUWMP forecast of MWD demand for normal, single dry year, and multiple dry
years.1 In a few cases, the member agency UWMP compares member agency forecasts of MWD
demand to what MWD assumed for individual agency MWD demand. However, MWD's RUWMP does
not provide a breakdown among individual member agencies as to demands on MWD.
All UWMPs evaluated contain detailed information regarding conservation efforts that are, or will be
undertaken to accomplish SBX7-7 conservation targets for 2015 and 2020. This analysis does not
summarize these efforts by MWD and its member agencies. For detailed information regarding the
plans of agencies to meet conservation goals, please refer to the individual UWMPs.
3.0 UWMP Planning Act
The California Urban Water Management Planning Act requires all urban water suppliers in the state to
prepare UWMPs and update them every five years. DWR provided a Guidebook to Assist Urban Water
Suppliers to Prepare a 2010 UWMP for preparation of the plans. Since plans were last prepared in 2005,
amendments were made to the UWMP Act, including:
Water Code Section 10631.1 requires a plan by retail water suppliers to include water use
projections for single- and multi-family residential housing needed for lower income and
affordable households, to assist with compliance with the existing requirement under Section
65589.7 of the Government Code, that suppliers grant a priority for the provision of service to
housing units affordable to lower income households.
1 While this analysis provides information derived from individual and cumulative member agency UWMP
forecasts and compares that to what is contained in MWD's plan, this report is not an evaluation of the adequacy
of the member agency UWMPs, nor does it verify whether member agencies’ targets or calculations for meeting
SBX7-7 per capita water use goals are correct or appropriate. Each member agency has, or will submit its UWMP
to DWR as required by law, and it is assumed that DWR will review the plans and note any further information that
may be required to comply with applicable UWMP requirements.

3 | P a g e
Water Code Section 10621(b) clarifies that every urban water supplier preparing a plan must
give at least 60 days advanced notice to any city or county prior to the public hearing on the
plan within which the supplier provides water supplies to allow for consultation on the
proposed plan.
Water Code Section 10631(j) deems water suppliers that are members of the California Urban
Water Conservation Council (CUWCC) and comply with the Memorandum of Understanding
(MOU), as it may be amended, to be in compliance with the requirement to describe the
supplier’s water demand management measures in its UWMP.
Water Code Section 10631.7 required DWR, in consultation with the CUWCC, to convene a
technical panel, no later than January 1, 2009, to provide information and recommendations to
DWR and the Legislature on new demand management measures, technologies, and
approaches. The panel and DWR were to report to the Legislature on their findings no later than
January 1, 2010 and every five years thereafter;
Water Code Section 10633(d) clarifies that the “indirect potable reuse” of recycled water should
be described and quantified in the plan, including a determination regarding the technical and
economic feasibility of serving those uses.
Water Code Section 10644(c) requires DWR to recognize exemplary efforts by water suppliers
by obligating DWR to identify and report to the technical panel, described above, and
“exemplary elements” of individual water suppliers’ plans, meaning any water demand
management measures adopted and implemented by specific urban water suppliers that
achieve water savings significantly above the levels required to meet the conditions for state
grant or loan funding.
Water Code Section 10631.5 was amended to address conditions of eligibility for grants or loans
from DWR. DWR will consider whether the urban water supplier has submitted an updated plan
when determining eligibility for funds made available pursuant to any program administered by
the Department.
In addition to changes in the Act, the state Legislature passed Senate Bill 7 as part of the Seventh
Extraordinary Session, referred to as SBX7-7, on November 10, 2009, which became effective February
3, 2010. This new law was the water conservation component of the Delta legislation package, and seeks
to achieve a 20 percent statewide reduction in urban per capita water use in California by December 31,
2020. The law requires each urban retail water supplier to develop urban water use targets to help meet
the 20 percent goal by 2020, and an interim water reduction target by 2015.
Urban retail water suppliers must include in their 2010 plans the following information from the bill’s
target setting process: (1) baseline daily per capita water use; (2) urban water use target; (3) interim
water use target; (4) compliance daily per capita water use, including technical bases and supporting
data for those determinations. An urban retail water supplier may update its 2020 urban water use
target in its 2015 urban water management plan. (Water Code Section 10608.20.) Wholesale water
suppliers must include in their 2010 Plans an assessment of their present and proposed future
measures, programs and policies to help retail agencies achieve their water use reduction targets.

4 | P a g e
Additionally, Water Code Sections 10910 through 10914 and Government Code Sections 65867.5,
66455.3, and 66473.7 (commonly referred to as SB 610 and SB 221) amended state law effective January
1, 2002 to improve the link between information on water supply availability and certain land use
decisions made by cities and counties. SB 610 requires that the water purveyor of the public water
system prepare a water supply assessment to be included in the environmental documentation of
certain large proposed projects. SB 221 requires affirmative written verification from the water purveyor
of the public water system that sufficient water supplies are available for certain large residential
subdivisions of property prior to approval of a tentative map. Most plans contain documentation on the
existing and planned water supplies being developed by the water provider that can be used in
preparing the water supply assessments and written verifications required under state law. Specific
documentation on MWD supplies can be found in its RUWMP.
4.0 MWD's Regional Urban Water Management Plans – Past and Present
MWD is a water wholesaler with no retail customers, providing treated and untreated water directly to
its 26 member agencies. For some member agencies, MWD supplies all the water provided by the
agency within its service area, while others obtain varying amounts of water from MWD to supplement
their local and other imported supplies. MWD provides between 45 and 60 percent of the municipal,
industrial, and agricultural water used in its service area.
After the drought of 1987-1992, MWD faced changed conditions and the need to develop a long-term
water resources strategy to fulfill the agency’s stated mission of providing reliable water supplies to its
service area. An integrated resources planning process was undertaken and MWD's first Integrated
Resources Plan (IRP) was adopted in 1996. The plan recognized that MWD’s role increasingly should be
focused on coordinating its planning activities with those of its member agencies and the other retail
water suppliers they serve (RUWMP at page 2-2). The plan also recognized that the region’s future
water supply reliability would increasingly depend on striking a balance between demand management
and supply augmentation by MWD, its member agencies and other public water suppliers. The resulting
IRP strategy attempted to balance demand management, imported supply augmentation and local
supply development. In dry years, MWD was counting on conservation, local supplies, withdrawal from
storage, and water transfers to augment available imported water supplies. From this plan, MWD
developed a RUWMP in 2000. The plan estimated average year, single dry year, and multiple dry year
demands on MWD to the year 2020 as follows:
Table 1- MWD 2000 Urban Water Management Plan (From MWD Table II-3)
MWD Total Demand, MAF/Yr
2005 2010 2015 2020
Average Year 1.90 1.95 2.08 2.30
Single Dry Year 1.91 1.97 2.09 2.32
Multiple Dry Years 2.20 2.25 2.36 2.57

5 | P a g e
The 2000 plan estimated groundwater replenishment as follows:
Table 2- MWD 2000 Urban Water Management Plan (From MWD Table II-3)
Groundwater Replenishment
Demand, MAF/Yr 2005 2010 2015 2020
Average Year 0.16 0.16 0.17 0.18
Single Dry Year 0.17 0.17 0.18 0.19
Multiple Dry Years 0.17 0.17 0.17 0.18
From this, the net firm demand on MWD can be determined by subtracting groundwater replenishment
demand from the MWD total demand:
Table 3- MWD Firm Demand from 2000 MWD Urban Water Management Plan
Net Firm MWD Demand, MAF/Yr
2005 2010 2015 2020
Average Year 1.74 1.79 1.91 2.12
Single Dry Year 1.74 1.80 1.91 2.13
Multiple Dry Years 2.04 2.08 2.19 2.39
In 2004, the MWD Board adopted an updated IRP. Legislation concerning population growth and water
supply called for further planning considerations. The IRP Update had three objectives: (1) Review the
goals and achievements of the 1996 IRP; (2) Identify the changed conditions for water resource
development; and (3) Update resource development targets through 2025 (RUWMP at page 2-2). The
2004 IRP process also updated the long-term plan to account for the new water planning legislation.
MWD’s RUWMP states that, “the updated plan contained resource development targets through 2025,
which reflected changed conditions; particularly increased conservation savings, planned increases in
local supplies and uncertainties” (RUWMP at page 2-2). The “uncertainties” noted by MWD were “the
level of population and economic growth which directly drive water demands, water quality regulations,
new chemicals found to be unhealthful, endangered species affecting sources of supplies, and periodic
and new changes in climate and hydrology” (RUWMP at pages 2-2 – 2-3). To address these
uncertainties, MWD added a 10 percent “planning buffer” of additional water supply to be developed.
Estimated MWD demands from the 2004 update were used as the basis for MWD 2005 Urban Water
Management Plan. The plan estimated average year, single dry year, and multiple dry years demands
on MWD to the year 2030 as follows:
Table 4- MWD 2005 Urban Water Management Plan (From MWD Tables II-5,6 and 7)
Total MWD Demand, MAF/Yr
2010 2015 2020 2025 2030
Average Year 2.262 2.191 2.234 2.341 2.460
Single Dry Year 2.523 2.414 2.457 2.565 2.671
Multiple Dry Years
2.570 2.499 2.515 2.635 2.761

6 | P a g e
For the 2005 plan, firm demand on MWD was shown as follows:
Table 5- MWD 2005 MWD Urban Water Management Plan (From MWD Tables II-5,6 and 7)
Firm MWD Demand, MAF/Yr
2010 2015 2020 2025 2030
Average Year 2.063 1.985 2.029 2.141 2.269
Single Dry Year 2.348 2.234 2.275 2.388 2.511
Multiple Dry Years
2.420 2.341 2.355 2.479 2.609
MWD again updated its IRP in 2010. MWD described the basic objectives of the 2010 IRP update as
follows: “1. Review the achievements of the 1996 IRP and the 2004 Update; 2. Identify changing
conditions affecting water resource management (attention will be given to emerging factors and
considerations, such as the current drought, climate change, energy use, and changes in Delta pumping
operations); and 3. Update resource development targets through 2030 (discussion will focus on
adaptation to future uncertainties, and potential alternatives for further diversifying Metropolitan’s
water resource portfolio and increasing supply reliability in the face of changing circumstances”
(RUWMP at page 2-3).
MWD's 2010 RUWMP was derived from the 2010 IRP update, and again estimated average year, single
dry year, and multiple dry years demands on MWD as follows:
Total Demand:
Table 6- MWD 2010 Urban Water Management Plan (From MWD Tables 2-6, 7 and 8)
Total MWD Demand, MAF/Yr
2015 2020 2025 2030 2035
Average Year 1.928 1.763 1.808 1.874 1.931
Single Dry Year 2.094 1.993 2.025 2.080 2.146
Multiple Dry Years
2.154 2.049 2.106 2.163 2.224
Firm Demand:
Table 7- MWD 2010 MWD Urban Water Management Plan (From MWD Table 2-6, 7, and 8)
Firm MWD Demand, MAF/Yr
2015 2020 2025 2030 2035
Average Year 1.826 1.660 1.705 1.769 1.826
Single Dry Year 1.991 1.889 1.921 1.974 2.039
Multiple Dry Years
2.056 1.947 2.003 2.059 2.119
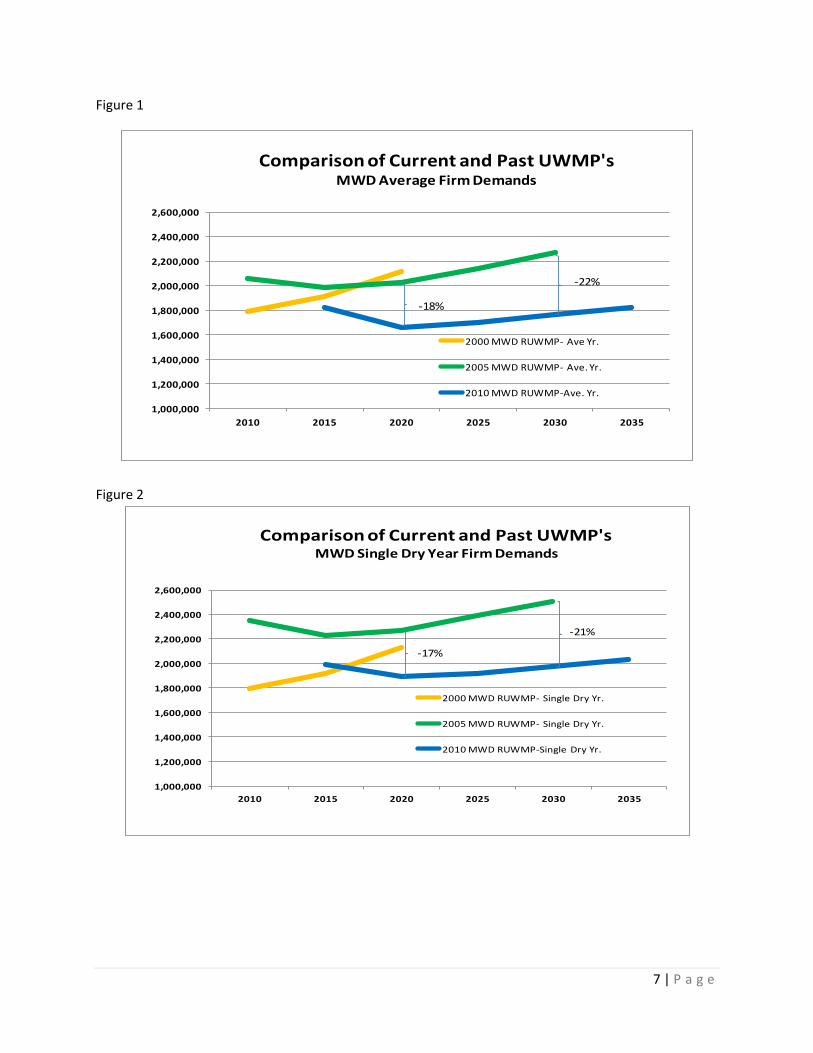
As can be seen in the figures below, each MWD Regional Urban Water Management, from 2000 to 2010,
resulted in decreased projections of firm demands on MWD.
7 | P a g e
Figure 1
1,000,000
1,200,000
1,400,000
1,600,000
1,800,000
2,000,000
2,200,000
2,400,000
2,600,000
2010 2015 2020 2025 2030 2035
2000 MWD RUWMP- Ave Yr.
2005 MWD RUWMP- Ave. Yr.
2010 MWD RUWMP-Ave. Yr.
Comparison of Current and Past UWMP'sMWD Average Firm Demands
-18%
-22%
Figure 2
1,000,000
1,200,000
1,400,000
1,600,000
1,800,000
2,000,000
2,200,000
2,400,000
2,600,000
2010 2015 2020 2025 2030 2035
2000 MWD RUWMP- Single Dry Yr.
2005 MWD RUWMP- Single Dry Yr.
2010 MWD RUWMP-Single Dry Yr.
Comparison of Current and Past UWMP'sMWD Single Dry Year Firm Demands
-17%
-21%

8 | P a g e
5.0 MWD Demands According to MWD’s RUWMP
MWD's 26 member agencies deliver to their customers a combination of local groundwater, local
surface water, recycled water, and imported water purchased from MWD and other sources. Some
MWD member agencies provide retail water service, while others provide water to the local area as
wholesalers (see RUWMP, Table 1-2 at page 1-8, reproduced below). For some member agencies, MWD
supplies all the water used within that agency's service area, while others obtain varying amounts of
imported water from MWD to supplement local supplies. This local supply comes from local wells, local
surface water, recycling and desalination. Two agencies import water from sources other than MWD:
The City of Los Angeles brings imported water from the eastern Sierra Nevada mountains through its Los
Angeles Aqueduct; and the San Diego County Water Authority (SDCWA) imports conserved water from
the Imperial Irrigation District and the All-American and Coachella Canal lining projects through MWD's
Colorado River Aqueduct and other MWD facilities. Member agencies also have water conservation
programs that reduce demand on MWD imported water supplies.
Table 8- MWD's Member Agencies and Type of Water Service Provided
County and Member Agency Type of Water Service
Los Angeles County
Beverly Hills, City of
Burbank, City of
Central Basin Municipal Water District
Compton, City of
Foothill Municipal Water District
Glendale, City of
Las Virgenes Municipal Water District
Long Beach, City of
Los Angeles, City of
Pasadena, City of
San Fernando, City
San Marino, City
Santa Monica, City
Three Valleys Municipal Water District
Torrance, City of
Upper San Gabriel Valley Municipal Water District
West Basin Municipal Water District
Retail
Retail
Wholesale
Retail
Wholesale
Retail
Retail
Retail
Retail
Retail
Retail
Retail
Retail
Wholesale
Retail
Wholesale
Wholesale
Orange County
Anaheim, City of
Fullerton, City of
Municipal Water District of Orange County
Santa Ana, City of
Retail
Retail
Wholesale
Retail
Riverside County
Eastern Municipal Water District
Retail and Wholesale

9 | P a g e
Western Municipal Water District Retail and Wholesale
San Bernardino County
Inland Empire Utilities Agency
Wholesale
San Diego County
San Diego County Water Authority
Wholesale
Ventura County
Calleguas Municipal Water District
Wholesale
Approximately 250 retail water suppliers including cities, utilities and water agencies directly serve
water ratepayers throughout MWD’s service area. MWD's member agencies collectively serve 152 cities
and 89 unincorporated communities (RUWMP, Table 1-3 at page 1-9). As noted earlier, this report does
not analyze or address the UWMPs filed by all of these retail water suppliers. However, it may be noted
generally that many retail water suppliers have plans to develop local water supplies in order to reduce
demand on imported water. Further, the plans of some retail agencies appear to be inconsistent with
the plans of MWD member agencies. Some agencies, such as the Water Replenishment District of
Southern California, that are not required to prepare and file an UWMP also have plans to reduce future
purchases of imported water.

10 | P a g e
Figure 3- MWD Service Area and Member Agencies
Each of the MWD member agencies prepared a 2010 UWMP. Like MWD's RUWMP, wholesale member
agencies' UWMPs are used as a planning tool to provide retail water suppliers guidance as to the
demand and availability of water supplies. All member agencies stated that they coordinated with
MWD in the preparation of UWMPs; however, not all agencies used the same supply and demand
estimates that were the basis of the MWD RUWMP. In many cases, wholesale member agencies had
separate models that estimated future demands, or received and used information provided by their
own retail agencies. In some cases, such as Calleguas MWD, differences between MWD's RUWMP
forecast of demands on MWD for the agency are compared to the agency's own forecast of demands.
Each agency summary in Appendix A provides an overview of the member agency and how the member
agency forecast its demands. Appendix B provides specific data from the member agency plans and
cumulative totals for supplies and demands contained in the plans.
11 | P a g e
There are also differences between what a member agency assumes in its forecast of local supply
development and what local supply development MWD assumes in its RUWMP. Examples of these
differences include both the quantity of available existing supplies, such as Los Angeles Aqueduct flows
during normal, dry and multiple dry year conditions and the planning assumptions of availability of
future supplies. The San Diego County Water Authority, Long Beach, and West Basin MWD all include
seawater desalination in their future available supplies, but MWD does not account in its 2010 RUWMP
for any seawater desalination in its estimate of member agency local water supplies. This is in contrast
to MWD’s 2005 RUWMP, when it included in its planning 150,000 acre-feet of seawater desalination as
future available local water supplies.
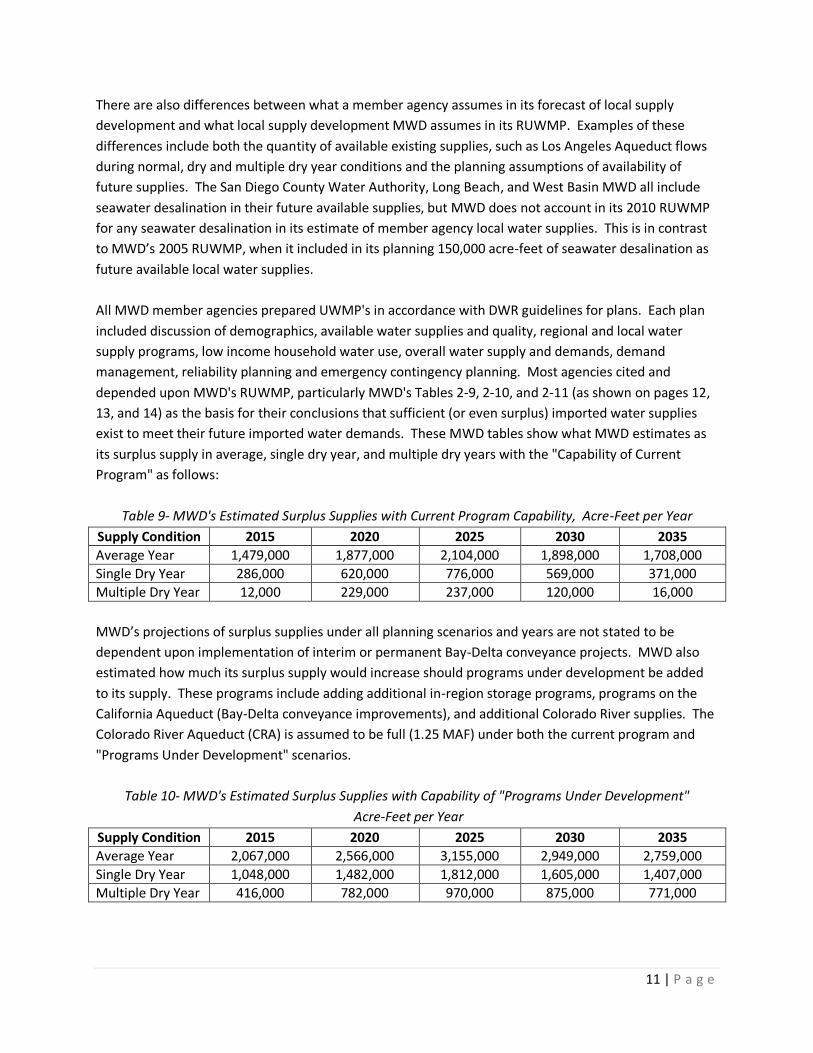
All MWD member agencies prepared UWMP's in accordance with DWR guidelines for plans. Each plan
included discussion of demographics, available water supplies and quality, regional and local water
supply programs, low income household water use, overall water supply and demands, demand
management, reliability planning and emergency contingency planning. Most agencies cited and
depended upon MWD's RUWMP, particularly MWD's Tables 2-9, 2-10, and 2-11 (as shown on pages 12,
13, and 14) as the basis for their conclusions that sufficient (or even surplus) imported water supplies
exist to meet their future imported water demands. These MWD tables show what MWD estimates as
its surplus supply in average, single dry year, and multiple dry years with the "Capability of Current
Program" as follows:
Table 9- MWD's Estimated Surplus Supplies with Current Program Capability, Acre-Feet per Year
Supply Condition 2015 2020 2025 2030 2035
Average Year 1,479,000 1,877,000 2,104,000 1,898,000 1,708,000
Single Dry Year 286,000 620,000 776,000 569,000 371,000
Multiple Dry Year 12,000 229,000 237,000 120,000 16,000
MWD’s projections of surplus supplies under all planning scenarios and years are not stated to be
dependent upon implementation of interim or permanent Bay-Delta conveyance projects. MWD also
estimated how much its surplus supply would increase should programs under development be added
to its supply. These programs include adding additional in-region storage programs, programs on the
California Aqueduct (Bay-Delta conveyance improvements), and additional Colorado River supplies. The
Colorado River Aqueduct (CRA) is assumed to be full (1.25 MAF) under both the current program and
"Programs Under Development" scenarios.
Table 10- MWD's Estimated Surplus Supplies with Capability of "Programs Under Development"
Acre-Feet per Year
Supply Condition 2015 2020 2025 2030 2035
Average Year 2,067,000 2,566,000 3,155,000 2,949,000 2,759,000
Single Dry Year 1,048,000 1,482,000 1,812,000 1,605,000 1,407,000
Multiple Dry Year 416,000 782,000 970,000 875,000 771,000

12 | P a g e
Figure 4- MWD's Table 2-9 from the 2010 RUWMP
13 | P a g e
Figure 5- MWD's Table 2-10 from the 2010 RUWMP

14 | P a g e
Figure 6- MWD's Table 2-11 from the 2010 RUWMP

15 | P a g e
6.0 MWD Demands According to Member Agencies' UWMPs
While most MWD member agencies used a fairly consistent format in their UWMPs, each plan has
differences in how data or projections are reported. Most plans show supply and demand projections
for 2015 to 2035 in five year increments for normal and single dry years, the multiple (three-year) dry
year scenarios are not necessarily three dry years ending in 2015, 2020, 2025, 2030, or 2035. In these
cases and for the purpose of being able to cumulate data from all MWD agencies, the third year of the
three year sequence is shown, and if this third year does not end on 2015, 2020, etc., then the supply
and demand figures shown in the summaries are the third year of the dry year sequence closest to year
2015, 2020, etc. In cases where the member agency UWMP goes to the year 2030 rather than the year
2035, 2030 figures are also shown in 2035.
The MWD member agencies’ summaries shown in Appendix A include population, overall water
demands and water supply. Overall demand includes firm demands, non-firm demands such as demand
for replenishment supplies and recycled water demand for direct use (does not include recycled water
used for replenishment purposes). Some agencies, such as Foothill Municipal Water District, provide
imported water to its customers (sub-agencies), but did not report in the UWMP use of other local
supplies by these sub-agencies. It is for this reason that the accumulation of Total Water Use among
each of the MWD member agency UWMPs include most, but not necessarily all of the local supplies
used with the MWD service area. However, the accumulations of all MWD supply and demand among
the member agencies' UWMPs does include all MWD demands from the members, subject to any
assumptions as noted on each summary.
The MWD member agencies are not consistent in the way they account for available MWD (or local)
supplies. Some agencies "balance" supply and demand, i.e. the total supply available equals the total
demand, even if the agency has additional supplies available. Others, such as Central Basin MWD
assumes that its Tier 1 purchase commitment will be available under each supply scenario and this
serves as the basis for its estimated MWD demand. Other agencies estimate available MWD demands
by applying the percentage of MWD surplus supplies noted in MWD's Tables 2-9, 2-10, or 2-11 towards
their estimated MWD demand, thus assuming that MWD will have more than enough supplies to meet
their estimated demands. In these cases, supply and demand are not "balanced" as the UWMP reports
supply exceeding demands.
The following table shows the cumulative firm MWD demands as reported in the member agency
UWMP's for years 2015 to 2035 for Average year, Single Dry Year, and Multiple Dry Year conditions:
Table 11- Cumulative MWD Firm Demand as Reported in Member Agency UWMPs (Acre-Feet)
Supply Condition
2015 2020 2025 2030 2035
Average Year 1,717,165 1,561,752 1,612,426 1,690,852 1,750,335
Single Dry Year 2,119,650 1,947,778 2,006,438 2,096,558 2,156,846
Multiple Dry Year
1,931,006 1,906,190 1,935,301 1,991,160 2,206,004

16 | P a g e
Average year demands represent those demands that member agencies expect to place on MWD when
existing local supplies are available, planned new supplies are on-line, and accounting for expected
population and demand increases after planned conservation efforts are achieved to meet SBX7-7
requirements. Some agencies expect to implement additional conservation measures that would lower
expected MWD demands further. As expected, single dry year (worst case) demands on MWD are
higher than average year demands, due to less availability of local supplies. The third year of a three
year multiple dry year sequence is slightly less than the single dry year worst case, as public awareness
and conservation efforts are increased. The UWMPs do not include MWD demands for a wet year, or
multiple wet year sequence, however it would be expected that under such conditions local supplies
would be more abundant, overall demands could be reduced slightly, and MWD firm demands would be
significantly lower than under average year conditions.
Below, are average year and a comparison of average and dry year demands for each member agency
for the year 2020, as reported in the UWMP's:
Figure 7
0
50,000
100,000
150,000
200,000
250,000
300,000
350,000
400,000
450,000
500,000
City
of A
nahe
im
City
of B
ever
ly Hi
lls
City
of B
urba
nk
Calle
guas
MW
D
Cent
ral B
asin
MW
D
City
of C
ompt
on
East
ern
MW
D
Foot
hill M
WD
City
of F
ulle
rton
City
of G
lend
ale
IEUA
Las V
irgen
es M
WD
City
of L
ong B
each
City
of L
os A
ngel
es
MW
DOC
City
of P
asad
ena
SDCW
A
City
of S
an F
erna
ndo
City
of S
an M
arin
o
City
of S
anta
Ana
City
of S
anta
Mon
ica
Thre
e Va
lleys
MW
D
City
of T
orra
nce
USG
Valle
y M
WD
Wes
t Bas
in M
WD
Wes
tern
MW
D
2020 MWD DemandAverage Year, AF

17 | P a g e
Figure 8
-50,000
0
50,000
100,000
150,000
200,000
250,000
300,000
350,000
400,000
450,000
500,000
City
of A
nahe
im
City
of B
ever
ly H
ills
City
of B
urba
nk
Calle
guas
MW
D
Cent
ral B
asin
MW
D
City
of C
ompt
on
East
ern
MW
D
Foot
hill
MW
D
City
of F
ulle
rton
City
of G
lend
ale
IEU
A
Las V
irgen
es M
WD
City
of L
ong
Beac
h
City
of L
os A
ngel
es
MW
DOC
City
of P
asad
ena
SDCW
A
City
of S
an F
erna
ndo
City
of S
an M
arin
o
City
of S
anta
Ana
City
of S
anta
Mon
ica
Thre
e Va
lleys
MW
D
City
of T
orra
nce
USG
Val
ley
MW
D
Wes
t Bas
in M
WD
Wes
tern
MW
D
2020 MWD DemandAverage Year and Dry Year, AF
Single Dry Year Demand
As shown, most agencies' UWMP dry year demands on MWD are greater than average year demands.
However, the degree of dry year peaking (ratio of dry year demand to average year) on MWD varies
greatly, from up to 224% for the City of Los Angeles to zero for the City of Santa Monica. The volume of
water required to meet dry year peaking also varies greatly, from up to 240,980 acre-feet for the City of
Los Angeles to a decrease of 31,024 for Inland Empire Utilities Agency. In the case of Inland Empire
Utilities Agency, its UWMP calls for increased pumping from groundwater basins to reduce imported
water demands (the reduction is shown as a negative number). In the case of the San Diego County
Water Authority, the above represents only purchases of MWD supplies and not transportation services.
Each MWD member agency reports local supplies that it expects will be available in future years. While
MWD's RUWMP includes local supplies in its forecasts, certain significant differences were identified
between the supplies MWD assumed to be available and the supplies the MWD member agencies
assumed in their plans. These supplies, if included in MWD's RUWMP, would further reduce MWD
projected demands from its member agencies:

18 | P a g e
Table 12- Member Agency Planned Supplies not Included in MWD's RUWMP
Local Supply
Included in Member Agency
UWMP Future Supply
Included in MWD's
RUWMP as a Local Supply
Annual Quantity
Long Beach- Seawater Desalination
Yes No 5,000 AF beginning in 2025
SDCWA- Seawater Desalination
Yes No 56,000 AF beginning in 2020
West Basin- Seawater Desalination
Yes No 21,500 AF beginning in 2020
Los Angeles Aqueduct- Difference in Supply Assumptions
Yes No 28,000 AF in 2015 decreasing to 14,000 AF in 2035 for average years; In single dry year LADWP's RUWMP estimates 17,480 to 19,060 AF less than MWD's RUWMP. In multiple dry years LADWP's UWMP estimates 27,700 to 42,770 AF more than MWD's RUWMP
LADWP Water Transfers Yes No 40,000 AF Beginning in 2015
Total 136,500 to 150,500 AF/Yr. for average years. 99,620 to 104,200 AF/Yr for dry years and 150,320 to 165,270 AF/Yr in multiple dry years
In addition to the above, two MWD member agencies (Calleguas MWD and the City of Burbank)
specifically detail how MWD's RUWMP projections are higher than their own UWMP projections. In the
case of Calleguas MWD, its assumptions for future local supply is greater than what MWD considered in
its RUWMP. In the case of the City of Burbank, its UWMP states that "Burbank's projections in this plan
go beyond the minimum conservation required even though MWD is planning for somewhat higher
demands." These specific differences result in a further estimated decrease in MWD demands of 5,750
to 18,683 acre-feet per year for Calleguas MWD and 1,350 acre-feet per year for the City of Burbank,
depending on the year and hydrologic scenario.

19 | P a g e
Additional potential local water supply development was identified in the member agency UWMP's that
if implemented, would further reduce both MWD's forecasted demand and member agency projections
of their demand on MWD. These local supplies include:
Table 13- Potential Member Agency Local Supplies Listed in UWMP
Local Supply
Included in Member
Agency UWMP as Potential
Supply
Included in Member Agency UWMP or MWD
RUWMP Demand Forecast
Annual Quantity
LADWP Storm water Capture and Replenishment
Yes No 2,000 AF in 2015 and expanding to 25,000 AF by 2035
Water Replenishment District GRIP Project (Central Basin MWD)
Yes, as a CBMWD Project
No 21,000 AF
Foothill MWD Water Reclamation
Yes No 1,280 AF Beginning in 2020
MWDOC Seawater Desalination- Huntington Beach
Yes No 56,000 AF Beginning in 2020
MWDOC Seawater Desalination- San Juan Capistrano
Yes No 16,000 AF Beginning in 2020
MWDOC- Irvine Ranch WD Strand Ranch- Dry Year Yield
Yes No 16,666 AF in dry years
Three Valleys MWD- Additional Project
Yes No 28,000 AF Beginning in 2020
Calleguas MWD-Additional Conservation
Yes No 22,250 AF beginning in 2020
City of Torrance-Expanded Recycle Water and Goldsworthy Desalter
Yes No Unspecified
Total 186,200 + AF/Yr.

20 | P a g e
7.0 Comparison of MWD Demands Projected by MWD and its Member Agencies
A comparison of MWD's RUWMP forecast of its demands from member agencies shows that MWD's
forecasts are higher in the average and multiple dry year scenarios than the cumulative forecasts made
by its member agencies and lower in the single dry year scenario:
Figure 9
1,000,000
1,100,000
1,200,000
1,300,000
1,400,000
1,500,000
1,600,000
1,700,000
1,800,000
1,900,000
2,000,000
2,100,000
2,200,000
2,300,000
2010 2015 2020 2025 2030 2035
Agencies' Total-Ave. Yr.
MWD UWMP Ave. Yr.
Agencies' UWMP Demand on MWD vs.MWD's UWMP Forecast
Firm Demand for an Average Year, AF/Yr.
Figure 10
1,000,000
1,100,000
1,200,000
1,300,000
1,400,000
1,500,000
1,600,000
1,700,000
1,800,000
1,900,000
2,000,000
2,100,000
2,200,000
2,300,000
2010 2015 2020 2025 2030 2035
Agencies' Total-Single Dry Yr.
MWD UWMP-Single Dry Yr.
Agencies' UWMP Demand on MWD vs.MWD's UWMP Demand
Firm Demand for a Single Dry Year, AF/Yr.

21 | P a g e
Figure 11
1,000,000
1,100,000
1,200,000
1,300,000
1,400,000
1,500,000
1,600,000
1,700,000
1,800,000
1,900,000
2,000,000
2,100,000
2,200,000
2,300,000
2010 2015 2020 2025 2030 2035
Agencies' Total-3 Dry Yrs.
MWD UWMP-3 Dry Yrs.
Agencies' UWMP Demand on MWD vs. MWD's RUWMP Demands
Multiple Dry Years, AF/Yr.
As noted above, MWD's 2005 RUWMP included 150,000 acre-feet per year of seawater desalination, but
no seawater desalination was included in MWD's 2010 RUWMP projections as a local supply. One of
these projects is a fully permitted project for the development of 56,000 acre-feet of local water supply
annually. Had MWD included current member agency plans for seawater desalination in its RUWMP
forecasts, its average year demands would be similar to the cumulative forecasts contained in the
member agencies UWMPs. Had MWD included other identified local supplies, such as LADWP's planned
water transfers and flows in the Los Angeles Aqueduct that are consistent with LADWP's UWMP, MWD's
RUWMP average year demands would have been even lower than the member agencies cumulative
demands.
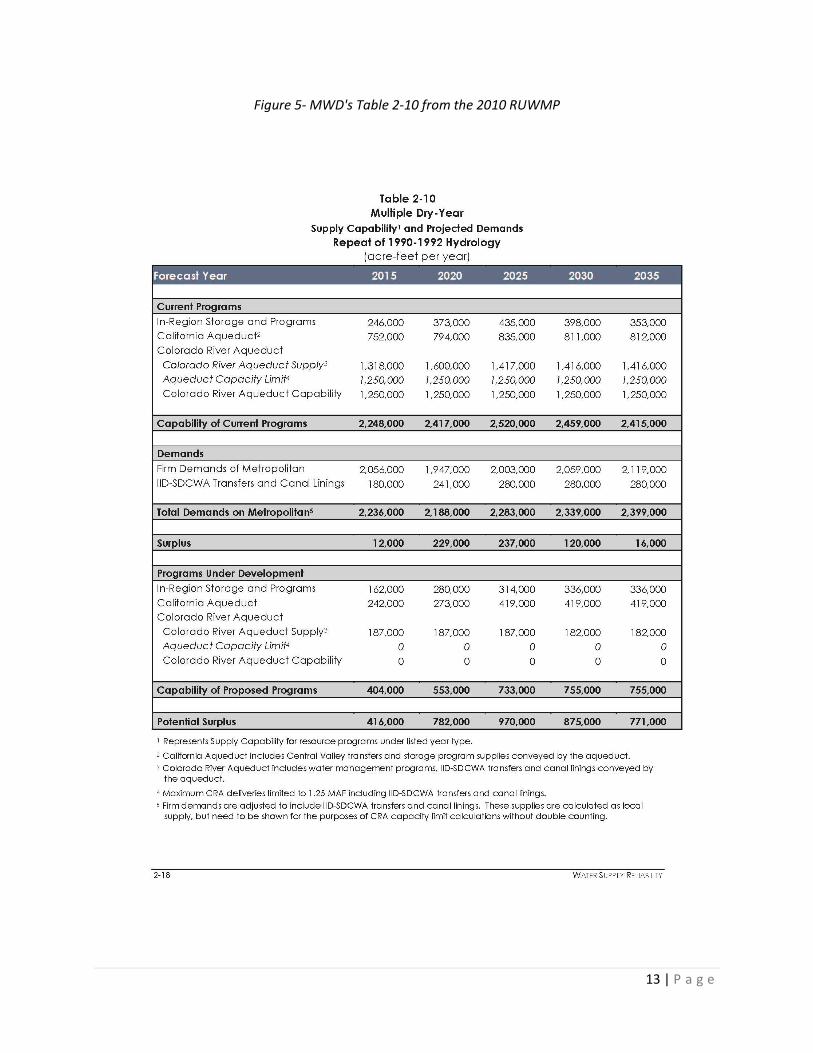
Further reductions in MWD demand would occur if the "potential projects" identified in the member
agencies UWMP's are implemented. These projects have become more cost-competitive as a result of
MWD rate increases.
22 | P a g e
Figure 12
1,000,000
1,100,000
1,200,000
1,300,000
1,400,000
1,500,000
1,600,000
1,700,000
1,800,000
1,900,000
2,000,000
2,100,000
2,200,000
2,300,000
2015 2020 2025 2030 2035
MWD RUMP- Firm Demands on MWD
MWD RUMP- Firm Demands on MWD-less MA Differences
MWD RUWMP- Firm Demands on MWD-less all potential projects
MWD RUWMP Demand on MWD, with AdjustmentsAverage Year
Figure 13
1,000,000
1,100,000
1,200,000
1,300,000
1,400,000
1,500,000
1,600,000
1,700,000
1,800,000
1,900,000
2,000,000
2,100,000
2,200,000
2,300,000
2015 2020 2025 2030 2035
MWD RUMP- Firm Demands on MWD
MWD RUMP- Firm Demands on MWD-less MA Differences
MWD RUWMP- Firm Demands on MWD-less all potential projects
MWD RUWMP Demand on MWD, with AdjustmentsSingle Dry Year
23 | P a g e
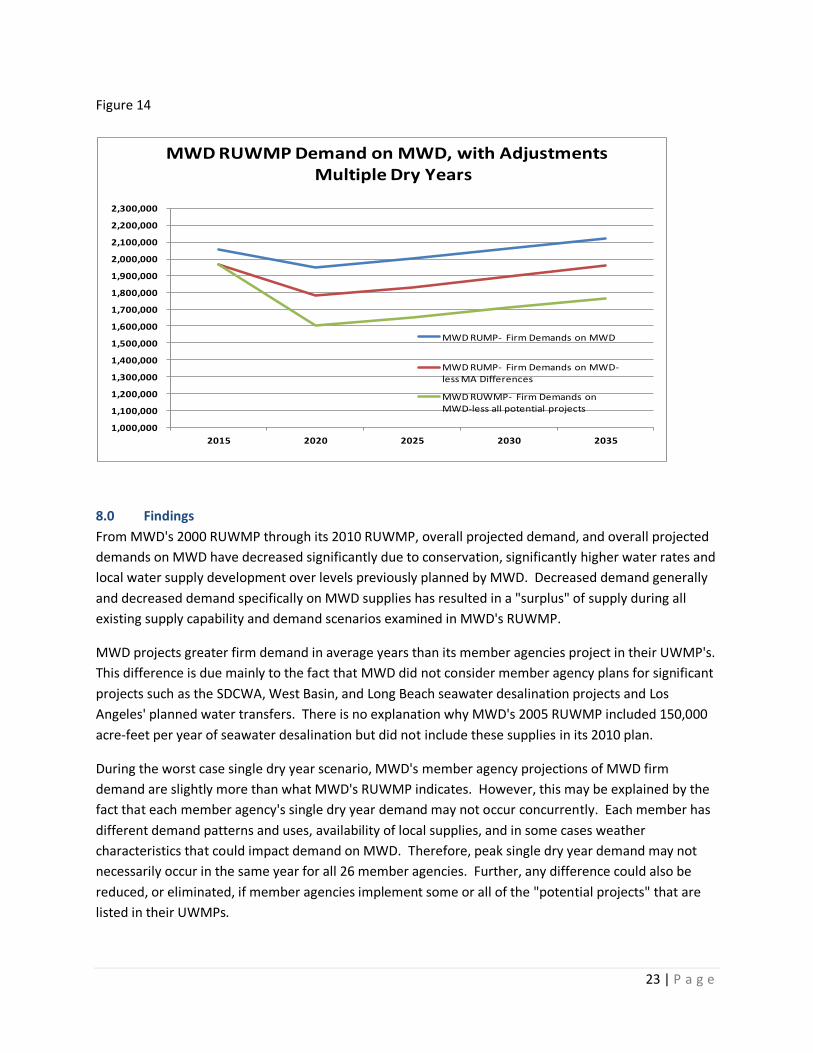
Figure 14
1,000,000
1,100,000
1,200,000
1,300,000
1,400,000
1,500,000
1,600,000
1,700,000
1,800,000
1,900,000
2,000,000
2,100,000
2,200,000
2,300,000
2015 2020 2025 2030 2035
MWD RUMP- Firm Demands on MWD
MWD RUMP- Firm Demands on MWD-less MA Differences
MWD RUWMP- Firm Demands on MWD-less all potential projects
MWD RUWMP Demand on MWD, with AdjustmentsMultiple Dry Years
8.0 Findings
From MWD's 2000 RUWMP through its 2010 RUWMP, overall projected demand, and overall projected
demands on MWD have decreased significantly due to conservation, significantly higher water rates and
local water supply development over levels previously planned by MWD. Decreased demand generally
and decreased demand specifically on MWD supplies has resulted in a "surplus" of supply during all
existing supply capability and demand scenarios examined in MWD's RUWMP.
MWD projects greater firm demand in average years than its member agencies project in their UWMP's.
This difference is due mainly to the fact that MWD did not consider member agency plans for significant
projects such as the SDCWA, West Basin, and Long Beach seawater desalination projects and Los
Angeles' planned water transfers. There is no explanation why MWD's 2005 RUWMP included 150,000
acre-feet per year of seawater desalination but did not include these supplies in its 2010 plan.
During the worst case single dry year scenario, MWD's member agency projections of MWD firm
demand are slightly more than what MWD's RUWMP indicates. However, this may be explained by the
fact that each member agency's single dry year demand may not occur concurrently. Each member has
different demand patterns and uses, availability of local supplies, and in some cases weather
characteristics that could impact demand on MWD. Therefore, peak single dry year demand may not
necessarily occur in the same year for all 26 member agencies. Further, any difference could also be
reduced, or eliminated, if member agencies implement some or all of the "potential projects" that are
listed in their UWMPs.
24 | P a g e
For multiple dry years, the analysis shows that cumulative member agency projections (third year) are
consistent with the average year in that the total projected MWD firm demand is less than MWD's
projection for the multiple dry year scenario. In the multiple dry year scenario, some agencies report
expected demand in each of the three "multiple" dry years, while others report only an annual figure for
each year of the projected sequence.
Projected future MWD demands for all three scenarios would be reduced further by potential projects
listed in the member agency UWMPs. Since UWMPs are not required to calculate wet year demands, no
data is available to determine what impact wet years will have on MWD, but past trends show that
MWD demands can decrease significantly during these periods. The fact that MWD member agencies
are planning on purchasing less water in the future, on average, than MWD anticipates during normal
(and likely wet) periods is likely to place upward pressure on MWD water rates over the longer term.
Additional sales, if any, by MWD during a single dry year worst case scenario would be short lived and
likely be offset by additional costs, thus having little impact on long term water rate trends when
compared to impacts of lower sales during average or wet years.
Dry year peaking poses a significant planning issue for MWD and occurs to some extent in most of its
member agencies. The volume of dry year peaking projected by MWD will have substantial economic
impacts and require water rate increases associated with carrying additional water supplies, storage and
capacity available to meet existing and future dry year peaking demands.
Tables 2-9, 2-10, and 2-11 in MWD's RUWMP state that the capability of MWD’s existing programs can
provide sufficient supplies to meet MWD demands in all years and all demand scenarios evaluated.
Most of MWD's member agencies' UWMPs cite these tables and use them as the basis for concluding
they have sufficient water supplies currently (and in many cases, surplus supplies) and will have
sufficient water supplies in the future. Despite this surplus and dramatically reduced demand
projections, MWD continues to pursue additional programs to increase its water supplies even further.
The combination of reduced demands and increased spending on new water supply programs will
continue to drive up the cost of MWD water.
Management of storage accounts plays a key role in both normal and dry years conditions, however, it is
not possible to derive from MWD’s RUWMP what assumptions it has made concerning the availability of
water to put into storage or take during dry year conditions. MWD and its member agencies would
benefit from a more detailed analysis of the expected availability of water for put and take into storage.
MWD's RUWMP also includes programs under development that will provide additional "potential
surplus" supplies in the average, single dry, and multiple dry year scenarios. These programs include an
interim Bay Delta measure, estimated to increase MWD's dry year supplies up to 487,000 acre-feet by
2015, and a more extensive Bay Delta solution that would increase its supply up to 628,000 acre-feet by
2025 (RUWMP Table A.3-7 at pages A.3-48 to A.3-52). These programs will result in substantial
overdevelopment of water supplies for Southern California unless other projects under development by
MWD, its member agencies and other water suppliers in Southern California are reduced or eliminated.

25 | P a g e
Further modeling should be done to factor in the anticipated timing and availability of Bay Delta supplies
including an analysis of projects which may be deferred or eliminated in order to avoid stranded costs.
The cumulative total of water supplies being developed under the category of "Programs Under
Development" for multiple dry years is as high 755,000 acre-feet, and for single dry years and average
years as high as 1,036,000 and 1,051,000 acre-feet, respectively. This is exclusive of supplies not
included in MWD's RUWMP being developed by member agencies and other retail water suppliers not
analyzed as part of this report.
If MWD's future water sales are lower than it projects, further, unnecessary upward pressure will be
placed on water rates. As MWD updates its long range finance plan and rate projections, MWD should
again review the timing and emphasis of program expenditures. Given all of the changed circumstances,
including reduced demands, escalating water rates and the economic downturn, MWD may wish to
revisit its IRP and RUWMP now in order to enhance coordination with the plans of its member agencies
and the other retail water suppliers that serve Southern California.

Appendix A
Summary of Member Agency Urban Water Management Plans
A-1 | P a g e
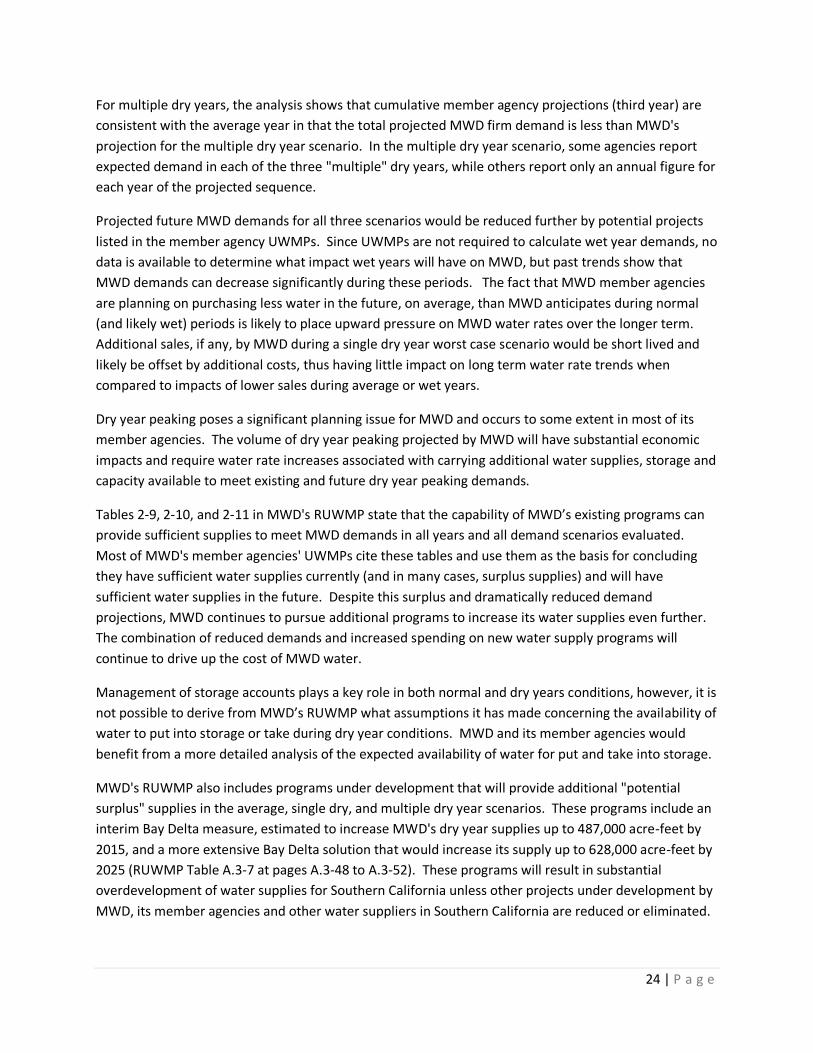
City of Anaheim
Overview
The City of Anaheim provides water to residents and businesses throughout its 49.3 square mile service
area. The City receives water from two main sources: the Orange County Groundwater Basin, which is
managed by the Orange County Water District and imported water from MWD. Groundwater is
pumped from active wells located within the City and imported water is delivered through seven treated
water connections and one untreated water connection from MWD.
Anaheim's 2010 UWMP lists its current population at 364,921 and project population to increase to
432,949 in the year 2035, an increase of 18.6%. Total Demand from the UWMP is expected to increase
16.1 % over the same period, from 66,929 acre-feet in 2010 to 77,700 acre-feet in 2035. This increased
demand will be met by both increased groundwater pumping and deliveries from MWD.
Existing and Projected Future Water Supply and Demand
Anaheim's demand projections were determined by an examination of its past water consumption by
type of use or by customer classification and information provided by the Center for Demographic
Research at California State University Fullerton.
0
10,000
20,000
30,000
40,000
50,000
60,000
70,000
80,000
90,000
Normal Dry2010
Normal Dry2015
Normal Dry2020
Normal Dry2035
Reclaimed
Other Local
MWD
City of AnaheimNormal Year vs. Dry Year Demands, AFY

A-2 | P a g e
Conservation and Per Capita Water Use
Anaheim is a member of an Orange County 20x2020 Regional Alliance, which is an effort to create
flexibility in meeting the per capita water use reduction targets required under SBX7-7. The Regional
Alliance selected as its calculation method the first DWR option, which require a simple 20% reduction
from the baseline by 2020 and 10 percent reduction by 2015. The City's baseline was calculated at
201.6 GPCD. Its 2015 and 2020 targets are 181.4 and 161.2 GPCD, respectively. Using population data
and average and dry year UWMP forecasts, the per capita use is projected as follows:
145.0
150.0
155.0
160.0
165.0
170.0
175.0
180.0
185.0
2010 2015 2020 2025 2030 2035
Normal Year
Dry Year
City of AnaheimPer Capita Water Use- Actual and Projected, GPCPD
Water Supply Reliability
Anaheim's plan indicates that future supplies are sufficient to meet its anticipated demands. The plan
relies on MWD's RUWMP as the basis for this conclusion and includes MWD's RUWMP Tables 2-11, 2-
19, and 2-10 which list a potential surplus of supply in all years examined in its plan.
The plan includes a discussion of groundwater and its management within the basin. It discusses the
OCWD Groundwater Replenishment System, put into operation in 2008, that provides a seawater
barrier through injection wells and groundwater recharge for the City. According to the plan, Anaheim's
groundwater production is expected to increase about 7 percent, or about 3,100 acre-feet. The City
currently does not provide recycled water, but plans to provide up to 255 acre-feet per year beginning in
2015.
Anaheim's plan states that it intends to reduce its demand through aggressive water use efficiency
programs. It also states that it has entered into an agreement to purchase GWRS water for use at the
Canyon Power Plant, within its service area and includes these efforts in its demand assumptions. The
plan lists desalination opportunities within MWDOC's service area, but the City does not plan to
participate. The plan states that it could indirectly benefit from construction of a desalination plant
because of the regional benefit that may be achieved.
A-3 | P a g e
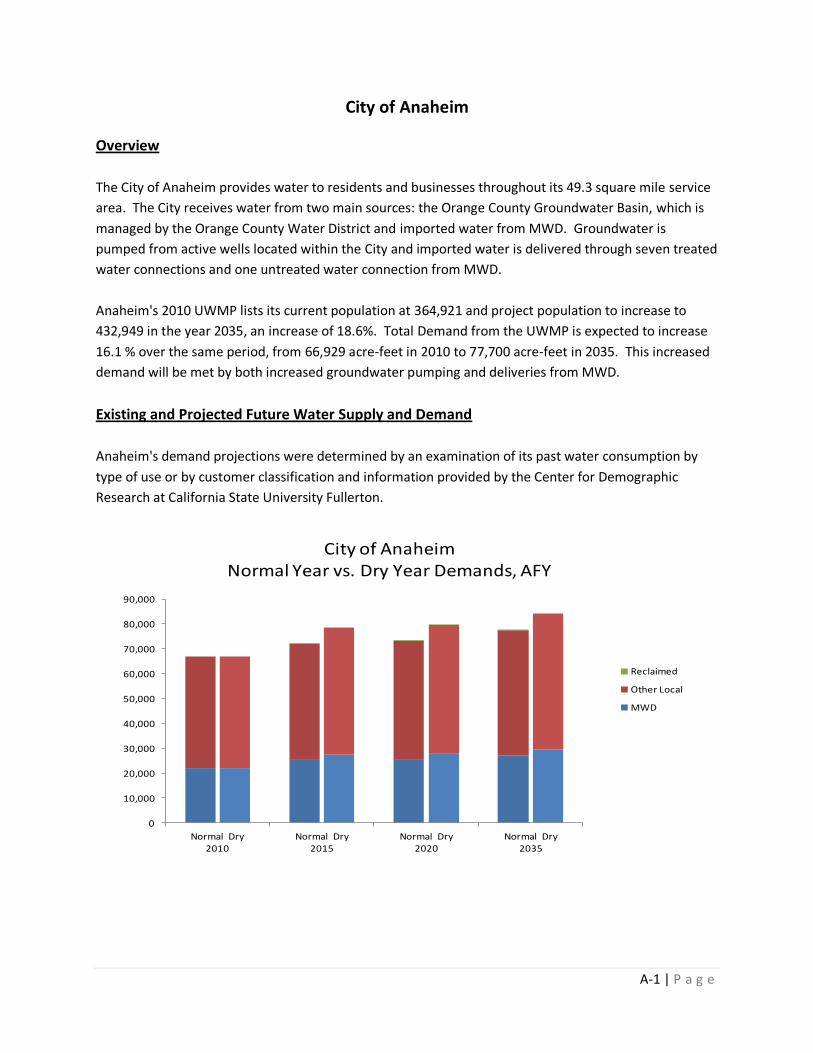
City of Beverly Hills
Overview
The City of Beverly Hills, located in Los Angeles County and surrounded by the City of Los Angeles,
provides water to city residents within its 5.69 square mile city limits and also to a portion of the City of
West Hollywood. Water is obtained from two main sources: groundwater from four groundwater wells
that pump water from the Hollywood Sub basin and treated water from MWD's Weymouth Treatment
Plant through the Santa Monica Feeder. All of the City's raw groundwater is treated at the City's
Reverse Osmosis Treatment Plant.
Beverly Hills' 2010 RUWP lists its water service area population at about 45,000 and projects a 5.75%
increase to 47,587 by the year 2035. Total Demand from the UWMP is expected to increase 5.1 % over
the same period, from 11,562 acre-feet in 2010 to 12,153 acre-feet in 2035. It plans to keep pumping in
the basin fairly constant to help prevent overdraft and stay within its pumping rights, thus this increased
demand will be met by increased deliveries from MWD.
Existing and Projected Future Water Supply and Demand
Beverly Hills' demand projections were determined by an examination of its past water consumption by
type of use or by customer classification, future development and redevelopment. The City is
considered to be "built-out" but as population increases slightly and water conservation measures
continue to be implemented, the plan states that the City should experience moderate increases in its
water consumption following an overall drop in water use from 2010 to 2020 due to SBX7-7
requirements.
0
2,000
4,000
6,000
8,000
10,000
12,000
14,000
16,000
Normal Dry2010
Normal Dry2015
Normal Dry2020
Normal Dry2035
Reclaimed
Other Local
MWD
City of Beverly HillsNormal Year vs. Dry Year Demands, AFY
A-4 | P a g e
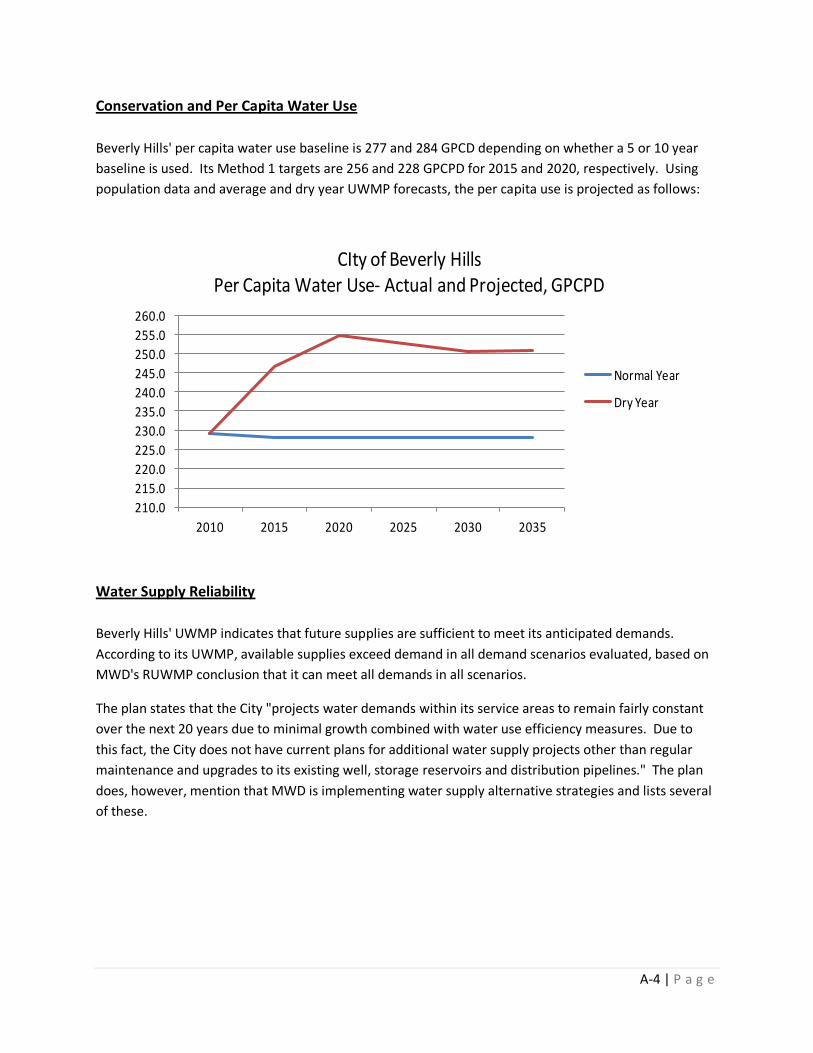
Conservation and Per Capita Water Use
Beverly Hills' per capita water use baseline is 277 and 284 GPCD depending on whether a 5 or 10 year
baseline is used. Its Method 1 targets are 256 and 228 GPCPD for 2015 and 2020, respectively. Using
population data and average and dry year UWMP forecasts, the per capita use is projected as follows:
210.0
215.0
220.0
225.0
230.0
235.0
240.0
245.0
250.0
255.0
260.0
2010 2015 2020 2025 2030 2035
Normal Year
Dry Year
CIty of Beverly HillsPer Capita Water Use- Actual and Projected, GPCPD
Water Supply Reliability
Beverly Hills' UWMP indicates that future supplies are sufficient to meet its anticipated demands.
According to its UWMP, available supplies exceed demand in all demand scenarios evaluated, based on
MWD's RUWMP conclusion that it can meet all demands in all scenarios.
The plan states that the City "projects water demands within its service areas to remain fairly constant
over the next 20 years due to minimal growth combined with water use efficiency measures. Due to
this fact, the City does not have current plans for additional water supply projects other than regular
maintenance and upgrades to its existing well, storage reservoirs and distribution pipelines." The plan
does, however, mention that MWD is implementing water supply alternative strategies and lists several
of these.

A-5 | P a g e
City of Burbank
Overview
The City of Burbank is located approximately 12 miles north of downtown Los Angeles. The City covers
17 square miles of the eastern end of the San Fernando Valley. The City of Los Angeles lies to the north
and west, and the City of Glendale to the south and east. Burbank's 2010 RUWP lists its current
population at 108,469 and projects populations to increase 24.5% to 132,877 in the year 2035. Total
normal year demand from the UWMP is expected to increase 17.6% over the same period. This
increased demand will be met by a combination of increase recycled water use and groundwater
pumping, and increased demand from MWD.
Existing and Projected Future Water Supply and Demand
According to its UWMP, Burbank's water use reached the required 20x2020 levels in 2010, although it
notes that 2010 had mild weather which may have contributed to this reduction. Its FY 2011/12
financial plan projects five years of water sales which are less than its interim 2015 per capita target.
Using available population projections, water use in the subsequent years to 2035 are estimated using
the same GPCD rates as planned for 2015.
0
5,000
10,000
15,000
20,000
25,000
30,000
Normal Dry2010
Normal Dry2015
Normal Dry2020
Normal Dry2035
Reclaimed
Other Local
MWD
City of BurbankNormal Year vs. Dry Year Demands, AFY

A-6 | P a g e
Conservation and Per Capita Water Use
Burbank evaluated its required SBX7-7 requirements using Method 1 and determine its per capita target
to be 156 GPCD. The plan notes its interim target for 2015 to be 175 GPCD and notes that current usage
is already below this target. Using population data and average and dry year UWMP forecasts, the per
capita use is projected as follows:
130.0
132.0
134.0
136.0
138.0
140.0
142.0
144.0
146.0
148.0
2010 2015 2020 2025 2030 2035
Normal Year
Dry Year
City of BurbankPer Capita Water Use- Actual and Projected, GPCPD
Water Supply Reliability
Burbank's UWMP shows that future supplies are sufficient to meet its anticipated demands. In the past
Burbank's groundwater supplies were reduced as a result of water quality issue caused by a number of
factors including industrial releases. Together with others, Burbank embarked on a program to clean up
groundwater supplies and make additional use of these supplies. The City is also implementing a storm
water capture and infiltration program that will increase availability of groundwater supplies.
The plan notes that MWD estimates for Burbank's 2015 demand to be 27% greater than Burbank's 2015
estimate. According to the plan, MWD did not count future conservation from additional agency efforts
to meet 20x2020 goals.
Burbank identified water exchanges, transfers and desalination as possible ways to develop additional
supplies. While they do not have plans to do so, the UWMP plan states the City is supportive of these
efforts by MWD or other entities. The City is looking at a chromium removal pilot study, expanded
water recycling, and more aggressive conservation measures to provide additional supply or reduce
demand further.

A-7 | P a g e
Calleguas MWD
Overview
The Calleguas Municipal Water District, located in southern Ventura County, is a wholesaler water
agency that distributes water to 19 local purveyors. Approximately three-quarters of Ventura County
residents depend on CMWD for all or part of their water. The water supplied by CMWD represents
approximately 73 percent of the total municipal and industrial water demand within its service area.
CMWD's 2010 RUWP lists its current population at 632,399 and projects populations to increase to
730,788 in the year 2035, an increase of 15.6%. Total Demand from the UWMP is expected to increase
17.6% over the same period, from 171,776 acre-feet in 2010 to 202,160 acre-feet in 2035.
Existing and Projected Future Water Supply and Demand
CMWD's UWMP notes that its projections for local supplies are substantially higher than the projections
developed by MWD. The plan notes that "The lower local supply projections by MWD are related to
MWD's policy not to include future local supply projects until funding allocations, engineering,
environmental approvals, and permitting requirements are substantially complete. CMWD purveyors,
however, typically include future local supplies in their projections upon completions of feasibility
studies." This difference tends to decrease the amount of imported water that CMWD states it needs
from MWD, whose estimates are about 15,000 to nearly 19,000 acre-feet higher (12 to 13 percent). For
calculation purposes in the UWMP, Calleguas uses the local supply figures provided by its purveyors.
0
50,000
100,000
150,000
200,000
250,000
Normal Dry2010
Normal Dry2015
Normal Dry2020
Normal Dry2035
Reclaimed
Other Local
MWD
Calleguas MWDNormal Year vs. Dry Year Demands, AFY
Graph-

A-8 | P a g e
Conservation and Per Capita Water Use
The Plan notes that MWD prepared a paper in 2009 titled "Estimating the Water Savings Achieved with
20 percent by 2020 Compliance at the Member Agency Level." Using method 1, the percent reduction
target would be 167 GPCD. While each purveyor's target may be different, the plan compared whether
CMWD's projected water supplies and uses would satisfy this overall target level. The plan found that it
would not, and states that "a combination of additional recycled water projects or conservation beyond
that included in current projections will be required to meet the 2020 targets. " The plan states that
CMWD and MWD intend to provide support for retail agencies efforts through technical assistance and
continued financial assistance to the CMWD wholesale agency assistance program. According to the
plan, a combination of additional increased recycled water use or additional conservation equal to
14.8% percent of total water use may be needed. For 2020, this amounts to a 27,925 acre-foot
reduction in use. Using population data and average and dry year UWMP forecasts, the per capita use is
projected as follows:
210.0
215.0
220.0
225.0
230.0
235.0
240.0
245.0
2010 2015 2020 2025 2030 2035
Normal Year
Dry Year
Calleguas MWDPer Capita Water Use- Actual and Projected, GPCPD
Water Supply Reliability
CMWD's UWMP indicated that future supplies are sufficient to meet its anticipated demands, even
though it may need to reduce demands further to be in compliance with SBX7-7 . CMWD's plan relies
on MWD's RUWMP as the basis for this conclusion. Because MWD estimates that CMWD's demands for
imported water are greater than the CMWD estimate (due to MWD's assumption regarding local
supplies) and that MWD anticipated meeting imported water demands in all supply and demand
conditions, CWMD's plan shows a surplus of supply between 5 and 16%, depending on the hydrologic
condition and planning year.

A-9 | P a g e
Besides increasing local water through the planning horizon with brackish water desalination,
conjunctive use and increased water reclamation, the CMWD plan briefly discusses DWR strategies to
improve the reliability of supplies from the Bay-Delta, MWD strategies on both the SWP and Colorado
River and its own strategies to increase conjunctive use, water treatment and salinity management. The
plan states that the district benefits from water transfers through MWD, but does not plan to pursue
these on its own.
A-10 | P a g e
Central Basin MWD
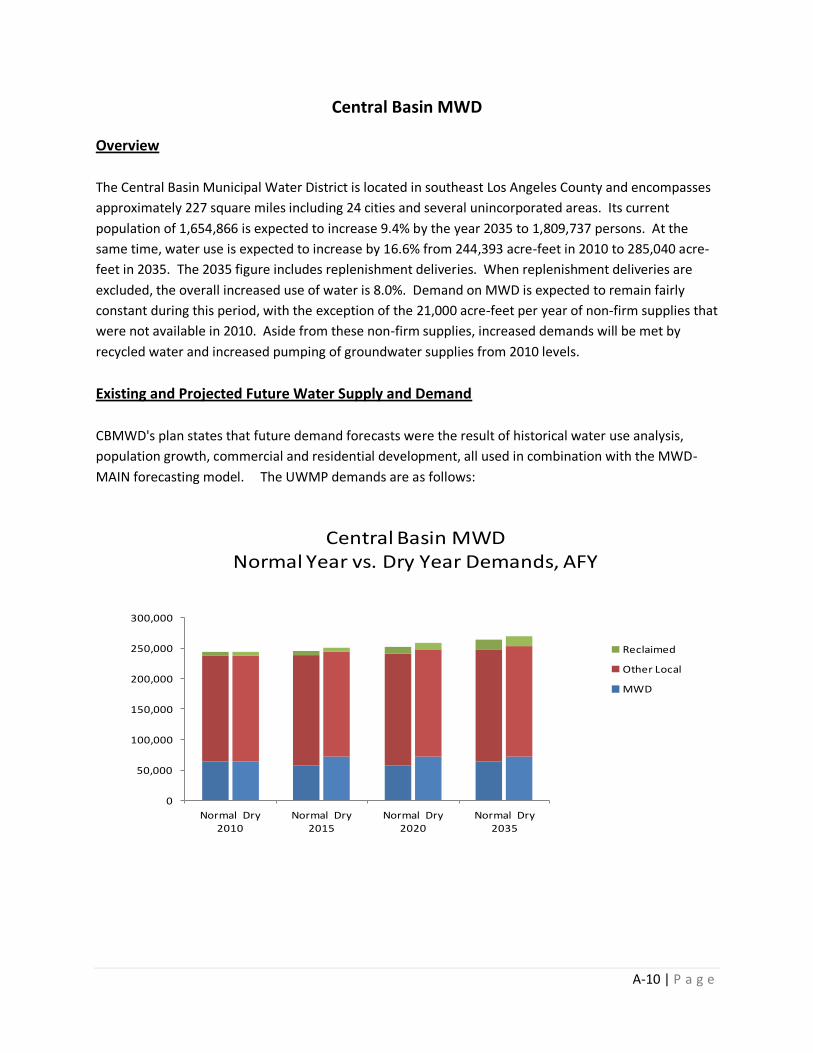
Overview
The Central Basin Municipal Water District is located in southeast Los Angeles County and encompasses
approximately 227 square miles including 24 cities and several unincorporated areas. Its current
population of 1,654,866 is expected to increase 9.4% by the year 2035 to 1,809,737 persons. At the
same time, water use is expected to increase by 16.6% from 244,393 acre-feet in 2010 to 285,040 acre-
feet in 2035. The 2035 figure includes replenishment deliveries. When replenishment deliveries are
excluded, the overall increased use of water is 8.0%. Demand on MWD is expected to remain fairly
constant during this period, with the exception of the 21,000 acre-feet per year of non-firm supplies that
were not available in 2010. Aside from these non-firm supplies, increased demands will be met by
recycled water and increased pumping of groundwater supplies from 2010 levels.
Existing and Projected Future Water Supply and Demand
CBMWD's plan states that future demand forecasts were the result of historical water use analysis,
population growth, commercial and residential development, all used in combination with the MWD-
MAIN forecasting model. The UWMP demands are as follows:
0
50,000
100,000
150,000
200,000
250,000
300,000
Normal Dry2010
Normal Dry2015
Normal Dry2020
Normal Dry2035
Reclaimed
Other Local
MWD
Central Basin MWDNormal Year vs. Dry Year Demands, AFY
A-11 | P a g e
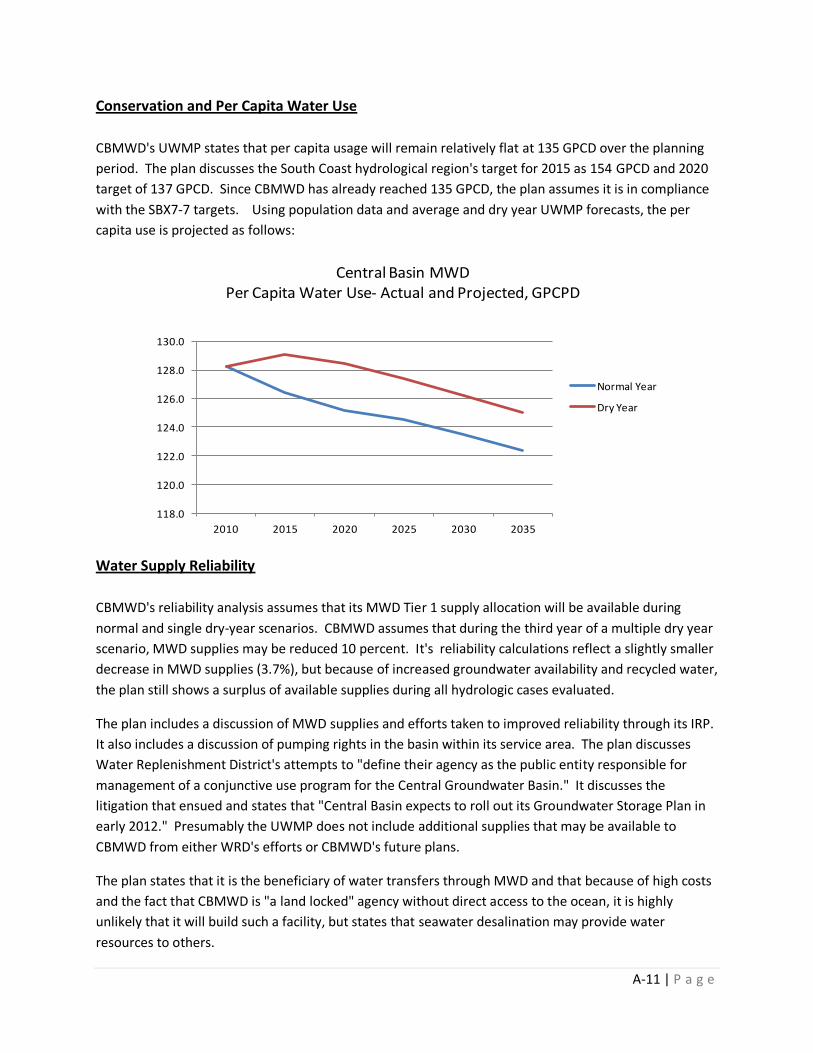
Conservation and Per Capita Water Use
CBMWD's UWMP states that per capita usage will remain relatively flat at 135 GPCD over the planning
period. The plan discusses the South Coast hydrological region's target for 2015 as 154 GPCD and 2020
target of 137 GPCD. Since CBMWD has already reached 135 GPCD, the plan assumes it is in compliance
with the SBX7-7 targets. Using population data and average and dry year UWMP forecasts, the per
capita use is projected as follows:
118.0
120.0
122.0
124.0
126.0
128.0
130.0
2010 2015 2020 2025 2030 2035
Normal Year
Dry Year
Central Basin MWDPer Capita Water Use- Actual and Projected, GPCPD
Water Supply Reliability
CBMWD's reliability analysis assumes that its MWD Tier 1 supply allocation will be available during
normal and single dry-year scenarios. CBMWD assumes that during the third year of a multiple dry year
scenario, MWD supplies may be reduced 10 percent. It's reliability calculations reflect a slightly smaller
decrease in MWD supplies (3.7%), but because of increased groundwater availability and recycled water,
the plan still shows a surplus of available supplies during all hydrologic cases evaluated.
The plan includes a discussion of MWD supplies and efforts taken to improved reliability through its IRP.
It also includes a discussion of pumping rights in the basin within its service area. The plan discusses
Water Replenishment District's attempts to "define their agency as the public entity responsible for
management of a conjunctive use program for the Central Groundwater Basin." It discusses the
litigation that ensued and states that "Central Basin expects to roll out its Groundwater Storage Plan in
early 2012." Presumably the UWMP does not include additional supplies that may be available to
CBMWD from either WRD's efforts or CBMWD's future plans.
The plan states that it is the beneficiary of water transfers through MWD and that because of high costs
and the fact that CBMWD is "a land locked" agency without direct access to the ocean, it is highly
unlikely that it will build such a facility, but states that seawater desalination may provide water
resources to others.

A-12 | P a g e
City of Compton
Overview
The City of Compton is located approximately six miles north of downtown Long Beach covering
approximately 10.2 square miles. The Compton Municipal Water District retails water to approximately
80 percent of the City and private water companies provide service to the remaining residents. Water
is obtained from two main two main sources: the Central Groundwater Basin and imported water from
MWD. Groundwater is pumped from active wells located within the City and imported water is
delivered through treated water connections from MWD.
Compton's 2010 RUWP lists its current population at 81,963 and projects populations to increase to
93,336 in the year 2030, an increase of 13.9%. Total Demand from the UWMP is expected to increase
7.6 % over the same period, from 8,929 acre-feet in 2010 to 10,455 acre-feet in 2030. As its rights to
pump water from the groundwater basin are fixed, this increased demand will be met by increased
deliveries from MWD.
Existing and Projected Future Water Supply and Demand
Compton's demand projections were determined by an examination of its past water consumption by
type of use or by customer classification. Water losses, estimated at 20% in 2010 were also included in
overall projections.
0
2,000
4,000
6,000
8,000
10,000
12,000
Normal Dry2010
Normal Dry2015
Normal Dry2020
Normal Dry2035
Reclaimed
Other Local
MWD
City of ComptonNormal Year vs. Dry Year Demands, AFY

A-13 | P a g e
Conservation and Per Capita Water Use
Compton's per capita water use is currently around 100 GPCPD and is therefore already meeting SBX7-7
requirements. Its base usage was calculated as 106 GPCPD and the City used Option 3, which is to
achieve 95% of the applicable state hydrologic region target to determine its 2015 and 2020 target of
142 GPCPD. Using population data and average and dry year UWMP forecasts, the per capita use is
projected as follows:
95.0
96.0
97.0
98.0
99.0
100.0
101.0
2010 2015 2020 2025 2030 2035
Normal Year
Dry Year
City of ComptonPer Capita Water Use- Actual and Projected, GPCPD
Water Supply Reliability
Compton's UWMP indicates that future supplies are sufficient to meet its anticipated demands. While
its UWMP Tables 5.4.5 and 5.4.6 show demand exceeding supply by up to 15 percent in dry and multiple
dry years, the plan states that Central Basin and MWD can provide additional surplus supplies to the City
to meet demands, when necessary. While these supplies may be available, the plan states that the City
"is still committed to water conservation in single dry and multiple dray years to help preserve precious
water reserves and supplies."
The plan states that the City does not distribute recycled water in its service are at this time, and has no
plans to do so in the future. It states that this is because of "alternate priorities by the recycled water
wholesaler within the service areas, the Central Basin Municipal Water District (CBMWD), and a lack of
funds available." The plan identifies one potential customer with a demand of 42 acre-feet per year.
The plan states that it receives benefits from MWD's water transfers and desalination programs but it
has no plans to pursue such options on its own.
A-14 | P a g e
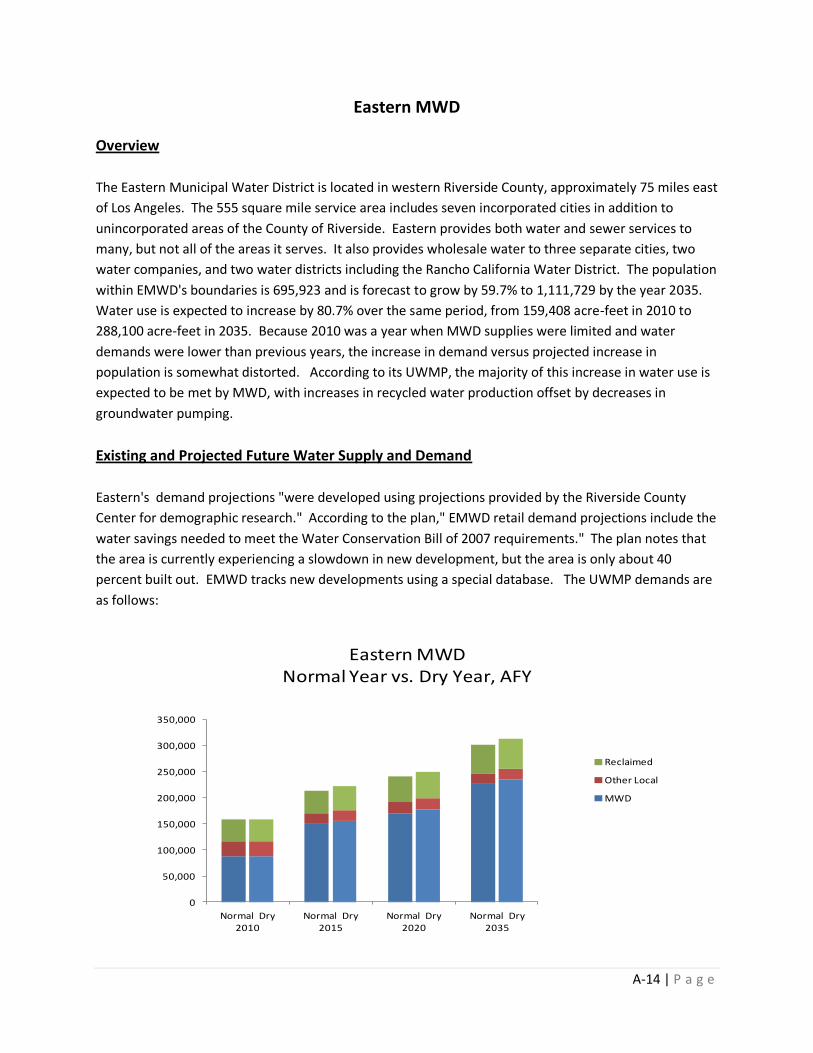
Eastern MWD
Overview
The Eastern Municipal Water District is located in western Riverside County, approximately 75 miles east
of Los Angeles. The 555 square mile service area includes seven incorporated cities in addition to
unincorporated areas of the County of Riverside. Eastern provides both water and sewer services to
many, but not all of the areas it serves. It also provides wholesale water to three separate cities, two
water companies, and two water districts including the Rancho California Water District. The population
within EMWD's boundaries is 695,923 and is forecast to grow by 59.7% to 1,111,729 by the year 2035.
Water use is expected to increase by 80.7% over the same period, from 159,408 acre-feet in 2010 to
288,100 acre-feet in 2035. Because 2010 was a year when MWD supplies were limited and water
demands were lower than previous years, the increase in demand versus projected increase in
population is somewhat distorted. According to its UWMP, the majority of this increase in water use is
expected to be met by MWD, with increases in recycled water production offset by decreases in
groundwater pumping.
Existing and Projected Future Water Supply and Demand
Eastern's demand projections "were developed using projections provided by the Riverside County
Center for demographic research." According to the plan," EMWD retail demand projections include the
water savings needed to meet the Water Conservation Bill of 2007 requirements." The plan notes that
the area is currently experiencing a slowdown in new development, but the area is only about 40
percent built out. EMWD tracks new developments using a special database. The UWMP demands are
as follows:
0
50,000
100,000
150,000
200,000
250,000
300,000
350,000
Normal Dry2010
Normal Dry2015
Normal Dry2020
Normal Dry2035
Reclaimed
Other Local
MWD
Eastern MWDNormal Year vs. Dry Year, AFY

A-15 | P a g e
Conservation and Per Capita Water Use
Eastern's UWMP includes calculations to meet SBX7-7 requirements. Its calculated baseline usage is 212
GPCD and method 2 is used to determine its 2105 target of 197.98 GPCD and 2020 target of 183.96
GPCD. To reduce its demands it plans to increase recycled water use and develop various conservation
programs. The targets apply to the retail service areas; the wholesales areas may have different
targets. Using population data and average and dry year UWMP forecasts, the per capita use is
projected as follows:
0
50
100
150
200
250
2010 2015 2020 2025 2030 2035
Normal Year
Dry Year
Eastern MWDPer Capita Water Use- Actual and Projected, GPCPD
Water Supply Reliability
Eastern's UWMP shows its water supplies as sufficient to meet its demands under all conditions
evaluated. According to the plan, "The majority of EMWD's current and projected water supplies are
imported through the MWD. In its 2010 RUWMP, MWD concluded that with the storage and transfers
programs developed, MWD will have a reliable source of water to serve its member agencies' needs
through 2035 during normal, historic single-dry and historic multiple-dry years. Unprecedented
shortage will be addressed through the water supply allocation plan."
The plan states that Eastern's planned local supplies will supplement imported supplies and improve
reliability for Eastern and the region. Eastern plans to expand a desalination program to desalt brackish
water. The plan states that another desalter could be warranted, in addition to an indirect potable
reuse project. These additional supplies are not included in supply projections. The plan also states that
EMWD is proposing a targeted 30 percent reduction in outdoor demand and a 10 percent reduction in
indoor demand by 2035. Presumably these reductions are not included in the demand projections.
Eastern states that it is investigating opportunities for independent transfers and exchanges, but states
that it cannot quantify these at this time.

A-16 | P a g e
Foothill MWD
Overview
The Foothill Municipal Water District is a wholesale agency that provides imported water to retail
agencies located in the foothills of the San Gabriel Mountains in Los Angeles County. While FMWD is
dependent on MWD for 100 percent of its water supply, most of its retail agencies have access to their
own groundwater supplies. Currently, these agencies rely on about 60 percent of their supplies to come
from FMWD.
The FMWD service area covers 21.66 square miles and overlies both the Raymond and Verdugo
Groundwater Basins. FMWD's 2010 RUWP lists its current population at 87,876 and projects
populations to increase 16.1% to 102,003 in the year 2035. Total normal year imported demand listed
the UWMP is expected to increase 25% over the same period, although this increase represents only the
increase in imported water demands of the agencies that FMWD serves and not use of local supplies.
The UWMP does not document or project local supply used within its service area.
Existing and Projected Future Water Supply and Demand
FMWD's future MWD demands are the accumulation of its retailer's estimated demands for imported
water. Presumably this information came from the retailers as they would have the best local
knowledge of historic water use trends, demographic, and land use trends within their boundaries. The
UWMP demands and supply are as follows:
0
2,000
4,000
6,000
8,000
10,000
12,000
14,000
16,000
Normal Dry2010
Normal Dry2015
Normal Dry2020
Normal Dry2035
Reclaimed
Other Local
MWD
Foothill MWDNormal Year vs. Dry Year Demands, AFY
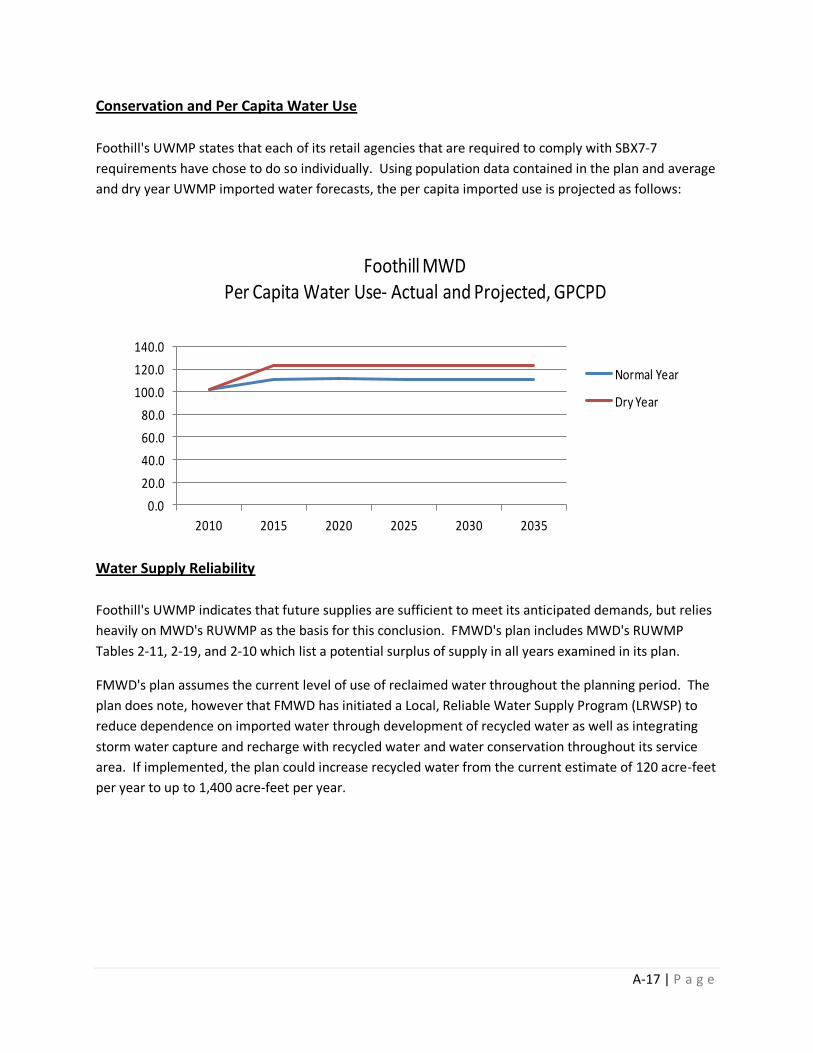
A-17 | P a g e
Conservation and Per Capita Water Use
Foothill's UWMP states that each of its retail agencies that are required to comply with SBX7-7
requirements have chose to do so individually. Using population data contained in the plan and average
and dry year UWMP imported water forecasts, the per capita imported use is projected as follows:
0.0
20.0
40.0
60.0
80.0
100.0
120.0
140.0
2010 2015 2020 2025 2030 2035
Normal Year
Dry Year
Foothill MWDPer Capita Water Use- Actual and Projected, GPCPD
Water Supply Reliability
Foothill's UWMP indicates that future supplies are sufficient to meet its anticipated demands, but relies
heavily on MWD's RUWMP as the basis for this conclusion. FMWD's plan includes MWD's RUWMP
Tables 2-11, 2-19, and 2-10 which list a potential surplus of supply in all years examined in its plan.
FMWD's plan assumes the current level of use of reclaimed water throughout the planning period. The
plan does note, however that FMWD has initiated a Local, Reliable Water Supply Program (LRWSP) to
reduce dependence on imported water through development of recycled water as well as integrating
storm water capture and recharge with recycled water and water conservation throughout its service
area. If implemented, the plan could increase recycled water from the current estimate of 120 acre-feet
per year to up to 1,400 acre-feet per year.
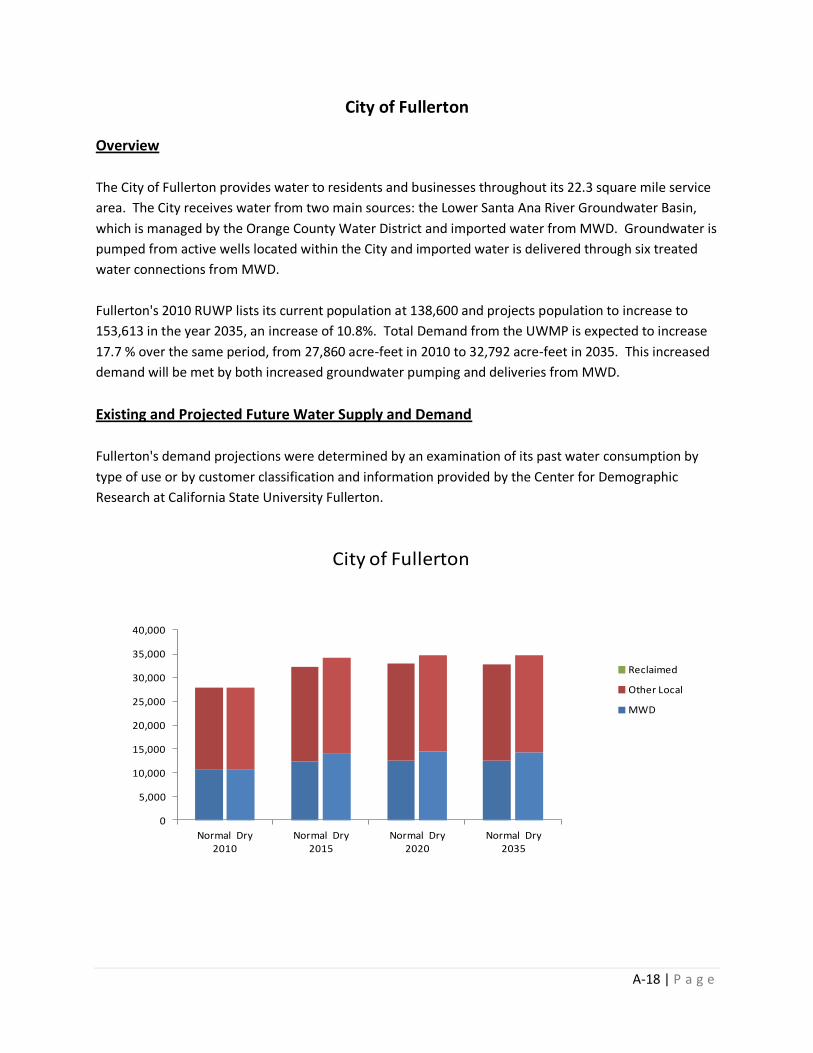
A-18 | P a g e
City of Fullerton
Overview
The City of Fullerton provides water to residents and businesses throughout its 22.3 square mile service
area. The City receives water from two main sources: the Lower Santa Ana River Groundwater Basin,
which is managed by the Orange County Water District and imported water from MWD. Groundwater is
pumped from active wells located within the City and imported water is delivered through six treated
water connections from MWD.
Fullerton's 2010 RUWP lists its current population at 138,600 and projects population to increase to
153,613 in the year 2035, an increase of 10.8%. Total Demand from the UWMP is expected to increase
17.7 % over the same period, from 27,860 acre-feet in 2010 to 32,792 acre-feet in 2035. This increased
demand will be met by both increased groundwater pumping and deliveries from MWD.
Existing and Projected Future Water Supply and Demand
Fullerton's demand projections were determined by an examination of its past water consumption by
type of use or by customer classification and information provided by the Center for Demographic
Research at California State University Fullerton.
0
5,000
10,000
15,000
20,000
25,000
30,000
35,000
40,000
Normal Dry2010
Normal Dry2015
Normal Dry2020
Normal Dry2035
Reclaimed
Other Local
MWD
City of Fullerton
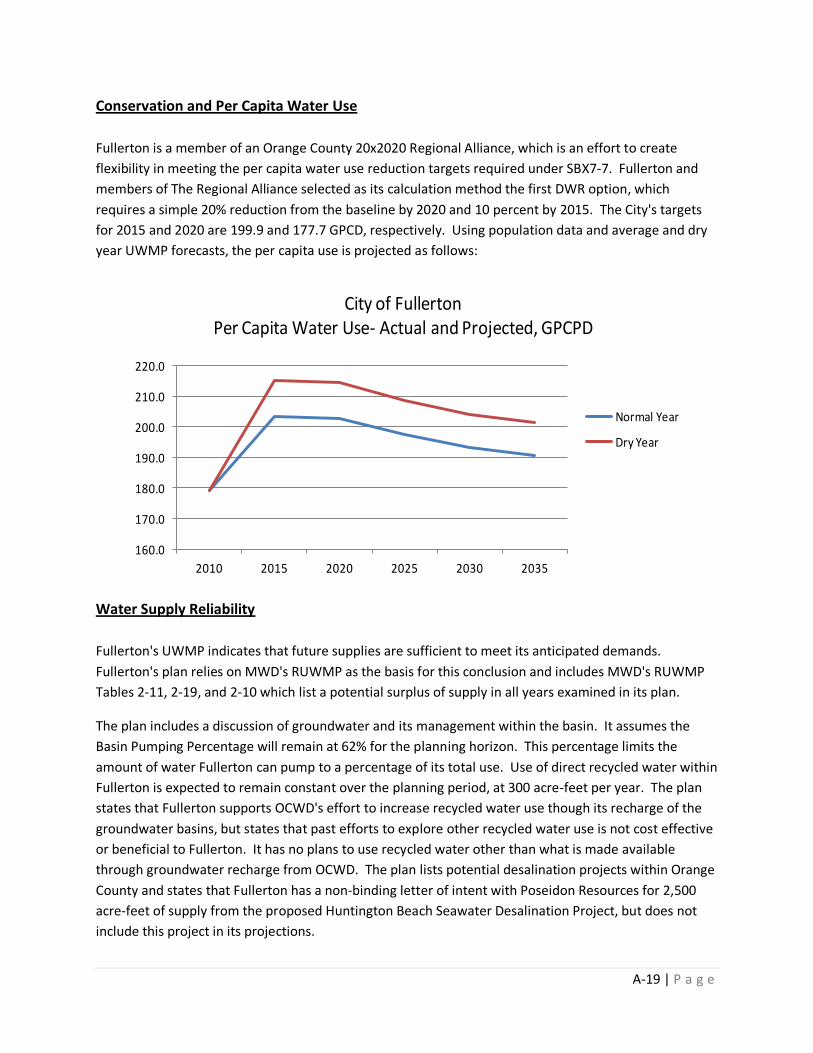
A-19 | P a g e
Conservation and Per Capita Water Use
Fullerton is a member of an Orange County 20x2020 Regional Alliance, which is an effort to create
flexibility in meeting the per capita water use reduction targets required under SBX7-7. Fullerton and
members of The Regional Alliance selected as its calculation method the first DWR option, which
requires a simple 20% reduction from the baseline by 2020 and 10 percent by 2015. The City's targets
for 2015 and 2020 are 199.9 and 177.7 GPCD, respectively. Using population data and average and dry
year UWMP forecasts, the per capita use is projected as follows:
160.0
170.0
180.0
190.0
200.0
210.0
220.0
2010 2015 2020 2025 2030 2035
Normal Year
Dry Year
City of FullertonPer Capita Water Use- Actual and Projected, GPCPD
Water Supply Reliability
Fullerton's UWMP indicates that future supplies are sufficient to meet its anticipated demands.
Fullerton's plan relies on MWD's RUWMP as the basis for this conclusion and includes MWD's RUWMP
Tables 2-11, 2-19, and 2-10 which list a potential surplus of supply in all years examined in its plan.
The plan includes a discussion of groundwater and its management within the basin. It assumes the
Basin Pumping Percentage will remain at 62% for the planning horizon. This percentage limits the
amount of water Fullerton can pump to a percentage of its total use. Use of direct recycled water within
Fullerton is expected to remain constant over the planning period, at 300 acre-feet per year. The plan
states that Fullerton supports OCWD's effort to increase recycled water use though its recharge of the
groundwater basins, but states that past efforts to explore other recycled water use is not cost effective
or beneficial to Fullerton. It has no plans to use recycled water other than what is made available
through groundwater recharge from OCWD. The plan lists potential desalination projects within Orange
County and states that Fullerton has a non-binding letter of intent with Poseidon Resources for 2,500
acre-feet of supply from the proposed Huntington Beach Seawater Desalination Project, but does not
include this project in its projections.
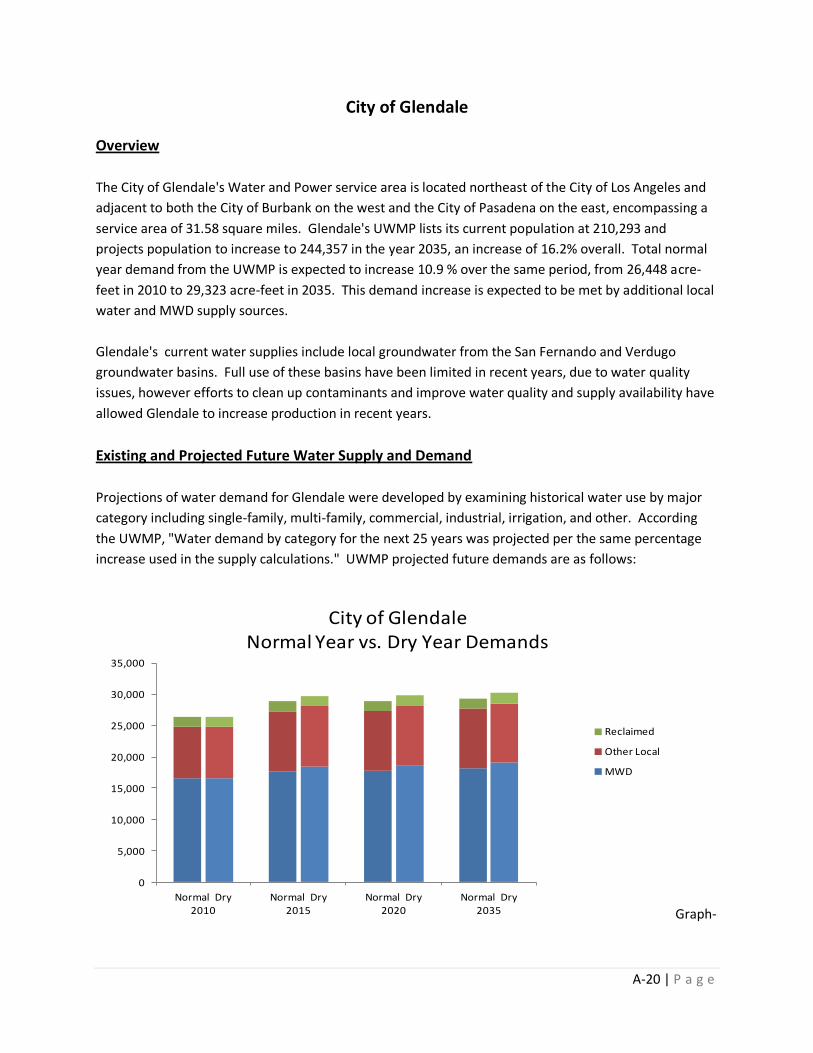
A-20 | P a g e
City of Glendale
Overview
The City of Glendale's Water and Power service area is located northeast of the City of Los Angeles and
adjacent to both the City of Burbank on the west and the City of Pasadena on the east, encompassing a
service area of 31.58 square miles. Glendale's UWMP lists its current population at 210,293 and
projects population to increase to 244,357 in the year 2035, an increase of 16.2% overall. Total normal
year demand from the UWMP is expected to increase 10.9 % over the same period, from 26,448 acre-
feet in 2010 to 29,323 acre-feet in 2035. This demand increase is expected to be met by additional local
water and MWD supply sources.
Glendale's current water supplies include local groundwater from the San Fernando and Verdugo
groundwater basins. Full use of these basins have been limited in recent years, due to water quality
issues, however efforts to clean up contaminants and improve water quality and supply availability have
allowed Glendale to increase production in recent years.
Existing and Projected Future Water Supply and Demand
Projections of water demand for Glendale were developed by examining historical water use by major
category including single-family, multi-family, commercial, industrial, irrigation, and other. According
the UWMP, "Water demand by category for the next 25 years was projected per the same percentage
increase used in the supply calculations." UWMP projected future demands are as follows:
0
5,000
10,000
15,000
20,000
25,000
30,000
35,000
Normal Dry2010
Normal Dry2015
Normal Dry2020
Normal Dry2035
Reclaimed
Other Local
MWD
City of GlendaleNormal Year vs. Dry Year Demands
Graph-

A-21 | P a g e
Conservation and Per Capita Water Use
Glendale evaluated its SBX7-7 requirements using Method 3 and determined its per capita target to be
137 GPCD and an interim target of 140.1 GPCD for 1015. Using population data and average and dry
year UWMP forecasts, the per capita use is projected as follows:
90.0
95.0
100.0
105.0
110.0
115.0
120.0
2010 2015 2020 2025 2030 2035
Normal Year
Dry Year
City of GlendalePer Capita Water Use- Actual and Projected, GPCPD
Water Supply Reliability
Glendale's UWMP indicates that future supplies are sufficient to meet its anticipated demands. The
plan relies on MWD's RUWMP as the basis for this conclusion with respect to imported water
availability. According to the plan, "Glendale foresees very little change in available sources and
amounts of water supply needed to meet water demands. In the next 25 years, we expect the same
amount of supply from the San Fernando Basin. On the other hand, we will be utilizing the City's full
water rights in the Verdugo Basin with the addition of new wells. Recycled water... will remain constant
with very little addition." Imported water from MWD as stated in MWD's 2010 UWMP, "shows that the
region can provide reliable water supplies under both the single driest year and the multiple dry year
hydrologies."
The plan contains only a brief discussion of water transfers and desalination. Glendale may utilize short
term transfers with neighboring agencies or cities. The plan states that it is supportive of MWD's efforts
to secure out-of-region water transfers and (with other agencies') desalination.

A-22 | P a g e
Inland Empire Utilities Agency
Overview
The Inland Empire Utilities Agency provides a number of services within the western portion of San
Bernardino County, including production of recycled water, sewage collection and treatment,
distribution of imported and recycled water, desalination of groundwater supplies and disposal of
industrial wastewater and brine. IEUA's service area encompasses approximately 242 square miles and
serves an estimated population of 846,469. The population is expected to grow 38.9% by 2035. Water
use within the service area for 2010 is reported as 243,664 acre-feet, and is expected to increase 28.9%
to 314,136 acre-feet by 2035. This increased demand is expected to be met by a combination of
increased recycled water use (32%), increased groundwater production (24%) and increased deliveries
from MWD (44%).
Existing and Projected Future Water Supply and Demand
IEUA's UWMP compares its estimated total water use in the future with MWD projections derived from
the MWD-MAIN model. According to the UWMP, overall IEUA member agency demand projections are
very similar to MWD's projections, with IEUA's demands being approximately 1% higher than MWD's in
the year 2035. The UWMP demands are as follows:
0
50,000
100,000
150,000
200,000
250,000
300,000
350,000
Normal Dry2010
Normal Dry2015
Normal Dry2020
Normal Dry2035
Reclaimed
Other Local
MWD
Inland Empire Utilities AgencyNormal Year vs. Dry Year Demands, AFY

A-23 | P a g e
Conservation and Per Capita Water Use
IEUA's UWMP includes calculations to meet SBX7-7 requirements, even though as an urban wholesale
water supplier, is not required to do so. It calculated its baseline for the "IEUA territory" as 251 GPCD
with 2015 and 2020 targets of 226 and 201 GPCD, respectively. The UWMP states that IEUA expects to
meet or exceed both targets. Using population data and average and dry year UWMP forecasts, the per
capita use is projected as follows:
0.0
50.0
100.0
150.0
200.0
250.0
300.0
2010 2015 2020 2025 2030 2035
Normal Year
Dry Year
Inland Empire Utilities AgencyPer Capita Water Use- Actual and Projected, GPCPD
Water Supply Reliability
IEUA shows its water supplies to exceed its demands under all conditions evaluated. IEUA assumes in its
projections that during dry and multiple dry years demands will be reduced by 10%. The plan states that
with implementation of MWD's 2010 IRP, it will have the resources to supply IEUA customers with 100
percent of their imported water demands. The plan states that with IEUA's dry year yield program in
effect, several of IEUA's member agencies will reduce their imported water demands, thus reducing
demands on MWD. This reduction (to 62% of the normal demand) is reflected in the single and multiple
dry years imported water projections. While the plan states overall demand projections by its members
are consistent with the MWD MAIN overall projections, it does not state whether both MWD and IEUA
account for reduced MWD demands in the dry and multi-dry year scenarios.
The plan discusses ways in which recycled water use will increase, how groundwater programs will
increase dry year yield, and also how expansion of the Chino desalter will increase local supplies to IEUA
agencies.

A-24 | P a g e
Las Virgenes MWD
Overview
Las Virgenes Municipal Water District is a retail water supplier in western Los Angeles County and
comprises a 122 square mile area. The service areas includes the incorporated cities of Agoura Hills,
Calabasas, Hidden Hills and Westlake Village as well as unincorporated portions of Los Angeles County.
LVMWD's 2010 RUWP lists its current population at 75,384 and projects populations to increase to
87,811 in the year 2035, an increase of 16.5%. Total normal water year demand from the UWMP is
expected to increase 34.5% over the same period, from 24,721 acre-feet in 2010 to 33,252 acre-feet in
2035. Of this increase, approximately 53% is projected to be from increased recycled water use.
LVMWD notes in its plan that 2010 demands are lower than its projected demand, citing temporary
conditions including penalties, weather and recession.
Existing and Projected Future Water Supply and Demand
LVMWD uses SCAG populations as the basis for calculating future water demands. The plan states that
historical per capita consumption rate was used in combination with the population projects to estimate
future water demands. The plan states that this is the same method used in LVMWD's 2007 Integrated
Water System Report.
0
5,000
10,000
15,000
20,000
25,000
30,000
35,000
40,000
45,000
Normal Dry2010
Normal Dry2015
Normal Dry2020
Normal Dry2035
Reclaimed
Other Local
MWD
Las Virgenes MWDNormal Year vs. Dry Year Demands, AFY
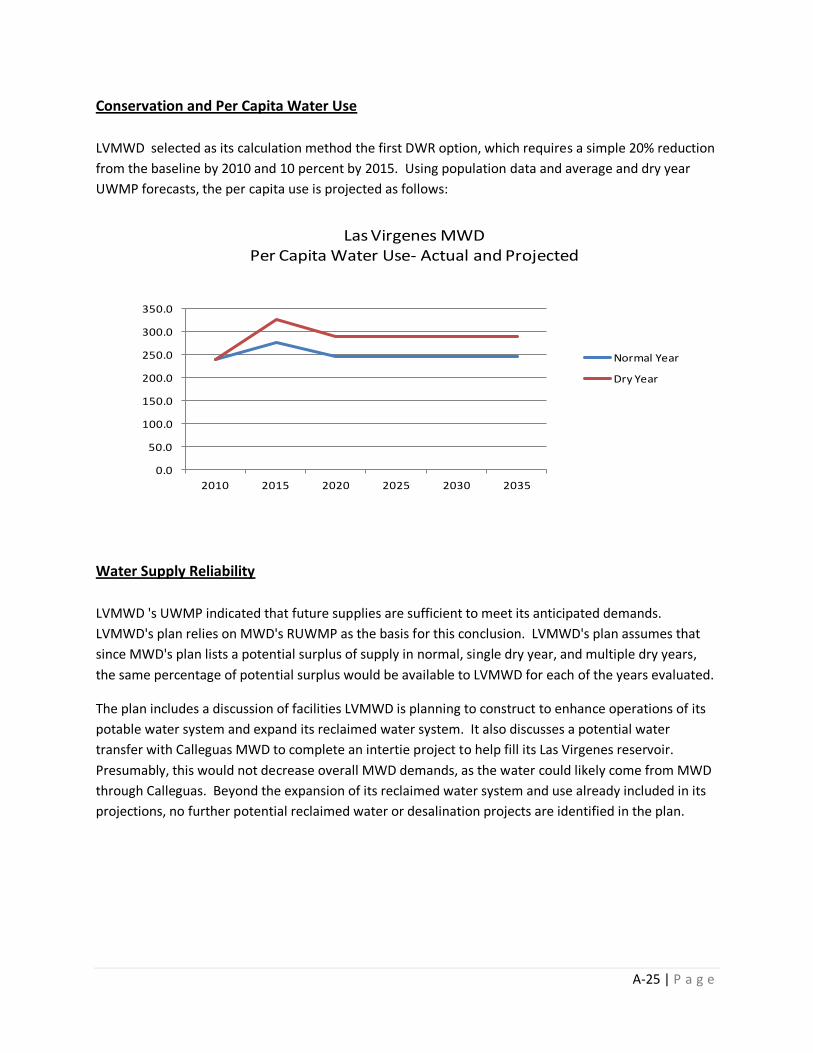
A-25 | P a g e
Conservation and Per Capita Water Use
LVMWD selected as its calculation method the first DWR option, which requires a simple 20% reduction
from the baseline by 2010 and 10 percent by 2015. Using population data and average and dry year
UWMP forecasts, the per capita use is projected as follows:
0.0
50.0
100.0
150.0
200.0
250.0
300.0
350.0
2010 2015 2020 2025 2030 2035
Normal Year
Dry Year
Las Virgenes MWDPer Capita Water Use- Actual and Projected
Water Supply Reliability
LVMWD 's UWMP indicated that future supplies are sufficient to meet its anticipated demands.
LVMWD's plan relies on MWD's RUWMP as the basis for this conclusion. LVMWD's plan assumes that
since MWD's plan lists a potential surplus of supply in normal, single dry year, and multiple dry years,
the same percentage of potential surplus would be available to LVMWD for each of the years evaluated.
The plan includes a discussion of facilities LVMWD is planning to construct to enhance operations of its
potable water system and expand its reclaimed water system. It also discusses a potential water
transfer with Calleguas MWD to complete an intertie project to help fill its Las Virgenes reservoir.
Presumably, this would not decrease overall MWD demands, as the water could likely come from MWD
through Calleguas. Beyond the expansion of its reclaimed water system and use already included in its
projections, no further potential reclaimed water or desalination projects are identified in the plan.

A-26 | P a g e
City of Long Beach
Overview
The City of Long Beach incorporates about 52 square miles in the southwest corner of the County of Los
Angeles. Long Beach's UWMP lists its current population at 462,257 and projects population to increase
to 508,233 in the year 2035, an increase of 9.9% overall. Total normal year demand from the UWMP is
expected to increase 11.8 % over the same period, from 63,448 acre-feet in 2010 to 70,929 acre-feet in
2035. This demand increase is expected to be met by additional local water, including recycling and
seawater desalination. These additional supplies are also expected to decrease MWD demands from
22,237 acre-feet in 2010 to 11,929 acre-feet in 2035.
Long Beach's current water supplies include local groundwater from the West Coast Basin. According to
the UWMP, Long Beach has a right to pump 32,692 acre-feet from the basin and has and will continue to
fully utilize this supply.
Existing and Projected Future Water Supply and Demand
According to the plan, "Future water use projections were based on estimates developed in cooperation
with MWDSC (which used input from LBWD and SCAG, feed that information into MWDSC's
econometric model), LBWD's expectations for additional water conservation and the SBX7-7 urban
water use target for LBWD." UWMP projected future demands are as follows:
0
10,000
20,000
30,000
40,000
50,000
60,000
70,000
80,000
Normal Dry2010
Normal Dry2015
Normal Dry2020
Normal Dry2035
Reclaimed
Other Local
MWD
City of Long BeachNormal Year vs. Dry Year Demands, AFY

A-27 | P a g e
Conservation and Per Capita Water Use
Long Beach evaluated its SBX7-7 requirements using Method 1 and determined its per capita target to
be 107 GPCD. The plan states that Long Beach did not account in its calculations for indirect potable
reuse water that is used, in part, to charge the West Coast Basin. It reserved the right to use these
supplies for calculation purposes in the future. This is because the City feels it can meet the water use
target without having to account for this additional reclaimed water usage at this time. Using
population data and average and dry year UWMP forecasts, the per capita use is projected as follows:
94.0
96.0
98.0
100.0
102.0
104.0
106.0
108.0
110.0
112.0
2010 2015 2020 2025 2030 2035
Normal Year
Dry Year
City of Long BeachPer Capita Water Use- Actual and Projected, GPCPD
Water Supply Reliability
Long Beach's UWMP indicates that future supplies are sufficient to meet its anticipated demands. The
plan relies, in part, on MWD's RUWMP as the basis for this conclusion with respect to imported water
availability. The plan includes calculations of its preferential right from MWD and determines that even
if MWD had only 1,500,000 acre-feet of supply, its 2.54% of preferential rights would provide 38,100
acre-feet of supply, and would sufficiently meet its current or future expected MWD demand of 22,237
and 11,929 acre-feet, respectively.
Long Beach is expanding its use of reclaimed water and has incorporated a seawater desalination plant
that would provide up to 10,000 acre-feet of water , beginning in 2025. While the desalination plant's
production was incorporated into Long Beach's future supplies, the plan states "If the desalination
facility is not put into production LBWD will continue to purchase the same amount [as current] from
MWDSC. This will have no impact of MWDSC's ability to supply reliable water to LBWD, due to the
relatively minuscule amount of water involved compared to the total MWDSC supply, and for the
reasons stated above [preferential right]in the discussion of imported water." Long Beach has no plans
to pursue water transfers, and "will rely on MWDSC to make that determination and pursue transfers/
exchanges."
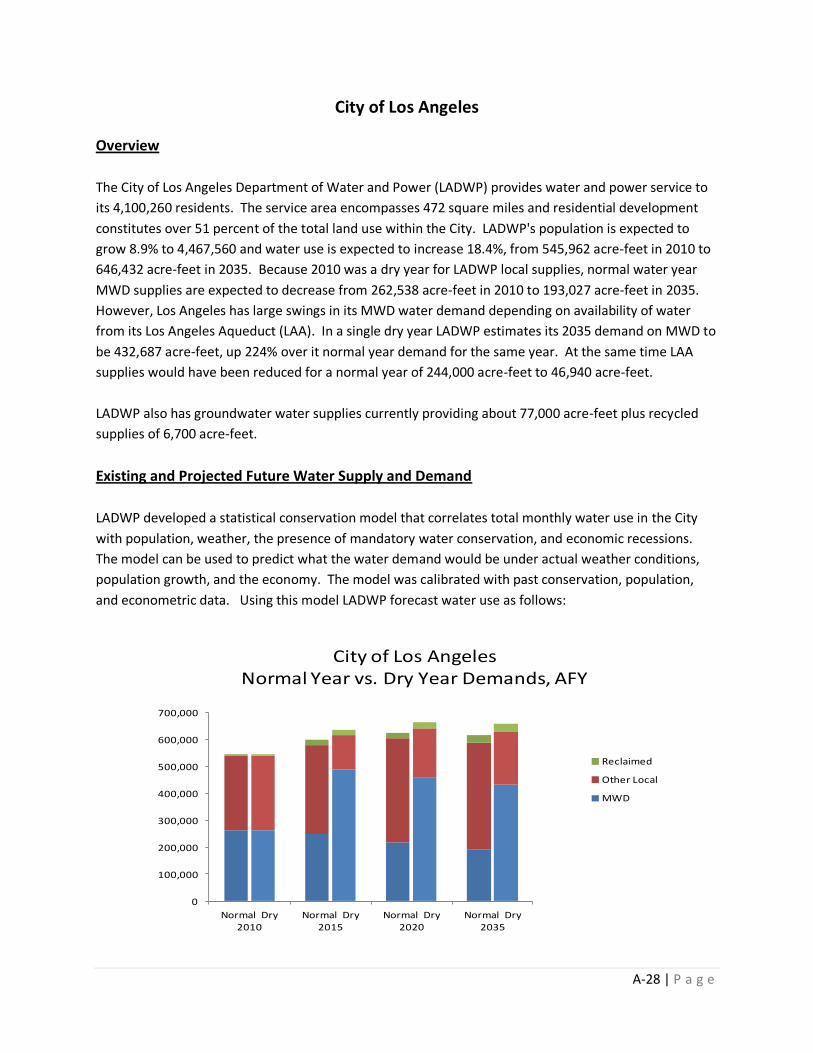
A-28 | P a g e
City of Los Angeles
Overview
The City of Los Angeles Department of Water and Power (LADWP) provides water and power service to
its 4,100,260 residents. The service area encompasses 472 square miles and residential development
constitutes over 51 percent of the total land use within the City. LADWP's population is expected to
grow 8.9% to 4,467,560 and water use is expected to increase 18.4%, from 545,962 acre-feet in 2010 to
646,432 acre-feet in 2035. Because 2010 was a dry year for LADWP local supplies, normal water year
MWD supplies are expected to decrease from 262,538 acre-feet in 2010 to 193,027 acre-feet in 2035.
However, Los Angeles has large swings in its MWD water demand depending on availability of water
from its Los Angeles Aqueduct (LAA). In a single dry year LADWP estimates its 2035 demand on MWD to
be 432,687 acre-feet, up 224% over it normal year demand for the same year. At the same time LAA
supplies would have been reduced for a normal year of 244,000 acre-feet to 46,940 acre-feet.
LADWP also has groundwater water supplies currently providing about 77,000 acre-feet plus recycled
supplies of 6,700 acre-feet.
Existing and Projected Future Water Supply and Demand
LADWP developed a statistical conservation model that correlates total monthly water use in the City
with population, weather, the presence of mandatory water conservation, and economic recessions.
The model can be used to predict what the water demand would be under actual weather conditions,
population growth, and the economy. The model was calibrated with past conservation, population,
and econometric data. Using this model LADWP forecast water use as follows:
0
100,000
200,000
300,000
400,000
500,000
600,000
700,000
Normal Dry2010
Normal Dry2015
Normal Dry2020
Normal Dry2035
Reclaimed
Other Local
MWD
City of Los AngelesNormal Year vs. Dry Year Demands, AFY

A-29 | P a g e
Conservation and Per Capita Water Use
LADWP evaluated its SBX7-7 requirements using Method 3 and determined its per capita baseline to be
154 GPCD. LADWP's interim target is 146 GPCD and the 2020 target is 138 GPCD. Using population
data and average and dry year UWMP forecasts, the per capita use is projected as follows:
105.0
110.0
115.0
120.0
125.0
130.0
135.0
140.0
2010 2015 2020 2025 2030 2035
Normal Year
Dry Year
City of Los AngelesPer Capita Water Use- Actual and Projected, GPCPD
Water Supply Reliability
LADWP's UWMP indicates that future supplies are sufficient to meet its anticipated demands. The plan
relies on MWD's RUWMP as the basis for this conclusion with respect to imported water availability, but
states that if imported water shortages should occur, then MWD's Water Supply Allocation Plan would
be implemented. The plan states that the WSAP was "designed to allocate supplies among its member
agencies in a fair and efficient manner." It also states "whether LADWP can provide reliable water
services to the residents of Los Angeles is highly dependent on MWD's assurances of supply reliability. It
further states that "the recent water supply shortage caused by dry weather and pumping restrictions in
the Delta prompted the City to develop a more sustainable water supply portfolio."
LADWP plans to reduce its normal year purchases from MWD by half, from the five-year average of 52
percent of total demands between 2006 and 2010 to 24 percent by 2035. The dry year purchases would
be nearly 63 percent. The reduction in normal year purchases would be accomplished by increasing
recycled water use to 59,000 acre-feet (direct and indirect), annual water transfers of 40,000 acre-feet
and increased groundwater usage to 110,000 acre-feet . The water transfers would be accomplished
through an interconnection that LADWP is constructing between its LAA and the State water Project's

A-30 | P a g e
California Aqueduct. This connection will be owned by DWR and designated as an AVEK (Antelope
Valley East Kern) interconnection. The plan states that MWD is involved in the agreement to provide
consent for the transferred water to enter its service territory.
Under potential supplies, the plan states that storm water capture and reuse and groundwater
replenishment could provide 25,000 acre-feet by 2035. LADWP's current water resources strategy does
not include seawater desalination as a water supply.
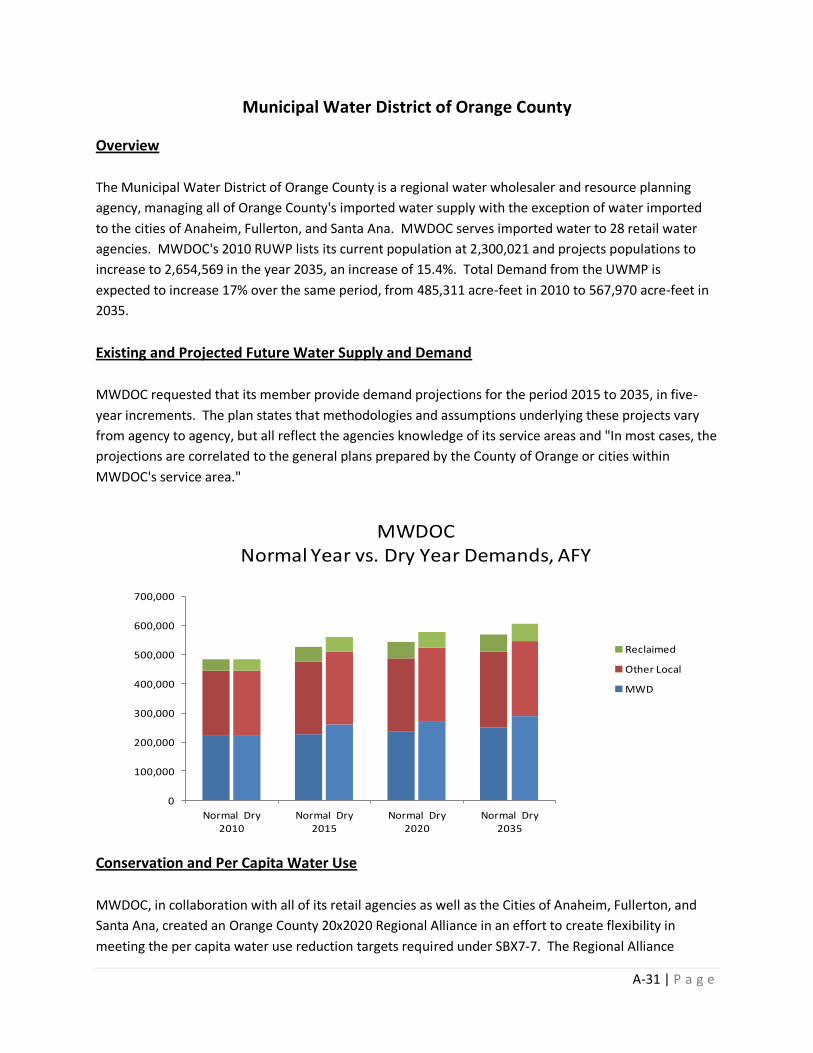
A-31 | P a g e
Municipal Water District of Orange County
Overview
The Municipal Water District of Orange County is a regional water wholesaler and resource planning
agency, managing all of Orange County's imported water supply with the exception of water imported
to the cities of Anaheim, Fullerton, and Santa Ana. MWDOC serves imported water to 28 retail water
agencies. MWDOC's 2010 RUWP lists its current population at 2,300,021 and projects populations to
increase to 2,654,569 in the year 2035, an increase of 15.4%. Total Demand from the UWMP is
expected to increase 17% over the same period, from 485,311 acre-feet in 2010 to 567,970 acre-feet in
2035.
Existing and Projected Future Water Supply and Demand
MWDOC requested that its member provide demand projections for the period 2015 to 2035, in five-
year increments. The plan states that methodologies and assumptions underlying these projects vary
from agency to agency, but all reflect the agencies knowledge of its service areas and "In most cases, the
projections are correlated to the general plans prepared by the County of Orange or cities within
MWDOC's service area."
0
100,000
200,000
300,000
400,000
500,000
600,000
700,000
Normal Dry2010
Normal Dry2015
Normal Dry2020
Normal Dry2035
Reclaimed
Other Local
MWD
MWDOCNormal Year vs. Dry Year Demands, AFY
Conservation and Per Capita Water Use
MWDOC, in collaboration with all of its retail agencies as well as the Cities of Anaheim, Fullerton, and
Santa Ana, created an Orange County 20x2020 Regional Alliance in an effort to create flexibility in
meeting the per capita water use reduction targets required under SBX7-7. The Regional Alliance
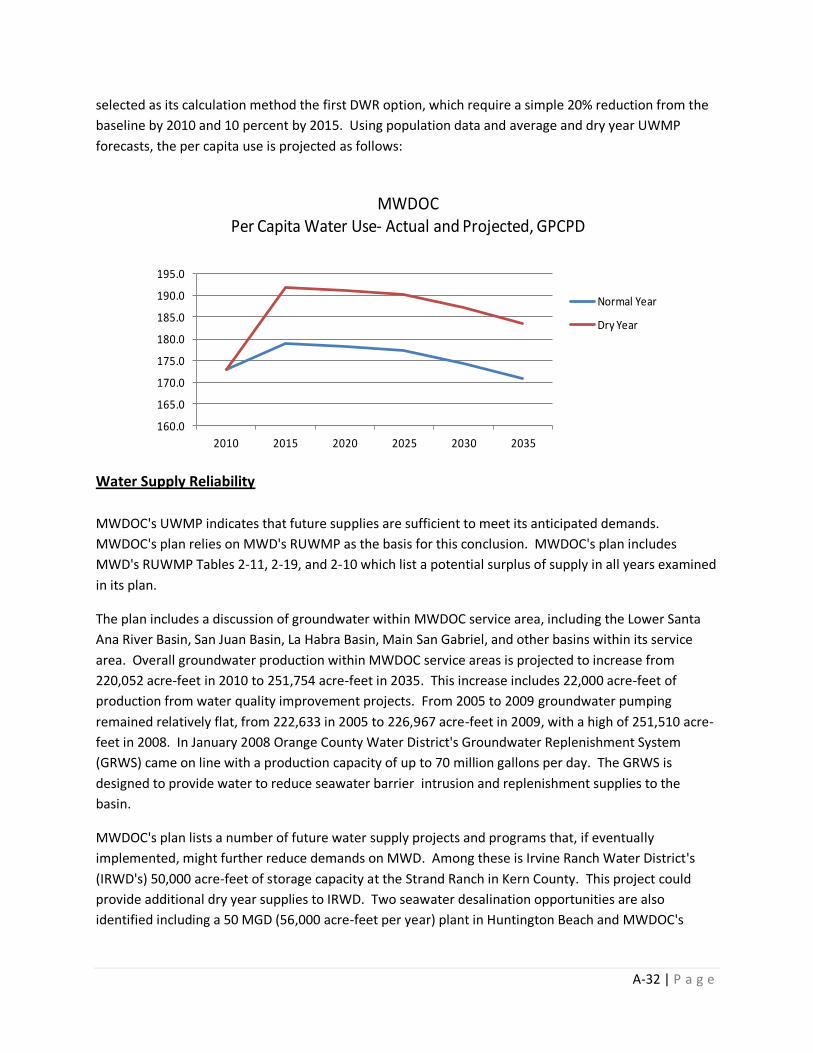
A-32 | P a g e
selected as its calculation method the first DWR option, which require a simple 20% reduction from the
baseline by 2010 and 10 percent by 2015. Using population data and average and dry year UWMP
forecasts, the per capita use is projected as follows:
160.0
165.0
170.0
175.0
180.0
185.0
190.0
195.0
2010 2015 2020 2025 2030 2035
Normal Year
Dry Year
MWDOCPer Capita Water Use- Actual and Projected, GPCPD
Water Supply Reliability
MWDOC's UWMP indicates that future supplies are sufficient to meet its anticipated demands.
MWDOC's plan relies on MWD's RUWMP as the basis for this conclusion. MWDOC's plan includes
MWD's RUWMP Tables 2-11, 2-19, and 2-10 which list a potential surplus of supply in all years examined
in its plan.
The plan includes a discussion of groundwater within MWDOC service area, including the Lower Santa
Ana River Basin, San Juan Basin, La Habra Basin, Main San Gabriel, and other basins within its service
area. Overall groundwater production within MWDOC service areas is projected to increase from
220,052 acre-feet in 2010 to 251,754 acre-feet in 2035. This increase includes 22,000 acre-feet of
production from water quality improvement projects. From 2005 to 2009 groundwater pumping
remained relatively flat, from 222,633 in 2005 to 226,967 acre-feet in 2009, with a high of 251,510 acre-
feet in 2008. In January 2008 Orange County Water District's Groundwater Replenishment System
(GRWS) came on line with a production capacity of up to 70 million gallons per day. The GRWS is
designed to provide water to reduce seawater barrier intrusion and replenishment supplies to the
basin.
MWDOC's plan lists a number of future water supply projects and programs that, if eventually
implemented, might further reduce demands on MWD. Among these is Irvine Ranch Water District's
(IRWD's) 50,000 acre-feet of storage capacity at the Strand Ranch in Kern County. This project could
provide additional dry year supplies to IRWD. Two seawater desalination opportunities are also
identified including a 50 MGD (56,000 acre-feet per year) plant in Huntington Beach and MWDOC's

A-33 | P a g e
proposal for a 15 MGD plant (16,000 acre-feet per year) in conjunction with Laguna Beach County Water
District.

A-34 | P a g e
City of Pasadena
Overview
The City of Pasadena's Water and Power (PWP) service area is located within the northwest portion of
the San Gabriel Valley in Los Angeles County, encompassing approximately 23 square miles, and is
slightly larger than the legal boundary of the City of Pasadena. PWP's UWMP lists its current population
at 175,957 and projects population to increase to 199,562 in the year 2035, an increase of 13.7% overall.
Total normal year demand from the UWMP is expected to decrease 5.1 % over the same period, from
38,460 acre-feet in 2010 to 36,510 acre-feet in 2035. Because local supplies are projected to increase
slightly (recycled water) during this period, the projected decrease in use would be from MWD supplies.
PWP's current water supplies include local groundwater from the Raymond Basin, surface water
diversions, and purchases of imported water. Declining groundwater level have reduced PWP's
pumping in the basin, and surface water is now used to augment these supplies.
Existing and Projected Future Water Supply and Demand
Projections of water demand for Pasadena were developed as part of a recently completed Water
Integrated Resources Plan based on historical water use factors, projected demographics, and passive
water conservation. Demands were projected to increase from 2010 to 2035 without future active
water conservation. With this conservation, the UWMP demands are as follows:
0
5,000
10,000
15,000
20,000
25,000
30,000
35,000
40,000
45,000
Normal Dry2010
Normal Dry2015
Normal Dry2020
Normal Dry2035
Reclaimed
Other Local
MWD
City of PasadenaNormal Year vs. Dry Year Demands, AFY
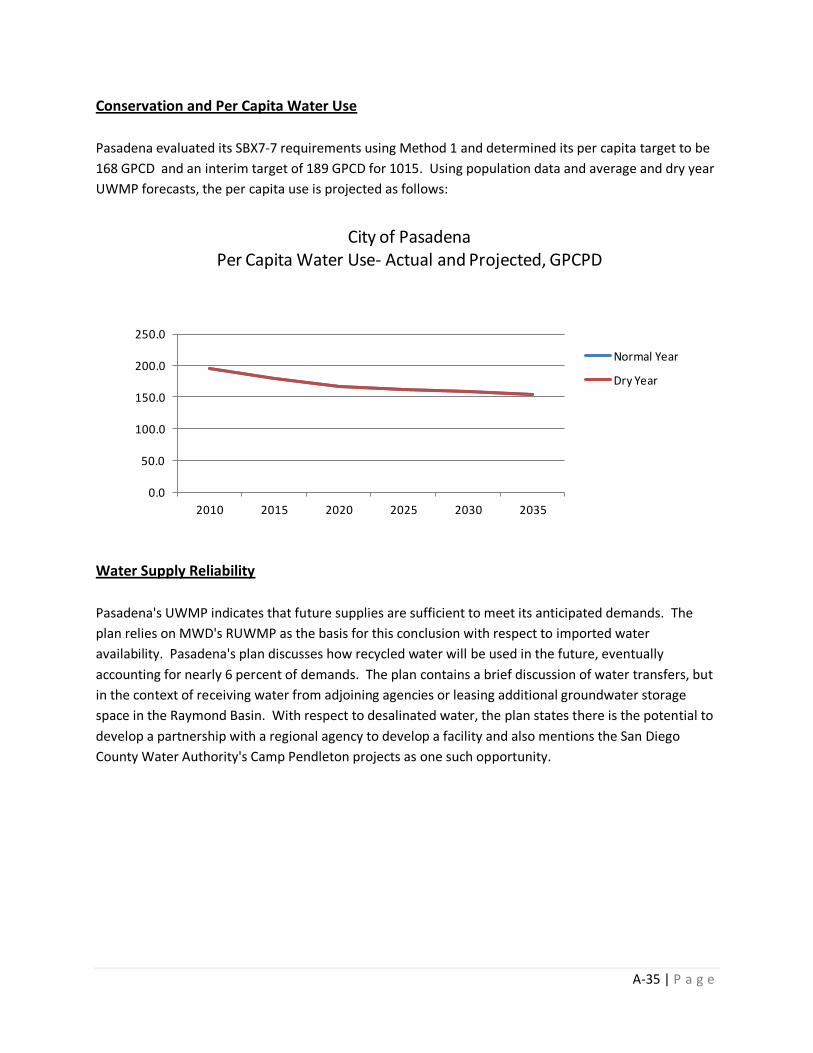
A-35 | P a g e
Conservation and Per Capita Water Use
Pasadena evaluated its SBX7-7 requirements using Method 1 and determined its per capita target to be
168 GPCD and an interim target of 189 GPCD for 1015. Using population data and average and dry year
UWMP forecasts, the per capita use is projected as follows:
0.0
50.0
100.0
150.0
200.0
250.0
2010 2015 2020 2025 2030 2035
Normal Year
Dry Year
City of PasadenaPer Capita Water Use- Actual and Projected, GPCPD
Water Supply Reliability
Pasadena's UWMP indicates that future supplies are sufficient to meet its anticipated demands. The
plan relies on MWD's RUWMP as the basis for this conclusion with respect to imported water
availability. Pasadena's plan discusses how recycled water will be used in the future, eventually
accounting for nearly 6 percent of demands. The plan contains a brief discussion of water transfers, but
in the context of receiving water from adjoining agencies or leasing additional groundwater storage
space in the Raymond Basin. With respect to desalinated water, the plan states there is the potential to
develop a partnership with a regional agency to develop a facility and also mentions the San Diego
County Water Authority's Camp Pendleton projects as one such opportunity.

A-36 | P a g e
San Diego County Water Authority
Overview
The San Diego County Water Authority is a regional water wholesaler and resource planning agency,
that provides imported water to the western part of San Diego County. The remaining portion of the
county is not within SDCWA's service area, nor does it receive imported water. SDCWA provides water
to its 24 member agencies, supplying between 75 to 95 percent of the region's needs depending on
weather conditions and yield from surface, recycled, and groundwater projects.
SDCWA's 2010 RUWP lists its current population at 3.2 million and projects populations to increase to
3,906,718 in the year 2035, an increase of 22.1 percent. Total Demand from the UWMP is expected to
increase 39% over the same period, from 566,443 acre-feet in 2010 to 785,685 acre-feet in 2035. Like
many MWD agencies, 2010 demands were well below average due to drought and water use
restrictions. Average demands for the period 2005-2010 was 648,030 acre-feet. Using this figure,
increased demand to 2035 is expected to be about 20 percent.
Existing and Projected Future Water Supply and Demand
SDCWA service area demands include both agricultural and municipal uses. According to its UWMP,
Municipal and Industrial (M&I) uses currently constitute about 80 to 85 percent of regional water
consumption, with the remaining 15 to 20 percent being agricultural demands. In the future agricultural
demand is expected to be less, and increase demands are anticipated to be in the M&I category.
M&I demands are forecast using an econometric water demand model call CWA-MAIN that has been
calibrated for the region and uses various inputs regarding housing population and other significant
factors provided by the San Diego Association of Governments (SANDAG). Agricultural demands are
forecast using data from past trends, forecasted future efficiencies and crop and land use patterns.
SDCWA incorporated anticipated climate change impacts into its forecast, which tend to suggest that
the region have slight increases in demand over base conditions through 2035, but could be greater
beyond this planning horizon.

A-37 | P a g e
0
100,000
200,000
300,000
400,000
500,000
600,000
700,000
800,000
900,000
Normal Dry2010
Normal Dry2015
Normal Dry2020
Normal Dry2035
Reclaimed
Other Local
MWD
SDCWANormal Year vs. Dry Year Water Use, AFY
Conservation and Per Capita Water Use
In its UWMP, SDCWA used urban water use targets that were calculated by each of its member agencies
to determine the regional demand reductions required by SBX7-7 for inclusion in the plan. This was
done in order to "clearly reflect retail compliance" with SBX7-7. For agencies that had already reach
compliance, additional water use reductions were set to zero and the remaining use reductions were
subtracted from the baseline derived from the CWA-MAIN model. No additional reductions are
required after 2020, and SDCWA's 2025 to 2035 GPCD targets were set at agencies' 2020 GPCD targets.
Using population data and average and dry year UWMP forecasts, the per capita use is projected as
follows:
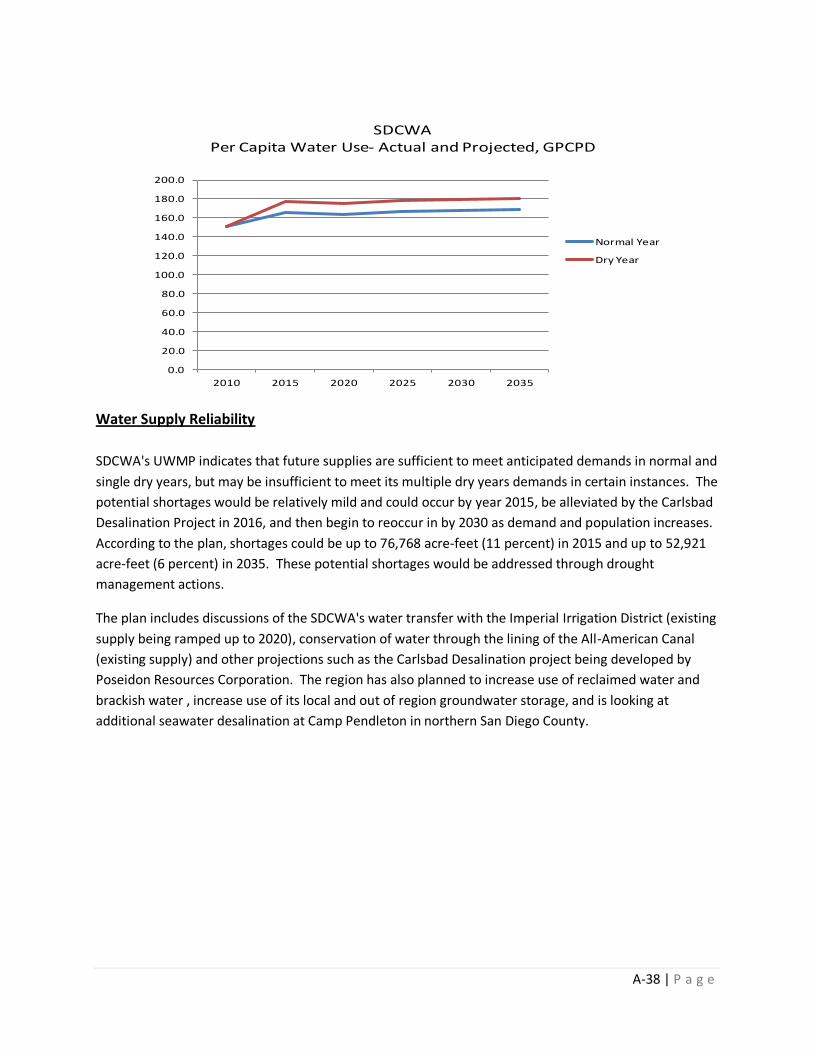
A-38 | P a g e
0.0
20.0
40.0
60.0
80.0
100.0
120.0
140.0
160.0
180.0
200.0
2010 2015 2020 2025 2030 2035
Normal Year
Dry Year
SDCWAPer Capita Water Use- Actual and Projected, GPCPD
Water Supply Reliability
SDCWA's UWMP indicates that future supplies are sufficient to meet anticipated demands in normal and
single dry years, but may be insufficient to meet its multiple dry years demands in certain instances. The
potential shortages would be relatively mild and could occur by year 2015, be alleviated by the Carlsbad
Desalination Project in 2016, and then begin to reoccur in by 2030 as demand and population increases.
According to the plan, shortages could be up to 76,768 acre-feet (11 percent) in 2015 and up to 52,921
acre-feet (6 percent) in 2035. These potential shortages would be addressed through drought
management actions.
The plan includes discussions of the SDCWA's water transfer with the Imperial Irrigation District (existing
supply being ramped up to 2020), conservation of water through the lining of the All-American Canal
(existing supply) and other projections such as the Carlsbad Desalination project being developed by
Poseidon Resources Corporation. The region has also planned to increase use of reclaimed water and
brackish water , increase use of its local and out of region groundwater storage, and is looking at
additional seawater desalination at Camp Pendleton in northern San Diego County.

A-39 | P a g e
City of San Fernando
Overview
The City of San Fernando is located in the San Fernando Valley northwest of downtown Los Angeles and
is bounded on all sides by the City of Los Angeles. The City's total areas is 2.42 square miles and overlies
both the San Fernando and Sylmar groundwater basins.
San Fernando's 2010 RUWP lists its current population at 23,650 and projects populations to increase to
25,478 in the year 2035, an increase of 7.7%. Total normal year demand from the UWMP is expected to
increase 14.3% over the same period, although this increase represents only 476 acre-feet because of
the size of the City and its population. In 2010 San Fernando took no water from MWD, and projects
only to use 476 acre-feet in 2035. San Fernando qualifies its projections of supply and demand, stating
"[the tables for normal, dry year, and multiple dry years are] not intended to be an estimate of the City's
actual groundwater production. The City may pump amounts different from its adjudicated right of
3,405 AFY based on leases to and from other agencies. The City may also overdraft up to 10% of this
amount." The plan also states that actual demands are likely to be below the SBX7-7 limit of 136 GPCD
in accordance with water efficiency trends in the City.
Existing and Projected Future Water Supply and Demand
San Fernando calculated its future demands based upon population forecast times 136 GPCD, which the
UWMP states as less than its SBX7-7 target. Subject to the qualification shown above, the UWMP
demands are as follows:
0
500
1,000
1,500
2,000
2,500
3,000
3,500
4,000
4,500
Normal Dry2010
Normal Dry2015
Normal Dry2020
Normal Dry2035
Reclaimed
Other Local
MWD
City of San FernandoNormal Year vs. Dry Year Demands, AFY

A-40 | P a g e
Conservation and Per Capita Water Use
San Fernando evaluated its required SBX7-7 requirements using both Method 1 and Method 3 and
determined its per capita target to be 141.5 GPCD. For planning water demand, it used 136 GPCD, lower
that what is required. Using population data and average and dry year UWMP forecasts, the per capita
use is projected as follows:
120.0
125.0
130.0
135.0
140.0
145.0
150.0
2010 2015 2020 2025 2030 2035
Normal Year
Dry Year
City of San FernandoPer Capita Water Use, Actual and Projected, GPCPD
Water Supply Reliability
San Fernando's UWMP indicates that future supplies are sufficient to meet its anticipated demands, but
relies heavily on MWD's RUWMP as the basis for this conclusion. San Fernando's plan assumes that
since MWD's plan lists a potential surplus of supply in normal, single dry year, and multiple dry years
that the same percentage of potential surplus would be available to it for each of the years evaluated.
San Fernando's UWMP lists supplies exceeding demands in all cased evaluated. In any given year, the
plan lists its local supplies as constant through a normal, single dry, and multiple dry year. MWD
supplies, on the other hand vary during these various supply conditions, but still exceed the UWMP
estimated demand.
San Fernando's UWMP discusses its plan to construct a denitrification plant at one of its wells. This may
allow the City to increase slightly its groundwater pumping, but its purpose appears mainly intended to
improve water quality and operational flexibility.

A-41 | P a g e
City of San Marino
Overview
The City of San Marino is located in the San Gabriel Valley, approximately 10 miles northeast of
downtown Los Angeles. The City's total area is 3.77 square miles, with a population (2010) of 13,147.
San Marino is served water by California American Water Company, which prepared its 2010 Urban
Water Management Plan. The plan includes the City of San Marino as part of California American's San
Marino service area, which also encompasses customers in the City of Alhambra, Arcadia, El Monte,
Pasadena, Rosemead, San Gabriel, East Pasadena, and East San Gabriel. California American serves a
population of approximately 55,558 people with its San Marino service area.
The City of San Marino's population has remained steady over the past 10 years, growing only slightly
from 12,945 to its current population. It is not expected that significant increases will occur in the
future. With California American's San Marino service areas, population is expected to increase 11.8
percent, from 55,558 to 62,103 in 2030. Water deliveries by California American is expected to increase
from 10,064 acre-feet in 2010 to 11,901 acre-feet in 2030, an increase of 18.2 percent.
Because the California American UWMP includes areas served in addition to the City of San Marino, and
includes areas service by other MWD member agencies, the future water demand for the purposes of
this report must be assumed. This assumption should not impact the accuracy of this report because of
the fact that San Marino's population is relatively small and not expected to grow. For the purpose of
this report, future demand on MWD is estimated to be the average of the past five years, as follows:
MWD Deliveries (AF) to the City of San Marino
2006 2007 2008 2009 2010 Average
1,208.6 1,572.9 895.1 1,009.7 583.8 1,054.0
Assumed MWD Demand, Average, Dry, and Multiple Dry Years
2015 2020 2025 2030 2035
1,054.0 1,054.0 1,054.0 1,054.0 1,054.0

A-42 | P a g e
0
200
400
600
800
1,000
1,200
Normal Dry2010
Normal Dry2015
Normal Dry2020
Normal Dry2035
Reclaimed
Other Local
MWD
City of San MarinoNormal Year vs. Dry Year Demands, AFY
Water Supply Reliability
California American's UWMP indicates that future supplies are sufficient to meet its anticipated
demands but relies, in part, on MWD's RUWMP as the basis for this conclusion. The plan contains
MWD's Tables 2-9, 10, and 11 that show MWD has surplus supplies in each scenario condition and year
that it evaluated.
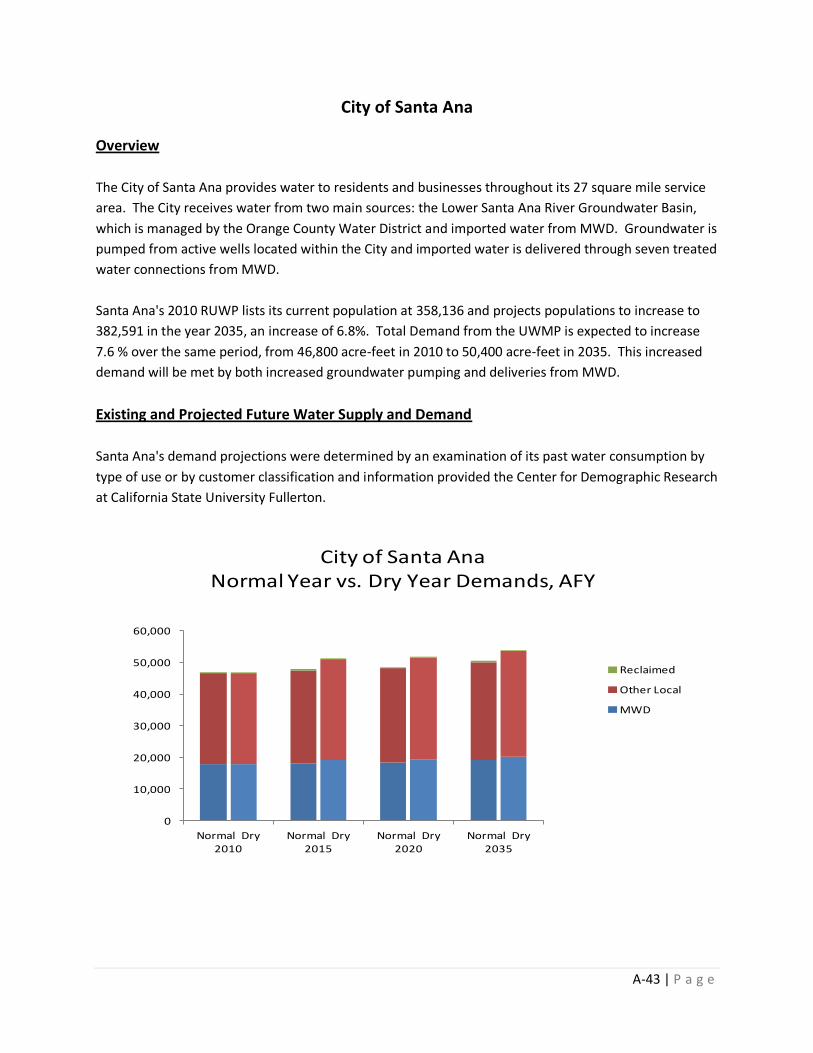
A-43 | P a g e
City of Santa Ana
Overview
The City of Santa Ana provides water to residents and businesses throughout its 27 square mile service
area. The City receives water from two main sources: the Lower Santa Ana River Groundwater Basin,
which is managed by the Orange County Water District and imported water from MWD. Groundwater is
pumped from active wells located within the City and imported water is delivered through seven treated
water connections from MWD.
Santa Ana's 2010 RUWP lists its current population at 358,136 and projects populations to increase to
382,591 in the year 2035, an increase of 6.8%. Total Demand from the UWMP is expected to increase
7.6 % over the same period, from 46,800 acre-feet in 2010 to 50,400 acre-feet in 2035. This increased
demand will be met by both increased groundwater pumping and deliveries from MWD.
Existing and Projected Future Water Supply and Demand
Santa Ana's demand projections were determined by an examination of its past water consumption by
type of use or by customer classification and information provided the Center for Demographic Research
at California State University Fullerton.
0
10,000
20,000
30,000
40,000
50,000
60,000
Normal Dry2010
Normal Dry2015
Normal Dry2020
Normal Dry2035
Reclaimed
Other Local
MWD
City of Santa AnaNormal Year vs. Dry Year Demands, AFY

A-44 | P a g e
Conservation and Per Capita Water Use
Santa Ana is a member of an Orange County 20x2020 Regional Alliance, which is an effort to create
flexibility in meeting the per capita water use reduction targets required under SBX7-7. Most members
of the Regional Alliance selected as its calculation method the first DWR option, which require a simple
20% reduction from the baseline by 2010 and 10 percent by 2015. With the assistance of MWDOC, the
City chose option 3, which is to achieve 95% of the applicable state hydrologic region target. The City's
targets for 2015 and 2020 are 118.5 and 108.9 GPCD, respectively. Using population data and average
and dry year UWMP forecasts, the per capita use is projected as follows:
110.0
112.0
114.0
116.0
118.0
120.0
122.0
124.0
126.0
128.0
2010 2015 2020 2025 2030 2035
Normal Year
Dry Year
City of Santa AnaPer Capita Water Use- Actual and Projected, GPCPD
Water Supply Reliability
Santa Ana's UWMP indicates that future supplies are sufficient to meet its anticipated demands.
Anaheim's plan relies on MWD's RUWMP as the basis for this conclusion and includes MWD's RUWMP
Tables 2-11, 2-19, and 2-10 which list a potential surplus of supply in all years examined in its plan.
The plan includes a discussion of groundwater and its management within the basin. It assumes the
Basin Pumping Percentage will remain at 62% for the planning horizon. This percentage limits the
amount of water the City can pump to a percentage of its total use. Use of direct recycled water within
the City is expected to remain constant over the planning period, at 300 acre-feet per year. The plan
states that the City supports OCWD's effort to increase recycled water use though its recharge of the
groundwater basins. The plan lists potential desalination projects within Orange County, but does not
include these projects in its projections.

A-45 | P a g e
City of Santa Monica
Overview
The City of Santa Monica's service area is bordered by the Pacific ocean on the west, and the City of Los
Angeles on the north, east and south. Santa Monica's 2010 RUWP lists its current population at 91,000
and projects virtually no growth, with a population of 92,124 in the year 2035. Total normal year
demand reported in UWMP is expected to increase slightly, from 13,864 acre-feet in 2010 to 14,509
acre-feet in 2035. The majority of this demand increase is in recycled water. At the same time, MWD
demand from Santa Monica is forecast to be zero, beginning in 2020 and throughout the remainder of
the planning period. Increased groundwater production from the Santa Monica Basin accounts for this
reduction in MWD demand. Santa Monica has a recycled dry weather urban runoff program that allow
it to help eliminate contamination of Santa Monica Bay and capture and treat runoff for reuse in
landscape irrigation and indoor plumbing.
Existing and Projected Future Water Supply and Demand
Santa Monica calculated its future demands based upon the population forecast times 140.6 GPCD.
Subject to the qualification shown above, the UWMP demands are as follows:
0
2,000
4,000
6,000
8,000
10,000
12,000
14,000
16,000
Normal Dry2010
Normal Dry2015
Normal Dry2020
Normal Dry2035
Reclaimed
Other Local
MWD
City of Santa MonicaNormal Year vs. Dry Year Demands, AFY

A-46 | P a g e
Conservation and Per Capita Water Use
Santa Monica evaluated its required SBX7-7 requirements using both Method 1 and Method 3 and
determined its per capita target to be 140.6 GPCD and used this figure for planning water demand.
Using population data and average and dry year UWMP forecasts, the per capita use is projected as
follows:
105.0
110.0
115.0
120.0
125.0
130.0
135.0
140.0
2010 2015 2020 2025 2030 2035
Normal Year
Dry Year
CIty of Santa MonicaPer Capita Water Use- Actual and Projected, GPCPD
Water Supply Reliability
Santa Monica's UWMP indicates that future supplies are sufficient to meet its anticipated demands, but
relies heavily on MWD's RUWMP as the basis for this conclusion. Santa Monica assumes that since
MWD's plan lists a potential surplus of supply in normal, single dry year, and multiple dry years that the
same percentage of potential surplus would be available to Santa Monica for each of the years
evaluated.
Santa Monica's UWMP discusses the potential to expand recycled water use beyond what is contained
in the plan, but does not quantify the additional water quantity that may be available from such
expansions. Because Santa Monica already plans to eliminate normal and dry year MWD deliveries,
additional expansion would have no impact on MWD. The UWMP also states that graywater use could
increase, and that storm water capture and seawater desalination are not being considered for Santa
Monica.

A-47 | P a g e
Three Valleys MWD
Overview
The Three Valleys MWD is a wholesale water provider to cities and water districts within the Pomona
Valley, Walnut Valley, and eastern portion of the San Gabriel Valley in Los Angeles County. The district
encompasses approximately 133.3 square miles and a current population of 573,799. The UWMP
projects population to increase to 712,264 in the year 2035, an increase of 24.1% overall. Total normal
year demand from the UWMP is expected to increase 20.8% over the same period, from 127,621 acre-
feet in 2010 to 154,144 acre-feet in 2035. The projected increase of over 26,000 acre-feet is expected to
come mainly from increased MWD purchases (over 21,000 acre-feet) and increased recycled water
usage (5,000 acre-feet), with local groundwater pumping remaining nearly constant.
Three Valleys members current water supplies include local groundwater from the Chino, San Gabriel,
Puente, Six Basins, and Spadra groundwater basins. The region also receives captured surface water
from San Gabriel, San Dimas, and San Antonio canyon watersheds that provide water through Covina
Irrigating Company, Golden State Water Company, and the City of Pomona. Typically, surface water
provides about 5 to 8% of the total water demand within the TVMWD service area.
Existing and Projected Future Water Supply and Demand
According to its UWMP, projections of future water demand for TVMWD were developed by MWD using
its MWD MAIN Water Use Forecasting model, taking into consideration demographics, hydrology, and
regulatory/environmental restrictions. The plan states that local resources from the TVMWD service
area will be tapped first to provide initial supply to meet overall demand. The balance will be met with
imported supplies through MWD. Future demands from the UWMP are as follows:
0
20,000
40,000
60,000
80,000
100,000
120,000
140,000
160,000
Normal Dry2010
Normal Dry2015
Normal Dry2020
Normal Dry2035
Reclaimed
Other Local
MWD
Three Valleys MWDNormal Year vs. Dry Year Demands, AFY

A-48 | P a g e
Conservation and Per Capita Water Use
TVMWD's UWMP contains a brief description of SBX7-7 requirements, including the following: "On a
regional basis, the baseline water demand is estimated to be 193 gallons per capita per day (GPCD). A 20
percent reduction would lessen this to 154 GPCD. Based on population projections for 2020, this
reduction translates to approximately 27,500 AF of projects and programs to lessen local dependence
on potable supplies. Achieving this will require additional local and regional investments in both
conservation and recycled water. TVMWD will work with its retail member agencies to develop policies
and programs to address individual water reduction targets."
Using population data and average and dry year UWMP forecasts, the per capita use is projected as
follows:
165.0
170.0
175.0
180.0
185.0
190.0
2010 2015 2020 2025 2030 2035
Normal Year
Dry Year
Three Valleys MWDPer Capita Water Use- Actual and Projected, GPCPD
Water Supply Reliability
TVMWD's plan indicates that it relies "primarily on the availability of MWD supplies to gauge reliability."
The plan refers to MWD's RUWMP: "wherein MWD explains the measures it has taken to try and guard
against shortages in imported supplies coming from the two primary sources [SWP and Colorado River]."
The plan also refers to MWD's groundwater banking/storage agreements, surface water storage, and
conservation programs. The plan also discusses groundwater and conjunctive use programs within its
service areas, such as the Chino Basin Dry-Year Yield Program and TVMWD's cyclic storage account in
the Main San Gabriel Basin.
The plan states that there are several "avenues" that TVMWD and its member agencies can take to
improved long-term water supply reliability including conjunctive use, cyclic storage, groundwater
recover, and additional resource development. Specific projects are listed that could, cumulatively,
provide an annual 28,000 acre-feet of additional yield into the TVMWD service area.
A-49 | P a g e
City of Torrance
Overview
The City of Torrance's Torrance Municipal Water (TMW) service area is approximately 16.2 square miles
and comprises about 78 percent of the land within the City limits. California Water Service provides
water service to the remaining portion of the City.
Torrance's 2010 UWMP lists its current population within TMW at 113,500 and projects the population
to increase to 116,610 in the year 2035, an increase of 2.7% overall. Total normal year demand from the
UWMP is expected to decrease 2.7% over the same period, from 25,203 acre-feet in 2010 to 24,522
acre-feet in 2035. At the same time, MWD demand within TMW is shown in the UWMP to decrease
from 16,471 acre-feet to 9,332 acre-feet. The decrease in MWD supply listed in the UWMP is a result of
increased groundwater, brackish water and recycled water use. Torrance qualifies its projections of
supply and demand, stating "[the tables for normal, dry year, and multiple dry years are] not intended to
be an estimate of the City's actual supply. City may pump amounts different from its adjudicated right
of 5,640 AFY based on leases & may expand its Desalter Facility. Additionally, imported supplies may or
may not be reduced. [These tables are] also not intended to be a projection of the City's actual demand.
Demand of 133 GPCD is a conservative estimate based on SDx7-7 limits. Actual demand is likely to be
below 133 GPCD with water efficiency trends in the City."
TMW pumps its groundwater from the West Coast Basin and uses desalted groundwater produced by
the Water Replenishment District's Robert W. Goldsworthy Desalter. It also purchases reclaimed water
from West Basin MWD.
Existing and Projected Future Water Supply and Demand
Torrance calculated its future demands based on the population forecast times 133 GPCD, which the
UWMP states is less that its SBX7-7 target. Subject to the qualification shown above, the UWMP
demands are as follows:
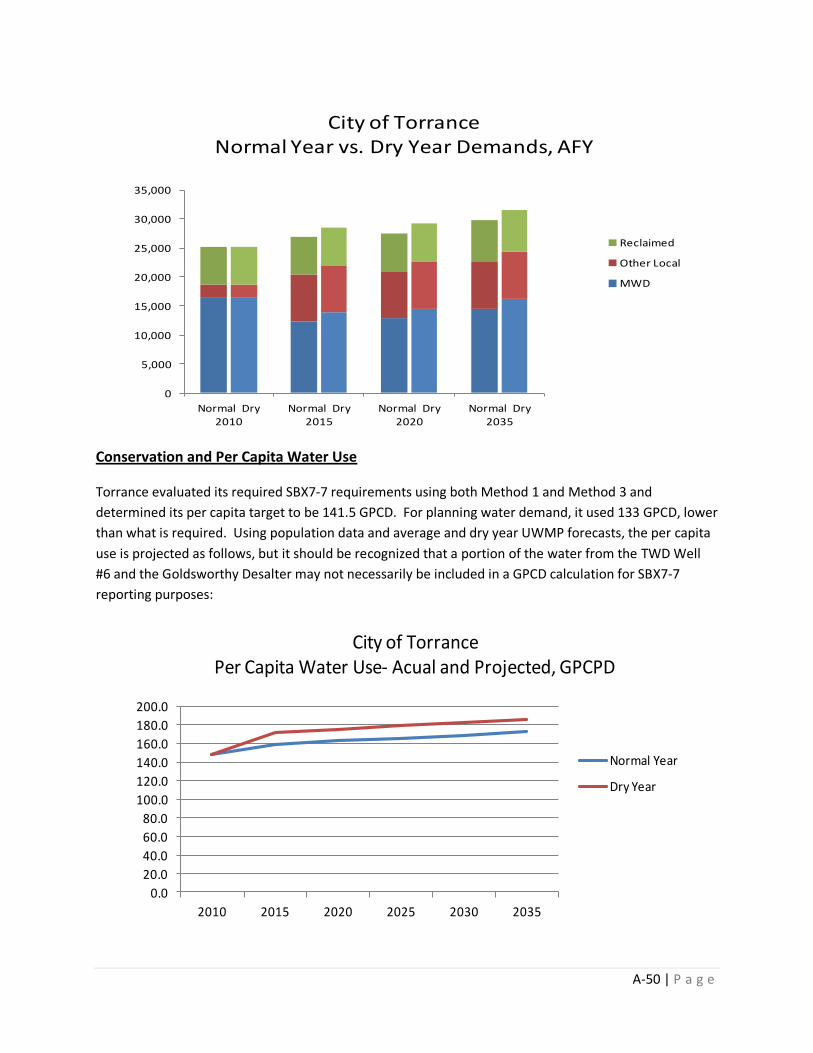
A-50 | P a g e
0
5,000
10,000
15,000
20,000
25,000
30,000
35,000
Normal Dry2010
Normal Dry2015
Normal Dry2020
Normal Dry2035
Reclaimed
Other Local
MWD
City of TorranceNormal Year vs. Dry Year Demands, AFY
Conservation and Per Capita Water Use
Torrance evaluated its required SBX7-7 requirements using both Method 1 and Method 3 and
determined its per capita target to be 141.5 GPCD. For planning water demand, it used 133 GPCD, lower
than what is required. Using population data and average and dry year UWMP forecasts, the per capita
use is projected as follows, but it should be recognized that a portion of the water from the TWD Well
#6 and the Goldsworthy Desalter may not necessarily be included in a GPCD calculation for SBX7-7
reporting purposes:
0.0
20.0
40.0
60.0
80.0
100.0
120.0
140.0
160.0
180.0
200.0
2010 2015 2020 2025 2030 2035
Normal Year
Dry Year
City of TorrancePer Capita Water Use- Acual and Projected, GPCPD
A-51 | P a g e
Water Supply Reliability
Torrance's UWMP indicates that future supplies are sufficient to meet its anticipated demands, but
relies on MWD's RUWMP as the basis for this conclusion. Torrance's plan assumes that since MWD's
plan lists a potential surplus of supply in normal, single dry year, and multiple dry years that the same
percentage of potential surplus would be available to TMW for each of the years evaluated.
Torrance's UWMP lists supplies exceeding demands in all cases evaluated. In any given year, the plan
lists its local supplies as constant through a normal, single dry year, and multiple dry years. MWD
supplies, on the other hand, vary during these various supply conditions, but still exceed the UWMP
estimated demand.
Torrance's UWMP discusses the potential to expand recycled water use and the Robert W. Goldsworthy
Desalter. The plan does not quantify the additional water that may be available for such expansions.
The plan also states that gray water use could increase, and that storm water capture and seawater
desalination are not viable options for the TMW.
A-52 | P a g e
Upper San Gabriel Valley MWD
Overview
Upper San Gabriel Valley MWD (Upper District) is a wholesale water agency that supplies imported
water from MWD and recycled water to its sub-agencies. Upper District is located within the San
Gabriel Valley in Los Angeles County and overlies the "Main Basin." It service area is about 144 square
miles and includes all or portions of 18 separate cities. The service area is largely urbanized consisting
mainly of residential, light industrial, and commercial uses.
Upper District's UWMP lists its current population at 903,000 and projects population to increase to
1,025,000 in the year 2035, an increase of 13.5% overall. Total normal year demand from the UWMP is
expected to increase only 1.6% over the same period, from 163,101 acre-feet in 2010 to 165,747 acre-
feet in 2035. This demand increase is expected to be met by increasing reclaimed water use. Imported
water constitutes a relatively small percentage of usage within the Upper District service area,
accounting for 22,633 acre-feet in 2010. Under "normal" conditions Upper District expects to use 3,000
acre-feet of MWD firm supplies and 16,000 to 25,000 acre-feet of non-firm MWD supplies. Upper
District's UWMP assumes that non-firm supplies would be available in both single dry and multiple dry
year conditions, however for the purposes of this analysis single dry and multiple dry year MWD
demands were treated as a firm demand, based on what occurred in 2010 when non-firm supplies were
not available.
Existing and Projected Future Water Supply and Demand
According to the UWMP, Upper District is required to receive projections of water use from its retail
urban water wholesalers. While not available for its plan, Upper District "reviewed projected values"
based on historical trends and projected population. Upper District provides a relatively small
percentage (14 to 16%) of the water in its service area. UWMP projected future demands are:

A-53 | P a g e
0
20,000
40,000
60,000
80,000
100,000
120,000
140,000
160,000
180,000
Normal Dry2010
Normal Dry2015
Normal Dry2020
Normal Dry2035
Reclaimed
Other Local
MWD
USG Valley MWDNormal Year vs. Dry Year Demands, AFY
Conservation and Per Capita Water Use
Because Upper District is a wholesaler of water it is not required to set future per-capita targets.
Presumably this is done individually or collectively by the 18 cities within the district. According to the
plan, Upper District does have the ability to monitor water use within its boundaries. The district keeps
track of local water use on a quarterly basis and imported water usage on a monthly basis. Using
population data and average and dry year UWMP forecasts, the per capita use is projected as follows:
115.0
120.0
125.0
130.0
135.0
140.0
145.0
150.0
155.0
160.0
2010 2015 2020 2025 2030 2035
Normal Year
Dry Year
USG Valley MWDPer Capita Water Use- Actual and Projected, GPCPD

A-54 | P a g e
Water Supply Reliability
Upper District's plan states "Metropolitan's 2010 RUWMP has concluded that the region can provide
reliable water supplies under both the single driest year and the multiple dry year hydrologies for the
next 20 years. The 2010 RUWMP prepared by Metropolitan, which is incorporated by reference, should
be referred to for more details on the reliability of Metropolitan's imported water supplies. With
regards to groundwater from the Main Basin, Upper District plan states "As noted in Chapter 3, the Main
Basin is a well-managed groundwater basin and can ensure long-term reliability of water supply."
Upper District's plan discusses projects and facilities that will increase recycled water production from
6,000 acre-feet in 2010 to 15,000 acre-feet by 2030. Included is Phase IIA- Rosemead extension and
Phase IIB- Industry Project, which will provide recycled water from the Whittier Narrows Water
Reclamation Plant to a golf course, schools, parks, industrial complexes, and other projects.
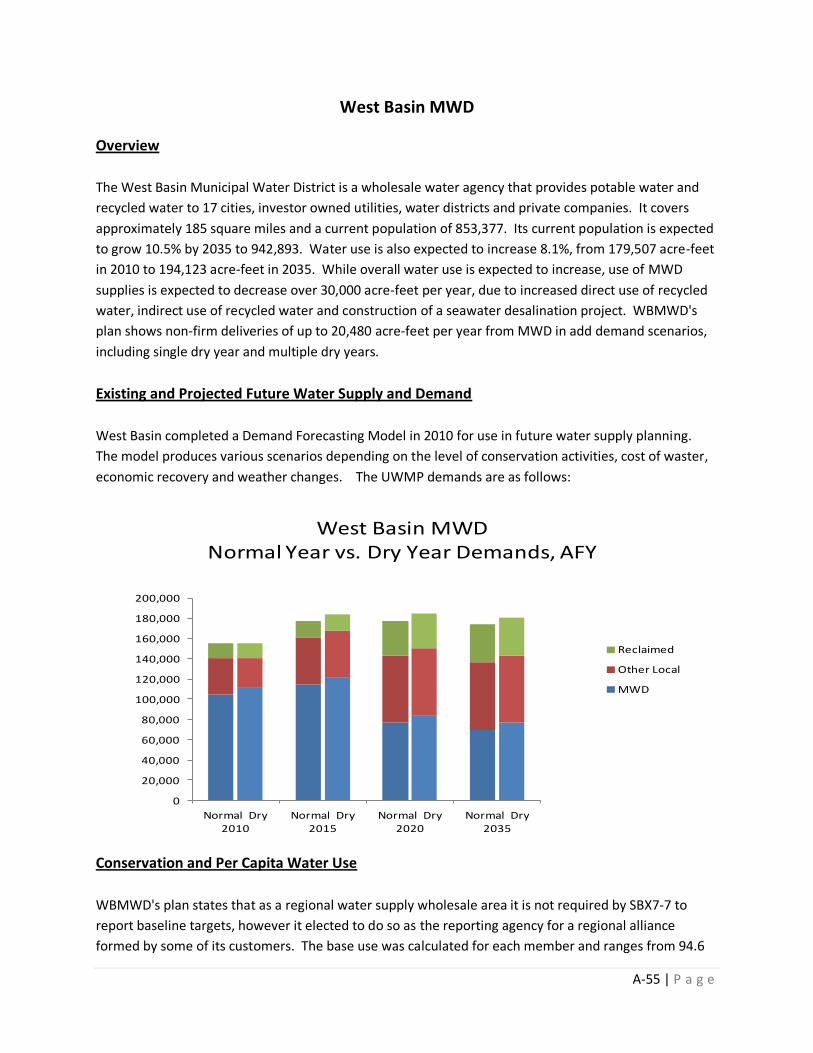
A-55 | P a g e
West Basin MWD
Overview
The West Basin Municipal Water District is a wholesale water agency that provides potable water and
recycled water to 17 cities, investor owned utilities, water districts and private companies. It covers
approximately 185 square miles and a current population of 853,377. Its current population is expected
to grow 10.5% by 2035 to 942,893. Water use is also expected to increase 8.1%, from 179,507 acre-feet
in 2010 to 194,123 acre-feet in 2035. While overall water use is expected to increase, use of MWD
supplies is expected to decrease over 30,000 acre-feet per year, due to increased direct use of recycled
water, indirect use of recycled water and construction of a seawater desalination project. WBMWD's
plan shows non-firm deliveries of up to 20,480 acre-feet per year from MWD in add demand scenarios,
including single dry year and multiple dry years.
Existing and Projected Future Water Supply and Demand
West Basin completed a Demand Forecasting Model in 2010 for use in future water supply planning.
The model produces various scenarios depending on the level of conservation activities, cost of waster,
economic recovery and weather changes. The UWMP demands are as follows:
0
20,000
40,000
60,000
80,000
100,000
120,000
140,000
160,000
180,000
200,000
Normal Dry2010
Normal Dry2015
Normal Dry2020
Normal Dry2035
Reclaimed
Other Local
MWD
West Basin MWDNormal Year vs. Dry Year Demands, AFY
Conservation and Per Capita Water Use
WBMWD's plan states that as a regional water supply wholesale area it is not required by SBX7-7 to
report baseline targets, however it elected to do so as the reporting agency for a regional alliance
formed by some of its customers. The base use was calculated for each member and ranges from 94.6

A-56 | P a g e
GPCD for California Water Service Hawthorne to 319.4 GPCD for Los Angeles County Water Works
District #29. The combined base is 227.7 GPCD. Using method 1 the combined final targets are 194.1
and 160.5 GPCD for 2015 and 2020 respectively. Using population data and average and dry year
UWMP forecasts, the per capita use is projected as follows:
0.0
20.0
40.0
60.0
80.0
100.0
120.0
140.0
160.0
180.0
2010 2015 2020 2025 2030 2035
Normal Year
Dry Year
West Basin MWDPer Capita Water Use- Actual and Projected, GPCPD
Water Supply Reliability
WBMWD's UWMP does not anticipate future shortages in any of the scenarios evaluated. The plan cites
MWD's 2010 RUWMP as being able to meet imported water demands and "as a result, there will be no
anticipated shortages under any dry year scenarios. It further states "Any shortfall in supplies will be
met through imported water so long as MWD manages its supply and demand balance through its
Water Surplus and Drought Management Plans.
The plan describes WBMWD's intent to increase recycled water use through both direct and indirect
means. Recycled water use (direct and indirect) is expected to increase from 21,888 acre-feet per year
in 2010 to 57,862 acre-feet in 2035. At the same time WBMWD anticipates seawater desalination to
provide 21,500 acre-feet per year. While the seawater desalination plant is included in its UWMP, the
plan states that the Ocean Water Desalination Demonstration Facility will test its viability. WBMWD is
current preparing a Desalination Program Master Plan.

A-57 | P a g e
Western MWD
Overview
The Western Municipal Water District provides both wholesale and retail water service to western
Riverside County. Western serves imported and local supplies on a wholesale basis to nine local area
water purveyors, including a portion of the Rancho California Water District. Western also has a retail
service area that it provides with similar water supplies. The general district (wholesale and retail areas
combined) consists of 527 square miles and an estimated population of more than 860,000 people.
Western's retail service area population is currently 85,469 and is expected to grow by 88.4% to 161,016
by 2035. The UWMP does not give estimated population growth figures for the entire service area.
Water use within the retail area is expected to grow from 24,741 acre-feet in 2010 to 46,968 acre feet in
2035, an increase of 89%. However, in 2009 water use in the retail area was roughly 30,000 acre-feet,
so increased usage from 2009 to 2035 is expected to be about 56.6%. 2035 demand projects include
additional conservation that is expected to occur.
Existing and Projected Future Water Supply and Demand
Western developed its Water Demand Forecast (WDF) model to help project future water demands
within the retail and wholesale service area. The WDF is a GIS based application that uses general plan
land use data to project water demands. Using the underlying land use information, the WDF takes user
inputs on unit demands and growth rate assumptions to project demands from the year 2006 to
buildout. The WDF model results were used as the basis of water projections for Western's retail service
area, and was offered to its member agencies during the UWMP public coordination process. However,
a number of agencies preferred to develop their own demand projections and their results were
incorporated into the Western UWMP. The UWMP demands are as follows:
0
20,000
40,000
60,000
80,000
100,000
120,000
140,000
160,000
180,000
200,000
Normal Dry2010
Normal Dry2015
Normal Dry2020
Normal Dry2035
Reclaimed-Dry Yr.
Other Local-Dry Yr.
MWD-Dry Yr.
Reclaimed
Other Local
MWD
Western MWDNormal Year vs. Dry Year Demands, AFY
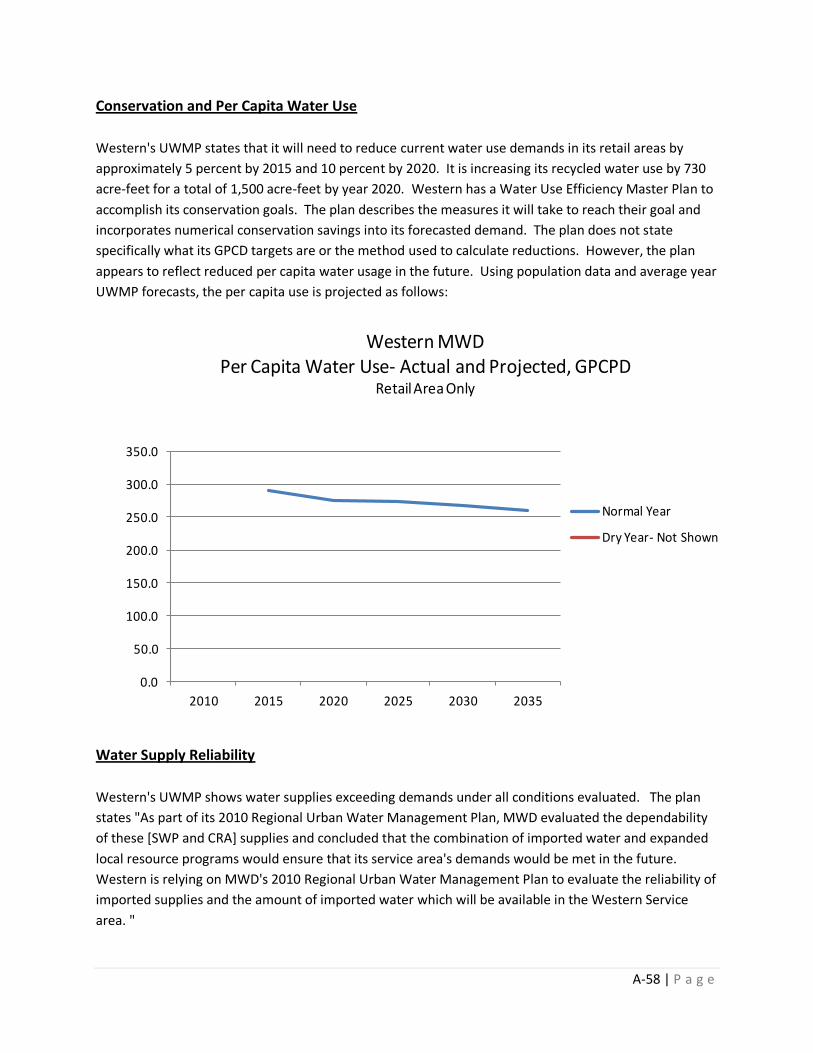
A-58 | P a g e
Conservation and Per Capita Water Use
Western's UWMP states that it will need to reduce current water use demands in its retail areas by
approximately 5 percent by 2015 and 10 percent by 2020. It is increasing its recycled water use by 730
acre-feet for a total of 1,500 acre-feet by year 2020. Western has a Water Use Efficiency Master Plan to
accomplish its conservation goals. The plan describes the measures it will take to reach their goal and
incorporates numerical conservation savings into its forecasted demand. The plan does not state
specifically what its GPCD targets are or the method used to calculate reductions. However, the plan
appears to reflect reduced per capita water usage in the future. Using population data and average year
UWMP forecasts, the per capita use is projected as follows:
0.0
50.0
100.0
150.0
200.0
250.0
300.0
350.0
2010 2015 2020 2025 2030 2035
Normal Year
Dry Year- Not Shown
Western MWDPer Capita Water Use- Actual and Projected, GPCPD
Retail Area Only
Water Supply Reliability
Western's UWMP shows water supplies exceeding demands under all conditions evaluated. The plan
states "As part of its 2010 Regional Urban Water Management Plan, MWD evaluated the dependability
of these [SWP and CRA] supplies and concluded that the combination of imported water and expanded
local resource programs would ensure that its service area's demands would be met in the future.
Western is relying on MWD's 2010 Regional Urban Water Management Plan to evaluate the reliability of
imported supplies and the amount of imported water which will be available in the Western Service
area. "

A-59 | P a g e
Table 3-2 in Western's UWMP shows Current and Planned Imported Water Supplies from MWD. The
plan states "The demands documented in Table 3-2 have been provided to MWD and were included in
MWD's 2010 Regional Urban Water Management Plan." However, the demands shown in Table 3-2 far
exceed Western's Total Forecasted Demands, shown in the UWMP Table 2-15, as follows:
Year 2015 2020 2025 2030 2035
Table 2-15, Total Forecasted Demands on Western's Water Supplies, Acre-Feet
118,640 124,042 134,684 145,164 156,231
Table 3-2, Current and Planned Imported Water Supplies from MWD, Acre-Feet
160,313 174,127 184,131 195,301 208,035
According to the UWMP, the supplies shown in Table 3-2 are expected to be available to Western in
single-dry and multiple dry years. Because of this, the plan shows that supplies far exceed demands in
each evaluated scenario. Using normal year demands from Table 5-1 and available local supplies the
actual demand on MWD is expected to be as follows:
Year 2015 2020 2025 2030 2035
Western UWMP Table 5-1 Normal Demands, Adjusted for Conservation, Acre-feet
118,640 127,879 138,982 149,922 161,450
MWD Demands, Calculated as Normal Demands less Available Local Supplies, Acre-feet
99,970 107,649 118,192 128,012 138,420
Despite the assumption that MWD will have more than sufficient supplies to meet demands, Western is
developing additional reclaimed water supplies, participating in the expansion of the Arlington Desalter
and expanding a groundwater banking program in the San Bernardino Basin Area (SBBA).
Appendix B
Member Agency Data from Urban Water Management Plans
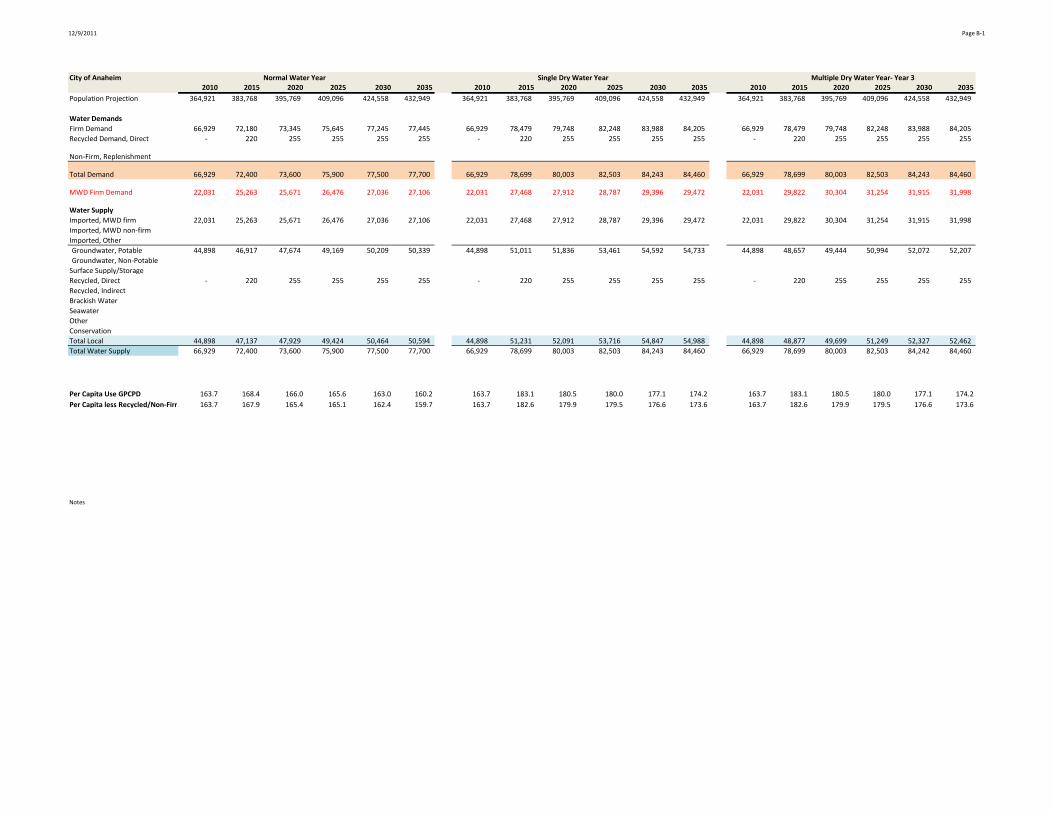
12/9/2011 Page B-1
City of Anaheim Normal Water Year Single Dry Water Year Multiple Dry Water Year- Year 32010 2015 2020 2025 2030 2035 2010 2015 2020 2025 2030 2035 2010 2015 2020 2025 2030 2035
Population Projection 364,921 383,768 395,769 409,096 424,558 432,949 364,921 383,768 395,769 409,096 424,558 432,949 364,921 383,768 395,769 409,096 424,558 432,949
Water Demands
Firm Demand 66,929 72,180 73,345 75,645 77,245 77,445 66,929 78,479 79,748 82,248 83,988 84,205 66,929 78,479 79,748 82,248 83,988 84,205
Recycled Demand, Direct - 220 255 255 255 255 - 220 255 255 255 255 - 220 255 255 255 255
Non-Firm, Replenishment
Total Demand 66,929 72,400 73,600 75,900 77,500 77,700 66,929 78,699 80,003 82,503 84,243 84,460 66,929 78,699 80,003 82,503 84,243 84,460
MWD Firm Demand 22,031 25,263 25,671 26,476 27,036 27,106 22,031 27,468 27,912 28,787 29,396 29,472 22,031 29,822 30,304 31,254 31,915 31,998
Water Supply
Imported, MWD firm 22,031 25,263 25,671 26,476 27,036 27,106 22,031 27,468 27,912 28,787 29,396 29,472 22,031 29,822 30,304 31,254 31,915 31,998
Imported, MWD non-firm
Imported, Other
Groundwater, Potable 44,898 46,917 47,674 49,169 50,209 50,339 44,898 51,011 51,836 53,461 54,592 54,733 44,898 48,657 49,444 50,994 52,072 52,207
Groundwater, Non-Potable
Surface Supply/Storage
Recycled, Direct - 220 255 255 255 255 - 220 255 255 255 255 - 220 255 255 255 255
Recycled, Indirect
Brackish Water
Seawater
Other
Conservation
Total Local 44,898 47,137 47,929 49,424 50,464 50,594 44,898 51,231 52,091 53,716 54,847 54,988 44,898 48,877 49,699 51,249 52,327 52,462
Total Water Supply 66,929 72,400 73,600 75,900 77,500 77,700 66,929 78,699 80,003 82,503 84,243 84,460 66,929 78,699 80,003 82,503 84,242 84,460
Per Capita Use GPCPD 163.7 168.4 166.0 165.6 163.0 160.2 163.7 183.1 180.5 180.0 177.1 174.2 163.7 183.1 180.5 180.0 177.1 174.2
Per Capita less Recycled/Non-Firm 163.7 167.9 165.4 165.1 162.4 159.7 163.7 182.6 179.9 179.5 176.6 173.6 163.7 182.6 179.9 179.5 176.6 173.6
Notes
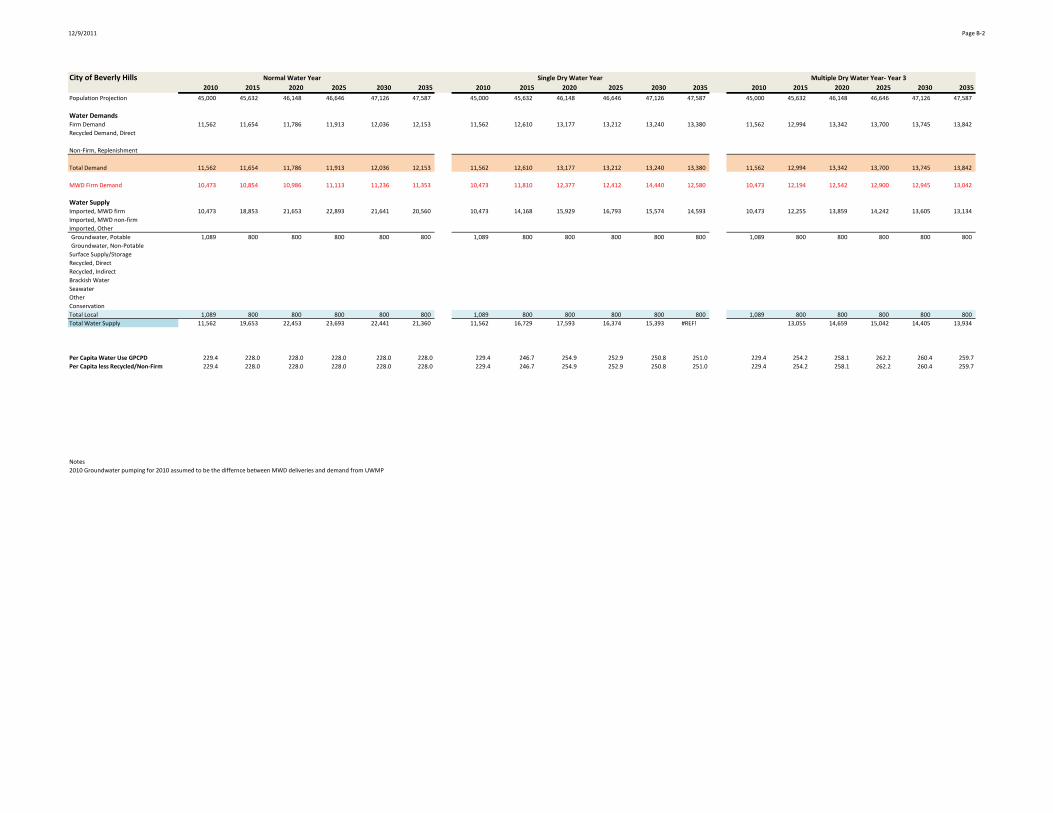
12/9/2011 Page B-2
City of Beverly Hills Normal Water Year Single Dry Water Year Multiple Dry Water Year- Year 3
2010 2015 2020 2025 2030 2035 2010 2015 2020 2025 2030 2035 2010 2015 2020 2025 2030 2035
Population Projection 45,000 45,632 46,148 46,646 47,126 47,587 45,000 45,632 46,148 46,646 47,126 47,587 45,000 45,632 46,148 46,646 47,126 47,587
Water DemandsFirm Demand 11,562 11,654 11,786 11,913 12,036 12,153 11,562 12,610 13,177 13,212 13,240 13,380 11,562 12,994 13,342 13,700 13,745 13,842
Recycled Demand, Direct
Non-Firm, Replenishment
Total Demand 11,562 11,654 11,786 11,913 12,036 12,153 11,562 12,610 13,177 13,212 13,240 13,380 11,562 12,994 13,342 13,700 13,745 13,842
MWD Firm Demand 10,473 10,854 10,986 11,113 11,236 11,353 10,473 11,810 12,377 12,412 14,440 12,580 10,473 12,194 12,542 12,900 12,945 13,042
Water SupplyImported, MWD firm 10,473 18,853 21,653 22,893 21,641 20,560 10,473 14,168 15,929 16,793 15,574 14,593 10,473 12,255 13,859 14,242 13,605 13,134
Imported, MWD non-firm
Imported, Other
Groundwater, Potable 1,089 800 800 800 800 800 1,089 800 800 800 800 800 1,089 800 800 800 800 800
Groundwater, Non-Potable
Surface Supply/Storage
Recycled, Direct
Recycled, Indirect
Brackish Water
Seawater
Other
Conservation
Total Local 1,089 800 800 800 800 800 1,089 800 800 800 800 800 1,089 800 800 800 800 800
Total Water Supply 11,562 19,653 22,453 23,693 22,441 21,360 11,562 16,729 17,593 16,374 15,393 #REF! 13,055 14,659 15,042 14,405 13,934
Per Capita Water Use GPCPD 229.4 228.0 228.0 228.0 228.0 228.0 229.4 246.7 254.9 252.9 250.8 251.0 229.4 254.2 258.1 262.2 260.4 259.7
Per Capita less Recycled/Non-Firm 229.4 228.0 228.0 228.0 228.0 228.0 229.4 246.7 254.9 252.9 250.8 251.0 229.4 254.2 258.1 262.2 260.4 259.7
Notes
2010 Groundwater pumping for 2010 assumed to be the differnce between MWD deliveries and demand from UWMP

12/9/2011 Page B-3
City of Burbank Normal Water Year Single Dry Water Year Multiple Dry Water Year- Year 3
2010 2015 2020 2025 2030 2035 2010 2015 2020 2025 2030 2035 2010 2015 2020 2025 2030 2035
Population Projection 108,469 115,986 120,428 124,732 128,888 132,877 108,469 115,986 120,428 124,732 128,888 132,877 108,469 115,986 120,428 124,732 128,888 132,877
Water DemandsFirm Demand 17,769 17,750 18,481 19,141 19,779 20,391 17,769 17,750 18,481 19,141 19,779 20,391 17,769 16,326 18,989 19,415 20,060 20,685
Recycled Demand, Direct 2,010 3,660 5,160 5,160 5,160 5,160 2,010 3,660 5,160 5,160 5,160 5,160 2,010 3,660 5,160 5,160 5,160 5,160
Non-Firm, Replenishment 2,034 2,100 500 300 200 100 2,034 2,100 500 300 200 100 2,034 2,100 500 300 200 100
Total Demand 21,813 23,510 24,141 24,601 25,139 25,651 21,813 23,510 24,141 24,601 25,139 25,651 21,813 22,086 24,649 24,875 25,420 25,945
MWD Firm Demand 7,852 6,750 7,481 8,141 8,779 9,391 7,852 6,750 7,481 8,141 8,779 9,391 7,852 5,326 7,989 8,415 9,060 9,685
Water SupplyImported, MWD firm 7,852 6,750 7,481 8,141 8,779 9,391 7,852 6,750 7,481 8,141 8,779 9,391 7,852 5,326 7,989 8,415 9,060 9,685
Imported, MWD non-firm 2,034 2,100 500 300 200 100 2,034 2,100 500 300 200 100 2,034 2,100 500 300 200 100
Imported, Other
Groundwater, Potable 9,917 11,000 11,000 11,000 11,000 11,000 9,917 11,000 11,000 11,000 11,000 11,000 9,917 11,000 11,000 11,000 11,000 11,000
Groundwater, Non-Potable
Surface Supply/Storage
Recycled, Direct 2,010 3,660 5,160 5,160 5,160 5,160 2,010 3,660 5,160 5,160 5,160 5,160 2,010 3,660 5,160 5,160 5,160 5,160
Recycled, Indirect
Brackish Water
Seawater
Other
Conservation
Total Local 11,927 14,660 16,160 16,160 16,160 16,160 11,927 14,660 16,160 16,160 16,160 16,160 11,927 14,660 16,160 16,160 16,160 16,160
Total Water Supply 21,813 23,510 24,141 24,601 25,139 25,651 21,813 23,510 24,141 24,601 25,139 25,651 21,813 22,086 24,649 24,875 25,420 25,945
Per Capita Water Use GPCPD 179.5 181.0 179.0 176.1 174.1 172.3 179.5 181.0 179.0 176.1 174.1 172.3 179.5 170.0 182.7 178.0 176.1 174.3
Per Capita less Recycled/Non-Firm 146.2 136.6 137.0 137.0 137.0 137.0 146.2 136.6 137.0 137.0 137.0 137.0 146.2 125.7 140.8 139.0 138.9 139.0
Notes

12/9/2011 Page B-4
Calleguas MWD Normal Water Year Single Dry Water Year Multiple Dry Water Year- Year 3
2010 2015 2020 2025 2030 2035 2010 2015 2020 2025 2030 2035 2010 2015 2020 2025 2030 2035
Population Projection 632,399 659,330 682,651 702,386 719,655 730,788 632,399 659,330 682,651 702,386 719,655 730,788 632,399 659,330 682,651 702,386 719,655 730,788
Water DemandsFirm Demand 164,829 167,809 171,414 173,664 179,073 182,985 169,336 173,685 177,168 180,127 187,205 192,110 169,336 173,349 177,610 181,122 188,145 192,708
Recycled Demand, Direct 6,947 12,009 17,273 18,457 19,091 19,175 7,212 12,275 17,531 18,716 19,351 19,437 7,212 12,305 16,720 17,326 17,411 17,497
Non-Firm, Replenishment
Total Demand 171,776 179,818 188,687 192,121 198,164 202,160 176,548 185,960 194,699 198,843 206,556 211,547 176,548 185,654 194,330 198,448 205,556 210,205
MWD Firm Demand 116,867 113,384 118,283 121,147 124,810 128,105 120,837 118,627 123,188 126,747 131,964 136,237 120,837 125,353 129,841 132,655 138,722 142,631
Water SupplyImported, MWD firm 116,867 113,384 118,283 121,147 124,810 128,105 120,837 118,627 123,188 126,747 131,964 136,237 120,837 125,353 129,841 132,655 138,722 142,631
Imported, MWD non-firm
Imported, Other
Groundwater, Potable 40,094 33,595 31,365 30,345 31,485 31,495 40,084 33,615 31,385 30,365 31,505 31,515 40,084 26,920 25,400 25,660 25,880 25,890
Groundwater, Non-Potable 7,068 7,331 7,734 8,132 8,730 9,328 7,615 7,928 8,530 8,925 9,620 10,215 7,615 7,670 8,270 8,665 9,355 9,950
Surface Supply/Storage
Recycled, Direct 6,947 12,009 17,273 18,457 19,091 19,175 7,212 12,275 17,531 18,716 19,351 19,437 7,212 12,305 16,720 17,326 17,411 17,497
Recycled, Indirect
Brackish Water 800 13,499 14,032 14,040 14,048 14,057 800 13,515 14,065 14,090 14,116 14,143 800 13,406 14,098 14,142 14,188 14,237
Seawater
Other
Conservation
Total Local 54,909 66,434 70,404 70,974 73,354 74,055 55,711 67,333 71,511 72,096 74,592 75,310 55,711 60,301 64,488 65,793 66,834 67,574
Total Water Supply 171,776 179,818 188,687 192,121 198,164 202,160 176,548 185,960 194,699 198,843 206,556 211,547 176,548 185,654 194,329 198,448 205,556 210,205
Per Capita Water Use GPCPD 242.5 243.5 246.8 244.2 245.8 247.0 249.2 251.8 254.6 252.7 256.2 258.4 249.2 251.4 254.1 252.2 255.0 256.8
Per Capita less Recycled/Non-Firm 232.7 227.2 224.2 220.7 222.1 223.5 239.0 235.2 231.7 228.9 232.2 234.7 239.0 234.7 232.3 230.2 233.4 235.4
Notes
1. Population Projections based on MWD/SCAG. Alternative projection is also shown in UWMP.
2. Local supply and imported demands are based upon CMWD projections. MWD projections are higher.
3. CMWD does not separate recycled demand from firm demand. CMUD subtracts local supplies to determine imported demand

12/9/2011 Page B-5
Central Basin MWD Normal Water Year Single Dry Water Year Multiple Dry Water Year- Year 3
2010 2015 2020 2025 2030 2035 2010 2015 2020 2025 2030 2035 2010 2015 2020 2025 2030 2035
Population Projection 1,654,866 1,689,064 1,720,700 1,751,519 1,781,368 1,809,737 1,654,866 1,689,064 1,720,700 1,751,519 1,781,368 1,809,737 1,654,866 1,689,064 1,720,700 1,751,519 1,781,368 1,809,737
Water DemandsFirm Demand 237,761 239,125 241,285 244,470 246,355 248,040 237,761 244,287 247,604 249,940 251,864 253,585 237,761 252,425 247,604 249,940 251,864 253,585
Recycled Demand, Direct 6,632 6,700 11,000 16,000 16,000 16,000 6,632 6,700 11,000 16,000 16,000 16,000 6,632 6,700 11,000 16,000 16,000 16,000
Non-Firm, Replenishment 21,000 21,000 21,000 21,000 21,000
Total Demand 244,393 266,825 273,285 281,470 283,355 285,040 244,393 250,987 258,604 265,940 267,864 269,585 244,393 259,125 258,604 265,940 267,864 269,585
MWD Firm Demand 63,443 56,525 57,185 59,870 61,755 63,440 63,443 72,360 72,360 72,360 72,360 72,360 63,443 69,711 69,711 69,711 69,711 69,711
Water SupplyImported, MWD firm (2) 63,443 72,360 72,360 72,360 72,360 72,360 63,443 72,360 72,360 72,360 72,360 72,360 63,443 69,711 69,711 69,711 69,711 69,711
Imported, MWD non-firm 21,000 21,000 21,000 21,000 21,000
Imported, Other
Groundwater, Potable 174,318 194,400 194,400 194,400 194,400 194,400 174,318 194,400 194,400 194,400 194,400 194,400 174,318 194,400 194,400 194,400 194,400 194,400
Groundwater, Non-Potable
Surface Supply/Storage
Recycled, Direct 6,632 12,900 17,900 17,900 17,900 17,900 6,632 12,900 17,900 17,900 17,900 17,900 6,632 12,900 17,900 17,900 17,900 17,900
Recycled, Indirect
Brackish Water
Seawater
Other
Conservation
Total Local 180,950 207,300 212,300 212,300 212,300 212,300 180,950 207,300 212,300 212,300 212,300 212,300 180,950 207,300 212,300 212,300 212,300 212,300
Total Water Supply 244,393 300,660 305,660 305,660 305,660 305,660 244,393 279,660 284,660 284,660 284,660 284,660 244,393 277,011 282,011 282,011 282,011 282,011
Total Supply, less Replenishment 279,660 284,660 284,660 284,660 284,660
Per Capita Water Use GPCPD 131.8 141.0 141.8 143.5 142.0 140.6 131.8 132.7 134.2 135.5 134.2 133.0 131.8 137.0 134.2 135.5 134.2 133.0
Per Capita less Recycled/Non-Firm 128.3 126.4 125.2 124.6 123.5 122.4 128.3 129.1 128.5 127.4 126.2 125.1 128.3 133.4 128.5 127.4 126.2 125.1
Notes
1. Population Projections based on MWD/SCAG. Alternative projection is also shown in UWMP.
2. MWD Firm demands calculated from Table 2-4
3. MWD Demands based on MWD Tier 1 purchase order contract, per plan
4. MWD firm demand in normal years is MWD demand, less 21,000 replenishment

12/9/2011 Page B-6
City of Compton Normal Water Year Single Dry Water Year Multiple Dry Water Year- Year 3
2010 2015 2020 2025 2030 2035 2010 2015 2020 2025 2030 2035 2010 2015 2020 2025 2030 2035
Population Projection 81,963 84,669 87,465 90,353 93,336 93,336 81,963 84,669 87,465 90,353 93,336 93,336 81,963 84,669 87,465 90,353 93,336 93,336
Water DemandsFirm Demand 8,929 9,484 9,798 10,121 10,455 10,455 8,929 9,522 9,847 10,172 10,497 10,497 8,929 9,626 9,916 10,273 10,612 10,612
Recycled Demand, Direct
Non-Firm, Replenishment
Total Demand 8,929 9,484 9,798 10,121 10,455 10,455 8,929 9,522 9,847 10,172 10,497 10,497 8,929 9,626 9,916 10,273 10,612 10,612
MWD Firm Demand 2,603 3,704 4,018 4,341 4,675 4,675 2,803 3,742 4,067 4,392 4,717 4,717 2,803 3,846 4,136 4,493 4,832 4,832
Water SupplyImported, MWD firm 2,803 3,704 4,018 4,341 4,675 4,675 2,803 3,742 4,067 4,392 4,717 4,717 2,803 3,846 4,136 4,493 4,832 4,832
Imported, MWD non-firm
Imported, Other
Groundwater, Potable 6,326 5,780 5,780 5,780 5,780 5,780 6,326 5,780 5,780 5,780 5,780 5,780 6,326 5,780 5,780 5,780 5,780 5,780
Groundwater, Non-Potable
Surface Supply/Storage
Recycled, Direct
Recycled, Indirect
Brackish Water
Seawater
Other
Conservation
Total Local 6,326 5,780 5,780 5,780 5,780 5,780 6,326 5,780 5,780 5,780 5,780 5,780 6,326 5,780 5,780 5,780 5,780 5,780
Total Water Supply 9,129 9,484 9,798 10,121 10,455 10,455 9,129 9,522 9,847 10,172 10,497 10,497 9,129 9,626 9,916 10,273 10,612 10,612
Per Capita Water Use GPCPD 97.3 100.0 100.0 100.0 100.0 100.0 97.3 100.4 100.5 100.5 100.4 100.4 97.3 101.5 101.2 101.5 101.5 101.5
Per Capita less Recycled/Non-Firm 97.3 100.0 100.0 100.0 100.0 100.0 97.3 100.4 100.5 100.5 100.4 100.4 97.3 101.5 101.2 101.5 101.5 101.5
Notes
Population, Supply and Demand for 2035 is 2030 data
Supplies for Dry and Multiple Dry are listed as same for average year. UWMP states that additional MWD
surplus water would be available, although conservation would be in effect.
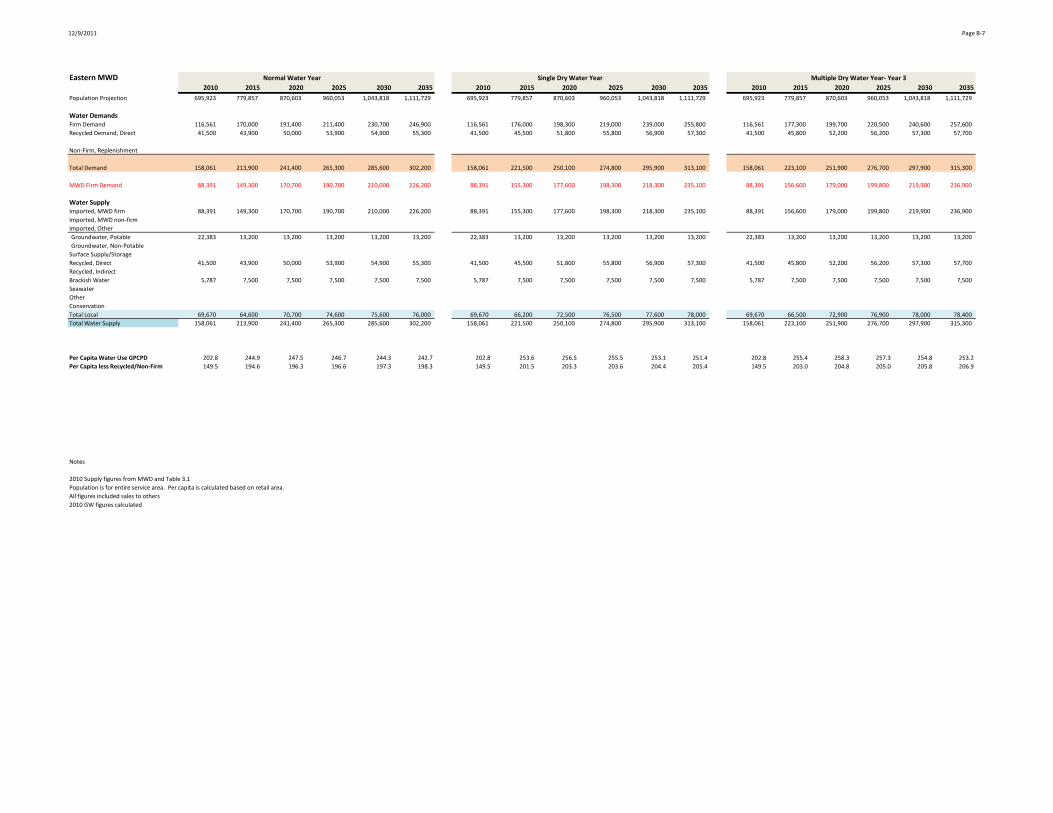
12/9/2011 Page B-7
Eastern MWD Normal Water Year Single Dry Water Year Multiple Dry Water Year- Year 3
2010 2015 2020 2025 2030 2035 2010 2015 2020 2025 2030 2035 2010 2015 2020 2025 2030 2035
Population Projection 695,923 779,857 870,603 960,053 1,043,818 1,111,729 695,923 779,857 870,603 960,053 1,043,818 1,111,729 695,923 779,857 870,603 960,053 1,043,818 1,111,729
Water DemandsFirm Demand 116,561 170,000 191,400 211,400 230,700 246,900 116,561 176,000 198,300 219,000 239,000 255,800 116,561 177,300 199,700 220,500 240,600 257,600
Recycled Demand, Direct 41,500 43,900 50,000 53,900 54,900 55,300 41,500 45,500 51,800 55,800 56,900 57,300 41,500 45,800 52,200 56,200 57,300 57,700
Non-Firm, Replenishment
Total Demand 158,061 213,900 241,400 265,300 285,600 302,200 158,061 221,500 250,100 274,800 295,900 313,100 158,061 223,100 251,900 276,700 297,900 315,300
MWD Firm Demand 88,391 149,300 170,700 190,700 210,000 226,200 88,391 155,300 177,600 198,300 218,300 235,100 88,391 156,600 179,000 199,800 219,900 236,900
Water SupplyImported, MWD firm 88,391 149,300 170,700 190,700 210,000 226,200 88,391 155,300 177,600 198,300 218,300 235,100 88,391 156,600 179,000 199,800 219,900 236,900
Imported, MWD non-firm
Imported, Other
Groundwater, Potable 22,383 13,200 13,200 13,200 13,200 13,200 22,383 13,200 13,200 13,200 13,200 13,200 22,383 13,200 13,200 13,200 13,200 13,200
Groundwater, Non-Potable
Surface Supply/Storage
Recycled, Direct 41,500 43,900 50,000 53,900 54,900 55,300 41,500 45,500 51,800 55,800 56,900 57,300 41,500 45,800 52,200 56,200 57,300 57,700
Recycled, Indirect
Brackish Water 5,787 7,500 7,500 7,500 7,500 7,500 5,787 7,500 7,500 7,500 7,500 7,500 5,787 7,500 7,500 7,500 7,500 7,500
Seawater
Other
Conservation
Total Local 69,670 64,600 70,700 74,600 75,600 76,000 69,670 66,200 72,500 76,500 77,600 78,000 69,670 66,500 72,900 76,900 78,000 78,400
Total Water Supply 158,061 213,900 241,400 265,300 285,600 302,200 158,061 221,500 250,100 274,800 295,900 313,100 158,061 223,100 251,900 276,700 297,900 315,300
Per Capita Water Use GPCPD 202.8 244.9 247.5 246.7 244.3 242.7 202.8 253.6 256.5 255.5 253.1 251.4 202.8 255.4 258.3 257.3 254.8 253.2
Per Capita less Recycled/Non-Firm 149.5 194.6 196.3 196.6 197.3 198.3 149.5 201.5 203.3 203.6 204.4 205.4 149.5 203.0 204.8 205.0 205.8 206.9
Notes
2010 Supply figures from MWD and Table 3.1
Population is for entire service area. Per capita is calculated based on retail area.
All figures included sales to others
2010 GW figures calculated

12/9/2011 Page B-8
Foothill MWD Normal Water Year Single Dry Water Year Multiple Dry Water Year- Year 3
2010 2015 2020 2025 2030 2035 2010 2015 2020 2025 2030 2035 2010 2015 2020 2025 2030 2035
Population Projection 87,876 90,538 93,283 96,103 99,012 102,003 87,876 90,538 93,283 96,103 99,012 102,003 87,876 90,538 93,283 96,103 99,012 102,003
Water DemandsFirm Demand 10,090 11,294 11,659 12,006 12,362 12,735 10,090 12,481 12,884 13,267 13,660 14,072 10,090 11,294 11,659 12,006 12,362 12,735
Recycled Demand, Direct 104 120 120 120 120 120 104 120 120 120 120 120 104 120 120 120 120 120
Non-Firm, Replenishment
Total Demand 10,194 11,414 11,779 12,126 12,482 12,855 10,194 12,601 13,004 13,387 13,780 14,192 10,194 11,414 11,779 12,126 12,482 12,855
MWD Firm Demand 10,090 11,043 11,259 11,711 12,139 12,621 10,090 12,204 12,442 12,941 13,414 13,946 10,090 11,414 11,779 12,126 12,482 12,855
Water SupplyImported, MWD firm 10,090 11,294 11,659 12,006 12,362 12,735 10,090 12,481 12,884 13,267 13,660 14,072 10,090 11,294 11,659 12,006 12,362 12,735
Imported, MWD non-firm
Imported, Other
Groundwater, Potable
Groundwater, Non-Potable
Surface Supply/Storage
Recycled, Direct 104 120 120 120 120 120 104 120 120 120 120 120 104 120 120 120 120 120
Recycled, Indirect
Brackish Water
Seawater
Other
Conservation
Total Local 104 120 120 120 120 120 104 120 120 120 120 120 104 120 120 120 120 120
Total Water Supply 10,194 11,414 11,779 12,126 12,482 12,855 10,194 12,601 13,004 13,387 13,780 14,192 11,414 11,779 12,126 12,482 12,855
Per Capita Water Use GPCPD 103.6 112.5 112.7 112.6 112.5 112.5 103.6 124.3 124.5 124.4 124.2 124.2 103.6 112.5 112.7 112.6 112.5 112.5
Per Capita less Recycled/Non-Firm 102.5 111.4 111.6 111.5 111.5 111.5 102.5 123.1 123.3 123.2 123.2 123.2 102.5 111.4 111.6 111.5 111.5 111.5
Notes
Population Provided by member retail agencies
Recycled water shown is produced by LA County San and delivered to golf course.

12/9/2011 Page B-9
City of Fullerton Normal Water Year Single Dry Water Year Multiple Dry Water Year- Year 3
2010 2015 2020 2025 2030 2035 2010 2015 2020 2025 2030 2035 2010 2015 2020 2025 2030 2035
Population Projection 138,600 141,603 144,605 147,608 150,610 153,613 138,600 141,603 144,605 147,608 150,610 153,613 138,600 141,603 144,605 147,608 150,610 153,613
Water DemandsFirm Demand 27,860 32,305 32,881 32,658 32,602 32,792 27,860 34,146 34,755 34,520 34,460 34,661 27,860 34,146 34,755 34,520 34,460 34,661
Recycled Demand, Direct
Non-Firm, Replenishment
Total Demand 27,860 32,305 32,881 32,658 32,602 32,792 27,860 34,146 34,755 34,520 34,460 34,661 27,860 34,146 34,755 34,520 34,460 34,661
MWD Firm Demand 10,587 12,276 12,495 12,410 12,389 12,461 10,587 14,117 14,369 14,272 14,247 14,330 10,587 14,117 14,369 14,272 14,247 14,330
Water SupplyImported, MWD firm 10,587 12,276 12,495 12,410 12,389 12,461 10,587 14,117 14,369 14,272 14,247 14,330 10,587 14,117 14,369 14,272 14,247 14,330
Imported, MWD non-firm
Imported, Other
Groundwater, Potable 17,273 20,029 20,386 20,248 20,213 20,331 17,273 20,029 20,386 20,248 20,213 20,331 17,273 20,029 20,386 20,248 20,213 20,331
Groundwater, Non-Potable
Surface Supply/Storage
Recycled, Direct
Recycled, Indirect
Brackish Water
Seawater
Other
Conservation
Total Local 17,273 20,029 20,386 20,248 20,213 20,331 17,273 20,029 20,386 20,248 20,213 20,331 17,273 20,029 20,386 20,248 20,213 20,331
Total Water Supply 27,860 32,305 32,881 32,658 32,602 32,792 27,860 34,146 34,755 34,520 34,460 34,661 27,860 34,146 34,755 34,520 34,460 34,661
Per Capita Water Use GPCPD 179.4 203.7 203.0 197.5 193.2 190.6 179.4 215.3 214.6 208.8 204.3 201.4 179.4 215.3 214.6 208.8 204.3 201.4
Per Capita less Recycled/Non-Firm 179.4 203.7 203.0 197.5 193.2 190.6 179.4 215.3 214.6 208.8 204.3 201.4 179.4 215.3 214.6 208.8 204.3 201.4
Notes
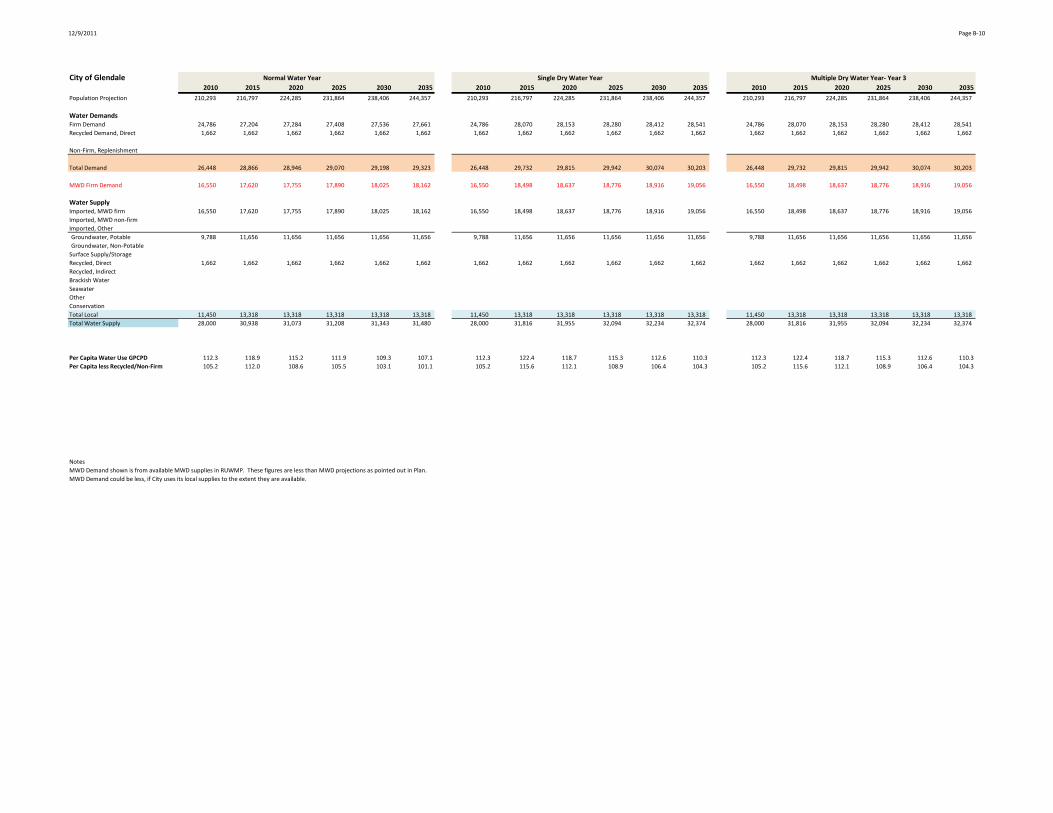
12/9/2011 Page B-10
City of Glendale Normal Water Year Single Dry Water Year Multiple Dry Water Year- Year 3
2010 2015 2020 2025 2030 2035 2010 2015 2020 2025 2030 2035 2010 2015 2020 2025 2030 2035
Population Projection 210,293 216,797 224,285 231,864 238,406 244,357 210,293 216,797 224,285 231,864 238,406 244,357 210,293 216,797 224,285 231,864 238,406 244,357
Water DemandsFirm Demand 24,786 27,204 27,284 27,408 27,536 27,661 24,786 28,070 28,153 28,280 28,412 28,541 24,786 28,070 28,153 28,280 28,412 28,541
Recycled Demand, Direct 1,662 1,662 1,662 1,662 1,662 1,662 1,662 1,662 1,662 1,662 1,662 1,662 1,662 1,662 1,662 1,662 1,662 1,662
Non-Firm, Replenishment
Total Demand 26,448 28,866 28,946 29,070 29,198 29,323 26,448 29,732 29,815 29,942 30,074 30,203 26,448 29,732 29,815 29,942 30,074 30,203
MWD Firm Demand 16,550 17,620 17,755 17,890 18,025 18,162 16,550 18,498 18,637 18,776 18,916 19,056 16,550 18,498 18,637 18,776 18,916 19,056
Water SupplyImported, MWD firm 16,550 17,620 17,755 17,890 18,025 18,162 16,550 18,498 18,637 18,776 18,916 19,056 16,550 18,498 18,637 18,776 18,916 19,056
Imported, MWD non-firm
Imported, Other
Groundwater, Potable 9,788 11,656 11,656 11,656 11,656 11,656 9,788 11,656 11,656 11,656 11,656 11,656 9,788 11,656 11,656 11,656 11,656 11,656
Groundwater, Non-Potable
Surface Supply/Storage
Recycled, Direct 1,662 1,662 1,662 1,662 1,662 1,662 1,662 1,662 1,662 1,662 1,662 1,662 1,662 1,662 1,662 1,662 1,662 1,662
Recycled, Indirect
Brackish Water
Seawater
Other
Conservation
Total Local 11,450 13,318 13,318 13,318 13,318 13,318 11,450 13,318 13,318 13,318 13,318 13,318 11,450 13,318 13,318 13,318 13,318 13,318
Total Water Supply 28,000 30,938 31,073 31,208 31,343 31,480 28,000 31,816 31,955 32,094 32,234 32,374 28,000 31,816 31,955 32,094 32,234 32,374
Per Capita Water Use GPCPD 112.3 118.9 115.2 111.9 109.3 107.1 112.3 122.4 118.7 115.3 112.6 110.3 112.3 122.4 118.7 115.3 112.6 110.3
Per Capita less Recycled/Non-Firm 105.2 112.0 108.6 105.5 103.1 101.1 105.2 115.6 112.1 108.9 106.4 104.3 105.2 115.6 112.1 108.9 106.4 104.3
Notes
MWD Demand shown is from available MWD supplies in RUWMP. These figures are less than MWD projections as pointed out in Plan.
MWD Demand could be less, if City uses its local supplies to the extent they are available.

12/9/2011 Page B-11
Inland Empire Utilities Agency Normal Water Year Single Dry Water Year Multiple Dry Water Year- Year 3
2010 2015 2020 2025 2030 2035 2010 2015 2020 2025 2030 2035 2010 2015 2020 2025 2030 2035
Population Projection 846,469 919,771 981,651 1,040,521 1,108,234 1,176,066 846,469 919,771 981,651 1,040,521 1,108,234 1,176,066 846,469 919,771 981,651 1,040,521 1,108,234 1,176,066
Water DemandsFirm Demand 226,366 243,006 236,803 247,969 256,877 273,233 226,366 215,819 209,957 219,736 227,484 241,819 226,366 212,932 206,790 216,300 223,778 237,729
Recycled Demand, Direct 17,298 28,865 31,662 34,359 37,056 40,903 17,298 28,865 31,662 34,359 37,056 40,903 17,298 31,752 34,828 37,795 40,762 44,993
Non-Firm, Replenishment
Total Demand 243,664 271,871 268,465 282,328 293,933 314,136 243,664 244,684 241,619 254,095 264,540 282,722 243,664 244,684 241,619 254,095 264,540 282,722
MWD Demand from UWMP 54,934 80,556 81,641 82,725 83,809 85,978 54,934 49,945 50,617 51,290 51,962 53,306 54,934 49,945 50,617 51,290 51,962 53,306
Water SupplyImported, MWD firm 54,934 80,556 81,641 82,725 83,809 85,978 54,934 49,945 50,617 51,290 51,962 53,306 54,934 49,945 50,617 51,290 51,962 53,306
Imported, MWD non-firm
Imported, Other
Groundwater, Potable 130,907 162,345 156,484 164,848 170,747 183,109 130,907 189,357 182,617 192,235 199,019 213,235 130,907 187,556 180,874 190,409 197,134 211,227
Groundwater, Non-Potable
Surface Supply/Storage 25,652 28,490 28,490 28,490 28,490 28,490 25,652 8,832 8,832 8,832 8,832 8,832 25,652 21,937 21,937 21,937 21,937 21,937
Recycled, Direct 17,298 28,865 31,662 34,359 37,056 40,903 17,298 28,865 31,662 34,359 37,056 40,903 17,298 31,752 34,828 37,795 40,762 44,993
Recycled, Indirect 7,208 20,000 21,000 21,000 21,000 7,208 20,000 21,000 21,000 21,000 7,208 20,000 21,000 21,000 21,000
Brackish Water-CDA 14,737 17,733 17,733 17,733 17,733 17,733 14,737 17,733 17,733 17,733 17,733 17,733 14,737 17,733 17,733 17,733 17,733 17,733
Seawater
Other 7,208 30,168 18,729 19,043 20,828 21,533 7,208 30,168 18,729 19,043 20,828 21,533 7,208 33,906 22,602 23,047 25,011 25,786
Conservation
Total Local 195,802 274,809 273,098 285,473 295,854 312,768 195,802 282,163 279,573 293,202 304,468 323,236 195,802 300,091 297,974 311,921 323,577 342,676
Total Water Supply 250,736 355,365 354,739 368,198 379,663 398,746 250,736 332,108 330,190 344,492 356,430 376,542 350,036 348,591 363,211 375,539 395,982
Per Capita Water Use GPCPD 257.0 263.9 244.1 242.2 236.8 238.5 257.0 237.5 219.7 218.0 213.1 214.6 257.0 237.5 219.7 218.0 213.1 214.6
Per Capita less Recycled/Non-Firm 238.7 235.9 215.4 212.8 206.9 207.4 238.7 209.5 190.9 188.5 183.2 183.6 238.7 206.7 188.1 185.6 180.3 180.5
Notes
Recycled water direct use from table 3-15
Recycled, indirect includes recharge potential
Other includes balance of recycled supply available
Demand figures include slight ag usage

12/9/2011 Page B-12
Las Virgenes MWD Normal Water Year Single Dry Water Year Multiple Dry Water Year- Year 3
2010 2015 2020 2025 2030 2035 2010 2015 2020 2025 2030 2035 2010 2015 2020 2025 2030 2035
Population Projection 75,384 77,285 79,984 82,718 85,323 87,811 75,384 77,285 79,984 82,718 85,323 87,811 75,384 77,285 79,984 82,718 85,323 87,811
Water DemandsFirm Demand 20,199 23,951 22,034 22,787 23,504 24,190 20,199 28,231 25,971 26,858 27,704 28,512 20,199 27,327 26,326 27,197 28,027 28,845
Recycled Demand, Direct 4,522 4,878 6,185 7,493 8,800 9,062 4,522 5,750 7,290 8,832 10,372 10,681 4,522 6,366 7,907 9,448 10,496 10,808
Non-Firm, Replenishment
Total Demand 24,721 28,829 28,219 30,280 32,304 33,252 24,721 33,981 33,261 35,690 38,076 39,193 24,721 33,693 34,233 36,645 38,523 39,653
MWD Firm Demand 20,199 23,951 22,034 22,787 23,504 24,190 20,199 28,231 25,971 26,858 27,704 28,512 20,199 27,327 26,326 27,197 28,027 28,845
Water SupplyImported, MWD firm 20,199 41,675 43,406 46,941 45,363 43,783 20,199 31,950 33,418 36,328 34,698 33,074 20,199 27,474 29,081 30,020 29,465 29,037
Imported, MWD non-firm
Imported, Other
Groundwater, Potable
Groundwater, Non-Potable
Surface Supply/Storage
Recycled, Direct 4,522 4,878 6,185 7,493 8,800 9,062 4,522 5,750 7,290 8,832 10,372 10,681 4,522 6,366 7,907 9,448 10,496 10,808
Recycled, Indirect
Brackish Water
Seawater
Other
Conservation
Total Local 4,522 4,878 6,185 7,493 8,800 9,062 4,522 5,750 7,290 8,832 10,372 10,681 4,522 6,366 7,907 9,448 10,496 10,808
Total Water Supply 24,721 46,553 49,591 54,434 54,163 52,845 24,721 37,700 40,708 45,160 45,070 43,755 24,721 33,840 36,988 39,468 39,961 39,845
Conservation from UWMP - 2,662 5,508 5,696 5,876 6,047 - 2,662 5,508 5,696 5,876 6,047 - 2,662 5,508 5,696 5,876 6,047
Per Capita Water Use GPCPD 292.8 333.0 315.0 326.8 338.0 338.1 292.8 392.5 371.2 385.2 398.4 398.5 292.8 389.2 382.1 395.5 403.1 403.1
Per Capita less Recycled/Non-Firm 239.2 276.7 245.9 245.9 245.9 245.9 239.2 326.1 289.9 289.9 289.9 289.9 239.2 315.7 293.8 293.5 293.2 293.3
Notes
Population Projections by SCAG
MWD supply vs. MWD demand calculated by using percentages on LVMWD table 7.9
Firm Demand includes recycled water
Conservation shown is from Table 5.5

12/9/2011 Page B-13
City of Long Beach Normal Water Year Single Dry Water Year Multiple Dry Water Year- Year 3
2010 2015 2020 2025 2030 2035 2010 2015 2020 2025 2030 2035 2010 2015 2020 2025 2030 2035
Population Projection 462,257 471,107 480,126 489,318 498,686 508,233 462,257 471,107 480,126 489,318 498,686 508,233 462,257 471,107 480,126 489,318 498,686 508,233
Water DemandsFirm Demand 56,892 57,520 57,546 57,551 56,977 56,929 56,892 57,520 57,546 57,551 56,977 56,929 56,892 57,520 57,546 57,551 56,977 56,929
Recycled Demand, Direct 6,556 10,100 11,300 13,400 13,700 14,000 6,556 10,100 11,300 13,400 13,700 14,000 6,556 10,100 11,300 13,400 13,700 14,000
Non-Firm, Replenishment
Total Demand 63,448 67,620 68,846 70,951 70,677 70,929 63,448 67,620 68,846 70,951 70,677 70,929 63,448 67,620 68,846 70,951 70,677 70,929
MWD Firm Demand 22,237 24,520 24,046 18,551 17,477 11,929 22,237 24,520 24,046 18,551 17,477 11,929 22,237 24,520 24,046 18,551 17,477 11,929
Water SupplyImported, MWD firm 22,237 24,520 24,046 18,551 17,477 11,929 22,237 24,520 24,046 18,551 17,477 11,929 22,237 24,520 24,046 18,551 17,477 11,929
Imported, MWD non-firm
Imported, Other
Groundwater, Potable 34,655 33,000 33,500 34,000 34,500 35,000 34,655 33,000 33,500 34,000 34,500 35,000 34,655 33,000 33,500 34,000 34,500 35,000
Groundwater, Non-Potable
Surface Supply/Storage
Recycled, Direct 6,556 10,100 11,300 13,400 13,700 14,000 6,556 10,100 11,300 13,400 13,700 14,000 6,556 10,100 11,300 13,400 13,700 14,000
Recycled, Indirect
Brackish Water
Seawater 5,000 5,000 10,000 5,000 5,000 10,000 5,000 5,000 10,000
Other
Conservation
Total Local 41,211 43,100 44,800 52,400 53,200 59,000 41,211 43,100 44,800 52,400 53,200 59,000 41,211 43,100 44,800 52,400 53,200 59,000
Total Water Supply 63,448 67,620 68,846 70,951 70,677 70,929 63,448 67,620 68,846 70,951 70,677 70,929 67,620 68,846 70,951 70,677 70,929
Per Capita Water Use GPCPD 122.5 128.1 128.0 129.4 126.5 124.6 122.5 128.1 128.0 129.4 126.5 124.6 122.5 128.1 128.0 129.4 126.5 124.6
Per Capita less Recycled/Non-Firm 109.9 109.0 107.0 105.0 102.0 100.0 109.9 109.0 107.0 105.0 102.0 100.0 109.9 109.0 107.0 105.0 102.0 100.0
Notes
Supplies equal demands
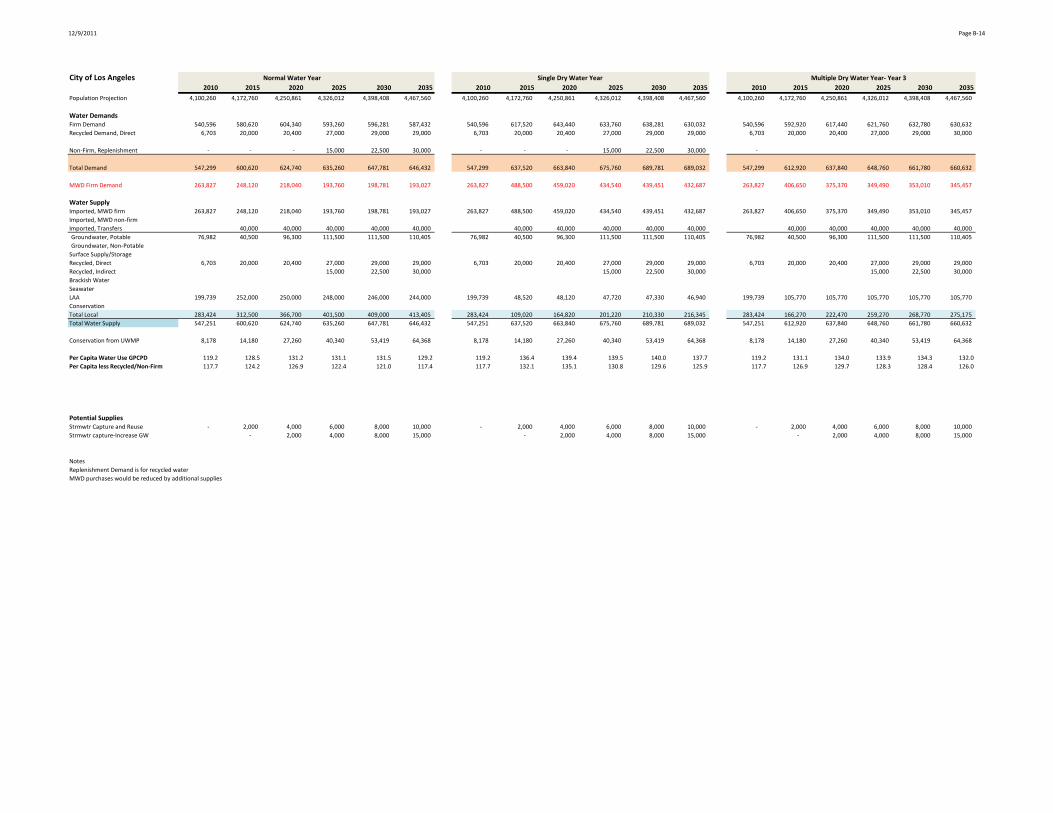
12/9/2011 Page B-14
City of Los Angeles Normal Water Year Single Dry Water Year Multiple Dry Water Year- Year 3
2010 2015 2020 2025 2030 2035 2010 2015 2020 2025 2030 2035 2010 2015 2020 2025 2030 2035
Population Projection 4,100,260 4,172,760 4,250,861 4,326,012 4,398,408 4,467,560 4,100,260 4,172,760 4,250,861 4,326,012 4,398,408 4,467,560 4,100,260 4,172,760 4,250,861 4,326,012 4,398,408 4,467,560
Water DemandsFirm Demand 540,596 580,620 604,340 593,260 596,281 587,432 540,596 617,520 643,440 633,760 638,281 630,032 540,596 592,920 617,440 621,760 632,780 630,632
Recycled Demand, Direct 6,703 20,000 20,400 27,000 29,000 29,000 6,703 20,000 20,400 27,000 29,000 29,000 6,703 20,000 20,400 27,000 29,000 30,000
Non-Firm, Replenishment - - - 15,000 22,500 30,000 - - - 15,000 22,500 30,000 -
Total Demand 547,299 600,620 624,740 635,260 647,781 646,432 547,299 637,520 663,840 675,760 689,781 689,032 547,299 612,920 637,840 648,760 661,780 660,632
MWD Firm Demand 263,827 248,120 218,040 193,760 198,781 193,027 263,827 488,500 459,020 434,540 439,451 432,687 263,827 406,650 375,370 349,490 353,010 345,457
Water SupplyImported, MWD firm 263,827 248,120 218,040 193,760 198,781 193,027 263,827 488,500 459,020 434,540 439,451 432,687 263,827 406,650 375,370 349,490 353,010 345,457
Imported, MWD non-firm
Imported, Transfers 40,000 40,000 40,000 40,000 40,000 40,000 40,000 40,000 40,000 40,000 40,000 40,000 40,000 40,000 40,000
Groundwater, Potable 76,982 40,500 96,300 111,500 111,500 110,405 76,982 40,500 96,300 111,500 111,500 110,405 76,982 40,500 96,300 111,500 111,500 110,405
Groundwater, Non-Potable
Surface Supply/Storage
Recycled, Direct 6,703 20,000 20,400 27,000 29,000 29,000 6,703 20,000 20,400 27,000 29,000 29,000 6,703 20,000 20,400 27,000 29,000 29,000
Recycled, Indirect 15,000 22,500 30,000 15,000 22,500 30,000 15,000 22,500 30,000
Brackish Water
Seawater
LAA 199,739 252,000 250,000 248,000 246,000 244,000 199,739 48,520 48,120 47,720 47,330 46,940 199,739 105,770 105,770 105,770 105,770 105,770
Conservation
Total Local 283,424 312,500 366,700 401,500 409,000 413,405 283,424 109,020 164,820 201,220 210,330 216,345 283,424 166,270 222,470 259,270 268,770 275,175
Total Water Supply 547,251 600,620 624,740 635,260 647,781 646,432 547,251 637,520 663,840 675,760 689,781 689,032 547,251 612,920 637,840 648,760 661,780 660,632
Conservation from UWMP 8,178 14,180 27,260 40,340 53,419 64,368 8,178 14,180 27,260 40,340 53,419 64,368 8,178 14,180 27,260 40,340 53,419 64,368
Per Capita Water Use GPCPD 119.2 128.5 131.2 131.1 131.5 129.2 119.2 136.4 139.4 139.5 140.0 137.7 119.2 131.1 134.0 133.9 134.3 132.0
Per Capita less Recycled/Non-Firm 117.7 124.2 126.9 122.4 121.0 117.4 117.7 132.1 135.1 130.8 129.6 125.9 117.7 126.9 129.7 128.3 128.4 126.0
Potential SuppliesStrmwtr Capture and Reuse - 2,000 4,000 6,000 8,000 10,000 - 2,000 4,000 6,000 8,000 10,000 - 2,000 4,000 6,000 8,000 10,000
Strmwtr capture-Increase GW - 2,000 4,000 8,000 15,000 - 2,000 4,000 8,000 15,000 - 2,000 4,000 8,000 15,000
Notes
Replenishment Demand is for recycled water
MWD purchases would be reduced by additional supplies

12/9/2011 Page B-15
MWDOC Normal Water Year Single Dry Water Year Multiple Dry Water Year- Year 3
2010 2015 2020 2025 2030 2035 2010 2015 2020 2025 2030 2035 2010 2015 2020 2025 2030 2035
Population Projection 2,300,021 2,370,931 2,441,838 2,512,752 2,583,659 2,654,569 2,300,021 2,370,931 2,441,838 2,512,752 2,583,659 2,654,569 2,300,021 2,370,931 2,441,838 2,512,752 2,583,659 2,654,569
Water DemandsFirm Demand 445,669 474,829 487,068 498,886 504,198 508,373 445,669 509,577 522,891 535,728 541,402 545,859 445,669 509,577 522,891 535,728 541,402 545,859
Recycled Demand, Direct 39,642 51,658 55,699 59,324 59,492 59,597 39,642 51,658 55,699 59,324 59,492 59,597 39,642 51,658 55,699 59,324 59,492 59,597
Non-Firm, Replenishment
Total Demand 485,311 526,487 542,767 558,210 563,690 567,970 485,311 561,235 578,590 595,052 600,894 605,456 485,311 561,235 578,590 595,052 600,894 605,456
MWD Firm Demand 220,132 225,697 234,454 243,853 247,545 250,519 220,132 260,445 270,277 280,695 284,749 288,005 220,132 260,445 270,277 280,695 284,749 288,005
Water SupplyImported, MWD firm 220,132 225,697 234,454 243,853 247,545 250,519 220,132 260,445 270,277 280,695 284,749 288,005 220,132 260,445 270,277 280,695 284,749 288,005
Imported, MWD non-firm
Imported, Other
Groundwater, Potable 220,052 243,032 246,514 248,933 250,553 251,754 220,052 243,032 246,514 248,933 250,553 251,754 220,052 243,032 246,514 248,933 250,553 251,754
Groundwater, Non-Potable
Surface Supply/Storage 5,485 6,100 6,100 6,100 6,100 6,100 5,485 6,100 6,100 6,100 6,100 6,100 5,485 6,100 6,100 6,100 6,100 6,100
Recycled, Direct 39,642 51,658 55,699 59,324 59,492 59,597 39,642 51,658 55,699 59,324 59,492 59,597 39,642 51,658 55,699 59,324 59,492 59,597
Recycled, Indirect
Brackish Water
Seawater
Other
Conservation
Total Local 265,179 300,790 308,313 314,357 316,145 317,451 265,179 300,790 308,313 314,357 316,145 317,451 265,179 300,790 308,313 314,357 316,145 317,451
Total Water Supply 485,311 526,487 542,767 558,210 563,690 567,970 485,311 561,235 578,590 595,052 600,894 605,456 561,235 578,590 595,052 600,894 605,456
Per Capita Water Use GPCPD 188.4 198.2 198.4 198.3 194.8 191.0 188.4 211.3 211.5 211.4 207.6 203.6 188.4 211.3 211.5 211.4 207.6 203.6
Per Capita less Recycled/Non-Firm 173.0 178.8 178.1 177.2 174.2 171.0 173.0 191.9 191.2 190.3 187.1 183.6 173.0 191.9 191.2 190.3 187.1 183.6
Notes
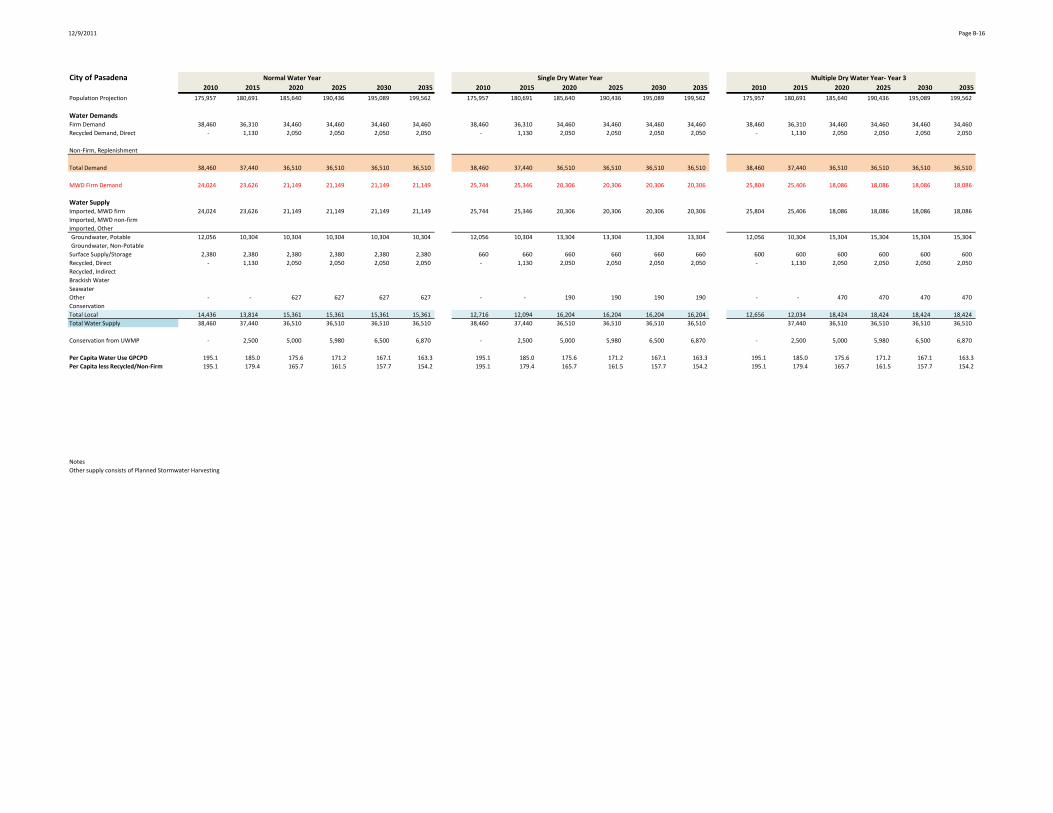
12/9/2011 Page B-16
City of Pasadena Normal Water Year Single Dry Water Year Multiple Dry Water Year- Year 3
2010 2015 2020 2025 2030 2035 2010 2015 2020 2025 2030 2035 2010 2015 2020 2025 2030 2035
Population Projection 175,957 180,691 185,640 190,436 195,089 199,562 175,957 180,691 185,640 190,436 195,089 199,562 175,957 180,691 185,640 190,436 195,089 199,562
Water DemandsFirm Demand 38,460 36,310 34,460 34,460 34,460 34,460 38,460 36,310 34,460 34,460 34,460 34,460 38,460 36,310 34,460 34,460 34,460 34,460
Recycled Demand, Direct - 1,130 2,050 2,050 2,050 2,050 - 1,130 2,050 2,050 2,050 2,050 - 1,130 2,050 2,050 2,050 2,050
Non-Firm, Replenishment
Total Demand 38,460 37,440 36,510 36,510 36,510 36,510 38,460 37,440 36,510 36,510 36,510 36,510 38,460 37,440 36,510 36,510 36,510 36,510
MWD Firm Demand 24,024 23,626 21,149 21,149 21,149 21,149 25,744 25,346 20,306 20,306 20,306 20,306 25,804 25,406 18,086 18,086 18,086 18,086
Water SupplyImported, MWD firm 24,024 23,626 21,149 21,149 21,149 21,149 25,744 25,346 20,306 20,306 20,306 20,306 25,804 25,406 18,086 18,086 18,086 18,086
Imported, MWD non-firm
Imported, Other
Groundwater, Potable 12,056 10,304 10,304 10,304 10,304 10,304 12,056 10,304 13,304 13,304 13,304 13,304 12,056 10,304 15,304 15,304 15,304 15,304
Groundwater, Non-Potable
Surface Supply/Storage 2,380 2,380 2,380 2,380 2,380 2,380 660 660 660 660 660 660 600 600 600 600 600 600
Recycled, Direct - 1,130 2,050 2,050 2,050 2,050 - 1,130 2,050 2,050 2,050 2,050 - 1,130 2,050 2,050 2,050 2,050
Recycled, Indirect
Brackish Water
Seawater
Other - - 627 627 627 627 - - 190 190 190 190 - - 470 470 470 470
Conservation
Total Local 14,436 13,814 15,361 15,361 15,361 15,361 12,716 12,094 16,204 16,204 16,204 16,204 12,656 12,034 18,424 18,424 18,424 18,424
Total Water Supply 38,460 37,440 36,510 36,510 36,510 36,510 38,460 37,440 36,510 36,510 36,510 36,510 37,440 36,510 36,510 36,510 36,510
Conservation from UWMP - 2,500 5,000 5,980 6,500 6,870 - 2,500 5,000 5,980 6,500 6,870 - 2,500 5,000 5,980 6,500 6,870
Per Capita Water Use GPCPD 195.1 185.0 175.6 171.2 167.1 163.3 195.1 185.0 175.6 171.2 167.1 163.3 195.1 185.0 175.6 171.2 167.1 163.3
Per Capita less Recycled/Non-Firm 195.1 179.4 165.7 161.5 157.7 154.2 195.1 179.4 165.7 161.5 157.7 154.2 195.1 179.4 165.7 161.5 157.7 154.2
Notes
Other supply consists of Planned Stormwater Harvesting

12/9/2011 Page B-17
SDCWA Normal Water Year Single Dry Water Year Multiple Dry Water Year- Year 3
2010 2015 2020 2025 2030 2035 2010 2015 2020 2025 2030 2035 2010 2015 2020 2025 2030 2035
Population Projection 3,200,000 3,271,773 3,438,837 3,599,952 3,758,933 3,906,718 3,200,000 3,271,773 3,438,837 3,599,952 3,758,933 3,906,718 3,200,000 3,271,773 3,438,837 3,599,952 3,758,933 3,906,718
Water DemandsFirm Demand 538,512 608,625 631,361 671,392 705,341 735,687 538,512 648,860 674,730 718,130 755,652 789,018 538,512 672,581 696,598 743,574 795,859 832,797
Recycled Demand, Direct 27,931 38,660 43,728 46,603 48,278 49,998 27,931 38,660 43,728 46,603 48,278 49,998 27,931 38,660 43,728 46,603 48,278 49,998
Non-Firm, Replenishment
Total Demand 566,443 647,285 675,089 717,995 753,619 785,685 566,443 687,520 718,458 764,733 803,930 839,016 566,443 711,241 740,326 790,177 844,137 882,795
MWD Firm Demand 310,027 358,189 230,601 259,694 293,239 323,838 310,027 430,431 305,101 338,501 376,023 409,389 310,027 320,456 324,100 328,695 334,532 341,486
Water SupplyImported, MWD firm 310,027 358,189 230,601 259,694 293,239 323,838 310,027 430,431 305,101 338,501 376,023 409,389 310,027 320,456 324,100 328,695 344,532 341,486
Imported, MWD non-firm
Imported, Other 182,018 180,200 270,200 280,200 280,200 280,200 182,018 180,200 270,200 280,200 280,200 280,200 182,018 180,200 210,200 280,200 280,200 280,200
Groundwater, Potable 10,513 11,710 11,100 12,100 12,840 12,840 10,513 9,977 9,977 9,977 9,977 9,977 10,513 9,977 9,977 9,977 9,977 9,977
Groundwater, Non-Potable
Surface Supply/Storage 27,336 48,206 47,940 47,878 47,542 47,289 27,336 17,932 17,932 17,932 17,932 17,932 27,336 44,950 43,274 46,231 36,711 46,693
Recycled, Direct 27,931 38,660 43,728 46,603 48,278 49,998 27,931 38,660 43,728 46,603 48,278 49,998 27,931 38,660 43,728 46,603 48,278 49,998
Recycled, Indirect
Brackish Water 10,320 10,320 15,520 15,520 15,520 15,520 10,320 10,320 15,520 15,520 15,520 15,520 10,320 10,320 15,520 15,520 15,520 15,520
Seawater 56,000 56,000 56,000 56,000 56,000 56,000 56,000 56,000 56,000 56,000 56,000 56,000
Other 30,000 30,000 6,951 40,000 30,000
Conservation
Total Local 76,100 108,896 174,288 178,101 180,180 181,647 76,100 76,889 143,157 146,032 147,707 149,427 76,100 133,907 198,499 181,282 206,486 208,188
Total Water Supply 568,145 647,285 675,089 717,995 753,619 785,685 568,145 687,520 718,458 764,733 803,930 839,016 568,145 634,563 732,799 790,177 831,218 829,874
Per Capita Water Use GPCPD 158.0 176.6 175.3 178.1 179.0 179.5 158.0 187.6 186.5 189.6 190.9 191.7 158.0 194.1 192.2 196.0 200.5 201.7
Per Capita less Recycled/Non-Firm 150.2 166.1 163.9 166.5 167.5 168.1 150.2 177.0 175.2 178.1 179.5 180.3 150.2 183.5 180.8 184.4 189.0 190.3
NotesGroundwater Recovery shown as brackish water
Other Imported includes water transfers-figure from MWD
Brackish water for 2010 assumed same as 2015
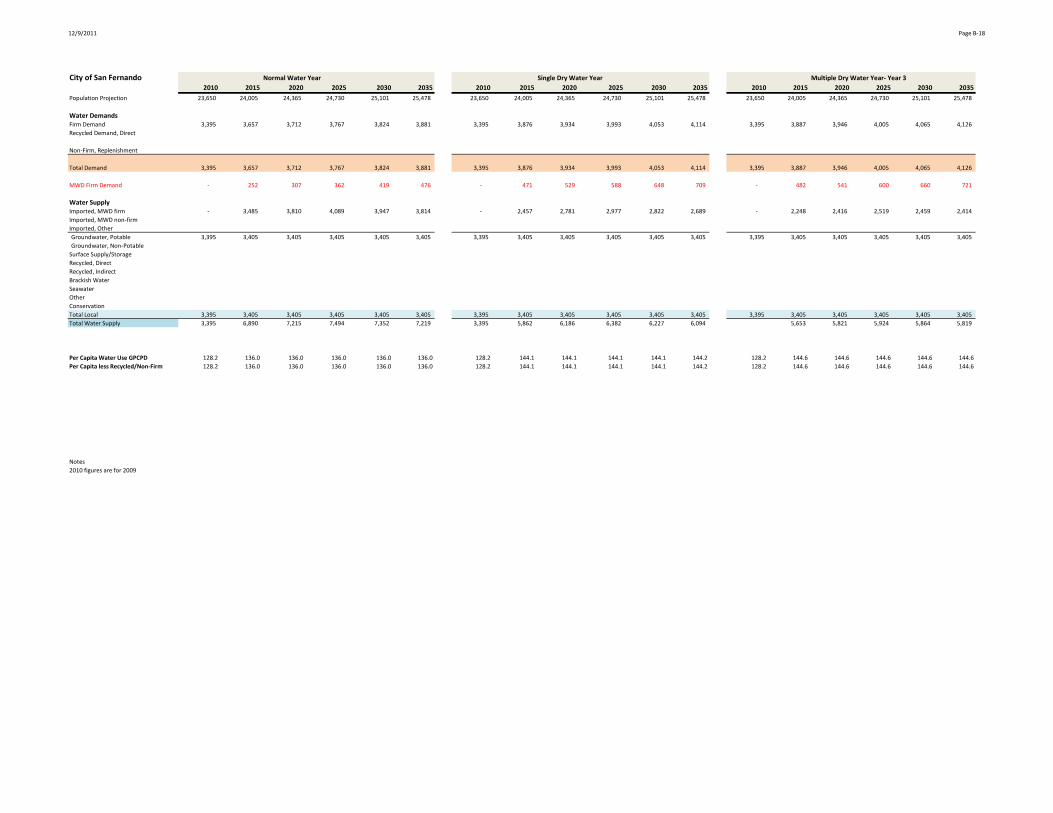
12/9/2011 Page B-18
City of San Fernando Normal Water Year Single Dry Water Year Multiple Dry Water Year- Year 3
2010 2015 2020 2025 2030 2035 2010 2015 2020 2025 2030 2035 2010 2015 2020 2025 2030 2035
Population Projection 23,650 24,005 24,365 24,730 25,101 25,478 23,650 24,005 24,365 24,730 25,101 25,478 23,650 24,005 24,365 24,730 25,101 25,478
Water DemandsFirm Demand 3,395 3,657 3,712 3,767 3,824 3,881 3,395 3,876 3,934 3,993 4,053 4,114 3,395 3,887 3,946 4,005 4,065 4,126
Recycled Demand, Direct
Non-Firm, Replenishment
Total Demand 3,395 3,657 3,712 3,767 3,824 3,881 3,395 3,876 3,934 3,993 4,053 4,114 3,395 3,887 3,946 4,005 4,065 4,126
MWD Firm Demand - 252 307 362 419 476 - 471 529 588 648 709 - 482 541 600 660 721
Water SupplyImported, MWD firm - 3,485 3,810 4,089 3,947 3,814 - 2,457 2,781 2,977 2,822 2,689 - 2,248 2,416 2,519 2,459 2,414
Imported, MWD non-firm
Imported, Other
Groundwater, Potable 3,395 3,405 3,405 3,405 3,405 3,405 3,395 3,405 3,405 3,405 3,405 3,405 3,395 3,405 3,405 3,405 3,405 3,405
Groundwater, Non-Potable
Surface Supply/Storage
Recycled, Direct
Recycled, Indirect
Brackish Water
Seawater
Other
Conservation
Total Local 3,395 3,405 3,405 3,405 3,405 3,405 3,395 3,405 3,405 3,405 3,405 3,405 3,395 3,405 3,405 3,405 3,405 3,405
Total Water Supply 3,395 6,890 7,215 7,494 7,352 7,219 3,395 5,862 6,186 6,382 6,227 6,094 5,653 5,821 5,924 5,864 5,819
Per Capita Water Use GPCPD 128.2 136.0 136.0 136.0 136.0 136.0 128.2 144.1 144.1 144.1 144.1 144.2 128.2 144.6 144.6 144.6 144.6 144.6
Per Capita less Recycled/Non-Firm 128.2 136.0 136.0 136.0 136.0 136.0 128.2 144.1 144.1 144.1 144.1 144.2 128.2 144.6 144.6 144.6 144.6 144.6
Notes
2010 figures are for 2009

12/9/2011 Page B-19
City of San Marino Normal Water Year Single Dry Water Year Multiple Dry Water Year- Year 3
2010 2015 2020 2025 2030 2035 2010 2015 2020 2025 2030 2035 2010 2015 2020 2025 2030 2035
Population Projection
Water DemandsFirm Demand 584 1,054 1,054 1,054 1,054 1,054 584 1,054 1,054 1,054 1,054 1,054 584 1,054 1,054 1,054 1,054 1,054
Recycled Demand, Direct
Non-Firm, Replenishment
Total Demand 584 1,054 1,054 1,054 1,054 1,054 584 1,054 1,054 1,054 1,054 1,054 584 1,054 1,054 1,054 1,054 1,054
MWD Firm Demand 584 1,054 1,054 1,054 1,054 1,054 584 1,054 1,054 1,054 1,054 1,054 584 1,054 1,054 1,054 1,054 1,054
Water SupplyImported, MWD firm
Imported, MWD non-firm
Imported, Other
Groundwater, Potable
Groundwater, Non-Potable
Surface Supply/Storage
Recycled, Direct
Recycled, Indirect
Brackish Water
Seawater
Other
Conservation
Total Local - - - - - - - - - - - - - - - - - -
Total Water Supply - - - - - - - - - - - - - - - - -
Per Capita Water Use GPCPD
Per Capita less Recycled/Non-Firm
Notes

12/9/2011 Page B-20
City of Santa Ana Normal Water Year Single Dry Water Year Multiple Dry Water Year- Year 3
2010 2015 2020 2025 2030 2035 2010 2015 2020 2025 2030 2035 2010 2015 2020 2025 2030 2035
Population Projection 358,136 363,027 367,918 372,809 377,700 382,591 358,136 363,027 367,918 372,809 377,700 382,591 358,136 363,027 367,918 372,809 377,700 382,591
Water DemandsFirm Demand 46,604 47,500 48,100 48,800 49,400 50,100 46,604 50,942 51,585 52,335 52,979 53,729 46,604 50,942 51,585 52,335 52,979 53,729
Recycled Demand, Direct 196 300 300 300 300 300 196 300 300 300 300 300 196 300 300 300 300 300
Non-Firm, Replenishment
Total Demand 46,800 47,800 48,400 49,100 49,700 50,400 46,800 51,242 51,885 52,635 53,279 54,029 46,800 51,242 51,885 52,635 53,279 54,029
MWD Firm Demand 17,710 18,050 18,278 18,544 18,772 19,038 17,710 19,172 19,416 19,701 19,946 20,231 17,710 19,172 19,416 19,701 19,946 20,231
Water SupplyImported, MWD firm 17,710 18,050 18,278 18,544 18,772 19,038 17,710 19,172 19,416 19,701 19,946 20,231 17,710 19,172 19,416 19,701 19,946 20,231
Imported, MWD non-firm
Imported, Other
Groundwater, Potable 28,894 29,450 29,822 30,256 30,628 31,062 28,894 31,770 32,169 32,634 33,033 33,498 28,894 31,770 32,169 32,634 33,033 33,498
Groundwater, Non-Potable
Surface Supply/Storage
Recycled, Direct 196 300 300 300 300 300 196 300 300 300 300 300 196 300 300 300 300 300
Recycled, Indirect
Brackish Water
Seawater
Other
Conservation
Total Local 29,090 29,750 30,122 30,556 30,928 31,362 29,090 32,070 32,469 32,934 33,333 33,798 29,090 32,070 32,469 32,934 33,333 33,798
Total Water Supply 46,800 47,800 48,400 49,100 49,700 50,400 46,800 51,242 51,885 52,635 53,279 54,029 46,800 51,242 51,885 52,635 53,279 54,029
Per Capita Water Use GPCPD 116.7 117.5 117.4 117.6 117.5 117.6 116.7 126.0 125.9 126.0 125.9 126.1 116.7 126.0 125.9 126.0 125.9 126.1
Per Capita less Recycled/Non-Firm 116.2 116.8 116.7 116.9 116.8 116.9 116.2 125.3 125.2 125.3 125.2 125.4 116.2 125.3 125.2 125.3 125.2 125.4
Notes
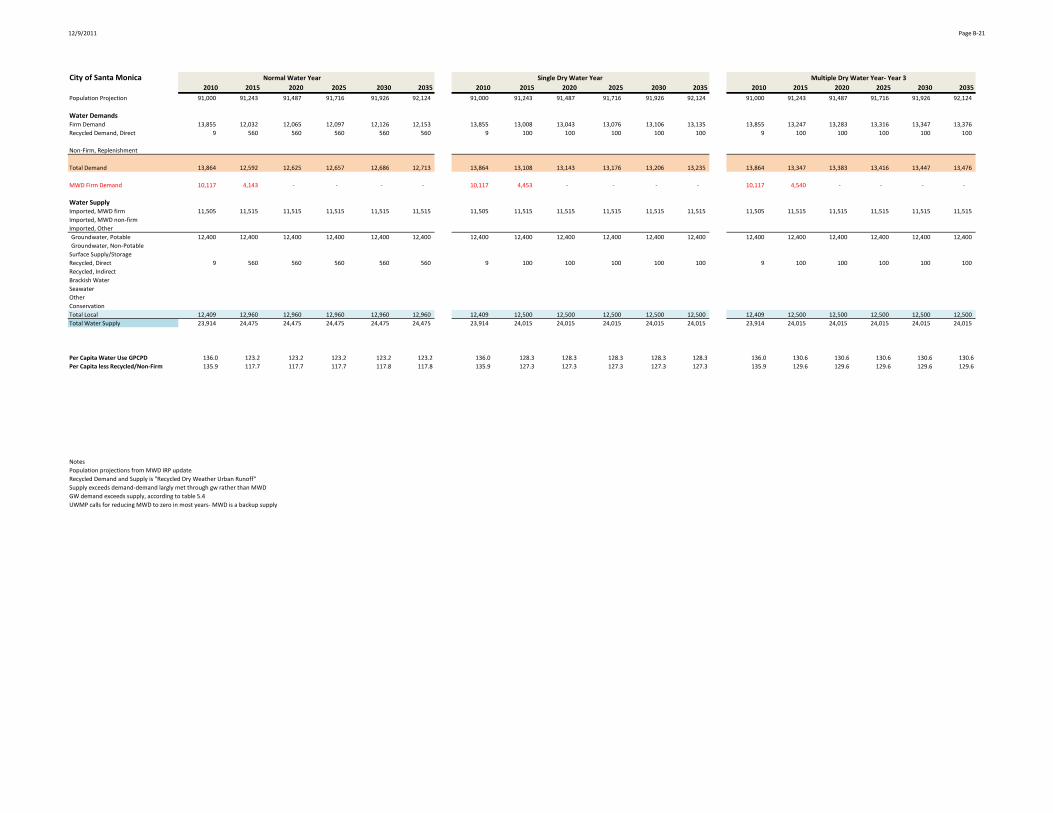
12/9/2011 Page B-21
City of Santa Monica Normal Water Year Single Dry Water Year Multiple Dry Water Year- Year 3
2010 2015 2020 2025 2030 2035 2010 2015 2020 2025 2030 2035 2010 2015 2020 2025 2030 2035
Population Projection 91,000 91,243 91,487 91,716 91,926 92,124 91,000 91,243 91,487 91,716 91,926 92,124 91,000 91,243 91,487 91,716 91,926 92,124
Water DemandsFirm Demand 13,855 12,032 12,065 12,097 12,126 12,153 13,855 13,008 13,043 13,076 13,106 13,135 13,855 13,247 13,283 13,316 13,347 13,376
Recycled Demand, Direct 9 560 560 560 560 560 9 100 100 100 100 100 9 100 100 100 100 100
Non-Firm, Replenishment
Total Demand 13,864 12,592 12,625 12,657 12,686 12,713 13,864 13,108 13,143 13,176 13,206 13,235 13,864 13,347 13,383 13,416 13,447 13,476
MWD Firm Demand 10,117 4,143 - - - - 10,117 4,453 - - - - 10,117 4,540 - - - -
Water SupplyImported, MWD firm 11,505 11,515 11,515 11,515 11,515 11,515 11,505 11,515 11,515 11,515 11,515 11,515 11,505 11,515 11,515 11,515 11,515 11,515
Imported, MWD non-firm
Imported, Other
Groundwater, Potable 12,400 12,400 12,400 12,400 12,400 12,400 12,400 12,400 12,400 12,400 12,400 12,400 12,400 12,400 12,400 12,400 12,400 12,400
Groundwater, Non-Potable
Surface Supply/Storage
Recycled, Direct 9 560 560 560 560 560 9 100 100 100 100 100 9 100 100 100 100 100
Recycled, Indirect
Brackish Water
Seawater
Other
Conservation
Total Local 12,409 12,960 12,960 12,960 12,960 12,960 12,409 12,500 12,500 12,500 12,500 12,500 12,409 12,500 12,500 12,500 12,500 12,500
Total Water Supply 23,914 24,475 24,475 24,475 24,475 24,475 23,914 24,015 24,015 24,015 24,015 24,015 23,914 24,015 24,015 24,015 24,015 24,015
Per Capita Water Use GPCPD 136.0 123.2 123.2 123.2 123.2 123.2 136.0 128.3 128.3 128.3 128.3 128.3 136.0 130.6 130.6 130.6 130.6 130.6
Per Capita less Recycled/Non-Firm 135.9 117.7 117.7 117.7 117.8 117.8 135.9 127.3 127.3 127.3 127.3 127.3 135.9 129.6 129.6 129.6 129.6 129.6
Notes
Population projections from MWD IRP update
Recycled Demand and Supply is "Recycled Dry Weather Urban Runoff"
Supply exceeds demand-demand largly met through gw rather than MWD
GW demand exceeds supply, according to table 5.4
UWMP calls for reducing MWD to zero in most years- MWD is a backup supply

12/9/2011 Page B-22
Three Valleys MWD Normal Water Year Single Dry Water Year Multiple Dry Water Year- Year 3
2010 2015 2020 2025 2030 2035 2010 2015 2020 2025 2030 2035 2010 2015 2020 2025 2030 2035
Population Projection 573,799 600,663 629,479 658,138 685,795 712,264 573,799 600,663 629,479 658,138 685,795 712,264 573,799 600,663 629,479 658,138 685,795 712,264
Water DemandsFirm Demand 117,304 124,980 130,505 133,145 136,149 137,852 117,810 125,525 131,076 133,730 136,748 138,461 117,810 125,300 131,548 134,832 137,829 139,838
Recycled Demand, Direct 5,317 7,272 8,185 8,937 9,623 10,292 5,317 7,272 8,185 8,937 9,623 10,292 5,317 7,062 8,010 8,797 9,487 10,159
Non-Firm, Replenishment 5,000 5,000 6,000 6,000 6,000 6,000 5,000 5,000 6,000 6,000 6,000 6,000 5,000 5,000 5,800 6,000 6,000 6,000
Total Demand 127,621 137,252 144,690 148,082 151,772 154,144 128,127 137,797 145,261 148,667 152,371 154,753 128,127 137,362 145,358 149,629 153,316 155,997
MWD Firm Demand 64,748 72,343 77,864 80,499 83,498 85,197 65,254 72,888 78,435 81,084 84,097 85,806 65,254 72,664 78,907 82,187 85,179 87,184
Water SupplyImported, MWD firm 64,748 72,343 77,864 80,499 83,498 85,197 65,254 72,888 78,435 81,084 84,097 85,806 65,254 72,664 78,907 82,187 85,179 87,184
Imported, MWD non-firm 5,000 5,000 6,000 6,000 6,000 6,000 5,000 5,000 6,000 6,000 6,000 6,000 5,000 5,000 5,800 6,000 6,000 6,000
Imported, Other
Groundwater, Potable 46,056 46,137 46,141 46,146 46,151 46,155 46,056 46,137 46,141 46,146 46,151 46,155 46,056 46,136 46,141 46,145 46,150 46,154
Groundwater, Non-Potable
Surface Supply/Storage 6,500 6,500 6,500 6,500 6,500 6,500 6,500 6,500 6,500 6,500 6,500 6,500 6,500 6,500 6,500 6,500 6,500 6,500
Recycled, Direct 5,317 7,272 8,185 8,937 9,623 10,292 5,317 7,272 8,185 8,937 9,623 10,292 5,317 7,062 8,010 8,797 9,487 10,159
Recycled, Indirect
Brackish Water
Seawater
Other
Conservation
Total Local 57,873 59,909 60,826 61,583 62,274 62,947 57,873 59,909 60,826 61,583 62,274 62,947 57,873 59,698 60,651 61,442 62,137 62,813
Total Water Supply 127,621 137,252 144,690 148,082 151,772 154,144 128,127 137,797 145,261 148,667 152,371 154,753 137,362 145,358 149,629 153,316 155,997
Conservation from UWMP 19,199 20,381 20,908 23,165 25,306 27,326 19,199 20,381 20,908 23,165 25,306 27,326 19,199 20,381 20,908 23,165 25,306 27,326
Per Capita Water Use GPCPD 198.6 204.0 205.2 200.9 197.6 193.2 199.3 204.8 206.0 201.7 198.4 194.0 199.3 204.2 206.1 203.0 199.6 195.5
Per Capita less Recycled/Non-Firm 182.5 185.8 185.1 180.6 177.2 172.8 183.3 186.6 185.9 181.4 178.0 173.5 183.3 186.2 186.6 182.9 179.4 175.3
Notes
Population Projections from SCAG and SGV Council of Governments
Conservation is 1990 base year
Retail Ag is included in firm demand
Groundwater and Groundwater Recover are combined

12/9/2011 Page B-23
City of Torrance Normal Water Year Single Dry Water Year Multiple Dry Water Year- Year 3
2010 2015 2020 2025 2030 2035 2010 2015 2020 2025 2030 2035 2010 2015 2020 2025 2030 2035
Population Projection 113,500 114,114 114,738 115,362 115,986 116,610 113,500 114,114 114,738 115,362 115,986 116,610 113,500 114,114 114,738 115,362 115,986 116,610
Water DemandsFirm Demand 18,758 20,368 20,882 21,409 21,950 22,604 18,758 21,997 22,552 23,122 23,706 24,304 18,758 21,793 22,343 22,908 23,486 24,079
Recycled Demand, Direct 6,445 6,500 6,650 7,150 7,150 7,150 6,445 6,500 6,650 7,150 7,150 7,250 6,445 6,500 6,650 7,150 7,150 7,150
Non-Firm, Replenishment
Total Demand 25,203 26,868 27,532 28,559 29,100 29,754 25,203 28,497 29,202 30,272 30,856 31,554 25,203 28,293 28,993 30,058 30,636 31,229
MWD Firm Demand 16,471 12,328 12,842 13,369 13,910 14,464 16,471 13,957 14,512 15,082 15,666 16,264 16,471 13,753 14,303 14,868 15,446 16,039
Water SupplyImported, MWD firm 16,471 20,967 20,967 20,967 20,967 20,967 16,471 15,799 18,677 20,406 19,613 18,867 16,471 13,822 15,884 16,509 16,234 16,152
Imported, MWD non-firm
Imported, Other
Groundwater, Potable 1,564 5,640 5,640 5,640 5,640 5,640 1,564 5,640 5,640 5,640 5,640 5,640 1,564 5,640 5,640 5,640 5,640 5,640
Groundwater, Non-Potable
Surface Supply/Storage
Recycled, Direct 6,445 6,500 6,650 7,150 7,150 7,150 6,445 6,500 6,650 7,150 7,150 7,250 6,445 6,500 6,650 7,150 7,150 7,150
Recycled, Indirect
Brackish Water 1,106 2,400 2,400 2,400 2,400 2,400 1,106 2,400 2,400 2,400 2,400 2,400 1,106 2,400 2,400 2,400 2,400 2,400
Seawater
Other
Conservation
Total Local 9,115 14,540 14,690 15,190 15,190 15,190 9,115 14,540 14,690 15,190 15,190 15,290 9,115 14,540 14,690 15,190 15,190 15,190
Total Water Supply 25,586 35,507 35,657 36,157 36,157 36,157 25,586 30,339 33,367 35,596 34,803 34,157 25,586 28,362 30,574 31,699 31,424 31,342
Per Capita Water Use GPCPD 198.2 210.2 214.2 221.0 224.0 227.8 198.2 222.9 227.2 234.3 237.5 241.6 198.2 221.3 225.6 232.6 235.8 239.1
Per Capita less Recycled/Non-Firm 147.5 159.3 162.5 165.7 168.9 173.1 147.5 172.1 175.5 178.9 182.5 186.1 147.5 170.5 173.8 177.3 180.8 184.3
Notes
Groundwater supply will be fully utilized to meet demand
Desalter supply will be full utilized to meet demand
Reclaimed supply will be full utilized to meet reclaimed demand
Imported supply is greater than imported demand
2010 figures from table 4.1

12/9/2011 Page B-24
USG Valley MWD Normal Water Year Single Dry Water Year Multiple Dry Water Year- Year 3
2010 2015 2020 2025 2030 2035 2010 2015 2020 2025 2030 2035 2010 2015 2020 2025 2030 2035
Population Projection 903,000 935,000 966,000 996,000 1,025,000 1,025,000 903,000 935,000 966,000 996,000 1,025,000 1,025,000 903,000 935,000 966,000 996,000 1,025,000 1,025,000
Water DemandsFirm Demand 157,101 162,739 146,118 148,495 150,747 150,747 157,101 162,739 146,118 148,495 150,747 150,747 157,101 162,739 146,118 148,495 150,747 150,747
Recycled Demand, Direct 6,000 7,500 10,000 12,500 15,000 15,000 6,000 7,500 10,000 12,500 15,000 15,000 6,000 7,500 10,000 12,500 15,000 15,000
Non-Firm, Replenishment 25,000 16,000 19,000 23,000 23,000
Total Demand 163,101 195,239 172,118 179,995 188,747 188,747 163,101 170,239 156,118 160,995 165,747 165,747 163,101 170,239 156,118 160,995 165,747 165,747
MWD Firm Demand 22,633 3,000 3,000 3,000 3,000 3,000 22,633 28,000 19,000 22,000 26,000 26,000 22,633 28,000 19,000 22,000 26,000 26,000
Water SupplyImported, MWD firm 5,700 3,000 3,000 3,000 3,000 3,000 32,000 31,000 45,000 43,000 41,000 41,000 32,000 31,000 45,000 43,000 41,000 41,000
Imported, MWD non-firm 21,000 25,000 16,000 19,000 23,000 23,000
Imported, Other
Groundwater, Potable
Groundwater, Non-Potable
Surface Supply/Storage
Recycled, Direct 6,000 7,500 10,000 12,500 15,000 15,000 6,000 7,500 10,000 12,500 15,000 15,000 6,000 7,500 10,000 12,500 15,000 15,000
Recycled, Indirect
Brackish Water
Seawater
Other
Conservation
Total Local 6,000 7,500 10,000 12,500 15,000 15,000 6,000 7,500 10,000 12,500 15,000 15,000 6,000 7,500 10,000 12,500 15,000 15,000
Total Water Supply 32,700 35,500 29,000 34,500 41,000 41,000 38,000 38,500 55,000 55,500 56,000 56,000 38,000 38,500 55,000 55,500 56,000 56,000
Conservation from UWMP
Per Capita Water Use GPCPD 161.2 186.4 159.1 161.3 164.4 164.4 161.2 162.5 144.3 144.3 144.4 144.4 161.2 162.5 144.3 144.3 144.4
Per Capita less Recycled/Non-Firm 155.3 155.4 135.0 133.1 131.3 131.3 155.3 155.4 135.0 133.1 131.3 131.3 155.3 155.4 135.0 133.1 131.3
Potential SuppliesRecycled for GW Replenishment 5,000 5,000 10,000 10,000
Notes
Plan goes through 2030 only; 2035 is assumed the same as 2030
MWD Demand in red is firm demand only
Plan show non-firm demands in dry and multiple dry years. These supplies are included as firm demands in this table.

12/9/2011 Page B-25
West Basin MWD Normal Water Year Single Dry Water Year Multiple Dry Water Year- Year 3
2010 2015 2020 2025 2030 2035 2010 2015 2020 2025 2030 2035 2010 2015 2020 2025 2030 2035
Population Projection 853,377 874,219 892,116 909,498 926,592 942,893 853,377 874,219 892,116 909,498 926,592 942,893 853,377 874,219 892,116 909,498 926,592 942,893
Water DemandsFirm Demand 140,805 160,647 143,297 141,886 137,098 136,261 140,805 167,728 150,384 148,917 144,077 143,207 140,805 160,078 152,162 151,342 146,437 145,369
Recycled Demand, Direct 14,182 16,368 33,882 33,882 37,382 37,382 14,182 16,368 33,882 33,882 37,382 37,382 14,182 16,368 33,882 33,882 37,382 37,382
Non-Firm, Replenishment 22,980 20,480 20,480 20,480 20,480 20,480 7,706 16,980 16,980 16,980 20,480 20,480 7,706 16,980 16,980 16,980 20,480 20,480
Total Demand 177,967 197,495 197,659 196,248 194,960 194,123 162,693 201,076 201,246 199,779 201,939 201,069 162,693 193,426 203,024 202,204 204,299 203,231
MWD Firm Demand 104,985 114,647 76,797 75,386 70,598 69,761 111,246 121,728 83,884 82,417 77,577 76,707 111,246 114,078 85,662 84,842 79,937 78,869
Water SupplyImported, MWD firm 104,985 114,647 76,797 75,386 70,598 69,761 111,246 121,728 83,884 82,417 77,577 76,707 111,246 114,078 85,662 84,842 79,937 78,869
Imported, MWD non-firm 15,274 3,500 3,500 3,500
Imported, Other
Groundwater, Potable 35,320 45,000 45,000 45,000 45,000 45,000 35,320 45,000 45,000 45,000 45,000 45,000 36,360 45,000 45,000 45,000 45,000 45,000
Groundwater, Non-Potable
Surface Supply/Storage
Recycled, Direct 14,182 16,368 33,882 33,882 37,382 37,382 14,182 16,368 33,882 33,882 37,382 37,382 14,182 16,368 33,882 33,882 37,382 37,382
Recycled, Indirect 7,706 16,980 16,980 16,980 20,480 20,480 7,706 16,980 16,980 16,980 20,480 20,480 7,706 16,980 16,980 16,980 20,480 20,480
Brackish Water
Seawater 500 1,000 21,500 21,500 21,500 21,500 500 1,000 21,500 21,500 21,500 21,500 1,000 1,000 21,500 21,500 21,500 21,500
Other
Conservation
Total Local 57,708 79,348 117,362 117,362 124,362 124,362 57,708 79,348 117,362 117,362 124,362 124,362 59,248 79,348 117,362 117,362 124,362 124,362
Total Water Supply 177,967 197,495 197,659 196,248 194,960 194,123 168,954 201,076 201,246 199,779 201,939 201,069 170,494 193,426 203,024 202,204 204,299 203,231
Conservation from UWMP 14,000 15,119 21,039 21,640 22,971 23,632 14,000 15,119 21,039 21,640 22,971 23,632 14,000 15,119 21,039 21,640 22,971 23,632
Per Capita Water Use GPCPD 186.2 201.7 197.8 192.6 187.8 183.8 170.2 205.3 201.4 196.1 194.6 190.4 170.2 197.5 203.2 198.5 196.8 192.4
Per Capita less Recycled/Non-Firm 147.3 164.1 143.4 139.3 132.1 129.0 147.3 171.3 150.5 146.2 138.8 135.6 147.3 163.5 152.3 148.6 141.1 137.6
Notes
Replenishment demands( IW and RW) are from Table 3-5, but not shown on tables 5-3 to 5-5
Desalination includes brackish and ocean water
Recycled does not include replenishment or deliveries to others

12/9/2011 Page B-26
Western MWD Normal Water Year Single Dry Water Year Multiple Dry Water Year- Year 3
2010 2015 2020 2025 2030 2035 2010 2015 2020 2025 2030 2035 2010 2015 2020 2025 2030 2035
Population Projection 85,469 98,812 112,157 126,524 142,732 161,016 85,469 98,812 112,157 126,524 142,732 161,016 85,469 98,812 112,157 126,524 142,732 161,016
Total Demand in Service Area w/ cons
Water DemandsFirm Demand 84,684 117,520 122,362 132,444 141,804 151,751 84,684 132,943 138,487 149,953 160,675 172,062 84,684 132,943 138,487 149,953 160,675 172,062
Recycled Demand, Direct 950 1,120 1,680 2,240 3,360 4,480 950 1,120 1,680 2,240 3,360 4,480 950 1,120 1,680 2,240 3,360 4,480
Non-Firm, Replenishment
Total Demand 85,634 118,640 124,042 134,684 145,164 156,231 85,634 134,063 140,167 152,193 164,035 176,542 85,634 134,063 140,167 152,193 164,035 176,542
MWD Firm Demand 79,064 99,970 103,812 113,894 123,254 133,201 79,064 109,633 105,177 116,643 127,365 138,752 79,064 115,633 120,177 131,643 142,365 153,752
Water SupplyImported, MWD firm 131,228 160,313 174,127 184,131 195,301 208,035 131,228 160,313 174,127 184,131 195,301 208,035 131,228 160,313 174,127 184,131 195,301 208,035
Imported, MWD non-firm
Imported, Other
Groundwater, Potable 1,000 2,600 3,600 3,600 3,600 3,600 1,000 2,360 3,360 3,360 3,360 3,360 1,000 2,360 3,360 3,360 3,360 3,360
Groundwater, Non-Potable
Surface Supply/Storage 6,000 6,000 15,000 15,000 15,000 15,000 6,000 6,000 15,000 15,000 15,000 15,000 6,000 6,000 15,000 15,000 15,000 15,000
Recycled, Direct 950 1,120 1,680 2,240 3,360 4,480 950 1,120 1,680 2,240 3,360 4,480 950 1,120 1,680 2,240 3,360 4,480
Recycled, Indirect
Brackish Water 6,400 10,750 10,750 10,750 10,750 10,750 6,400 10,750 10,750 10,750 10,750 10,750 6,400 10,750 10,750 10,750 10,750 10,750
Seawater
Other 6,200 6,200 6,200 6,200 6,200 6,200 6,200 6,200 6,200 6,200 6,200 6,200 6,200 6,200 6,200 6,200 6,200 6,200
Conservation
Total Local 20,550 26,670 37,230 37,790 38,910 40,030 20,550 26,430 36,990 37,550 38,670 39,790 20,550 26,430 36,990 37,550 38,670 39,790
Total Water Supply 151,778 186,983 211,357 221,921 234,211 248,065 151,778 186,743 211,117 221,681 233,971 247,825 151,778 186,743 211,117 221,681 233,971 247,825
Conservation from UWMP 11,021 21,685 23,227 24,728 26,377 12,453 24,504 26,246 27,943 29,806 12,453 24,504 26,246 27,943 29,806
Per Capita Water Use GPCPD 894.5 1071.9 987.3 950.3 908.0 866.2 894.5 1211.2 1115.7 1073.9 1026.0 978.8 894.5 1211.2 1115.7 1073.9 1026.0 978.8
Per Capita less Recycled/Non-Firm 884.5 1061.8 974.0 934.5 886.9 841.4 884.5 1201.1 1102.3 1058.1 1005.0 954.0 884.5 1201.1 1102.3 1058.1 1005.0 954.0
Notes
Population is for retail area only. Per capita numbers cannot be calculated
Supplies exceed demands in all cases
Recycled water demand is 950 AFY, per Table 3-11
Demand provided to MWD appears to exceed actual demands
MWD Demand in 2010 from Delivery summary from MWD- Appears to be a conflict from table ES-2
Other includes purchases from Meeks, Daley and City of Riverside
Existing and Planned supplies are combined, as they appear certain
Verify to see if above includes conservation
2010 MWD Demand includes agriculture
2010 Total demand from Table 2-4

12/9/2011 Page B-27
Totals Normal Water Year Single Dry Water Year Multiple Dry Water Year- Year 3
2010 2015 2020 2025 2030 2035 2010 2015 2020 2025 2030 2035 2010 2015 2020 2025 2030 2035
Population Projection-Million 18.773 19.443 20.097 20.746 21.317 18.773 19.443 20.097 20.746 21.317 18.773 19.443 20.097 20.746 21.317
Water DemandsFirm Demand 3,136,860 3,434,163 3,491,040 3,587,828 3,679,933 3,758,264 3,141,873 3,580,679 3,647,345 3,750,805 3,851,210 3,934,684 3,141,873 3,575,159 3,644,053 3,766,814 3,888,150 3,980,805
Recycled Demand, Direct 194,606 263,182 317,751 351,352 368,939 377,446 194,871 265,460 320,454 354,390 372,311 380,967 194,871 269,083 323,651 357,312 374,465 384,411
Non-Firm, Replenishment 30,014 73,580 63,980 81,780 93,180 100,580 14,740 24,080 23,480 38,280 49,180 56,580 14,740 24,080 23,280 23,280 26,680 26,580
Total Demand 3,361,480 3,770,925 3,872,771 4,020,960 4,142,052 4,236,290 3,351,484 3,870,219 3,991,279 4,143,475 4,272,701 4,372,231 3,351,484 3,868,322 3,990,985 4,147,406 4,289,295 4,391,796
MWD Firm Demand 1,580,579 1,717,165 1,561,752 1,612,426 1,690,853 1,750,335 1,593,236 2,119,650 1,947,778 2,006,438 2,096,558 2,156,846 1,593,296 1,931,006 1,906,190 1,935,301 1,991,160 2,026,004
Water SupplyImported, MWD firm 1,616,814 1,837,507 1,701,770 1,753,168 1,827,038 1,883,305 1,655,571 2,191,281 2,071,911 2,126,058 2,203,469 2,262,874 1,655,631 1,986,530 2,004,009 2,026,855 2,084,122 2,107,718
Imported, MWD non-firm 43,308 56,600 47,000 49,800 50,200 50,100 7,034 7,100 6,500 6,300 6,200 6,100 7,034 7,100 6,300 6,300 6,200 6,100
Imported, Other 182,018 220,200 310,200 320,200 320,200 320,200 182,018 220,200 310,200 320,200 320,200 320,200 182,018 220,200 250,200 320,200 320,200 320,200
Groundwater, Potable 939,880 982,900 1,036,471 1,064,730 1,076,011 1,089,675 939,870 1,014,373 1,070,770 1,099,444 1,110,988 1,126,548 940,910 1,003,522 1,062,650 1,092,445 1,102,957 1,118,388
Groundwater, Non-Potable 7,068 7,331 7,734 8,132 8,730 9,328 7,615 7,928 8,530 8,925 9,620 10,215 7,615 7,670 8,270 8,665 9,355 9,950
Surface Supply/Storage 73,353 97,676 106,410 106,348 106,012 105,759 71,633 46,024 55,024 55,024 55,024 55,024 71,573 86,087 93,411 96,368 86,848 96,830
Recycled, Direct 194,606 269,382 324,651 353,252 370,839 379,346 194,871 271,660 327,354 356,290 374,211 382,867 194,871 275,283 330,551 359,212 376,365 385,311
Recycled, Indirect 7,706 24,188 36,980 52,980 63,980 71,480 7,706 24,188 36,980 52,980 63,980 71,480 7,706 24,188 36,980 52,980 63,980 71,480
Brackish Water 39,150 62,202 67,935 67,943 67,951 67,960 39,150 62,218 67,968 67,993 68,019 68,046 39,150 62,109 68,001 68,045 68,091 68,140
Seawater 500 1,000 77,500 82,500 82,500 87,500 500 1,000 77,500 82,500 82,500 87,500 1,000 1,000 77,500 82,500 82,500 87,500
Other 213,147 288,368 275,556 273,870 273,655 272,360 213,147 84,888 73,239 73,153 74,548 74,863 213,147 175,876 165,042 142,438 177,451 168,226
Conservation - - - - - - - - - - - - - - - - - -
Total Local 1,475,410 1,733,047 1,933,237 2,009,755 2,049,678 2,083,408 1,474,492 1,512,279 1,717,365 1,796,309 1,838,890 1,876,543 1,475,972 1,635,734 1,842,405 1,902,653 1,967,547 2,005,825
Total Water Supply 3,317,550 3,847,354 3,992,207 4,132,923 4,247,116 4,337,013 3,319,115 3,930,860 4,105,976 4,248,867 4,368,759 4,465,717 3,320,655 3,849,564 4,102,914 4,256,008 4,378,069 4,439,843