comparison of monoterpene oil composition and volatile
TRANSCRIPT

Comparison of monoterpene oil composition and volatile emissions
from ponderosa and Austrian pine
Jenny Eav
Academic Affiliation, Fall 2011: Los Angeles City College and East Los Angeles College
SOARS® Summer 2011
Science Research Mentor: Jim Greenberg
Writing and Communication Mentor: Anne Smith
Community Mentor: Wendy Abshire
Peer Mentor: Raymond Detweiler
ABSTRACT
Monoterpenes (C10H16) are volatile organic compounds (VOCs) naturally emitted into the
atmosphere from vegetation, especially flowering plants and conifers. VOCs play a role in
controlling atmospheric chemistry and they participate in the formation of air pollutants, such as
ozone. Monoterpene emissions from vegetation are species-specific and strongly dependent on
temperature. There have been no detailed studies that correlate monoterpene emissions into the
atmosphere with monoterpenes found in storage reservoirs in plant foliage nor are there detailed
studies that describe the variability of monoterpene composition within individual plants and
between plants of the same species. Using a gas chromatograph equipped with a mass
spectrometer and flame ionization detector, this study surveyed the variation in concentration
and composition of monoterpenes in Pinus ponderosa and Pinus nigra needles to determine (1)
whether variation occurs between needle orientation (e.g., north-, east-, west-, south-facing) or
needle age within individual trees (new, one-, and two-year-old needles); (2) whether variation
of oil composition exists among different trees of the same species, and (3) whether differences
occur between monoterpene composition stored within needles and emissions. Results show that
compositions and concentrations did not differ in samples taken from different positions within a
tree, but they do differ between age groups in ponderosa pine. Additionally, sabinene and
myrcene were found in emission samples in the presence of light, but not in monoterpene pools
of Austrian pine needles, suggesting that they are produced and emitted immediately and not
stored. Future study will develop a numerical model for emissions incorporating temperature and
concentrations.
The Significant Opportunities in Atmospheric Research and Science (SOARS) Program is managed by the University
Corporation for Atmospheric Research (UCAR) with support from participating universities. SOARS is funded by the National
Science Foundation, the National Oceanic and Atmospheric Administration (NOAA) Climate Program Office, the NOAA Oceans
and Human Health Initiative, the Center for Multi-Scale Modeling of Atmospheric Processes at Colorado State University, and
the Cooperative Institute for Research in Environmental Sciences.

SOARS®
2011, Jenny Eav, 2
1. Introduction
Non-methane volatile organic compounds (NMVOCs) are photochemical oxidant
precursors important to controlling atmospheric chemistry (Fuentes et al., 2000; Guenther et al.,
1995; Tingey et al., 1990; Kesselmeier and Staudt, 1999). For instance, powered by light,
volatile organic compounds will react with nitrogen oxides, NOx, to produce air pollutants like
ozone and carbon monoxide. NMVOCs are released into the atmosphere from both natural and
anthropogenic sources. While anthropogenic sources tend to be the major source within urban
areas, about 90% of global NMVOC emissions are attributed to natural sources (Tingey et al.,
1990). Some NMVOCs, such as monoterpenes (C10H16), are emitted naturally from flowering
plants and conifers, like Pinus ponderosa, as a part of the carbon cycle and a plant’s defense
against herbivores and pathogens (Lerdau et al., 1997; Latta et al., 2000). It is estimated that
about 1.2 Tg C is emitted from vegetation each year (Guenther et al., 1995). Other natural
sources include emissions from decomposition of organic matter or other microbial processes
(Guenther et al., 2000; Fuentes et al., 2000). Fossil fuel combustion, industrial processes and
waste are the most important anthropogenic sources of NMVOCs.
To accurately estimate and model regional and global NMVOC emissions, the factors
that affect their emission must be understood, especially factors that affect emissions from
vegetation. Several studies have focused on the environmental factors that influence
monoterpene emissions from vegetation (Tingey et al., 1980). Environmental factors that
influence terpene emission may include temperature, light intensity and water availability.
Guenther et al. (2000) found that biogenic isoprene emissions increased with temperature.
Similarly, Tingey et al. (1980) showed that there was a log-linear relationship between
monoterepene emissions and temperature in slash pine. This relationship suggests that there will
be a net increase in some biogenic NMVOCs with increases in atmospheric temperatures.
Additionally, light may indirectly influence the emission rate of monoterpene (Tingey et al.,
1990). As Fuentes et al. (2000) discuss, when there is a lack of water, isoprene emission
increases but monoterpene emissions rate does not change.
Current models of emissions are based on estimations and measurements from the ocean,
i.e. from algae, and terrestrial vegetation (Guenther, et al., 1995). Emission models from
terrestrial vegetation extrapolate leaf level enclosure and local above-canopy flux measurements
to estimate regional and global emissions. They are also based on geography, local biomass data
and ecosystem type but there are large uncertainties with these estimates. For instance, in one
approach, ecosystem types are assigned emission rates where terpene flux measurements are
available. Areas where flux information is not available must be assigned a default emission
estimate. However, since emissions are species specific, it is challenging to estimate emissions
for those areas. Consequently, estimates of the landscape terpene emissions are limited by lack of
information about the vegetation present.
Though there has been substantial progress made in understanding the role of
environmental factors on biogenic NMVOCs, there are gaps in knowledge about several other
factors that may control emissions, such as foliage age and position as well as the composition of
terpenes within the leaf or needle. This study attempted to close that gap by comparing the
composition of monoterpenes in pine needles to monoterpene emissions. Incorporating
information about the amount of monoterpenes stored in pine needles and the factors that affect

SOARS®
2011, Jenny Eav, 3
their composition will improve the measurement database used for developing emission models.
The objectives of this research were to (a) determine whether variation in monoterpene
composition occurs between different pine needle orientations, e.g. north-, south-, west- or east-
facing, and between different needle age groups; (b) determine whether composition differs from
tree to tree in the same species; and (c) determine whether there is a difference between
composition of monoterpenes in the needle oil and emission rates. The monoterpenes in the pine
needles were identified by matching experimental mass spectra against a pre-existing library of
mass spectra and the concentration of each monoterpene found in the oils of the pine needles
were quantified by using FID data and n-nonane as an internal standard. Ultimately, the goal will
be to produce a numerical model to estimate monoterpene emission rates from one pine tree and
extrapolate to larger areas.
2. Methods
a. Site selection
This study focused on Ponderosa and Austrian pine. Ponderosa pine is a major
constituent in the western regions of North America (Latta et al., 2000). Our first site was in
Manitou Experimental Forest, a research area 48 km northwest of Colorado Springs, Colorado, at
about 8,000 feet elevation. The Manitou Experimental Forest has been the site of a number of
Ponderosa ecosystem studies since the 1980s (Adams et al., 2004). Two ponderosa pine trees
were selected from this site.
The second area of study was the National Center for Atmospheric Research (NCAR)
Foothill campus. The species at this site were Austrian pine trees (Pinus nigra). Eight pine trees
were selected from this site for study.
b. Analytical techniques for needle oil
Several samples with different branch orientation and of different age groups within
individual trees were taken. For Austrian pine, two trees were selected and one-year-old needles
easily accessible from within five feet from the ground from four branches facing north, east,
west and south were taken. For ponderosa pines, two branches facing south and two facing north
were selected from each of the two trees. Current year, one-year-old and two-year-old needles
from those four branches were taken. To test for variability from tree to tree, new needles, one-
year-old, and two-year-old needles were taken from the eight Austrian pine trees.
All the samples were ground in liquid nitrogen and the oils were extracted in 5-mL
cyclohexane, with n-nonane as an internal standard (150 ppmv). It took about five days to extract
all the monoterpenes from fresh needles. Once complete, 1 L from each extract was analyzed
with a gas chromatograph (HP 5890 Series II) equipped with a mass spectrometer (HP 5972
Series) and flame ionization detector (GC-MS/FID). A Restek Rtx-5Sil MS (30m column,
0.25 mmID, 0.25 m film thickness) fused silica capillary column was used in the oven to
separate compounds. A 0.25 mmID deactivated silica tube was used to split and send the flow
into the MS and FID. The GC oven was programmed to hold the sample at 50C for 2 minutes
and then heat at a 6C/min ramp to 275C, where it was held for 3 additional minutes. Each peak

SOARS®
2011, Jenny Eav, 4
was identified by comparing the output MS spectrum to a library of MS spectra. The signal
peaks from the FID were integrated and concentration of each monoterpene was calculated.
c. Calibration
We calculated the response factor for n-nonane, our internal standard, and used it to
calculate the concentration of each monoterpene in the needle samples. We also prepared an
external standard containing n-nonane, α-pinene, β-pinene and caryophyllene to confirm
concentrations of each monoterpene.
d. Gas-phase emission sampling and analysis
We used a dynamic, flow-through leaf gas exchange system (MPH-1000, Campbell
Scientific, Logan, UT, USA) with a custom-built, temperature-controlled glass cuvette
(volume = 400 cm3) to measure emissions of monoterpenes from the Austrian pine trees on
NCAR’s Foothill campus. We isolated and enclosed a small branch in the cuvette and introduced
hydrocarbon-free air at a known flow rate. As air enriched with monoterpenes and other biogenic
VOCs exited the cuvette, the VOCs were trapped on adsorbent material (200 mg Tenax GR and
200 mg Carograf 5; Markes Int., Llantrisant, UK) in a stainless steel sample tube. All
measurements were made at 30C (leaf temperature) and either in high light (photosynthetic
photon flux density (PPFD) > 1000 mmol m-2
s-1
) or in the dark. A red-blue LED source
(Hydroponic 90 Watt UFO LED Grow Light) was used as the source of light.
After drawing approximately 4-5 liters of air through the sample tube using a small pump
and a mass flow controller, the sample tubes were desorbed using heat. They were heated to
270C in an automated thermal desorption system (Unity, Markes Int.). The collected VOCs
were analyzed by gas chromatography coupled to a mass spectrometer and flame ionization
detector (GC-MS-FID; Model 7890A, Agilent Technologies, Santa Clara, CA, USA). After
quantifying each of the monoterpene collected, individual monoterpene emission rates (ER;
g monoterpene g-1
dry weight of needles h-1
) were calculated using the following formula,
[ ]
where air flow rate was measured in mol h-1
, the concentration of each monoterpene in
mol mol-1
, the molecular weight in g mol-1
and dry weight in grams.
After measuring emissions, the needles in the cuvette were collected and the oils in the
needles were analyzed using analytical techniques described in part b.
e. Statistical Analysis
In the analysis, we looked at the variation in monoterpene concentrations (the total
amount of monoterpenes in needle samples). Using an ANOVA, we first tested for differences
among the different needle age groups and orientation of the branches within a tree. Second, we
tested for differences between trees.
SOARS®
2011, Jenny Eav, 5
3. Results
a. Variability within trees
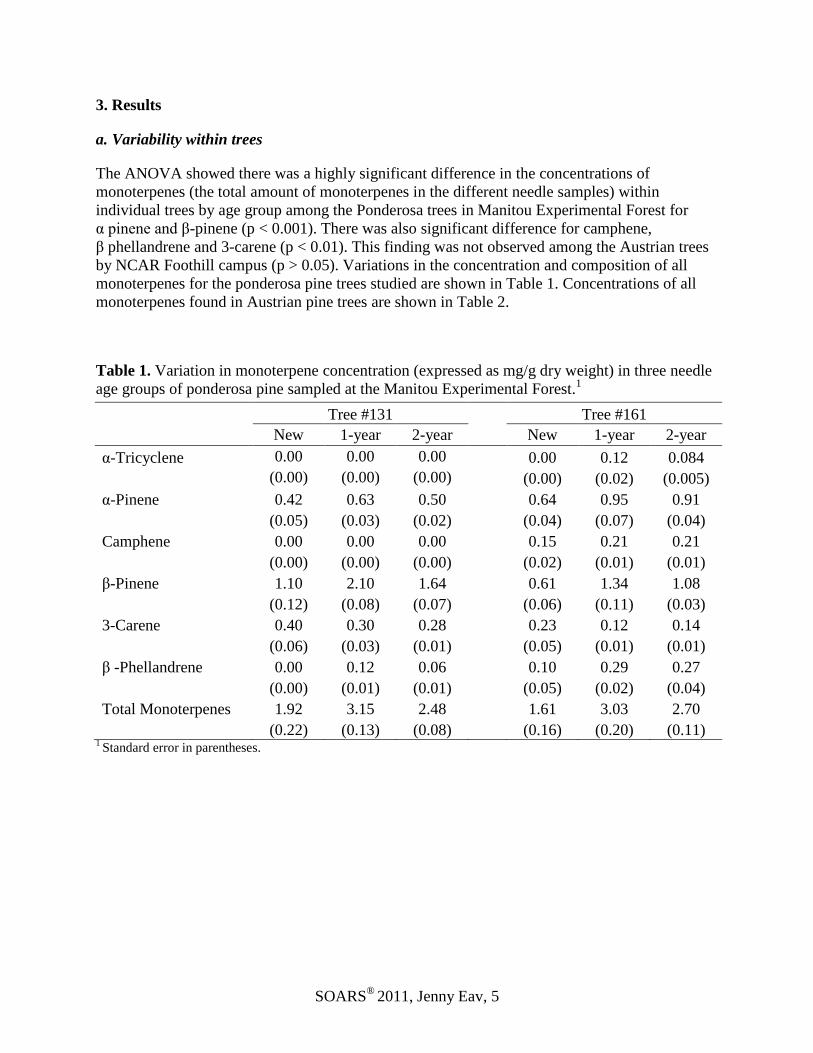
The ANOVA showed there was a highly significant difference in the concentrations of
monoterpenes (the total amount of monoterpenes in the different needle samples) within
individual trees by age group among the Ponderosa trees in Manitou Experimental Forest for
α pinene and β-pinene (p < 0.001). There was also significant difference for camphene,
β phellandrene and 3-carene (p < 0.01). This finding was not observed among the Austrian trees
by NCAR Foothill campus (p > 0.05). Variations in the concentration and composition of all
monoterpenes for the ponderosa pine trees studied are shown in Table 1. Concentrations of all
monoterpenes found in Austrian pine trees are shown in Table 2.
Table 1. Variation in monoterpene concentration (expressed as mg/g dry weight) in three needle
age groups of ponderosa pine sampled at the Manitou Experimental Forest.1
Tree #131 Tree #161
New 1-year 2-year New 1-year 2-year
α-Tricyclene 0.00 0.00 0.00 0.00 0.12 0.084
(0.00) (0.00) (0.00) (0.00) (0.02) (0.005)
α-Pinene 0.42 0.63 0.50 0.64 0.95 0.91
(0.05) (0.03) (0.02) (0.04) (0.07) (0.04)
Camphene 0.00 0.00 0.00 0.15 0.21 0.21
(0.00) (0.00) (0.00) (0.02) (0.01) (0.01)
β-Pinene 1.10 2.10 1.64 0.61 1.34 1.08
(0.12) (0.08) (0.07) (0.06) (0.11) (0.03)
3-Carene 0.40 0.30 0.28 0.23 0.12 0.14
(0.06) (0.03) (0.01) (0.05) (0.01) (0.01)
β -Phellandrene 0.00 0.12 0.06 0.10 0.29 0.27
(0.00) (0.01) (0.01) (0.05) (0.02) (0.04)
Total Monoterpenes 1.92 3.15 2.48 1.61 3.03 2.70
(0.22) (0.13) (0.08) (0.16) (0.20) (0.11) 1 Standard error in parentheses.

SOARS®
2011, Jenny Eav, 6
Table 2. Little variation in monoterpene concentration (expressed in mg/g dry weight) in three
needle age groups of Austrian pine sampled at NCAR Foothill campus2
New 1-Year-Old 2-Year-Old
α-Tricyclene 0.05 -- 0.11 (0.02) 0.15 --
α-Pinene 3.33 (0.38) 3.63 (0.49) 3.05 (0.42)
Camphene 0.096 (0.023) 0.098 (0.017) 0.051 (0.006)
β-Pinene 1.92 (0.53) 1.17 (0.25) 0.94 (0.27)
β-Phellandrene 0.126 (0.064) 0.130 (0.022) 0.058 (0.009)
Total Monoterpenes 5.40 (0.77) 5.05 (0.52) 4.08 (0.41) 2The table shows the mean of new, one-, and two-year-old needles for eight Austrian pine trees. Standard error in
parentheses. Only one needle sample from one tree had detectable amounts of α-tricyclene.
Except for 3-carene, the concentrations of all monoterpenes in one-year-old needles were
greater than both the concentrations in new and two-year-old needles (Table 1). While we
observed differences in concentrations within individual trees with different needle age groups
for ponderosa, there was little variation between different branch positions within individual
trees among ponderosa (Figure 1) or Austrian pines (p > 0.05). The analysis of the needle oil of
one Austrian pine tree revealed α-pinene (52%) and β-pinene (44%) as the major components.
Similarly, the major component of the needle oil in a second Austrian pine tree was α-pinene
(89%) and β-pinene (4%) for north-, south-, east- and west-facing branches.
Figure 1. Little variation in composition and concentration of monoterpenes in needles taken
from different branch positions from two trees in Manitou Experimental Forest.
0
0.5
1
1.5
2
Ave
rage
Co
nce
ntr
atio
n (
mg/
g DW
)
Monoterpene
Tree #131 NorthTree #131 SouthTree #161 NorthTree #161 South

SOARS®
2011, Jenny Eav, 7
c. Variability between trees
There was significant variability between concentrations and composition of
monoterpenes between the two ponderosa pine needles in Manitou experimental forest as well as
between the eight trees at NCAR Foothill campus (p < 0.01). Figure 1 shows two monoterpenes,
α-tricyclene and camphene, detected in tree #161, but not in tree #131.
d. Comparision of oils within needles and emission rates
There was a difference in the composition of monoterpenes in the needles compared with
emissions. Table 1 compares the concentration of monoterpenes in needle oils with their
emission rate.
Table 3. Comparison of concentration of monoterpenes in needle oils (mg/gDW) from Austrian
pines and their emissions into the atmosphere in high light and in the dark (µg/gDW/h)
α-Pinene Camphene Sabinene β-Pinene Myrcene
Concentrations 1.77 (0.46)
0.015 (0.009)
0.00 (0.00)
1.14 (0.17)
0.00 (0.00)
Emissions in the dark 0.29 (0.13)
0.041 (0.024)
0.0036 (0.0016)
0.15 (0.02)
0.013 (0.023)
Emissions in the light 0.41 (.15)
0.061 (0.34)
0.051 (0.017))
0.26 (0.06)
0.27 (0.12)
Myrcene and sabinene were two monoterpenes detected in emissions in the dark and in
high light but were not detected in the needle oils (Table 3). The major components of emissions
in high light were α-pinene (39%), myrcene (26%), β-pinene (24%), camphene (6%) and
sabinene (5%). In contrast, the major components of emissions in the dark were α-pinene (58%),
β-pinene (30%), camphene (8%). Both myrcene and sabinene contributed less than 4%. In the
needle oils, α-pinene (60%) and β-pinene (39%) dominated.
4. Discussion
Due to the limited sample size, the results of this study should be used as indications of
factors to consider when studying variability of monoterpene concentration within individual
pine trees and across pine trees of the same species. Given the different amount of sunlight each
side of a tree would receive, one might predict concentrations of all monoterpenes to be higher in
south-facing needles compared to the other sides. Latta et al. (2000) found that the needles from
the south-facing branches of the tree contained slightly higher concentrations compared to the
north-facing branches. The monoterpene concentration from ponderosa pine was found not to be
dependent on branch orientation (Figure 1), contrary to results found in Latta et al. (2000) and
what one might expect. The lack of correlation was found in Austrian pine trees as well. This
suggests that variation with branch position is random and the concentrations are determined
more by other environmental or biological factors, such as needle age, tree age, location of tree
and other available resources.

SOARS®
2011, Jenny Eav, 8
In Table 1, one-year-old needles produced slightly more monoterpenes compared to
two-year-old needles and new needles developing this year in ponderosa pines. This was not
observed in Austrian pine trees. There are several implications of this finding. First, it is not well
understood at what point pine needles begin and stop producing monoterpenes in ponderosa
pines. The new needles were collected approximately two months after emerging from the
branches. Future study that measure concentrations at various times throughout the year is
needed to determine at what point during the year new needles produce the maximum amount of
monoterpenes. It would be beneficial to also study and compare older needles. Current models
use leaf-level measurements of emissions. If emissions vary with needle age as concentrations
vary with age, incorporating measurements of emissions from different needle ages will improve
estimations of emissions. Second, the differences in variability within trees between Austrian and
ponderosa pines highlight the specificity of monoterpenes concentration and composition to pine
species. To accurately estimate emissions and concentrations from a given region, the
contribution from different species along with biomass data must be known.
There were differences in composition of monoterpene emission and concentrations
stored in needle oils of Austrian pine. Table 3 shows that two monoterpenes, sabinene and
myrcene, were emitted from needles both in the dark and in high light, but were not found in the
needle oils. This suggests that some monoterpenes may be highly dependent on light. They may
be produced and released immediately, rather than stored. Furthermore, the rate at which
sabinene and myrcene were emitted in highlight was much greater than the rate in the dark.
Future work should directly study the influence of light on production of sabinene and myrcene
in needles as well as develop a numerical model that relates emission rates with vapor pressures
of the oils found in needles along with temperature.

SOARS®
2011, Jenny Eav, 9
ACKNOWLEDGEMENTS
This work was performed under the auspices of the Significant Opportunities in
Atmospheric Research and Science Program. SOARS is managed by the University Corporation
for Atmospheric Research and is funded by the National Science Foundation, the National
Oceanic and Atmospheric Administration, the Cooperative Institute for Research in
Environmental Science, and by the Center for Multiscale Modeling of Atmospheric Processes.
Thank you to everyone who has supported and helped with the research, especially Jim
Greenberg, Peter Harley and Monica Madronich. Thank you to Anne Smith, Andrea Feldman
and Raymond Detweiler for their constructive criticism of earlier versions of this manuscript.
Thank you to SOARS staff and Wendy Abshire for their continued support and encouragement.
SOARS®
2011, Jenny Eav, 10
REFERENCES
Adams, M., Loughry, L.; Plaugher, L., 2004: Experimental Forests and Ranges of the USDA
Forest Service. U.S. Department of Agriculture, Forest Service, Northeastern Research
Station.
Fuentes, J. D., Lerdau, M., Atkinson, R., Baldocchi, D., Bottenheim, J. W., Ciccioli, P., et al.,
2000: Biogenic hydrocarbons in the atmospheric boundary layer: a review. Bulletin of the
American Meteorological Society, 1537-1575.
Guenther, A., Geron, C., Pierce, T., Lamb, B., Harley, P., and R. Fall, 2000: Natural emissions of
non-methane volatile organic compounds, carbon monoxide, and oxides of nitrogen from
North America. Atmospheric Environment, 2205-2230.
Guenther, A., Hewitt, C. N., Erickson, D., Fall, R., Geron, C., Graedel, T., et al., 1995: A global
model of natural volatile organic compound emissions. Journal of Geophysical Research,
8873-8892.
Kesselmeier, J., and M. Staudt, 1999: Biogenic volatile organic compounds (VOC): an overview
on emission, physiology and ecology. Journal of Atmospheric Chemistry, 23-88.
Latta, R. G., Linhart, Y. B., Lundquist, L. and M. A. Snyder, 2000: Patterns of monoterpene
variation within individual trees in Ponderosa pine. Journal of Chemical Ecology, 26,
1341-1357.
Lerdau, M., Litvak, M., Palmer, P., and R. Monson, 1997: Controls over monoterpene emissions
from boreal forest conifers. Tree physiology, 563-569.
Tingey, D. T., Manning, M., Grothaus, L. C., and W. F. Burns, 1980: Influence of light and
temperature on monoterpene emission rates from slash pine. Plant Physiology, 65, 797-
801.
Tingey, D. T., Turner, D. P., and J. A. Weber, 1990: Factors controlling the emissions of
monoterpenes and other volatile organic compounds. Trace Gas Emissions by Plants, 93-
119.