comparison of model and measured power from a wec … · orcaflex screenshot. opt proprietary...
TRANSCRIPT

OPT ProprietaryInformation contained in the presentation may not be used without
the express permission of Ocean Power Technologies, Inc.
Ocean Power Technologies, Inc.1590 Reed Road
Pennington, NJ 08534-5003
Comparison of Model and Measured Power from a WEC Ocean Deployment
Kate Edwards, James Bretl, John Montgomery, Mike Mekhiche, and Bruce Downie
4/29/2015

OPT ProprietaryInformation contained in the presentation may not be used without
the express permission of Ocean Power Technologies, Inc.
Background: OPT PowerBuoy®
2
• Ocean Power Technologies Inc.− Moored buoys which capture power from
ocean waves− Periodic ocean testing since 1997− Ongoing optimization of Power Takeoff and
structure− Upcoming ocean tests off NJ in 2015
• PowerBuoy− Surface float moves along spar; drives thrust
rod into PTO inside spar. Linear motion translated to rotation of generator. Seek to minimize conversion stages and component losses.
− Resulting power output supplied to payload or grid
− Long-term operation, so system and mooring must withstand marine environment
Surface Float
Spar Containing Power Takeoff
Heave Plate Constraining Spar’s
Motion
Example Payload

OPT ProprietaryInformation contained in the presentation may not be used without
the express permission of Ocean Power Technologies, Inc.
• Analysis needs− Power, load performance of candidate geometry
concepts− Mooring design− Effect of PTO limits, PTO efficiency/losses, braking
behavior− Design and fatigue load specification for PTO,
structure, and mooring− Towout
• STORM (Simulink to OrcaFlex Realtime Model)− Replaces prior OPT models. Main benefit: more
flexible.− Combines WAMIT (hydrodynamic coefficients),
OrcaFlex (PowerBuoy motions in irregular waves), Simulink (PTO behavior), Matlab (scripting/analysis)
− Can vary PowerBuoy geometry, mooring components, MetOcean conditions, PTO control
− Validation against tank measurements (Bretl et al., June 2015 OMAE: 3 PowerBuoy geometries, 3 PTO controls)
Role of Modeling in PowerBuoy Development
3
OrcaFlex Screenshot

OPT ProprietaryInformation contained in the presentation may not be used without
the express permission of Ocean Power Technologies, Inc.
• Scale model of PB150 PowerBuoy, compliant 3-leg mooring, resistive PTO control
• OPT Tank test data collected at Memorial University of Newfoundland
• Tank generated waves with desired wave statistics, Bretschneider spectra
• STORM simulations reasonably close to tank measurements
• Similar performance for other geometries (Bretl et al. 2015).
Example Comparison of STORM to Tank Results
4
Ratio Of Tank Test To STORM Mechanical PowerPB150 Geometry Study
OrcaFlex Screenshot

OPT ProprietaryInformation contained in the presentation may not be used without
the express permission of Ocean Power Technologies, Inc.
How Ocean Test Differs from Tank
5

OPT ProprietaryInformation contained in the presentation may not be used without
the express permission of Ocean Power Technologies, Inc.
• LEAP (Littoral Expeditionary Autonomous PowerBuoy) – First APB350 generation− Power source for HF radar payload− Rutgers and CODAR: coastal radar network− Naval Undersea Warfare Center Keyport funded
• Completed 3-month ocean test (Oct 2011)− Site in 37m water depth off New Jersey− Measured power flow, system health− Powered payload continuously per operational
plan− On station and operational during Hurricane Irene− Sufficient range of sea states to fill out power
matrix; can then project power performance for any known wave climate.
Ocean Test
6

7Commercial In Confidence
• Customer: US Navy• Location: New Jersey• Purpose: Maritime Surveillance
(High Frequency)• Results:
• 400W Continuous Power• 1500W Peak Power• Survived Hurricane• Fully Autonomous Operation
APB-350 2011 Ocean Test Off the Coast of NJ

OPT ProprietaryInformation contained in the presentation may not be used without
the express permission of Ocean Power Technologies, Inc.
• Sensors to measure system health, behavior, power flow− Data transmitted to shore and
captured in archive
• Focus: Power at input to generator,− Constant PTO damping
commanded throughout deployment,
− Does not include friction upstream of generator
• During 3-month deployment, covered most ‘typical’ sea states− Bin data by sea state and obtain
power matrix− How does STORM compare?
PowerBuoy Measurements
8
2vP PTOMech
PTO

OPT ProprietaryInformation contained in the presentation may not be used without
the express permission of Ocean Power Technologies, Inc.
• ADCP (Acoustic Doppler Current Profiler)
• Data processed with WavesMon software (Teledyne RDI, B. Strong)
• Calculates spectra from 3 sources: surface tracking, velocity, and pressure sensor.
• Surface tracking preferred since does not attenuate short-period waves, but requires wind-roughened surface
• Wave statistics (Hs, Ta) derived from best spectrum
Ocean Test: Wave Data Collection
9

OPT ProprietaryInformation contained in the presentation may not be used without
the express permission of Ocean Power Technologies, Inc.
• STORM did not include friction upstream of measurement point (frictional damping or constant friction force)
• Greater differences between STORM and measurements (0.5-1.3) than tank comparison (0.8-1.1) for same sea states− Greatest misfit at common sea states, which are heavily weighted in site average power
• Data binned based on Hs, Ta (simulations generated with idealized spectral shape, Bretschneider)
Ratio of Ocean Test to STORM Mechanical Power: Initial comparison not including all loss mechanisms
10
0.530.39
.
.
.
.
.
.
.
.
0.430.480.47
.
.
.
.
.
.
.
0.870.520.540.6
0.57
.
.
.
.
.
1.20.570.520.670.73
0.660.63
.
.
.
1.50.710.640.7
0.77
0.780.720.64
.
.
2.40.950.770.960.78
.
0.890.770.790.73
.
1.31
1.30.98
0.820.87
.
0.710.85
Period (s)
Hei
ght (
m)
3 4 5 6 7 8 90.5
11.5
22.5
33.5
44.5
5
Ratio Of Ocean Test To STORM Mechanical Power

OPT ProprietaryInformation contained in the presentation may not be used without
the express permission of Ocean Power Technologies, Inc.
• Tuned frictional damping and constant friction force to reduce misfit in common sea states (before 0.4-0.7, now 0.7-1.1), but increased misfit in higher sea states (before 0.7-0.9, now 1.2-1.4)
• Investigation ongoing, to better understand source of misfit (friction and other factors)
Some Improvement when Friction Included
11
0.870.66
.
.
.
.
.
.
.
.
0.70.750.77
.
.
.
.
.
.
.
1.50.820.860.970.95
.
.
.
.
.
2.60.960.841.11.2
1.11.1
.
.
.
3.51.31.11.21.3
1.31.21.1
.
.
6.41.81.41.61.3
.
1.51.31.31.2
.
2.81.92.11.6
1.31.4
.
1.11.4
Period (s)
Hei
ght (
m)
3 4 5 6 7 8 90.5
11.5
22.5
33.5
44.5
5
Ratio Of Ocean Test To STORM Mechanical PowerSTORM Included Frictional Damping And Constant Friction Force
OPT ProprietaryInformation contained in the presentation may not be used without
the express permission of Ocean Power Technologies, Inc.
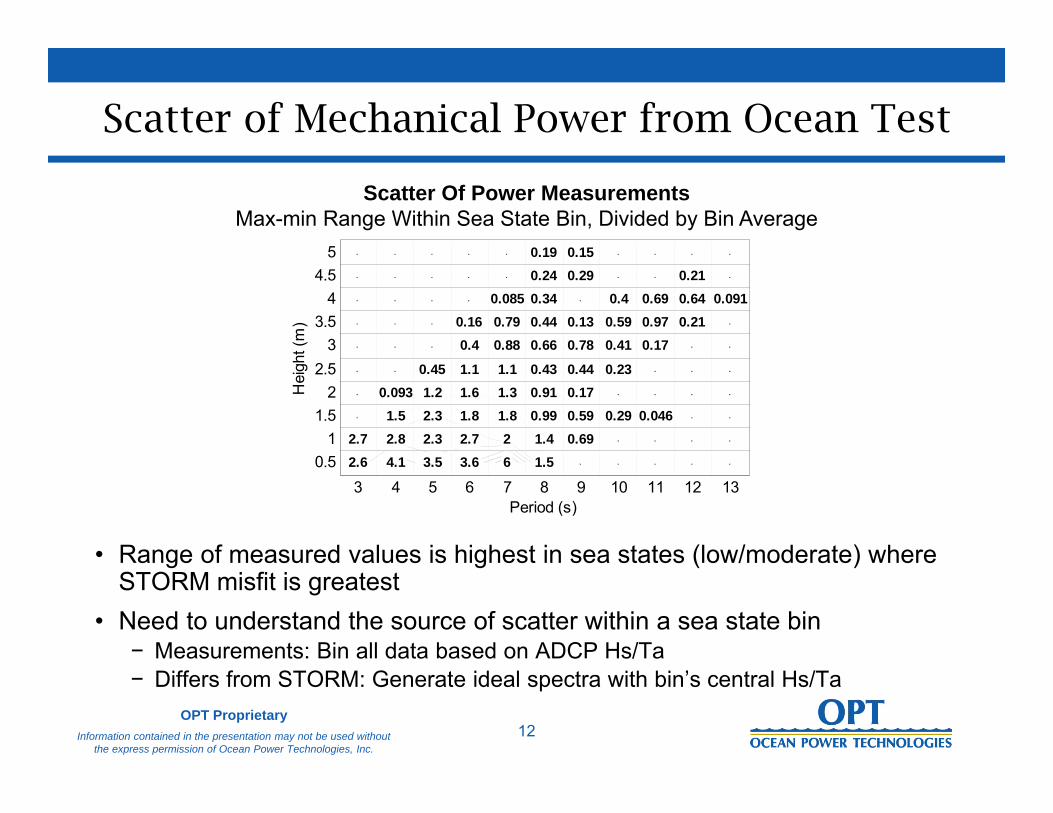
• Range of measured values is highest in sea states (low/moderate) where STORM misfit is greatest
• Need to understand the source of scatter within a sea state bin− Measurements: Bin all data based on ADCP Hs/Ta− Differs from STORM: Generate ideal spectra with bin’s central Hs/Ta
Scatter of Mechanical Power from Ocean Test
12
2.62.7
.
.
.
.
.
.
.
.
4.12.81.5
0.093
.
.
.
.
.
.
3.52.32.31.2
0.45
.
.
.
.
.
3.62.71.81.61.1
0.40.16
.
.
.
62
1.81.31.1
0.880.790.085
.
.
1.51.4
0.990.910.43
0.660.440.340.240.19
.
0.690.590.170.44
0.780.13
.
0.290.15
.
.
0.29
.
0.23
0.410.590.4
.
.
.
.
0.046
.
.
0.170.970.69
.
.
.
.
.
.
.
.
0.210.640.21
.
.
.
.
.
.
.
.
0.091
.
.
Period (s)
Hei
ght (
m)
3 4 5 6 7 8 9 10 11 12 130.5
11.5
22.5
33.5
44.5
5
Scatter Of Power MeasurementsMax-min Range Within Sea State Bin, Divided by Bin Average

OPT ProprietaryInformation contained in the presentation may not be used without
the express permission of Ocean Power Technologies, Inc.
• One measure of fit of spectral shape: Expect Tp/Ta=1.29 for Bretschneider• Close to most commonly occurring value, but wide variance• Wave statistics from ADCP measurements calculated by RDI WavesMon software
Adequacy of Ideal Spectra Shape for Site?
13

OPT ProprietaryInformation contained in the presentation may not be used without
the express permission of Ocean Power Technologies, Inc.
• From ADCP spectra, estimate wave statistics (Hs, Tp)
• Using same statistics, generate idealized spectra (Bretschneider). Expect Tp/Ta=1.29, here 0.79.
• Misfit expected to matter for power output; device most responsive at T≤7s
• For each hour of deployment, used measured ADCP spectra to run STORM simulation. Does power prediction improve?
Example of Idealized vs. Real Spectra
14

OPT ProprietaryInformation contained in the presentation may not be used without
the express permission of Ocean Power Technologies, Inc.
• Black line: Measured mechanical power from ocean test• Dots: STORM time-averaged mechanical power using ADCP spectra
as input. (Tuned friction not applied.)• Color indicates whether ADCP estimated spectra from surface tracking,
velocity, or pressure sensor− Reasonable performance unless pressure sensor (green) is used, due to
poor resolution of shorter wave periods (attenuation in 37m water depth)
Compare Measured Power to STORM Simulations
15

OPT ProprietaryInformation contained in the presentation may not be used without
the express permission of Ocean Power Technologies, Inc.
• Average data in bins of Hs and Ta• Left: STORM simulations using ideal spectra. Right: Using ADCP spectra.• Scatter reduced if ADCP spectra are used. Ocean test/STORM = 0.8.
Better Model Performance from Real Spectra
16

OPT ProprietaryInformation contained in the presentation may not be used without
the express permission of Ocean Power Technologies, Inc.
• Compared to ocean test, closer (0.7-1.1) than original (0.4-1.0), especially in common sea states
• Still binning by sea state
Ratio of Ocean Test to STORM using ADCP spectra
17
Ratio Of Ocean Test To STORM Mechanical PowerUsing ADCP Spectra as Input

OPT ProprietaryInformation contained in the presentation may not be used without
the express permission of Ocean Power Technologies, Inc.
• Power matrix: easy to use (function of 2 variables, Hs and Ta); independent of site
• If must incorporate spectral shape, how? • Active research area
− Saulnier et al. (2011): Wave groupiness and spectral bandwidth as relevant parameters for the performance assessment of WECs, Ocean Eng. 38(1), 130-147.
− Mackay, E. B. (2011). Modelling and description of omnidirectional wave spectra. In Proc. of 9th EWTEC.
− Clabby et al. (2012): The effect of spectral distribution of wave energy on the performance of a bottom hinged flap type WEC. In Proc. of ASME 2012.
− Dallman, A., & Neary, V. (2014). Initial characterization of the wave resource at several high energy US sites.
How to Incorporate Spectral Shape?
18

OPT ProprietaryInformation contained in the presentation may not be used without
the express permission of Ocean Power Technologies, Inc.
• Lesson learned− For upcoming deployments (summer 2015), use measured spectra
as simulation input− Measure mechanical power as far upstream of friction as possible
• Next steps: Weighing how to summarize PowerBuoy performance− Simple Hs/Ta description inadequate, but convenient− Want power performance information which is independent of site
Summary
19

OPT ProprietaryInformation contained in the presentation may not be used without
the express permission of Ocean Power Technologies, Inc.
• LEAP (Naval Undersea Warfare Center Keyport, USCG, Rutgers, CODAR)
• DOE: PB150 tank tests• Matlab, Orcina• Tank staff at Memorial University of Newfoundland• DOE, NREL for METS
Acknowledgements
20