comparison of measured and fao-56 modeled evaporation from
TRANSCRIPT

Comparison of Measured and FAO-56 Modeled Evaporation from Bare Soil
A. J. Mutziger1; C. M. Burt2; D. J. Howes3
; and R. G. Allen4
Abstract: This paper evaluates how well the FAO-56 style soil water evaporation model simulates measurements of evaporation (E)
from bare soil. Seven data sets were identified from the literature and in all but one case, the individuals who took the measurements were contacted and they provided the writers with specific weather and soils data for model input. Missing weather and soils data were obtained from online sources or from the National Climatic Data Center. Simulations for three possible variations of soil data were completed and compared. The measured and the FAO-56 simulated E/ETo and cumulative evaporation trends and values were similar. Specifically, the average evaporation weighted percent difference between the measured and the simulated cumulative evaporation was between -7.5 and -0.5%. This evaluation suggests model accuracy of about ± 15% with the use of sound weather data and a fairly generalized understanding of soil properties in the location being evaluated.
CE Database subject headings: Evapotranspiration; Evaporation; Lysimeters; Irrigation scheduling; Soil water; Transpiration; Measurement.
Introduction
In California and many other states, data from a network of agricultural weather stations is accessible via the World Wide Web to provide estimates of local reference evapotranspiration which, when coupled with crop coefficient (Kc) values, can be used for irrigation scheduling and water management. The California Irrigation Management Information System (CIMIS) weather stations identify the water use of a 10-15 cm tall unstressed irrigated grass for the reference evapotranspiration (ETo) (Eching and Moellenberndt 1998). ETo is estimated using solar radiation, air temperature, vapor pressure, and wind speed measurements as inputs into a version of the Penman equation modified by Pruitt and Doorenbos (1977). Multiplying the local K c value for the crop of interest by the local daily ETo value provides an estimate of daily crop evapotranspiration (ETc).
lAir Quality Specialist, San Luis Obispo County Air Pollution Control District, San Luis Obispo, CA 9340 I; formerly, Irrigation Technician II, Irrigation Training and Research Center (ITRC), California Polytechnic State Univ. (Cal Poly), San Luis Obispo, CA 93407.
2Chairman, Irrigation Training and Research Center, BioResource and Agricultural Engineering Dept., California Polytechnic State Univ., San Luis Obispo, CA 93407. E-mail: [email protected]
3lrrigation Support Engineer III, Irrigation Training and Research Center, California Polytechnic State Univ. (Cal Poly), San Luis Obispo, CA 93407. E-mail: [email protected]
4Professor of Water Resources Engineering, Univ. of Idaho, Kimberly Research and Extension Center, 3793 N. 3600 E., Kimberly, ID 83341. E-mail: [email protected]
FAO-56 (Allen et al. 1998) offers a method for dividing ETc into evaporation (E) and transpiration (7) components. This is done by splitting K c into two terms, the basal crop coefficient (Kcb ) and the soil evaporation coefficient (Ke), where Kc=Kcb +K e . This dual K approach was used for cumulative evaporation c
predictions in a CALFED/ARI Evaporation Study by Cal Poly Irrigation Training and Research Center (ITRC) (Burt et al. 2002) that estimated the amount of evaporation from California agricultural lands under three rainfall scenarios.
Allen et al. (2000) compared the predicted evaporation using these two ET partitioning methods with Kimberly, Id. data sets. The results indicate that the FAO-56 estimated cumulative soil evaporation for the growing season was about two times greater than that calculated with the Wright (1982) method that uses a time-based decay function. Since these data were collected on large precision weighing Iysimeters that measured E and T collectively, there was no conclusive evidence as to which method provides a more accurate partitioning prediction. Both of these methods neglect diffusive water losses (from deep soil) that comprise part of the total evaporation component. These diffusive losses may be 5-10% of total ET (Allen, personal communication, 200 I).
This paper is a companion paper to another written by Allen et al. (2005). Allen et al. (2005) introduce the FAO-56 dual crop coefficient procedure and associated two-stage evaporation model and algorithms that were used in the Cal Poly ITRC CALFED/ ARI Evaporation Study. Allen et al. (2005) also recommend parameter values, and demonstrates the integration of the procedure to create K at the beginning of the season. That paper also introc
duces an expansion of the FAO-56 evaporation model to consider three-stage evaporation. The two- and three-stage models are also described in Chapter 6 and in Appendix B of the Cal Poly ITRC CALFED/ARI Evaporation Study report (Burt et al. 2002).
The purpose of this study was to provide an independent evaluation of how the FAO-56 style model predicts bare soil evaporation. Measured bare soil evaporation data sets (identified in the literature) were compared to simulations of those evapora
Table 1. Summary of Measured Bare Soil Evaporation Data Sets Used to Evaluate the Modified FAO-56 Model
Data set number Source Location Soil type Evaporation measurement method
Ritchie (1972) Temple, Tex. Houston black clay; 55% Lysimeter fine montmorillonitic clay
2 Parlange et al. (1992) Davis, Calif Yolo clay loam Lysimeter
3 Howell et al. (1995) Bushland, Tex. Pullman clay loam Lysimeter 4 5
6 Wright (1982, Kimberly,Id. Portneuf silt loam Lysimeter personal communication, 2001)
7 Farahani and Bausch (1995) Fort Collins, Colo. Sandy clay loama Bowen Ratio
aFarahani (personal communication, 2000) stated that the laboratory evaluation of the soil from the study location classified it as a sandy clay loam. Soil survey maps identify the soil in the area as a Kim loam.
tion events. Three types of simulations were used, which differed in their methods of defining the required soil parameters used in the FAO-56 model.
Method
To assess the effectiveness of the FAO-56 style model in simulating bare soil evaporation, measured bare or near-bare soil (when the Leaf Area Index ~0.15) evaporation events found in the literature were compared to simulations of these events. Data from
Table 2. Summary for Data Set I: Houston Black Clay
Parameter Parameter values for data set
Data set number
Source
Location
Soil
Supporting weather data
Evaportation measurement method
Start date
Date end
Total days
Reported pre irrigation volumetric soil water (m3 m-3)
Reported volumetric soil water at field capacity (m3 m-3)
Reported volumetric soil water at 3permanent wilting point (m3 m- )
Rain; Amount (mm) and number of events: Start to end
Irrigation: Amount (mm) and number of events: Start to end
Crop
Planting date
Emergence date
I
Ritchie (1972)
Temple, Tex.
Houston black clay; 55% fine montmorillonitic clay
Ft. Hood, Tex.; W. of Temple; from NOAA
1.83 m X 1.83 m X 1.22 m deep Iysimeter; backfilled by layers
using saturated sieved soil from pit
April 27, 1969
May 8, 1969
12
Not stated
Not stated
Not stated
48.4, 6
None
Sorghum
Not stated
April 10, 1969
Leaf area index (LA!) at data enda 0.15
Other measured LAI 0.03 April 27, 1969
aE and T data as partitioned in Ritchie (1972) indicated that loss from transpiration is very small when the leaf area index is 0.15 or less.
five sources presented seven evaporation events using either lysimeters to measure water input and daily evaporation or Bowen Ratio equipment to estimate the daily evaporation from 12-h measurements. Table I summarizes general information regarding each of these studies, while Tables 2-6 present detailed information regarding each study.
The weather, irrigation, and evaporation data required to run the comparison simulations were provided by the scientists (personal communication) who published or made the evaporation measurements, except for the Ritchie (1972) paper, which contained much of the necessary data. When required, additional weather data were obtained using the World Wide Web sites for CIMIS (2001 a, b) and Colorado Agricultural Meteorological Net-
Table 3. Summary for Data Set 2: Yolo Clay Loam
Parameter Parameter values for data set
Data set number
Source
Location
Soil
Supporting weather data
Evaporation measurement method
Start date
Date end
Total days
Reported preirrigation volumetric soil water (m3 m-3)
Reported volumetric soil water at field capacity (m3 m-3)
Reported volumetric soil water at permanent wilting point (m3 m-3)
Rain: Amount (mm) and number of events: Start to end
Irrigation: Amount (mm) and number of events: Start to end
Crop
Planting date
Emergence date
Leaf area index (LAI) at data end
Other measured LAI
2
Parlange and Katul (J 992)
Davis, Calif.
Yolo clay loam
CIMIS Sta No. 6--Davis, Calif.
6 m diameter X I m deep Iysimeter
September 14, 1990
September 23, 1990
10
September 13, 19900.31: 0-0.75 m deep
0.26 at -1/3 bar; 0-0.3 m deep (the writers note that this looks too low for a clay loam, but these are the values indicated fi-om neutron
probe readings)
0.15 at -15 bar; 0-0.3 m deep
18.1, I
None
None

Table 4. Summary for Data Sets 3, 4, and 5: Pullman Clay Loam
Parameter Parameter values for data sets
Data set number 3 4
Source Howell et al. (1995)
Location Bushland, Tex.
Soil Pullman clay loam
Supporting weather data 2.
I. On site measurements Amarillo lnt. Airport, 15 miles east; Acquired
Evaporation measurement method Avg.
from NOAA
from two 3 m X 3 m X 2.3 m deep undisturbed
Iysimeters
Start date October 7, 1989
soil monolithsa-c
September 18, 1991
Date end November 6, 1989 October 28, 1991
Total days 31 41
Reported pre irrigation volumetric soil October 13, 1989d Not measured water (m3 m-3) 0.36: 0-0.3 m and
0.24: 0.3-1.9 m
Reported volumetric soil water at field 0.338; from 0 to 1.6 m deep capacity (m3 m-3)
Reported volumetric soil water at 0.216; from 0 to 1.6 m deep permanent wilting point (m3 m 3)
Rain: Amount (mm) and number of events: 13.0,5 25.3,6 Start to end
Irrigation: Amount (mm) and number of 61.1,4 79.5,4 events: Start to end
Crop Winter wheat
Planting date October 10, 1989 September 27, 1991
Emergence date October 18, 1989 October 7, 1991
Leaf area index (LAI) at data end f Approx 0.15 <0.15
Other measured LAI Not measured 0.4 on December 5,
5
September 27, 1992
November 5, 1992
40
October 9, 1992e
0.29: 0-0.2 m, and
0.32: 0.2-2 m
]3.0,6
82.7,4
September 29, 1992
October 9, 1992
Approx 0.15
0.13 on November 2, 1991 1992
a1989: Averages of Iysimeter data are from NW Lysimeter Wheat-Irrigated and SW Lysimeter Wheat-Dryland; irrigations for the two treatments were matched during the fall and winter.
b1991 : Averages of Iysimeter data are from SE Lysimeter Wheat-Deficit Irrigated and NE Lysimeter Wheat-Irrigated; irrigations for the two treatments were matched during the fall and winter.
cI992: Averages of Iysimeter data are from NW Lysimeter Wheat-Dryland and SW Lysimeter Wheat-Irrigated; irrigations for the two treatments were matched during the fall and winter.
dMeasured before a 10.3 mm irrigation on October 13, 1989 and after a I mm rain on October 5, 1989, a 0.5 mm rain on October 6, 1989, and a 0.5 mm rain on October 10, 1989.
eMeasured before 11 mm irrigation on October 9, 1992 and after a 38.8 mm irrigation on October 2, 1992 and a 7.5 mm rain on October 7, 1992.
fE and T data as partitioned in Ritchie (1972) indicated that loss from transpiration is very small when the leaf area index is 0.15 or less.
work (CoAgMet) (200 I) or by requesting hard copies of data not available on the web from the National Climatic Data Center. Specific contact and WWW links for these sources are found in the reference section of this paper (NOAA 2001; USDA-NRCS 200 I). CoAgMet solar radiation data were corrected due to obvious discrepancies from theoretical incoming solar radiation, and grass reference evapotranspiration (ETo) was recalculated using the FAa-56 Penman-Monteith equation with hourly time steps.
The required weather data for the simulations were 1. Occurrence dates and amounts of precipitation or irrigation
(mm/d); 2. Average daily wind speed (m/s); 3. Minimum daily relative humidity (%); and 4. Daily grass reference evapotranspiration, ETo (mm/d).
The required soil data were 1. The effective depth of soil evaporation layer (2e , m); 2. Stage I readily evaporable water (REW, mm);
3. Total evaporable water through evaporation Stages 1 and 2 (TEW2 ,mm);
4. Total evaporable water through evaporation Stages 1, 2, and 3 (TEW3 ,mm);
5. Evaporation reduction coefficient (K,.2) at the end of Stage 2 and beginning of Stage 3 (Kr2 =0 if there is no Stage 3). See Fig. 1; and
6. Cracking nature of the soil, not required, but offers insight into Stage 3 evaporation potential.
Unlike the weather data, which are generally well defined using the available sources, data for the specific soil at a location are often not readily available and may vary to some degree with time or management practices. In this evaluation, required soil data were obtained with three different methods and provided three series of simulations to compare against the measured evaporation amounts. Specifically, the measured and FAa-56 simulated ratio of daily E to ETo and cumulative E for the events were

Table 5. Summary for Data Set 6: Portneuf Silt Loam Table 6. Summary for Data Set 2: Sandy Clay Loama
Parameter Parameter Values for Data Set
Data set number 6
Source Wright (1982, personal communication, 2001); Allen (personal communication,
2001)
Location Kimberly, Id.
Soil Portneuf silt loam
Supporting weather data National Wheather Servo 0.6 m north
Evaporation 1.83 m X 1.83 m X 1.22 m Iysimeter; measurement method backfilled by layers, compacted to
original bulk density, and saturated with bottom excess water removed using sintered extraction
candles
Start date August I, 1977
Date end September 24, 1977
Total days 55
Reported preirrigation 0.05-0.1 volumetric soil water (m3 m-3)
Reported volumetric soil 0.32 water at field capacity (m3 m-3)
Reported volumetric soil water at Lower limit of plant available permanent wilting point (m3 m-3) water=O. J2-0.16
Rain: Amount (mm) and 26.2, 12 number of events: Start to end
Irrigation: Amount (mm) and 215.3,4 number of events: Start to end
Crop Start of data period is after the
Planting date harvest of garden peas and end of period is before planting of winterEmergence data
wheat.Leaf area index (LAI) at data end
Other measured LA!
presented graphically for visual analysis and compared statistically.
These three series of simulations represent an array of possible methods for choosing the soil data that one might use, and the comparison of the results from the three series offers an assessment of the possible impact on the estimation caused by differences between the methods. Prior to describing the differentiation of the soil parameter selections for these three series of simulations, a short discussion of Stage 3 evaporation and the cracking nature of the soils is appropriate.
The FAO-56 model presented in Allen et al. (1998) allowed evaporation to occur in a two-stage process similar in appearance to the empirical model presented by Ritchie (1972). In the FAO-56 model, the relative evaporation rate (K,.=E/ Ep, where Ep=potential evaporation rate for wet soil) decreases linearly with increasing cumulative evaporation during Stage 2. In this study, a third stage of evaporation is represented by changing the slope of the falling rate of Stage 2. Stage 3 evaporation is associated with a slow and steady vapor transfer rate between moist deep soil and the dry air above, or with soil cracking that exposes deeper soil to the surface evaporation potential. The option for Stage 3 evaporation was added to the FAO-56 model by Allen (1998) to simulate deeply cracking soils in the Imperial Valley of California. The three-stage FAO-56 style model was described by Allen et al. (2005). The values for TEW3 and K rz , the value for K r
Parameter Parameter values for data set
Data set number 7
Source Parahani and Bausch (1995)
Location Fort Collins, Colo.
Soil Sandy clay loam
Supporting weather data CoAgMet Sta. Ftc03-Fort Collins
Evaporation Bowen ratio equipmentb: ET
measurement method Measurements are for 7 a.m. to 7 p.m.
Values were adjusted to account for 24 h of evaporation by
multiplying measured evaporation
by RS-z4 h/Rs-7 a.m.-7 p.m.
Start date May 15, 1993
Date end June 8, 1993
Total days 25
Reported preirrigation 0.28 volumetric soil water
Reported volumetric soil 0.34 water at field capacity
Reported volumetric soil water 0.265 at permanent wilting point
Rain: Amount (mm) and number 56.1, 10 of events: Start to end
Irrigation: Amount (mm) none and number of events: Start to end
Crop Field corn
Planting date April 28, 1993
Emergence date May 12, 1993
Leaf area index (LAI) at data 0.16 endc
Other measured LAI 0.3 on June 14, 1993
aparahani stated that the laboratory evaluation of the soil from the study location classified it as a sandy clay loam. The maps identifY the area as a Kim loam.
b l2 h ET measured with Bowen Ratio equipment was calibrated in Bushland, Tex. against Iysimeter measurements.
cE and T data as partitioned in Ritchie (1972) indicated that loss from transpiration is very small when the leaf area index is 0.15 or less.
at the start of Stage 3, were based on unpublished work presented in the Imperial Irrigation District Water Use Assessment for the Years 1987-1996. For this research, Stage 3 evaporation was used if specific soils were identified as cracking soils in the USDANRCS Soil Survey Division Official Soil Series Descriptions. The soil parameter selection process for each of the three series of simulations follows.
¥ Stage 1 (FAO-56)
~--=-~
Stage 2 (FAO-56) ItK,
Stage 3 (modified KJ2 .+ :... ~,,-_ ¥ FAO-56)
O-l---+------+----.....:::::~ o REW TEW2
Evaporable Water
Fig. 1. Three stage soil evaporation process

Table 7. Typical Soil Water Characteristics for Different Soil Types; Reproduction of Table 19 in Allen et al. (1998)
Evaporation parameters
Amount of water that can be Soil water characteristics depleted by evaporation
Soil type Stages 1 and 2 (USA Soil Stage I TEWc
Texture °FC-OWP REW (Zed =0.10 m) Classification) (m 3 m-3) (mm) (mm)
Sand 0.Q7-0.17 0.02-0.Q7
Loamy sand 0.11-0.19 0.03-0.10
Sandy loam 0.18-0.28 0.06-0.16
Loam 0.20-0.30 0.07-0.17
Silt loam 0.22-0.36 0.09-0.21
Silt 0.28-0.36 0.12-0.22
Silt clay loam 0.30-0.37 0.17-0.24
Silty clay 0.30-0.42 0.17-0.29
Clay 0.32-0.40 0.20-0.24
aOFc=soil water content at field capacity (m3 of after per m3 of soil; m3 m 3).
bOwr=soil water content at permanent wilting point (m3 m-3).
0.05-0.11 2-7 6-12
0.06-0.12 4-8 9-14
0.11-0.15 6-10 15-20
0.13-0.18 8-10 16-22
0.13-0.19 8-11 18-25
0.16-0.20 8-11 22-26
0.13-0.18 8-11 22-27
0.13-0.19 8-12 22-28
0.12-0.20 8-12 22-29
cTEW=Total evaporable water=maximum depth of water that can be evaporated from the soil when the soil has been initially completely wetted (mm); TEW= 1,000(OFcO.50Wp)Ze'
dZe=depth of surface soil layer that is subject to drying by way of evaporation (0.10-0.15 m).
Simulation Series 1: General Soil Parameters from FAO-56 as Used in the CALFED/ARI Evaporation Study
The CALFED/ART Evaporation Study (Burt et al. 2002) used general values for the REW and TEWz soil parameters as recommended in FAO-56 Table 19 (see Table 7 of this paper). The Houston black clay was simulated using average REW and TEWz values from Table 7 for clay. The clay loam, silt loam, and sandy clay loam soils were grouped together and were represented by typical REW and TEW values from Table 7 for a silt texture. Although Table 19 of FAO-56 contains characteristics of a silt
loam, it was felt that the REW and TEW values for a silt more closely matched the mix of the CALFED/ART Evaporation Study soils. The Ze parameter was set at 0.1 m.
The Portneuf silt loam soil at Kimberly, Id., which was not identified as having cracking tendencies, was modeled using a third stage of evaporation during the Series 1 simulation since three-stage evaporation was used in all simulations of silt loam soils in the CALFED/ART Evaporation Study. The third stage, and associated TEW3, provided better estimates than did a twostage simulation for the Portneuf silt loam soil when a Ze = 0.1
Table 8. Series I Simulation Soil Parameter Values: These Follow the Soil Groupings Used in the CALFED/ARJ Evaporation Study and Were Used in the Comparison between Measured and FAO-56 Simulated Bare Soil Evaporation.
Houston black Pullman clay Portneuf silt Kim loam/sandy clay Yolo clay loam loam loam clay loam
Source Ritchie (1972) Parlange et al. Howell et al. Wright (personal Farahani and Bausch (1992) (1995) communication, 200 I) ( 1995)
Stage I REW (mm) 10 9 9 9 9
Stages I and 2 TEWz (mm) 26 24 24 24 24
Stages 1,2, and 3 TEW3 (mm)b 50 45 40
K r2 : Evaporation Coefficient at end of Stage 2b 0.2 0.2 0.2
Ze or the effective depth of soi I 0.1 0.1 0.1 0.1 0.1 evaporation layer (mt
Cracking nature of simulated soild Yes No Yes NOd No
aSoil parameters for the soils in the Series I simulations were grouped consistently with the method used in the CALFED/ARI evaporation study that estimated evaporation from California agricultural lands. In that study the clay loam, silt loam, and sandy clay loam soils were grouped together and the Stage 1 and Stage 2 soil parameters for this group were represented by the parameters for an average silt soil as identified in Table 19 of Allen et al. (1998). Note that Ze in the CALFED/ARI Evaporation Study was set at 0.1 for all soils.
bStage 3 evaporation parameters for the three-Stage FAO-56 model were based on information from the report: Water Study Team. Imperial Irrigation District Water Use Assessment for the years 1987-1996 (1998). Received via Freedom of Information Act.
cFAO-56 recommends using values for Ze between 0.1 and 0.15 m. Ze was set to 0.1 m during Simulation Series I and 2.
dIn the Series I simulations, the cracking soil designations match the USDA-NRCS Soil Survey Division Official Soil Series Description designations of this property for the actual soils from the five locations. However, some silt loam soils in the CALFED/ARI evaporation study were modeled using a third stage of evaporation. For the Series I simulations, the Portneuf silt loam at Kimberly was modeled better using a third stage of evaporation than without when Ze=O.1 m was used, and was modeled in this manner to represent those California silt loam soils where three stages of evaporation were used in the CALFED/ARI evaporation study.

Table 9. Series 2 Simulation Soil Parameter Values
Houston black Pullman clay Portneuf silt Kim loam/sandy clay Yolo clay loam loam loam clay loam
Source Ritchie (1972) Parlange et al. Howell et al. (1995) Wright (personal Farahani and Bausch (1992) communication, 200 I) (1995)
Specific soil texture from Clay; 55% fine Clay loam Clay loam Silt loam Loam, but sandy clay evaporation experiment location montmorillinite loam by lab analysis
clay of soil at site
Stage I REW (mm) 7 8 8 8
Stage I and 2 TEW2 (mm)" 18.7 23 37.5 20.8
Stages 1,2, and 3 TEW3 (mm)b 45
Evaporation Coefficient at end of Stage 2b 0.2
Ze or the effective depth of soil 0.1 0.1 0.15 0.1 evaporation layer for Stage 2 evaporation (m)"
Cracking nature of observed soilc Yes No Yes No No
"The TEW for the Series 2 simulations were computed using Eq. 73 from Allen et al. (1998): TEW= I,000(FC-0.5WP)Ze, where field capacity (FC) and wilting point (WP) were reported by the scientist and are listed in Table I. As with the Series I simulations, all soils in the Series 2 simulations were modeled with a Ze=O.1 0 m except the Portneuf silt loam, where Ze=0.I5 m as recommended Allen (personal communication, 200 I) and Wright (personal communication, 200 I). REW values for the Series 2 simulations were approximated from the reported FC and WP values. Scientist reported soil parameter values were not available for the Houston black clay. Therefore this soil was not simulated during Series 2.
bStage 3 evaporation parameters for the extended FAO-56 model were based on information from the report: Water Study Team. Imperial Irrigation District Water Use Assessment for the Years 1987-1996 (1998). Received via Freedom of Infonnation Act.
eNote that the cracking tendencies of the soils for the Series 2 and Series 3 simulations match the USDA-NRCS Soil Survey Division Official Soil Series Description designations of this property for the actual soils from the five locations. The change from cracking to noncracking designation for Portneuf silt loam was strengthened by statements from the local scientists: Allen (personal communication, 2001) stated that this soil seems to be better modeled without cracking tendencies and, from personal observations, Wright (personal communication, 2001) stated that although the portion of a Portneuf silt loam furrow that is saturated usually does crack on drying, the cracking is typically only about 0.05 m deep. The surface soil that is wetted by soaking in between the furrows usually does not crack on drying.
was used. A larger value for Ze and a two stage simulation was was changed to 0.15 m, as recommended by Allen (personal comused for the Portneuf soil during Series 2. Table 8 shows the munication, 2001) and Wright (personal communication, 2001). specific soil parameters used in the Series I simulations. For the other soils, Ze was left at 0.1 m. The Portneuf silt loam
soil simulation was run without Stage 3 evaporation in the Series 2 simulations. Table 9 shows the specific soil parameters used inSimulation Series 2: Scientist-Reported Soil the Series 2 simulations. Parameters
For this series of simulations, the FAO-56 Model used REW and Simulation Series 3: Best-Fit Soil Parameters
TEW2 soil parameters that were developed from detailed soils data provided by the scientists that conducted the specific field Simulation Series 3 modified soil parameters from the Series 2 evaporation studies. Specific soils data for the Houston black clay simulations. REW, TEW2, TEW3, and K r2 evaporation coeffiwere not available. The Ze parameter for the Portneuf silt loam cients were altered manually to obtain the best fit between the
Table 10. Simulation series 3 soil Parameter Values Altered to Produce the Best Comparison Between Measured and FAO-56-style Simulated Evaporation.
Houston black Pullman clay Portneuf si It Kim loam/sandy clay Yolo clay loam loam loam clay loam
Source Ricthie Parlange et al. Howell et al. Wright personal Farahani and Bausch (1972) (1992) (1995) communication, (2001) (1995)
Stage I REW (mm) 7 2 7 13 10
Stages 1 and 2 TEW2 (mm)" 30 6 22 40 25
Stages 1,2, and 3 TEW3 (mm)b 50 18 45
Evaporation Coefficient at end of Stage 2b 0.3 0.35 0.2
Ze or the effective depth of soi I 0.115 0.032 0.096 0.16 0.12 evaporation layer (m)"
Cracking nature of simulated soilc Yes No Yes No No
"In the Series 3 simulation, values were determined for Ze to produce the value shown for TEW2 based on Eq. 73 from Allen et al. (1998): TEW = I,000(FC-0.5WP)Ze where field capacity (FC) and wilting point (WP) were reported by the scientist and are listed in Table I.
bStage 3 evaporation methods for three-stage FAO-56 model were based on information from the following report: Water Study Team. Imperial Irrigation District Water Use Assessment for the Years 1987-1996 (1998). Received via Freedom of Information Act.
cRelative to the Series 2 simulations, only the Yolo clay loam simulation was altered to include Stage 3 evaporation in the best fit simulations.

1.75 TS~er--;ie--;s-:-l-si:-m-ul:-at::-io-o--;. S:-o'7 120il-7"io-pu""t-pa-ra-m-et--;e-rs--;th-a--;tm--;i:-m7"ic7"ked--;--;th-e-so"""il:---'--" 77
groupings used in the CALFEDIARt Evaporation Study. e \.50 t~=~,=====~============'.----t66 != 100 o
~ 1.25 '--__-'---'-_---'1------.,----------+ 55 'a
'ij 80
o 1.00 +-~r------------+-:.------_+ 44 s: ~ g~ lol 0.75 ~iS 60
+----=-~r----------......__-_::7"'=-----_+ 33 = .~
~8. 0.50 t--4J-~.___------___:;*?--------_+ 22 '1 40
~
0.25 +-----"':::>-.(?-.,......"-F:...,,.-,;,....:.---------_+ 1\ :B 20 = Eo o = 0.00 -I---..,.---..,.---...,-......I:l.--,-__--r----l..l.--,-___+ 0 U
......- Cumulative· Measured I • ""•. Cumulative - Modeled Series I simulation.
0 Precipitation
I
24.7
0 -'" '1':"~
24.2 ~.~ .. ~ .. ~ .. ",.
.' .., 0 n 0
1.75
\.50
1.25
~ 1.00
~ lol 0.75
0.50
0.25
0.00
Series 3 simulation. Soil-input parameters altered manually ror the best comparison between measured and simulated evaporation. I ~ --.- ElETo • Measured I
• 0- .ElETo - Modeled o Precipitation
II
~.\ ~ :..~ ~ 2
G·· .... s ·e'· 0b >k~
0 0 n n ...'" '"'"
o
77 120
66 = 100o
55 !_:§E l:: 80
44 e ~ 8 ~ .~ is 60
33 'S, 'l:l
'E ~ .. 0..
22 ... ~ 40
~11 20 E = o u
0
"""-Cumulative - Measured I Series 3 SimUlation~• ""•. Cumulative· Modeled
0 Precipitation I I
24.6
0 .-... ,;---D 24.2
~.'7!r"= ,.' 0 n 0
'" ? N N W N 00~ ~ ~ i:: ~ ~ i:: 00 f'>:: '?' '? '" '? ';' ';'
~ '1 ~ ~ :> ;). :> i:: >:: .,i:: .,i::'" 1 '" .,>:: 'C 'C '"'C 'C '"'C '" '"'C '"'C 1 '" ';' ~ ~ ~ ~ '1' '1''" 'C '1'
'C 'C '" '" '" '"'" '" '" '" '" '" '" '"'" '" Fig. 2. Comparison of daily bare soil EIETo ratios and of cumulative bare soil evaporation for lysimeter measurements in 1990 at Temple, Tex.-Houston black clay-reported by Ritchie (1972) and FAG-56 model results. Simulation results for two variations on the soil parameter definitions. Scientist reported soil parameter values were not available for this soil. Therefore it was not simulated during Series 2.
measured and simulated evaporation events. During Simulation Series 3, the Yolo clay loam was altered to include Stage 3 evaporation. The Ze parameters were modified from those used in the Series 2 simulations to create values for TEW2 as shown in Table 10. Table 10 summarizes the specific soil parameters used in the Series 3 simulation.
Results and Discussion
The figures in this section display the measured and simulated EIETo versus time, and cumulative evaporation versus time, for five of the seven bare soil evaporation data sets used to evaluate the model. The results from these five data sets demonstrate key points learned from this evaluation. Each figure includes measured and simulation comparisons for the three variations (Series 1, 2, and 3) used for defining the soil parameters.
General Observations about the Figures of EI ETo and Cumulative E
I. The measured and simulated EIETo and cumulative bare soil evaporation trends (Figs. 2-6) were similar among the three simulation series that used different approaches to define soil parameters. This indicates that the FAG-56 evaporation
model is generally valid for predicting evaporation from bare soil and that the general soil values published in FAG-56 are sufficient for general prediction work.
2. The similarity between predicted and measured evaporation values offers confidence as to the capability of the two-stage and three-stage FAG-56 model to provide good prediction of bare soil evaporation when there is sound weather data.
3. Following large precipitation or irrigation events, the FAG-56 simulated ratios of EIETo were similar to measured ratios of EIETo (Figs. 2-6). Maximum measured EIETo often exceeded 1.2, which contrasts with findings by Snyder et al. (2000), who found that maximum EIETo measurements following soil wetting ranged from 0.8 to 1.0 in Imperial Valley, Calif.
4. The response of EIETo to small precipitation or irrigation events occurring several days after a large irrigation event as simulated by the FAG-56 model tended to be smoother and of lower magnitude than the measured EIETo response (Figs. 2-6). This is due to the dampening caused by the water balance conducted for the entire surface soi I layer (of depth Ze) in the FAG-56 model, so that small wetting events increase the average water content of the entire layer by a small amount and consequently the predicted ratio E IETo may not change significantly. In reality, small events will rehydrate the skin of the soil surface and will generally shift

1.75
1.50
1.25
1.00<>... ~
'" 0.75
0.50
0.25
0.00
1.75
1.50
1.25
1.00<>... ~
'" 0.75
0.50
0.25
0.00
1.75
1.50
1.25
1.00<>... ~
0.75
0.50
0.25
0.00
Series 1simulation. Soil-input parameters that mimicked the soil
Igroupings used in the CALFEDJARI Evaporation Study.
I--ElETo- Measured J ' 0- . ElET0 - Modeled
<Y, ! 0 Sorinklcr lrri 'ation = 18.1nun , "'r.>
\ \ l>
~ OJ G>,
"@. ::-- ..... • '@" 'c.>,,:!"
77 120,-;=========::::;-----------,E -'-Cumulative - Measured I.§. Series t simulation.., • -6.. 'Cumulative - Modeled
66 .2:. 100 0 SprinkterIrrigation= 18.1mm!----------------I
'C
~55 <> 80 +------------------------1
E :::: 44 .§. ·i
<>., 'g 60+-------------------------;
:::: ..33 go. is.,~ .g 40 +------------------------1 22 e
<>.. II
!: 20 r-"'W:JTI--~~~.~'~'~'~A:-~'~'~A~'~'::'~~':::'~-~':::::':j' ~,:::,:::-'i='-::-::,~18~.3~
.A" 16.8'0'" ~ ~ :; e e
77 120 r;==:;==:===:=:===:==,---------iESeries 2 simulation. Soil-input parameters as reported by the scientists I ......- Cumulative - Measured I
J .§.
..
., Series 2 simulation. who conducted the evaporation measurements. • -l:l•. Cwnulative - Modeled66
.~ 100 0 SprinklerIrrjgation~ 18. 1nunl-------------I I--ElETo - Measured , 'C
' 0- . ElETo' Modeled 55G-' -G> I 0 SprinklerIrrigation~ 18. I nun ~ 80 +-------------------------;
44 E ·8
II
\ .§. :e.., 60 +------------------------1f
\ '", ·8 ..
33 r ., ~
<>
40 +-------------------------; 22 E
<>OJ .. " ~ 20~- 11 UI .A' "A-- ·A· ..A-- 'A--· .. , .. , .. , 16.8.. r-LrI~=~=:t=I=r:::~~~;::j~~~:::j~18~.I~'@, '"~
.-r-;.:~"@ :---. ~ " '(3,. :;0 e = u
77 120ESeries 3 simulation. Soil~input parameters altered manually for the .§.best comparison between measured and simulated evaporation. I 66 co
100.~ I--ElETo - Measured
- 0- . ElET0 - Modeled J
'eoQ I 0 Sprinkler Irrigation ~ 18.lnun
55 'il 80.gE
44 .§. .~..",\ = .~ 60 '-;<> ..
33 ..\ ~ .,is
40:822 ..e
<>Oi !: 20~-,
11"'G,,~ '" '. ..... ..... ~
:; o "'"
......- Cumulative - Measured
I• -1::.• •Cumulative - Modeled Series 3 simulation.
0 Sprinkler Irrigation'" 18. 1nun
WI 16.8 16.1
~ e [::j'" '"'"'?' '!' u= ':"' f" ~ 00 \"'" ~ <Il <Il '" in ~ w <Il in inW .g .g .g{ i'9 ~ t~ t ~ ~ ~ ~
0 0 0 0 0 0 00 '" '" '" 0 0 0 0 0 0 '" '" '" '" Fig. 3. Comparison of daily bare soil EIETo ratios and of cumulative bare soil evaporation for lysimeter measurements in 1990 at Davis, Calif.-Yolo clay loam-reported by Parlange et al. (1992) and FAO-56 model results. Simulation results for three variations on the soil parameter definitions.
the evaporation process temporarily into Stage 1 drying. Allen et al. (2005) have expanded the FAO-56 method to conduct two separate water balances of the surface soil layer to account for skin wetting. Their expansion of the method was not tested in this study.
5. Occasionally, the upper limit on the evaporation and transpiration component (Ke max= 1.20) in the Modified FAO-56 model was reached and even exceeded (Figs. 2-6). It should be noted that K max is intended for cropped surfaces, but inc
the CALFED/ARI Evaporation Study this limit was included in the bare soil evaporation as well. The value of 1.20 is to account for impacts of lower albedo of wet soil relative to grass, coupled with heat storage in the soil surface layer prior to wetting (Allen et al. 1998). The impact of allowing K e max
to limit the rate of bare soil evaporation appears to be minimal since it was only occasionally exceeded by measured data and, over time, the simulated cumulative evaporation was very similar to the measured value for all three series of simulations (Figs. 2-6).
General Observations about the Statistical Evaluation of the Bare Soil Evaporation Simulations
There are several possibilities that could be used as a basic evaluation of how well the two-stage FAO-56 model and enhancement to a three-stage model perfonned in simulating soil evaporation. The method that seemed most appropriate was to compare the evaporation weighted average percent difference between the

1.75
1.50
.. 1.25
1.00
~ '" 0.75
0.50
0.25
0.00
Series I siIrnJation. Soil-input parameters that mimicked the soil groupings used in the CALFEDIARl Evaporation Study.
--ElETo - Measured - 0 ElETo - Modeled
0 Preci itatioo & 1m
77
66
E 55 .s
= .~
44r oll..33 .~
22 :f .. II
0
E .s 120 .. .2 :0)00
Series 1simulation.
93.7 87.9~
.g 80l!
f 60.. .......
~ 40~
&.
'".. ~
20
~ ;; e U" 0
1.75 77 Series 2 simulation. Soil-input parameters as reported by the scientists who conducted the evaporation measurements.
--ElETo - Measured -0- ElETo - Modeled
0 Prcci italion & IITi
I 120 .... 1.50 66 ! 100
E 1:
1.25 55 .s ~ .. .g 80l!~ Q. .. 1.00 44E ~I .. 60~ oll ..... ..'" 0.75 33 ....~ 1:
40~ 0.50 22~ &.
~ ~
II
.. '"" ~ 200.25 '.; ;; e
0.00 0 0 U"
1.75 77 E 120Series 3. Soil· input parameters for Howen Series 3 simulations are identical to .s that of Series 2 values obtained from Howell since manual parameter .. alterations could not be made such that simulation improvements were150 66 :a.. 100observed for alllhree Howell dala sels. e 'C
1.25 55 .s ~ .. .. .", 80
1.00 44f ~ l!
{2. 60!oll.. :;~ 075 33 .. ..
~ .g
i 40
050 221 .. " <oj 20.. ~
0.25 II ~
~ ;; e0.00 ... :;; ... .. 0 u"
0 :;; ...:;; 'f' 2: &: 'f' :;; 'D ~~ &: ~ {? .. .y ~ $? ..'?
'D .y'" .y $? ~ '?"'" ... f ~ <
~ ~ 'D ::e 'D ~ ~ ~::e ::e ~ '" Fig. 4. Comparison of daily bare soil E/ETo ratios and of cumulative bare soil evaporation for Iysimeter measurements in 1991 at Bushland, Tex.-Pullman clay loam-reported by Howell et al. (1995) and three-stage FAO-56 model results. Simulation results are for three variations on the soil parameter definitions.
Series 2 simulation.
93.7 88.9
Series 3 simulation,
93.7 88.9
...
measured and the simulated cumulative bare soil evaporation. The evaporation weighted average was a straightforward method of minimizing bias that could be introduced by the variation in the time of year, the geographical location, and length of evaluation period for the seven data sets.
The evaporation weighted average percent difference between the measured and FAO-56 simulated cumulative evaporation was negative for all three methods of defining the simulation parameters for all soils (Tables 11-13). As one might expect, the general method for defining the soil parameters (Series 1 simulations) resulted in more average evaporation weighted error than when
the scientist-reported (Series 2) or best-fitted (Series 3) soil parameters were used: -7.3, -4.2, and -3.1%, respectively, when the Ritchie data set is not included.
Specific Findings from This Evaluation of Soil Water Evaporation Predicted by the Two- or Three-Stage FAD-56 Model
Specific findings from this evaluation of soil water evaporation predicted by the two- or three-stage FAO-56 model are
1. The FAO-56 style soil water evaporation model, patterned

1.75
1.50
1.25
0 1.00 ... E:<:'
'" 0.75
0.50
0.25
0.00
1.75
1.50
1.25
1.000...
E:<:'
'" 0.75
0.50
0.25
0.00
1.75
1.50
1.25
.. 1.00 ... E:<:'
'" 0.75
0.50
0.25
0.00
77 I 120 .. ~
66 :c 100
e 55 .s.. ~
0
0 80l:!·6044} .=
~ 60o<l .. ..33 0 ..0
'" l:! 0
'":: 40 22 :~ 8..
~ 20 '"
~
LI ~
'" ..'"e= 0 U
77 I 120Series 2 simulation. Soil-inputO. parameters as reported by the .. evaporation measurements.scientists who conducted the ~ 66 t\ 100 e ·C
55 .s ~ .. .=0
';0
l:! 80
·6044f .~
... 60o<l l;33 g ...= ..
l:! 40 22 :~ "{
... ~ !l 11 '".. ~
20
';;; e U = 0
77 E 120 .s 116.8 .. Series 3 simulation
i)
. 66 "i
.. 100
--&-- Cumulative - Measured·C • {;- Cumulative - Modeled
55 I 0 Pecci itatian & lrri arion.. ~ .... 80
.~ 0 '" i·i
44~ .~ 60...o<l ....33 ..
~ ....l:! 40'" q22l ~ ... ~
11 '"~ 20
i ;;
0 e 0 ....'" '<> ~ ... .... !::l u = '" 00 ~ .... .... '" ;). ;).
= ~ ;). '" t ;). ;l.~ ~= 'P
~
= = '9 '" Ii'- 'P
~
= .. = '" '" j .... 'P 'P :::l ! .... .... '".:., '".:., ~ ~ "".:.,........ .... ....:::l :::l ~ .... .... .... .... ....
01 Series 1 simulation. Soil-input parameters that mimicked the soil groupings used in the CALFEDIARI Evaporation Study.
Series 1 simulation. 101.8
-.-Cumulative - Measured - {;- Cumulative - Modeled
0 Pecci itatian & lrri arion i
Oi
oi
°i Series 3 simulation. Soil-input parameters altered manually for the best comparison between measured and simulated evaporation.
Fig. 5. Comparison of daily bare soil E/ETo ratios and of cumulative bare soil evaporation. Lysimeter measured (in 1977 at Kimberly, Id.-Portneuf silt loam-reported by Wright personal communication, 2001) and FAO-56 model results. Simulation results are for three variations on the soil parameter definitions.
after Ritchie (1972), provided a good physical structure for simulating evaporation from bare soil. The use of a daily soil water balance and the use of two or three stages of drying in the model appears to be sound. There is a tendency for a small to modest improvement in model results when scientist-reported soil parameters (Series 2) are used in simulations, rather than general parameters from FAO-56 whose values are based on general textural classes (Series 1).
Specifically, the improvement in the straight percent difference between the measured and modeled cumulative bare soil evaporation ranged from I to 2% for 4 of the 6 comparable data sets.
Results were worse for Series 2 as compared to Series I for a fifth data set [the 1992 Iysimeter data from Howell et al. (1995) found in Tables 11 and 12].
The sixth Series 2 simulation [using Wright (personal communication 2001) data] that had scientist-reported soil data for the Portneuf silt loam soil in Kimberly, Id. resulted in the most significant improvement over the Series 1 simulation, by increasing the depth of the evaporation zone (Ze) from 0.1 m to the reported value of 0.15 m and using a two-stage process rather than threestages. The Series 2 simulation brought the cumulative evaporation 8.4% closer to the measured cumulative value (Fig. 5 and
1.75
1.50
1.25
.." 1.00
f:!1 0.75 '" 0.50
0.25
0.00
1.75
1.50
1.25
.." 1.00
f:!1 0.75 '" 0.50
0.25
0.00
1.75
1.50
1.25
.." 1.00
f:!1... 0.75
0.50
0.25
0.00
Series I simulation. Soil-input parameters that mimicked the soil groupings used in the CALFED/ARI Evaporation Study.
0 0 0
Series 2 simulation. Soil-input parameters as reported by the scientists who conducted the evaporation measurements.
Gl'Gl'Gl 0
0
Series 3 simulation. Soil-input parameters altered manually for the best comparison between measured and simulated evaporation.
~ ElETo - Measured - 0- 'ElETo- Modeled
0 Pred italian
'@ 0 0 'Gl'Gl
..... ..... w v.
'" ! :;~ '1'
1:: ;:: ;:: ~ -j! -j!! f '" w ~ w w :::l :::l
77 e§, c66 ~ .~
55 ~ "
44 e-§, '" ·ic
.~ ~
33 '6. ..... .~ "c
22 ... ~ e co " c
II ~
'" ~ 0 § = U
77 120e§, c66 ~ 100
.~ 55 'il 80e- t44 §,
c
f 60~ ...33 ·i ..
.~ "c 40... ~ 22 e 8c ~ 20
II '" .~ 00 ~ = U
77 120e§,
66 .g 100 c•
c..£:
55 ~ 80e- ~
44 §, l:! c 's. " .~ 60'" ...33 ·i ..
"c 40 22 l -8
i ~ 20
11 ... ~
00 ~ e = u
Series I simulation.
120 .......... Cumulative - Measured • -6. .Cumulative - Modeled
\00 0 Precipitation
80
60
40
20
0
Series 2 simulation. .......... Cumulative - Measured • -6..- 'Cwnulative - Modeled
0 Precipitation
.......... Cumulative - Measured Series 3 simulation.
- -1::.- •Cumulative - Modeled 0 Precipitation
..... ..... w '1' z: .:..~ ~ ~f ! t
:;
t~ :::l ~ ~
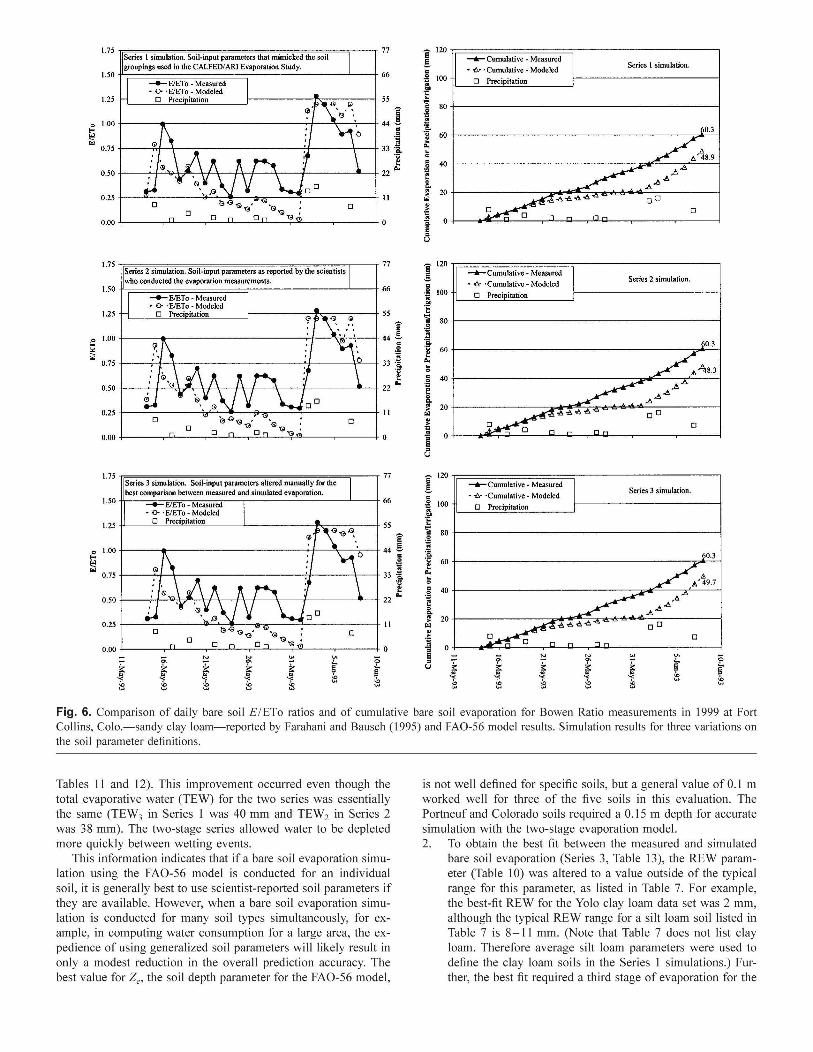
Fig. 6. Comparison of daily bare soil EIETo ratios and of cumulative bare soil evaporation for Bowen Ratio measurements in 1999 at FOt1 Collins, Colo.-sandy clay loam-reported by Farahani and Bausch (1995) and FAO-56 model results. Simulation results for three variations on the soil parameter definitions.
Tables 11 and 12). This improvement occurred even though the total evaporative water (TEW) for the two series was essentially the same (TEW3 in Series 1 was 40 mm and TEW2 in Series 2 was 38 mm). The two-stage series allowed water to be depleted more quickly between wetting events.
This infonnation indicates that if a bare soil evaporation simulation using the FAO-56 model is conducted for an individual soil, it is generally best to use scientist-reported soil parameters if they are available. However, when a bare soil evaporation simulation is conducted for many soil types simultaneously, for example, in computing water consumption for a large area, the expedience of using generalized soil parameters will likely result in only a modest reduction in the overall prediction accuracy. The best value for Ze, the soil depth parameter for the FAO-56 model,
is not well defined for specific soils, but a general value of 0.1 m worked well for three of the five soils in this evaluation. The Portneuf and Colorado soils required a 0.15 m depth for accurate simulation with the two-stage evaporation model. 2. To obtain the best fit between the measured and simulated
bare soil evaporation (Series 3, Table 13), the REW parameter (Table 10) was altered to a value outside of the typical range for this parameter, as listed in Table 7. For example, the best-fit REW for the Yolo clay loam data set was 2 mm, although the typical REW range for a silt loam soil listed in Table 7 is 8-11 mm. (Note that Table 7 does not list clay loam. Therefore average silt loam parameters were used to define the clay loam soils in the Series 1 simulations.) Further, the best fit required a third stage of evaporation for the

Table 11. Measurements of Bare Soil Evaporation Compared to FAO-56 Simulated Bare Soil Evaporation. Simulation Series 1.
Ritchie Parlange et al. Wright (personal Farahan i and (1972) (1992) Howell et al. (1995) communication, 200 I) Bausch (1995)
Soil type Clay Clay loam Clay loam
Year measurements were collected 1969 1990 1989 1991 1992
Measurement method Lysimeter Lysimeter Lysimeter
Number of days from start to end of evaluated 12 10 31 41 40 period
Rain or irrigation during period (mm) 48.4 18.! 74.0 104.8 95.7
Measured cumulative bare soil evaporation (mm) 24.2 16.8 52.8 93.7 81.2
Modified FAO-56 modeled cumulative bare soil 24.7 18.3 51.5 87.9 84.4 evaporation (mm)
Percent difference between measured and modeled 2.1 8.9 -2.4 -6.1 3.9 cumulative E (%)
Evaporation-weighted average percent difference between measured and modeled cumulative bare soil evaporation (%)
Silt loam
1977
Lysimeter
37
Sandy Clay loam
1993
Bowen ratio
25
223.8
117.9
101.8
56.1
60.3
48.1
-13.7 -20.2
Without Ritchie
-7.3
All data sets -6.3
Table 12. Measurements of Bare Soil Evaporation Compared to FAO 56 Simulated Bare Soil Evaporation. Simulation Series 2.
Ritchie Parlange et al. Howell et al. Wright Farahani and (1972) (1992) (1995) (personal communication, 200 I) Bausch (1995)
Measured cumulative bare soil evaporation (mm) 16.8 52.8 93.7 81.2 117.9 60.3
Modified FAO-56 modeled cumulative bare soil 18.1 52.5 88.9 85.6 Ill.? 48.3 evaporation (mm)
Percent difference between measured and modeled 7.9 -0.6 -5.1 5.4 -5.3 -19.9 cumulative E (%)
Without Ritchie
Evaporation-weighted average percent difference between measured and modeled cumulative bare soil -4.2 evaporation (%)
Table 13. Measurements of Bare Soil Evaporation Compared to FAO 56 Simulated Bare Soil Evaporation. Simulation Series 3.
Ritchie Parlange et al. Howell et al. Wright (personal Farahani and (1972) (1992) (1995) communication, 200 I) Bausch (1995)
Measured cumulative bare soil evaporation (mm) 24.2 16.8 52.8 93.7 81.2 117.9 60.3
Modified FAO-56 modeled cumulative bare soil 24.6 16.1 52.5 88.9 85.6 116.8 49.7 evaporation (mm)
Percent difference between measured and modeled 1.6% -4.0% -0.6% -5.1 % 5.4% -0.9% 17.6% cumulative E
Without Ritchie All data sets
Evaporation-weighted average percent difference between measured and modeled cumulative bare soil -3.1% -2.8% evaporation

Yolo clay loam soil, with a TEW2 of 6 mm, as opposed to the TEW2 range of 18-25 mm for silt loam soil in Table 7.
Although not tested, it may have been possible to obtain bestfit parameters for the Series 3 simulations closer to expected ranges in value had the Ze parameter, representing the depth of drying in the profile at the end of stage 2, been allowed to vary more. However, what seems crucial is that the overall benefit of using best-fit soil parameters (Table 13), rather than general (Table 11) or scientist-reported (Table 12) soil parameters, appears to be rather modest. Furthermore, in order to identify bestfit soil parameters, one must have a complete bare soil evaporation data set for optimizing the specific FAO-56 model soil parameters. If such a data set is not readily available, it is likely that the potential improvement in simulation would likely be overshadowed by the cost and effort required to obtain the data. 3. The average evaporation weighted errors indicate that the
model underestimates bare soil evaporation by about 7% (Tables 11-13). This said, the relatively sparse number of bare soil evaporation data sets that were available for this evaluation does not allow one to conclude a bias for the FAO-56 evaporation model to overestimate or underestimate bare soil evaporation using the published model parameters.
4. To assess a 95% confidence interval containing model error may result in an erroneous measure of the model accuracy, simply due to the limited number of available data sets. Instead, it may be better to look at the nonevaporation weighted percent differences and to use observed errors to generalize the potential model accuracy.
The Series I simulations (using soil parameters defined in Table 7 and the CALFEDIARI Evaporation Study method for grouping the soil types) can be used as an approximation of expected error. Some percent differences between the measured and modeled cumulative bare soil evaporation were high (8.9%) and some were low (-20.2%). From this range, we estimate the general accuracy of the FAO-56 model, when applied with general estimates of soil parameters, to be about ± 15%.
Conclusions
The measured and the two- and three-stage FAO-56 simulated EIETo and cumulative bare soil evaporation trends and values were similar for each of the three methods used for defining soil simulation parameters. All other things being equal, the Series 2 simulation using measured soil parameters tended to give similar results to the Series I simulation that used generalized soil parameters. The Series 3 simulation indicated that the soil parameters can be varied from general or measured values to obtain somewhat better correlations-even though there may not be a logical justification for individual parameter values except to obtain better correlations. Specifically, the average evaporation weighted percent difference between the measured and the simulated cumulative evaporation was -4.2% for the Series 2 simulations and -7.3 and -3.1% for the Series I and Series 3 simulations, respectively, for data sets that were directly comparable.
The tendency for the model to underestimate bare soil evaporation for the data sets in this evaluation by 7% does not necessarily mean that the FAO-56 model will always underestimate evaporation since the number of possible data sets evaluated (7) was relatively small. Simulations of some of the data sets resulted in an overestimate and some resulted in an underestimate of the cumulative evaporation measurements. Therefore this evaluation
does not conclusively indicate that the FAO-56 model has a bias when simulating bare soil evaporation.
Rather than identifying the statistical accuracy of the model for predicting bare soil evaporation using the relatively sparse number of identified data sets, the accuracy may be best estimated by general comparison of the measured and simulated evaporation. For the simulations that used the general soil parameters published in FAO-56 (Series I), it appears that the model is accurate to about ±15% based on the largest overestimate and the largest underestimate of the cumulative bare soil evaporation.
For bare soil evaporation simulations, it seems reasonable that if one has good site-specific soil parameter information for use in the FAO-56 model, the results will tend to have a modest improvement over a simulation that uses generally defined soil parameters. For broad scope evaluations of bare soil evaporation, use of generalized soil parameters seem to be dependable. The effort to obtain the site specific parameters will tend to be rewarded by only modest improvements in the evaporation estimate.
The simulations using best-fit soil parameters (Simulation Series 3) were for comparison purposes only to find the most improvement possible in model accuracy. The Series 3 simulation is artificial in nature, as the optimized parameter values tended to be outside the normal ranges expected for soils. The results were only slightly better than for the other two simulation series.
References
Allen, R. G. (1998). "The revised FAa procedure for estimating crop evapotranspiration." Imperial Irrigation District Water Use Assessmentfor the Years 1987-1996, Appendix A3.3 of Water Study Team, A3.64-A3.82.
Allen, R. G., Pereira, L. S., Raes, D., and Smith, M. (1998). "Crop evapotranspiration; Guidelines for computing crop water requirements." FAD lrrigation and Drainage Paper No. 56, Rome, Italy.
Allen, R. G., Pereira, L. S., Smith, M., Raes, D., and Wright, J. L. (2005). "FAa-56 dual crop coefficient method for predicting evaporation from soil and application extensions." J. lrrig. Drain. Eng., 131(1), xxx~xxx.
Allen, R. G., Smith, M., Pereira, L. S., Raes, D., and Wright, J. L. (2000). "Revised FAa procedures for calculating evapotranspiration, with
testing in Idaho." ASCE Watershed Management Conf, Ft. Collins,
Colo., Published on CD-ROM. Burt, C. M., Mutziger, A. J., Howes, D. J., and Solomon, K. H. (2002).
Evaporation from irrigated agriculture land in California. A study funded by the CALFED and the California State University! Agricultural Research Inititiative. Available on the web page (http:// www.itrc.orglreports!reportsindex.html). Irrigation Training and Research Center. California Polytechnic State Univ. San Luis Obispo, Calif.
Colorado Agricultural Meteorological Network (CoAgMet) weather data. (2001). (http://ccc.atmos.colostate.edu/-coag/) (verified May 10, 2001).
"Daily CIMIS weather data." (2001 a). (http://www.lpm.ucdavis.edu/ WEATHERlwxretrieve.html) (verified May 10,2001).
Eching, S., and Moellenberndt, D. (1998). Technical elements ofC1M/S.
The California Irrigation Management Information System. State of California, The Resources Agency, Department of Water Resources, Division of Planning and Local Assistance. Sacramento, Calif.
Farahani, H. J., and Bausch, W. C. (1995). "Performance of evapotranspiration models for maizbare soil to closed canopy." Trans. ASAE, 38(4), 1049-1059.
"Hourly CIMIS weather data." (200 Ib). Telnet session to "aviion.water.ca.gov" using CIMIS registered user name and pass

word. CIMIS helpline (800) 922-4647 or direct line to Simon Eching
(916-327-1836) (verified May 10,2001). Howell, T. A., Steiner, J. L., Schneider, A. D., and Evett, S. R. (1995).
"Evapotranspiration of irrigated winter wheat-Southern Plains."
Trans. ASAE, 38(3), 745~759.
National Oceanic and Atmospheric Administration, National Climatic
Data Center (2001). 828-271-4800, [email protected], or (http://
www.ncdc.noaa.gov/) (verified May 10,2001). Parlange, M. B., and Katul, G. G. (1992). "Estimation of the diurnal
variation of potential evaporation from a wet bare soil surface." J
Hydro/., 132, 71-89. Parlange, M. B., Katul, G. G., Cuenca, R. H., Kavvas, M. L., Nielsen, D.
R., and Mata, M. (1992). "Physical basis for a time series model of
soil water content." Water Resour. Res., 28,2437-2446.
Pruitt, W.O., and Doorenbos, J. (1977). Proc., Int. Round Table Con! on "Evapotranspiration, " Budapest, Hungary.
Ritchie, J. T. (1972). "Model for predicting evaporation from a crop with incomplete cover." Water Resour. Res., 8,1204-1213.
Snyder, R., Bali, K., Ventura, F., and Gomez-MacPherson, H. (2000). "Estimating evaporation from bare or nearly bare soil." J Irrig. Drain. Eng., 126(6), 399-403.
USDA-NRCS Soil Survey Division Official Soil Series Descriptions Data Access web site. (200 I). (http://www.statlab.iastate.edu/soils/osd/) (verified May 10,2001).
Water Study Team. (1998). Imperial irrigation district water use assess
ment for the years 1987-1996, Received via Freedom of Information Act.
Wright, J. L. (1982). "New evapotranspiration crop coefficients." 1. Irrig. Drain. Eng., 108(1),57-74.