comparison of manual and automated food inventory
TRANSCRIPT

COMPARISON OF MANUAL AND AUTOMATED FOOD
INVENTORY VALUATION SYSTEMS FOR THE
PRIVATE CLUB FOOD SERVICE
by
CECELIA JAN KRUSE, B.S.
A THESIS
IN
RESTAURANT, HOTEL, AND INSTITUTIONAL MANAGEMENT
Submitted to the Graduate Faculty of Texas Tech University in
Partial Fulfillment of the Requirements for
the Degree of
MASTER OF SCIENCE
Approved
Accepted
May, 1993

ACKNOWLEDGEMENTS
With gratitude and deep respect, special thanks is
given to Dr. Linda c. Hoover. The special interest,
patience, and support extended by her created a desire to
accomplish and learn more than I expected. The advice and
encouragement of Dr. Lynn Huffman and Dr. Penny Granucci
made my goals attainable and more worthwhile. A special
thanks is extended to them.
For offering patience, love, support, and
encouragement, this assignment is dedicated to my
grandparents, Otis and Edith McBride. Their inspiration and
guidance have been offered willingly and lovingly without
hesitation through every phase of my life.
Sincere gratitude and special love is given to Corky
and Donna Sue Kruse; Kip and Shelia Wadleigh; and my best
buddies P.K. Wadleigh and Cathy Palmer for endless
encouragement and continuous support. The memory of my
brother, Perry Kruse, provides a constant desire to
accomplish more than I think I can.
ii

TABLE OF CONTENTS
ACKNOWLEDGEMENTS. . • • • • . • • • . • • • . • • • • . • • • . • . • • . • • • • . • • • . ii
LIST OF TABLES. . . . . . . . . . . . . . . . . . . . . . . . . . . . . . . . . . . . . . . . vi
CHAPTER
I. INTRODUCTION. . . . . . . • . . . • . . . • . . . . . . . . . • . . . . . . . 1
Statement of the Problem..................... 2
Purpose of the Study......................... 2
Research Questions........................... 3
Definitions.................................. 3
Assumptions. . . . . . . . . . . . . . . . . . . . . . . . . . . . . . . . . . 4
Limitations.................................. 5
II. REVIEW OF LITERATURE......................... 7
Inventory Valuation Methods.................. 10
Inventory Valuation Systems.................. 14
Manual Systems. . . . . . . . . . . . . . . . . . . . . . . . . . . 14 Automated Systems........................ 15
Time Studies. . . . . . . . . . . . . . . . . . . . . . . . . . . . . . . . . 21
Case Studies. . . . . . . . . . . . . . . . . . . . . . . . . . . . . . . . . 2 2
Summary. . . . . . . . . . . . . . . . . . . . . . . . . . . . . . . . . . . . . . 2 3
III. METHODOLOGY. . • • • . • • • • . • • • • • • • • • • • • . • • • . • • • • • • 24
Data Collection............................. 24
Manual and Automated Calculations........... 26
Accuracy Data . . . . . . . . . . . . . . . . . . . . . . . . . . . . . . 27
Timing the Data Collection.................. 27
Cost Analysis of Valuation Systems.......... 28
IV. RESULTS AND DISCUSSIONS...................... 29
iii

Existing Physical Inventory Procedures....... 29
Accuracy of Inventory Valuation.............. 30
Types of Errors......................... 30 Accuracy of the Manual and Automated Systems. . . . . • . . . . . . . . . . . . . . . . . . . . . • . . . . • 3 2
Time Required for Inventory Valuation........ 35
Manual Valuation System................. 35 Automated Valuation System.............. 37
Projected Cost Savings....................... 38
Analysis of the Results...................... 39
Summary. . . . . . . . . . . . . . . . . . . . . . . . . . . . . . . . . . . . . . 4 2
V. SUMMARY AND CONCLUSIONS...................... 43
Statement of the Problem..................... 43
Research Questions........................... 44
Results and Conclusions...................... 44
Impact of the Study.......................... 46
Recommendations. . . . . . . . . . . . . . . . . . . . . . . . . . . . . . 4 7
REFERENCES. • • • • . • . • . • • • . . . . . • • • • . . . . . • • • . . . . . • . • . . • . . • 4 9
APPENDICES
A. INVENTORY SAMPLE . . . • . . . . . . . . . . . . . . . . . . . . . . . . . 52
B. COUNTING PROCEDURES. . . . . . . . . . . . . . . . . . . . . . . . . . 53
C. INVENTORY PROCEDURES......................... 54
D. MANUAL INVENTORY SHEET. . . . . . . . . . . . . . . . . . . . . . . 56
E. AUTOMATED INVENTORY SHEET.................... 57
F. AUTOMATED INVENTORY FORMULAS................. 58
G. COMPUTATION ERRORS. . . . . . . . . . . . . . . . . . . . . . . . . . . 59
H. INVENTORY TIME SHEET. . . . . . . . . . . . . . . . . . . . . . . . . 6 0
iv

I. LABOR COST ••••••••••••••••••••••••••••••••••• 61
J. SYSTEM COSTS ••••••••••••••••••••••••••••••••• 62
v

LIST OF TABLES
1. Errors in manual and automated valuation systems for food inventory .................•......• 31
2. Elapsed time for manual and automated valuation of food inventory ..........•....................... 36
3. Quarterly and annual cost for the manual and automated valuation systems. . . . . . . . . . . . . . . . . . • . . . . . 40
vi

CHAPTER I
INTRODUCTION
Inventory control is essential to the efficient
management of a private club. Inventory valuation of stock
on hand is an important aspect of this controlling process.
Calculating the value of these commodities is necessary to
the establishment of asset and cost of goods sold figures
when presenting the monthly balance sheet and income
statement (Coltman, 1989). The inventory is considered an
asset on the balance sheet and, when totaled with other
assets, indicates the potential worth of the private club.
In preparing an income statement, the opening and closing
inventories are used to demonstrate the cost of the goods
sold by the establishment (Schmidgall, 1990). To generate
an accurate representation of the club's worth, the
inventory valuation system employed must be accurate and
reliable.
Producing accurate financial reports depends on the
assessment of the value of each department's assets. The
food department manager is expected to calculate and assess
the value of the department's inventory, including food, and
provide the accounting department with precise financial
information (Kasavana, 1992). To be an effective manager
and run a successful foodservice operation, inventory
control and calculating its potential worth is crucial.
1

2
Statement of the Problem
To evaluate the food inventory on a monthly basis and
at the end of the fiscal year, the foodservice manager needs
to implement an accurate and timely system to present
precise numbers to the accounting department (Coltman,
1989). This system should incorporate the processing of the
values of individual inventory items and the calculation of
a comprehensive total for the kitchen inventory. When
managers must rely on the manual computation of such
numbers, the processing is not entirely accurate nor is it
quick. The computation of the total inventory value can be
extremely tedious and time-consuming if it must be
calculated using a calculator. Alternative systems which
alleviate the tediousness of these duties should be
explored.
Purpose of the Study
The purpose of this study was to compare the manual and
automated food inventory valuation systems for the food
department of a private club. The specific objectives of
this study were to:
1. Determine the value of a private club's monthly
food inventory by means of both a manual and
automated system, based on invoices of food
purchases and a physical count.

3
2. Determine the accuracy of the manual and automated
systems by reviewing the inventory source
documents and reports.
3. Calculate the cost of each system based on the
amount of time required to valuate the inventory
and the salary and benefit data of the employee
involved in this process.
4. Compare the accuracy and cost data to identify
which of the systems provides the most accurate
and cost effective approach to inventory
valuations.
Research Questions
The research questions addressed by this study are:
1. Will inventory calculations be more accurate and
require less time when the inventory is taken and
computed using the automated system?
2. What are the potential cost savings of the
automated valuation system as a tool in
calculating the inventory of the private club?
Definitions
An automated valuation system is a system which
utilizes an electronic machine (computer) to compile and
correlate data and perform inventory calculations according
to an internally stored program of instruction.

4
Data are the facts or concepts suitable to be processed
by either system. Data for this study will include physical
inventory counts and prices from actual invoices.
An electronic spreadsheet is a computer program that
displays on a screen an electronic worksheet with lettered
columns and numbered rows and allows for easy manipulation
of the figures involved.
The inventory packet contains the source documents
(inventory sheets) that, when completed at the end of the
month, will be marked by the kitchen manager indicating the
quantity of each item in the inventory.
A manual valuation system is a system that is used to
calculate the value of an inventory using a ten-key machine
and the inventory sheets supplied by the counter.
Assumptions
One of the major assumptions made during this study was
that the inventory was counted accurately. Considering the
large number of inventory items, the various locations in
the facility, and the time required to conduct the inventory
count, it would be logical to assume that errors might have
been made.
When reading and interpreting the invoices, there were
various code names and different sizes for many items kept
in stock at the private club. To display an accurate price
for each item, care had to be taken to assign the correct
value for the inventory listings.

5
Limitations
The latest purchase price method used in this study to
value the inventory is the most practical for this private
club when considering the number of personnel employed, the
small size of the inventory, and, most importantly, it is
the method chosen by the manager and directors of the
facility. Other methods may be more accurate and sensitive;
however, they require more time and effort to track new
inventory, assign prices to new inventory, and calculate the
inventory for the accounting period.
The manager calculating the inventory had to be able to
use a ten-key machine and a computer keyboard, to some
extent, so that the spreadsheet could be used efficiently.
Learning to use the computer system and adapting an
automated system to fit the club's needs might require more
time and energy than should seem necessary. However, the
potential accuracy and speed of using the automated system
would be negated if the employee cannot utilize the system
to benefit the club.
The case study method was selected for this study so
that the researcher could determine how the implementation
of an automated inventory valuation system would benefit the
private club. The inability to generalize the results to
other private clubs is the major limitation of this study.

6
However, conclusions from this study may provide information
so that subsequent research results can be more generalized.

CHAPTER II
REVIEW OF LITERATURE
Inventory is comprised of the food and beverages that
the private club owns. These nonmonetary assets are the
commodities in which the foodservice operation invests for
resale in order to make a profit (Schmidgall, 1990). The
food inventory of a foodservice operation is its most
perishable asset and must be guarded carefully since any
waste is literally money spent to gain nothing. If money is
held in inventory, it is not available for profitable
investments. The costs of inventory are largely hidden and
can be overlooked, but they are actually quite significant.
Increased stock on hand results in more handling, cleaning,
counting, and so forth. Manhours and capital are required
to keep excessive stocks of goods in supply (Powers &
Powers, 1984). The private club caters exclusively to
members, limiting the customer count considerably, making
the inventory in stock even more important because of the
chance of serving fewer diners than a regular restaurant.
The commodities available for resale should be kept in
quantities large enough to produce menu items available for
customers while allowing the least investment possible in
the inventory. To operate efficiently, the foodservice
operation should monitor the volume of food purchased and
keep stock at levels to maintain effectiveness. The
7

hospitality operation must perform an inventory count and
valuation at least once a month for the profit and loss
statement to be prepared and to monitor the food on hand
(Stefanelli, 1992). While running out of products is
intolerable, careful ordering certainly is necessary to
avoid the cost of overstocking (Powers & Powers, 1984).
8
Financial accounting centers on accounts payable,
inventory control, payroll, financial statement preparation,
and financial management issues. Counting, calculating, and
reporting the inventory valuation is an important aspect of
this accounting. Along with the other responsibilities of
financial accounting, inventory control aids in measuring
and reporting varied financial information for decision
making and operational planning (Kasavana, 1992). Inventory
management provides an integral part of ensuring that
accurate income statements are produced for the food
operation (Coltman, 1989). The balance sheet reflects the
soundness of the club by presenting its statement of
financial position, for a stated period of time. This
provides a detailed summary of the club's net worth and
enables the calculation of some important financial ratios
(Kasavana, 1992). The computed inventory values are
valuable elements of the balance sheet. The inventory, as
an asset, is an important part of the resources of the club.
The income statement reports the financial
profitability of the club for a specific period of time
9
(Kasavana, 1992). As a summary of revenues received from
the sale of goods and costs incurred by cost of goods sold,
the income statement indicates the profit of the club. By
using the beginning and ending inventory values, inventory
purchases, and goods used internally, the cost of goods sold
or cost of sales is entered on the income statement. If
revenues exceed expenses, net earnings result, but should
the reverse by true, then a loss is determined (Kasavana,
1992). To generate numbers to indicate an accurate
representation of the worth of the club, the inventory
valuation system employed must be accurate, reliable, and
quick.
Managing food inventories requires that sufficient
supplies of food be available. However, excessive amounts
on hand leads to (1) spoilage, because food must be held too
long before being used; (2) excessive capital tied up in
inventory; (3) higher that necessary labor cost to handle
the greater amount of food; (4) greater than necessary space
allocated to storage; and (5) unwarranted opportunities for
theft (Dittmer & Griffin, 1984). With increasing cost
pressures, the objective of inventory control is to maintain
inventories keeping both the amount of money that has to be
invested in inventory and the storage and handling costs as
low as possible (Keiser, 1989). Without proper physical
inventory management, it is possible for one to maintain a
misleadingly low food cost by not recording requisitions and

10
not replacing food taken from storage. Management must be
aware of the stock levels on hand and how much is expected
to be used before the next order can be received (Dittmer &
Griffin, 1984).
In addition to supplying the correct numbers for the
financial statements, ensuring the least possible investment
tied up in an extremely perishable commodity, and aiding the
manager in ordering each period, the inventory sheet
provides other elements of cost control. The inventory will
show the manager the usage of various foods and how fast
they move from the shelf, or if they are no longer needed.
By taking inventory more often, the numbers garnered will
indicate any unexpected shortage from theft, or overstock
that might lend to easy theft. It is necessary to have
access to the inventory numbers in stock to maintain
quality service, yet not overinvest in items that will only
take up space or spoil on the shelves (Kasavana, 1992).
Inventory Valuation Methods
One of the principal difficulties with the procedure of
calculating the inventory extensions after the physical
count has been taken is determining the unit costs or values
for each item. Not all purchases made by the club are made
on the same day and at the same price during the purchasing
period. Determining what value to assign to units remaining
in inventory at the end of the accounting period raises the
question of which, if any, of the various prices should be
11
assigned to the unit item for purposes of inventory
valuation. According to Dittmer and Griffin (1984), there
are five methods of assigning values to units of commodities
in stock.
One of the first methods to consider is the Actual
Purchase Price Method. Each item is marked with the value
as it arrives, writing on the can or container its
particular price, and multiplying at the end of the month
the actual price of the commodity times the quantity on
hand. This can be done only if those prices are marked at
receiving, which takes a considerable amount of time. When
using the Actual Purchase Price Method, each inventory item
requires an extra step. Calculating each item's worth,
depending on the delivery date cost, consumes more time
because items on hand may have been acquired at different
prices. The addition of the totals for each different price
could create much more paper work and calculation time.
(Dittmer & Griffin, 1984).
Another method of assigning values is the First-In,
First-Out (FIFO) method. Assuming that stock is rotated
during the period, that the units consumed during the month
were the first to be shelved, and the remaining items are
actually the most recently purchased, then the FIFO method
can be applied to valuing the stock. Many times, however,
the most recently received items are the ones that are used
first. It is necessary to know the latest purchase price
12
and the number of items at that price, the next to last
delivery price, and the number of items received at that
price to determine the extension of the item. If there are
no guarantees that the stock on the shelves has been rotated
as it should, this method would not be the safest possible
course (Dittmer & Griffin, 1984).
The Weighted Average Purchase Price method is another
way of valuing the stock on hand. Where no certainty exists
that stock has been rotated and where large quantities of
goods are involved, it would be possible to determine a
weighted average purchase price by multiplying the number of
units in the opening inventory and in each purchase by their
individual purchase prices, adding these values to determine
a total value for all units together, and then dividing by
the number of units involved. It should be apparent that
while this procedure makes logical sense on paper, it
requires access to extensive documentation. In fact, it is
rather cumbersome and far too time-consuming to use in most
food and beverage operations (Dittmer & Griffin, 1984).
Another valuation method is the Last-In, First-out
(LIFO) method. In certain circumstances, this method would
be aptly employed. In periods of high inflation or when
management chooses to minimize profits on financial
statements in order to decrease income taxes, it is
possible, by LIFO, to maximize cost by minimizing the value
of the closing inventory. If management requests that
costs are kept at a higher level to minimize profits, this
can be achieved in times of rising prices by valuing the
remaining units in the inventory at an earlier purchase
price (Dittmer & Griffin, 1984}.
13
The fifth method is the Latest Purchase Price method, a
simpler, faster and more widely employed approach using the
latest price in valuing the closing inventory. This method
gives justification by asking how much an item would cost if
it were replaced at that time. The cost at the moment of
extension would be at the beginning of the month, and the
last price paid for an item would be the cost to replace it.
Multiplying the number of units on hand by the latest
purchase price gives the value for the item (Dittmer &
Griffin, 1984}.
Each of the five inventory valuation methods differ in
length of time used to calculate the total, reasons for
using the method, prices used on the inventory sheets, and
in final extension values. The selected method should be
understood by the inventory counter, those calculating the
inventory, and the accountant who produces financial
statements (Dittmer & Griffin, 1984}. After the choice is
made as to which of the valuing methods will be utilized,
the inventory can be extended.
It should be kept in mind that the food department
manager does not normally determine the method to be used in
valuing the club's inventory. The general manager, the

14
board of directors, and/or the accounting department decide
which method should be used by the private club. Once the
valuing system is chosen, the decision to utilize a
particular method is made and cannot be changed during the
yearly period. Regulations of the Internal Revenue Service
and accounting principles preclude any changes (Kasavana,
1992).
Inventory Valuation Systems
Manual System
Once the items in the inventory have been counted, the
next step in calculating the ending inventory value is to
price the inventory using the inventory value system most
appropriate to the operation. For this study, the latest
purchase price method was used. After the latest prices are
entered onto the inventory sheet, the manual valuation is
initiated. Using the ten-key machine, the purchase price of
each unit is divided by the number of items in the purchase
unit. This number will give a cost of each individual item.
The cost will then be multiplied times the actual number of
items counted in the inventory, and an extended cost
entered. Extending simply refers to multiplying the total
count on hand by its cost. The figure in the last column is
the extension for the inventory item; each item on the
inventory sheet is extended individually. Calculating each
individual item separately renders a value for each stock
item on hand. The values (or extensions) are added together

to give the "total inventory value" for the club's food
inventory (see Appendix A) (Powers & Powers, 1984).
Automated Systems
15
To calculate the inventory by means of an automated
system, the manager must have access to both computer
hardware and software. Computer hardware and software are
used to generate electronic data that can be used by club
management. The hardware is the machinery on which the
tasks are performed while the software makes the computer
work. The computer equipment includes keyboards, monitors
or displays, printers, disk drives, perhaps a POS (point of
sale) system, and CPU's (central processing unit). This
equipment can be used to create greater flexibility and can
result in improved operations (Wolverton, 1989). The
software, or programs, of the computer are what actually
makes the computer work. There are two types of software:
system programs that control the operation of the system and
application programs which perform more obviously useful
tasks, such as word processing or mathematical calculations
(Wolverton, 1989).
The hardware and the software equipment of the
automated system are vital to assist private club managers
and accountants in performing their day-to-day jobs
(Burford, 1990). The computer and its programs offer so
much freedom to design software to do what is necessary for

16
any size facility and is not limited just in valuing
inventory (Mainelli, 1989). Dennington (1989) reported that
at least 90% of the educational institutions surveyed either
taught or used spreadsheet programs. These spreadsheet
programs can be easily adapted in the foodservice department
to calculate inventory values and give an inventory total
quickly.
In the private club sector, it was reported that, in
1991, food and beverage sales were up 5.4 percent over 1990
(Gordon, 1991). With this growth, it seems likely that,
with the software and hardware available, more managers will
learn to use this technology during the 90's (Woodman,
1991). Software is now readily available to manage
inventory with a personal computer. Computers can lead to
greater productivity through the replacement of tedious
manual tasks (Young, 1989). Many manual robot-like tasks
have become automated, freeing management to allocate
personnel to functions requiring more decision-making
capabilities (Kasavana, 1984). An article in the Bottomline
(Clubs, 1986) stated that at least two-thirds of medium
sized clubs were utilizing some type of computer system.
Club usage of the computer was indicated in areas such as
payroll processing, general ledger, and inventory. A survey
by Buergermeister and Van Loenen (1990) noted that 54.6% of
the restaurants that have been in business at least two
years owned and used a computer. In the same survey,

17
personnel management and inventory software were programs
used most often (72.1%) by managers. Use of the computer
for inventory was favored by 65.3% of the respondents. Some
specific features identified by the computer users as most
useful included: maintenance of a perpetual inventory,
provision of an inventory listing, and integration to
automatically update cost changes to other applications in
the system.
Choosing a software package designed for the private
club is vital for a successful club computer system. The
idea of having membership information close at hand is one
benefit to having a program that is specifically geared for
the private club (Mainelli,1989). Vendors have responded to
these needs with software products for club operations. By
combining membership control and reporting, membership
accounting and accounts receivable, accounts payable,
general ledger, and payroll, the private club has access to
figures and information that other restaurant businesses do
not need on their systems.
Integrated computerization provides for a double-entry
accounting system. The user makes only one entry, such as
the inventory total, and this total is automatically
entered onto the balance sheet in the program, and the cost
of sales is calculated for the income statement. This type
of computer program is a valuable system that can generate
reports within a short time frame (Kasavana, 1992). Having

18
interactive file transfers and resource sharing with minimal
data handling and elapsed time are very helpful and
effective in the hectic foodservice operation (Kasavana,
1990). Programs built to industry specifications and to
interconnect with other programs are known as customized
programs. They have the potential to improve efficiency,
productivity, and profitability for the private club
(Mainelli, 1989).
Generic software are non-specific programs that provide
the manager with the opportunity to develop or modify them
for desired applications. Generic programs tend to be
easier to use in a start-up environment. These individual
programs do not share resources with other programs and take
much more time for data entry which is required to generate
financial statements (Kasavana, 1990). While generic
software can provide information, having an integrated,
customized program will, in the long-run, be more beneficial
to the bookkeeping and management departments.
An electronic spreadsheet program, a type of generic
software, calculates the total inventory costs associated
with a particular unit of inventory (Barr & Bell, 1991).
Basically, the electronic spreadsheet is an electronic
replacement for the traditional financial modeling tools:
the accountant's columnar pad, pencil, and calculator (Lotus
1-2-3, 1987). The electronic spreadsheet allows a user to
enter information into the program and view it on the

19
terminal. By using a standard computer spreadsheet package
it is possible to design and build an effective model of a
club's inventory spreadsheet that facilitates the routine of
calculating the numbers manually. Some of the major
benefits of generating the spreadsheet are:
1. Absence of programming. Programming instructions
are easily understood and implemented.
2. Rapid computation. A key feature of the
spreadsheet is the speed at which it calculates
data.
3. Instant feedback. As data is entered into the
program, the figures change instantly and a new
total is obvious.
4. Documentation. As soon as all the data is
entered, a complete printout can be available
(Harris, 1991).
The physical inventory provides information that is
used to update the data in the computer. With this
information included at the end of the accounting period, it
is possible to obtain a report showing the value of
inventory by one of the automated methods. It is readily
apparent that the calculation of the closing inventory value
can be completed much faster by computer than by manual
means (Dittmer & Griffin, 1984).
As with any generic data base, it is initially time
consuming to put all of the information into the program and

20
arrange it to meet the needs of the program. However, once
all of the items of stock are entered into the program,
along with the packing, the packing cost, the item cost, and
the calculations, entering the quantity is the last step to
generate an inventory total (Plotkin, 1990). An inventory
control spreadsheet program on the personal computer is
relatively easy to generate and maintain, and it is very
effective. The typical spreadsheet will include columns
for:
1. The product name and brand.
2. Pack size. For example, 17oz tells the counter
that the bottle of Heinz ketchup should be the
17oz size.
3. Pack count. For example, 12*17oz bottles
indicates the pack, or how many units are in each
pack.
4. Case cost. This price is the total cost of the
entire pack as delivered.
5. Unit cost. This figure is calculated by the
computer by dividing the case cost by the pack
count.
6. Count or quantity. This is the actual number
physically counted in inventory.
7. The extended cost. This is the final column and
indicates the total number of items counted times
the unit cost. This final column will be added
with the other final columns to generate a total
inventory (Pappas, 1988).
21
The electronic spreadsheet employs calculations that
can save time and money when implemented properly. The
major differences between the computerized program and a
program performed manually is the speed and accuracy of the
computer over the ten-key machine. The computer can replace
the calculator and enable the user to complete the
calculations in seconds rather that hours, ensure
mathematical accuracy of the calculations, print results in
a "ready" format, and provide storage of the spreadsheet for
use month after month (Burford, 1990).
Time Studies
To determine if using an automated system actually is
more efficient, a time study is needed. Time studies
frequently incorporate the time-series research design, a
quasi-experimental approach which involves the periodic
measurement of the time required to perform a task or tasks
and the introduction of an experimental change into this
series of measurements. The problem under investigation
and the type of measuring device determine whether a time
series design should be used in a particular study (Campbell
& stanley, 1963). The time-series design is applied when a
control group cannot be included in a study (Touliatos &
compton, 1988). By studying the procedures occurring over a
period of time, it is possible to evaluate the tasks and

22
compare the results to another task evaluation when true
experiments are inappropriate to the program being evaluated
(Babbie, 1989). Time studies are an effective method of
identifying tasks or services provided, establishing
reliable estimates of time for each task, and providing data
for determining whether tasks are appropriate and effective
(Pedderson, 1982).
Hume, Shanklin, and Lousley (1987) employed a timing
procedure when evaluating a computer-assisted recipe costing
program. Their study compared the time required to
calculate costs by manual and computerized methods. A
significant difference was found between the accuracy of the
manual method and the accuracy of the computer method. The
time required by each method was not significantly
different, however, unfamiliarity with the computer keyboard
was ascertained as one of the reasons (Hume, Shanklin, &
Lousley, 1987). Time expenditures were also utilized by
Shanklin, Hernandez, Gould, and Gorman (1988) to analyze the
time required by clinical dietitians to perform daily tasks.
In this study, dietitians were studied to analyze time spent
while performing various duties. Relationships between time
required to perform various activities was determined
(Shanklin et al., 1988).
Case Studies
Since hospitality is a relatively new field of study, a
variety of research methods are appropriate for use when

23
exploring industry problems. This includes the case study
approach. The case study is a type of field study which
provides an in-depth analysis of an individual or a program.
The case study is a part of descriptive research that
ventures into new and experimental methods of testing
subjects when seeking answers to why or how something works.
Single-case designs are selected when testing an extreme or
unique case that requires careful documentation and analysis
(Touliatos & Compton, 1988). Descriptive research, using a
case study and time study, will not create laws and
conclusions, but will provide clues for subsequent research
to pin down and generalize on the results of this testing
(Simon & Burstein, 1985).
summary
The food inventory is an important asset of a private
country club. These investments must be closely monitored
and accounted for on a periodic basis. Maintaining the
quantities on hand that are necessary to serve the members,
yet minimizing cash invested in inventory, is an area on
which the manager should concentrate. Accurate counting of
inventory, precise calculations of extended costs, and
efficient use of time are major concerns when designing a
food inventory system.

CHAPTER III
METHODOLOGY
This study compared two systems for calculating the
value of food inventory. Specifically, the time required
and accuracy of the two systems used to calculate the
inventory were compared. Prior to data collection,
procedures and forms developed for this study were pre
tested with actual data. Modifications were made as deemed
necessary to provide accurate results for the study. The
valuation method used was the latest purchase price method
based on each month's invoices to calculate the inventory
for the private club. The actual study was conducted in
June, July, and August of 1992.
Data Collection
The data for the inventory calculations began with the
transferring of item prices from the invoices to the
inventory sheets. Care was taken when reading invoices to
identify the various packs or counts of each item (Appendix
B). Because restaurant foods are often bought in varying
pack formats, the counter was instructed to be cautious as
to what was actually counted.
Data reporting the time required to calculate the
inventory and information concerning errors committed during
the inventory valuation was recorded. The time required to
utilize each system was determined and compared.
24

25
Additionally, data was gathered and compared concerning the
errors committed while calculating with the ten-key machine
and the errors committed while entering the data in the
computer program. Because the data was collected for three
separate accounting periods for one test site, this study
followed the pattern of a case study (Compton & Hall, 1972).
Tasks were completed by the researcher, computations and
entries were monitored, and the elements of the comparison
were studied by comparing the timed results and the errors
committed. By testing the time and accuracy required to
perform the inventory calculations, this study addressed the
usefulness of the computer-assisted programs as an aid to
inventory valuation.
Protocol was developed to assure that data was
collected in a standardized manner. By following the
guidelines in Appendix B, the steps taken while performing
the duties were standardized. The steps outlined in
Appendix C were followed to ensure that the data were
identically checked and evaluated for each month that the
data was collected. When determining the latest purchase
price, the invoices for the current month were used.
However, the last day was viewed first to identify the most
current purchase prices for the delivered stock. By
arranging the invoices in reverse order, each item purchased
during the month was assigned the most current price. Using
the inventory sheet with the actual counts, the manager

26
located each inventory item listed on the invoices and
entered the new price beside the item in the correct column.
Quantities and current prices had been entered for all the
items on the inventory sheet. New items purchased during
the month had been added with the necessary information, the
prices and/or unit packs had been changed and, if necessary,
the prices and unit packs were recorded for the items not
altered or purchased during the month based on the previous
month's inventory data. The next step was to determine each
item's total worth.
Manual and Automated Calculations
Using the manual system, the extensions were calculated
by multiplying the count of each commodity times the unit
cost of each commodity (Appendix D). Once the extension of
each item was completed, these totals were summed to
determine the total dollar value of the inventory. Using
the automated system, the manager transferred the latest
purchase price from the inventory sheet for items purchased
during the month and added new items purchased during the
month, along with the number of units on hand. The
electronic spreadsheet calculated the extension using the
formulas entered when the program was established by
multiplying the quantity of each item times the unit price
for the each item in the entire inventory, giving a total
dollar value of the inventory on the spreadsheet (Appendix E
& F) •

27
Accuracy Data
When both methods were completed, an impartial party
reviewed the numbers on the computer print-out to check for
accuracy in the transfer from the inventory sheet to the
spreadsheet and on the counter's inventory sheet. The
numbers were compared with those in the inventory packet to
check for the accuracy on the manual computations. The
errors committed for each system were entered onto the
Computation Errors sheet (Appendix G) and transposed onto
the evaluation sheets. The errors sheet gave an indication
as to where the majority of the errors were committed using
each system. This same procedure was followed for each of
the three months for which data was collected.
Timing the Data Collection
For actual data collection, two digital stopwatches
were utilized. The timer started the watches when the new
prices and new unit packs were transferred from the month's
invoices to the inventory sheets from the previous month.
The second stage was timed when the actual calculations for
unit prices were begun on the manual method and when the
spreadsheet was booted for viewing on the computer monitor.
The timer stopped the watch for any breaks or time spent
away from the actual calculations and recommenced when the
calculations were resumed. The time was officially stopped
for the manual method when the final total for the inventory

28
packet was computed. The times from each setting were added
so an accumulated time was entered onto the evaluation sheet
(Appendix H). The timing for the automated system used the
same procedure concerning breaks and was stopped when the
computer printout was received. This time was entered on
the evaluation sheet in the appropriate area.
Cost Analysis of Valuation Systems
Calculations to show the costs of the systems were
computed based on the time in minutes required to complete
the calculations, the number of items, and the salary and
benefits of the employee who performed the inventory
valuation {Appendix I). The total cost of the valuation
methods was calculated by finding the minutes required to
complete the inventory and multiplying the total minutes
times the cost of the subject per minute to the private
club. This cost was extended to identify the most cost
effective system (Appendix J). By comparing the data
received from each month and evaluating the time expended
and the accuracy of the calculations, the study provided
information needed to identify which system should be
implemented in this private club restaurant.

CHAPTER IV
RESULTS AND DISCUSSION
The objectives of this study were to determine the
value of the food inventory by means of both a manual and an
automated system; determine the degree of accuracy of each
system; calculate the labor cost of operating each system;
and compare the accuracy and cost data of the systems for
the food department of a private club in order to determine
which system provides the most accurate and cost effective
approach to inventory valuation. The objectives were
achieved by collecting and analyzing the food inventory data
of a private club for a three month period (June, July, and
August 1992).
Existing Physical Inventory Procedures
In the test facility, inventory items are divided into
three categories, based on their physical location in the
facility. Because the inventory is grouped into these
categories, the process of calculating and timing was
performed within these same groups: dry storage,
refrigerated storage, and freezer. Dry storage consisted of
foods in the main dry storage area and other goods located
in the various wait stations and the kitchen area. The
refrigerated storage section included the walk-in
refrigerated storage area, the refrigerator in the wait
stations, and coolers in the two kitchen areas. The freezer
29

30
storage included the main freezer and the freezer in the
wait station areas. The counting procedures outlined in
Appendix B were followed by the inventory counter to
determine the counts for each of the three month involved in
the study. The inventory counter provided inventory sheets
which documented the counts to the manager. The inventory
valuation calculations were computed according to the
inventory procedures outlined in Appendix c.
Accuracy of Inventory Valuation
Following the manual and automated valuation of the
inventory, results were compared to detect errors committed.
A checker compared the final results of the manual system
with the automated system for each inventory item. The
researcher checked the results for discrepancies noted and
looked through the invoices to ascertain in which of the
inventory systems the error had occurred.
Types of Errors
The errors were categorized in six groups (Table 1).
These included quantity transfer, purchase unit, purchase
pack, purchase price, extended price, and transferjentry
categories. Errors noted in the quantity transfer column
were errors made by the manager when the quantities marked
by the inventory counter were transferred incorrectly to the
spreadsheet or manual inventory sheet. The purchase unit

Tab
le
1:
Err
ors
in
m
an
ual
an
d
au
tom
ate
d v
alu
ati
on
sy
stem
s fo
r fo
od
in
ven
tory
.
Jun
e
Ju
ly
Au
gu
st
Err
or
Cate
go
ry
Ma
Ab
M
A
M
A
M
Qu
an
tity
T
ran
sfe
r 0
6 1
5 6
2 7
Pu
rch
ase
U
nit
0
0 0
2 0
0 0
Pu
rch
ase
P
ack
9
15
6
10
1
4 1
6
Pu
rch
ase
P
rice
2 2
3 1
0 0
5
Ex
ten
ded
P
rice
4 0
1 2
3 0
8
Tra
nsfe
r/E
ntr
y
3 2
11
0
5 0
19
To
tal
18
2
5
22
2
0
15
6
55
a =
Man
ual
b =
Au
tom
ate
d
To
tal A
13
2
29
3 2 2
51
w ~

32
category indicated that errors were made when the item units
were entered onto the inventory sheets. The purchase pack
error category indicated that the manager had incorrectly
listed or failed to change purchase packs for the inventory
item. Under the category of purchase price, errors were
committed when the prices listed on the inventory sheets
were not accurate. Those errors noted in the extended price
category were for mistakes made when calculating the
extended price on the ten-key. Errors in this category for
the automated valuation system were made when the researcher
failed to copy the formula for calculations when new items
were added to the inventory spreadsheet. The formulas to
compute the calculations on the automated system were
checked for any errors preceding the testing; however, if
items were added to or taken from the inventory, the
formulas must be added to or taken from the inventory, also.
Transfer/entry errors indicated that the manager failed to
note the items added during the month listed by the
inventory counter because they were entered on the manual
sheets, in random order throughout the inventory, not in the
category in which they actually should have been listed.
Accuracy of the Manual and Automated Systems
For the month of June, there were 18 errors committed
by the manual system (Table 1). The majority (50%) of these
were in the purchase pack category. Twenty-five errors were

committed by the automated valuation system. Again, a
majority were categorized as purchase pack errors.
33
The most errors for July, six for the manual valuation
system and 10 for the automated valuation system, were again
made in the purchase pack category. The number of errors
made by each valuation system declined from the previous
month, with 22 errors for the manual system and the 20
errors for the automated version.
The number of errors noted for the month of August were
the fewest of all three months, 15 for the manual valuation
system and six for the automated system. The largest number
of errors in the manual system was in the quantity transfer
category as six of the 15 errors committed were in this
category. The counter changed the method of listing added
items in the food inventory from month to month and caused
some confusion for the manager in transferring these items.
The counter had been listing items not previously on the
manual inventory sheets on a separate sheet of paper, making
it easier to add these items to the correct category.
However, during the last month, inventory items were
randomly added throughout the inventory sheets creating more
difficulty in transferring these items to the correct
category. Assigning an incorrect purchase pack was again
the major error in the automated valuation system.
The number of errors committed by the manager
performing the transfers and calculations decreased each

34
month because of the familiarity of the manager to each of
the systems used for calculations; however, there were still
errors made in the purchase pack category each month. This
can, in part, be attributed to the changes made by the
inventory counter in the methods of adding items to the
inventory and the failure of the manager to make the
necessary corrections. One of the main reasons for this
type of error was that when new items were added to the
inventory, the new purchase packs noted by the manager on
the month's invoices and the purchase packs used by the
counter were not always the same. The counter would use the
previous purchase pack listed on the inventory sheet instead
of assessing the new item a different entry using the new
purchase pack, as noted by the manager. When the counter
did not identify the new packs, the errors occurred. This
type of error could be corrected if the inventory counter
would use the count sheets generated by the electronic
spreadsheet instead of the manual inventory sheets now in
use. The count sheets generated by the electronic
spreadsheet can be easily updated from month to month.
Using the manual forms, the inventory counter adds items to
the count sheets of any storage areas or on a separate sheet
of paper, without any reference to brand, purchase pack, or
unit pack.
A total of 1,333 items were valuated for the three
months of the study. Based on the six categories for

errors, there were at least 7,998 chances for errors to be
made. Only 55 errors were committed using the manual
valuation system, and 51 were committed by the automated
system.
Time Required for Inventory Valuation
Manual Valuation System
35
The manual valuation system was performed by utilizing
a ten-key machine to calculate the extended prices and
totals for each category of the inventory {Table 2). The
timing for this system was initiated when the first purchase
price change was transposed from the invoice to the
inventory sheet. The price changes were entered onto the
inventory sheet, divided by the purchase pack, multiplied
times the quantity and entered into the extended price
column. The total for each inventory sheet was determined
by adding the extended process for each item. Category
totals for the dry storage, refrigerated storage, and
freezer were then determined. The category totals were
summed, and this elapsed time was included in the freezer
category calculations.
The first timing period of this study was June. The
manual valuation system, divided into the three categories,
plus the price change category required a total of 220
minutes, 32 seconds (Table 2). Each of 445 items on the
inventory required, on an average, 30.13 seconds to
calculate. The July inventory required 180 minutes and 54

Tab
le
2:
Ela
pse
d
tim
e•
for
man
ual
an
d
au
tom
ate
d v
alu
ati
on
o
f fo
od
in
ven
tory
.
Jun
eb
Man
ual
A
uto
mate
d
Pri
ce
11
4:1
7
Ch
an
ges
Dry
4
9:4
4
Sto
rag
e
Refr
ig-
21
:47
era
ted
S
tora
ge
Fre
ezer
34
:44
To
tal
22
0:3
2
Seco
nd
s/
30
.13
It
em
a m
inu
tes:s
eco
nd
s
b 4
45
it
em
s v
alu
ed
c 4
40
it
em
s v
alu
ed
d 4
48
it
em
s v
alu
ed
e 1
33
3
item
s v
alu
ed
42
:28
34
:14
17
:22
19
:18
11
3:2
2
15
.28
July
c
Man
ual
A
uto
mat
ed
92
:12
3
7:4
6
41
:34
2
6:2
2
21
:32
1
0:4
8
25
:36
2
4:0
6
18
0:5
4
99
:02
25
.07
1
3.5
0
Au
gu
std
T
ota
le
Man
ual
A
uto
mate
d
Man
ual
A
uto
mat
ed
10
3:2
7
41
:16
3
09
:56
1
21
:30
52
:12
3
0:5
3
14
3:3
0
91
:29
12
:57
1
2:0
1
56
:16
4
0:1
1
31
:33
1
6:0
2
91
:53
5
9:2
6
20
0:0
9
10
0:1
2
60
1:3
5
31
2:3
6
27
.21
1
3.4
2
27
.08
1
4.0
7
w
0'1
37
seconds, or an average of 25.07 seconds for each of the 440
items. The final inventory period of the study was August.
The total time required was 200 minutes and 9 seconds, with
each item averaging 27.21 seconds. The manual valuation
system, when calculated by means of the ten-key, required
601 minutes and 35 seconds for the three testing periods.
The average seconds/item required was 27.08 seconds.
Automated Valuation System
The calculations of the food inventory for the months
of June, July, and August were performed according to the
three separate categories described in the preceding
section. Each month's total time required, total items on
the inventory sheet, and itemsjsecond were calculated. The
timing for the automated system, using an electronic
spreadsheet, was started when the first price change was
transposed from the invoices to the inventory sheets. The
program was then retrieved onto the computer and the
changes, if any, of quantity, price, and unit pack were
made. The spreadsheet was designed to calculate the unit
price and extend the price of each item automatically.
The time required for each category of the automated
valuation system was less than the time required for the
manual valuation (Table 2). The total time required for the
June inventory was 113 minutes and 22 seconds, 91 minutes
less time than the manual inventory, averaging 15.28 seconds
for each item. The July inventory required 99 minutes and 2

38
seconds, and the August measurement was 100 minutes and 12
seconds, for an average of 13.50 seconds per item and 13.42
seconds per item, respectively. On average, 14.07 seconds
was required for each of the 1333 items during the three
month period. The times for the automated system were less
each month because there were fewer changes in prices and
the items added to the inventory during the final two
testing periods were minimal. Familiarity with the
spreadsheet may also account for the decline in time
required each month.
Projected Cost Savings
When accounting for the cost of each system, the amount
of time required to valuate the food inventory, along with
the salary and benefit data of the employee involved in the
process, was considered. The salary and benefit data were
made available to the researcher by the private club that
employs the manager involved in the study and the Texas
Employment Commission (TEC).
By using the data provided by the private club and the
TEC, the monthly costs for salary, health insurance, FICA,
unemployment taxes, and for workers' compensation were
determined. A total of $1629.21 is required to employ this
manager per month (Appendix I). The manager maintained a
set schedule, and worked 173.33 hours/month (Kresse & Sneed,
1989). The cost for this employee was $0.16/minute to the
private club.

Table 3 reports the costs required to calculate the
food inventory by both the manual and automated systems.
The quarterly cost to the private club for the manager to
perform the duties of calculating the food inventory
manually was $95.04, while the cost to perform the same
duties using the automated system was $49.39. The annual
projection comparing the two systems was $380.16 using the
manual system and $197.56 when the automated system was
implemented. The annual cost savings of the automated
valuation system over the manual valuation system would be
$182.60.
Analysis of the Results
39
The comparisons of cost savings and number of errors
committed would suggest that the implementation of an
automated valuation system would result in cost savings for
the private club and would generate slightly more accurate
results. With the number of spreadsheet programs and the
accuracy they afford, the timed test results display the
obvious move to the automated version of food inventory
calculations. Cost savings alone merit the need for a
private club to strongly consider the implementation of an
automated system, and the time saved allows the manager to
use this saved time to spend working with personnel and
performing other duties of the manager responsible for the
inventory, instead of being confined to the desk for
calculations.

40 Table 3: Quarterly and annual cost for the manual and
automated valuation systems.
Month
June
July
August
Quarterly Costs
Annual Projection
Manual
$34.84
28.58
31.62
$95.04
$380.16
Cost
Automated
$17.91
15.65
15.83
$49.39
$197.56
Automated System
Cost Savings
$16.93
12.93
15.79
$45.65
$182.60
41
Not only should costs be considered, but the job
satisfaction of the employee should also be a factor when
the choice of one valuation system is made over another.
Spending less time on a job as tedious and time-consuming as
valuating the inventory is a goal that should be
contemplated. Yielding pertinent results in as short a time
span possible, with a finished product that is accurate,
neat, and serving a useful purpose should be part of the
argument in favor of the automated system. The automated
system can produce a spreadsheet, with changes throughout
the month that can be used the following month for inventory
comparisons, as well. The manual inventory sheets can be
updated from month to month, but with additions,
subtractions, and changes made in prices and other areas the
sheets must be modified frequently. Upon the completion of
the automated inventory packet and its presentation to the
accounting department, the responsibility of calculating the
inventory has been conducted in a professional and expedient
fashion, a product of which the conducting manager can be
proud. Satisfaction of the manager is extremely important
to performance standards.
In the study by Hume et al. (1987), the results were
just the opposite as those in this study. When
comparing the results of the recipe costing, the accuracy of
the manual computation was much lower than the computer
42
program recipe calculations. The length of time required to
perform each method was not significantly different,
however. The lack of expertise of the participants in
manual computations could have caused the accuracy of those
computations to be much lower, whereas the computations of
the computer program were performed by the program, and the
participants could more easily detect errors as they were
made. Required time for each system was essentially the
same, perhaps because of the opportunity of the participants
to review and correct problems in the computer program, and
the lack of confidence of the participants when performing
the manual computations.
Summary
The results of the study were reported in this chapter.
The objectives were stated along with the methods of
achieving the results. The procedures of conducting the
inventory were summarized along with the categories of the
inventory. The time required for each valuation system was
reported, in an itemized fashion, as well as the total
minutes needed. The accuracy of each valuation system, the
errors committed, were discussed and compared with one
another. Finally, the cost savings of each system was
calculated, and a quarterly and projected annual cost
savings was presented for study.

CHAPTER V
SUMMARY AND CONCLUSIONS
Statement of the Problem
In order to determine the value of the food inventory
on a monthly basis and at the end of the fiscal year, the
foodservice manager needs to implement an accurate and
timely system to present precise numbers (Coltman, 1989).
Manual computations using the ten-key machine, can be
extremely tedious and time consuming, and may not be
entirely accurate. Identifying and testing an alternative
system to alleviate the tediousness of this duty is
important. The calculation of the extended prices and the
total inventory is an important asset to the private club.
Therefore, the system that renders this total efficiently
and accurately should be implemented by the private club.
This case study determined the time required to perform
the food inventory calculations for both a manual and
automated valuation system. The total time of the systems
were compared in order to assess which system was more time
efficient. Accuracy also was evaluated to determine in
which system fewer errors were committed during the
valuation process.
43
44
Research Questions
The research questions of this study were:
1. Will inventory calculations be more accurate and
require less time when the inventory is taken and
computed using the automated system for each item
on the inventory list?
2. What are the potential cost savings of the
automated valuation system as a tool in
calculating the inventory of the private club?
Results and Conclusions
When comparing the results of the three testing periods
for the manual and automated valuation systems, the
inventory calculations were slightly more accurate but
required approximately half the time when the inventory was
taken and computed using the automated system. This alone
does not justify the need to implement an automated system;
however, this information along with the cost savings of the
automated system, and consideration of job satisfaction of
the manager, should provide strong influence on the decision
of choosing the automated system over the manual system.
During the test period, the automated valuation system
required 288 minutes less than the manual valuation system
to perform the calculations. This not only means time
savings but also translates into cost savings for the
private club.
45
The automated valuation system, performed by means of
an electronic spreadsheet, uses virtually the same ten-key
set-up as the manual system. The manual system and the
automated system provide a list of inventory items that are
kept up-to-date with prices, purchase packs, and unit packs
available. Each month, however, when the new prices must be
changed on the manual system, a master or permanent copy of
the inventory must be altered. If the unit price is to be
calculated by the manual system, the data must be entered
onto each inventory sheet, about 444 items in each month of
this study. This would necessitate even more time spent
working on the manual inventory. Having the purchase pack
and the unit price on the inventory sheet is essential when
comparing prices, brands, and holding tight controls for
food costs. The unit price is not calculated using the
manual system for the private club at the present time;
however, its availability could benefit those individuals
using the inventory sheets by offering prices to compare for
similar items when a choice between items is to be made.
The automated valuation system is stored on a disk,
making the data available at any time either by viewing the
screen or generating a print out. In an automated system,
the inventory sheets can be printed with existing unit
prices (Stefanelli, 1992). At the end of each accounting
period, changes can be made to one item or to all items.
since the formulas to calculate each column in the inventory

46
are previously set--the quantity, unit pack, purchase pack,
latest price, unit price, and extended price--do not require
as many calculations each month as the manual valuation
requires.
Each month, the inventory calculations required at
least three hours for the manual valuation and a little over
an hour and a half for the automated valuation calculations.
The time saved by the automated system allows the private
club foodservice manager to spend time on other duties such
as scheduling, preparing for special functions, working on
the menus, working with new personnel, and preparing
statements and other paperwork.
The potential cost savings of the automated valuation
system, when used to calculate the inventory of the private
club, are obvious. The comparisons of accuracy and time of
the automated valuation system and the manual valuation
offered little doubt as to which system should be used by
the private club in its inventory valuation.
Impact of the Study
The results of this study should be of interest to any
one in the private club sector. The manager in charge of
valuing the inventory, the kitchen manager who needs costs
easily at hand, and the accounting department who rely on
accurate departmental data should be interested in the
findings. With an understanding of the benefit an automated
valuation system has for the foodservice department, it
47
should be obvious that the automated system might prove
beneficial in other aspects of the bookkeeping of the club.
Recommendations
This study was one of small range, using only one small
foodservice operation; however, the results suggest there
are savings of time and costs based on the implementation of
the automated system. With the advent of the computer age,
it seems apparent that implementation of an automated
inventory program be strongly weighed. The job satisfaction
of the employee performing the inventory valuation should be
a factor in the decision to implement the automated system,
also.
It is recommended, when considering the time and cost
savings exhibited by the automated system in this research,
that this private club employ an automated valuation system
for use in valuing the food inventory. The test results
display a cost savings that should not be overlooked,
especially since budget control is essential.
Further refinement of the automated valuation system
utilized in this study should be performed. By transposing
the changes of prices and unit packs directly onto the
electronic spreadsheet instead of onto the inventory sheets
first, the beginning step timed in this study would be
deleted, resulting in even less time for the automated
valuation system. System, method, and procedure changes

48
should be evaluated to ascertain the quickest and most
efficient plan of inventory valuation. Further cost savings
utilizing other automated techniques might be determined
with more research in this area.
Each month of the study the number of errors decreased
while the errors that were committed using the manual system
remained constant. The errors committed using the automated
system potentially could continue to decrease due to the
refinement of the system and the manager's familiarity with
the program. A long-term study would be most beneficial to
exhibit the cost savings over a longer period of time.
Further research needs to be performed with more in
depth testing to determine the benefits of the automated
system over the manual system. To design a study more
general in nature, it would be useful to test the manual and
automated systems in several small private clubs over a
longer period of time.
There does seem to be a need for further study of
implementation of the automated system, both generic and
fully integrated, in the private club business for time and
cost savings. By researching the time, accuracy, and cost
savings of manual systems, generic automated systems, and
full-feature systems, the results could be generalized for
various sizes of private clubs to analyze when considering
the implementation of an automated system.
REFERENCES
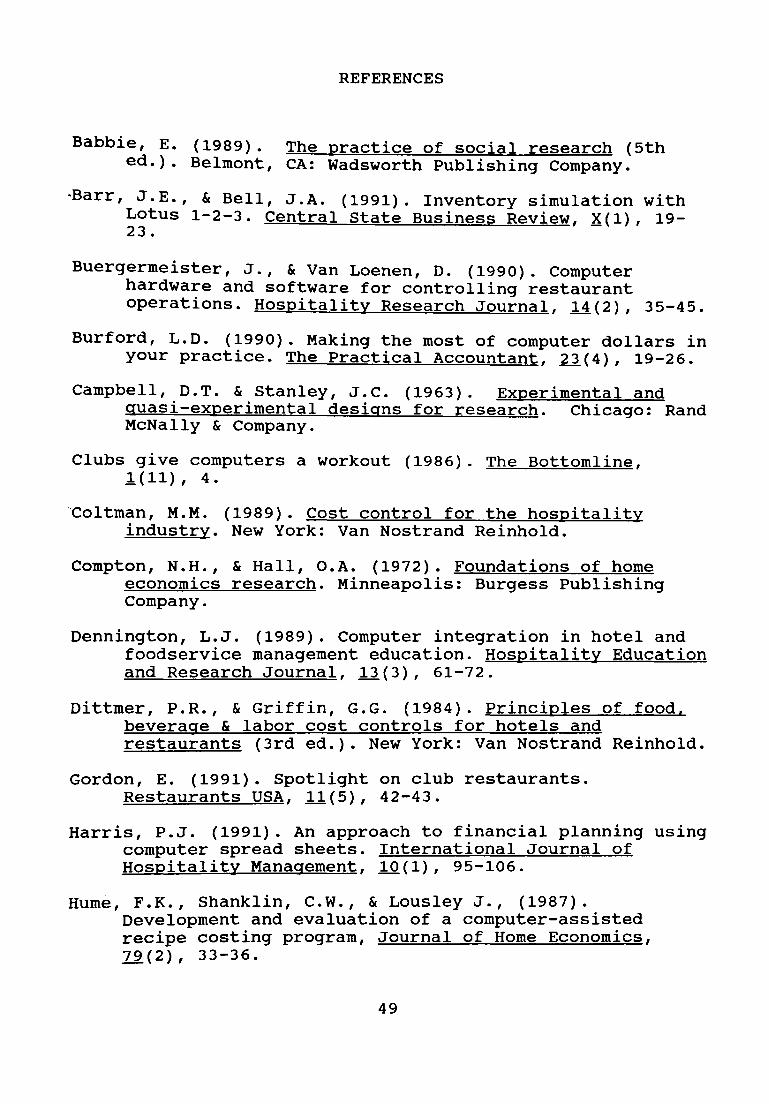
Babbie, E. (1989). The practice of social research (5th ed.). Belmont, CA: Wadsworth Publishing Company.
·Barr, J.E., & Bell, J.A. (1991). Inventory simulation with Lotus 1-2-3. Central State Business Review, X(1), 19-23.
Buergermeister, J., & Van Loenen, D. (1990). Computer hardware and software for controlling restaurant operations. Hospitality Research Journal, 14(2), 35-45.
Burford, L.D. (1990). Making the most of computer dollars in your practice. The Practical Accountant, 23(4), 19-26.
Campbell, D.T. & Stanley, J.C. (1963). Experimental and quasi-experimental designs for research. Chicago: Rand McNally & Company.
Clubs give computers a workout (1986). The Bottomline, 1(11)' 4.
~oltman, M.M. (1989). Cost control for the hospitality industry. New York: Van Nostrand Reinhold.
Compton, N.H., & Hall, O.A. (1972). Foundations of home economics research. Minneapolis: Burgess Publishing Company.
Dennington, L.J. (1989). Computer integration in hotel and foodservice management education. Hospitality Education and Research Journal, 13(3), 61-72.
Dittmer, P.R., & Griffin, G.G. (1984). Principles of food, beverage & labor cost controls for hotels and restaurants (3rd ed.). New York: Van Nostrand Reinhold.
Gordon, E. (1991). Spotlight on club restaurants. Restaurants USA, 11(5), 42-43.
Harris, P.J. (1991). An approach to financial planning using computer spread sheets. International Journal of Hospitality Management, 10(1), 95-106.
Hume, F.K., Shanklin, c.w., & Lousley J., (1987). Development and evaluation of a computer-assisted recipe costing program, Journal of Home Economics, 79(2), 33-36.
49

Kasavana, M.L. {1984). Computer systems for food service operations. New York: Van Nostrand Reinhold.
Kasavana, M.L. (1990). Modifying generic software. Restaurant Business, 89(21), 80-82.
Kasavana, M.L. (1992). The bottom line on computerized accounting part 2. Club Management, 71(2), 80-93.
50
Keiser, J. (1989). Controlling and analyzing costs in foodservice operations. New York: Macmillan Publishing Company.
Kresse, K.H., & Sneed, J. (1989). Understanding foodservice financial management. Rockville, MD: Aspen Publications.
Lotus 1-2-3. {1987). Using 1-2-3 Special Edition. Carmel, IN: QUE Corporation.
Mainelli, M. (1989}. The right software equals success. Bottomline, 4(4), 6-7.
Pappas, M. (1988}. Inventory by computer, Restaurant Management, 17(9), 90-91.
Pedderson,R. (1982). A plea for more dietitians, Food Management, 17(8), 25.
Plotkin, R. (1990). Keeping tabs, Restaurant Hospitality, 74(9), 144-148.
·Powers, T.F. & Powers, J.M. (1984). Food service operations: planning and control. New York: John Wiley & Sons.
·Schmidgall, R.S. (1990). Hospitality industry managerial accounting. East Lansing, MI: Educational Institute.
Shanklin, C.W., Hernandez, H.N., Gould, R.M., & Gorman, M.A. (1988). Documentation of time expenditures of clinical dietitians: results of a statewide time study in Texas. The American Dietetic Association, 88(1), 38-43.
Simon, J.L. & Burstein, P. (1985). Basic research methods in social science (3rd ed.). New York: Random House.
Stefanelli, J.M. (1992). Purchasing, selection, and procurement for the hospitality industry (3rd ed.). New York: John Wiley & Sons, Inc.

Touliatos, J. & Compton, N.H. (1988). Research methods in human ecology/home economics. Ames, IA: Iowa State University Press.
51
Wolverton, V. (1989). Running MS DOS (4th ed.). Redmond, WA: Microsoft Press.
Woodman, J. (1991). The byte stuff. Restaurants & Institutions, 101(33), 85-86.
Young, S.T. (1989). Hospital materials management: systems and performance. Journal of Purchasing and Materials Management, 25(3), 31-35.

Count
24
10
7
APPENDIX A
INVENTORY SAMPLE
Item Pack Price
Tomato Juice 24 $4.80
Apple Juice 24 5.28
Hot Dog Buns 8 .96
Total
52
Unit Cost Extension
$.20 $4.80
.22 2.20
.12 .84
Inventory $7.84

APPENDIX B
COUNTING PROCEDURES
1. The counting team, consisting of a counter and a
marker, will count the food inventory.
2. An inventory sheet, arranged in the order of the food
on the shelves, is used.
3. The counter will follow the same pattern in counting
each period following the items on the sheet. The team
will proceed systematically through the storeroom to
maintain accuracy and save time.
4. To record the inventory, one member counts the number
of items and calls the item and the quantity to the
marker.
5. If an item is found in more than one place in the
storeroom, a '+' is entered after the first number with
all pluses totaled at the end of counting.
6. Once the counting has taken place for all storage
areas, the walk-in, and the freezer, the inventory
sheet (packet) is given to the employee responsible for
calculating the total value of the inventory.
53
APPENDIX C
INVENTORY PROCEDURES
1. After the inventory packet is received from the
kitchen manager, the manager will use the month's
invoices and make any price/packing changes
necessary. The manual inventory packet will be
changed for the manual inventory system
calculations, and the automated spreadsheet will
be changed for calculations of the automated
valuation system.
2. The manual method of calculation will determine
the unit prices by dividing the pack price by the
pack size. These unit prices will not be
displayed on the manual inventory packet.
3. The unit price will then be multiplied times the
quantity on hand according to the inventory sheet,
giving the extended value for that particular
item.
4. Each item will be extended using these same steps.
5. After each item has been extended, each page will
be totaled by adding the extended prices for the
items on that page.
6. The totals of each inventory sheet will be added
together to provide the total inventory.
54

7. The computer program method will use the
spreadsheet inventory packet with the quantities
and changes from the invoices.
8. Using the computer, the new quantities will be
entered onto the spreadsheet.
9. The new prices/pack numbers will be entered onto
the spreadsheet.
10. The unit prices and the extended prices will be
automatically calculated based on the formulas
entered onto the Lotus 1-2-3 program for the
inventory.
11. When all of the changes have been made,the file
will be saved and printed, and the value of the
inventory on hand will be available.
55

APPENDIX D
MANUAL INVENTORY SHEET
---------·-·---·-----------INVENTORY ___ .. . . . ... ,., -··-··
Sh"'\ Nn _____ _
1>..,-.;~rtm,·n~I . ..:..TC=I-I...:::E.:...:N ____ -·-l'rk,-..1 h)'-·······-·-
EXI\'Il\1\'1.1 ">'·---·····-·- .. Exa111im·J h)'---·-·---·--· r---=-...:==r===-=====-==--====·=·-=·=· =r=.r-==·=· ·=,··r-"':'-·~· .•.. ···-·· -·z:·-·- 'I "'---·
ITo.< NO DESCRIPTION -.j OUANTITY ..,,..,,. rnoc[ uNoT ltliTtNSoONs
t=-==-====-==f===-"""""===========1=· ··n===-'-l·· z.5 Jf. [-1,011.lon, J.fdlcrr·.t ~
1----f'-'-"a::.:..::.!..:...o:._.....ru.l.J.U.l~------ - __.c_,_ ..
Cann.t br~-----l...o..'!ltlon SroRI:~M •-..><..:....:.. ________ _
l!nu:n'\1 hy·---·---
.tJ. ~aS0111~~t~ ~( f Lowry~ 50 ~------~~~~~·~--~~.----- a
JOlt I p,.t:jii,J'ovJdU rlt1Jdllllo.1o•ns ,-,
r_t.I.L~..t::..,_ L_+.:.;,~.;;.;;..L.::t(A;..:.;l;..::..D;..;." ...:.v:....;,1 ".:...' l:..:..:lt'I.:.:..,{:....;ICI:.:..":....D_r _..:~_·_-o_ .:...rl e:...O:._r_._ ~ I _7
50. I
4
·-· ..... - --- - .
- - -. -- -1- -
~/~()1t-tf41 Nood fcs Gx!t. /. ~ 1 _.:;:.~0_-'--4.~..} ...... {tl:..:.;'(~tt..:...;vo;.:.".:.;..; ___ __:lJ_:....;n' ;:....;le._S_v_~~l--- ·- ·-!.~-
-- - ·- .. - : - ·- .
·- . - . - - ·-I- ..
1--'-IO_H_+--'SkLI.I,t._.,l=ll';'o(!~n'---___ lJ_h._ll_S_W~_~--· __ _:_:L. L
: IOit ~P./).c.~;,_!. LJhilt. S,Jui /. 5 ~~---P~~~~---------~~-~41-~~-
,()If I.AsM"__e tJI,:It s~f'l....:..._-l 1 /OH ~.,.. ~") ~ol:,,: Sprols Wl--. .. fc s~" 0 ION ~-Mt.A.if'e. Wh;~e Sw.-n 6 1--~-_..p:::J..~ ~;,:,;,:,:::__ ___ __;,. __ _..::::..=..:.~..__-f- ---- .
~~~·0"--I.....,S'p~49~/,!&..LcHJ..:..i ________ --i- . _!?_____ .. ./.. ··- ·- -I---
wt=;~ZD#~Ij£~,,~,~·!:!:!'"~·e~C~&VL!:!:«~~_;--p,~o~~;~":._; ---=---··- ____ 1 _ ,~ Pmal, c~<."-s R~m(~ f;J.t '1 _ .
- ·--
- -- - --- - . t5 PC {Jrk1() es..;M _o __
f-1-tcS:....__~PC:::.....!.:.M.:..::t(.:..:.:s(A::...:rd:__ ___ C=o=h'"'-----t- ~_5" __ . ~..::::c_s __ j.Jlfe'-"'-.!...J/t=~c:.'O~nfi=A....t.:ii51 t!=---------1 _ _ _Q_ __
CS Pc. Swu1 RrJi~h ._ _() __ ..1.
.. ~ 81
. -· - - - - - ' - .
. -- - --- . CS Pc Kt~cJ.. .. " ... __ _ _1 ______ . I 14 (.3 . 1- - ·-
C5 PC r:"rt""'h Drr~'"='l--------·-·- _ __ ()_. ~CS PC lt~lion Dro$'~j _D __ _
CS_ pc. T!,J,~ncl_~la.r:{_Q,.r-"''«r . ---·· _ _ .0.. ... J
CS R:. llo~ --·-··-·- __ 1__7 __ ..
5 "!2
s 'n
I 5 1.
"l oo
C c. 1}-lfc~o- MrA ll-.1 Kcc.blu 1 3 51t.J ~al\iii.1._Walu; Su"'~"';"CJ -· ..l/~ j .
lq &8 -·· . ...
5 l<j
It/ 85 -· - --· -- -- .. ~ . ..__ ·-- .
~-H_.:.I.:.._O-+-Kt.:.....~U.._~~. ....... 'P ___ e=o.:..:..;;111:.!.1.••1."""lLv:::...._ __ ·=--j-~ t J=_· .... ~ .. -1*fQ_J2iucl1oM1fD(S \Crpsft A.."es "
56

APPENDIX E
AUTOMATED INVENTORY SHEET
Unlt Latest Unit Quant lty Description Unit Pack Price Price Inventory Value •~~z•=•z::aa:a:s:azacaaa:aaaa::aaaaasaaaaasaasaec::a:acc:c:a:aaa&esc:::aaacaac:c::a:a:::c:a:ca:aaca:aaaaas:a
3.00 : Croutona 2.51 1 • . I 1.09 : 11.09 : 13.27 :
------------------------------------------------------------------------------------------------------------30.00 : S~aqonlng SAlt 50 : 171.99 : 11.44 : 143. 19 :
------------------------------------------------------------------------------------------------------------0.90 : BAking Powd~r 101 1 : I 7. 92 : 17.92 : S7 .13 :
------------------------------------------------------------------------------------------------------------0.70 : I•ltatlon Vanilla Flavor : CL 4 : 116.00 : 14.00 : 12.80 :
------------------------------------------------------------------------------------------------------------1.50 : r.gg "oodlee 101 1 • . S8.25 : Sll.25 : 112.38 :
------------------------------------------------------------------------------------------------------------0.50 : Har.aronl 101 I : 16.65 : 16.65 : 13.33 :
------------------------------------------------------------------------------------------------------------101 1 : 15.03 : 15.03 : S2 .01 :
------------------------------------------------------------------------------------------------------------1.50 : r~ttucclne 101 1 : 16.75 : S6.75 : 110. 13 :
------------------------------------------------------------------------------------------------------------101 I : S7.fi8 : 17.68 : 17.68 :
------------------------------------------------------------------------------------------------------------0.00 : Rainbow Rotlnl Spirals 101 1 : 19.70 : 19.70 : 10.00 :
------------------------------------------------------------------------------------------------------------
1.00 : llotlni
19.00 : Potato Chlpa
0.00 : PC Potato Chips
0.50 : PC Hustard
0.00 : PC Mayonnalg~
O.OJ ; PC R~liah
1.00 : PC Ketchup
0.00 ; PC French Dr~~sln!
0.00 : PC Italian Dr~AAing
0.00 : PC 1000 leland Dressing
101
101
201
11
cs
cs
cs
cs
cs
cs
cs
cs
cs
1 • . 1 :
1 :
6 • . 1 :
1 :
1 • . 1 • . 1 :
1 :
1 • . 1 :
1 :
16.75 : S6.75 : so.oo :
S5.55 : 15.55 : 10.00 :
115.65 : 115.65 : 115.65 :
18.95 : 11.49 : 128.34 :
S4. 75 : S4. 75 : 10.00 :
15.65 : S5.65 ; 12.83 :
10.00 : 10.00 : so.oo :
16.81 : 16.81 : 10.00 :
14.75 : S4. 75 : S4 .75 :
15.92 : S5.92 : so.oo :
15.92 : 15.92 : 10.00 :
15.92 : 15.92 : 10.00 :
19.00 : 19.00 : 16.30 :
------------------------------------------------------------------------------------------------------------cs I : 119.9a : 119.911 : S25.97 :
------------------------------------------------------------------------------------------------------------1.50 : Vanilla Waf~rs cs I : S7.211 : 17.28 : 110.92 :
·------------------------------------------------------------------------------------------------------------110 6 : 115.48 : 12.511 : S10.32 :
------------------------------------------------------------------------------------------------------------9.00 : Diced Ta.ato~a 110 6 • . Sl5.45 : 12.57 : 123.17 :
------------------------------------------------------------------------------------------------------------TOTAL 1220.16
57

APPENDIX F
AUTOMATED INVENTORY FORMULAS
Quantity Description Unit
Unit Pack Price Price InventorY value ••=~•=:zs:s~~~•=~:azsa:z:::::zsaacac:szc:~~•==~•=••==z:ac::::::::ca:s:sa:~:a::caa::~==•==••~==••;::::z:a:
: O : Crouton~~ 2.51 I : 1.09 : IJ5/H51 : 185•LSI
---------------------------------------------------------------------------------------------------------so : 11.99 : IJ1/H11
-------------------------- -------------------------------------------------------------------------------101 I ,
' 1.92 : IJ9/H91
---------------------------------------------------------------------------------------------------------0 : l•it•tlon Vanilla rlavor : CL 4 ' I 16 : IJII/Hlll : 18ll•Llll
---------------------------------------------------------------------------------------------------------0 : I:!! lloodl ... 101 1 ' I 8.25 : IJI]/Hl31 : I813•Llll
---------------------------------------------------------------------------------------------------------0 : HAca.ront 101 1 ' I 6.65 : IJIS/HISI : IBIS•LISI
---------------------------------------------------------------------------------------------------------0 : Sh,.llaRC:S 101 I ' I 5.03 : IJ17/Hl71 : IBI1•Ll71
---------------------------------------------------------------------------------------------------------0 : Fettuccine 101 I : 6,15 : IJ19/Hl91 : IBI9•Ll91
---------------------------------------------------------------------------------------------------------101 1 ' I 1.68 : IJZI/H211 : IB2l•L211
-----------------------------------------------~---------------~-----------------------------------------0 : Rainbow Rotlnl Spirals 101 I : 9.1 : (J23/H231 : IB23•LZ31
---------------------------------------------------------------------------------------------------------101 I : 6.75 : IJ25/H25) : IB25•L251
---------------------------------------------------------------------------------------------------------101 l ' I 5.55 : IJ27/H271 : 1827•L27)
---------------------------------------------------------------------------------------------------------0 : Rot In I 201 6 : 15,65 : IJ29/H291 : IB29•L291
---------------------------------------------------------------------------------------------------------0 : Po~ato Chips II 6 : 8.95 : IJll/Hlll : !Bll•Llll
---------------------------------------------------------------------------------------------------------
. II
0 : PC Potato Chips
0 : PC Mustard
0 : PC MAyonnaise
0 : PC Jll!llsh
0 : PC K"tchup
0 : PC ltal\Rn Dr .. sslns
0 : PC 1000 Island Dressln!
0 : PC Hon")l
0 : Vanilla War .. ra
0 : Kl!tc:hu['
cs
cs
cs
cs
cs
cs
cs
cs
cs
cs
cs
110
110
I :
1 :
I :
I :
1 :
J I I
I ' I
I ' I
1 I I
I I I
I I I
6 I I
6 I I
4.15 : IJ33/H331 : IB33•L331
5.65 : IJ35/H35l : (B3S•L35)
5.65 : IJ37/H311 : IB37•L311
6.81 : IJ39/Hl91 : 1839•L391
4.75 : IJ41JH4ll : IB41•L411
5.92 : IJ43/H431 : IB43•L431
5.92 : IJ45/H451 : IB4S•L45l
5.92 : IJ41/H471 : IB47•L411
9 : IJ49/H491 : IB49•L491
19.98 : IJ51/H511 : IB5l•LSll
7.28 : IJ53/H531 : 18SJ•L53l
15.48 : IJ55/H551 : IB55•L551
15.45 : IJ51/H511 : IBS1•LS71
---------------------------------------------------------------------------------------------------------TOTAL 1Slll11 115 .. 11571
58

APPENDIX G
COMPUTATION ERRORS
MONTH -----
MANUAL COMPUTER ============================================= jQuantity Transfer I ---------------------------------------------junit Pack I ---------------------------------------------!Purchase Pack I ---------------------------------------------!Purchase Price I ---------------------------------------------!Extended Price I
jTransferjEntry ---------------------------------------------
TOTAL
59

APPENDIX H
INVENTORY TIME SHEET
MONTH
MANUAL SYSTEM AU':'O?-'.ATED SYSTEM
DATE TIME (MIN:SEC) DATE TIME (MIN:SEC) ============================ ====~======================= I I ---------------------------- ----------------------------1 1 ---------------------------- ---~------------------------1 1
----------------------------
I I ---------------------------- ----------------------------1 1 ----------------------------
TOTAL TOTAL
60

APPENDIX I
LABOR COST
Monthly ==================================================
Monthly Salary $1,375.00
FICA $48.55
Health Insurance $153.00
State Unemployment $6.75
Federal Unemployment $4.66
Workers' Compensation $41.25 -----------
Monthly Total $1,629.21
Hours Worked 173.33
Labor Cost/Min $0.16
61

Month
APPENDIX J
SYSTEM COSTS
Total Cost Manual
·Total Cost Automated
Cost Difference
=========================================================== !June, 1992 I I -----------------------------------------------------------!July, 1992 1 I -----------------------------------------------------------!August, 1992 1 -----------------------------------------------------------!Quarterly I -----------------------------------------------------------!Annual I -----------------------------------------------------------
62