comparison of land use area estimates from three different
TRANSCRIPT
CARD Technical Reports CARD Reports and Working Papers
2-2008
Comparison of Land Use Area Estimates fromThree Different Data Sources for the UpperMississippi River BasinChinnasamy SanthiTexas A&M University
Philip W. GassmanIowa State University, [email protected]
Sylvia SecchiIowa State University, [email protected]
Raghavan SrinivasanTexas A&M University
Follow this and additional works at: http://lib.dr.iastate.edu/card_technicalreports
Part of the Environmental Policy Commons, Natural Resource Economics Commons, and theNatural Resources Management and Policy Commons
This Article is brought to you for free and open access by the CARD Reports and Working Papers at Iowa State University Digital Repository. It hasbeen accepted for inclusion in CARD Technical Reports by an authorized administrator of Iowa State University Digital Repository. For moreinformation, please contact [email protected].
Recommended CitationSanthi, Chinnasamy; Gassman, Philip W.; Secchi, Sylvia; and Srinivasan, Raghavan, "Comparison of Land Use Area Estimates fromThree Different Data Sources for the Upper Mississippi River Basin" (2008). CARD Technical Reports. 42.http://lib.dr.iastate.edu/card_technicalreports/42
Comparison of Land Use Area Estimates from Three Different DataSources for the Upper Mississippi River Basin
AbstractThis study presents the results of comparing land use estimates between three different data sets for the UpperMississippi River Basin (UMRB). The comparisons were performed between the U.S. Department ofAgriculture (USDA) Natural Resource Conservation Service (NRCS) National Resource Inventory (NRI),the U.S. Geological Survey (USGS) National Land Cover Data (NLCD) database, and a combined USDANational Agricultural Statistics Service (NASS) Agricultural Census – NLCD dataset created to supportapplications of the Hydrologic Unit Model for the U.S. (HUMUS). The comparison was performed for 1992versions of the datasets because that was the only consistent year available among all three data sources. Theresults show that differences in land use area estimates increased as comparisons shifted from the entireUMRB to smaller 4- and 8-digit watershed regions (as expected). However, the area estimates for the majorland use categories remained generally consistent among all three data sets across each level of spatialcomparison. Differences in specific crop and grass/forage land use categories were magnified with increasingrefinement of the spatial unit of comparison, especially for close-grown crops, pasture, and alfalfa/hayland.The NLCD close-grown crop area estimates appear very weak relative to the NRI and HUMUS, and the lackof specific crop land use estimates limits its viability for UMRB agricultural-based modeling scenarios.However, the NLCD is a key source of non-agricultural land use data for HUMUS and supplemental wetlandland use area estimates for the NRI. We conclude that comparisons between more recent versions of the datasets (i.e., 1997 NRI, 1997 or 2002 Agricultural Census, and 2001 NLCD) would not result in significantadditional insights and that the 1997 NRI is a viable land use data source for current CARD UMRB waterquality modeling studies. However, adoption of other land use data such as USDA-NASS remote sensing datashould be investigated.
Keywordsagricultural land, cropland, HUMUS, land use area estimates, NLCD, non-agricultural land, NRI, UMRB,water quality modeling
DisciplinesEnvironmental Policy | Natural Resource Economics | Natural Resources Management and Policy
This article is available at Iowa State University Digital Repository: http://lib.dr.iastate.edu/card_technicalreports/42
Comparison of Land Use Area Estimates from Three Different
Data Sources for the Upper Mississippi River Basin
Chinnasamy Santhi, Philip W. Gassman, Silvia Secchi, and Raghavan Srinivasan
Technical Report 08-TR 48 February 2008
Center for Agricultural and Rural Development Iowa State University
Ames, Iowa 50011-1070 www.card.iastate.edu
Chinnasamy Santhi is an associate research scientist, Blacklands Research and Extension Center, Texas Agricultural Experiment Station, Temple, Texas. Philip Gassman and Silvia Secchi are assistant and associate scientists, respectively, in the Center for Agricultural and Rural Development at Iowa State University. Raghavan Srinivasan is a professor and director of the Spatial Sciences Laboratory at Texas A&M University. The authors would like to thank Mr. Jay Atwood, USDA, Natural Resources Conservation Service and Mr. Clive Walker, former employee of the Blackland Research and Extension Center, Temple, Texas, for their support in this analysis and sharing of NRI and HUMUS land use data. This paper is available online on the CARD Web site: www.card.iastate.edu. Permission is granted to excerpt or quote this information with appropriate attribution to the authors. Questions or comments about the contents of this paper should be directed to Philip Gassman, 560A Heady Hall, Iowa State University, Ames, IA 50011-1070; Ph: (515) 294-6313; Fax: (515) 294-6336; E-mail: [email protected]. Iowa State University does not discriminate on the basis of race, color, age, religion, national origin, sexual orientation, gender identity, sex, marital status, disability, or status as a U.S. veteran. Inquiries can be directed to the Director of Equal Opportunity and Diversity, 3680 Beardshear Hall, (515) 294-7612.

Abstract
This study presents the results of comparing land use estimates between three
different data sets for the Upper Mississippi River Basin (UMRB). The comparisons were
performed between the U.S. Department of Agriculture (USDA) Natural Resource
Conservation Service (NRCS) National Resource Inventory (NRI), the U.S. Geological
Survey (USGS) National Land Cover Data (NLCD) database, and a combined USDA
National Agricultural Statistics Service (NASS) Agricultural Census – NLCD dataset
created to support applications of the Hydrologic Unit Model for the U.S. (HUMUS). The
comparison was performed for 1992 versions of the datasets because that was the only
consistent year available among all three data sources. The results show that differences
in land use area estimates increased as comparisons shifted from the entire UMRB to
smaller 4- and 8-digit watershed regions (as expected). However, the area estimates for
the major land use categories remained generally consistent among all three data sets
across each level of spatial comparison. Differences in specific crop and grass/forage
land use categories were magnified with increasing refinement of the spatial unit of
comparison, especially for close-grown crops, pasture, and alfalfa/hayland. The NLCD
close-grown crop area estimates appear very weak relative to the NRI and HUMUS, and
the lack of specific crop land use estimates limits its viability for UMRB agricultural-
based modeling scenarios. However, the NLCD is a key source of non-agricultural land
use data for HUMUS and supplemental wetland land use area estimates for the NRI. We
conclude that comparisons between more recent versions of the data sets (i.e., 1997 NRI,
1997 or 2002 Agricultural Census, and 2001 NLCD) would not result in significant
additional insights and that the 1997 NRI is a viable land use data source for current
CARD UMRB water quality modeling studies. However, adoption of other land use data
such as USDA-NASS remote sensing data should be investigated.
Keywords: agricultural land, cropland, HUMUS, land use area estimates, NLCD, non-
agricultural land, NRI, UMRB, water quality modeling.

COMPARISON OF LAND USE AREA ESTIMATES FROM THREE DIFFERENT DATA SOURCES FOR THE
UPPER MISSISSIPPI RIVER BASIN
Introduction Land use and water resources are directly linked. The type and intensity of land use
greatly affects the water quantity and quality of receiving water bodies, whether the land
use is natural or has been greatly altered by human activity. Land use activities have
direct impacts on water resources, while water quality and quantity greatly influence the
siting of land use activities.
Anthropogenic land use influences have greatly affected the water resources of the
Upper Mississippi River Basin (UMRB). The Mississippi River and tributary streams
have been greatly impacted by excess nitrogen, phosphorus, and sediment loadings from
cropland and other sources. The nutrient load discharged from the mouth of the Missis-
sippi River has also been implicated as a key cause of the Gulf of Mexico seasonal
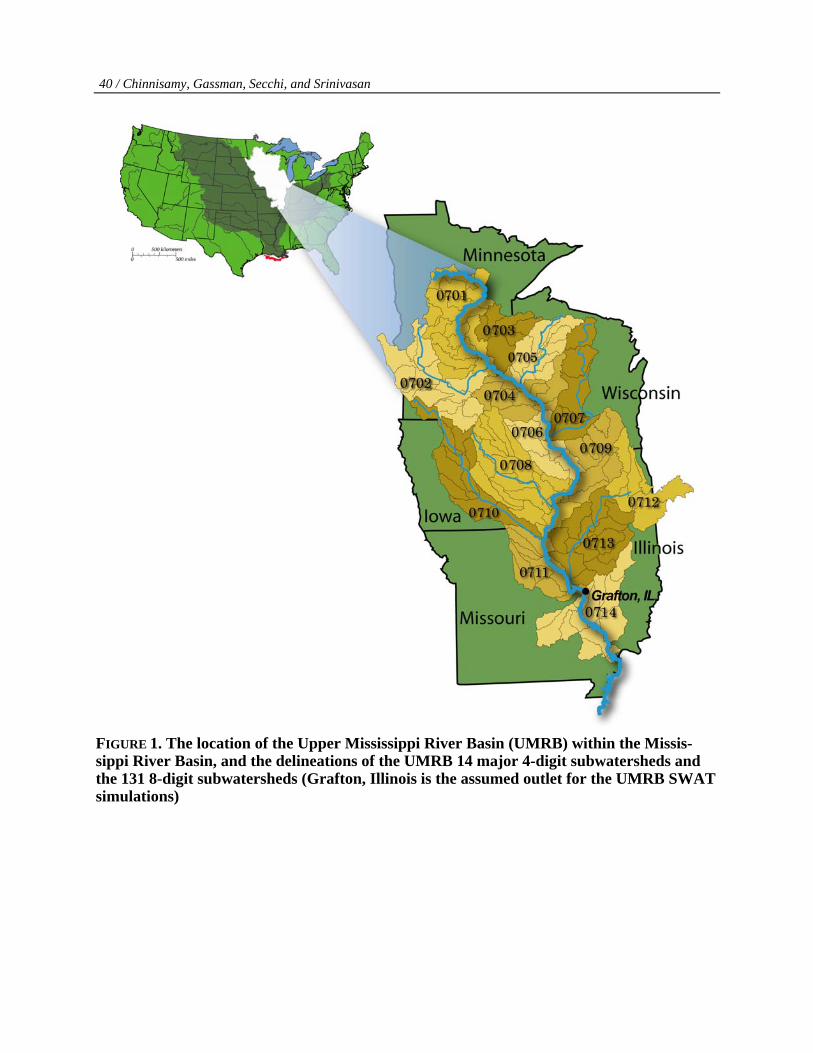
oxygen-depleted hypoxic zone (Figure 1), which has covered an extent equal to or greater
than 20,000 km2 in recent years (Rabalais, Turner, and Scavia, 2002). Goolsby et al.
(1999) estimated that the UMRB was the source of nearly 39% of the Mississippi nitrate
load discharged to the Gulf between 1980 and 1996; 35% of this load was attributed
solely to Iowa and Illinois tributary rivers for average discharge years during the same
time period (Goolsby et al., 2001). Nutrient inputs via fertilizer and/or livestock manure
on cropland and pasture areas are the primary sources of nonpoint source nutrient pollu-
tion in the UMRB stream system. Sediment losses to the UMRB stream system are a
function of erosion from upland soils, especially from cropland areas, and stream bank
erosion. These nonpoint source pollution problems persist throughout the region, despite
a wide range of water quality initiatives that have been undertaken at different watershed
and regional scales by federal, state, and/or local agencies. This underscores the need for
continued assessments of specific subwatersheds and of the entire region, to determine

2 / Chinnisamy, Gassman, Secchi, and Srinivasan
which management and land use strategies will be the most effective approaches for
mitigating nonpoint source pollution problems in the UMRB.
The Center for Agricultural and Rural Development (CARD) has initiated a set of
simulation studies to investigate potential water quality pollution mitigation strategies for
the UMRB, using the Soil and Water Assessment (SWAT) model (Arnold and Forher,
2005; Neitsch et al., 2005; Gassman et al., 2007). A key input to the modeling system is
land use data obtained from the 1997 U.S. Department of Agriculture (USDA) National
Resources Inventory (NRI) database (USDA-NRCS, 2007b; Nusser and Goebel, 1997).
The land use and other data reported in the NRI is derived from a statistical sampling
approach within the UMRB (and for the remainder of the U.S.) and is used in the model-
ing system at the 8-digit watershed1 level (Gassman et al., 2006). Other land use data
sources are also available that could be used for the UMRB applications, including the
U.S. Geological Survey (USGS) National Land Cover Data (NLCD) database (Vogel-
mann et al., 2001), USDA National Agricultural Statistics Service (NASS) Agricultural
Census survey data, and a combined NLCD-Agricultural Census land use data layer that
was developed for the Hydrologic Unit Model of the U.S. (HUMUS) modeling system
(Arnold et al., 1999).
Land use comparisons have been reported between the NLCD and the Global Land-
Cover Characteristics (GLCC) global land use dataset (Brown et al., 1993) across the
continental United States (Chen et al., 2005) and for 11 selected U.S. agricultural eco-
regions (Chen et al., 2006). However, comparisons between the NRI land use data and
the previously described alternative land use data sources have not been reported for the
UMRB or for other regions. Thus, the objective of this study is to compare the area
estimates of major land use data categories between the NRI, the NLCD, and HUMUS
for the entire UMRB (2-digit watershed level), and at the 4- and 8-digit watershed scales
(Figure 1). These comparisons will provide valuable insight regarding implications of
land use dataset choice for SWAT UMRB simulation assessments and other studies,
including the relative strengths and weaknesses of the NRI as compared to the other two
land use data sources.

Comparison of Land Use Area Estimates from Three Different Data Sources / 3
Land Use Data Source Descriptions The NLCD, NRI, and HUMUS land use layers were compared in this study for 1992,
which was the only common year available for all three data sets. The three data sets are
described below in further detail, including a description of the Agricultural Census
survey data, which are a key component of the HUMUS land use layer.
NLCD Land Use Data The 1992 NLCD was derived from an analysis of Landsat Thematic Mapper (TM)
satellite imagery purchased jointly by the Multi-Resolution Land Characteristics (MRLC)
consortium in the early 1990s (Vogelmann et al., 2001). The spatial resolution of the data
is 30 meters and it is mapped in the Albers Conic Equal Area projection (North American
Datum of 1983 or NAD83). The NLCD data are provided on a state-by-state basis; these
state data sets were cut out from larger “regional” data sets that are mosaics of Landsat
TM scenes. The USGS National Land Cover Database (NLCD) 2001 (USGS, 2007) data
set has also been recently released and features more updated land use data for 2001,
which is further described by Homer et al. (2004).
The NLCD classifies land use according to one of 21 categories (Table 1) across the
conterminous United States, which were largely derived from the Anderson land use/land
cover classification scheme (Anderson et al., 1976; Vogelmann et al., 2001). The signifi-
cance of a land use/land cover classification scheme is that it provides information not
only about the vegetation structure of an area but also about the specific human uses of
that area. The Anderson classification scheme is hierarchical in nature, with a progression
from more general land use characterizations (Level I) to highly specific ones (Level III).
Level III classifications are difficult to discern with satellite data only and thus were not
included in the NLCD scheme. Modifications to the Anderson classification scheme
include the consolidation of Level II categories into a single NLCD class (i.e.,
Streams/Canals and Lakes/Ponds to simply Open Water), or their dissection (i.e., Crop-
land and Pasture: Pasture/Hay, Row Crops, Small Grains and Fallow).
The dominant land use for each of the 30 m2 units was first estimated using an “unsu-
pervised” clustering algorithm at a sub-regional level for four TM spectral bands. Both
summer and spring/fall images were assessed for each scene, to account for the large
variations that can occur in vegetation appearance during the course of a year. One hundred
4 / Chinnisamy, Gassman, Secchi, and Srinivasan
distinct classes were initially generated using this clustering approach, which were then
aggregated into one of the final 21 NLCD land use classifications (USGS, 1996).
Classification at this scale results in some error between classes with similar reflec-
tance values. Khorram et al. (1999) attempted to assess the accuracy of a portion of the
NLCD and concluded that confusion of deciduous versus mixed forest, evergreen versus
mixed, high residential versus low-residential, and high-residential versus commer-
cial/industrial/transportation were common classification errors. Despite these errors, this
data set is generally regarded as being among the most accurate available for depicting
regional land use patterns.
The USGS and Environmental Protection Agency (EPA) have also conducted accu-
racy assessments of the NLCD data for selected federal regions using a scientifically
rigorous approach. Accuracy assessments follow a revision cycle that incorporates
feedback from MRLC Consortium partners and affiliated users. Private sector vendors
under contract to the USEPA conducted the accuracy assessments. A protocol has been
established by the two agencies that incorporates a two-stage, geographically stratified
cluster sampling plan (Zhu et al., 2000) utilizing National Aerial Photography Program
(NAPP) photographs as the sampling frame and the basic sampling unit. Results of the
accuracy assessment indicate the ability of the NLCD to meet data requirements for
applications at the regional to continental scale (Yang et al., 2001).
NRI Land Use Data
The NRI is a scientifically based survey designed to assess conditions and trends of
soil, water, and related resources of U.S. non-federal lands at the national, regional, and
state levels. NRI datasets were developed for the United States every five years from
1982 to 1997 (Nusser and Goebel, 1997; USDA-NRCS, 2007b). The NRI sample is a
stratified two-stage unequal-probability area sample (Nusser and Goebel, 1997). Much of
the United States is divided according to the Public Land Survey (PLS) system (USDI,
2007), and the NRI sample selection procedure is developed using the PLS system
structure. Counties or analogous units have been used to implement the basic sampling
design. The primary sampling units (PSUs) are areas of land called “segments.” The
segments vary in size from 16 to 256 hectares (40-640 acres). There are about 300,000
PSUs in the current national sample. Detailed data are collected at a randomized sample
Comparison of Land Use Area Estimates from Three Different Data Sources / 5
of points within each of these PSUs. Generally, there are three points per PSU, but some
PSUs only contain one or two points. There are about 844,000 sample points in the NRI.
At each sample point, information is collected on nearly 200 attributes including land use
and cover, soil type, cropping history, conservation practices, erosion potential, water and
wind erosion area estimates, wetlands, wildlife habitat, vegetative cover conditions, and
irrigation method. The NRI data is spatially identified by state, Major Land Resource
Area (MLRA), 8-digit watershed, and counties. Nusser and Goebel (1997) provide a
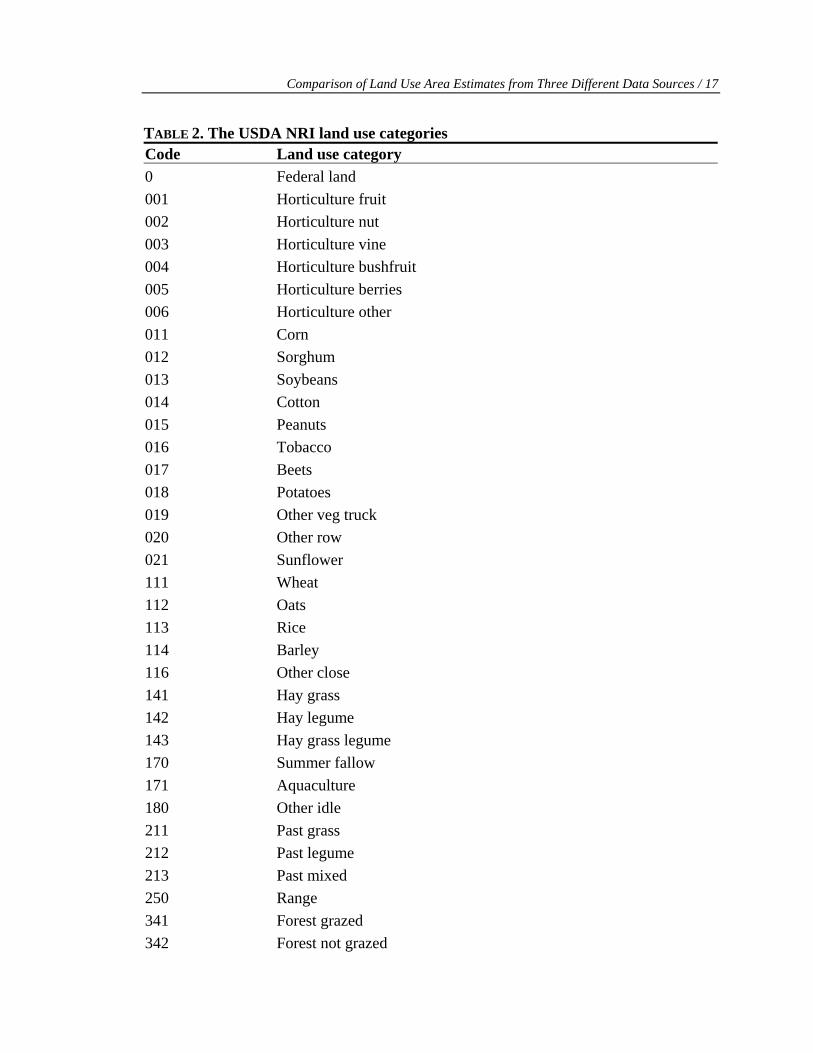
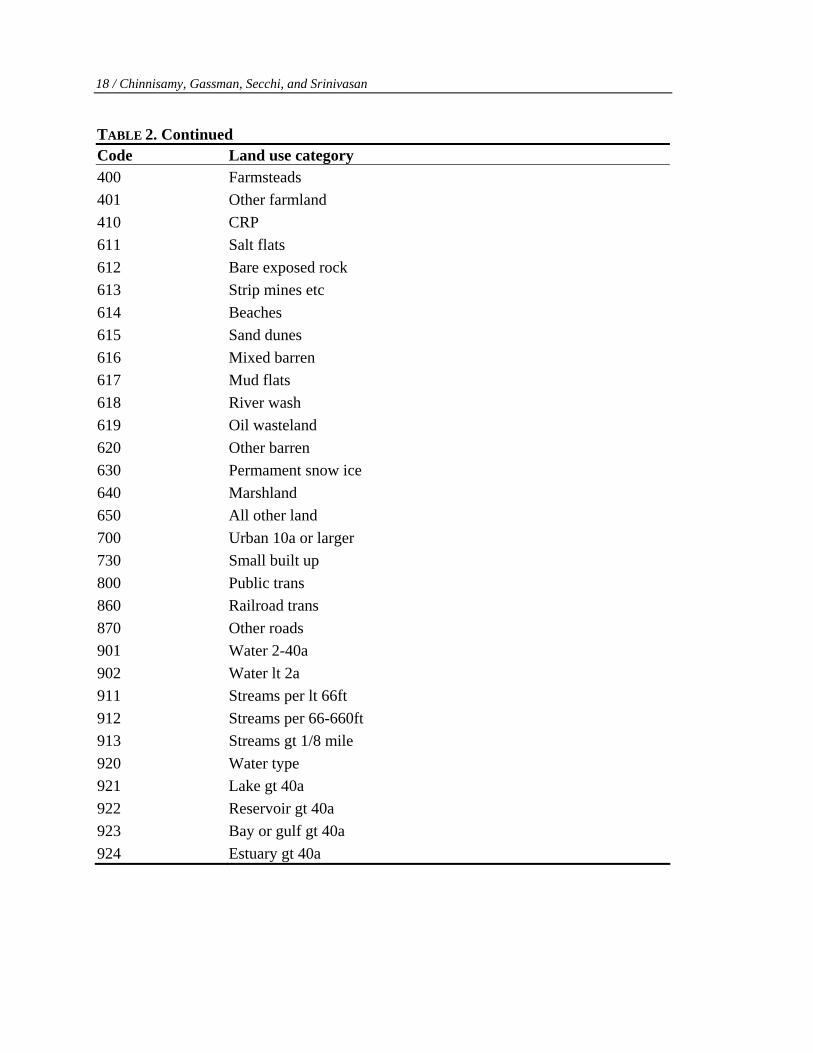
more detailed description of the NRI survey design and statistical procedures. Table 2
provides the land use categories of NRI.
NRI data have been collected annually since 2001. In each year, both a Core Panel
and Supplement Panel are sampled. The Core Panel is sampled each year while the
Supplemental Panel rotates from year to year, consisting of a separate set of NRI sample
points each year. The Core Panel and each Supplemental Panel are subsets of the NRI
Foundation Sample, which is the full set of NRI sample points. The Core Panel contains
about 41,600 PSUs, and the three Supplemental Panels drawn for 2001, 2002, and 2003
each contain about 32,000 PSUs. The density of PSUs collected nationally each year in
these annual NRI surveys are roughly 25% of the full national sample, resulting in a
greatly reduced resolution of land use characterization as compared to the 1997 NRI and
earlier NRI datasets. Thus, these more recent annual NRI survey data cannot be used for
the UMRB modeling system because of a lack of sampling points (i.e., these NRI data are
statistically valid only at the national level).2 Therefore, 1997 NRI data are currently used
in the UMRB modeling system, with some links to the 1992 NRI data.
Agriculture Census Data The Census of Agriculture (AgCensus) is the leading source of U.S. agricultural pro-
duction statistics at the county, state, and national levels (USDA-NASS, 2007a). The
AgCensus has been collected on a five-year cycle for years ending in 2 and 7 at the
county (or equivalent) level since 1982. The census data within the United States is
collected using mailout/mailback data collection procedures. The mailing list for the 1992
census was comprised of individuals, businesses, and organizations that could be readily
identified as being associated with agriculture. The list was assembled from the records
of the 1987 census, administrative records of the Internal Revenue Service (IRS), and the

6 / Chinnisamy, Gassman, Secchi, and Srinivasan
statistical records of the USDA. Three different report forms (sample, nonsample, and
screener form) were used for data collection in 1992. To assure adequate county- level
census coverage and to minimize the reporting burden, a stratified random sample
procedure is used to select recipients of the sample form. Operators are selected using
strata that reflect product type, value of sales, and total acreage. Responses are collected
and a statistical estimation procedure is used to account for non-responders. The AgCen-
sus data is developed using this information. More details on the collection, processing
methodology, and reliability of census estimates are given in USDA-NASS (2007b).
AgCensus statistics are used by Congress to develop and change farm programs,
study historical trends, assess current conditions, and plan for the future. Many national
and state programs use census data to design and allocate funding for extension service
projects, agricultural research, soil conservation programs, and land-grant colleges and
universities. Private industry uses census statistics to provide a more effective production
and distribution system for the agricultural community.
HUMUS Land Use Data (Combined NLCD and AgCensus Data) The NLCD land use data is widely used for generating inputs for hydrologic/water
quality modeling because these data are available in GIS format at a high resolution (30
m). However, as mentioned earlier, these data do not provide area estimates for individ-
ual row and close-grown crops (Table 1). In contrast, the AgCensus provides area
estimates for agricultural land use including specific crops but does not contain land use
data for non-agricultural land categories such as forest, wetland, urban, and water. Thus,
the two data sets were merged to provide a more robust land use data layer to support
applications of HUMUS, which was initially developed to support USDA analyses of the
United States Resources Conservation Act Assessment of 1997 for the conterminous
United States. The combined NLCD-AgCensus land use dataset was developed to
improve and update the less detailed land use layers that were initially used in HUMUS
as described by Arnold et al. (1999).
The HUMUS data set was created by initially setting the broad agricultural and non-
agricultural land use areas equal to the corresponding NLCD areas, at the 2-, 4-, and 8-digit
levels. The NLCD non-agricultural land use subcategories (e.g., urban, forest) were also
incorporated into the HUMUS land use layer. The AgCensus land use subcategories,
Comparison of Land Use Area Estimates from Three Different Data Sources / 7
including both broad land use designations (e.g., row crop, cover crop) and specific crops
(e.g., corn, soybean, hay land) were then imputed within the overall HUMUS agricultural
land use category. This process was performed by determining the appropriate areal
weights that allowed the AgCensus county-level data to be translated to the 8-digit water-
shed level for the HUMUS data set. This step provided much more detailed agricultural
land use information for HUMUS than could have been obtained using just the NLCD.
Comparison Methodology The initial phase of the land use comparison process was the grouping of specific
land use categories (Tables 1 to 3) into broader land use categories (Tables 4 and 5),
which required some subjective decisions as to the most appropriate category into which
a specific land use should be placed. This process was carried out in two steps: (1) the
grouping of NRI and NLCD land use categories into 12 consistent major land use catego-
ries (Table 4), where the NLCD broad non-agricultural land use categories also
represented the corresponding categories in HUMUS; and (2) the further partitioning of
the HUMUS agricultural land use categories, as reported in the AgCensus, into the four
broad agricultural categories (Table 5). For this study, agricultural land included row
crops, close-grown crops, pasture, hay, and orchards, while the non-agricultural land
included all other categories such as range, urban, fallow, transitional, barren, forest,
wetland, and water. The land area estimates for the HUMUS and NLCD broad agricul-
tural and non-agricultural land uses are identical at all levels, and thus are identified as
HUMUS/NLCD for the land use area comparisons. There are variations in how some of
the land use categories are defined within each source, which precludes direct compari-
sons for some of the categories. For example, actual land use is not identified for federal
land areas in the NRI but is accounted for in the NLCD and HUMUS data sources.
The first step in performing the comparisons between the different land use sources
was determining the areas of each land use category at the 2-, 4-, and 8-digit watershed
scales (Figures 1). These areas were estimated for the NLCD database by overlaying the
land use map on the different hydrologic units. The NRI land use areas were determined
using a two-step process in which the total areas for each point were first estimated using
the expansion factors associated with each NRI point, and then the point areas were

8 / Chinnisamy, Gassman, Secchi, and Srinivasan
aggregated to the hydrologic unit levels. The total areas of each land use category were
also similarly summed for the HUMUS data within each respective hydrologic unit. The
percentage differences in land use area comparisons were performed by comparing the
NRI land use areas relative to the NLCD or HUMUS land use area estimates, for each
land use category3 using the following equations:
% *100.0NRI NLCDdiffNRI−⎛ ⎞=⎜ ⎟
⎝ ⎠ (1)
% *100.0NRI HUMUSdiffNRI−⎛ ⎞=⎜ ⎟
⎝ ⎠ (2)
where %diff equals the percentage difference, and NRI, NLCD, and HUMUS are the
respective land use area estimates for each percentage difference calculation.
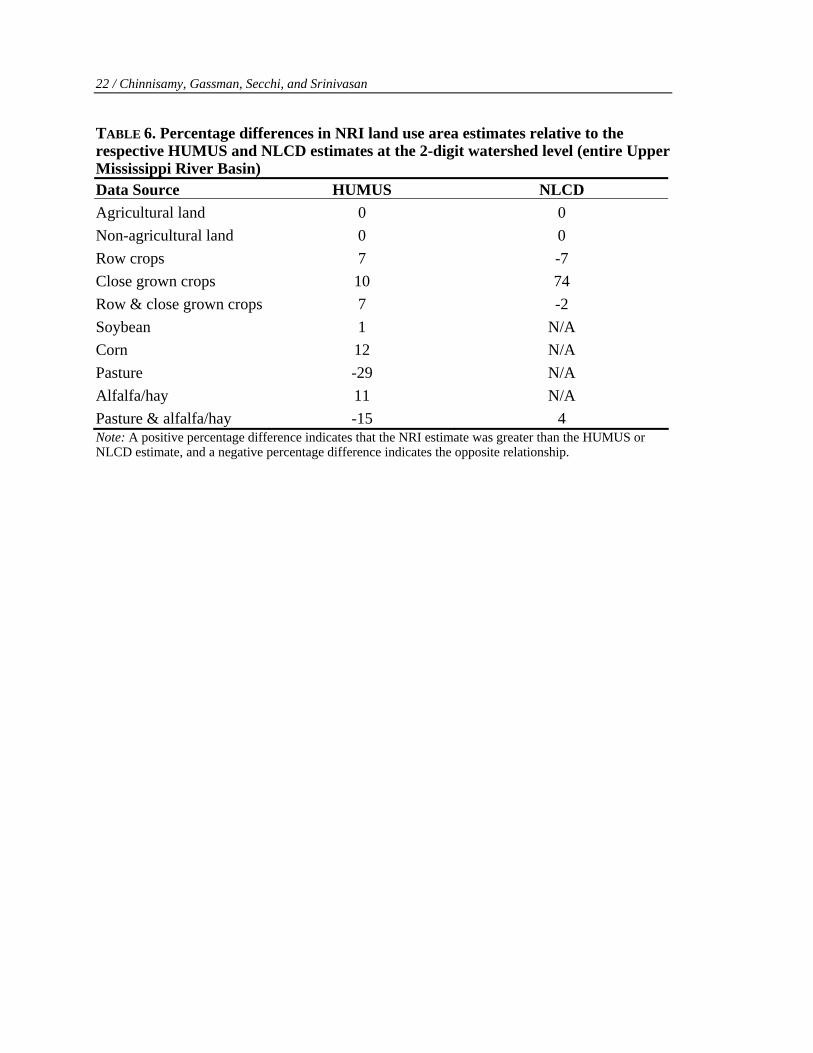
Results Comparison of the Land Use Area Estimates at the 2-Digit Watershed Level
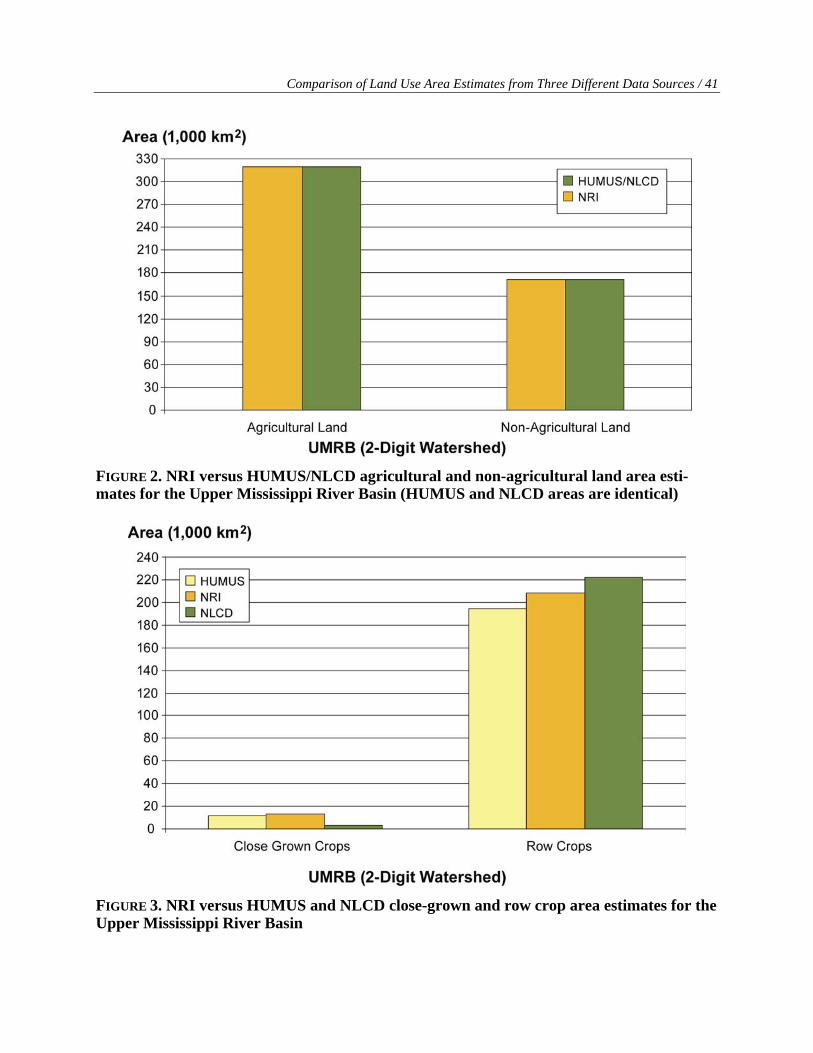
The total UMRB agricultural and non-agricultural land estimates between the NRI
and HUMUS/NLCD matched well (Figure 2) with no discernible variation (Table 6).
However, comparisons of UMRB-level row crop and close-grown crop areas show
definite variations between the three land use sources, especially for the NLCD estimates
(Figure 3). The estimated NRI row crop area was 7% less than the respective NLCD
estimate (Table 6). On the other hand, the estimated NRI row crop area exceeded the
corresponding HUMUS by 7%. The estimated NLCD close-grown crop area for the
entire UMRB was considerably less than the corresponding areas for the other two data
sources (Figure 3). The NLCD underestimated the NRI close-grown crop area by 74%
while the HUMUS estimate was only 10% lower than the corresponding NRI area (Table
6). The combined close-grown crop and row crop areas were much closer for the three
land use databases; the overall NLCD and HUMUS areas were 2% higher and 7% lower,
respectively, when compared to the NRI. The combined NLCD and HUMUS estimated
pasture and hay areas were 4% higher and 15% lower, respectively, than the associated
Comparison of Land Use Area Estimates from Three Different Data Sources / 9
NRI estimate (Table 6). Overall, these results show that the total URMB cropland and
grassland estimates are similar among the three datasets. However, the NLCD appears to
underestimate greatly the total UMRB close-grown crop area.
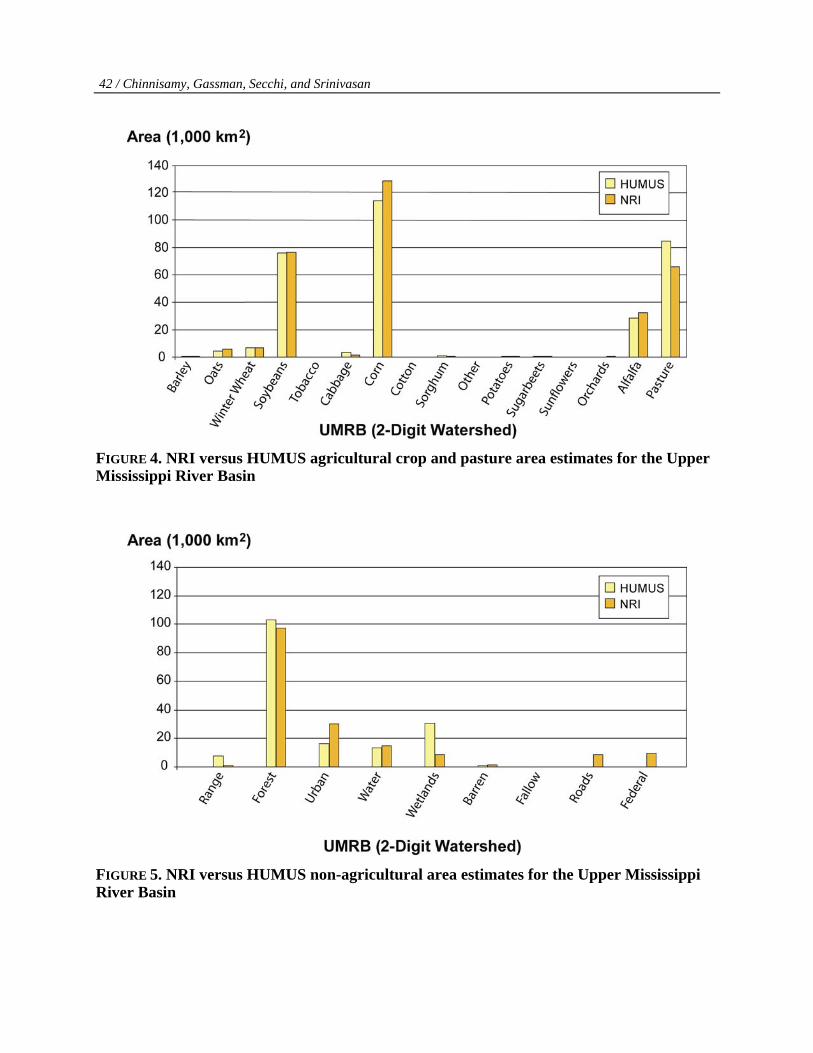
Comparisons of individual crops, alfalfa, and pasture were performed only between
the NRI and HUMUS data sets (Figure 3), because the NLCD land use data do not
provide individual crop area estimates. The estimated land areas of corn and soybeans,
the two dominant UMRB crops, were generally similar. The difference in the estimated
soybean areas was just 1% while the NRI corn acreage estimate was 12% higher than the
respective HUMUS estimate (Table 6). The estimated areas of oats, winter wheat, and
barley (all close-grown crops) and other non-grassland crops were also similar between
the two data sets and were much smaller than the corn and soybean areas. The NRI
alfalfa/hay area estimate exceeded the associated HUMUS estimate by 11% (Table 6),
which was nearly the same as the difference found between the two data sets for the corn
area estimates; however, the amount of cropland planted to alfalfa was equal to only
about 25% of the planted corn area (Figure 4). In contrast, the NRI pasture area estimate
was 29% lower than the estimated HUMUS pasture area (Table 6), which was the largest
difference of any of the major land use categories shown in Figure 4
Figure 5 shows comparisons between the NRI and HUMUS for several non-
agricultural categories (the HUMUS areas are based directly on the NLCD as previously
discussed). The predicted forest areas were relatively close between the two data sources,
and are the largest non-cropland areas for both the NRI and HUMUS (except for pasture
and hay land). The NRI urban area estimate was roughly double that of the HUMUS
urban area, while the HUMUS range area estimate was much larger than the correspond-
ing NRI area and is likely an overestimate. The HUMUS wetland area estimate is over
three times greater than the NRI wetland area. The extent of wetland areas in the NRI is
known to greatly underestimate the true wetland area as discussed by Gassman et al.
(2006). This is due in part to wetlands being located in federal land, which is not broken
out into specific land uses in the NRI. This NRI wetland area underestimate has been
corrected for the SWAT UMRB simulation by making adjustments to align the wetland
areas with those reported in the NLCD, as described by Gassman et al. (2006).
10 / Chinnisamy, Gassman, Secchi, and Srinivasan
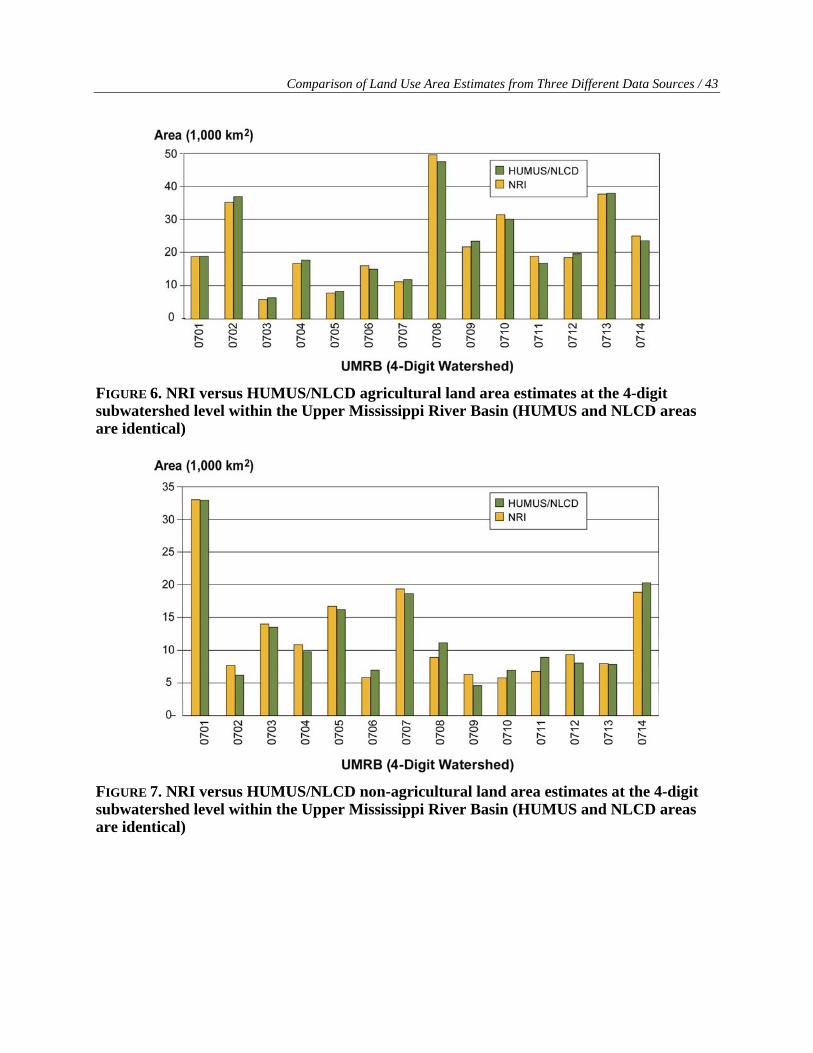
Comparison of the Land Use Area Estimates at the 4-Digit Watershed Level Land use area comparisons were performed between the NRI and the two other land
use data sets for the 14 4-digit watersheds (Figure 1). Percentage differences are reported
for all of the comparisons in Table 7. The agricultural land areas estimated for the NRI
data sources were within -8% to 11% of the corresponding HUMUS/NLCD area esti-
mates across the 14 UMRB 4-digit watersheds (Figure 6). The NRI estimates for the non-
agricultural land areas varied between -32% to 20% as compared to the HUMUS/NLCD
area estimates (Figure 7). The NRI row crop area estimates were consistently lower as
compared to the NLCD (Figure 8), except for three of the 4-digit watersheds; the per-
centage differences ranged from -108% to 27% (Table 7). However, the NRI row crop
area estimates were always higher (2% to 14%) than the HUMUS area estimates in all 14
4-digit watersheds (Figure 8, Table 7). The NRI close-grown crop area estimates ranged
from 47% to 100% higher than the NLCD estimates except for watershed 0701, which
was 7% less than the NLCD area estimate (Figure 9, Table 7). The majority of the NRI
close-grown crop area estimates were greater than the corresponding HUMUS areas, with
percentage differences varying from -61% to 46% (Table 7). The graphical comparisons
in Figure 9 further confirm the weakness of the NLCD close-grown crop estimates as
compared to the estimates provided by the NRI and HUMUS. The percentage differences
determined between the combined row crop and close-grown crop areas (Table 7) for the
most intensively cropped 4-digit watersheds (i.e., 0702, 0708, 0709, 0710, and 0713) are
relatively small, suggesting that the three datasets provide accurate estimates of total
cropland in UMRB cropland-dominated subregions.
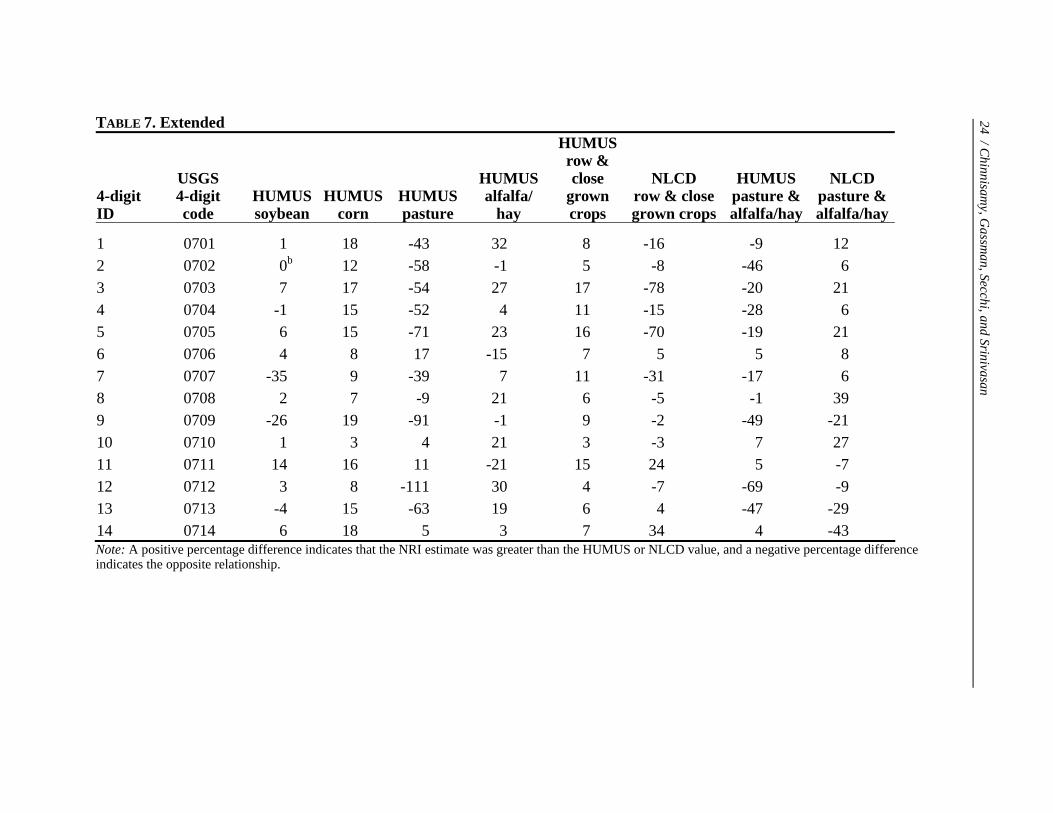
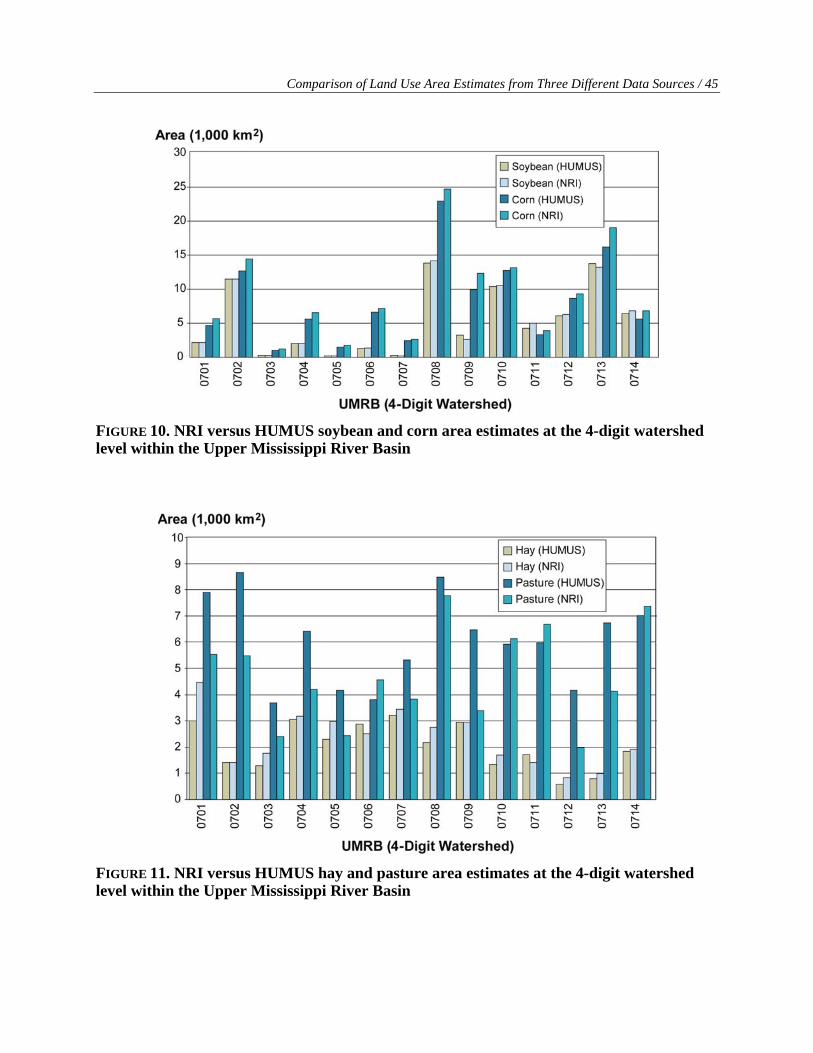
Comparisons between the NRI and HUMUS are shown for corn and soybeans in Fig-
ure 10, and for hay and pasture in Figure 11. The soybean area estimates between the
NRI and HUMUS were within ±10% for 11 out of the 14 4-digit watersheds. The NRI
corn area estimates exceeded the corresponding HUMUS corn areas by 3% to 19%. The
estimated NRI pasture areas differed from the HUMUS pasture areas by -111% to 17%
and were lower in 11 of the 14 4-digit watersheds. The opposite result occurred for the
alfalfa/hay area comparisons, which revealed that the estimated NRI areas were higher in
10 of the 4-digit watersheds as compared to the HUMUS area estimates and that the NRI
areas ranged from -21% to 32% of the HUMUS areas. The combined NRI estimated
Comparison of Land Use Area Estimates from Three Different Data Sources / 11
pasture and alfalfa/hay areas ranged from -69% to 5% and -43% to 39% of the corre-
sponding HUMUS and NLCD combined areas. In general, the pasture and alfalfa/hay
area estimates at the 4-digit watershed level reflect greater variability between the three
datasets as compared to the cropland estimates, which suggests that there is more uncer-
tainty in the grassland use estimates.
Comparison of the Land Use Area Estimates at the 8-Digit Watershed Level Land use comparisons for the 131 8-digit watersheds (Figure 12) are shown in Fig-
ures 13 through 22 between the NRI, HUMUS, and/or NLCD datasets. Percentage
differences between the different land use estimates are listed in Table 8, which includes
a cross-reference between the 8-digit watershed IDs (Figure 12) and the USGS 8-digit
watershed codes.
The NRI agricultural and non-agricultural land use patterns were generally similar to
the corresponding HUMUS/NLCD land use estimates at the UMRB 8-digit watershed
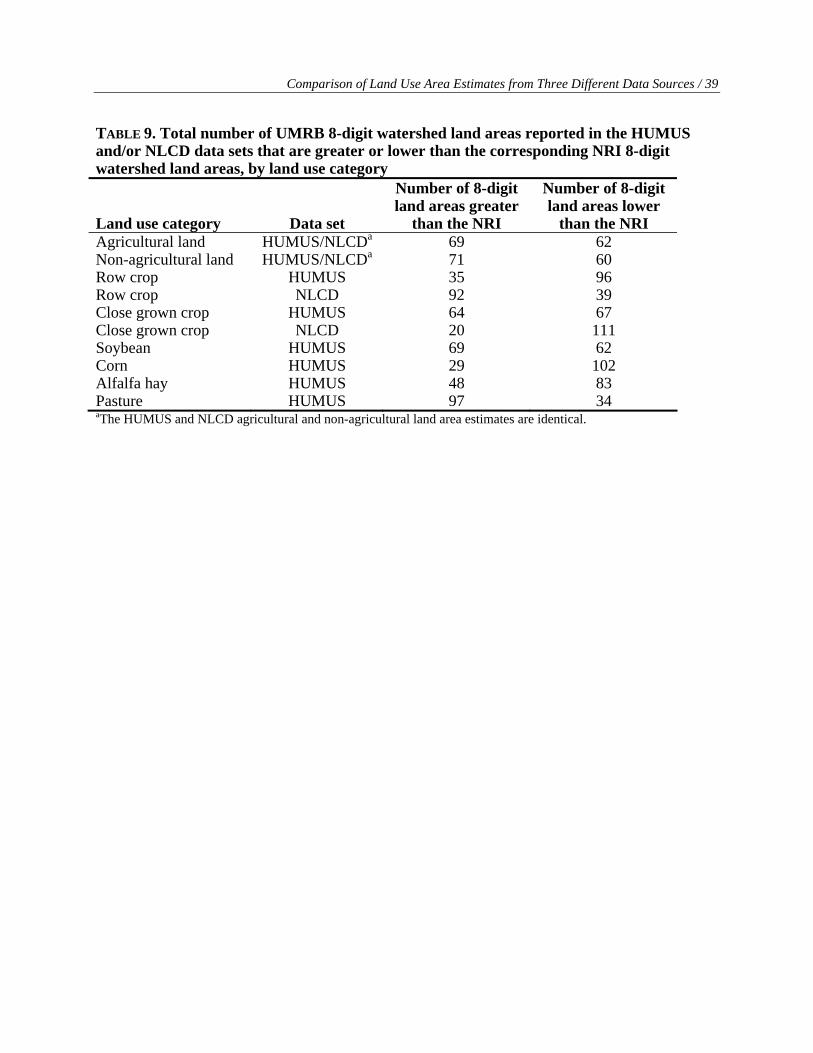
level (Figures 13 and 14). Slightly more than half of these HUMUS/NLCD land areas
were greater than the respective NRI land use areas (Table 9). Differences between the
NRI and HUMUS/NLCD agricultural land area estimates were greater than ±30% (-76%
to 35%) in only five of the 8-digit watersheds. The percentage differences for the NRI
versus HUMUS/NLCD non-agricultural land use comparisons exceeded ±30% (-100% to
57%) for 23 of the 8-digit watersheds. Several of the largest discrepancies were found for
8-digit watersheds with relatively small amounts of agricultural or non-agricultural land;
e.g., watershed 5 in Figure 13 and watersheds 70 and 96 in Figure 14.
The extent of estimated row crop area reported in the NRI was also similar to the es-
timated row crop areas in the HUMUS and NLCD datasets, as shown in Figures 15 and
16. Row crop land area estimate comparisons at the individual 8-digit watershed level
reveal essentially opposite results with respect to the NRI (Table 9), with 70% of the
NLCD estimates higher and 73% of the HUMUS estimates lower. The greatest percent-
age differences in the row crop estimates ranged from 88% to -324% between the NRI
and HUMUS and from 44% to -893% between the NRI and NLCD. Several of these
large differences again occurred for 8-digit watersheds with small row crop areas such as
watersheds 3, 5, 9, and 122 in Figure 15 and watersheds 5, 28, 29, and 54 in Figure 16.

12 / Chinnisamy, Gassman, Secchi, and Srinivasan
Much greater differences resulted in the close-grown crop land area estimate com-
parisons (Figures 17 and 18). The HUMUS close-grown crop areas followed the general
pattern of the corresponding NRI areas across the 8-digit watersheds, and the distribution
of the HUMUS close-grown crop area estimates were nearly evenly split between higher
and lower values relative to the NRI (Table 9). However, the percentage differences were
greater than ±30% (80% to -525%) for 75 of the 8-digit watershed close-grown crop area
comparisons between the NRI and HUMUS. The NLCD close-grown crop distributions
greatly underestimated the corresponding NRI land areas in virtually all of the 8-digit
watersheds (Tables 8 and 9), reflecting the very low NLCD close-grown crop area
estimates that were previously discussed for the 2- and 4-digit watershed levels. These 8-
digit comparisons further indicate that the NLCD close-grown crop area estimates are
likely inaccurate.
Soybean, corn, alfalfa/hay, and pasture 8-digit watershed comparisons between the
NRI and HUMUS are shown in Figures 19 to 22, respectively. Similar trends in estimated
soybean, corn, and alfalfa/hay land areas can be seen between the two data sets; however,
the differences between the NRI and HUMUS pasture areas are noticeably greater. The
distributions of HUMUS individual 8-digit watershed land areas relative to the NRI
varied considerably (Table 9), with a little over half exceeding corresponding NRI land
areas for soybeans while the majority of corn, alfalfa/hay, and pasture areas were less
than the associated NRI land areas. Large percentage differences were again found
between the NRI and HUMUS estimates for the three crops and pasture, with extreme
differences (Table 7) and ranges of 100% to -1112%, 66% to -637%, 72% to -281%, and
48% to -321% for soybeans, corn, alfalfa/hay, and pasture, respectively. Similar to
previously discussed comparisons, many of these large percentage differences resulted
for 8-digit watersheds with relatively small areas of the respective crop or pasture; e.g.,
subwatersheds 8 and 9 in Figure 19.
Conclusions The results of this study show that the NRI is a viable source of land use data for
UMRB SWAT simulation studies and other analyses. The NRI land use estimates were in
general agreement with the corresponding HUMUS and NLCD estimates for most of the
Comparison of Land Use Area Estimates from Three Different Data Sources / 13
major land use categories. As expected, the percentage differences increased as the land
area comparisons were refined from the larger watersheds (2- and 4-digit) to the smaller 8-
digit watersheds. However, the overall consistency in land use estimates indicates that the
NRI land use data can be used for UMRB modeling studies with reasonable confidence.
The results of the study also show the clear advantage of the NRI and HUMUS rela-
tive to the NLCD for agricultural land use analyses. A key weakness of the NLCD is the
lack of specific crop land use data that is available in both the NRI and HUMUS. The
NLCD also greatly underestimates the extent of close-grown crops at all levels in the
UMRB. However, the NLCD does provide similar overall cropland area estimates
relative to the NRI and HUMUS for the most intensely cropped UMRB subregions,
indicating that the NLCD is a viable alternative land use data source depending on how
the data are applied. It is necessary to incorporate the more complete NLCD wetlands
land use into NRI-based UMRB studies, to ensure an accurate accounting of wetland
impacts in the region. The NLCD also provides an accurate set of non-agricultural land
use data for the HUMUS approach.
The greatest uncertainty between the NRI and HUMUS land use estimates was for
close-grown crops, pasture, and alfalfa/hayland, based on the magnitudes of the percent-
age difference calculations. It is not possible to establish which of the data sources
provides the most accurate estimates of these land use categories. Sensitivity analyses of
different land use levels for these three agricultural land use categories could provide
useful insights regarding the impacts of the differences between the two data sets.
It is likely that comparisons between more recent datasets, such as the 1997 NRI,
1997 or 2002 AgCensus, and 2001 NLCD data would provide only limited additional
insights. Cropland is defined as only “cultivated crops” in the 2001 NLCD, which is even
less information than the row and cover crop categories provided in the 1992 NLCD. The
1997 NRI also does not show major land use shifts as compared to the 1992 NRI, with
the exception of changes in row crop acreage as described by Gassman et al. (1998).
Thus, we would not expect that such additional comparisons would result in different
conclusions than those found for this study. However, the following future research is
recommended for further assessment of the impacts of the different land use datasets on
UMRB hydrology and water quality:
14 / Chinnisamy, Gassman, Secchi, and Srinivasan
• Compare the results of using both the 1997 NRI and HUMUS as land use data
sources for SWAT UMRB simulations. This would provide useful insights re-
garding the impacts of the two approaches on UMRB water resources and
potentially reveal additional data gaps that need to be addressed in future
UMRB land use data sets.
• Further compare the results of the NRI and HUMUS approaches with the
USDA Conservation Effects Assessment Project (CEAP) National Assess-
ment that is described in USDA-NRCS (2007a). The National CEAP
assessment is a partial NRI-based approach that incorporates updated data ob-
tained from more recent surveys of agricultural producers.
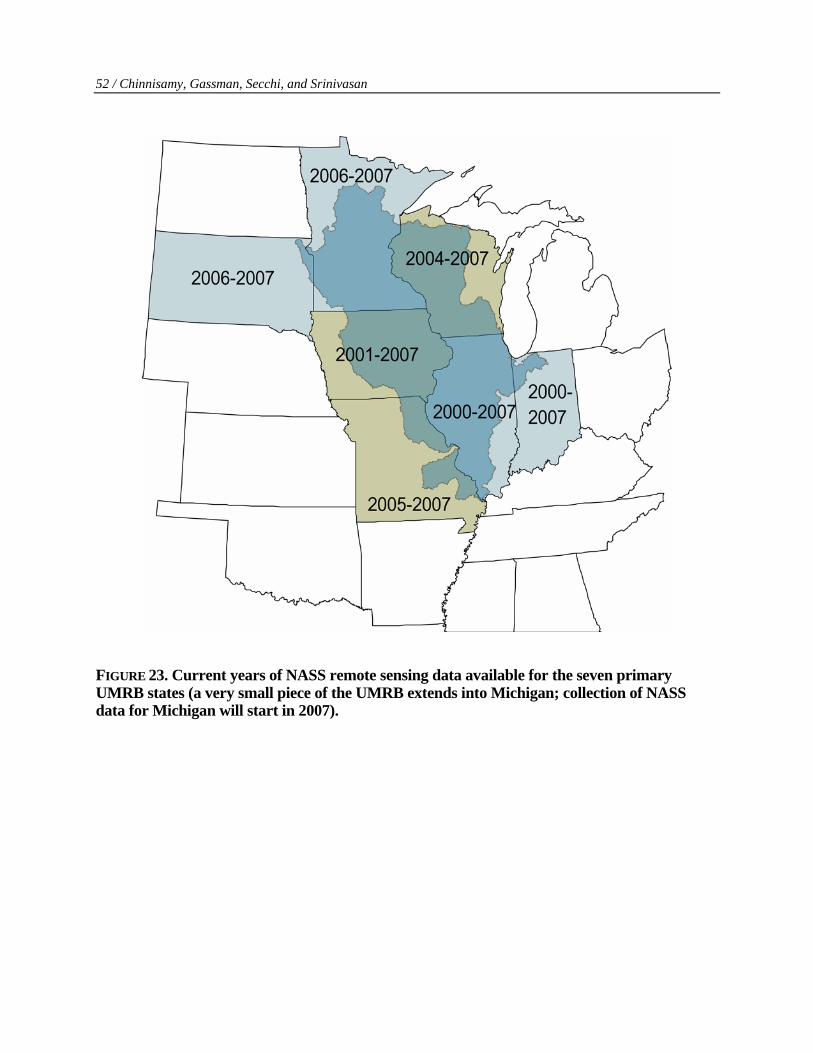
• Pursue development of a UMRB land use data source based on remote sensing
data collected by USDA-NASS (2007c), which can be used to derive crop ro-
tations such as those reported by Secchi et al. (2007) for an Iowa biofuels
assessment. The NASS land use data years that will be available for each state
in the UMRB after the 2007 remote sensing data are processed as shown in
Figure 23. Additional years of NASS remote sensing data beyond 2007 will
provide the basis for more accurate crop rotation estimates for some of the
states, especially Minnesota and Missouri. Supplemental data may be required
in the interim, such as that provided by the 1997 NRI, to develop fully the
necessary crop rotations for these states.
Endnotes
1. U.S. Geological Survey (USGS) 8-digit hydrologic unit code (HUC) watersheds as described by Seaber, Kapinos, and Knapp (1987) and in USDA-NRCS (2007c).
2. Combining the annual NRI surveys across years could result in a complete national sample comparable to the 1997 NRI and earlier surveys, which would be suitable for many UMRB SWAT modeling applications. However, it is not clear if this step will be taken in the future.
3. The percentage difference calculations result in negative numbers being reported in Tables 6-8 when the NRI land use area estimates are less than the corresponding NLCD or HUMUS es-timates and result in positive numbers for the opposite situation.

16 / Chinnisamy, Gassman, Secchi, and Srinivasan
TABLE 1. The USGS NLCD land use categories Code Land use category 11 Open water
12 Perennial ice/snow
21 Low intensity residential
22 High intensity residential
23 Commercial/industrial/transportation
31 Bare rock/sand/clay
32 Quarries/strip mines/gravel pits
33 Transitional
41 Deciduous forest
42 Evergreen forest
43 Mixed forest
51 Shrubland
61 Orchards/vineyards/other
71 Grasslands/herbaceous
81 Pasture/hay
82 Row crops
83 Small grains
84 Fallow
85 Urban/recreational grasses
91 Woody wetlands
Comparison of Land Use Area Estimates from Three Different Data Sources / 17
TABLE 2. The USDA NRI land use categories Code Land use category 0 Federal land 001 Horticulture fruit 002 Horticulture nut 003 Horticulture vine 004 Horticulture bushfruit 005 Horticulture berries 006 Horticulture other 011 Corn 012 Sorghum 013 Soybeans 014 Cotton 015 Peanuts 016 Tobacco 017 Beets 018 Potatoes 019 Other veg truck 020 Other row 021 Sunflower 111 Wheat 112 Oats 113 Rice 114 Barley 116 Other close 141 Hay grass 142 Hay legume 143 Hay grass legume 170 Summer fallow 171 Aquaculture 180 Other idle 211 Past grass 212 Past legume 213 Past mixed 250 Range 341 Forest grazed 342 Forest not grazed
18 / Chinnisamy, Gassman, Secchi, and Srinivasan
TABLE 2. Continued Code Land use category 400 Farmsteads 401 Other farmland 410 CRP 611 Salt flats 612 Bare exposed rock 613 Strip mines etc 614 Beaches 615 Sand dunes 616 Mixed barren 617 Mud flats 618 River wash 619 Oil wasteland 620 Other barren 630 Permament snow ice 640 Marshland 650 All other land 700 Urban 10a or larger 730 Small built up 800 Public trans 860 Railroad trans 870 Other roads 901 Water 2-40a 902 Water lt 2a 911 Streams per lt 66ft 912 Streams per 66-660ft 913 Streams gt 1/8 mile 920 Water type 921 Lake gt 40a 922 Reservoir gt 40a 923 Bay or gulf gt 40a 924 Estuary gt 40a
Comparison of Land Use Area Estimates from Three Different Data Sources / 19
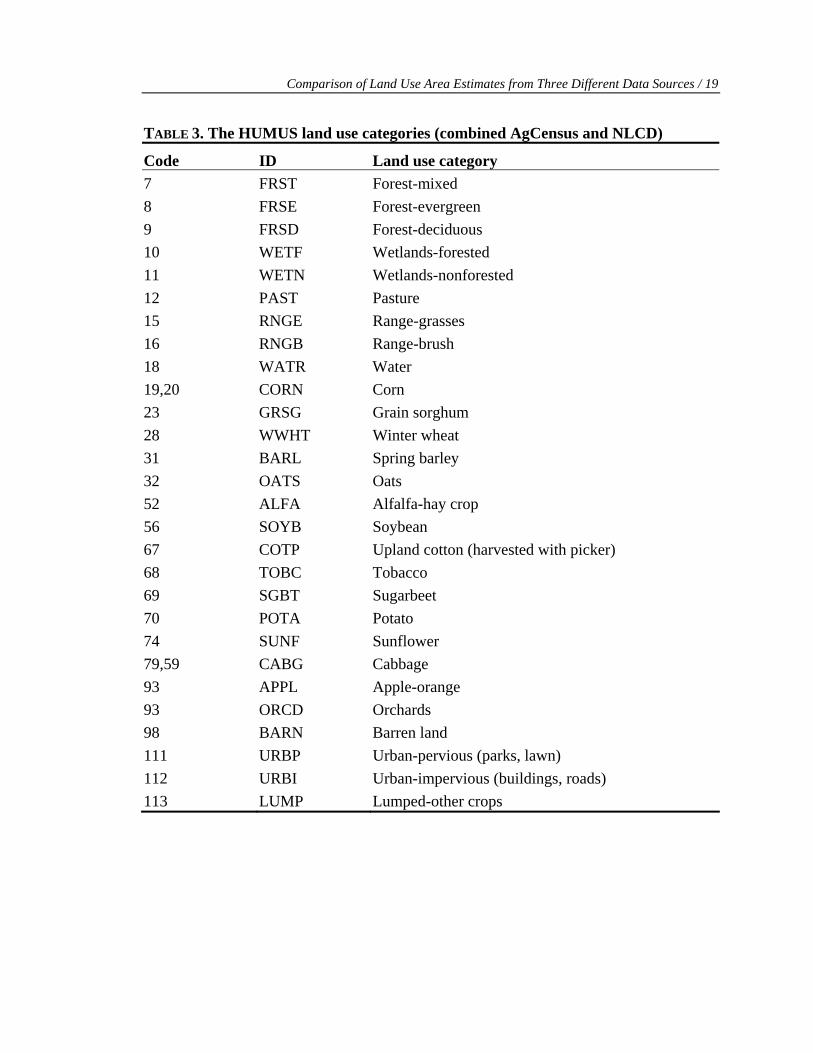
TABLE 3. The HUMUS land use categories (combined AgCensus and NLCD)
Code ID Land use category 7 FRST Forest-mixed 8 FRSE Forest-evergreen 9 FRSD Forest-deciduous 10 WETF Wetlands-forested 11 WETN Wetlands-nonforested 12 PAST Pasture 15 RNGE Range-grasses 16 RNGB Range-brush 18 WATR Water 19,20 CORN Corn 23 GRSG Grain sorghum 28 WWHT Winter wheat 31 BARL Spring barley 32 OATS Oats 52 ALFA Alfalfa-hay crop 56 SOYB Soybean 67 COTP Upland cotton (harvested with picker) 68 TOBC Tobacco 69 SGBT Sugarbeet 70 POTA Potato 74 SUNF Sunflower 79,59 CABG Cabbage 93 APPL Apple-orange 93 ORCD Orchards 98 BARN Barren land 111 URBP Urban-pervious (parks, lawn) 112 URBI Urban-impervious (buildings, roads) 113 LUMP Lumped-other crops

TABLE 4. Grouping of the NRI and NLCD land use categories into 12 major land use categories Category NRI land use categories NLCD land use categories Barren 611, 612, 613, 614, 615, 616, 617, 618, 619, 620, 630 12, 31, 32 Fallow 170 84 Forest 341, 342 41, 42, 43 Non-natural woody 001, 002, 003, 004, 005, 006 61 Pasture/hay 141, 142, 143, 211, 212, 213, 180, 410 81 Rangeland 250 51, 71 Row crops 011, 012, 013, 014, 015, 016, 017, 018, 019, 020, 021 82 Small grains 111, 112, 113, 114, 116 83 Transitional 400, 401, 650 33 Urban 700, 730, 800, 860, 870 21, 22, 23, 85 Water 901, 902, 911, 912, 913, 921, 922, 923, 924, 171 11 Wetlandsa 640 91, 92 aThere is a separate wetlands table in the NRI that is the primary source of wetlands land use data.
20 / Chinnisam
y, Gassm
an, Secchi, and Srinivasan
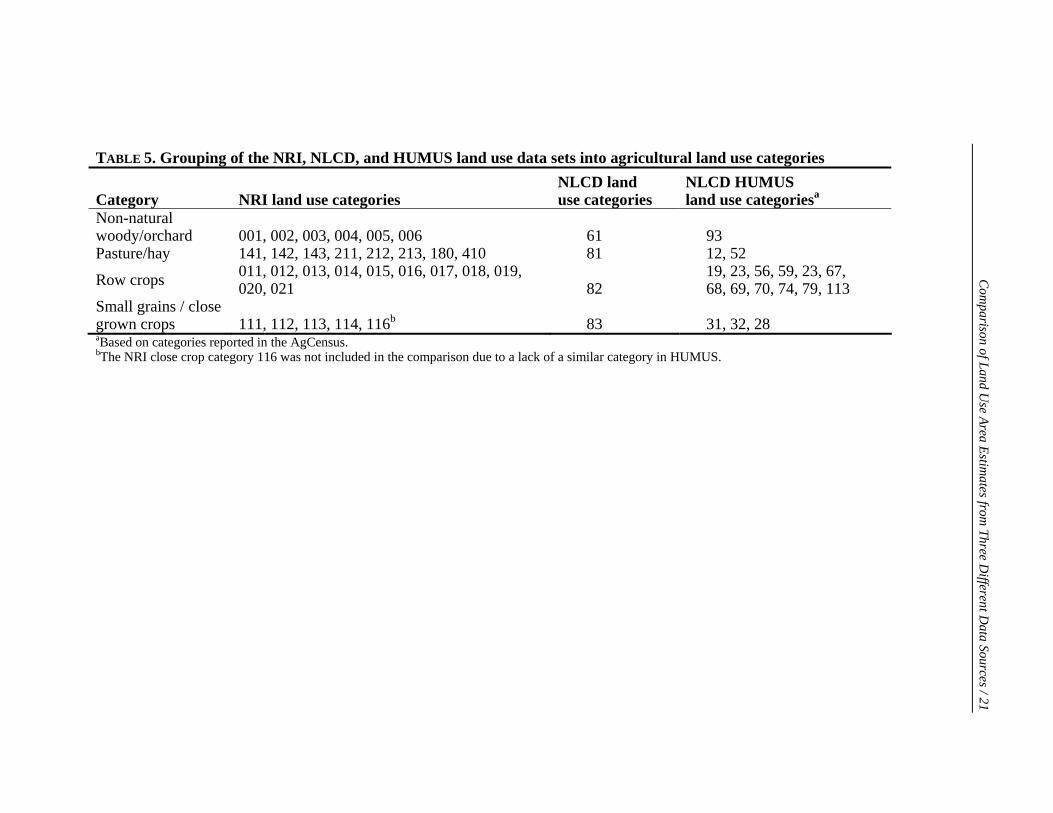
TABLE 5. Grouping of the NRI, NLCD, and HUMUS land use data sets into agricultural land use categories
Category NRI land use categories NLCD land use categories
NLCD HUMUS land use categoriesa
Non-natural woody/orchard 001, 002, 003, 004, 005, 006 61 93 Pasture/hay 141, 142, 143, 211, 212, 213, 180, 410 81 12, 52
Row crops 011, 012, 013, 014, 015, 016, 017, 018, 019, 020, 021 82
19, 23, 56, 59, 23, 67, 68, 69, 70, 74, 79, 113
Small grains / close grown crops 111, 112, 113, 114, 116b 83 31, 32, 28 aBased on categories reported in the AgCensus. bThe NRI close crop category 116 was not included in the comparison due to a lack of a similar category in HUMUS.
Com
parison of Land Use Area Estim
ates from Three D
ifferent Data Sources / 21
22 / Chinnisamy, Gassman, Secchi, and Srinivasan
TABLE 6. Percentage differences in NRI land use area estimates relative to the respective HUMUS and NLCD estimates at the 2-digit watershed level (entire Upper Mississippi River Basin) Data Source HUMUS NLCD Agricultural land 0 0 Non-agricultural land 0 0 Row crops 7 -7 Close grown crops 10 74 Row & close grown crops 7 -2 Soybean 1 N/A Corn 12 N/A Pasture -29 N/A Alfalfa/hay 11 N/A Pasture & alfalfa/hay -15 4 Note: A positive percentage difference indicates that the NRI estimate was greater than the HUMUS or NLCD estimate, and a negative percentage difference indicates the opposite relationship.
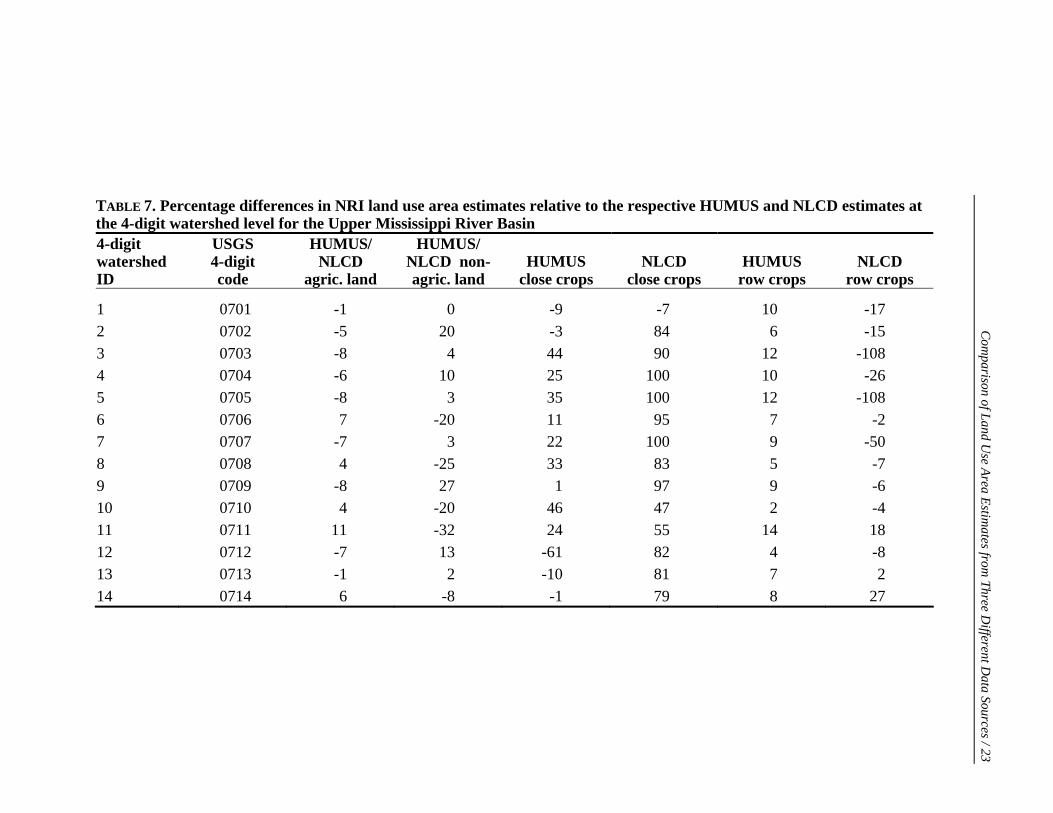
TABLE 7. Percentage differences in NRI land use area estimates relative to the respective HUMUS and NLCD estimates at the 4-digit watershed level for the Upper Mississippi River Basin 4-digit watershed ID
USGS 4-digit code
HUMUS/ NLCD
agric. land
HUMUS/ NLCD non-agric. land
HUMUS close crops
NLCD close crops
HUMUS row crops
NLCD row crops
1 0701 -1 0 -9 -7 10 -17 2 0702 -5 20 -3 84 6 -15 3 0703 -8 4 44 90 12 -108 4 0704 -6 10 25 100 10 -26 5 0705 -8 3 35 100 12 -108 6 0706 7 -20 11 95 7 -2 7 0707 -7 3 22 100 9 -50 8 0708 4 -25 33 83 5 -7 9 0709 -8 27 1 97 9 -6 10 0710 4 -20 46 47 2 -4 11 0711 11 -32 24 55 14 18 12 0712 -7 13 -61 82 4 -8 13 0713 -1 2 -10 81 7 2 14 0714 6 -8 -1 79 8 27
Com
parison of Land Use Area Estim
ates from Three D
ifferent Data Sources / 23
24 / Chinnisam
y, Gassm
an, Secchi, and Srinivasan
TABLE 7. Extended 4-digit ID
USGS 4-digit code
HUMUS soybean
HUMUScorn
HUMUS pasture
HUMUS alfalfa/
hay
HUMUS row & close
grown crops
NLCD row & close grown crops
HUMUS pasture & alfalfa/hay
NLCD pasture & alfalfa/hay
1 0701 1 18 -43 32 8 -16 -9 12 2 0702 0b 12 -58 -1 5 -8 -46 6 3 0703 7 17 -54 27 17 -78 -20 21 4 0704 -1 15 -52 4 11 -15 -28 6 5 0705 6 15 -71 23 16 -70 -19 21 6 0706 4 8 17 -15 7 5 5 8 7 0707 -35 9 -39 7 11 -31 -17 6 8 0708 2 7 -9 21 6 -5 -1 39 9 0709 -26 19 -91 -1 9 -2 -49 -21 10 0710 1 3 4 21 3 -3 7 27 11 0711 14 16 11 -21 15 24 5 -7 12 0712 3 8 -111 30 4 -7 -69 -9 13 0713 -4 15 -63 19 6 4 -47 -29 14 0714 6 18 5 3 7 34 4 -43 Note: A positive percentage difference indicates that the NRI estimate was greater than the HUMUS or NLCD value, and a negative percentage difference indicates the opposite relationship.
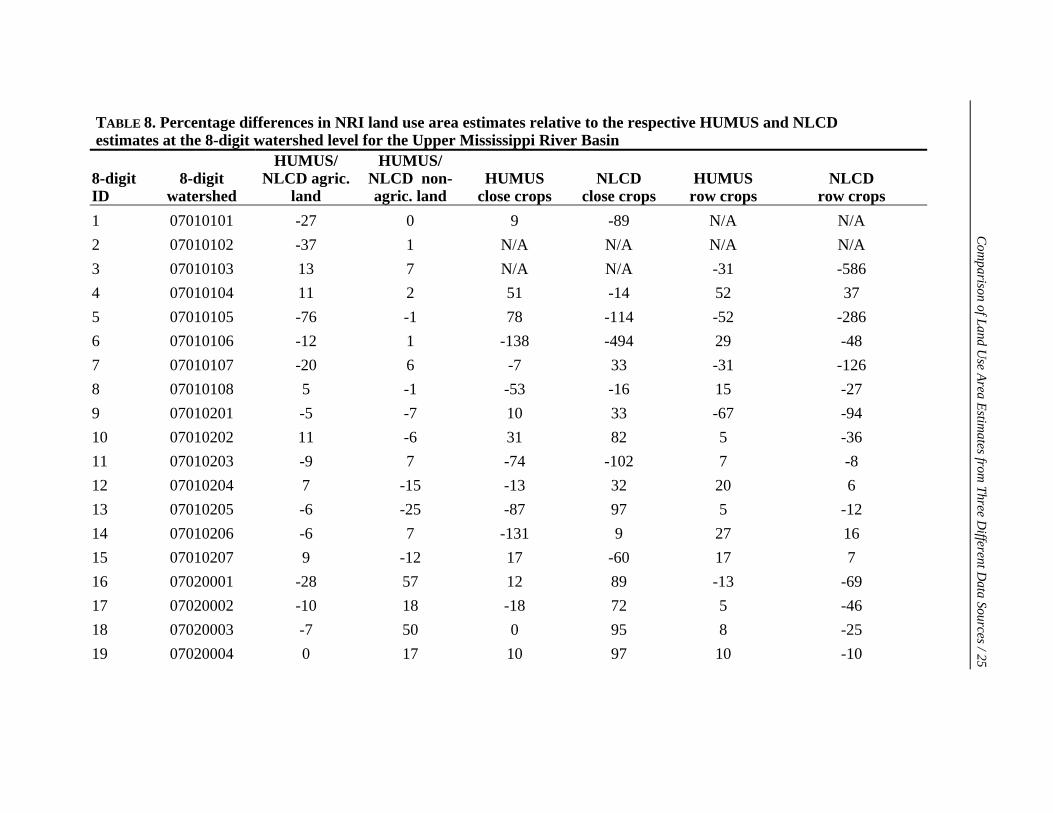
TABLE 8. Percentage differences in NRI land use area estimates relative to the respective HUMUS and NLCD estimates at the 8-digit watershed level for the Upper Mississippi River Basin
8-digit ID
8-digit watershed
HUMUS/ NLCD agric.
land
HUMUS/ NLCD non-agric. land
HUMUS close crops
NLCD close crops
HUMUS row crops
NLCD row crops
1 07010101 -27 0 9 -89 N/A N/A 2 07010102 -37 1 N/A N/A N/A N/A 3 07010103 13 7 N/A N/A -31 -586 4 07010104 11 2 51 -14 52 37 5 07010105 -76 -1 78 -114 -52 -286 6 07010106 -12 1 -138 -494 29 -48 7 07010107 -20 6 -7 33 -31 -126 8 07010108 5 -1 -53 -16 15 -27 9 07010201 -5 -7 10 33 -67 -94 10 07010202 11 -6 31 82 5 -36 11 07010203 -9 7 -74 -102 7 -8 12 07010204 7 -15 -13 32 20 6 13 07010205 -6 -25 -87 97 5 -12 14 07010206 -6 7 -131 9 27 16 15 07010207 9 -12 17 -60 17 7 16 07020001 -28 57 12 89 -13 -69 17 07020002 -10 18 -18 72 5 -46 18 07020003 -7 50 0 95 8 -25 19 07020004 0 17 10 97 10 -10
Com
parison of Land Use Area Estim
ates from Three D
ifferent Data Sources / 25
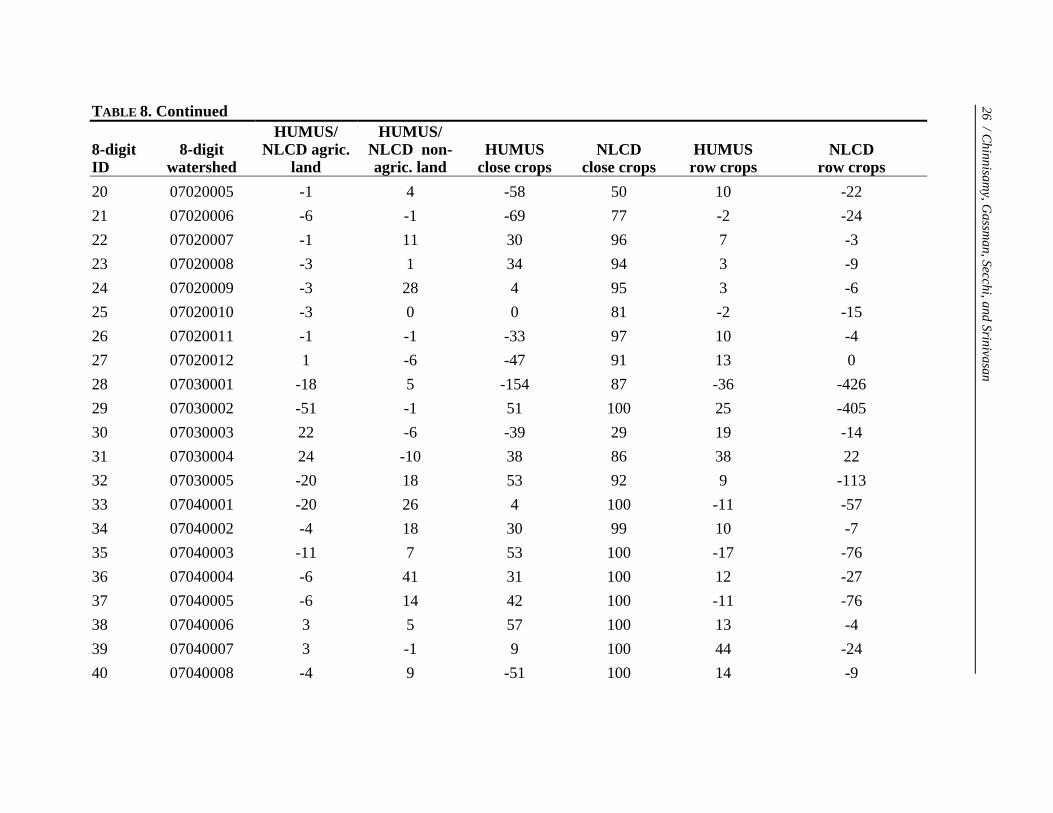
TABLE 8. Continued
8-digit ID
8-digit watershed
HUMUS/ NLCD agric.
land
HUMUS/ NLCD non-agric. land
HUMUS close crops
NLCD close crops
HUMUS row crops
NLCD row crops
20 07020005 -1 4 -58 50 10 -22 21 07020006 -6 -1 -69 77 -2 -24 22 07020007 -1 11 30 96 7 -3 23 07020008 -3 1 34 94 3 -9 24 07020009 -3 28 4 95 3 -6 25 07020010 -3 0 0 81 -2 -15 26 07020011 -1 -1 -33 97 10 -4 27 07020012 1 -6 -47 91 13 0 28 07030001 -18 5 -154 87 -36 -426 29 07030002 -51 -1 51 100 25 -405 30 07030003 22 -6 -39 29 19 -14 31 07030004 24 -10 38 86 38 22 32 07030005 -20 18 53 92 9 -113 33 07040001 -20 26 4 100 -11 -57 34 07040002 -4 18 30 99 10 -7 35 07040003 -11 7 53 100 -17 -76 36 07040004 -6 41 31 100 12 -27 37 07040005 -6 14 42 100 -11 -76 38 07040006 3 5 57 100 13 -4 39 07040007 3 -1 9 100 44 -24 40 07040008 -4 9 -51 100 14 -9
26 / Chinnisam
y, Gassm
an, Secchi, and Srinivasan
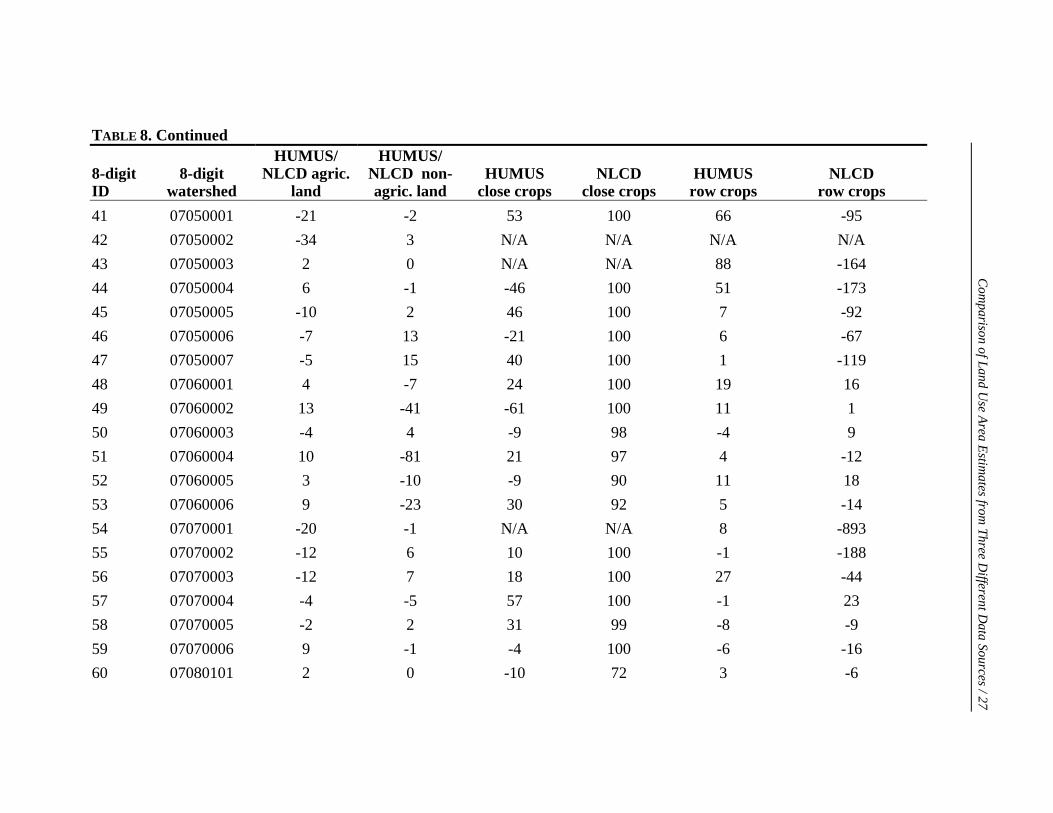
TABLE 8. Continued
8-digit ID
8-digit watershed
HUMUS/ NLCD agric.
land
HUMUS/ NLCD non-agric. land
HUMUS close crops
NLCD close crops
HUMUS row crops
NLCD row crops
41 07050001 -21 -2 53 100 66 -95 42 07050002 -34 3 N/A N/A N/A N/A 43 07050003 2 0 N/A N/A 88 -164 44 07050004 6 -1 -46 100 51 -173 45 07050005 -10 2 46 100 7 -92 46 07050006 -7 13 -21 100 6 -67 47 07050007 -5 15 40 100 1 -119 48 07060001 4 -7 24 100 19 16 49 07060002 13 -41 -61 100 11 1 50 07060003 -4 4 -9 98 -4 9 51 07060004 10 -81 21 97 4 -12 52 07060005 3 -10 -9 90 11 18 53 07060006 9 -23 30 92 5 -14 54 07070001 -20 -1 N/A N/A 8 -893 55 07070002 -12 6 10 100 -1 -188 56 07070003 -12 7 18 100 27 -44 57 07070004 -4 -5 57 100 -1 23 58 07070005 -2 2 31 99 -8 -9 59 07070006 9 -1 -4 100 -6 -16 60 07080101 2 0 -10 72 3 -6
Com
parison of Land Use Area Estim
ates from Three D
ifferent Data Sources / 27
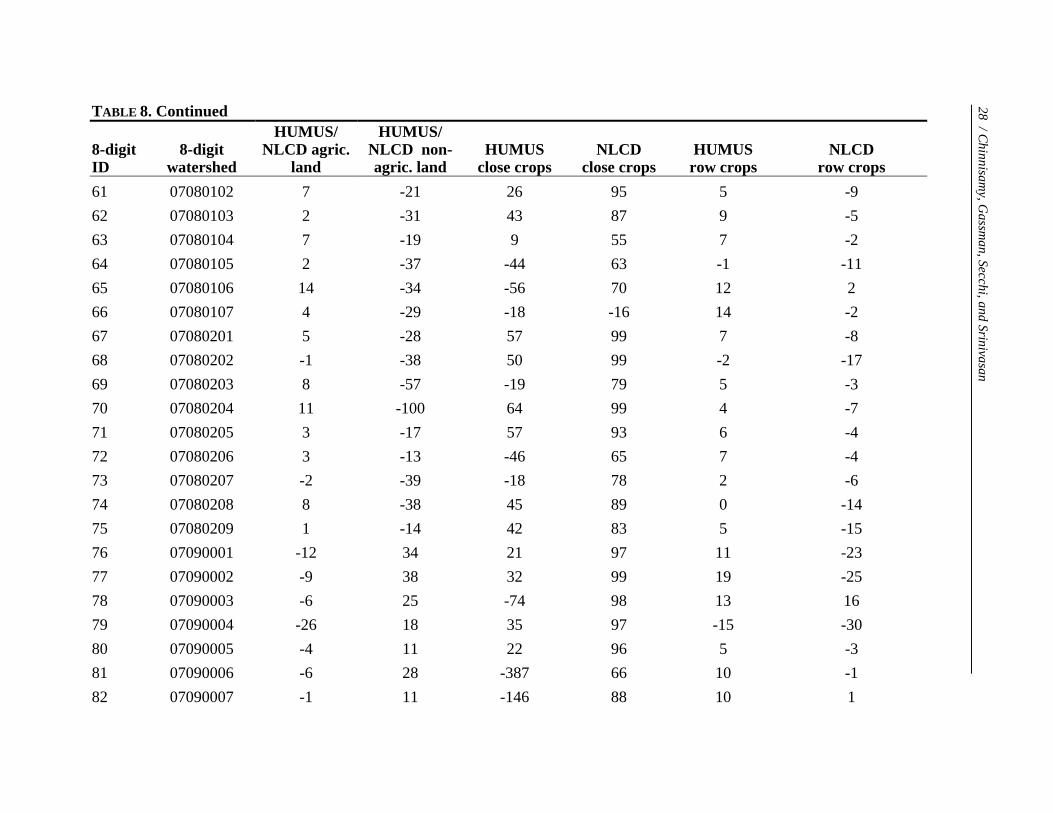
TABLE 8. Continued
8-digit ID
8-digit watershed
HUMUS/ NLCD agric.
land
HUMUS/ NLCD non-agric. land
HUMUS close crops
NLCD close crops
HUMUS row crops
NLCD row crops
61 07080102 7 -21 26 95 5 -9 62 07080103 2 -31 43 87 9 -5 63 07080104 7 -19 9 55 7 -2 64 07080105 2 -37 -44 63 -1 -11 65 07080106 14 -34 -56 70 12 2 66 07080107 4 -29 -18 -16 14 -2 67 07080201 5 -28 57 99 7 -8 68 07080202 -1 -38 50 99 -2 -17 69 07080203 8 -57 -19 79 5 -3 70 07080204 11 -100 64 99 4 -7 71 07080205 3 -17 57 93 6 -4 72 07080206 3 -13 -46 65 7 -4 73 07080207 -2 -39 -18 78 2 -6 74 07080208 8 -38 45 89 0 -14 75 07080209 1 -14 42 83 5 -15 76 07090001 -12 34 21 97 11 -23 77 07090002 -9 38 32 99 19 -25 78 07090003 -6 25 -74 98 13 16 79 07090004 -26 18 35 97 -15 -30 80 07090005 -4 11 22 96 5 -3 81 07090006 -6 28 -387 66 10 -1 82 07090007 -1 11 -146 88 10 1
28 / Chinnisam
y, Gassm
an, Secchi, and Srinivasan
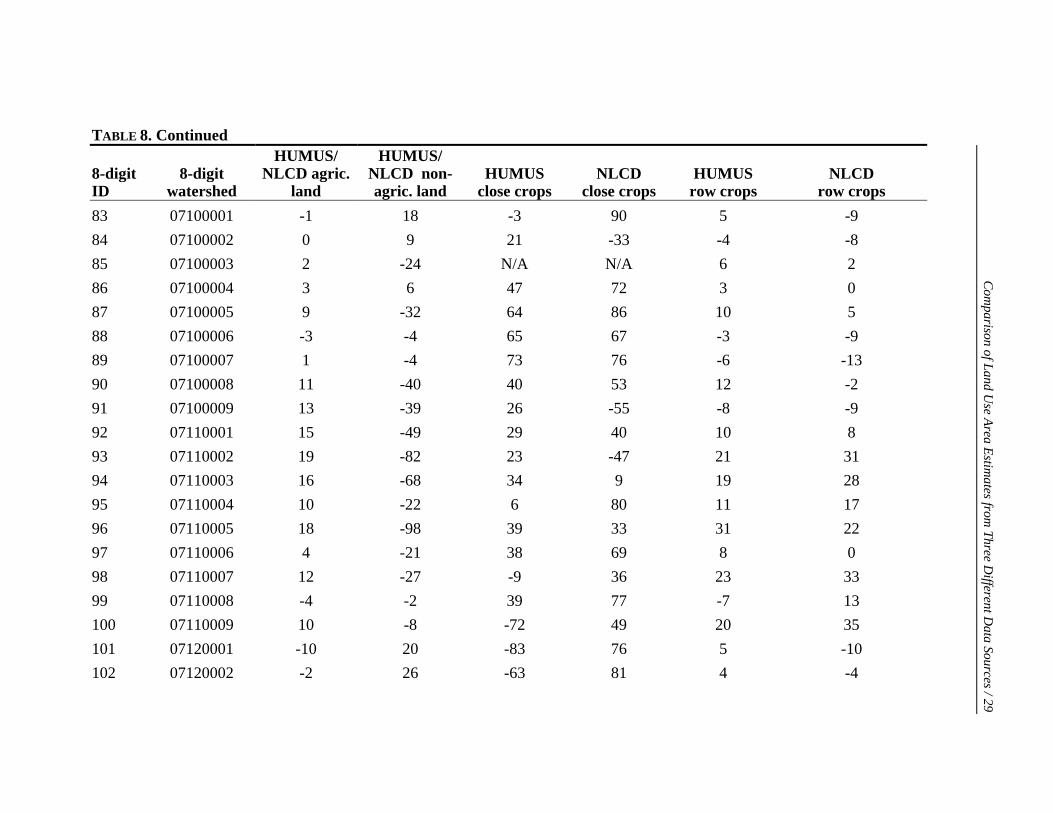
TABLE 8. Continued
8-digit ID
8-digit watershed
HUMUS/ NLCD agric.
land
HUMUS/ NLCD non-agric. land
HUMUS close crops
NLCD close crops
HUMUS row crops
NLCD row crops
83 07100001 -1 18 -3 90 5 -9 84 07100002 0 9 21 -33 -4 -8 85 07100003 2 -24 N/A N/A 6 2 86 07100004 3 6 47 72 3 0 87 07100005 9 -32 64 86 10 5 88 07100006 -3 -4 65 67 -3 -9 89 07100007 1 -4 73 76 -6 -13 90 07100008 11 -40 40 53 12 -2 91 07100009 13 -39 26 -55 -8 -9 92 07110001 15 -49 29 40 10 8 93 07110002 19 -82 23 -47 21 31 94 07110003 16 -68 34 9 19 28 95 07110004 10 -22 6 80 11 17 96 07110005 18 -98 39 33 31 22 97 07110006 4 -21 38 69 8 0 98 07110007 12 -27 -9 36 23 33 99 07110008 -4 -2 39 77 -7 13 100 07110009 10 -8 -72 49 20 35 101 07120001 -10 20 -83 76 5 -10 102 07120002 -2 26 -63 81 4 -4
Com
parison of Land Use Area Estim
ates from Three D
ifferent Data Sources / 29
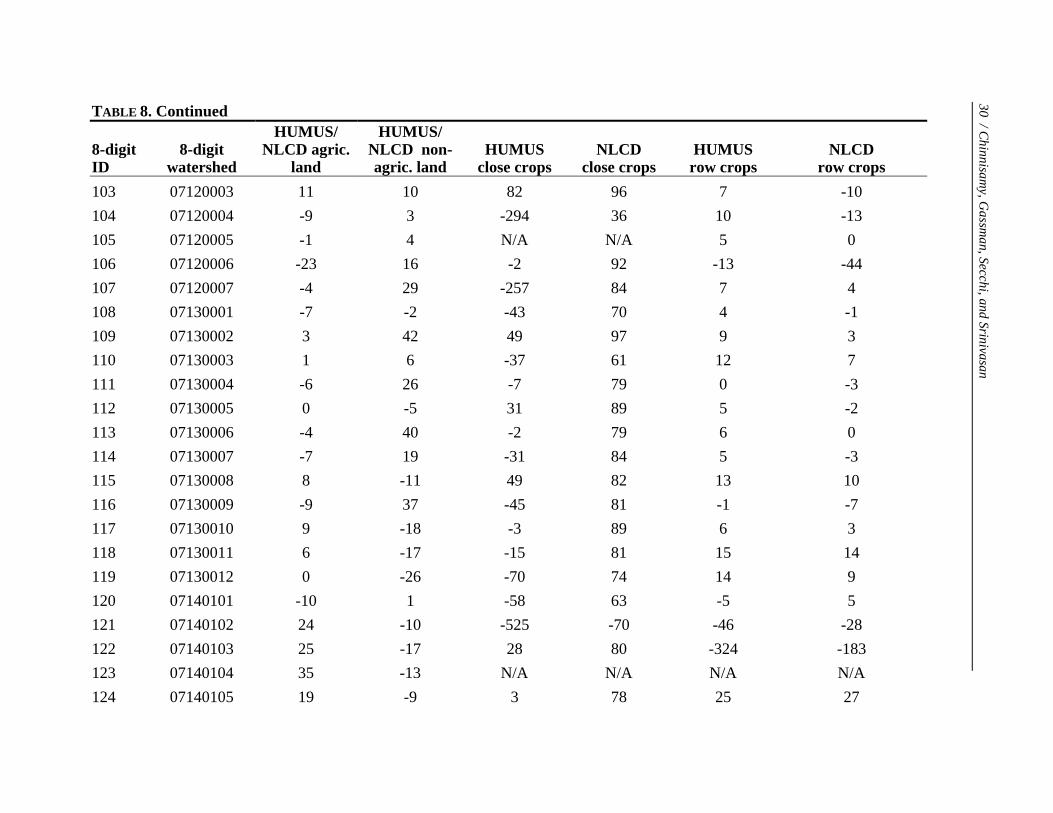
TABLE 8. Continued
8-digit ID
8-digit watershed
HUMUS/ NLCD agric.
land
HUMUS/ NLCD non-agric. land
HUMUS close crops
NLCD close crops
HUMUS row crops
NLCD row crops
103 07120003 11 10 82 96 7 -10 104 07120004 -9 3 -294 36 10 -13 105 07120005 -1 4 N/A N/A 5 0 106 07120006 -23 16 -2 92 -13 -44 107 07120007 -4 29 -257 84 7 4 108 07130001 -7 -2 -43 70 4 -1 109 07130002 3 42 49 97 9 3 110 07130003 1 6 -37 61 12 7 111 07130004 -6 26 -7 79 0 -3 112 07130005 0 -5 31 89 5 -2 113 07130006 -4 40 -2 79 6 0 114 07130007 -7 19 -31 84 5 -3 115 07130008 8 -11 49 82 13 10 116 07130009 -9 37 -45 81 -1 -7 117 07130010 9 -18 -3 89 6 3 118 07130011 6 -17 -15 81 15 14 119 07130012 0 -26 -70 74 14 9 120 07140101 -10 1 -58 63 -5 5 121 07140102 24 -10 -525 -70 -46 -28 122 07140103 25 -17 28 80 -324 -183 123 07140104 35 -13 N/A N/A N/A N/A 124 07140105 19 -9 3 78 25 27
30 / Chinnisam
y, Gassm
an, Secchi, and Srinivasan
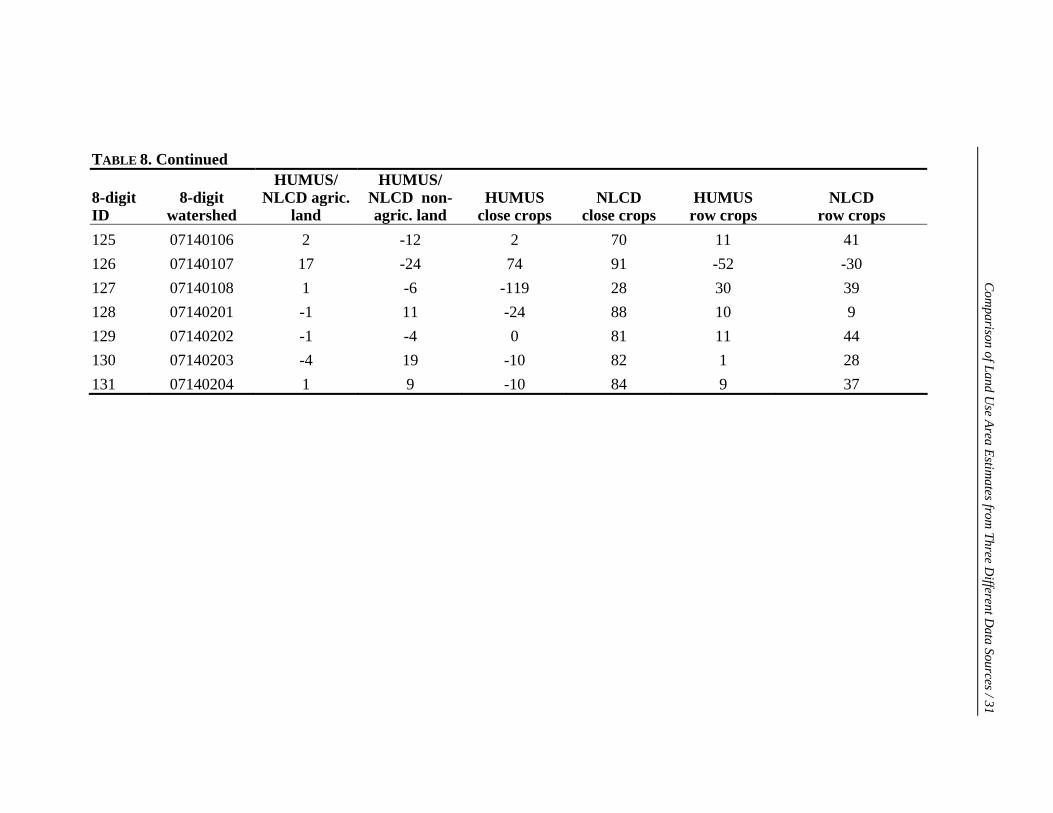
TABLE 8. Continued
8-digit ID
8-digit watershed
HUMUS/ NLCD agric.
land
HUMUS/ NLCD non-agric. land
HUMUS close crops
NLCD close crops
HUMUS row crops
NLCD row crops
125 07140106 2 -12 2 70 11 41 126 07140107 17 -24 74 91 -52 -30 127 07140108 1 -6 -119 28 30 39 128 07140201 -1 11 -24 88 10 9 129 07140202 -1 -4 0 81 11 44 130 07140203 -4 19 -10 82 1 28 131 07140204 1 9 -10 84 9 37
Com
parison of Land Use Area Estim
ates from Three D
ifferent Data Sources / 31
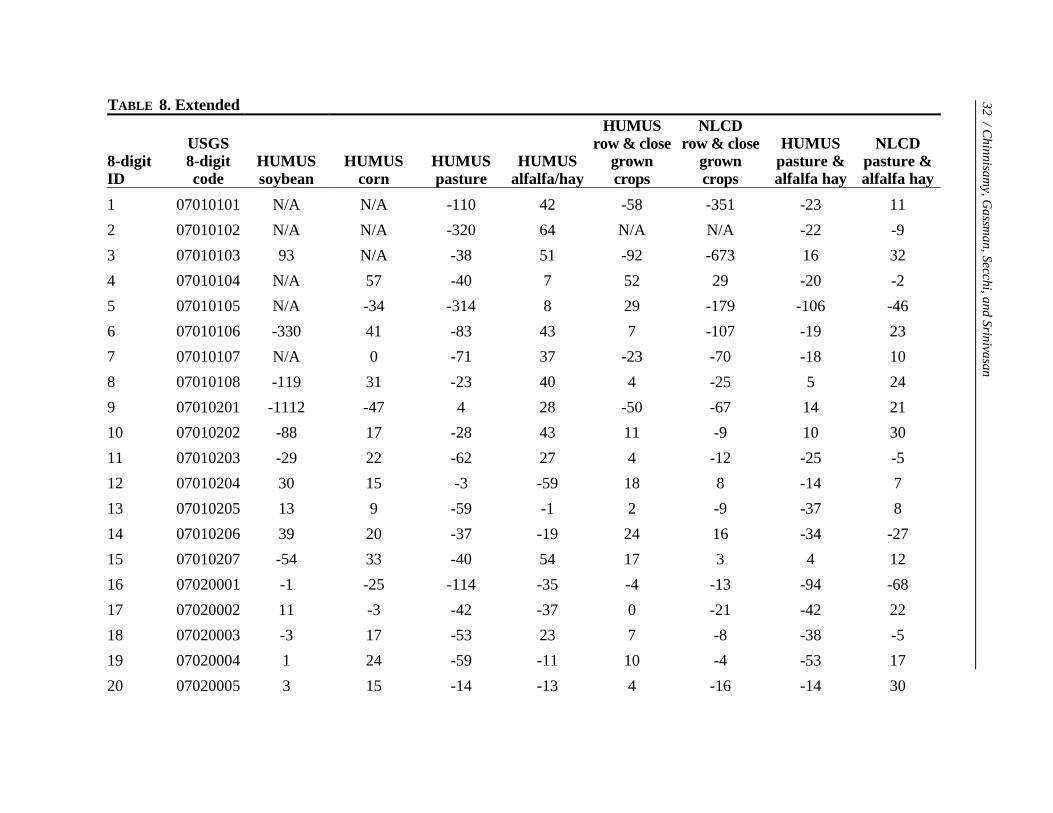
TABLE 8. Extended 8-digit ID
USGS 8-digit code
HUMUS soybean
HUMUS corn
HUMUS pasture
HUMUS alfalfa/hay
HUMUS row & close
grown crops
NLCD row & close
grown crops
HUMUS pasture & alfalfa hay
NLCD pasture & alfalfa hay
1 07010101 N/A N/A -110 42 -58 -351 -23 11 2 07010102 N/A N/A -320 64 N/A N/A -22 -9 3 07010103 93 N/A -38 51 -92 -673 16 32 4 07010104 N/A 57 -40 7 52 29 -20 -2 5 07010105 N/A -34 -314 8 29 -179 -106 -46 6 07010106 -330 41 -83 43 7 -107 -19 23 7 07010107 N/A 0 -71 37 -23 -70 -18 10 8 07010108 -119 31 -23 40 4 -25 5 24 9 07010201 -1112 -47 4 28 -50 -67 14 21 10 07010202 -88 17 -28 43 11 -9 10 30 11 07010203 -29 22 -62 27 4 -12 -25 -5 12 07010204 30 15 -3 -59 18 8 -14 7 13 07010205 13 9 -59 -1 2 -9 -37 8 14 07010206 39 20 -37 -19 24 16 -34 -27 15 07010207 -54 33 -40 54 17 3 4 12 16 07020001 -1 -25 -114 -35 -4 -13 -94 -68 17 07020002 11 -3 -42 -37 0 -21 -42 22 18 07020003 -3 17 -53 23 7 -8 -38 -5 19 07020004 1 24 -59 -11 10 -4 -53 17 20 07020005 3 15 -14 -13 4 -16 -14 30
32 / Chinnisam
y, Gassm
an, Secchi, and Srinivasan
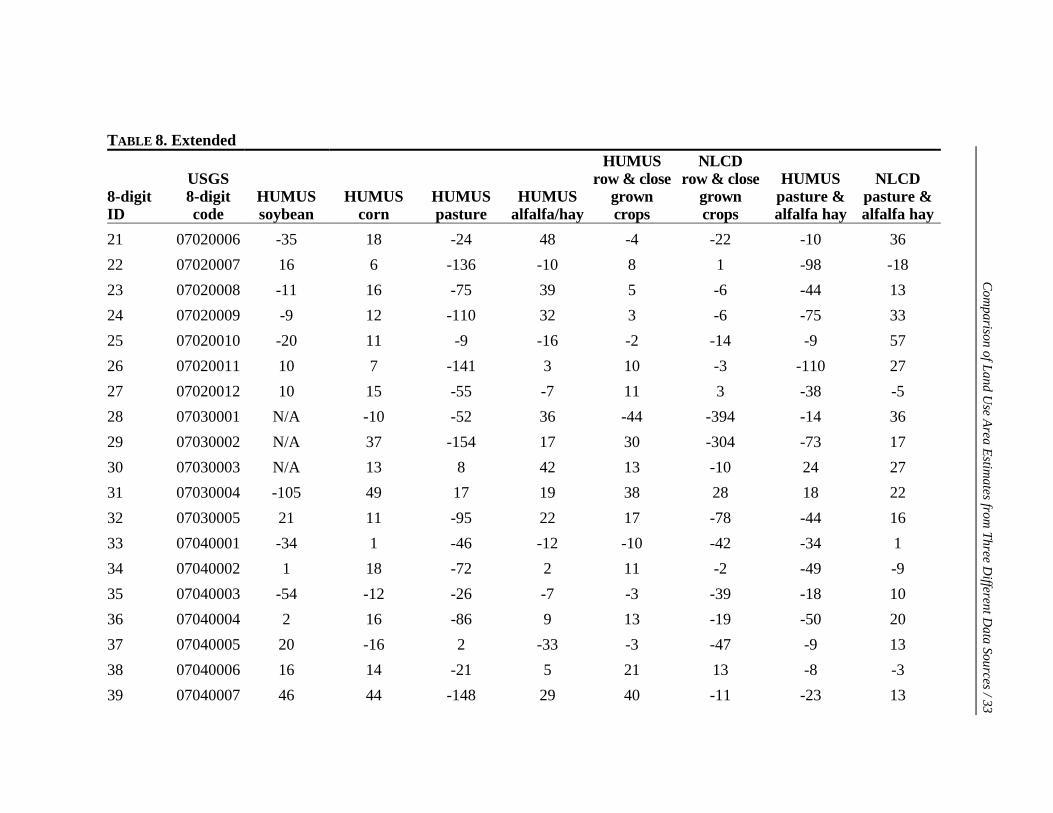
TABLE 8. Extended
8-digit ID
USGS 8-digit code
HUMUS soybean
HUMUS corn
HUMUS pasture
HUMUS alfalfa/hay
HUMUS row & close
grown crops
NLCD row & close
grown crops
HUMUS pasture & alfalfa hay
NLCD pasture & alfalfa hay
21 07020006 -35 18 -24 48 -4 -22 -10 36 22 07020007 16 6 -136 -10 8 1 -98 -18 23 07020008 -11 16 -75 39 5 -6 -44 13 24 07020009 -9 12 -110 32 3 -6 -75 33 25 07020010 -20 11 -9 -16 -2 -14 -9 57 26 07020011 10 7 -141 3 10 -3 -110 27 27 07020012 10 15 -55 -7 11 3 -38 -5 28 07030001 N/A -10 -52 36 -44 -394 -14 36 29 07030002 N/A 37 -154 17 30 -304 -73 17 30 07030003 N/A 13 8 42 13 -10 24 27 31 07030004 -105 49 17 19 38 28 18 22 32 07030005 21 11 -95 22 17 -78 -44 16 33 07040001 -34 1 -46 -12 -10 -42 -34 1 34 07040002 1 18 -72 2 11 -2 -49 -9 35 07040003 -54 -12 -26 -7 -3 -39 -18 10 36 07040004 2 16 -86 9 13 -19 -50 20 37 07040005 20 -16 2 -33 -3 -47 -9 13 38 07040006 16 14 -21 5 21 13 -8 -3 39 07040007 46 44 -148 29 40 -11 -23 13
Com
parison of Land Use Area Estim
ates from Three D
ifferent Data Sources / 33
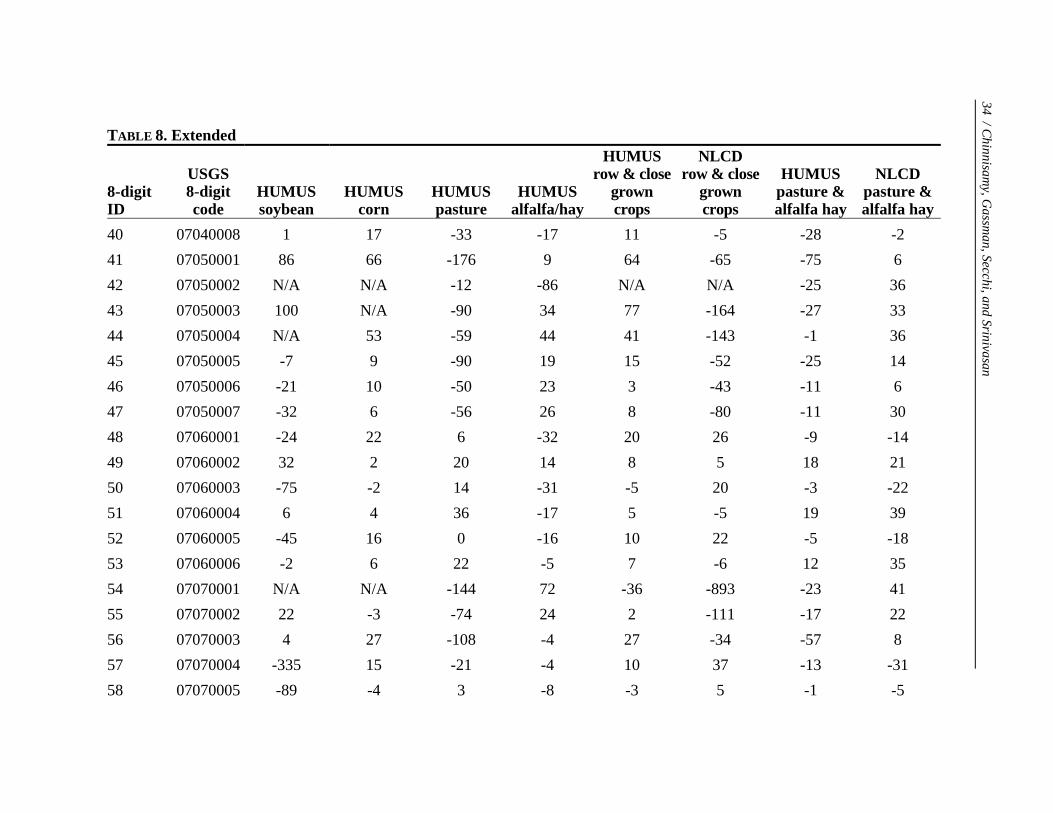
TABLE 8. Extended
8-digit ID
USGS 8-digit code
HUMUS soybean
HUMUS corn
HUMUS pasture
HUMUS alfalfa/hay
HUMUS row & close
grown crops
NLCD row & close
grown crops
HUMUS pasture & alfalfa hay
NLCD pasture & alfalfa hay
40 07040008 1 17 -33 -17 11 -5 -28 -2 41 07050001 86 66 -176 9 64 -65 -75 6 42 07050002 N/A N/A -12 -86 N/A N/A -25 36 43 07050003 100 N/A -90 34 77 -164 -27 33 44 07050004 N/A 53 -59 44 41 -143 -1 36 45 07050005 -7 9 -90 19 15 -52 -25 14 46 07050006 -21 10 -50 23 3 -43 -11 6 47 07050007 -32 6 -56 26 8 -80 -11 30 48 07060001 -24 22 6 -32 20 26 -9 -14 49 07060002 32 2 20 14 8 5 18 21 50 07060003 -75 -2 14 -31 -5 20 -3 -22 51 07060004 6 4 36 -17 5 -5 19 39 52 07060005 -45 16 0 -16 10 22 -5 -18 53 07060006 -2 6 22 -5 7 -6 12 35 54 07070001 N/A N/A -144 72 -36 -893 -23 41 55 07070002 22 -3 -74 24 2 -111 -17 22 56 07070003 4 27 -108 -4 27 -34 -57 8 57 07070004 -335 15 -21 -4 10 37 -13 -31 58 07070005 -89 -4 3 -8 -3 5 -1 -5
34 / Chinnisam
y, Gassm
an, Secchi, and Srinivasan

TABLE 8. Extended
8-digit ID
USGS 8-digit code
HUMUS soybean
HUMUS corn
HUMUS pasture
HUMUS alfalfa/hay
HUMUS row & close
grown crops
NLCD row & close
grown crops
HUMUS pasture & alfalfa hay
NLCD pasture & alfalfa hay
59 07070006 5 -3 25 -7 -5 -2 12 10 60 07080101 -49 16 -7 23 2 -5 1 26 61 07080102 2 7 -6 32 6 -6 10 54 62 07080103 23 1 -74 23 10 -2 -33 22 63 07080104 -19 19 4 20 7 0 7 34 64 07080105 6 -6 10 24 -1 -10 13 47 65 07080106 3 15 20 23 11 3 21 36 66 07080107 16 14 -16 -67 14 -3 -24 23 67 07080201 14 2 -31 13 9 -4 -21 50 68 07080202 -4 0 -6 13 -1 -15 -3 64 69 07080203 0 9 -1 71 5 -3 20 57 70 07080204 2 5 23 58 6 -4 32 71 71 07080205 -1 10 -41 -13 7 -1 -33 31 72 07080206 9 7 -36 26 7 -3 -13 28 73 07080207 -1 4 -55 27 2 -6 -35 41 74 07080208 -8 4 13 39 2 -10 20 43 75 07080209 11 1 -25 18 7 -11 -13 29 76 07090001 4 16 -109 5 12 -16 -50 -6
Com
parison of Land Use Area Estim
ates from Three D
ifferent Data Sources / 35

TABLE 8. Extended
8-digit ID
USGS 8-digit code
HUMUS soybean
HUMUS corn
HUMUS pasture
HUMUS alfalfa/hay
HUMUS row & close
grown crops
NLCD row & close
grown crops
HUMUS pasture & alfalfa hay
NLCD pasture & alfalfa hay
77 07090002 17 28 -109 -14 20 -15 -62 3 78 07090003 -34 19 -30 -24 10 18 -28 -38 79 07090004 -115 -2 -117 2 -11 -18 -44 -36 80 07090005 -41 17 -105 36 5 -1 -49 -17 81 07090006 -25 23 -164 2 8 -1 -107 -44 82 07090007 -31 24 -143 30 9 1 -87 -20 83 07100001 3 7 -46 37 5 -7 -28 26 84 07100002 -10 1 12 48 -4 -8 18 39 85 07100003 8 5 -40 -132 5 2 -48 9 86 07100004 3 4 -6 -18 4 0 -8 24 87 07100005 23 -3 -43 33 11 6 -27 54 88 07100006 -8 2 -10 -27 -1 -7 -12 30 89 07100007 -7 -6 11 -5 -2 -8 9 25 90 07100008 11 13 2 24 13 0 8 24 91 07100009 -22 0 25 30 -7 -11 26 29 92 07110001 -3 20 25 3 12 11 20 21 93 07110002 34 1 24 -12 21 24 17 15 94 07110003 27 10 19 -27 21 25 11 7 95 07110004 7 18 16 -37 10 25 9 -15
36 / Chinnisam
y, Gassm
an, Secchi, and Srinivasan
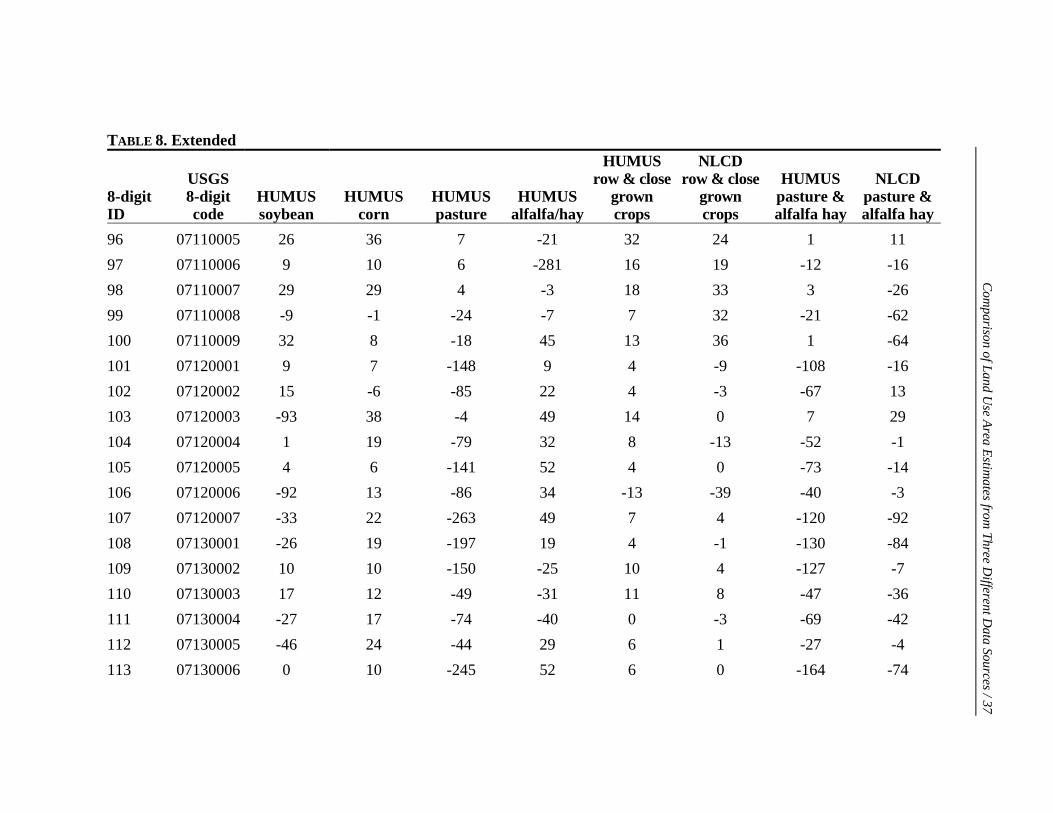
TABLE 8. Extended
8-digit ID
USGS 8-digit code
HUMUS soybean
HUMUS corn
HUMUS pasture
HUMUS alfalfa/hay
HUMUS row & close
grown crops
NLCD row & close
grown crops
HUMUS pasture & alfalfa hay
NLCD pasture & alfalfa hay
96 07110005 26 36 7 -21 32 24 1 11 97 07110006 9 10 6 -281 16 19 -12 -16 98 07110007 29 29 4 -3 18 33 3 -26 99 07110008 -9 -1 -24 -7 7 32 -21 -62 100 07110009 32 8 -18 45 13 36 1 -64 101 07120001 9 7 -148 9 4 -9 -108 -16 102 07120002 15 -6 -85 22 4 -3 -67 13 103 07120003 -93 38 -4 49 14 0 7 29 104 07120004 1 19 -79 32 8 -13 -52 -1 105 07120005 4 6 -141 52 4 0 -73 -14 106 07120006 -92 13 -86 34 -13 -39 -40 -3 107 07120007 -33 22 -263 49 7 4 -120 -92 108 07130001 -26 19 -197 19 4 -1 -130 -84 109 07130002 10 10 -150 -25 10 4 -127 -7 110 07130003 17 12 -49 -31 11 8 -47 -36 111 07130004 -27 17 -74 -40 0 -3 -69 -42 112 07130005 -46 24 -44 29 6 1 -27 -4 113 07130006 0 10 -245 52 6 0 -164 -74
Com
parison of Land Use Area Estim
ates from Three D
ifferent Data Sources / 37

TABLE 8. Extended
8-digit ID
USGS 8-digit code
HUMUS soybean
HUMUS corn
HUMUS pasture
HUMUS alfalfa/hay
HUMUS row & close
grown crops
NLCD row & close
grown crops
HUMUS pasture & alfalfa hay
NLCD pasture & alfalfa hay
114 07130007 -7 15 -184 34 4 -1 -133 -74 115 07130008 8 20 -31 19 14 12 -25 -16 116 07130009 -8 4 -183 58 -1 -6 -101 -41 117 07130010 -18 20 15 28 5 7 17 14 118 07130011 9 19 -28 18 13 17 -20 -37 119 07130012 24 6 -37 -123 10 13 -42 -53 120 07140101 -7 7 9 -94 -13 15 -3 -52 121 07140102 -60 -637 37 -56 -74 -31 28 26 122 07140103 -189 -343 33 32 -123 -33 33 28 123 07140104 N/A N/A 48 4 N/A N/A 40 42 124 07140105 21 36 17 17 21 35 17 1 125 07140106 -4 30 -18 21 10 45 -10 -72 126 07140107 -44 -27 24 10 10 30 20 10 127 07140108 37 26 -46 -264 26 39 -62 -98 128 07140201 3 15 -153 -109 9 11 -148 -178 129 07140202 13 24 -73 -14 9 50 -57 -283 130 07140203 2 4 -39 23 -1 35 -20 -188 131 07140204 12 16 -36 18 5 46 -18 -215
Notes: A positive percentage difference indicates that the NRI estimate was greater than the HUMUS or NLCD value, and a negative percentage difference indicates the opposite relationship. N/A indicates percentage difference calculations where the NRI area estimate equals zero, resulting in a divide by zero error (see equations 1 and 2); a zero value indicates small percentage differences less than an absolute value of 1.
38 / Chinnisam
y, Gassm
an, Secchi, and Srinivasan
Comparison of Land Use Area Estimates from Three Different Data Sources / 39
TABLE 9. Total number of UMRB 8-digit watershed land areas reported in the HUMUS and/or NLCD data sets that are greater or lower than the corresponding NRI 8-digit watershed land areas, by land use category
Land use category Data set
Number of 8-digit land areas greater
than the NRI
Number of 8-digit land areas lower
than the NRI Agricultural land HUMUS/NLCDa 69 62 Non-agricultural land HUMUS/NLCDa 71 60 Row crop HUMUS 35 96 Row crop NLCD 92 39 Close grown crop HUMUS 64 67 Close grown crop NLCD 20 111 Soybean HUMUS 69 62 Corn HUMUS 29 102 Alfalfa hay HUMUS 48 83 Pasture HUMUS 97 34 aThe HUMUS and NLCD agricultural and non-agricultural land area estimates are identical.
40 / Chinnisamy, Gassman, Secchi, and Srinivasan
FIGURE 1. The location of the Upper Mississippi River Basin (UMRB) within the Missis-sippi River Basin, and the delineations of the UMRB 14 major 4-digit subwatersheds and the 131 8-digit subwatersheds (Grafton, Illinois is the assumed outlet for the UMRB SWAT simulations)
Comparison of Land Use Area Estimates from Three Different Data Sources / 41
FIGURE 2. NRI versus HUMUS/NLCD agricultural and non-agricultural land area esti-mates for the Upper Mississippi River Basin (HUMUS and NLCD areas are identical)
FIGURE 3. NRI versus HUMUS and NLCD close-grown and row crop area estimates for the Upper Mississippi River Basin
42 / Chinnisamy, Gassman, Secchi, and Srinivasan
FIGURE 4. NRI versus HUMUS agricultural crop and pasture area estimates for the Upper Mississippi River Basin
FIGURE 5. NRI versus HUMUS non-agricultural area estimates for the Upper Mississippi River Basin
Comparison of Land Use Area Estimates from Three Different Data Sources / 43
FIGURE 6. NRI versus HUMUS/NLCD agricultural land area estimates at the 4-digit subwatershed level within the Upper Mississippi River Basin (HUMUS and NLCD areas are identical)
FIGURE 7. NRI versus HUMUS/NLCD non-agricultural land area estimates at the 4-digit subwatershed level within the Upper Mississippi River Basin (HUMUS and NLCD areas are identical)
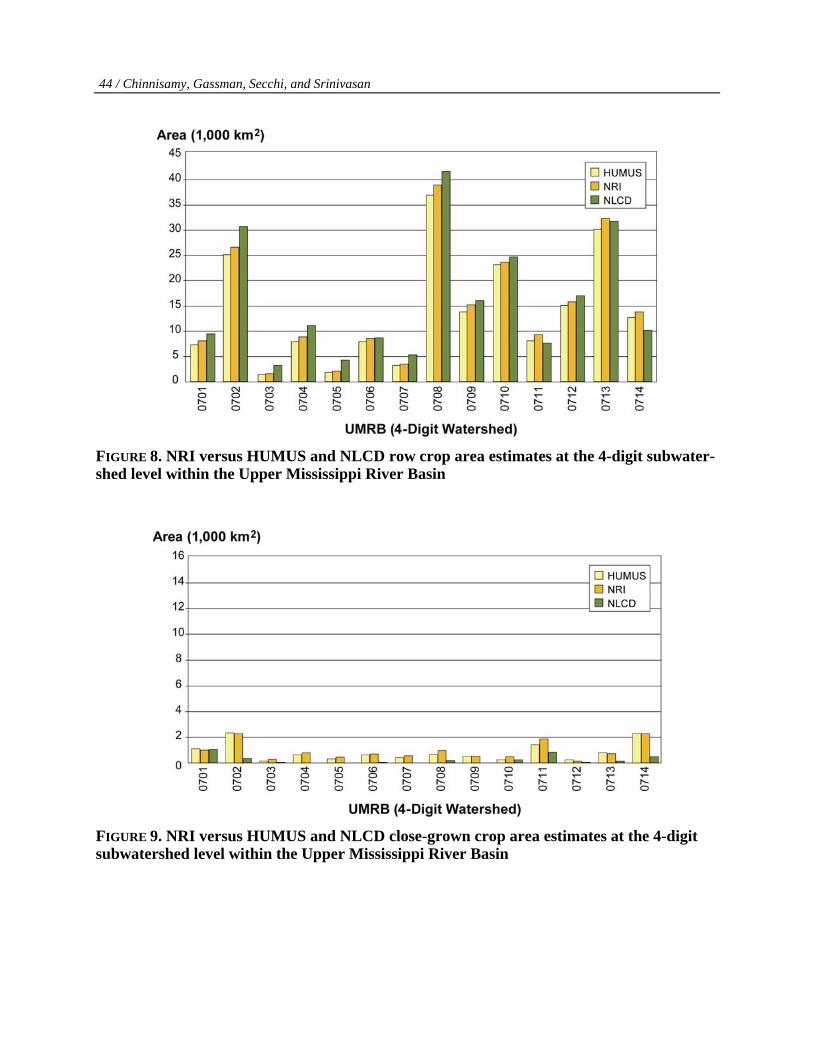
44 / Chinnisamy, Gassman, Secchi, and Srinivasan
FIGURE 8. NRI versus HUMUS and NLCD row crop area estimates at the 4-digit subwater-shed level within the Upper Mississippi River Basin
FIGURE 9. NRI versus HUMUS and NLCD close-grown crop area estimates at the 4-digit subwatershed level within the Upper Mississippi River Basin
Comparison of Land Use Area Estimates from Three Different Data Sources / 45
FIGURE 10. NRI versus HUMUS soybean and corn area estimates at the 4-digit watershed level within the Upper Mississippi River Basin
FIGURE 11. NRI versus HUMUS hay and pasture area estimates at the 4-digit watershed level within the Upper Mississippi River Basin
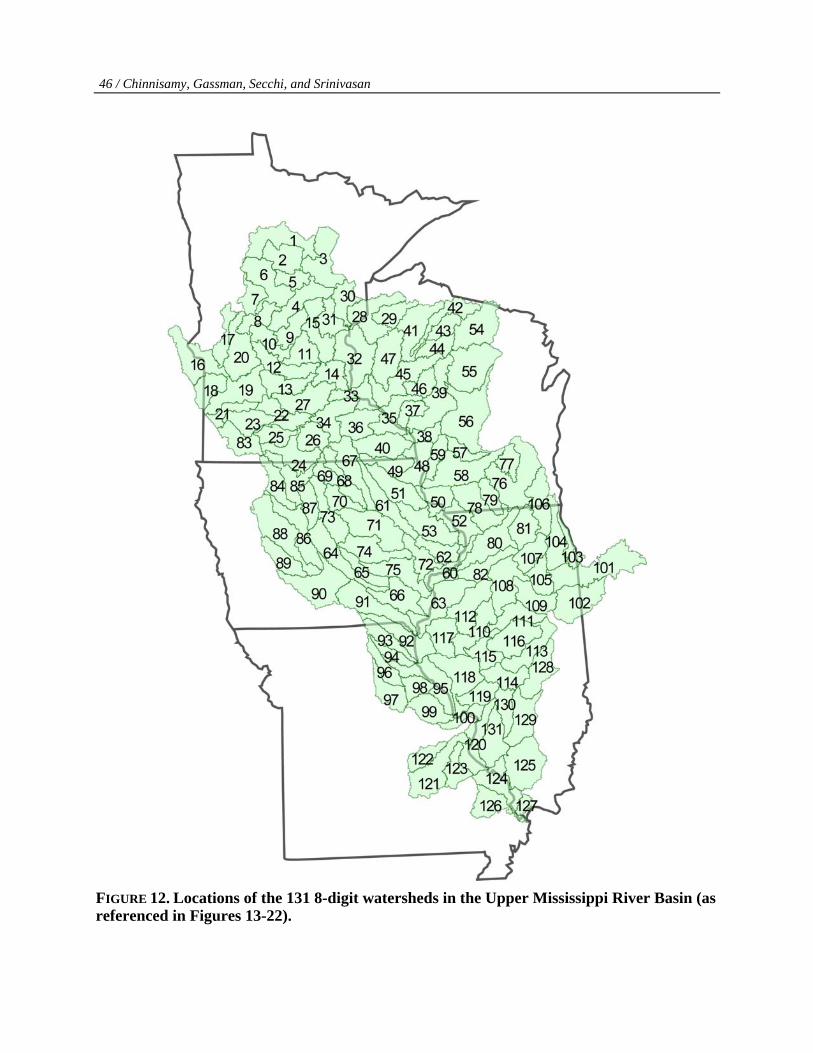
46 / Chinnisamy, Gassman, Secchi, and Srinivasan
FIGURE 12. Locations of the 131 8-digit watersheds in the Upper Mississippi River Basin (as referenced in Figures 13-22).
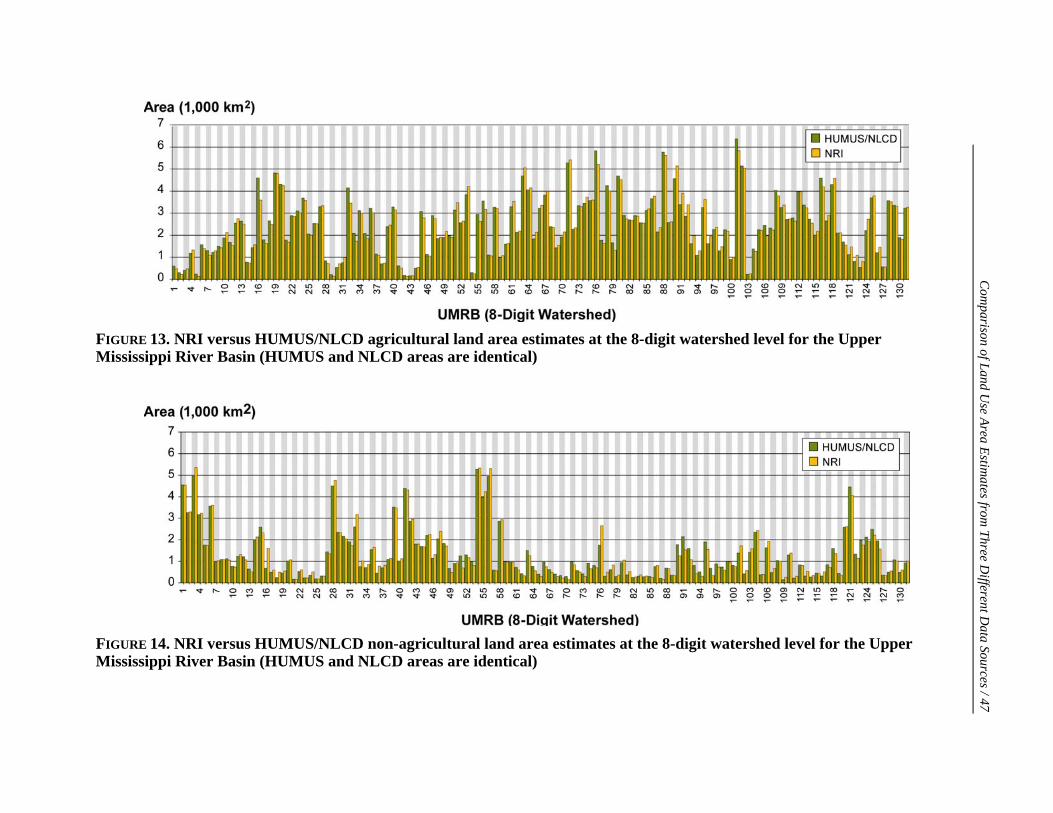
FIGURE 13. NRI versus HUMUS/NLCD agricultural land area estimates at the 8-digit watershed level for the Upper Mississippi River Basin (HUMUS and NLCD areas are identical)
FIGURE 14. NRI versus HUMUS/NLCD non-agricultural land area estimates at the 8-digit watershed level for the Upper Mississippi River Basin (HUMUS and NLCD areas are identical)
Com
parison of Land Use Area Estim
ates from Three D
ifferent Data Sources / 47
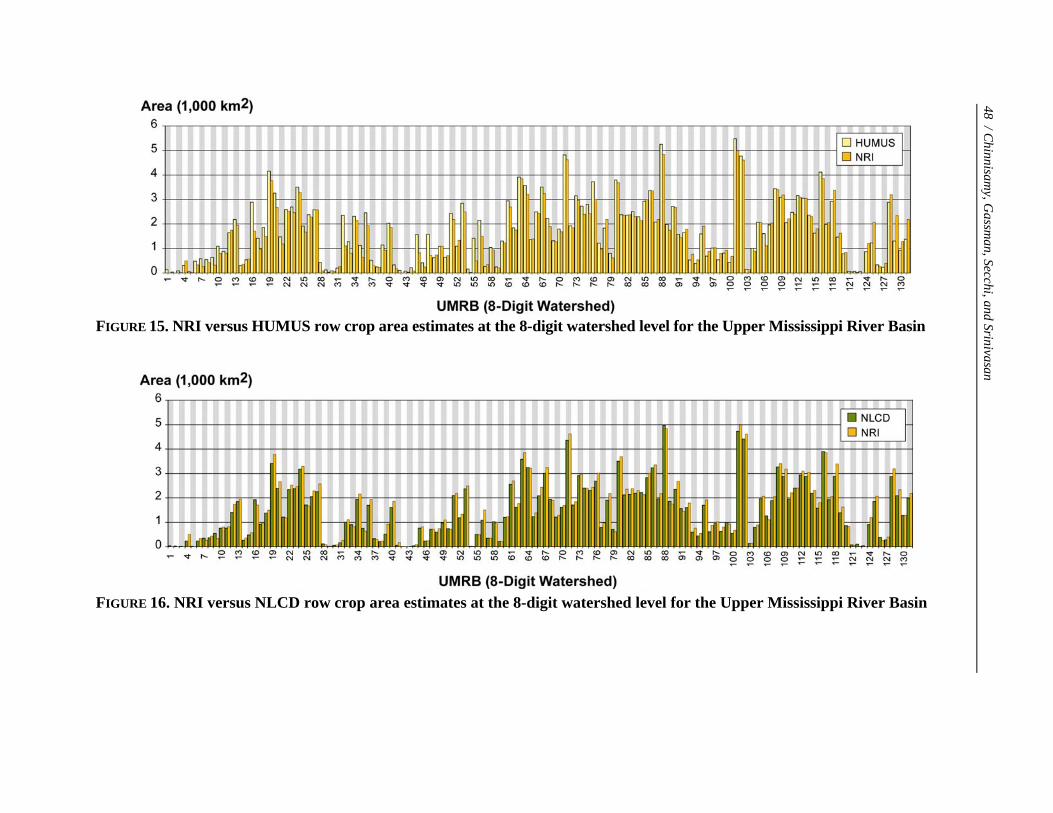
FIGURE 15. NRI versus HUMUS row crop area estimates at the 8-digit watershed level for the Upper Mississippi River Basin
FIGURE 16. NRI versus NLCD row crop area estimates at the 8-digit watershed level for the Upper Mississippi River Basin
48 / Chinnisam
y, Gassm
an, Secchi, and Srinivasan

FIGURE 17. NRI versus HUMUS close-grown crop area estimates at the 8-digit watershed level for the Upper Mississippi River Basin
FIGURE 18. NRI versus NLCD close-grown crop area estimates at the 8-digit watershed level for the Upper Mississippi River Basin
Com
parison of Land Use Area Estim
ates from Three D
ifferent Data Sources / 49
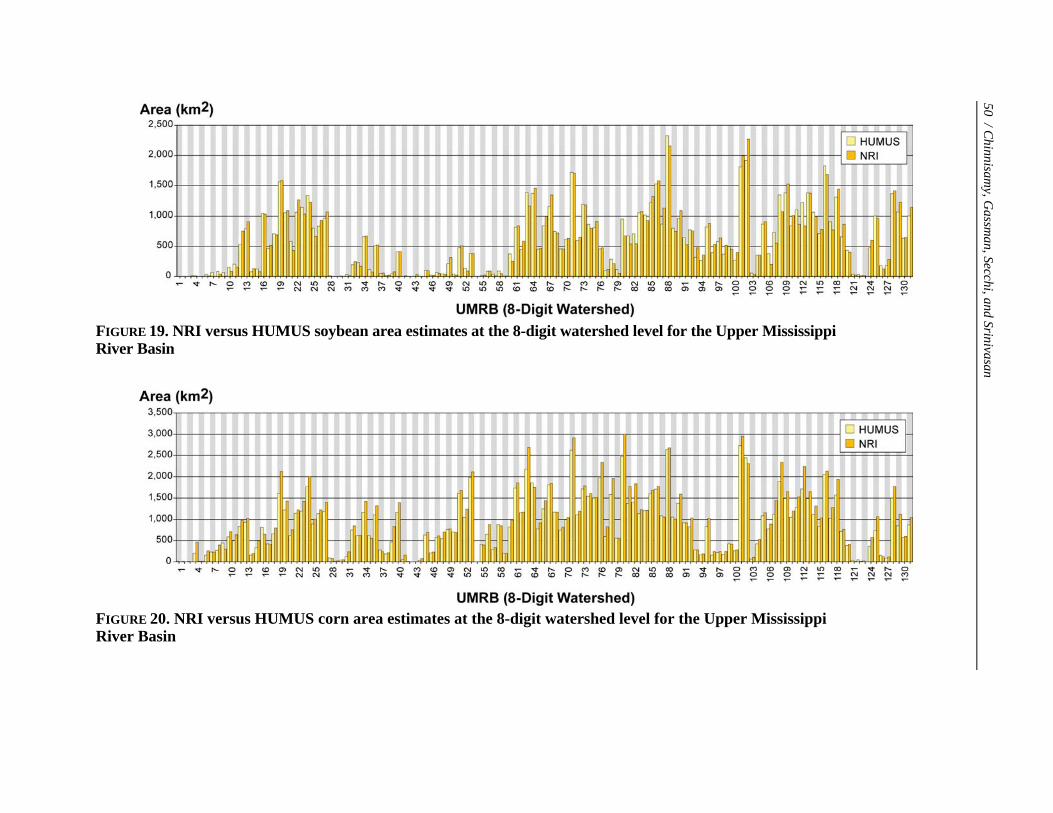
FIGURE 19. NRI versus HUMUS soybean area estimates at the 8-digit watershed level for the Upper Mississippi River Basin
FIGURE 20. NRI versus HUMUS corn area estimates at the 8-digit watershed level for the Upper Mississippi River Basin
50 / Chinnisam
y, Gassm
an, Secchi, and Srinivasan
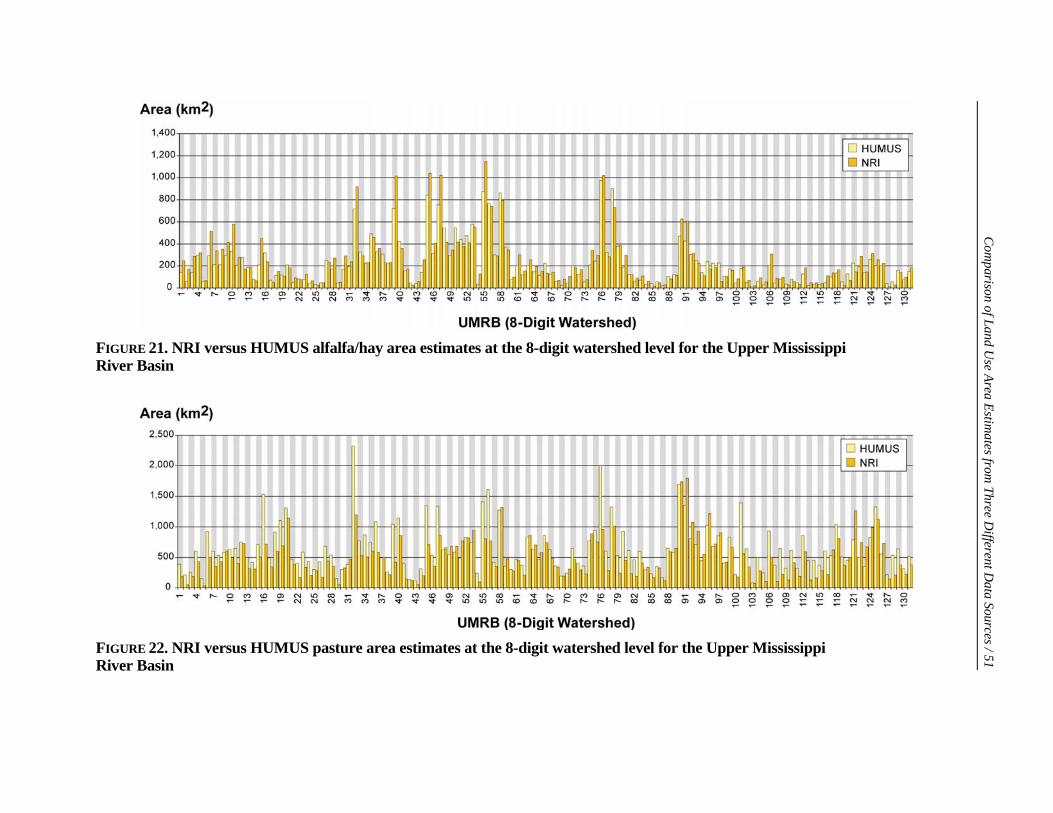
FIGURE 21. NRI versus HUMUS alfalfa/hay area estimates at the 8-digit watershed level for the Upper Mississippi River Basin
FIGURE 22. NRI versus HUMUS pasture area estimates at the 8-digit watershed level for the Upper Mississippi River Basin
Com
parison of Land Use Area Estim
ates from Three D
ifferent Data Sources / 51
52 / Chinnisamy, Gassman, Secchi, and Srinivasan
FIGURE 23. Current years of NASS remote sensing data available for the seven primary UMRB states (a very small piece of the UMRB extends into Michigan; collection of NASS data for Michigan will start in 2007).
References
Anderson, J.F., E.E. Hardy, J.T. Roach, and R.E. Witmer. 1976. “A Land Use and Land Cover Classifica-tion System for Use with Remote Sensor Data.” Professional Paper 964, U.S. Geological Survey, Reston, VA.
Arnold, J.G., and N. Fohrer. 2005. “SWAT2000: Current Capabilities and Research Opportunities in Applied Watershed Modeling.” Hydrol. Process. 19(3): 563-572.
Arnold, J.G., R. Srinivasan, R.S. Muttiah, P.M. Allen and C. Walker. 1999. “Continental Scale Simulation of the Hydrologic Balance.” J. Amer. Water Resour. Assoc. 35(5): 1037-1052.
Brown, J.F., T.R. Loveland, J.W. Merchant, B.C. Reed and D.O. Ohlen. 1993. “Using Multisource Data in Global Land Cover Characteristics: Concepts, Requirements, and Methods.” Photogram. Engin. Rem. Sens. 59: 977-987.
Chen, P.Y., M. Di Luzio, and J.G. Arnold. 2005. “Spatial Assessment of Two Widely Used Land-Cover Datasets Over the Continental U.S.” IEEE Trans. Geosci. Rem. Sens. 43(10): 2396-2404.
Chen, P.Y., M. Di Luzio, and J.G. Arnold. 2006. “Spatial Agreement between Two Land-Cover Data Sets Stratified by Agricultural Eco-Regions.” Intern. J. Rem. Sens. 27(15): 3223-3238.
Gassman, P.W., M. R. Reyes, C.H. Green, and J.G. Arnold. 2007. “The Soil and Water Assessment Tool: Historical Development, Applications, and Future Directions.” Trans. ASABE 50(4): 1211-1250.
Gassman, P.W., S. Secchi, M. Jha, and L. Kurkalova. 2006. “Upper Mississippi River Basin Modeling System Part 1: SWAT Input Data Requirements and Issues.” In Coastal Hydrology and Processes, V.P. Singh and Y.J. Xu, eds., pp. 103-115. Highland Ranch, CO: Water Resources Publications.
Gassman, P.W., J. Wu, P.D. Mitchell, B.A. Babcock, T.M. Hurley, and S.W. Chung. 1998. “Impact of U.S. Agricultural Policy on Regional Nitrogen Losses.” In Proceedings of the 3rd International Conference on Diffuse Pollution, Edinburgh, Scotland, 31 Aug. – 4 Sept. London: International Association of Wa-ter Quality.
Goolsby, D.A., W.A. Battaglin, B.T. Aulenbach, and R.P. Hooper. 2001. “Nitrogen Input to the Gulf of Mexico.” J. Environ. Qual. 30: 329-336.
Goolsby, D.A., W.A. Battaglin, G.B. Lawrence, R.S. Artz, B.T. Aulenbach, R.P. Hooper, D.R. Keeney, and G.J. Stensland. 1999. “Flux and Sources of Nutrients in the Mississippi-Atchafalaya River Basin: Topic 3 Report for the Integrated Assessment on Hypoxia in the Gulf of Mexico.” NOAA Coastal Ocean Program Decision Analysis Series No. 17. U.S. Department of Commerce, National Oceanic and Atmospheric Administration, National Centers for Coastal Ocean Science, Silver Spring, Maryland. Available at: http://www.nos.noaa.gov/products/pubs_hypox.html.
Homer, C., C. Huang, L. Yang, B. Wylie, and M. Coan. 2004. “Development of a 2001 National Land-Cover Database for the United States.” Photogram. Engin. Rem. Sens. 70(7): 829-840.
54 / Chinnisamy, Gassman, Secchi, and Srinivasan
Khorram, S., G. Biging, D. Colby, R. Congalton, J. Dobson, R. Ferguson, M. Goodchild, J. Jensen, and T. Mace. 1999. Accuracy Assessment of Remote Sensing Derived Change Detection. Monograph. Be-thesda, MD: American Society of Photogrammetry and Remote Sensing.
Neitsch, S.L., J.G. Arnold, J.R. Kiniry, and J.R. Williams. 2005. Soil and Water Assessment Tool Theoreti-cal Documentation, version 2005. Temple, TX: Grassland, Soil and Water Research Laboratory, Agricultural Research Service. Available at: www.brc.tamus.edu/swat/doc.html.
Nusser, S.M., and J.J. Goebel. 1997. The National Resources Inventory: A long-Term Multi-Resource Monitoring Program.” Environ. Ecol. Stat. 4: 181-204.
Rabalais, N.N., R.E. Turner, and D. Scavia. 2002. “Beyond Science into Policy: Gulf of Mexico Hypoxia and the Mississippi River.” BioScience 52(2): 129-141.
Seaber, P.R., F.P. Kapinos, and G.L. Knapp. 1987. “Hydrologic Units Maps.” USGS Water Supply Paper No. 2294, U.S. Geological Survey, Reston, VA.
Secchi, S., L. Kurkalova, P.W. Gassman, and C. Hart. 2007. “Land Use Change on the Intensive and Extensive Margin in a Biofuels Hotspot: The Case of Iowa, USA.” Working Paper, Iowa State Univer-sity.
USDA-NASS. 2007a. The Census of Agriculture. United States Department of Agriculture, National Agricultural Statistics Service, Washington, D.C. Available at: http://www.agcensus.usda.gov/.
USDA-NASS. 2007b. Census of Agriculture General Information. United States Department of Agricul-ture, National Agricultural Statistics Service, Washington, D.C. Available at: http://www.nass.usda.gov/census/census92/ag0100.htm.
USDA-NASS. 2007c. The Cropland Data Layer. United States Department of Agriculture, National Agricultural Statistics Service, Washington, D.C. Available at: http://www.nass.usda.gov/research/Cropland/SARS1a.htm.
USDA-NRCS. 2007a. CEAP National Assessment: Cropland. United States Department of Agriculture, Natural Resources Conservation Service, Washington D.C. Available at: http://www.nrcs.usda.gov/Technical/nri/ceap/cropland.html.
USDA-NRCS. 2007b. National Resources Inventory. United States Department of Agriculture, Natural Resources Conservation Service, Washington D.C. Available at: http://www.nrcs.usda.gov/technical/NRI/.
USDA-NRCS. 2007c. Watershed Boundary Dataset (WBD). United States Department of Agriculture, Natural Resources Conservation Service, Washington D.C. Available at: http://www.ncgc.nrcs.usda.gov/products/datasets/watershed/.
USDI. 2007. The Public Land Survey System (PLSS). National Atlas of the United States. United States Department of the Interior, Washington, D.C. Available at: http://nationalatlas.gov/articles/boundaries/a_plss.html.
USGS. 2007. National Land Cover Database 2001 (NLCD 2001). United States Geological Survey, Reston, VA. Available at: http://www.mrlc.gov/mrlc2k_nlcd.asp.
Vogelmann, J. E., S.M. Howard, L. Yang, C.R. Larson, B.K. Bruce, and N. van Driel. 2001. “Completion of the 1990s National Land Cover Data Set for the Conterminous United States from Landsat Thematic Mapper Data and Ancillary Data Sources.” Photogram. Engin. Rem. Sens. 67(6): 650-662.

Yang, L., S.V. Stehman, J.H. Smith, and J.D. Wickham. 2001. “Short Communication: Thematic Accuracy of MRLC Land-Cover for the Eastern United States.” Remote Sens. Environ. 76: 418-422.
Zhu, Z, L. Yang, S.V. Stehman, and R.L. Czaplewski, 2000. “Accuracy Assessment for the U.S. Geologi-cal Survey Regional Land Cover Mapping Program: New York and New Jersey Region.” Photogram. Engin. Rem. Sens. 66: 1425-1435.