comparison of economic effects between china and other
TRANSCRIPT

32
CHAPTER 4
Comparison of Economic Effects between
China and Other Host Countries
With the eye on the opportunity for earning a great deal of profits, raising national
reputation and stimulating social and economic follow-up development, it goes without
saying that the Chinese put all their efforts on preparing for Beijing 2008 Olympic
Games.
Wang (2002) pointed that The Tenth Five-Year Plan suggested the growth rate of
GDP in Beijing city would rise to 11% from 9% due to holding Beijing 2008 Olympic
Games. As far as the economic development of Beijing city was concerned, it still
expected not only the amount of GDP would boost to 600 billion RMB, but also GDP per
capita would increase to 6 thousand US dollars. The plan could be broken into the
following steps in detail. Within 2010, Beijing city would be built as perfect basic
construction. Then, within 2020, it would be one of the modernized metropolises.
What is more, The Eleventh Five-Year Plan, made by the National People’s
Congress, emphasized six points on economic reforms from 2006 to 2010. With the
holding of Beijing 2008 Olympic Games, advancing economic growth and motivating
industrial structure were, especially, the two main points of all. In detail, it suggested the
amount of GDP per capita in 2010 would double those in 2000. Besides, shrinking the
use of resources by 20% would help control ecological damage and keep environmental
protection. Third, percentage of the amount of GDP contributed from service section
would be raised by 3% to 4%. As a result, it is no doubt that holding Beijing 2008
Olympic Games will accelerate to achieve these goals.
4.1 Overall Impacts on China’s Economy
Beijing Olympic Committee (BOC) announced the expected fiscal budget shown in
table 4-1. The expenditure here stands for the direct investment on holding the Olympic
Games. It includes, roughly speaking, gymnasiums, athlete’s villages, journalist’s villages

33
and communicational facilities, and so on. The amount of total expected expenditure is as
many as 1,625 million US dollars. On the other hand, revenue here stands for the
earnings due to holding the Olympic Games. It includes sales of TV rights, business
sponsors, tickets, and so on. The amount of total expected revenues is as many as 1,609
million US dollars. Still, the amount of profits is estimated to be 16 million US dollars.
Table 4-1: Fiscal Budget of BOC
Unit: million US dollars
Items Amount Percentage
(%)
Expenditure Amount Percentage
(%)
Sales of TV rights 709.00 43.63
Business sponsors
-Plan of TOP
-Sponsor of committees
-Certificated revenues
-Certificated suppliers
330.00
130.00
130.00
50.00
20.00
20.31
8.00
8.00
3.08
1.23
Basic facility
-Physical facility
-Olympic Games
-News center
-Center of
international media
- Journalist’s village
190.00
102.00
40.00
45.00
—
3.00
11.69
6.28
2.46
2.77
—
0.18
Souvenir coins
Stamps
Lotteries
Tickets
8.00
12.00
180.00
140.00
0.49
0.74
11.08
8.62
Donation
Sale of property
Subsidy from central
government
Subsidy from city
government
20.00
80.00
50.00
50.00
1.23
4.92
3.08
3.08
Others 46.00 2.83
Operational cost
-Games
-Olympic village
-News center
- Journalist’s village
-Ceremony
-Medical service
-Catering and reception
-Transportation
-Security
-Fee for injure
-Promotion
-Administration
-Coordination
-Others
1419.00
275.00
65.00
360.00
10.00
100.00
30.00
51.00
70.00
50.00
82.00
60.00
125.00
40.00
101.00
88.31
16.92
4.00
22.15
0.62
6.15
1.85
3.14
4.31
3.08
5.05
3.69
7.69
2.46
6.22
Total 1,625.00 100.00 Total 1,609.00 100.00
Source: Wang (2002).
Table 4-2 indicates comparison of Olympic host committees’ revenues from 1984 to
2008. It can be observed that Beijing 2008 Olympic Games are not supposed to bring as

34
many profits as Seoul 1988 and Sydney 2000 Olympic Games do. Nevertheless, it is still
a considerable sum of profits to be earned by holding the Olympic Games.
Table 4-2: Comparison of Olympic Host Committees’ Revenues —
1984~2008 Unit: million US dollars
Items
Los Angeles1984
Seoul1988
Barcelona1992
Atlanta 1996
Sydney 2000
Beijing 2008
Direct revenue 746 1,324 1,699 1,705 2,605 1,625 - TV rights - Ticket - Sponsora - Others
286 140 123 197
327 40 493 464
471 82 505 641
560 422 540 183
1,318 356 550 38
709 140 530 24
Expenditure 531 827 1,696 1,705 1,740 1,609 Profits 215 497 3 0 865 16 Note: The figures of Beijing 2008 Olympic Games are estimated.
Source: Shih and Chen (2005), Wang (2002).
Even if the profits of holding Beijing 2008 Olympic Games is not as alluring as
those of previous Olympic Games, the impacts on China’s economy, however, are worthy
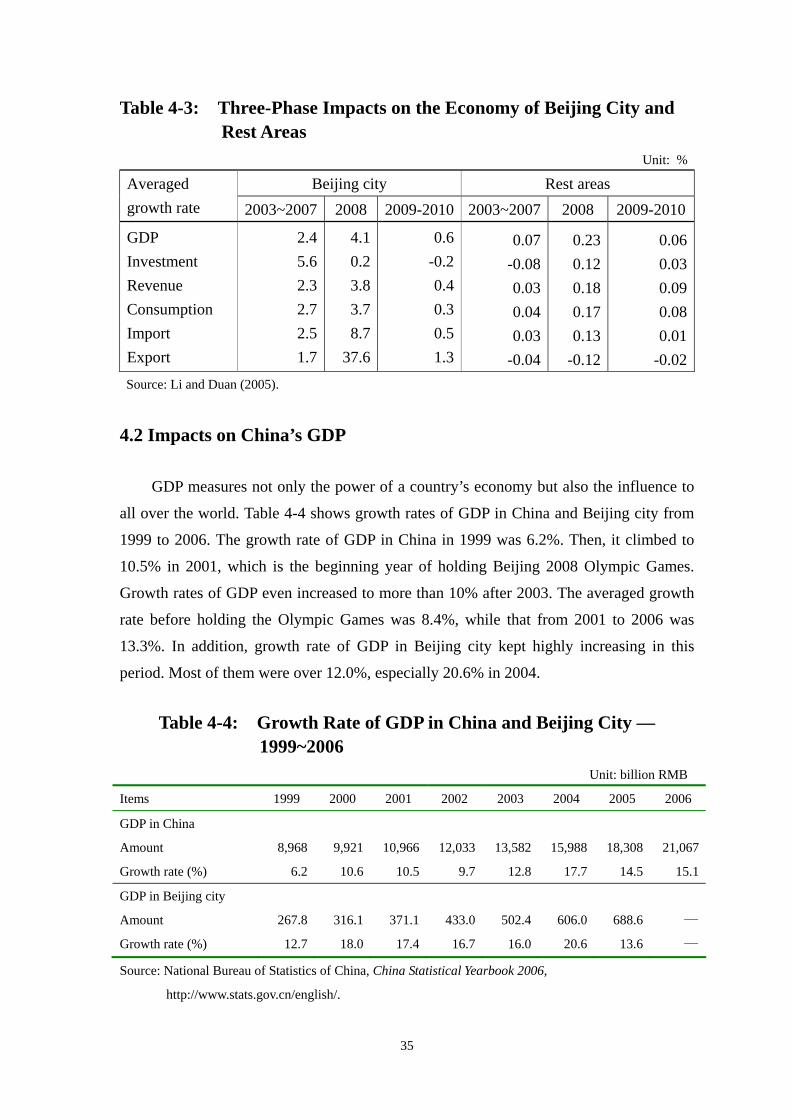
of being put much value on. Table 4-3 briefly explains the trend of economic indicators.
Li and Duan (2005) pointed that, as for as Beijing city is concerned, the averaged growth
rates of GDP, revenue, consumption, import and export are supposed to be the most in
2008. From 2003 to 2007, the averaged growth rate of GDP in Beijing city increases by
2.3%, which is about 4,026 million US dollars.15 In 2008, the growth rate of GDP is
supposed to increase by 4.1%, which is about 6,571 million US dollars.16 Instead, the
growth rate of investment will be the most from 2003 to 2007 and will decrease from
2009 to 2010.
On the other hand, when it comes to the impacts on rest areas, all the economic
indicators slightly vary within 0.15%. Specifically, the averaged growth rates of GDP,
revenue, consumption, import are supposed to be the most in 2008 as well. To sum up,
Games-Year will be considered as the most critical phase of the three. They will be
discussed in the following sessions in detail. 15 The amount of money the author estimated was 31 billion RMB. 16 The amount of money the author estimated was 50.6 billion RMB.
35
Table 4-3: Three-Phase Impacts on the Economy of Beijing City and Rest Areas
Unit: %
Beijing city Rest areas Averaged growth rate 2003~2007 2008 2009-2010 2003~2007 2008 2009-2010
GDP Investment Revenue Consumption Import Export
2.4 5.6 2.3 2.7 2.5 1.7
4.1 0.2 3.8 3.7 8.737.6
0.6-0.2 0.4 0.3 0.5 1.3
0.07 -0.08 0.03 0.04 0.03-0.04
0.23 0.12 0.18 0.17 0.13 -0.12
0.06 0.03 0.09 0.08 0.01-0.02
Source: Li and Duan (2005).
4.2 Impacts on China’s GDP
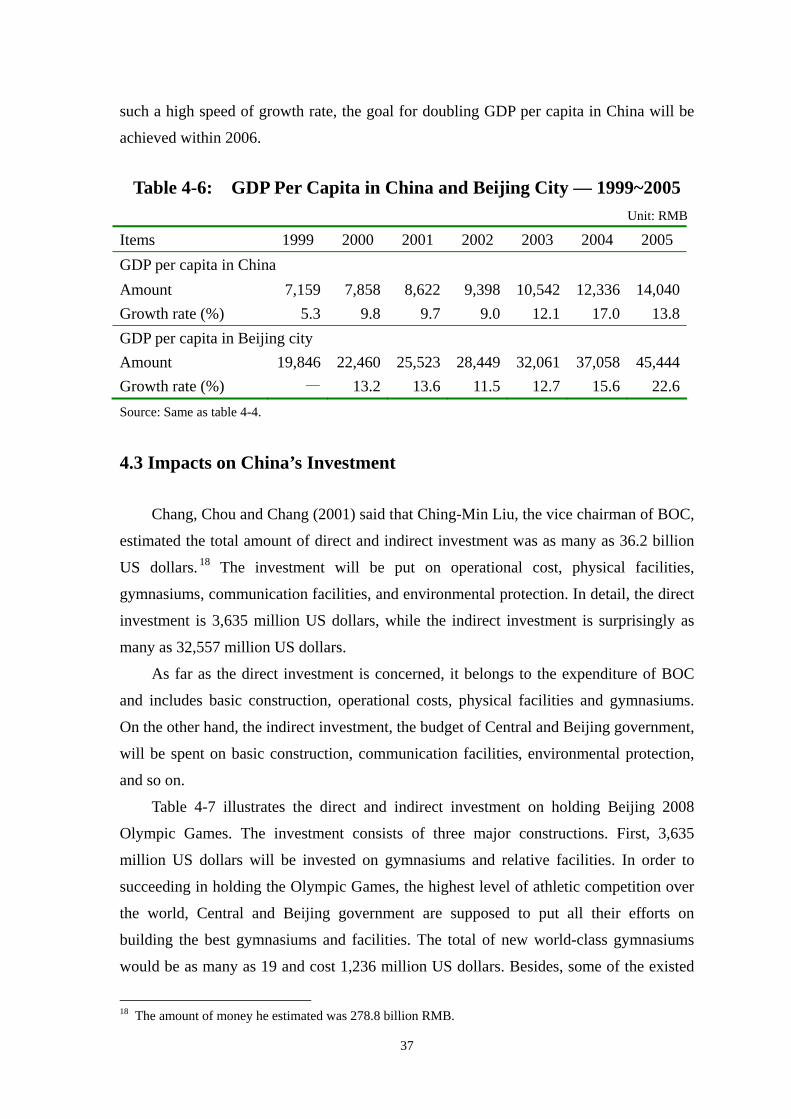
GDP measures not only the power of a country’s economy but also the influence to
all over the world. Table 4-4 shows growth rates of GDP in China and Beijing city from
1999 to 2006. The growth rate of GDP in China in 1999 was 6.2%. Then, it climbed to
10.5% in 2001, which is the beginning year of holding Beijing 2008 Olympic Games.
Growth rates of GDP even increased to more than 10% after 2003. The averaged growth
rate before holding the Olympic Games was 8.4%, while that from 2001 to 2006 was
13.3%. In addition, growth rate of GDP in Beijing city kept highly increasing in this
period. Most of them were over 12.0%, especially 20.6% in 2004.
Table 4-4: Growth Rate of GDP in China and Beijing City —
1999~2006 Unit: billion RMB
Items 1999 2000 2001 2002 2003 2004 2005 2006
GDP in China
Amount 8,968 9,921 10,966 12,033 13,582 15,988 18,308 21,067
Growth rate (%) 6.2 10.6 10.5 9.7 12.8 17.7 14.5 15.1
GDP in Beijing city
Amount
Growth rate (%)
267.8
12.7
316.1
18.0
371.1
17.4
433.0
16.7
502.4
16.0
606.0
20.6
688.6
13.6
—
—
Source: National Bureau of Statistics of China, China Statistical Yearbook 2006, http://www.stats.gov.cn/english/.

36
In addition, in 2005, the percentage of GDP contributed from Beijing was almost
3.8%.17 Therefore, the increased averaged growth rates of GDP in the three phases,
contributed from Beijing 2008 Olympic Games, can be estimated to be 0.2% in
Pre-Games, 0.4% in Games-Year and 0.1% in Post-Games.
Table 4-5 illustrates the comparison of three-phase growth rate of GDP between the
Olympic host countries. Growth rates of GDP in Beijing 2008 Olympic Games are as
much as those of Tokyo 1964 and Seoul 1988 Olympic Games. On the other hand,
growth rates of GDP in the advanced countries such as the United States and Australia are
steady and less than 8%. Therefore, holding the Olympic Games is a great opportunity for
China to be one of NICs.
Table 4-5: Comparison of Three-Phase Growth Rate of GDP
Unit: %
Averaged growth rate of GDP Olympic Games Pre-Games Games-Year Post-Games Tokyo 1964 Seoul 1988 Barcelona 1992 Atlanta 1996 Sydney 2000 Athens 2004 Beijing 2008
16.215.111.15.35.68.3
13.4
17.618.87.75.77.57.7
13.8
13.7 16.4 5.0 5.8 6.6 7.7
13.9
Note: The figures of averaged growth rate of GDP in Beijing 2008 are estimated.
Source: Same as table 3-1.
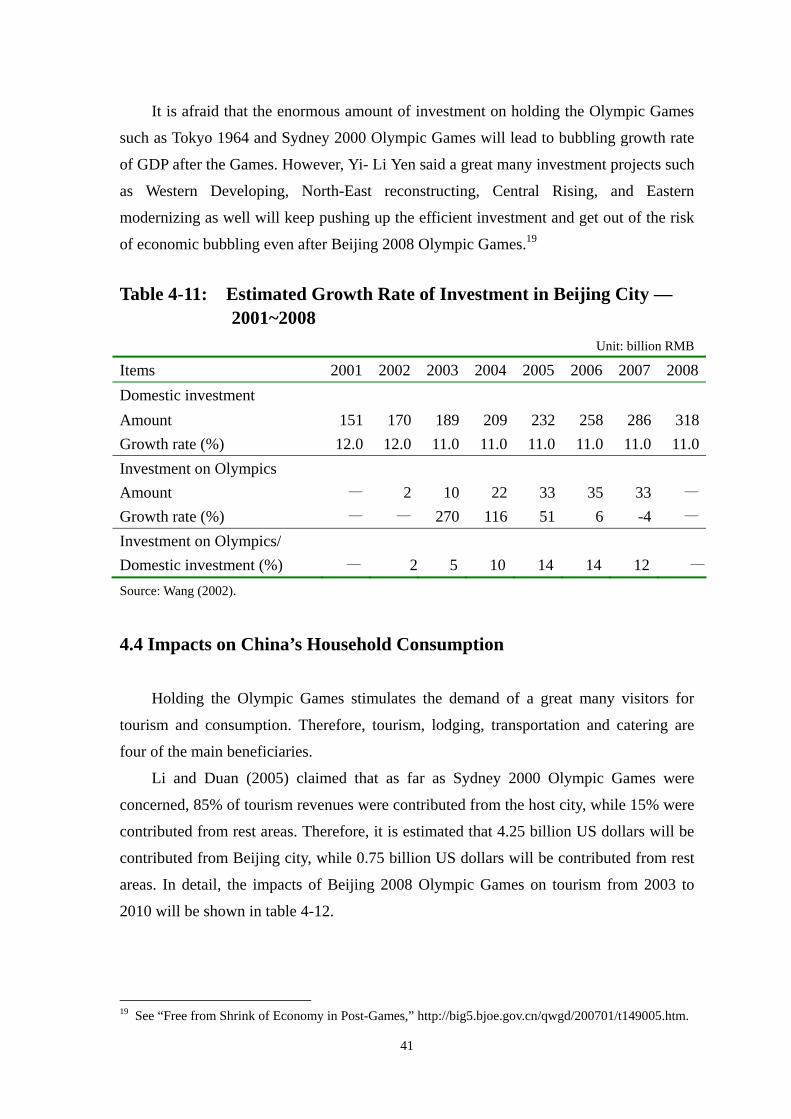
The Eleventh Five-Year Plan pointed that the amount of GDP per capita in 2010
expected to be twice as many as that in 2000, in order to achieve the goal of motivating
economic growth and advancing social development. As a result, holding Beijing 2008
Olympic Games is supposed to be a perfect opportunity to achieve this plan. Table 4-6 is
GDP per capita in China and Beijing city from 1999 to 2005. The averaged growth rates
of GDP per capita in China and Beijing city before 2001 were 7.6% and 13.2%
respectively, while those were 12.3% and 15.2% afterwards. It is obviously observed that
GDP per capita indeed boost since preparing for the Olympic Games. As a result, with
17 See National Bureau of Statistics of China, China Statistical Yearbook 2006. In 2005, the amount of GDP contributed from Beijing was 688.6 billion RMB. Also, the total amount of GDP in China was 18,308 billion RMB.
37
such a high speed of growth rate, the goal for doubling GDP per capita in China will be
achieved within 2006.
Table 4-6: GDP Per Capita in China and Beijing City — 1999~2005
Unit: RMB Items 1999 2000 2001 2002 2003 2004 2005 GDP per capita in China Amount 7,159 7,858 8,622 9,398 10,542 12,336 14,040Growth rate (%) 5.3 9.8 9.7 9.0 12.1 17.0 13.8GDP per capita in Beijing city Amount Growth rate (%)
19,846 —
22,46013.2
25,52313.6
28,449 11.5
32,061 12.7
37,058 15.6
45,44422.6
Source: Same as table 4-4.
4.3 Impacts on China’s Investment
Chang, Chou and Chang (2001) said that Ching-Min Liu, the vice chairman of BOC,
estimated the total amount of direct and indirect investment was as many as 36.2 billion
US dollars. 18 The investment will be put on operational cost, physical facilities,
gymnasiums, communication facilities, and environmental protection. In detail, the direct
investment is 3,635 million US dollars, while the indirect investment is surprisingly as
many as 32,557 million US dollars.
As far as the direct investment is concerned, it belongs to the expenditure of BOC
and includes basic construction, operational costs, physical facilities and gymnasiums.
On the other hand, the indirect investment, the budget of Central and Beijing government,
will be spent on basic construction, communication facilities, environmental protection,
and so on.
Table 4-7 illustrates the direct and indirect investment on holding Beijing 2008
Olympic Games. The investment consists of three major constructions. First, 3,635
million US dollars will be invested on gymnasiums and relative facilities. In order to
succeeding in holding the Olympic Games, the highest level of athletic competition over
the world, Central and Beijing government are supposed to put all their efforts on
building the best gymnasiums and facilities. The total of new world-class gymnasiums
would be as many as 19 and cost 1,236 million US dollars. Besides, some of the existed
18 The amount of money he estimated was 278.8 billion RMB.

38
gymnasiums were supposed to be renovated. The renovating cost 313 million US dollars.
Secondly, 24,998 million US dollars will be invested on basic construction and
transportation. To meet the demand of a great many visitors attracted by Beijing 2008
Olympic Games, well and convenient transportation will be needed.
The projects of transportation improvement are such as road circularity, radiate
freeway, subway system and light rail. In detail, 100 kilometers of rail road, 200
kilometers of new or reconstructed road and 700 kilometers of new freeway are all
needed from 2001 to 2008. The amount of freeways in Beijing city is expected from 500
kilometers to 718 kilometers in 2008. The total kilometers of road will amount to 14,700
and 87.3 per square kilometers. The total length of rail road is expected from 114
kilometers to 300 kilometers as well. With the construction project, transportation in
Beijing city is supposed to be greatly improved. Besides, the basic facilities such as
electricity, water supply, heat supply, air supply and communication are prerequisites for
succeeding in holding the Olympic Games.
Thirdly, 7,559 million US dollars will be invested on environmental protection in
case that the seriously polluted environment will become worse and worse. This part of
investment is funded by government, civil organization and The World Bank. The fee of
environmental protection is almost 20% of all the budgets. Table 4-7: Direct and Indirect Investment on Holding Beijing 2008
Olympic Games Unit: million US dollars
Items Amount Items AmountDirect Investment 17,506 Indirect Investment 18,6751.Gymnasiums and facilities - New gymnasiums - Extended gymnasiums - New facilities - Gymnasiums for practicing - Facilities for Paralymic Olympia 2. Basic construction - Railroad construction - Electricity - Telecommunication
3,6351,236
3131,986
5149
13,8702,5843,0938,201
1. Environmental protection - Energy resources - Water cleansing - Garbage disposal - Landscape engineering 2. Transportation - Railroad - Road construction - Others
7,5594,1422,380
187850
11,1175,1815,390
546
Source: Wang (2002).

39
Table 4-8 is the direct and indirect investment of Olympic host countries. The total
amount of investment on holding Beijing 2008 Olympic Games can be observed as the
most of all. It is almost four times as much as that on holding Barcelona 1992 Olympic
Games. Furthermore, the proportion of indirect investment to direct investment is 1:1,
which is similar to that of Seoul 1988 Olympic Games. With the enormous amount of
indirect investment, China’s follow-up economic development is supposed to be strongly
motivated by the Olympic Games.
Table 4-8: Comparison of Direct and Indirect Investment
Unit: million US dollars
Items
Tokyo 1964
Seoul 1988
Barcelona1992
Atlanta 1996
Sydney 2000
Beijing 2008
Direct investment Amount Percentage (%)
452(2.7%)
1,534(46.5%)
2,460(26.2%)
1,182
3,724 (63.8%)
17,506(48.0%)
Indirect investment Amount Percentage (%)
6,373(97.3%)
1,763(53.5%)
6,915(73.8%)
—
2,112
(36.2%) 18,675
(52.0%)Amount of total investment
6,825(100%)
3,296(100%)
9,376(100%)
— 5,836 (100%)
36,171(100%)
Source: Same as table 3-12.
Table 4-9 illustrates direct investment during the holding of Beijing 2008 Olympic
Games. The closer the holding of the Olympic Games is, the more the amount of
investment will be. It is 2007 that the investment is expected to amount to 5,365 million
US dollars, the most during the Olympic Games.
Table 4-10 illustrates growth rate of investment in China from 2000 to 2006. Growth
rate of investment in China kept increasing from 1999 and boosted to the summit of
27.7% in 2003. The averaged growth rate of investment in 1999 and 2000 was 7.6%,
while that was 22.1% when preparing for holding the Olympic Games. Moreover, growth
rates of investment in Beijing city were over 18% from 2001 to 2003. Then, it
dramatically dropped from 17.2% in 2004 to 11.8% in 2005. That could be attributed to
the inefficient investment. Therefore, holding Beijing 2008 Olympic Games, indeed,
stimulated domestic investment in China and Beijing city.

40
Table 4-9: Direct Investment during the Holding of Beijing 2008 Olympic Games
Unit: million US dollars Year Amount % Total 17,506 100.0 2003 298 1.7 2004 926 5.3 2005 4,233 24.2 2006 4,512 25.8 2007 5,365 30.6 2008 2,178 12.4
Source: “Input on the Olympic Games and development of Beijing city,”
http://www.bjstats.gov.cn/ldcxxt/tjfx/tjbg/200510/t20051013_32344.htm.
Table 4-10: Growth Rate of Investment in China and Beijing City —
2000~2006 Unit: billion RMB
Items 2000 2001 2002 2003 2004 2005 2006 Investment in China Amount Growth rate (%)
3,29210.2
3,72113.0
4,35017.0
5,55727.7
7,048 26.8
8,877 26.0
10,987
23.7Investment in Beijing city Amount Growth rate (%)
129.710.8
153.118.0
181.418.5
215.718.9
252.8 17.2
282.7 11.8
—
—
Source: Same as table 4-4, and China Economic Databases, China Economic Analysis Monthly,
http://ics.nccu.edu.tw/ced/paper/CEAM-07-02.pdf.
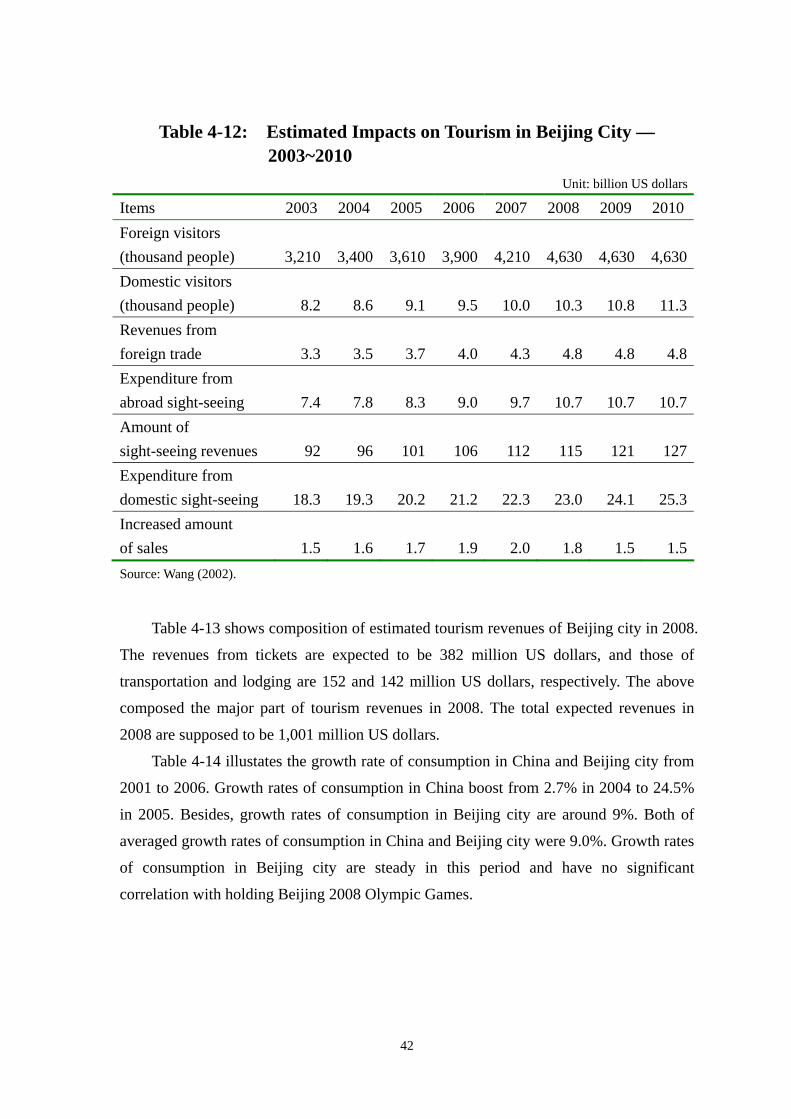
Table 4-11 is the estimated growth rate of investment in Beijing city from 2001 to
2008. The growth rate of investment in Beijing city is estimated to be from 11.0% to
12.3%. What is more, estimated growth rate of investment contributed from holding the
Olympic Games will summit at 270% in 2003 and then decrease. The deficient amount of
investment will seriously drop to - 4.3% in 2007. As a result, holding the Olympic Games
stimulates a considerable sum of investment in Beijing city.
41
It is afraid that the enormous amount of investment on holding the Olympic Games
such as Tokyo 1964 and Sydney 2000 Olympic Games will lead to bubbling growth rate
of GDP after the Games. However, Yi- Li Yen said a great many investment projects such
as Western Developing, North-East reconstructing, Central Rising, and Eastern
modernizing as well will keep pushing up the efficient investment and get out of the risk
of economic bubbling even after Beijing 2008 Olympic Games.19
Table 4-11: Estimated Growth Rate of Investment in Beijing City —
2001~2008 Unit: billion RMB
Items 2001 2002 2003 2004 2005 2006 2007 2008Domestic investment Amount 151 170 189 209 232 258 286 318Growth rate (%) 12.0 12.0 11.0 11.0 11.0 11.0 11.0 11.0Investment on Olympics Amount — 2 10 22 33 35 33 —
Growth rate (%) — — 270 116 51 6 -4 —
Investment on Olympics/ Domestic investment (%)
—
2
5
10
14
14
12
—
Source: Wang (2002).
4.4 Impacts on China’s Household Consumption
Holding the Olympic Games stimulates the demand of a great many visitors for
tourism and consumption. Therefore, tourism, lodging, transportation and catering are
four of the main beneficiaries.
Li and Duan (2005) claimed that as far as Sydney 2000 Olympic Games were
concerned, 85% of tourism revenues were contributed from the host city, while 15% were
contributed from rest areas. Therefore, it is estimated that 4.25 billion US dollars will be
contributed from Beijing city, while 0.75 billion US dollars will be contributed from rest
areas. In detail, the impacts of Beijing 2008 Olympic Games on tourism from 2003 to
2010 will be shown in table 4-12.
19 See “Free from Shrink of Economy in Post-Games,” http://big5.bjoe.gov.cn/qwgd/200701/t149005.htm.
42
Table 4-12: Estimated Impacts on Tourism in Beijing City —
2003~2010 Unit: billion US dollars
Items 2003 2004 2005 2006 2007 2008 2009 2010Foreign visitors (thousand people)
3,210 3,400 3,610 3,900 4,210
4,630
4,630 4,630
Domestic visitors (thousand people)
8.2 8.6 9.1 9.5 10.0
10.3
10.8 11.3
Revenues from foreign trade
3.3 3.5 3.7 4.0 4.3
4.8
4.8 4.8
Expenditure from abroad sight-seeing
7.4 7.8 8.3 9.0 9.7
10.7
10.7 10.7
Amount of sight-seeing revenues
92 96 101 106 112
115
121 127
Expenditure from domestic sight-seeing
18.3 19.3 20.2 21.2 22.3
23.0
24.1 25.3
Increased amount of sales
1.5 1.6 1.7 1.9 2.0
1.8
1.5 1.5
Source: Wang (2002).
Table 4-13 shows composition of estimated tourism revenues of Beijing city in 2008.
The revenues from tickets are expected to be 382 million US dollars, and those of
transportation and lodging are 152 and 142 million US dollars, respectively. The above
composed the major part of tourism revenues in 2008. The total expected revenues in
2008 are supposed to be 1,001 million US dollars.
Table 4-14 illustates the growth rate of consumption in China and Beijing city from
2001 to 2006. Growth rates of consumption in China boost from 2.7% in 2004 to 24.5%
in 2005. Besides, growth rates of consumption in Beijing city are around 9%. Both of
averaged growth rates of consumption in China and Beijing city were 9.0%. Growth rates
of consumption in Beijing city are steady in this period and have no significant
correlation with holding Beijing 2008 Olympic Games.

43
Table 4-13: Estimated Tourism Revenues of
Beijing City in 2008 Unit: million US dollars
Items Estimated tourism revenues
Tickets 382 Transportation 152 Lodging 142 Catering service 96 Shopping 96 Communication 8 Sightseeing 44 Recreation 30 Others 50 Total 1,001
Source: Same as table 4-9.
Table 4-14: Growth Rate of Consumption in China and
Beijing City — 2001~2006 Unit: billion RMB
Items 2001 2002 2003 2004 2005 2006 Consumption in China Amount 4,306 4,814 5,252 5,395 6,718 7,641 Growth rate (%) — 11.8 9.1 2.7 24.5 13.7 Consumption in Beijing city Amount Growth rate (%)
183—
2009.2
2199.5
2398.9
260 8.7
— —
Source: Same as table 4-10.
It is well known that China’s tourism develops rapidly. In 2005, total amount of
tourists was up to 120 million people, and the sum of tourism revenues boosted to 29.3
billion US dollars. Each of growth rates was 10.3% and 13.8, respectively. Therefore,
with the splendid performance of tourism, the numbers of tourists and amount of
revenues in Beijing 2008 Olympic Games are supposed to be more than those of the
previous host countries.
44
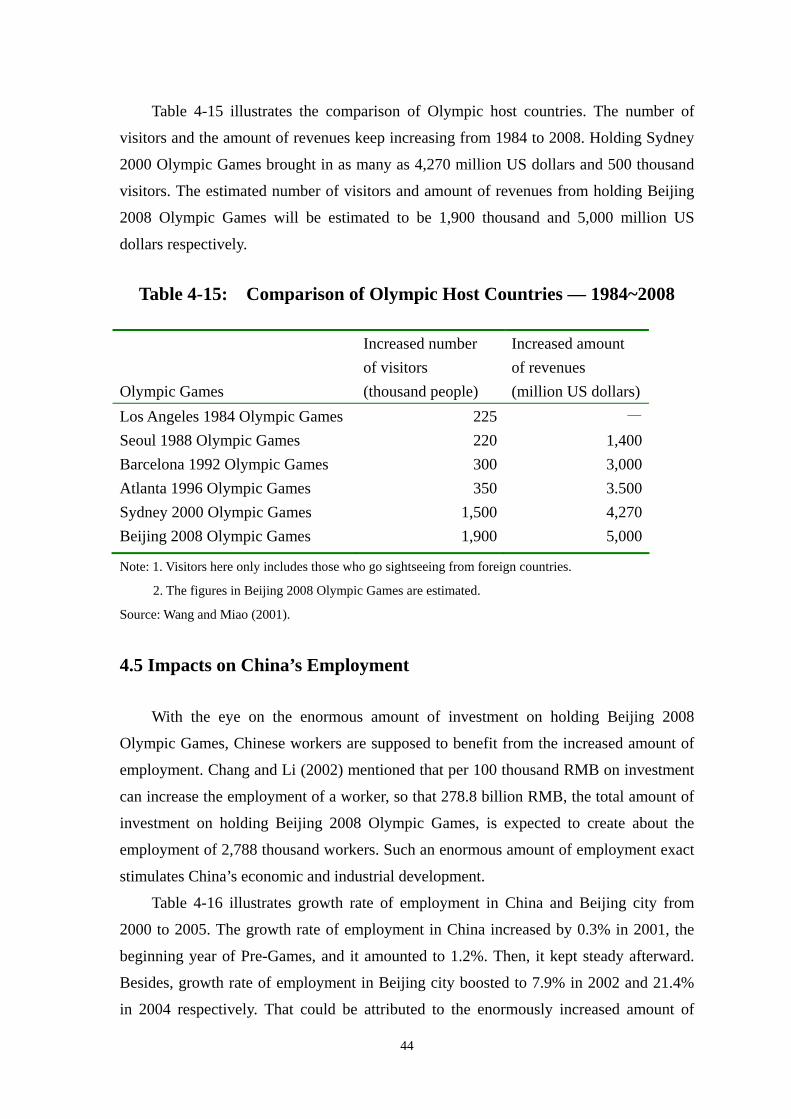
Table 4-15 illustrates the comparison of Olympic host countries. The number of
visitors and the amount of revenues keep increasing from 1984 to 2008. Holding Sydney
2000 Olympic Games brought in as many as 4,270 million US dollars and 500 thousand
visitors. The estimated number of visitors and amount of revenues from holding Beijing
2008 Olympic Games will be estimated to be 1,900 thousand and 5,000 million US
dollars respectively.
Table 4-15: Comparison of Olympic Host Countries — 1984~2008
Olympic Games
Increased number of visitors (thousand people)
Increased amount of revenues (million US dollars)
Los Angeles 1984 Olympic Games Seoul 1988 Olympic Games Barcelona 1992 Olympic Games Atlanta 1996 Olympic Games Sydney 2000 Olympic Games Beijing 2008 Olympic Games
225220300350
1,500 1,900
— 1,400 3,000 3.500 4,270
5,000
Note: 1. Visitors here only includes those who go sightseeing from foreign countries.
2. The figures in Beijing 2008 Olympic Games are estimated.
Source: Wang and Miao (2001).
4.5 Impacts on China’s Employment
With the eye on the enormous amount of investment on holding Beijing 2008
Olympic Games, Chinese workers are supposed to benefit from the increased amount of
employment. Chang and Li (2002) mentioned that per 100 thousand RMB on investment
can increase the employment of a worker, so that 278.8 billion RMB, the total amount of
investment on holding Beijing 2008 Olympic Games, is expected to create about the
employment of 2,788 thousand workers. Such an enormous amount of employment exact
stimulates China’s economic and industrial development.
Table 4-16 illustrates growth rate of employment in China and Beijing city from
2000 to 2005. The growth rate of employment in China increased by 0.3% in 2001, the
beginning year of Pre-Games, and it amounted to 1.2%. Then, it kept steady afterward.
Besides, growth rate of employment in Beijing city boosted to 7.9% in 2002 and 21.4%
in 2004 respectively. That could be attributed to the enormously increased amount of

45
investment on holding the Olympic Games.
Table 4-16: Growth Rate of Employment in China and Beijing City — 2000~2005
Items 2000 2001 2002 2003 2004 2005 Employment in China Amount (million workers) 721 730 737 744 752 758Growth rate (%) 0.9 1.2 0.9 0.9 1.1 0.8Employment in Beijing city Amount (million workers) Growth rate (%)
6.20.0
6.31.6
6.87.9
7.0 2.9
8.5 21.4
8.83.5
Source: Same as table 4-4.
Table 4-17 compares the increased amount of employment between Olympic host
countries from 2000 to 2005. Sydney 2000 Olympic Games created as many as 1,577
thousand workers, while Beijing 2008 Olympic Games are expected to create more than
2,788 thousand workers.
Table 4- 17: Comparison of Increased Employment — 2000~2005 Unit: thousand workers
Items
Los Angeles1984
Seoul1988
Barcelona1992
Atlanta1996
Sydney 2000
Beijing2008
Amount of increased employment
25
336
120
90
1,577
2,788
Note: The employment of Beijing 2008 Olympic Games is estimated.
Source: Tao (2003).
4.6 Impacts on China’s Industrial Structure
As mentioned in the third session, the enormous demands of visitors for the Olympic
Games stimulate development of tourism, lodging real estate, and catering. During the
period as long as seven years, domestic and foreign visitors will go sight-seeing in the
host city and country. Athletes’ needs for food and drink greatly benefit catering. Next,
the great amount of investment on gymnasiums and athletic facilities motivates
development of design, construction, building and adornment.

46
Furthermore, in order to build a much more convenient environment, transportation,
postal industry, and telecommunication are beneficiaries as well. In addition, holding the
Olympic Games creates a lot of business opportunities for information technological
industry and manufacturing. The alluring revenues for Olympic souvenirs such as
Olympic logos, Olympic flags, T-shirts, handicrafts and so on will benefit manufacturing.
Chang, Chou and Chang (2001) pointed that the revenues of Olympic souvenir in Sydney
2000 Olympic Games were as many as 213 million US dollars. Therefore, it supposed to
be an alluring profit in Beijing 2008 Olympic Games. Meanwhile, the need for modern
computer science will bring in a great deal of money for manufacturing. Finally, the three
themes of holding Beijing 2008 Olympic Games, which are Green Olympics, Humanistic
Olympics and High-tech Olympics, stimulate development of educational industry,
cultural industry and environmental protection.
Wang (2002) stated that the splendid amount of investment and consumption will
benefit the third industry the most. And the impacts on the third industry can break into
direct and indirect influence. To begin with, the direct influence means the need for
constructing gymnasiums, athletic facilities and operational fees. Secondly, as far as
indirect influence is concerned, holding Beijing 2008 Olympic Games not only improves
basic facilities and environment, but also raises China’s international reputation. As a
result, indirect influence will be much more significant than direct one.
Table 4-18 explains the three-phase impacts on industrial structures in China. Li and
Duan (2005) thought that the second and third industries in Beijing city will be the most
beneficiaries. Especially, GDP of the third industry is supposed to increase by 0.4% in
2010. Besides, from 2003 to 2007, the employment of the second and third industry will
increase the employment of 140 thousand and 90 thousand workers.
Then, in 2008, the employment contributed from the third industry will increase to
263 thousand workers. On the other hand, the increased employment and GDP in rest
areas will be far fewer than that of Beijing city. Roughly speaking, GDP of rest areas is
supposed to increase by 0.07% from 2003 to 2007 and by 0.23% in 2008. During the
holding of Beijing 2008 Olympic Games, most of the economic indicators in rest areas
are expected to be less than 0.15%. It can attribute to Beijing city’s minor percentage.
Therefore, hardly can the Olympic Games stimulate economic development of rest areas.

47
Table 4-18: Three-Phase Impacts on Industrial Structures Unit: %
Beijing city Rest areas Items 2002 2005 2010 2002 2005 2010 Proportion of production The first industry 3.1 2.4 2.8 15.70 15.68 15.68The second industry 34.7 35.1 34.6 51.60 51.63 51.61The third industry Total
62.2100.0
62.5100.0
62.6100.0
32.60100.0
32.59 100.0
32.62100.0
Proportion of employment The first industry 8.5 7.5 6.8 50.50 50.48 50.46The second industry 30.8 32.6 28.5 21.30 21.33 21.31The third industry Total
60.7100.0
59.9100.0
64.8100.0
28.20100.0
28.19 100.0
28.23100.0
Source: Li and Duan (2005).
Table 4-19 is the expected impacts on the switch of industrial structures in Beijing
city from 2000 to 2008. The percentages of the first and second industries are supposed to
decrease with the holding of Beijing 2008 Olympic Games, while that of the third
industry will increase instead. The averaged growth rate of the third industry is about
0.65%.
Table 4-19: Impacts on the Switch of Industrial Structures in Beijing City—2000~2008
Unit: %
Industries 2000 2001 2002 2003 2004 2005 2006 2007 2008
The first industry
The second industry
The third industry
3.0
38.0
59.0
3.3
36.2
60.5
3.0
35.6
61.4
2.8
35.6
61.6
2.5
36.1
61.4
2.4
36.0
61.6
2.2
35.0
62.8
2.1
33.4
64.5
2.0
32.3
65.7
Total 100.0 100.0 100.0 100.0 100.0 100.0 100.0 100.0 100.0Source: Wang (2002).
Wang (2002) mentioned that holding the Olympic Games will stimulate the
percentage of the third industry to 0.65% before 2008. It means that holding the Olympic
48
Games will achieve the goal earlier than the circumstance without holding the Olympic
Games. Meanwhile, such an industrial structure symbolizes that Beijing city will achieve
the standard of the modernized metropolis.
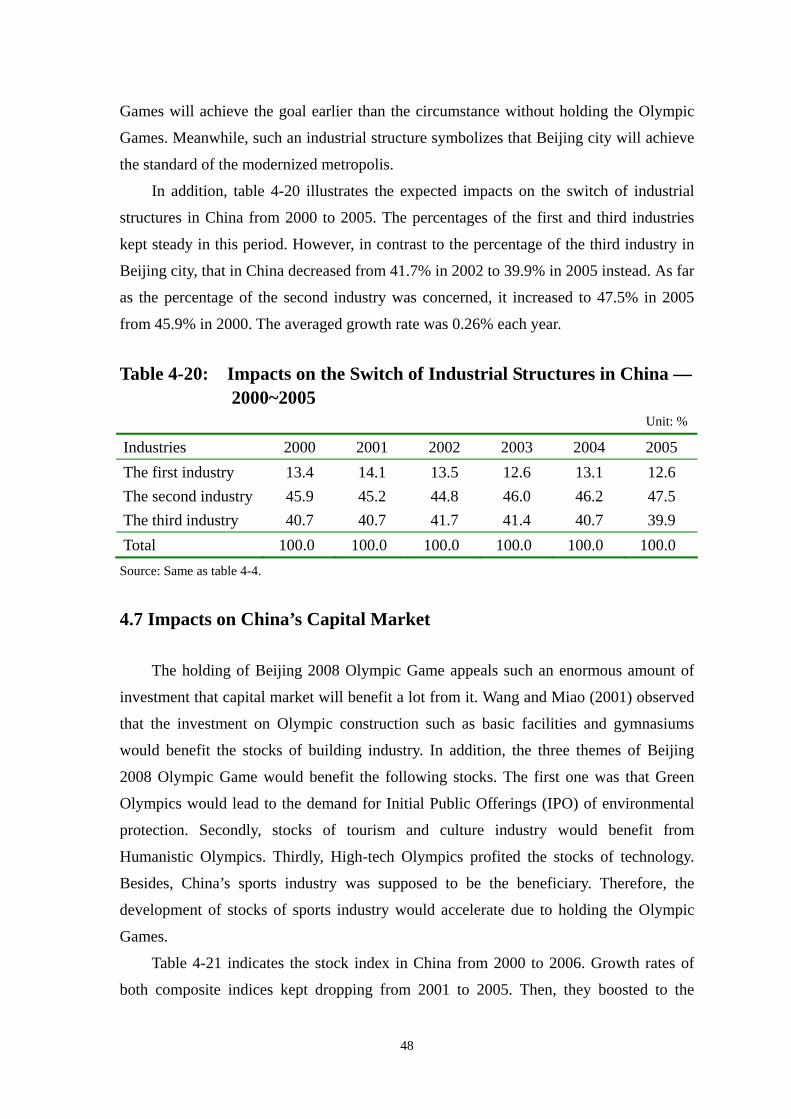
In addition, table 4-20 illustrates the expected impacts on the switch of industrial
structures in China from 2000 to 2005. The percentages of the first and third industries
kept steady in this period. However, in contrast to the percentage of the third industry in
Beijing city, that in China decreased from 41.7% in 2002 to 39.9% in 2005 instead. As far
as the percentage of the second industry was concerned, it increased to 47.5% in 2005
from 45.9% in 2000. The averaged growth rate was 0.26% each year.
Table 4-20: Impacts on the Switch of Industrial Structures in China —
2000~2005 Unit: %
Industries 2000 2001 2002 2003 2004 2005 The first industry 13.4 14.1 13.5 12.6 13.1 12.6 The second industry 45.9 45.2 44.8 46.0 46.2 47.5 The third industry 40.7 40.7 41.7 41.4 40.7 39.9 Total 100.0 100.0 100.0 100.0 100.0 100.0
Source: Same as table 4-4.
4.7 Impacts on China’s Capital Market
The holding of Beijing 2008 Olympic Game appeals such an enormous amount of
investment that capital market will benefit a lot from it. Wang and Miao (2001) observed
that the investment on Olympic construction such as basic facilities and gymnasiums
would benefit the stocks of building industry. In addition, the three themes of Beijing
2008 Olympic Game would benefit the following stocks. The first one was that Green
Olympics would lead to the demand for Initial Public Offerings (IPO) of environmental
protection. Secondly, stocks of tourism and culture industry would benefit from
Humanistic Olympics. Thirdly, High-tech Olympics profited the stocks of technology.
Besides, China’s sports industry was supposed to be the beneficiary. Therefore, the
development of stocks of sports industry would accelerate due to holding the Olympic
Games.
Table 4-21 indicates the stock index in China from 2000 to 2006. Growth rates of
both composite indices kept dropping from 2001 to 2005. Then, they boosted to the
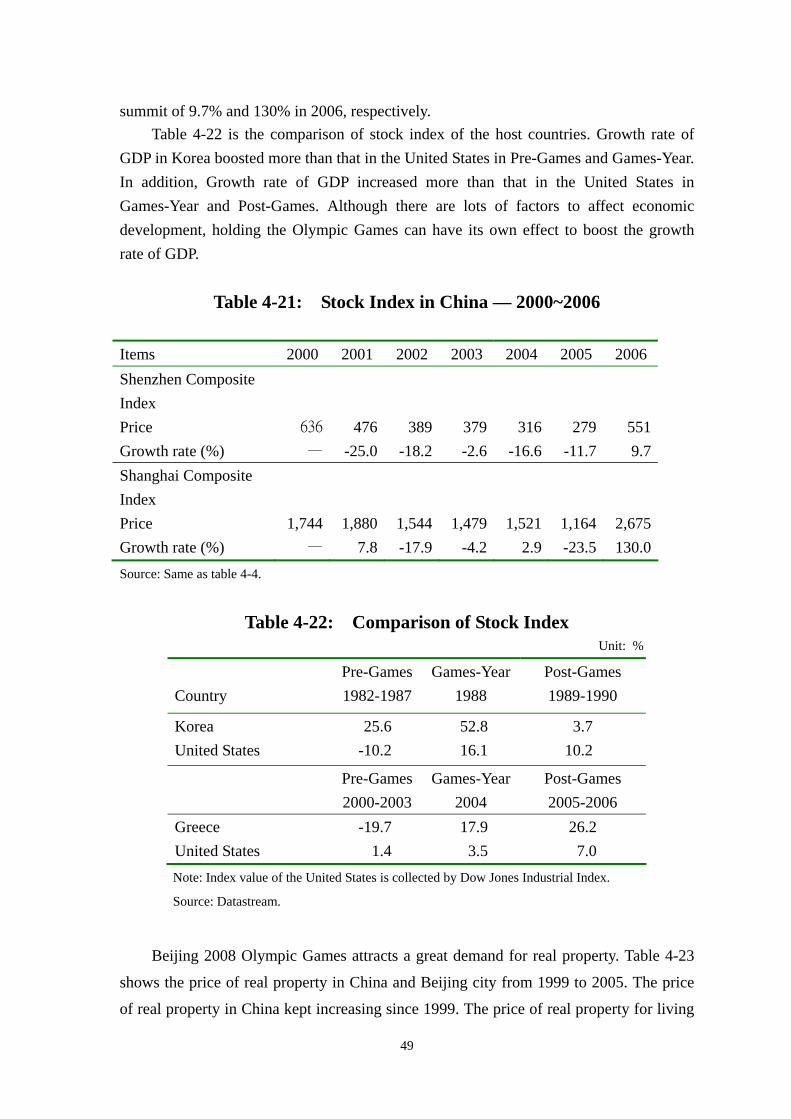
49
summit of 9.7% and 130% in 2006, respectively. Table 4-22 is the comparison of stock index of the host countries. Growth rate of
GDP in Korea boosted more than that in the United States in Pre-Games and Games-Year. In addition, Growth rate of GDP increased more than that in the United States in Games-Year and Post-Games. Although there are lots of factors to affect economic development, holding the Olympic Games can have its own effect to boost the growth rate of GDP.
Table 4-21: Stock Index in China — 2000~2006
Items 2000 2001 2002 2003 2004 2005 2006 Shenzhen Composite Index Price Growth rate (%)
636
—
476-25.0
389-18.2
379-2.6
316-16.6
279 -11.7
551 9.7
Shanghai Composite Index Price Growth rate (%)
1,744 —
1,8807.8
1,544-17.9
1,479-4.2
1,521
2.9
1,164 -23.5
2,675 130.0
Source: Same as table 4-4.
Table 4-22: Comparison of Stock Index
Unit: %
Country
Pre-Games1982-1987
Games-Year1988
Post-Games 1989-1990
Korea United States
25.6 -10.2
52.8 16.1
3.7 10.2
Pre-Games2000-2003
Games-Year2004
Post-Games 2005-2006
Greece United States
-19.7 1.4
17.9 3.5
26.2 7.0
Note: Index value of the United States is collected by Dow Jones Industrial Index.
Source: Datastream.
Beijing 2008 Olympic Games attracts a great demand for real property. Table 4-23
shows the price of real property in China and Beijing city from 1999 to 2005. The price
of real property in China kept increasing since 1999. The price of real property for living

50
increased more significantly than that for business. In addition, the price of real property
in Beijing city fluctuated from 4,737 RMB per square meter in 2003 to 6,788 RMB per
square meter in 2005. High price of real property in 2005 could be attributed to the
approach of the Olympic Games.
With the coming of Beijing 2008 Olympic Games, the price of real property in
Beijing city is supposed to boost. According to the analysis in Chapter 3, the price of real
estates will be pushed up before and after the Olympic Games. As far as the price of real
estates in China was concerned, it boosted in 2004 and then fall down a little bit in 2005.
Such a trend was supposed to keep off bubbling. However, as for the price of real estates
in Beijing city, the excessive growth rate in 2005 might end up with overheating.
Table 4-23: Price of Real Estates in China and Beijing City —
1999~2005 Unit: RMB per square meter
Items 1999 2000 2001 2002 2003 2004 2005 Real estates in China Price Growth rate (%)
2,053—
2,1122.9
2,1702.7
2,2503.7
2,359
4.8
2,778 17.8
3,16814.0
Real estates in Beijing city Price Growth rate (%)
5,647—
4,919-12.9
5,0622.9
4,764-5.9
4,737 0.5
5,053 6.7
6,78834.3
Source: Same as table 4-4.
Due to the alluring opportunity of investment, foreign investors are supposed to be
attracted by Beijing 2008 Olympic Games. Table 4-24 shows foreign direct investment
(FDI) in China and Beijing city from 1999 to 2005. The amount of FDI kept increasing
since 1999. Growth rate of FDI boosted to the summit of 39% in 2003 and then slightly
decreases afterwards. The trend shows no significance with the holding of Beijing 2008
Olympic Games. However, the amount of FDI in Beijing city fluctuated much more
fiercely than that in China. Growth rate of FDI summated at 257.9% in 2004, while it
bottomed to -54.4% in 2005. Such a phenomenon reflected the insufficient investment on
the Olympic Games.

51
Table 4-24: Foreign Direct Investment in China and Beijing City — 1999~2005
Unit: billion RMB
Items 1999 2000 2001 2002 2003 2004 2005 FDI in China Amount 41.2 62.4 69.2 82.8
115.1
153.5 189.1
Growth rate (%) — 51.4 10.9 19.7 39.0 33.4 23.2
FDI in Beijing city Amount 3.5 1.4 1.5 2.4
1.9
6.8 3.1
Growth rate (%) -14.6 -0.6 7.1 60 -20.8 257.9 -54.4Source: Same as table 4-4.
4.8 Summary
Beijing 2008 Olympic Games are supposed to result in far more indirect revenues
than direct one. Although direct revenues and profit from holding the Olympic Games are
not marvelous at all, the impacts on GDP, investment, tourist’s revenues, employment,
industrial structure and capital market of China’s economy, however, are extremely
significant. The overall impacts of holding Beijing 2008 Olympic Games on China can be
concluded as the followings:
1. The alluring revenues and profits. The profit of holding Beijing 2008 Olympic
Games is expected to be as many as 16 million US dollars. The expected revenue is 1,625
million US dollars, while the expected expenditure is 1,609 million US dollars. Although
such a profit is not as much as those of Los Angeles 1984, Seoul 1988 and Sydney 2000
Olympic Games, it is, however, still a considerable sum of money to earn.
2. Splendid Growth Rate of GDP. The averaged growth rate of GDP during the
holding of Beijing 2008 Olympic Games is expected to be above 13%. Such a high
growth rate closes to those of Tokyo 1964 and Seoul 1988 Olympic Games.
3. The enormous amount of investment. The amount of investment on holding
Beijing 2008 Olympic Games is far more than those of previous Olympic Games. It is
supposed to be around 36,171 million US dollars. Specifically, the amount of indirect
investment is as many as 18,675 million US dollars, while that of direct one is about
17,506 million US dollars. The proportion of indirect investment to direct one is 1:1.
Such a proportion equals to that in Seoul 1988 Olympic Games. Growth rates of
investment are expected to be 19% and 11% respectively in China and Beijing city. Also,

52
the three-phase growth rates of investment in Beijing city contributed from Beijing 2008
Olympic Games are estimated as 5.6% in Pre-Games, 0.2% in Games-Year and - 0.2% in
Post-Games.
4. Excellent achievement on attracting tourists and creating employment. The
increased tourism revenues, visitors and employment are expected to be more than those
of previous Olympic Games. They are 5,000 million US dollars and 1,900 thousand
people respectively. Specifically, 4.25 billion US dollars will be contributed from Beijing
city, while 0.75 billion US dollars will be contributed from rest areas.
5. Rapid development of the third industry. Holding Beijing 2008 Olympic Games
benefits the third industry the most, so that the swift of industrial structures in Beijing
city raises percentage of the third industry to 65% step by step. In contrast, as for the
industries in China, the Olympic Games benefit the second industry the most instead.
From 2000 to 2005, the averaged growth rate of the second industry is 0.26%.
6. The risk of bubbling capital market. High demand for renting will lead to
over-heated price of real property. Especially, boosted price of real property in Beijing
city will encounter the risk of bubbling.