comparison of ecn and eis measurement for corrosion ... · comparison of ecn and eis measurement...
TRANSCRIPT

PaperNo.
276
COMPARISON OF ECN AND EIS MEASUREMENT FOR CORROSIONMONITORING UNDER MULTIPHASE FLOW CONDITIONS
Y. Chen , M Gopal, W.P. JepsonNSF IAJCRC Center Corrosion in Multiphase Flow Systems
Department of Chemical EngineeringOhio University
Athens, OH 45701
ABSTRACT
Electrochemical Noise(ECN) and Electrochemical Impedance Spectroscope (EIS) measurements were madesimultaneously in a 75 mm I.D., 10 m long acrylic pipeline using salt-water/carbon dioxide mixtures. Fullpipe flow was studied for liquid velocities of 0.5,0.75, 1.1, 1.5 rrds and slug flow for Froude numbers 4, 6and 9. Experiments were carried out at a constant pressure of 136 kPa and temperature of 40 ‘C. ECNdata were measured with a fast auto zero resistance ammeter. The ECN technique is able to detect changesin flow regime, showing distinct differences between fill pipe flow and slug flow. The choice of samplingrate when using ECN is very important. For slug flows, sampling rates as high as 100 Hz are necessary toinclude most of the transients in the flow. Distinct differences can be seen in the Fast Fourier Transformswhere dominant frequencies exist which correspond to possible bubble action in the slug body. EIS can beused to measure corrosion rate in muhiphase flows. It does show an increase in the corrosion rate withliquid flow rates for fidl pipe flow and Froude numbers for stationw slug flow. A simple statistical analysisof ECN response gives a correlation with corrosion rate. These show ECN could be a very powerful toolfor determining corrosion rate and corrosion mechanism in multiphase flow.
Electrochemical Noise, ElectrochemicalBubble Impact
KEYwoRDs
Impedance Spectroscope, Corrosion, Multiphase Slug Flow,
Copyright01997 by NACE International. Requests for permission to publish this manuscript in any form, in part or in whole must be maoe in writing to NACEInternational, Conferences Division, P.O. Box 218340, Houston, Texas 77218-8340. The material preeented and the views expressed in thispaper are solely those of the author(s) and are not necessarily endorsed by the Association. Printed in the U.S.A.

INTRODUCTION
In remote areas, the production from the wells is required to be transported as a multiphase mixture of oil,
sea-water, carbon dioxide and nature gas. This results ilthefomation ofaweAcomosion cmbonic acid
often causing severe corrosion in carbon steel pipeline:;. It is important that proper design and operation
conditions bemaintained tominimize corrosion and itisimperative tomonitor corrosion carefully,
There are many different flow regions (Lee and Jepson, 1993)], At high production rates, the slug flowregime is prominent. Here, hlghlyaerated bodies ofliqllid called slugs propagate intemitiently along tiepipe. Slug flow is known to significantly enhance intemd corrosion in oil-gas pipelines. This is due to thehigh levels ofshemmd ~bulence occting attheslug iont. Green etal. (1989)2 investigated the effectsof different flow regime oncorrosion rate intield studies. They showed that instrmtaneous corrosion valuesfor slug flow are at least two orders of magnitude higher than those existing under stratitied flow.
Comosionprocesses have beenstidied byvtiousreseachers. Mmy carried outtheirstudies insinglephasesystemsin autoclaves using RCE, using brine sa~ated,tith cwbon dioxide. Corrosion in Multiphase flowhas been studied extensively at the NSF I/UCRC Corrosion Center. Zhou and Jepson (1993)3studied flowand corrosion at slug flow condition in the large di:~meter pipeline. They used Linear Polarization
Resistance (LPR) and Electrical Resistance (ER) teclmiques, and weight loss measurements to quanti~overall corrosion rates for full pipe flow and slug flow. Vuppu and Jepson (1994)4, studied corrosionproducts on carbon steel coupons at various temperatures and at different flow conditions. They observedunifomcomosion for fullpipe flow andpitting Vpeccmosion under slug flow. The measurements weremade over long periods of time and instantaneous effects could not be isolated. Slug flow has beencharacterizedby the Froudenumber, Fr, whlchis defiltedas(Jepson, 1987)”:
Fr = (Vt - V,) /(g hem)05
where:V, andV~ metietrmslationd velocities oftieslug mdfilmvelocities, respectively;g is the acceleration due to gravity;hcflis the effective height of the liquid film
Electrochemical noise (ECN) is defined as the spontaneous fluctuations observed in potential and currentat the free corrosion potential. Evaluation of thk ECN as ~itool of measuring corrosion has increased steadilysince 1968 by Iversons. Theabili~to isolate d~aicevents mdstudytiem botiintie time mdfiequencydomains make ECN a powerful tool for gaining mechanistic information on corrosion in multiphasepipelines. Extensive research has been conducted to develop the ECN technique as an effective analysis toolfor corrosion studies. Hladkymd Dawson(1981)c st~died thevoltage noise output wdermifomorgeneral corroding conditions. They found that pit initiation occurs when the environmental conditionsbecame aggressive. Eden and Rothwell (1992)7 have shown that during pitting corrosion, the currenttransient are normally hi-directional with positive and negative excursions. The duration of the transientidentities whether the specimen is undergoing pit propagation or pit initiation. Webster et al. (1994)8appliedthe ECN techniques to monitor corrosion in rnultiphasc flows. They found that the technique can detectchange in flow regime and discriminate theperformw.ce ofirrMbitors on a qualitative basis. Deva andJepson(1995)9 used ECNtostudy comosion mechtismfor fillpipe flow mdslugflow atdifferentwatercuts. They demonstrated that electrochemical noise technique is usefal for measuring the corrosion
27W2

mechanisms in slug flow. Sampling rates up to only 20 Hz were available at that time.
The Electrochemical Impedance Spectroscope (EIS) has been successfully applied to the study of corrosionsystems for over twenty years because thk method yi:lds information about the type of corrosion, thekinetics of the corrosion reaction and also the corrosion late (Tait) ‘O.An important advantage of EIS overother laboratory techniques is the possibility of using very small amplitude signals without disturbing theproperty being measured. EIS has thus been successful in studying the corrosion of carbon steel in lowconductivity media (Chechirlian, et al., 1993) ‘‘. Both signal magnitude and phase shift are used tocharacterize the interface impedance. Equivalent electrkal circuits can be developed from this and used toprovide information regarding the corrosion mechanism. Many workers have tried to use EIS to study thecorrosion mechanism and analyze the EIS data for common corrosion processes (Mansfeld, et al., 1993)]2,The most successtid application of EIS is in the coating area and for evaluating corrosion inhibitors (Chen1994)’’”4
This paper compares the ECN and the EIS technique:; and examines the effect of multiphase flow oncorrosion in horizontal pipes.
EXPERIMENTAL PROCEDURE
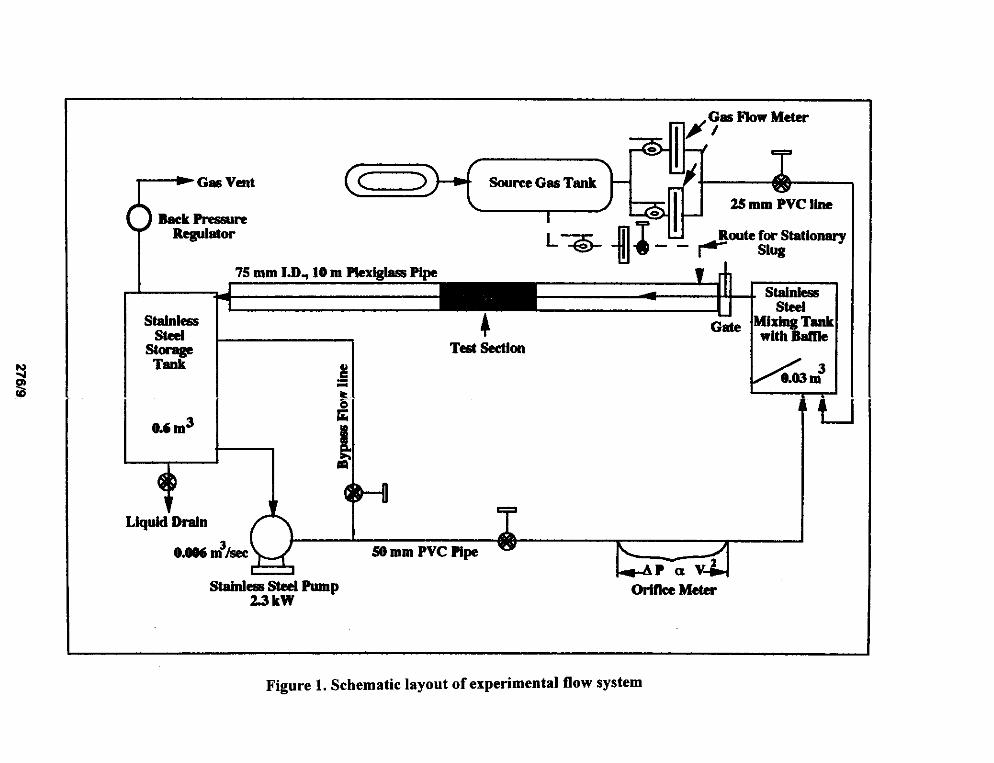
The flow loop schematic is shown in Figure 1. Liquid is pumped by a 2.3 kW stainless steel centrifugalpump from a 0.6 m’ stainless steel storage tank through a 50 mm I.D. PVC pipe into a 0.03 m’ stainless steelmixing tank. The liquid flow rate is controlled by valve> and a by-pass line and is monitored by means ofan orifice plate.
Carbon dioxide gas, from a pressurized 1.67 m3tank, is introduced into the system at an inlet pressure of900 kpa (l OOpsi).The gas flow rate is controlled by a gate valve and is monitored by means of variable areagas flow meter.
The mrdtiphase mixture flows through a 75 mm I.D., 10 m long acrylic pipeline. The mixture is dischargedinto the liquid storage tank where it is separated by means of a perforated separation plate. The gas isexhausted to the atmosphere. The system is equipped with aback pressure regulator to maintain a constantsystem pressure. Slugs are generated in the test section following the same procedure as Zhou and Jepson(1994 )3. The data in this study was generated using a :tationary slug over the probes. TMs is equivalentto as moving slug flow more than 40 /rein frequency.
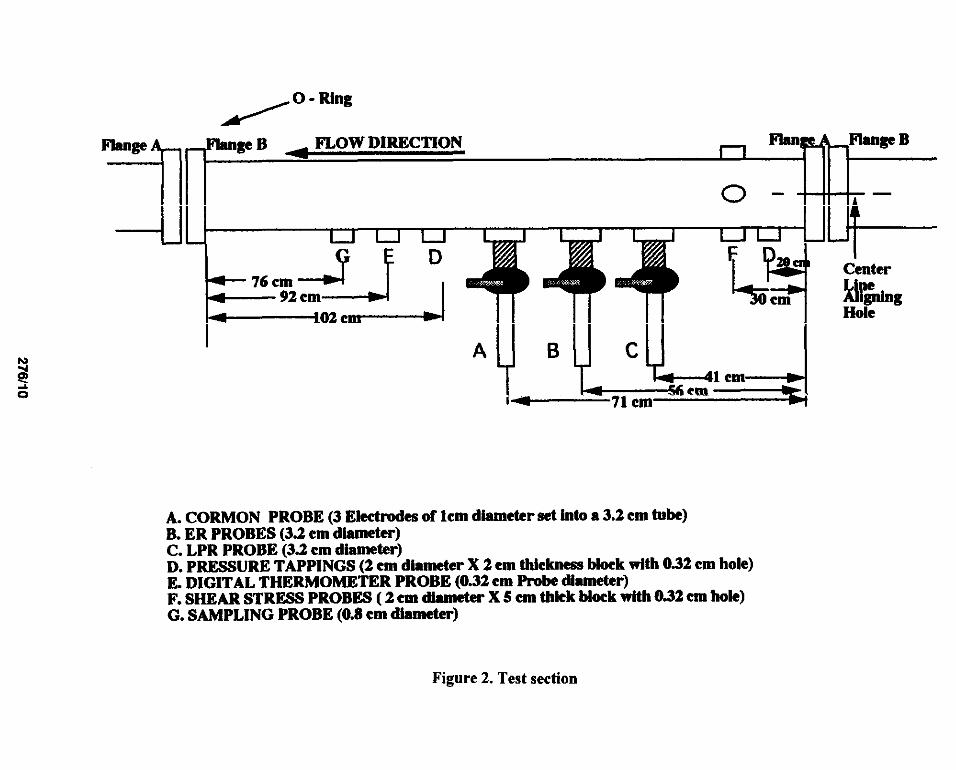
Measurements are taken in the test section as shown in the Figure 2. At position A, the ECN probe isinserted. At position B and C, flush mounted EIS/LPR and ER probes respectively, can be inserted tomeasure the corrosion rate at the bottom of the pipe. F~rrall experiments, the iron and oxygen levels aremaintained below 10 ppm and 10 ppb, respectively. The’levels are monitored with the appropriate test kitsfrom CHEMets.
The ECN probe is shown in Figure 3. It is a three identical carbon steel electrode probe and is insertedthrough a 3.18 cm inlet. The three electrodes are set in an 3.18 cm O.D. tube. The exposed surface of theelectrode is flush mounted on the pipe wall. The working electrode area exposed is 0.7854 cm 2.Current andvoltage measurement across the probe are measured wiih zero resistance ammeter (ZRA) that can sample
27613

at rates up to 1000 Hz. The ZRA is connected to a micr,]computer. The data is logged and analyzed using
software provided with the ZRA.
The design and set-up of EIS/LPR probe are same a: that of ECN probe except the material of oneelectrode is carbon steel as working electrode and otk two are stainless steel as counter electrode andreference electrode respectively. The potential and impedance are measured and the data is logged andanalyzed using the same microcomputer.
The system temperature and pressure are maintained contant at 40 ‘C and 136 kpa for all experiment.s. The
test me performed using 3’% ASTM standard salt-water. The experiment are conducted for fill pipe liquid
flow and slug flow. Liquid velocities of 0.5,0.75, 1.1, and 1.5 rnAec are used for full pipe flow whilst slugflow experiments are conducted at Froude numbers of 4,6 and 9. These correspond to slug velocities of2,3 and 4.5 rnls respectively. The gas used is carbon dioxide. ECN and EIS/LPR measurements are takenat each set of conditions.
RESULTS AND DISCUSSION
Em
Full pipe flow
Figure 4 shows voltage and current fluctuations obtained from the ECN for a liquid velocity of 1.1 rdsecin full pipe flow after 4 hours of operation at a sampling rate of 20 Hz. Random fluctuations around a meanare seen in the voltage and current response and the response is similar to that obtained by Hladky andDawson(l 986)s and Deva (1995)9. They interpreted th,: fluctuation around a mean as uniform corrosion.
Slug Flow
To understand the corrosion mechanism and the effect of bubbles within slugs that impact on the pipe wall,noise data is recorded by keeping slugs stationary. Here the intermittent pulses of bubbles within the slugimpact on the electrode surface.
Typical ECN response to slug flow is shown in Figure 5 This is for slugs with a Froude number 6 whichcorresponds to a slug velocity of approximately 3 rds. Here data is recorded at a rate of 50 Hz. Theresponse is different to that observed in full pipe flow. Characteristic transients are observed in the currentfluctuations, but not seen in the voltage fluctuations. These transients represent impacting pulses ofbubbles at the front of slug, as shown by Gopal et al ( 1995)’5.
The sampling rate for ECN is very important when studying slug flow. Usual instruments can only sampleup to a few Hz and much of the transient characteristics of the flow are omitted. This study, which hasexamined the flow at different sampling rates, shows that the sampling rate should be between 100 and 500Hz depending on the Froude number (or velocity) of the slugs. TMs is described in detail later.
Frequency Response
276/4

Parameters typically studied in the potential spectrum are the low-frequency cut-off, roll-off slopes andpeaks in the potential noise spectrum. There are relation; between these ‘parameters and the corrosion typeand mechanism. The amplitude is calculated by a Fast Fourier Transform algorithm in mV/Hz”2 or indB/Hz’n. The reference voltage has been taken as 1V. Tt.e slope is calcrdated in mV/decade or in dB/decadeby taking the drop in this amplitude over a decade of frequency.
Figore 6 describes the potential noise spectra of for liquid velocity of a 1.1 m/see full pipe flow at samplingrate of 20 Hz. The figure shows roll-off vrdues of -31 dB/decade. These correspond to uniform corrosionas shown by Searson andDawson(1988)6 andDeva(1995)9.
Figure 7 shows the potential noise spectra for slug flow I’roude number 6 at a sampling rate of 50 Hz. Thisfigure shows roll-off slope of -14.8 dB/decade, Searson and Dawson (1988)6andDeva(1995)’ have shownthat shallow slopes less than -20 dB/decade are characteristic of pitting corrosion.
The peaks in the spectmm correspond to characteristic fluctuations in the flow. The peaks between 0.1 Hzto 1 Hz, which are found both in Figure 6 and Figure 7, me interpreted as the characteristic of Fast FourierTransforms byDeva(1995)’7. Figure 8 shows that the potential spectra for slug flow at a sampling rate100Hz. Compared to Figure 7, which is obtained at the completely same experimental condition, asignificant number of peaks between 1 to 10 Hz are now observed at the higher sampling rate. Analysisof simultaneous video recordings of flow in the test sec:ion has shown that pulses of bubbles impact theelectrode every 3-4 per second for Froude number 6 in s’.ugflow. These peaks are probably related to thepresence and behavior of the pulses of bubbles and their interaction with the electrode surface. Moreexperiments are being carried out by the authors.
MS
Figure 9 is the impedance spectrum results from EIS for a liquid velocity of 0.75 rn/sec after 4 hoursoperation. The experimental and fitted impedance spectra are superimposed in the same figure. The spectrahave been fitted to a one-time-constant model to obtain :he polarization resistance, Rp, capacitance C andthe parameter a, which has been used to account for the deviation from ideal capacitive behavior. One timeconstant impedance spectrum indicates that there was :10measurable corrosion products built up on themetal surface.
The impedance spectrum results of EIS for Froude number 6 stationary slug flow after 4 hours operationis shown in Figure 10 The fitting parameters using one-time-constant model are obtained again Acomparison between till pipe flow and slug flow for the same superficial liquid velocity shows that the Rpfor slug flow (163 ohm) is lower than that for full pipe ~low (2440hm).
It can be noted that EIS can be used for slug flow and does give averaged values of corrosion rate. However,it does not provide information on the transients present. in the flow.
COMPARISON BETWEEN ECN AND EIS METHOD FOR CORROSION RATE
276/5

Figures 11and 12 compare the corrosion rates calculated using EIS, LPR and electrical resistance (ER) forfull pipe flow and slug flow. It cm be seen that EIS, LPR and ER do follow the same trend with corrosionrate increasing with increase in liquid velocity and/or Frfmde number. However, the corrosion rate for LPRis not as stable as that for ER and EIS. This probably r>sults from the limitations of this technique. It isknown that linear polarization can only measure genera1corrosion rates but can not be used to determinethe corrosion rate for localized corrosion such as pittin$;or crevice corrosionl”. So at high corrosion rate,such as for Froude number 9 slug flow, the LPR result .s not as stable as other techniques, due to pittingcorrosion occurring in thk case.
The corrosion rates measured by EIS were consistently approximately 0.75 -1.0 mrrr/yhigher than thosetaken from ER probes. For example, The corrosion rates for EIS increase from 1.88 to 2.13 mm/y as theliquid velocity is increased from 0.4 to 1.5 rnk The corresponding values for LPR and ER are 1.75 to 2,45and 0.75 to 1.25 mm/y respectively.
For slug flow, the ER corrosion rates increase from 1.2 to 2.5 mmly as the Froude number of the slug isincreased from 4 to 9. The corresponding EIS values increase from 2.25 to 3.38 mr-dy respectively. TheLPR results seem to present reasonable corrosion rates al low Froude numbers but give very high values atthe higher Froude numbers.
Figures 13 and 14 show the comparison of the corrosion rate measured by ECN and ER for full pipe flowand slug flow respectively. The Rn for ECN impedance is defined as the ratio of the RMS of the corrosionpotential fluctuation W to the RMS of the current fluctuation 61. A very good agreement between ECNand ER has been observed. For full pipe flow, the corrosion rates from ECN are slightly larger than theER at the higher velocities. These are still within the experimental error as shown. It is seen from Figure14, that the corrosion rate for ER and ECN at Froude number 6 are very close at 1.45 and 1.58 mrdyrespectively.
SAMPLING RATE
Figure 15 is the potential amplitude spectra for Froude rwrnber 6 stationary slug flow at 500Hz. Comparedto Figure 7-8, Figure 15 shows far more detail of flow regime. The effect of data sampling rate on the ECNsignal has been demonstrated by Webster and Green (1$193)8.The data sampling rate must be at least at afrequency an order of magnitude greater than the frequency of the perturbing effect, otherwise a significantamount of details are missed. The group of peaks is found in potential noise spectrum for slug flow in the1-10HZ frequency domain. Interpreting these peaks by high frequency ECN is the future work of theauthors.
CONCLUMONS
The ECN technique is able to detect changes in flow regime. The ECN signal showed distinct differences
between fill pipe flow and slug flow. The group of peaks are found in spectrum response for slug flow byhigh sampling rate in the 1-10HZ tlequency domain. These peaks are probably related with pulse behaviorsof bubbles.
276/6

The effect of data logging rate on the ECN signal has been demonstrated. The sampling frequency for ECNis very important especially for slug flow. The tlequenc~ should be between 100 and 500 Hz depending onthe slug Froude number, This work used the ZRA with m ~chhigher sampling rate (up to 1000 Hz) than mostavailable ECN instnunents.
EIS can be used for examining corrosion in slug flows but it cannot provide information on the transientsencountered in slug flow. Corrosion rates determined by ECN, LPR, ECN and ER exhibit the same trendsand show an increase in the corrosion rate with liquid flow rate for full pipe flow and Froude number forslug flow. LPR was less stable than the others. Corrosion rate for ECN is very close to the ER values butEIS and LPR results are consistently 0.75- mm/y greater than that of ECN or ER,
These show ECN can be a very powerful tool for corro;ion rate and corrosion mechanism in multiphaseflow when the proper sampling rate is selected.
ACKNOWLEDGMENTS
The technical guidance and help of Dr. Huey J. Chen of Chevron PTC is hereby gratefrdly acknowledged,
REFERENCES
1. Lee, A-H, Sun J-Y and Jepson,W.P., “Study of Flow Regime Transition of Oil-Water-Gas Mixture inHorizontal Pipelines”, 3rd Int. Proc. ISOPE,VO1.11.(19’J3):P. 159.
2. Green,A.S.,Johnson, B.V.,and Choi,H.J., “Flow Relation Corrosion in Large Diameter MultiphaseFloeline”, SPE paper 20685, (Houston, Tx:SPE 1989).
3, Zhou,X., and Jepson, W. P., “Corrosion in Three-phase OiUWater/Gas Slug Flow in Horizontal Pipes”,Corrosion Paper no.94026, (Houston, TX: NACE International, 1994).
4. Vuppu,A. K., and Jepson, W. P., “Study of Sweet Corrosion in Horizontal Multiphase, Carbon SteelPipelines”, Offshore Technology Conference, 7794/265-7494/276, (Houston,TX:SPE 1994).
5. Iverson,W. P., “ Transient Voltage Changes Produced in Corroding Metals and Alloy”, J. Electrochem.SOC.,115,617,1968.
6. Hladky, K.,rmdDawson, J. L. “The Measurement of Localized Corrosion Using Electrochemical Noise”,Corrosion Science, 21 ,(1981) :P.317.
7, Eden, D.A.,and Rothwell, A.N., “ Electrochemical Noise Data: Analysis, Interpretation andPresentation”, Corrosioti92, Paper no.292, ( Houston, TX: NACE International, 1992).
8. Webster,AS. et.al., ” The Application of the Electrochemical Noise Techrique for Corrosion MonitoringUnder Multiphase Flow Condition”, First International Symposium on Electrochemical Noise Measurement
27617

for Corrosion Applications, Montreal, Canada, Paper 2:l,May 16-17, 1994.
9. Deva, Y.K., and Jepson, W. P. “Use of Electrochemixd Noise to Monitor Muhiphase Flow Corrosion”,Corrosion/96, Paper no.337, ( Dever, Co: NACE Intem~tional, 1996).
10. Tait, W, S., “ An introduction to Electrochemical I;orrosion Testing for Practicing Engineering andScientists”, P. 79, 1994.
11. Chechirlian, S., Keddam, M., and Takenouti, H., ” Special Aspects of Impedance Measurements in LowConductivity Media,’ Electrochemical Impedance: zlmm’ysis and Interpretation, ASTM STP46781188.
12. Mansfeld, F., Shil, H. Greene, H. And Tsai, C. H. “ Analysis of EIS Data foe Common CorrosionProcesses,” Electrochemical hnpedance: ~nalysis and .Jrrterpretation , ASTM STP 1188.
13. Chen, H,, “ Evaluation of Commercial Coating b) EIS” ,Corrosiorr/94, Paper no.437, ( Co: NACEInternational, 1994).
14. Chen, H., “ Evaluation of Oil Field Corrosion Inhibitors by EIS” , Corrosion/94, Paper no.32, ( Co:NACE International, 1994).
15.Gopal,M., Kaul,A., Jepson,W. P., “Mechanism Contributing to Enhanced Corrosion in Three Phase SlugFlow in Horizontal Pipes’’,Comosiorr/95,Paper no. 105, (Co: NACE International ,1995).
16,Jepson,, W. P. , “The flow Characteristics in Hotizcntal Slug Flow”, 3rd International Conference onMultiphase Flow, Hague, Netherlands, 18-20 May, Paper F2, 1987.
17, Dave.,Y., Jepson., W, P., “Slug Flow Induced Corrosion Studies Using Electrochemical NoiseMeasurements”, Ohio University Thesis, 1995.
276/8
TI
0.006 m3/aec&
SOmm PVCP@
c:Sack Pressww
75mm1.D910 m Ptexlglass Pipe
steelG!* M$:h~~ti
n
e-
Stainim steel Pump23 kW
Ortflce Meter
Figure 1. Schematic layout of experimental flow system
/0-””’Flange
II:4WULFlange B FLOW DIREcTIoN n
FIMI* Flange B
o- –Uu
-JJF
:7’C%J 4Lq ‘
Center
ti~ngHole
IA
A. CORMON PROBE (3 Electrodes of lcm diameter set into a 3.2 cm tube)B. ER PROBES (3.2 cm diameter)C. LPR PROBE (3.2 cm diameter)D. PRESSURE TAPPINGS (2 cm diameter X 2 cm thickness htock with 0.32 cm hole)E. DIGITAL THERMOMETER PROBE (0.32 cm Probe dtameter)F. SHEAR STRESS PROBES ( 2 em dhmeter X 5 cm thkk block with 0.32 cm hole)G. SAMPLING PROBE (0.S cm diameter)
Figure 2. Test section

1:TEST SECTION
1 I
Auto ZeroResistance.Ammeter -
mMicroprocessor
A. Working Electrode 1B. Working Electrode 2C. Reference Elecbmde
h , ,
1
Ill111111
d111111
111111
111111@-l
w’wl-
W I
3 Electrodes(2 working and1 Reference)
Compremion Nttings todfO”W lip find dotimovement of electrode
Probe pin coupledto Auto ZRA
Figure 3.1 Data logging section Figure 3.2. Enlarged view of tbe noise probe

3
2.9
~ 2.8
~2.7
~ 2.6
2.5
2.4
0 10 20 30 40 50Time (seconds)
0.0765
0,076
~o,0755
~ 0.075
~t 0.0745z
0.074
0.0735
0 10 20 30 40 50Time (seconds)
Figure 4. Voltage& current noise response for 1.1 mls full pipe flow .
Sampling rate =20 Hz.
276112

6
5.9
5.8
957g“
; 5.6=$! 5.5
5,4
5.3
5.2
0 10 22 30 40 50Time( seconds)
0.0475
0.047
~ 0.0465
k~ 0046
~ 0.0455
~ 0.045
0.0445
0.044
0 10 23 30 40 50Tme (seconds)
Figure 5. Voltage& current noise response for Froude No. 6 slug flow.
Sampling rate =50 Hz.
276/1 3

mV.HzY21 I I I I I I I I
1.OE-04 –
1.OE-05 –
1.OE-06 : I I I I I I
1.OE-01 1.OE+OOFrequency Hz
Figure 6. Potential amplitude spectrmm for 1.1 m/s full pipe flow.Sampling rate *2O Hz.
276114

i
Ii
LOE-05
-h
1.OE-06 T
1.OE-07 ~
I I I I I 1111 I I I I L
1.OE-01 1.OE+OO 1.OE+O1Frequency Hz
Figure 7. Potential amplitude spectrum for Froude No. 6 stationary slug flowSampling rate~50Hz.
276/15

1.OE-05
i
[ I Ill ~ 111 ~ 1 1II1.OE-01 1.OE+OO l.OE+Ol
Frequency Hz
Figure 8. Potential amplitude spectrum for Froude No. 6 stationary slug flowSampling rate= 100Hz.
276116

Potentiostatic EIS‘fpm7-3e.dta” 8/2/1996-12 :27:’18
1.40
VI
Io.m
2m + Ow
2.Mt
.10coFlw~ T .m.m~.Imt: .m.m :
xlatz
Lylmj.40.m g
1W4-mm
Ocu+
a.m
060~~ .70.KI.2.DI -I,tm 0.03 1.03 2.w 3.m 4.m
L-Pm (Hz)
End Frequenw: 0,02 Hz
DC Pot.: O V
AC Pot,: 10 mV(rms)
(Area 0.7854 m12I,(W,W 7.,, gnl,m,, ,7,, ,,mau,.
~
Results
RP = 2,441 E+02 * 6.153 E-01
l::%s::%%0AIPha . 8.446E~1 + 1.131 E-03
Potentiostntic EIS“fpm7=3e.dta’8121b996-12:27:lS
.2C.JE+04 ~~
O.WEWQ 5,1.3E+01 1.COE+OZ 1.50E+02 2. COEW2 2.5QE+L12
R,B1 (Ohm)
Figure 9. The impedance spectra of ~IS for 0.75 m/s full pipe flow
27611?

PotentiostaticEIS‘sf6-04e.dta”9/17/1996-13:15:23
2,40
Ml
.5.w●
220
I
.Io.m
2.CO .15,W
F lea-2003
& .Z.m x~ 1.M
E..?am -
ilatz, .35m ~
g 1.273t-40.03
Ica + .45.93
Omt
.5mx
Oeu J 55.m
.2.m .*w o.m 1.m 2.w 3.m 4.m
,,, Fremmcw 5000 HZ
$ Frwumcv 0.02 HzP.!.: o v
P.,.: 10 rnv,,,m,
,a 0.7854 cm2
ct(ode 7.86 wknt?, 27.9 @wv.dtlon’n#. OFF
I.W W, 300 s
tea
,.1,s
- , .630 E+02 , 4.700 E.01
= 6.697E+O0 * 1.693E.02
= 1.091 E+03 i 7.070E+O0
,hd - 8.01 8E4t * 1.364E-03
Potentiostatic EIS‘sf6-04a.dta” S/17/1998-13:15:23
8, CJ3E+OI
~~
5,03E+01 + ●
●403E+0, {
z
6~
●
; 3.D3E+01
E
‘~ ●. ●
.2.ME.04 ,
1.33E.01
O,COE+Ol L
OWE+ 2.WE+ 4.Q3E+ 6,W+ 8. WE+ 1.I$IE+ 1.20E+ 1.40E+ ?.WE+ I. WE+
WO1O1O1O1I2 02 D2U202
Real (Oi%m)
Figure 10. The impedance spectra of EIS for Froude No. 6 stationary slug flow
276118

L
1.80 k
1.20
0.60 E
moo ~~
0.00 0.40 0.80 1.20 1.60 2.00
velocity, mlsec
Figure 11. Comparison of corrosion rate among LPR ,EIS, ER for full pipe flow
Figure 12. Comparison of corrosion rate among LP~ EIS, ER for slug flow
27S/19,

2.50 1 1 1 I
$2.00 :
=
; 1.50 :
&
.: 1.00 -
89
Tm T80 0.50 -
u
0.001 1 1 1
0.00 0.40 0.80 1.20 1.60 2.00
velocity, rrdsec
Figure 13. Comparison of corrosion rate betweenER and ECN for full pipe flow
Froude Number
Figure 14. Comparison of corrosion rate between ER and ECN for slug flow
276/20

mV.HzY2
oE-’’,rw
\
1.OE-06 :
1.OE-07 :
1.OE-08 :
I I I I I Ill I I I I L
1.OE-01 1.OE+OO 1.OE+OlFrequency Hz
Figure 15. Potential amplitude spectra for Froude number 6 stationary slug flowSampling rs,te=500Hz.
276121