comparison of disc analysis algorithms provided by cirrus oct and stereo optic-disc photography in...
TRANSCRIPT

2013
Current Eye Research, 2013; 38(5): 605–613! Informa Healthcare USA, Inc.
ISSN: 0271-3683 print / 1460-2202 online
DOI: 10.3109/02713683.2013.769059
ORIGINAL ARTICLE
Comparison of Disc Analysis Algorithms Provided byCirrus OCT and Stereo Optic-disc Photography in
Normal and Open Angle Glaucoma Patients
Marvin Lee, Hyungyu Yoo, and Jaehong Ahn
Department of Ophthalmology, Ajou University School of Medicine, Suwon, Korea
ABSTRACT
Purpose: To compare optic nerve head (ONH) parameters obtained by semi-automated disc analysis of stereooptic-disc photography (ODP) with those by spectral domain optical coherence tomography (SD-OCT)regarding their reproducibility, agreement and relationship with the retinal nerve fiber layer (RNFL) thickness.
Patients and methods: In this cross-sectional retrospective study, 91 eyes (50 normal and 41 with open angleglaucoma) from 47 patients were examined. ONH parameters were obtained by ODP and SD-OCT. Agreementand reproducibility were assessed by intra-class correlation coefficients (ICCs). Inter-device agreement andprecision were also evaluated. The structural factors related to the ONH measurements by both instrumentsand the disparity between the measurements were evaluated by the generalized estimating equation model.
Results: ODP showed good intra-reader and inter-reader reproducibility, comparable to that of SD-OCT (ICC:40.970). Disc area (DA) (ICC: 0.950) showed better inter-device agreement than rim area (RA) (ICC: 0.859).RNFL thickness was correlated with RA, but not with DA, for both devices. SD-OCT RA showed significantcorrelation with RNFL thickness in both the normal and glaucoma groups, whereas ODP RA correlated withRNFL only in the glaucoma group. The measurement disparity between the devices was influenced by the DAin both groups. The inter-device difference in RA was not correlated with RA, but instead with the RNFLthickness in the glaucoma group.
Conclusion: ONH parameters obtained by semi-automated algorithms of ODP showed excellent reproducibilityand good agreement with those measured by SD-OCT. SD-OCT RA was a better indicator of RNFL thickness,compared with ODP RA for both normal patients and glaucoma patients; however, the inter-device disparity ofthe RA was less in glaucoma patients who had a thinner RNFL.
Keywords: Optic disc photography, optic disc size, optic nerve head parameters, optical coherence tomography,retinal nerve fiber layer measurement
INTRODUCTION
Evaluating the optic nerve head (ONH) is anessential step in diagnosing and monitoring glau-coma, and has been performed by ophthalmoscopicexamination or stereo optic-disc photography (ODP).ONH parameters, including the cup-to-disc (CD)ratio and the rim area (RA) have been widely used toquantify the anatomic features of ONH and todiagnose glaucomatous ONH. However, the use ofONH analysis alone for the diagnosis and
monitoring of glaucoma has been shown to havelow-to-medium inter-observer agreement, evenamong glaucoma specialists.1,2 The diagnosis canalso be difficult due to the wide variations in ONHanatomy in both normal and glaucomatous eyes. Incontrast, ONH analysis using Heidelberg RetinaTomography (HRT) and spectral domain opticalcoherence tomography (SD-OCT) has been reportedto have excellent reproducibility and diagnosticability comparable with retinal nerve fiber layer(RNFL) parameters. Therefore, these devices are
Correspondence: Jaehong Ahn, MD, Department of Ophthalmology, Ajou University School of Medicine, San 5, Wonchon-dong, Yeongtong-gu, Suwon 443-729, Korea. Tel: 82-31-219-5260. Fax: 82-31-219-5259. Email: [email protected]
Received 19 July 2012; revised 11 December 2012; accepted 15 January 2013; published online 27 February 2013
605
Cur
r E
ye R
es D
ownl
oade
d fr
om in
form
ahea
lthca
re.c
om b
y U
nive
rsity
Lib
rary
Utr
echt
on
10/0
8/13
For
pers
onal
use
onl
y.
widely used for monitoring structural changes in theONH of glaucoma patients.3,4
Previously published studies using stereophoto-graphs to evaluate ONH parameters have focusedmainly on improving reproducibility and inter-observer agreement by analyzing stereophotographsusing extra image-processing equipment.4–7 Sharmaet al.4 compared the ONH parameters obtained by SD-OCT with planimetric analysis of ODP. SD-OCTshowed good agreement with ODP as analyzed by aglaucoma specialist and exhibited higher intra-devicereproducibility than ODP. AFC-210 (NIDEK, Aichi,Japan), an advanced ODP that can measure ONHparameters using intrinsic semi-automated disc ana-lysis algorithms (NAVIS-Lite, Software Version 3.1.2.0:Nidek Inc., Fremont, CA), was investigated in ourstudy. Unlike other planimetric parameters, ONHparameters are calculated and displayed automatic-ally after a reader marks several points on the outerand inner margins of the neural rim (see Methodssection).
In this study, we evaluated the reproducibility andaccuracy of semi-automated ONH analysis algorithmsof AFC-210 ODP by comparing the results with thoseobtained from automated optic disc analysis of SD-OCT. Additionally, the relationship between RNFLthickness and ONH parameters measured by bothdevices was investigated in normal patients andglaucoma patients. We also assessed the structuralfactors influencing measurement disparity betweenthese devices in both normal and glaucoma patients,because both the optic disc dimension and theglaucomatous change of the ONH may influenceONH and RNFL measurements8,9 and the measure-ment difference between the devices.4
MATERIALS AND METHODS
In this cross-sectional retrospective study, the medicalrecords of the patients who visited the glaucoma clinicat the Department of Ophthalmology, Ajou UniversityHospital from January to December 2011 werereviewed. The present study conformed to theDeclaration of Helsinki and was approved by theInstitutional Review Board of Ajou UniversityHospital.
In total, 180 eyes from 91 patients were reviewedusing the medical records. Patients were from 18 to 80years of age. All subjects has undergone comprehen-sive ophthalmologic examinations, including a reviewof their medical history, best-corrected visual acuity(BCVA), slit-lamp biomicroscopy, central cornealthickness (CCT; DGH-500, DGH Technology, Exton,PA), spherical equivalent (SE) of refractive error,intraocular pressure measured by Goldman applana-tion tonometry, gonioscopy, dilated fundoscopicexamination and automated perimetry (HFA; Carl
Zeiss Meditec, Dublin, CA) using the Swedish inter-active thresholding algorithm standard 24-2 strate-gies. ODP (AFC-210; NIDEK, Aichi, Japan) and SD-OCT (Cirrus OCT; Carl Zeiss Meditec, Dublin, CA)were repeated twice for each eye on the same day.Only reliable visual field (VF) tests (525% fixationloss, false negatives and false positives) were includedin our analysis. The pupils were not routinely dilatedduring SD-OCT imaging, but were dilated withtropicamide (0.5%) when the pupil size was toosmall to obtain good quality images. OCT images,showing good centration and signal strength (�7)were included in the analysis. Subjects who had aBCVA of less than 20/40 and ocular or systemicdiseases other than glaucoma that could affect theoptic nerve or VF were excluded. None of the patientshad undergone ocular surgery, such as cataract orrefractive surgery, or laser treatment to controlintraocular pressure. Eyes with severe myopic degen-eration, severe peripapillary atrophy (PPA), or anoptic disc anomaly such as optic disc coloboma, tiltedoptic disc syndrome, optic disc drusen, optic discedema or optic nerve hypoplasia were also excluded.To minimize the error from refraction, patients havinga SE of over þ6.0 D and under �6.0 D were excludedfrom the final analysis. None of our subjects hadastigmatism over 3.0 D for any axis.
Finally, 91 eyes from 47 patients were enrolled inour study. Of the 91 eyes, 41 were diagnosed asnormal tension glaucoma or primary open angleglaucoma (OAG) by standard automated perimetryand red-free fundus photography. None of our glau-coma patients had uveitis, pseudoexfoliation syn-drome, or neovascularization due to ischemic retinaldisease. There were 50 eyes without glaucomatous VFdefects, RNFL defects on red-free photography, andabnormal SD-OCT findings; these subjects wereassigned to the normal group.
Two different readers, one more experienced (R1,[ML]) and one less experienced (R2, [HY]), separatelytraced the ODP. The ODP images were viewedstereoscopically, and each reader marked the outlineof the optic disc and cup. At least 15 points weremarked to give an accurate outline, and then acomplete circle was drawn automatically using theintrinsic software. Finally, the disc area (DA), RA, cuparea (CA), CD ratios, and CD area ratios werecalculated automatically (Figure 1). Each readerrepeated the same process three times, and theaverage values were compared to evaluate agreementbetween the readers. R1 repeated the same procedureto estimate the intra-reader reproducibility.
An automated three-dimensional segmentationalgorithm was used to process the data acquiredfrom Cirrus OCT. The optic disc edge was determinedby the termination of Bruch’s membrane, forming acircular opening around the ONH. The area of theopening in Bruch’s membrane was considered the DA.
606 M. Lee et al.
Current Eye Research
Cur
r E
ye R
es D
ownl
oade
d fr
om in
form
ahea
lthca
re.c
om b
y U
nive
rsity
Lib
rary
Utr
echt
on
10/0
8/13
For
pers
onal
use
onl
y.

The internal edge of the neuroretinal rim was definedby the continuation of the points at which the innerlimiting membrane meets the neural canal. The areabetween the optic disc edge and the neural rim edgewas defined as the neuroretinal RA. The CA wascalculated by subtracting the RA from the DA.3
Statistical analyses for reproducibility by the samereader and among different readers, as well asagreement between the two different devices, wereperformed by the method described by Bland andAltman using MedCalc software (Version 8,Mariakerke). The intra-class correlation coefficients(ICCs) were calculated using SPSS ver. 20.0 (SPSS,Inc., Chicago, IL). Agreement between the two deviceswas verified. The precision of ONH analysis of ODPwas compared with the established SD-OCT param-eters and precision values of the normal and OAGgroups were also compared. In this case, precisionrefers to the relative agreement between repeatedmeasurements, determined using the methoddescribed by Cecconi et al.10 and Mutoh et al.11 Toanalyze the correlation between ONH and RNFLparameters, we used the generalized estimatingequation (GEE) model with SPSS 20.0 for relatedsamples because both eyes of the same patient werestudied in most cases. GEE also was adopted toinvestigate the correlation of ONH or RNFL
parameters with ONH measurement disparitybetween the two devices. For all statistical analyses,p values 50.05 were considered to be statisticallysignificant.
RESULTS
The mean age of the patients was 46.6 years, and themale to female ratio was 25/22. The ONH parametersas measured by ODP and SD-OCT in the normal andOAG groups are summarized in Table 1. All of theRNFL parameters measured by SD-OCT were signifi-cantly lower in the glaucoma group. The DA and RAfrom ODP were significantly larger than those ofSD-OCT (mean difference: 0.32 mm2, p50.001; and0.34 mm2, p50.001, respectively), whereas the CA wasnot significantly different (mean difference:�0.01 mm2, p¼ 0.753) (Table 1).
Considering all of the ONH parameters, semi-automated analysis of ODP showed good intra-readerreproducibility (ICC: 0.995� 0.997) and inter-readeragreement (ICC: 0.977� 0.997) (Table 2), which werecomparable with the reproducibility of the ONHanalysis by SD-OCT (ICC: 0.975� 0.995). The inter-device agreement between SD-OCT and ODP wasgood, almost equal between the more experienced
FIGURE 1. ONH analysis by AFC-210 stereo ODP using intrinsic semi-automated disc analysis algorithms (NAVIS-Lite). (A) A readermarks outlines of the optic disc. (B) The complete circle was drawn automatically by the intrinsic algorithms after the final pointinghad been made. (C) A reader marks the outlines of the optic cup. (D) Vertical and horizontal diameters and areas of the optic disc andcup, vertical and horizontal CD ratio and cup-to-DA ratio were automatically calculated by intrinsic algorithms of ODP.
Comparison of Disc Analysis Algorithms 607
! 2013 Informa Healthcare USA, Inc.
Cur
r E
ye R
es D
ownl
oade
d fr
om in
form
ahea
lthca
re.c
om b
y U
nive
rsity
Lib
rary
Utr
echt
on
10/0
8/13
For
pers
onal
use
onl
y.

(ICC: 0.859� 0.960 with R1) and less experienced(ICC: 0.841� 0.954 with R2) readers. To enhance thereliability of our data, we repeated the process threetimes, and the average values were used for the ODPreading. Because it is a time-consuming procedure,we evaluated the same analysis using a single meas-urement. The intra-reader (ICC: 0.975� 0.992) andinter-reader (ICC: 0.969� 0.991) reproducibility wereslightly diminished but still reliable; however, theinter-device agreement (ICC: 0.859� 0.955 with R1and ICC: 0.838� 0.953 with R2) showed no significantchange (Table 2).
The ONH parameters, measured using semi-auto-mated analysis algorithms by ODP, showed goodagreement with those measured by SD-OCT. The CAshowed the best agreement (ICC: 0.957), followed by
the DA (ICC: 0.950), the VCD ratio (ICC: 0.930) andthe RA (ICC: 0.858) (Table 2). Precision comparisonanalysis of all ONH parameters showed good agree-ment between devices. There were no differencesbetween the OAG and normal groups (Table 3).
The average RNFL thickness was not significantlycorrelated with the DA measured by the devices. ODPRA showed a positive correlation with RNFL thick-ness in the glaucoma group (p50.001, GEE), but notin the normal group. SD-OCT RA was positivelycorrelated with RNFL thickness in both the normaland glaucoma patients (p50.001, GEE) (Table 4).
The DA values obtained by ODP were significantlylarger than those by SD-OCT (Table 1). The measure-ment difference of the DA between devices increasedwith increasing mean DA (average of ODP DA and
TABLE 2. Reproducibility and agreement of ONH parameters.
Mean differences 2SD LOA ICC ICC with single ODP examination
DA ODP R1-R1 0.01 0.11 �0.10–0.11 0.997 0.990ODP R1-R2 0.03 0.12 �0.08–0.15 0.997 0.991ODPR1-OCT 0.33 0.37 �0.04–0.70 0.950 0.945ODPR2-OCT 0.30 0.36 �0.07–0.66 0.952 0.953OCT1-OCT2 0.01 0.24 �0.23–0.25 0.975 0.975
CA ODP R1-R1 0.01 0.10 �0.09–0.11 0.997 0.992ODP R1-R2 0.13 0.22 �0.09–0.35 0.987 0.969ODPR1-OCT �0.01 0.40 �0.41–0.40 0.960 0.955ODPR2-OCT �0.14 0.43 �0.57–0.29 0.954 0.951OCT1-OCT2 0.00 0.15 �0.15–0.16 0.995 0.995
RA ODP R1-R1 0.00 0.13 �0.13–0.13 0.993 0.975ODP R1-R2 �0.10 0.23 �0.33–0.14 0.978 0.984ODPR1-OCT 0.34 0.50 �0.16–0.84 0.859 0.859ODPR2-OCT 0.44 0.52 �0.19–0.96 0.841 0.838OCT1-OCT2 0.01 0.13 �0.13–0.14 0.989 0.989
VCD ODP R1-R1 0.01 0.04 �0.04–0.05 0.995 0.983ODP R1-R2 0.04 0.09 �0.06–0.13 0.977 0.974ODPR1-OCT �0.01 0.13 �0.14–0.12 0.951 0.927ODPR2-OCT �0.05 0.15 �0.20–0.11 0.935 0.931OCT1-OCT2 0.00 0.05 �0.05–0.05 0.993 0.993
TABLE 1. ONH and RNFL measurements of all subjects and subgroups.
All subjects(n¼ 91)
Normal(n¼ 50)
OAG(n¼ 41)
p Value betweenNormal and OAG
RNFL thickness (mm) Average 82.77� 17.29 92.14� 12.30 71.34� 15.60 50.001Temporal 63.55� 15.21 67.52� 11.55 58.71�17.70 0.005Superior 105.63� 27.50 119.22� 20.47 89.05� 25.98 50.001Nasal 61.63� 9.92 64.22� 9.98 58.46� 8.99 0.019Inferior 100.43� 28.66 117.74� 20.74 79.32� 22.12 50.001
ODP DA (mm2) 2.49� 0.49 2.44� 0.48 2.54� 0.49 0.612CA (mm2) 1.17� 0.50 0.94� 0.40 1.44� 0.47 50.001RA (mm2) 1.32� 0.40 1.50� 0.32 1.10� 0.40 50.001VCD 0.65� 0.15 0.58� 0.13 0.74� 0.11 50.001
SD-OCT DA (mm2) 2.17� 0.41 2.14� 0.38 2.21� 0.44 0.762CA (mm2) 1.1� 0.53 0.98� 0.49 1.41� 0.49 50.001RA (mm2) 0.99� 0.34 1.16� 0.30 0.80� 0.28 50.001VCD 0.66� 0.15 0.60� 0.14 0.74� 0.11 50.001
p value with GEEs model.
608 M. Lee et al.
Current Eye Research
Cur
r E
ye R
es D
ownl
oade
d fr
om in
form
ahea
lthca
re.c
om b
y U
nive
rsity
Lib
rary
Utr
echt
on
10/0
8/13
For
pers
onal
use
onl
y.

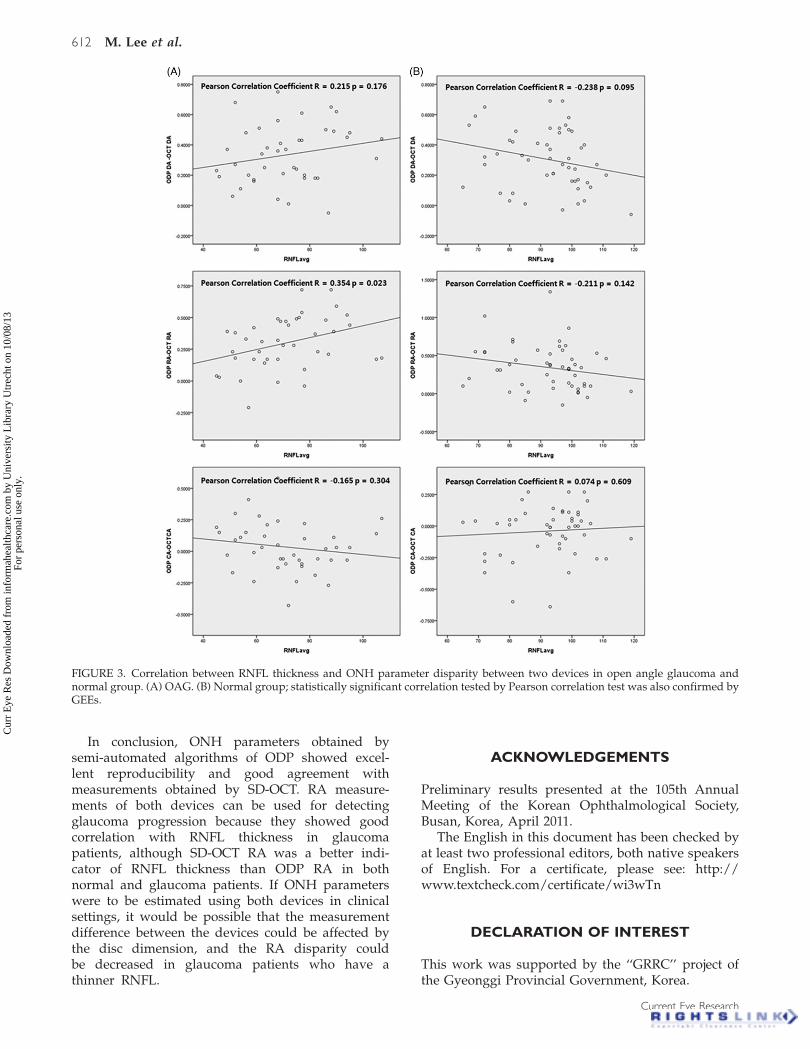
SD-OCT DA) for the normal group (p¼ 0.001, GEE),but not for the glaucoma group (Table 5, Figure 2).The RA by ODP was also larger than that by SD-OCT(Table 1), and the measurement difference of the RAbetween devices increased with increasing mean DAfor both the normal and glaucoma groups (p50.001,GEE). Additionally, the measurement disparity of theRA between devices was positively correlated withthe mean RA (average of ODP RA and SD-OCT RA)for the normal group (p50.001, GEE), but not for theglaucoma group (Table 5, Figure 2). The RA measure-ment difference between devices was significantlycorrelated with the average RNFL thickness for theglaucoma group (p¼ 0.012, GEE), but not for thenormal group (Table 5, Figure 3).
DISCUSSION
Careful observation of ONH and peripapillary RNFLchange is of great importance in the diagnosis andmonitoring of glaucoma.12,13 Optic disc hemorrhageand other parameters measured by ODP have beenused to diagnose and monitor glaucoma in previous
reports, such as the OHTS study.13,14 However, ODPanalysis showed low reproducibility and could notquantitate the ONH parameters. To overcome theselimitations, various types of planimetry have beenused to analyze the ONH parameters.4–7 The previousplanimetry-based disc analysis methods requiredadditional software and examiners to draw outlinesof the disc and the cup margin manually, but it isdifficult to draw exactly what is observed on thescreen. The NAVIS-Lite semi-automated ONH ana-lysis algorithm of the AFC-210 stereophotographysystem provides an easier method of ONH analysis asit calculates and displays ONH parameters automat-ically after an examiner has marked several pointson the outer and inner margins of the neural rim(Figure 1).
In this study, the ONH parameters measuredby both devices showed good reproducibility(ICC40.970). Reproducibility of the ONH parametermeasurements using SD-OCT was excellent (ICC:0.975� 0.997) and consistent with a previous report(ICC: 0.96� 0.99)4 which also showed that the intra-reader reproducibility of the planimetry analysis ofODP was highest for CA (ICC: 0.99) and lowest for RA
TABLE 3. Precision comparison between ONH parameters obtained by ODP and SD OCT.
All subjects (n¼ 91) Normal (n¼ 50) OAG (n¼ 41)
MD 2SD % Error* MD 2SD % Error* MD 2SD % Error*
DA 0.31 0.2 0.09 0.28 0.2 0.09 0.34 0.2 0.08CA �0.05 0.21 0.18 �0.1 0.22 0.24 0.01 0.2 0.14RA 0.36 0.27 0.23 0.38 0.31 0.23 0.34 0.22 0.23VCD �0.03 0.07 0.11 �0.04 0.07 0.12 �0.01 0.07 0.09
*% Error: a value less than 0.30 represents that two methods show good precision.
TABLE 4. Correlation between average RNFL thickness and ONH parameters measured by OPD and SD-OCT.
Pearson correlation test Hypothesis test by GEE
Group Correlation coefficient p Value p Value
Average RNFL thickness ODP DA Total �0.016 0.881 0.868OAG 0.202 0.205 0.177Normal �0.085 0.555 0.701
ODP RA Total 0.696 50.001 50.001OAG 0.748 50.001 50.001Normal 0.357 0.011 0.731
ODP CA Total �0.575 50.001 50.001OAG �0.390 0.012 0.028Normal �0.395 0.005 0.674
OCT DA Total 0.006 0.952 0.952OAG 0.134 0.405 0.405Normal 0.014 0.923 0.931
OCT RA Total 0.776 50.001 50.001OAG 0.754 50.001 50.001Normal 0.608 50.001 50.001
OCT CA Total �0.485 50.001 50.001OAG �0.312 0.047 0.129Normal �0.353 0.012 0.012
Comparison of Disc Analysis Algorithms 609
! 2013 Informa Healthcare USA, Inc.
Cur
r E
ye R
es D
ownl
oade
d fr
om in
form
ahea
lthca
re.c
om b
y U
nive
rsity
Lib
rary
Utr
echt
on
10/0
8/13
For
pers
onal
use
onl
y.

(ICC: 0.88). In our study, intra-reader reproducibilityof ODP was highest for DA (ICC: 0.997) and CA (ICC:0.997), and lowest for RA (ICC: 0.993). Also, ourresults indicated that the inter-device agreementbetween the ONH parameters of ODP and SD-OCTwas highest for CA (ICC: 0.960) and lowest for RA(ICC: 0.859). For both parameters, the agreement wasbetter than that cited in a previous report in which theICCs for CA and RA were 0.90 and 0.40, respectively.4
Precision comparison analysis showed good precisionwith low percentage error (�0.30) for all ONHparameters. The percentage error was lowest for DA(0.09) and highest for RA (0.23); there was nodifference in the percentage error between thenormal and glaucoma groups (Table 3). Althoughthe fundamental environment could be different ineach study, the reproducibility and inter-device agree-ment of RA measurements by semi-automated ana-lysis appeared to be superior to those by previousplanimetric methods.
In previously reported studies, there was a positivecorrelation between the optic disc size and RNFLthickness measured using Stratus OCT15,16 andSD-OCT.17 In contrast, Oddone et al.9 reported thatthe RNFL parameters measured by GDx-VCC orCirrus HD-OCT were either unaffected or affectedonly minimally by the disc size. Haung et al.18
reported that there was no association between theRNFL and disc size; although if there were someassociation, it would come from axial length effects.Our study also showed no association between theRNFL thickness and DA measured by both devices. Incontrast, the RA obtained by SD-OCT was wellcorrelated with the average RNFL thickness for bothnormal patients and glaucoma patients (Table 4),
which was consistent with previous reports.19,20
However, the RA measured by ODP showed signifi-cant correlation with the RNFL thickness only in theglaucoma group (Table 4). This suggests that the ODPRA is an acceptable ONH parameter, comparable tothe SD-OCT RA, for representing the RNFL thicknessand for monitoring glaucoma patients; however, innormal patients, SD-OCT RA showed a strongercorrelation with RNFL thickness compared withODP RA. RA is strongly influenced by DA innormal patients, but the influence of DA on RA isthought to be negligible when glaucomatous opticneuropathy progresses. Thus, RA is influenced mostlyby RNFL thickness in glaucoma patients, but isdependent on other structural factors, including DA,in non-diseased conditions.
Additionally, inter-device agreement and percent-age error of precision were lowest for RA among theONH parameters in this study (Tables 2 and 3).Therefore, we tried to find structural factors affectingmeasurement disparity between the devices. Ourresults suggest that compared with SD-OCT, ODPoverestimates DA and RA in patients with larger discs(Table 5 and Figure 2). As previously reported, thedifference in the disc border definition between thedevices is a possible cause of these discrepancies. Asthe disc size increases, the disparity between the discborders determined by each device will likelyincrease.4 Moghimi et al.21 reported that axiallength-corrected HRT DA measurements decreasedthe discrepancy between HRT and SD-OCT measure-ments of ONH parameters. The measurements bySD-OCT did not appear to be affected by the magni-fication correction formula. This suggests that theprinciple reason for the difference between HRT and
TABLE 5. Correlation of structural measurements with ONH parameter disparity between OPD and SD-OCT.
Pearson correlation test Hypothesis test by GEE
Group Correlation coefficient p Value p Value
mDA DA differences (ODP DA-OCT DA) Total 0.433 50.001 0.001OAG 0.307 0.051 0.067Normal 0.534 50.001 0.001
mDA RA differences (ODP RA–OCT RA) Total 0.627 50.001 50.001OAG 0.569 50.001 50.001Normal 0.707 50.001 50.001
mRA RA differences (ODP RA–OCT RA) Total 0.365 50.001 0.001OAG 0.213 0.181 0.204Normal 0.625 50.001 50.001
Average RNFLthickness
DA differences (ODP DA-OCT DA) Total �0.054 0.614 0.623OAG 0.215 0.176 0.216Normal �0.238 0.095 0.103
RA differences (ODP RA–OCT RA) Total 0.071 0.506 0.500OAG 0.354 0.023 0.012Normal �0.211 0.142 0.079
CA differences (ODP CA–OCT CA) Total �0.143 0.176 0.225OAG �0.165 0.304 0.279Normal 0.074 0.609 0.636
610 M. Lee et al.
Current Eye Research
Cur
r E
ye R
es D
ownl
oade
d fr
om in
form
ahea
lthca
re.c
om b
y U
nive
rsity
Lib
rary
Utr
echt
on
10/0
8/13
For
pers
onal
use
onl
y.

SD-OCT measurements is the lack of adequate cor-rection for the magnification with HRT. Therefore, thecorrection factors for magnification adopted by ODPas well as different disc margin definition may explainthe discrepancy between the ODP and SD-OCTmeasurements of ONH parameters.
In this study, the RA difference between devicesdecreased with decreasing mean RA in the normalgroup, but it was not correlated with the mean RA inthe glaucoma group. In contrast, the RNFL thicknesswas significantly correlated with the RA difference inglaucoma patients, but not in normal patients. Thus,the measurement disparity of RA is dependent on thevalue of the RA, which is determined mainly by DA innormal patients. However, in glaucoma patients, thedifference in the RA measurements did not appear tobe dependent on the RA dimension, but appeared to
decrease with a decrease in the RNFL thicknessrelated to glaucoma progression (Table 5 andFigure 3). It may be that the glaucoma-inducedstructural changes of the ONH can alter the geometricrelationship between the outer and inner borders ofthe neuroretinal rim, as indicated by ODP and SD-OCT measurements.
Our study has several limitations. We did notmeasure the axial length and could not analyze itsinfluence on the measurements made by the devices,due to the retrospective nature of this study. Thelimited number of subjects, inclusion of both eyesfrom the same patient and uncontrolled glaucomaseverity might have influenced the results. Theexclusion of patients who had extensive PPA mighthave artificially improved the reproducibility of ourmethod owing to selection bias.
FIGURE 2. Correlation between average disc and RA of ODP and SD-OCT measurements and ONH parameter disparity between twodevices in OAG and normal group. (A) OAG. (B) Normal group; statistically significant correlation tested by Pearson correlation testwas also confirmed by GEEs.
Comparison of Disc Analysis Algorithms 611
! 2013 Informa Healthcare USA, Inc.
Cur
r E
ye R
es D
ownl
oade
d fr
om in
form
ahea
lthca
re.c
om b
y U
nive
rsity
Lib
rary
Utr
echt
on
10/0
8/13
For
pers
onal
use
onl
y.
In conclusion, ONH parameters obtained bysemi-automated algorithms of ODP showed excel-lent reproducibility and good agreement withmeasurements obtained by SD-OCT. RA measure-ments of both devices can be used for detectingglaucoma progression because they showed goodcorrelation with RNFL thickness in glaucomapatients, although SD-OCT RA was a better indi-cator of RNFL thickness than ODP RA in bothnormal and glaucoma patients. If ONH parameterswere to be estimated using both devices in clinicalsettings, it would be possible that the measurementdifference between the devices could be affected bythe disc dimension, and the RA disparity couldbe decreased in glaucoma patients who have athinner RNFL.
ACKNOWLEDGEMENTS
Preliminary results presented at the 105th AnnualMeeting of the Korean Ophthalmological Society,Busan, Korea, April 2011.
The English in this document has been checked byat least two professional editors, both native speakersof English. For a certificate, please see: http://www.textcheck.com/certificate/wi3wTn
DECLARATION OF INTEREST
This work was supported by the ‘‘GRRC’’ project ofthe Gyeonggi Provincial Government, Korea.
FIGURE 3. Correlation between RNFL thickness and ONH parameter disparity between two devices in open angle glaucoma andnormal group. (A) OAG. (B) Normal group; statistically significant correlation tested by Pearson correlation test was also confirmed byGEEs.
612 M. Lee et al.
Current Eye Research
Cur
r E
ye R
es D
ownl
oade
d fr
om in
form
ahea
lthca
re.c
om b
y U
nive
rsity
Lib
rary
Utr
echt
on
10/0
8/13
For
pers
onal
use
onl
y.
The authors have no conflict or financial interest inthe subject matter of this manuscript.
REFERENCES
1. Azuara-Blanco A, Katz LJ, Spaeth GL, Vernon SA, SpencerF, Lanzl IM. Clinical agreement among glaucoma expertsin the detection of glaucomatous changes of the optic diskusing simultaneous stereoscopic photographs. Am JOphthalmol 2003;136:949–950.
2. Coleman AL, Sommer A, Enger C, Knopf HL, Stamper RL,Minckler DS. Interobserver and intraobserver variability inthe detection of glaucomatous progression of the opticdisc. J Glaucoma 1996;5:384–389.
3. Mwanza JC, Oakley JD, Budenz DL, Anderson DR. Abilityof cirrus HD-OCT optic nerve head parameters to discrim-inate normal from glaucomatous eyes. Ophthalmology2011;118:241–248 e241.
4. Sharma A, Oakley JD, Schiffman JC, Budenz DL, AndersonDR. Comparison of automated analysis of Cirrus HD OCTspectral-domain optical coherence tomography with stereophotographs of the optic disc. Ophthalmology 2011;118:1348–1357.
5. Deleon-Ortega JE, Arthur SN, McGwin Jr G, Xie A,Monheit BE, Girkin CA. Discrimination between glau-comatous and nonglaucomatous eyes using quantitativeimaging devices and subjective optic nerve head assess-ment. Invest Ophthalmol Vis Sci 2006;47:3374–3380.
6. Abramoff MD, Alward WL, Greenlee EC, Shuba L, KimCY, Fingert JH, et al. Automated segmentation of theoptic disc from stereo color photographs using physiolo-gically plausible features. Invest Ophthalmol Vis Sci2007;48:1665–1673.
7. Samarawickrama C, Pai A, Huynh SC, Burlutsky G, JonasJB, Mitchell P. Measurement of optic nerve head param-eters: comparison of optical coherence tomography withdigital planimetry. J Glaucoma 2009;18:571–575.
8. Garudadri CS, Rao HL, Parikh RS, Jonnadula GB, SelvarajP, Nutheti R, et al. Effect of optic disc size and diseaseseverity on the diagnostic capability of glaucoma imagingtechnologies in an Indian population. J Glaucoma 2012;21:475–480.
9. Oddone F, Centofanti M, Tanga L, Parravano M, MichelessiM, Schiavone M, et al. Influence of disc size on optic nervehead versus retinal nerve fiber layer assessment fordiagnosing glaucoma. Ophthalmology 2011;118:1340–1347.
10. Cecconi M, Rhodes A, Poloniecki J, Della Rocca G,Grounds RM. Bench-to-bedside review: the importance ofthe precision of the reference technique in method
comparison studies – with specific reference to the meas-urement of cardiac output. Crit Care 2009;13:201.
11. Mutoh T, Kazumata K, Ishikawa T, Terasaka S.Performance of bedside transpulmonary thermodilutionmonitoring for goal-directed hemodynamic managementafter subarachnoid hemorrhage. Stroke 2009;40:2368–2374.
12. Quigley HA, Katz J, Derick RJ, Gilbert D, Sommer A. Anevaluation of optic disc and nerve fiber layer examinationsin monitoring progression of early glaucoma damage.Ophthalmology 1992;99:19–28.
13. Kass MA, Heuer DK, Higginbotham EJ, Johnson CA,Keltner JL, Miller JP, et al. The Ocular HypertensionTreatment Study: a randomized trial determines thattopical ocular hypotensive medication delays or preventsthe onset of primary open-angle glaucoma. ArchOphthalmol 2002;120:701–713; discussion 829-730.
14. Katz J, Congdon N, Friedman DS. Methodological vari-ations in estimating apparent progressive visual field lossin clinical trials of glaucoma treatment. Arch Ophthalmol1999;117:1137–1142.
15. Savini G, Zanini M, Carelli V, Sadun AA, Ross-CisnerosFN, Barboni P. Correlation between retinal nerve fibre layerthickness and optic nerve head size: an optical coherencetomography study. Br J Ophthalmol 2005;89:489–492.
16. Kaushik S, Pandav SS, Ichhpujani P, Gupta A. Correlationof frequency-doubling perimetry with retinal nerve fiberlayer thickness and optic disc size in ocular hypertensivesand glaucoma suspects. J Glaucoma 2011;20:366–370.
17. Hwang YH, Kim YY. Correlation between optic nerve headparameters and retinal nerve fibre layer thickness mea-sured by spectral-domain optical coherence tomographyin myopic eyes. Clin Experiment Ophthalmol 2012;40:713–720.
18. Huang D, Chopra V, Lu AT, Tan O, Francis B, Varma R,et al. Does optic nerve head size variation affect circumpa-pillary retinal nerve fiber layer thickness measurement byoptical coherence tomography? Invest Ophthalmol Vis Sci2012;53:4990–4997.
19. Mansoori T, Viswanath K, Balakrishna N. Correlationbetween peripapillary retinal nerve fiber layer thicknessand optic nerve head parameters using spectraldomain optical coherence tomography. J Glaucoma 2010;19:604–608.
20. Suh MH, Kim SH, Park KH, Kim SJ, Kim TW, Hwang SS,et al. Comparison of the correlations between optic discrim area and retinal nerve fiber layer thickness inglaucoma and nonarteritic anterior ischemic optic neur-opathy. Am J Ophthalmol 2011;151:277–286 e271.
21. Moghimi S, Hosseini H, Riddle J, Lee GY, Bitrian E,Giaconi J, et al. Measurement of optic disc size and rimarea with spectral-domain OCT and scanning laser oph-thalmoscopy. Invest Ophthalmol Vis Sci 2012;53:4519–4530.
Comparison of Disc Analysis Algorithms 613
! 2013 Informa Healthcare USA, Inc.
Cur
r E
ye R
es D
ownl
oade
d fr
om in
form
ahea
lthca
re.c
om b
y U
nive
rsity
Lib
rary
Utr
echt
on
10/0
8/13
For
pers
onal
use
onl
y.