comparison of dac and monaco dsmc codes with flat plate ... · comparison of dac and monaco dsmc...
TRANSCRIPT
August 2010
NASA/TM-2010-216835
Comparison of DAC and MONACO DSMC Codes With Flat Plate Simulation Jose F. Padilla Langley Research Center, Hampton, Virginia
https://ntrs.nasa.gov/search.jsp?R=20100029686 2020-01-06T03:05:03+00:00Z

NASA STI Program . . . in Profile
Since its founding, NASA has been dedicated to the advancement of aeronautics and space science. The NASA scientific and technical information (STI) program plays a key part in helping NASA maintain this important role.
The NASA STI program operates under the auspices of the Agency Chief Information Officer. It collects, organizes, provides for archiving, and disseminates NASA’s STI. The NASA STI program provides access to the NASA Aeronautics and Space Database and its public interface, the NASA Technical Report Server, thus providing one of the largest collections of aeronautical and space science STI in the world. Results are published in both non-NASA channels and by NASA in the NASA STI Report Series, which includes the following report types:
TECHNICAL PUBLICATION. Reports of
completed research or a major significant phase of research that present the results of NASA programs and include extensive data or theoretical analysis. Includes compilations of significant scientific and technical data and information deemed to be of continuing reference value. NASA counterpart of peer-reviewed formal professional papers, but having less stringent limitations on manuscript length and extent of graphic presentations.
TECHNICAL MEMORANDUM. Scientific and technical findings that are preliminary or of specialized interest, e.g., quick release reports, working papers, and bibliographies that contain minimal annotation. Does not contain extensive analysis.
CONTRACTOR REPORT. Scientific and technical findings by NASA-sponsored contractors and grantees.
CONFERENCE PUBLICATION. Collected
papers from scientific and technical conferences, symposia, seminars, or other meetings sponsored or co-sponsored by NASA.
SPECIAL PUBLICATION. Scientific, technical, or historical information from NASA programs, projects, and missions, often concerned with subjects having substantial public interest.
TECHNICAL TRANSLATION. English-language translations of foreign scientific and technical material pertinent to NASA’s mission.
Specialized services also include creating custom thesauri, building customized databases, and organizing and publishing research results. For more information about the NASA STI program, see the following: Access the NASA STI program home page at
http://www.sti.nasa.gov
E-mail your question via the Internet to [email protected]
Fax your question to the NASA STI Help Desk at 443-757-5803
Phone the NASA STI Help Desk at 443-757-5802
Write to: NASA STI Help Desk NASA Center for AeroSpace Information 7115 Standard Drive Hanover, MD 21076-1320
National Aeronautics and Space Administration Langley Research Center Hampton, Virginia 23681-2199
August 2010
NASA/TM-2010-216835
Comparison of DAC and MONACO DSMC Codes With Flat Plate Simulation Jose F. Padilla Langley Research Center, Hampton, Virginia

Available from:
NASA Center for AeroSpace Information 7115 Standard Drive
Hanover, MD 21076-1320 443-757-5802
Abstract
Various implementations of the direct simulation Monte Carlo (DSMC) method exist in academia, government and industry. By comparing implementations, deficiencies and merits of each can be discovered. This document reports comparisons between DSMC Analysis Code (DAC) and “MONACO”. DAC is NASA’s standard DSMC production code and MONACO is a research DSMC code developed in academia. These codes have various differences; in particular, they employ distinct computational grid definitions. On one hand, DAC employs a wall surface grid comprising unstructured triangular cells in conjunction with a volume grid comprising three-space Cartesian cells. On the other hand, MONACO employs a volume grid generally comprising unstructured cells and defines a wall surface by one of its surface boundaries. In this study, DAC and MONACO are compared by having each simulate a blunted flat plate wind tunnel test, using an identical volume mesh. Simulation expense and DSMC metrics are compared. In addition, flow results are compared with available laboratory data. Overall, this study revealed that both codes, excluding grid adaptation, performed similarly. For parallel processing, DAC was generally more efficient. As expected, code accuracy was mainly dependent on physical models employed.
Nomenclature
total drag, drag due to pressure, drag due to shear,
error flat plate length
serial processing memory parallel memory of processor proc
free stream number density, number of simulation molecules
number of parallel processors parallel processing memory spread
serial processing real time, parallel processing real time,
collision model reference temperature
reference temperature for rotational energy exchange,
isothermal wall temperature, free stream temperature,
, , spatial coordinates, rotational collision number maximum rotational collision
number collision diameter, Δ, Δ change, characteristic cell size molecule rotational energy, rotational degrees of freedom parallel processing speed up
efficiency mean free path, free stream mean free path, collision time, reference collision time, viscosity index
2
1 Introduction
Various implementations of the direct simulation Monte Carlo (DSMC) method exist in academia, government and industry. By comparing implementations, deficiencies and merits of each can be discovered. This document reports comparisons between DSMC Analysis Code (DAC) and “MONACO”. DAC is NASA’s standard DSMC production code and MONACO is a research DSMC code developed in academia. These codes have various differences; in particular, they employ distinct computational grid definitions. On one hand, DAC employs a wall surface grid comprising unstructured triangular cells in conjunction with a volume grid comprising three-space Cartesian cells. On the other hand, MONACO employs a volume grid generally comprising unstructured cells and defines a wall surface by one of its surface boundaries. In this study, DAC and MONACO are compared by having each simulate a blunted flat plate wind tunnel test, using an identical volume mesh.
This document begins by providing a brief overview of DAC and MONACO. Then, a description on their setup for comparisons is given. Next, a description of a flat plate wind tunnel test is provided. Then, boundary conditions and collision model configurations are outlined. Subsequently, computational mesh generation and configuration is presented, including a grid convergence study.
Following these descriptions, comparisons of resulting flat plate simulations are presented. First, serial and parallel simulation time and memory are compared, along with code function profiles of serial simulations. Second, the quality of the simulations is examined through DSMC metrics. Third, flow field contours of macroscopic flow properties are discussed. Finally, surface properties are studied, including comparison against existing surface pressure and heat flux data found in literature.
2 Description of DSMC Codes
DAC was invented in the mid 1990’s by LeBeau and others.1,2 The code is written in FORTRAN 77, and uses Cray style pointers to permit dynamic memory allocation. DAC has been employed by NASA and other organizations for mission support, aerospace vehicle design analysis, computational nonequilibrium gas modeling and in support of laboratory projects.3 Simulations have involved nonequilibrium flow about spacecraft in orbit,4–6 rarefied hypersonic flow7,8 and support of hybrid simulation research.4,8 For DAC, each computational grid is a composition of a vehicle surface grid and a flow-field volume grid. By using two grids, the surface grid does not impose a geometric constraint on the surrounding volume grid. The vehicle surface grid, generated independently, is a closed surface comprising an unstructured distribution of triangular cells. The flow-field grid is generated automatically by DAC’s preprocessing utility called PREDAC. It is nominally bounded by six planes, each coordinate axis perpendicular to a pair, and by the vehicle surface grid. Each bounding plane represents an inflow, outflow or symmetry boundary. Alternatively, the computational domain can be defined more generally via the use of the same type of unstructured triangular grids that are used to define a surface, as the boundary conditions for these grids can be defined as surface, inflow or outflow. The initial flow-field grid comprises three-space Cartesian cells, labeled “level 1” cells, often distributed uniformly along each coordinate direction for initial simulation. Solution results obtained from level 1 cells enable PREDAC to refine the grid in regions of higher flow density by dividing level 1 cells into smaller cells, labeled “level 2” cells. The version of DAC employed for this study is based on 97 distribution 11.
MONACO is a research code developed in academia. Its name is a geographic reminder of Monte Carlo simulation. The code was devised in the mid 1990’s by Dietrich and Boyd.9,10 The code is written in the C programming language. MONACO has been employed by research universities and laboratories for
3
computational nonequilibrium gas modeling and in support of laboratory projects. Simulations have involved support of hybrid simulation research,11–16 nonequilibrium hypersonic flow17–22 and nonequilibrium flow about spacecraft.23–25 MONACO employs a single body fitted grid with general surface topology for its boundaries. External software is used to generate the grid and define inflow, outflow, symmetry and wall surface boundaries. Two or three-dimensional grids are applicable with structured or unstructured cell distributions. This study employs three-dimensional grids with Cartesian cells. Mesh adaptation to simulation results is performed with external software. The version of MONACO employed for this study is based on 3.09.
For this study, both codes employ DSMC algorithms based on Bird’s 1994 algorithms,26 with random pairing of molecules within a cell for collision. Gas molecule collision dynamics follow the variable-hard-sphere (VHS)27 model. Both codes consider rotational energy exchange according to Borgnakke–Larson statistical model.28 However, DAC assumes constant rotational collision number, while MONACO employs the variable rotational energy exchange probability model of Boyd.29 For gas-surface interactions, both codes are run with diffuse reflection and full thermal accommodation, against an isothermal wall. Gridgen30 is employed to generate surface grids for DAC and volume grids for MONACO.
3 Description of Flat Plate Simulations
Wind Tunnel Model Notwithstanding differences in grid processing procedures between DAC and MONACO, flow field
computational grids exist that are identical in both codes. Excepting solid surface discretization, these grids enable grid independent comparisons between the codes. For this study, such comparisons are achieved by simulation of rarefied flow about rectangular flat-plate model within a free-jet expansion wind-tunnel. The particular geometry and flow conditions are taken from an experiment presented by Allègre and others in 1992.31 This experiment is characterized by a rarefied global Knudsen number of 0.016 based on the free stream mean-free-path 1.60 (computed from free-stream conditions) and flat-plate length 100 . Flat plate thickness is 5 . Further details of the wind-tunnel experiment are found in references 31–33.
Flow Conditions Identical flow conditions are employed for each code to simulate the experiment. Both codes
commenced with a vacuum domain. Inflow of pure nitrogen is assumed. The following input parameters define the nitrogen gas species: molecular weight 28.01, VHS molecular diameter 4.1710 ,26 viscosity index 0.74 at reference temperature 273 K,26 and number of rotational degrees of freedom 2. However, because of distinct rotational relaxation models, DAC utilizes constant rotational collision number 5, while MONACO employs variable rotational collision number model with reference temperature for rotational energy exchange 91.5 K and limiting rotational collision number 18.1. Unless otherwise indicated, simulations are performed with molecule rotational energy exchange procedures activated. Nitrogen gas enters the inflow boundary uniformly with 1503 ⁄ , 13.32 and 3.71610 . Free stream velocity is parallel to x axis and longitudinal surfaces of flat plate. The flat-plate boundary condition is an isothermal wall temperature 290 K. Gas molecules are assumed to reflect diffusely from the wall according to the Maxwellian velocity distribution at .
4
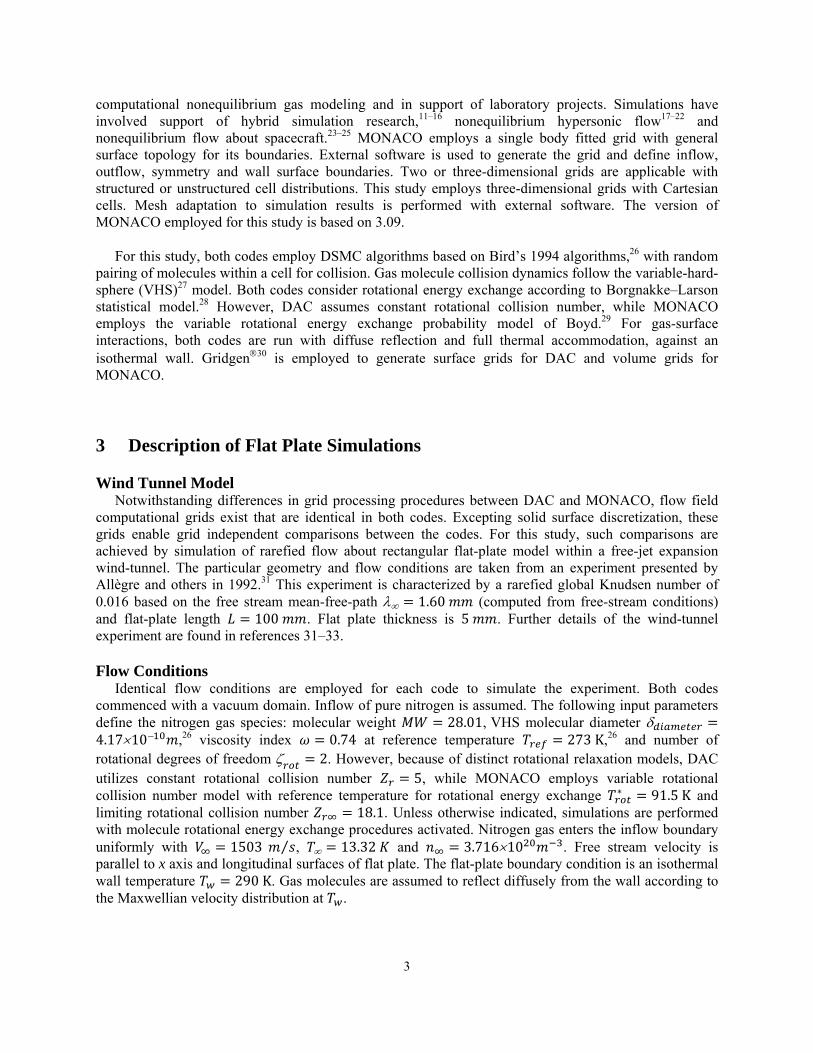
Computational Mesh The computational flow field grid selected for baseline simulation is a three-dimensional structured
grid with cubic cells having 0.5 mm sides. The domain is a rectangular region of flow about the flat-plate and has two-dimensional symmetry, and is illustrated by Figure 1. The domain dimensions are 180 by 205 by 1 mm in the x, y and z directions, respectively. Inflow boundaries are defined by left, bottom and top faces in Fig. 1. Outflow boundary is defined by the right face. Symmetry boundaries are defined by the front and back faces. Flat plate surface boundary is defined by the open interior region with dimensions 100 by 5 by 1 mm. in the x, y and z directions, respectively. The origin of the coordinate system is at the center of the flat plate left face. With DAC, flow field mesh generated with level 1 cells so that MONACO could easily use the same flow field mesh. To keep the focus of the comparisons on the core DSMC algorithms, variable particle and time weighting is not employed.
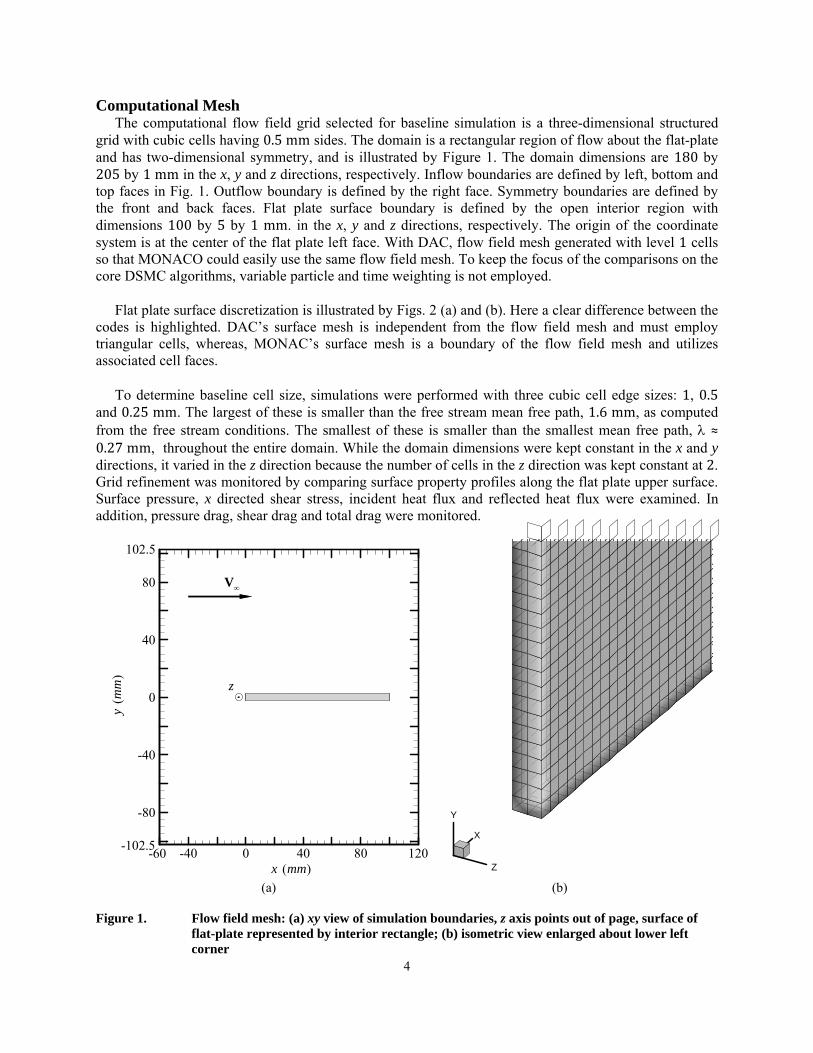
Flat plate surface discretization is illustrated by Figs. 2 (a) and (b). Here a clear difference between the codes is highlighted. DAC’s surface mesh is independent from the flow field mesh and must employ triangular cells, whereas, MONAC’s surface mesh is a boundary of the flow field mesh and utilizes associated cell faces.
To determine baseline cell size, simulations were performed with three cubic cell edge sizes: 1, 0.5 and 0.25 mm. The largest of these is smaller than the free stream mean free path, 1.6 mm, as computed from the free stream conditions. The smallest of these is smaller than the smallest mean free path, ≈ 0.27 mm, throughout the entire domain. While the domain dimensions were kept constant in the x and y directions, it varied in the z direction because the number of cells in the z direction was kept constant at 2. Grid refinement was monitored by comparing surface property profiles along the flat plate upper surface. Surface pressure, x directed shear stress, incident heat flux and reflected heat flux were examined. In addition, pressure drag, shear drag and total drag were monitored.
(a) (b) Figure 1. Flow field mesh: (a) xy view of simulation boundaries, z axis points out of page, surface of
flat-plate represented by interior rectangle; (b) isometric view enlarged about lower left corner
z
V
x mm
ym
m
-40 0 40 80 120
-80
-40
0
40
80
( )
()
102.5
-102.5-60
X
Y
Z
5
(a) DAC surface mesh (b) MONACO surface mesh
Figure 2. Isometric view of flat plate surface meshes near leading edge
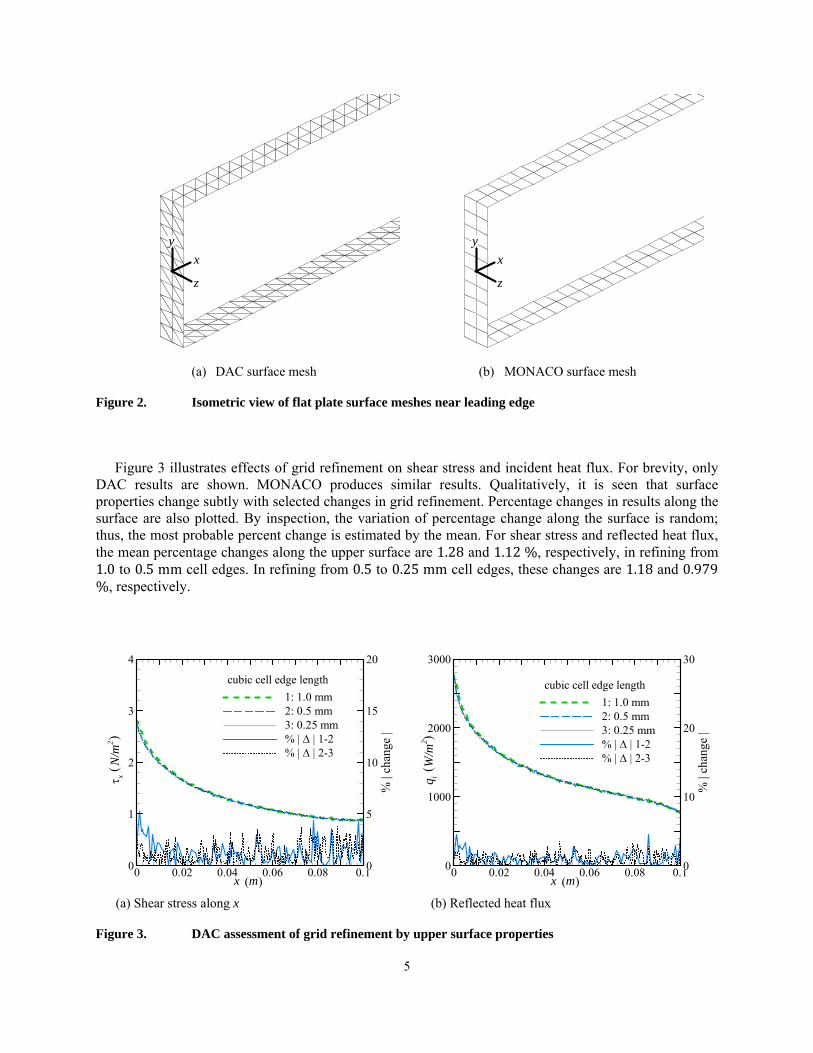
Figure 3 illustrates effects of grid refinement on shear stress and incident heat flux. For brevity, only
DAC results are shown. MONACO produces similar results. Qualitatively, it is seen that surface properties change subtly with selected changes in grid refinement. Percentage changes in results along the surface are also plotted. By inspection, the variation of percentage change along the surface is random; thus, the most probable percent change is estimated by the mean. For shear stress and reflected heat flux, the mean percentage changes along the upper surface are 1.28 and 1.12 %, respectively, in refining from 1.0 to 0.5 mm cell edges. In refining from 0.5 to 0.25 mm cell edges, these changes are 1.18 and 0.979 %, respectively.
(a) Shear stress along x (b) Reflected heat flux Figure 3. DAC assessment of grid refinement by upper surface properties
y
x
z
y
x
z
x m
xN
/m2
%|c
hang
e|
0 0.02 0.04 0.06 0.08 0.10
1
2
3
4
0
5
10
15
20
1: 1.0 mm2: 0.5 mm3: 0.25 mm% | | 1-2% | | 2-3
( )
cubic cell edge length
()
x m
q iW
/m2
%|c
hang
e|
0 0.02 0.04 0.06 0.08 0.10
1000
2000
3000
0
10
20
30
1: 1.0 mm2: 0.5 mm3: 0.25 mm% | | 1-2% | | 2-3
( )
cubic cell edge length
()
6
Table 1 summarizes grid refinement results by DAC and MONACO. Listed are mean percentage absolute value of changes of upper surface pressure, x directed shear stress, and incident and reflected heat flux. Additionally, percentage changes of drag, including pressure and shear components, are listed. Decreasing edge lengths from 1 to 0.5 mm, results in, local surface property, mean percentage changes between 1 and 2 %. Decreasing edges from 0.5 to 0.25 mm, results in these changes being less than 1 %, except for shear stress. The reason for sensitivity of shear stress is suspected due to selection of only two cells along z direction. Now examining total surface drag, it is seen that changes are less than one percent, even in refining from 1.0 mm to 0.5 mm cell edges. Because the percentage changes of total surface drag, and incident and reflected heat flux, decreases from the first to the second refinements, and because they are less than 1 % in the second refinement, the computational mesh with 0.5 mm cubic cell edge lengths is selected as baseline for further DSMC code comparisons involving selected simulation case.
Table 1. Effects of grid refinement on surface properties with the following cubic cell edge lengths: (1) 1.0, (2) 0.5 and (3) 0.25 mm
%|∆| %|∆| %|∆| %|∆| %Dpress %Dshear %DDAC 1 2 1.02 1.28 1.09 1.12 ‐0.488 ‐0.673 ‐0.5952 3 0.883 1.18 0.993 0.979 ‐0.405 ‐0.0799 ‐0.217 MONACO 1 2 1.21 1.38 1.39 1.26 0.299 0.689 0.5182 3 0.841 1.09 0.990 0.955 ‐0.167 0.764 0.356
4 Comparison of Flat Plat Simulations
Simulation Expense For the purpose of comparing simulations, the same simulation parameters listed in Table 2 are input
to DAC and MONACO. Reference time-step and particle weight are determined by DAC’s preprocessor. These codes have different standard output processes. In DAC input file, the “number of time-steps between file updates” is set to 100 setting it to 2000 resulted in 5.48 % increase in simulation real time). In MONACO input file, “Interval: Evaluate simulation process” and “Interval: Print output” are each set to 100, while “Interval: Write restart file” is set to 2000.
Table 2. DSMC simulation parameters
time-step 3.102 10particle weight 4.645 10 real per simulated moleculestransient period 8000 time‐stepssampling period 8000 time‐stepsinterval sample data 2
7
Serial processing executables are generated with Intel® 10.1.018 compilers34 using default optimization (-O2) for serial processing. Each executable is run on an AMD OpteronTM Processor 244,35 a 64 bit processor having 1.8 GHz clock rate and 4 GB memory. Simulation time and memory are measured by Linux commands “time” and “top”, respectively. Table 3 summarizes simulation expense with serial processing. For this case, DAC utilizes 57 % less memory, while MONACO takes 9.8 % less time.
Table 3. Serial processing simulation expense
simulation code DAC MONACO real time : : 9:42:18 8: 45: 10memory 223 Mb 516 Mb
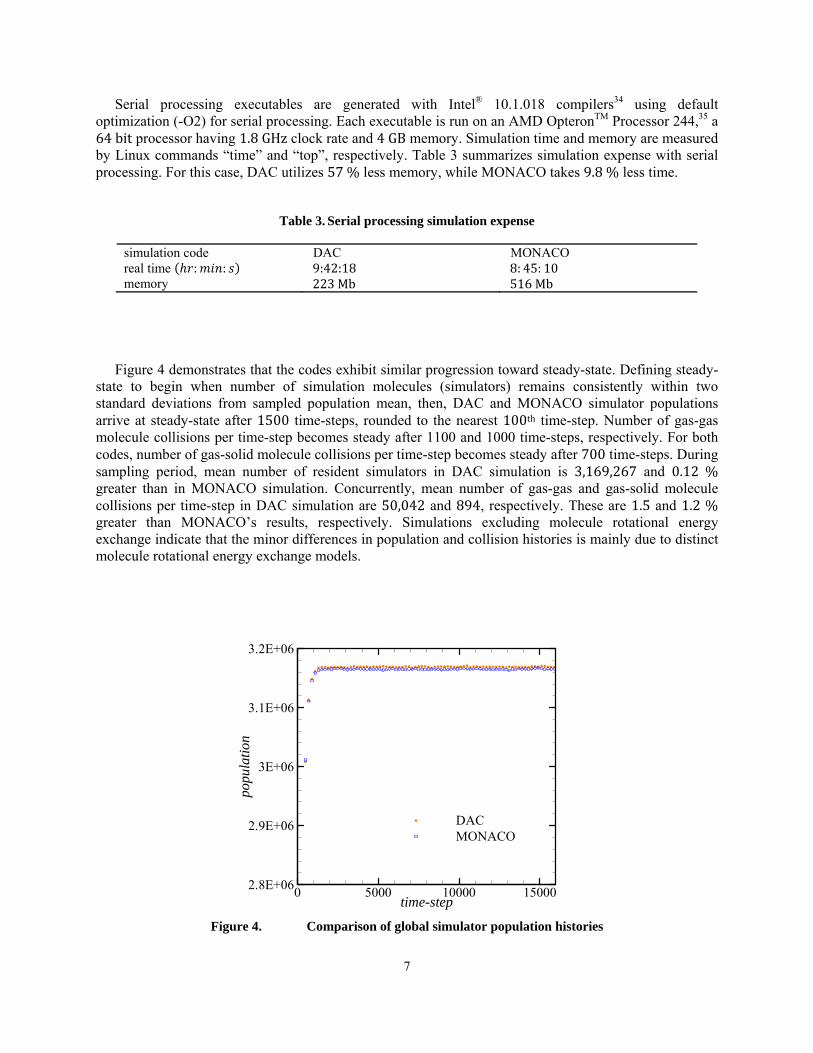
Figure 4 demonstrates that the codes exhibit similar progression toward steady-state. Defining steady-state to begin when number of simulation molecules (simulators) remains consistently within two standard deviations from sampled population mean, then, DAC and MONACO simulator populations arrive at steady-state after 1500 time-steps, rounded to the nearest 100th time-step. Number of gas-gas molecule collisions per time-step becomes steady after 1100 and 1000 time-steps, respectively. For both codes, number of gas-solid molecule collisions per time-step becomes steady after 700 time-steps. During sampling period, mean number of resident simulators in DAC simulation is 3,169,267 and 0.12 % greater than in MONACO simulation. Concurrently, mean number of gas-gas and gas-solid molecule collisions per time-step in DAC simulation are 50,042 and 894, respectively. These are 1.5 and 1.2 % greater than MONACO’s results, respectively. Simulations excluding molecule rotational energy exchange indicate that the minor differences in population and collision histories is mainly due to distinct molecule rotational energy exchange models.
Figure 4. Comparison of global simulator population histories
time-step
popu
latio
n
0 5000 10000 150002.8E+06
2.9E+06
3E+06
3.1E+06
3.2E+06
DACMONACO
8
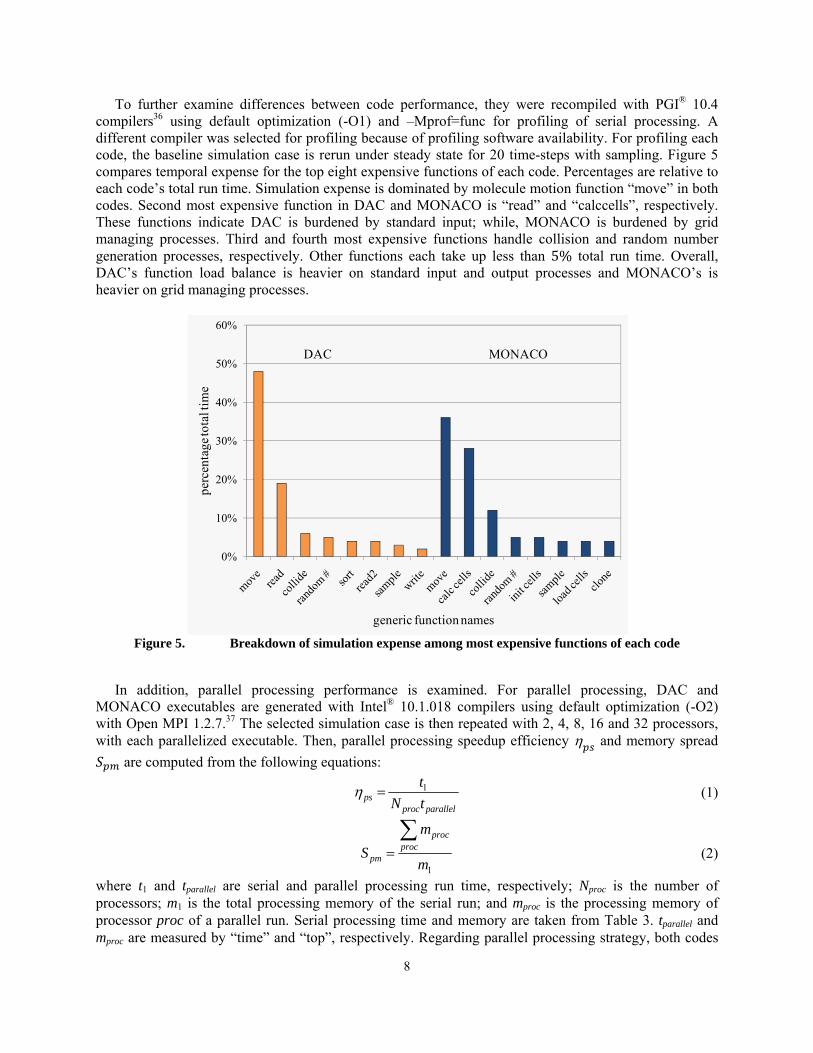
To further examine differences between code performance, they were recompiled with PGI® 10.4 compilers36 using default optimization (-O1) and –Mprof=func for profiling of serial processing. A different compiler was selected for profiling because of profiling software availability. For profiling each code, the baseline simulation case is rerun under steady state for 20 time-steps with sampling. Figure 5 compares temporal expense for the top eight expensive functions of each code. Percentages are relative to each code’s total run time. Simulation expense is dominated by molecule motion function “move” in both codes. Second most expensive function in DAC and MONACO is “read” and “calccells”, respectively. These functions indicate DAC is burdened by standard input; while, MONACO is burdened by grid managing processes. Third and fourth most expensive functions handle collision and random number generation processes, respectively. Other functions each take up less than 5% total run time. Overall, DAC’s function load balance is heavier on standard input and output processes and MONACO’s is heavier on grid managing processes.
Figure 5. Breakdown of simulation expense among most expensive functions of each code
In addition, parallel processing performance is examined. For parallel processing, DAC and MONACO executables are generated with Intel® 10.1.018 compilers using default optimization (-O2) with Open MPI 1.2.7.37 The selected simulation case is then repeated with 2, 4, 8, 16 and 32 processors, with each parallelized executable. Then, parallel processing speedup efficiency and memory spread
are computed from the following equations:
1ps
proc parallel
t
N t (1)
1
procproc
pm
m
Sm
(2)
where t1 and tparallel are serial and parallel processing run time, respectively; Nproc is the number of processors; m1 is the total processing memory of the serial run; and mproc is the processing memory of processor proc of a parallel run. Serial processing time and memory are taken from Table 3. tparallel and mproc are measured by “time” and “top”, respectively. Regarding parallel processing strategy, both codes
0%
10%
20%
30%
40%
50%
60%
perc
enta
ge to
tal t
ime
generic function names
DAC MONACO
9
assign one processor for standard input and output (I/O), however, DAC excludes this processor from DSMC work.
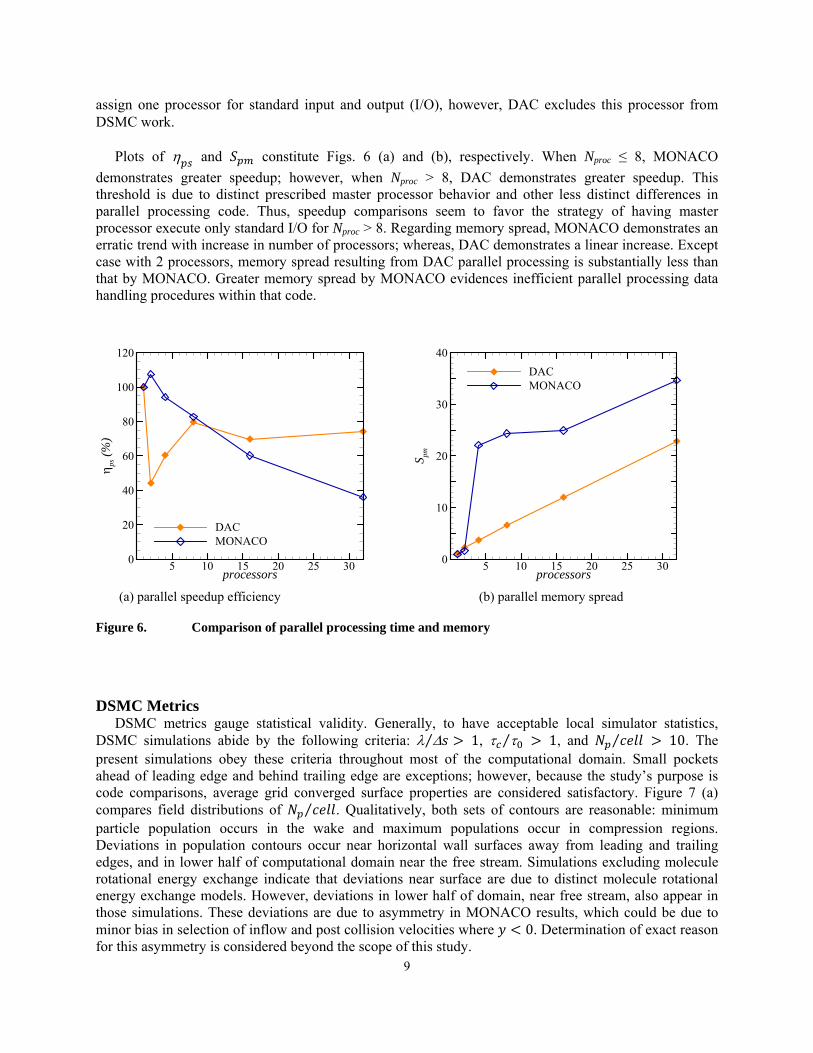
Plots of and constitute Figs. 6 (a) and (b), respectively. When Nproc ≤ 8, MONACO
demonstrates greater speedup; however, when Nproc > 8, DAC demonstrates greater speedup. This threshold is due to distinct prescribed master processor behavior and other less distinct differences in parallel processing code. Thus, speedup comparisons seem to favor the strategy of having master processor execute only standard I/O for Nproc > 8. Regarding memory spread, MONACO demonstrates an erratic trend with increase in number of processors; whereas, DAC demonstrates a linear increase. Except case with 2 processors, memory spread resulting from DAC parallel processing is substantially less than that by MONACO. Greater memory spread by MONACO evidences inefficient parallel processing data handling procedures within that code.
(a) parallel speedup efficiency (b) parallel memory spread Figure 6. Comparison of parallel processing time and memory DSMC Metrics
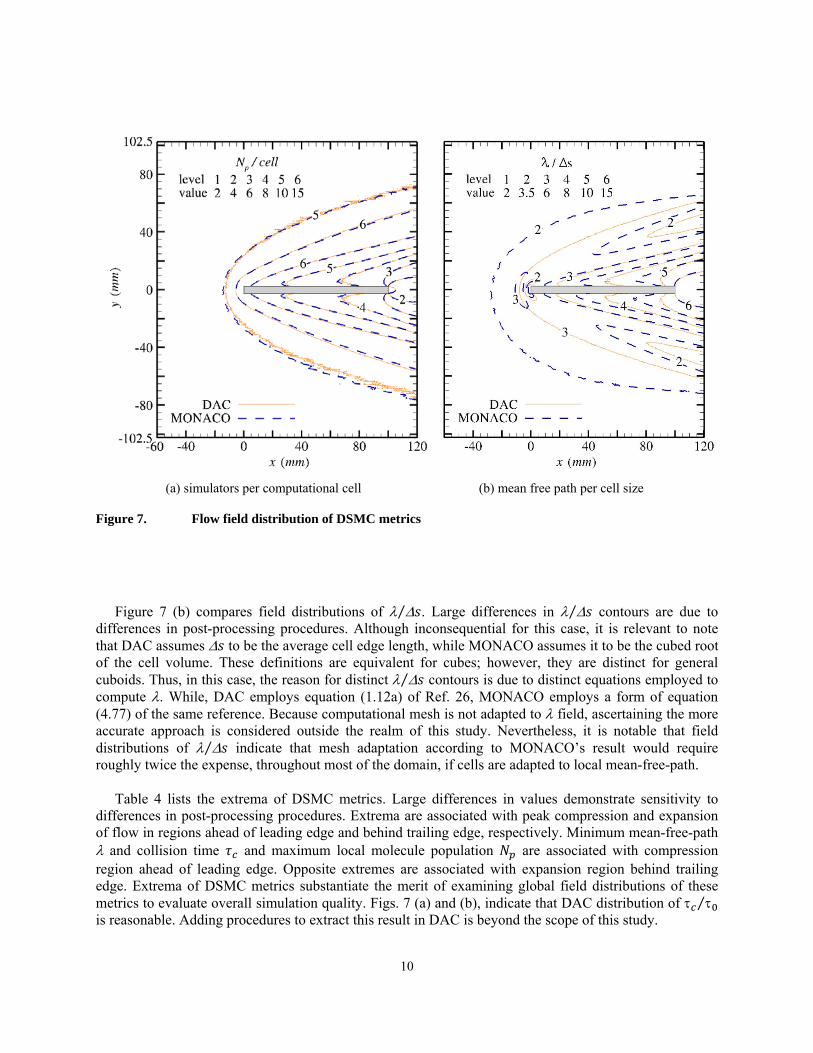
DSMC metrics gauge statistical validity. Generally, to have acceptable local simulator statistics, DSMC simulations abide by the following criteria: ⁄ 1, ⁄ 1, and ⁄ 10. The present simulations obey these criteria throughout most of the computational domain. Small pockets ahead of leading edge and behind trailing edge are exceptions; however, because the study’s purpose is code comparisons, average grid converged surface properties are considered satisfactory. Figure 7 (a) compares field distributions of ⁄ . Qualitatively, both sets of contours are reasonable: minimum particle population occurs in the wake and maximum populations occur in compression regions. Deviations in population contours occur near horizontal wall surfaces away from leading and trailing edges, and in lower half of computational domain near the free stream. Simulations excluding molecule rotational energy exchange indicate that deviations near surface are due to distinct molecule rotational energy exchange models. However, deviations in lower half of domain, near free stream, also appear in those simulations. These deviations are due to asymmetry in MONACO results, which could be due to minor bias in selection of inflow and post collision velocities where 0. Determination of exact reason for this asymmetry is considered beyond the scope of this study.
processors
ps(%
)
5 10 15 20 25 300
20
40
60
80
100
120
DACMONACO
processors
S pm
5 10 15 20 25 300
10
20
30
40
DACMONACO
10
(a) simulators per computational cell (b) mean free path per cell size
Figure 7. Flow field distribution of DSMC metrics
Figure 7 (b) compares field distributions of ⁄ . Large differences in ⁄ contours are due to differences in post-processing procedures. Although inconsequential for this case, it is relevant to note that DAC assumes to be the average cell edge length, while MONACO assumes it to be the cubed root of the cell volume. These definitions are equivalent for cubes; however, they are distinct for general cuboids. Thus, in this case, the reason for distinct ⁄ contours is due to distinct equations employed to compute . While, DAC employs equation (1.12a) of Ref. 26, MONACO employs a form of equation (4.77) of the same reference. Because computational mesh is not adapted to field, ascertaining the more accurate approach is considered outside the realm of this study. Nevertheless, it is notable that field distributions of ⁄ indicate that mesh adaptation according to MONACO’s result would require roughly twice the expense, throughout most of the domain, if cells are adapted to local mean-free-path.
Table 4 lists the extrema of DSMC metrics. Large differences in values demonstrate sensitivity to differences in post-processing procedures. Extrema are associated with peak compression and expansion of flow in regions ahead of leading edge and behind trailing edge, respectively. Minimum mean-free-path and collision time and maximum local molecule population are associated with compression region ahead of leading edge. Opposite extremes are associated with expansion region behind trailing edge. Extrema of DSMC metrics substantiate the merit of examining global field distributions of these metrics to evaluate overall simulation quality. Figs. 7 (a) and (b), indicate that DAC distribution of ⁄ is reasonable. Adding procedures to extract this result in DAC is beyond the scope of this study.
11
Table 4. Extrema of DSMC metrics
simulation code DAC MONACO ⁄ , 0.55, 2.59 0.59, 432 ⁄ , n/a 1.5, 1513 ⁄ , 0, 127 0.15, 129
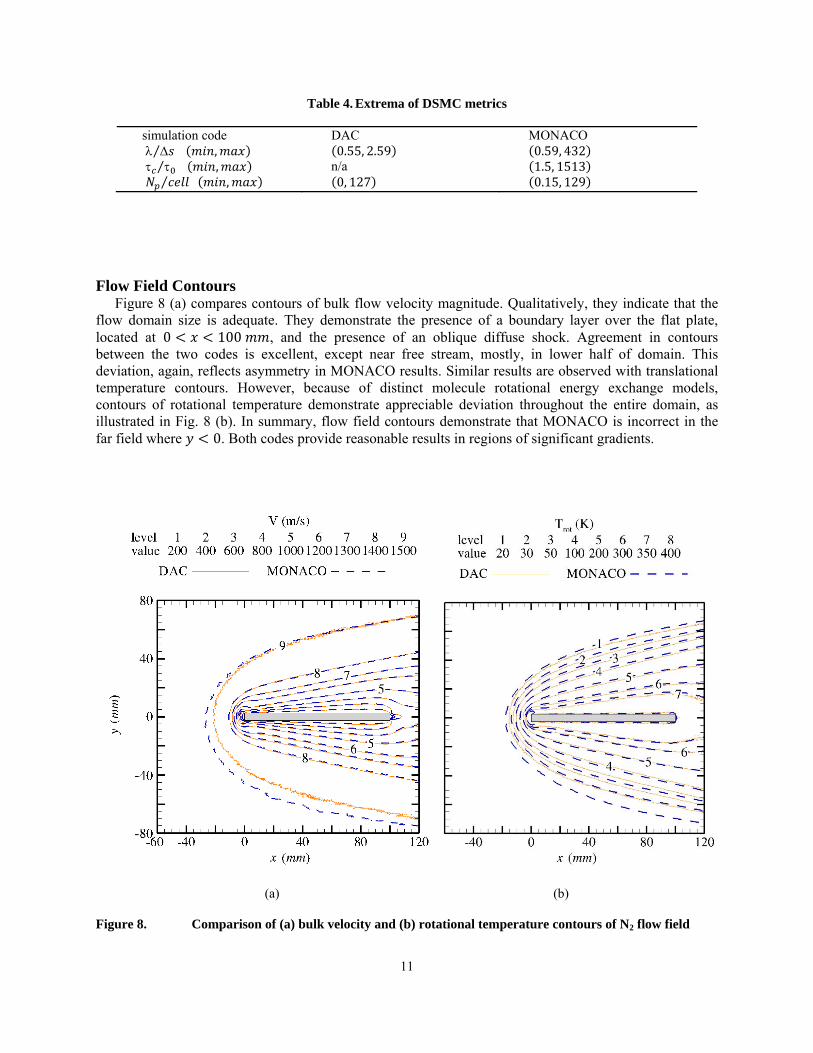
Flow Field Contours Figure 8 (a) compares contours of bulk flow velocity magnitude. Qualitatively, they indicate that the
flow domain size is adequate. They demonstrate the presence of a boundary layer over the flat plate, located at 0 100 , and the presence of an oblique diffuse shock. Agreement in contours between the two codes is excellent, except near free stream, mostly, in lower half of domain. This deviation, again, reflects asymmetry in MONACO results. Similar results are observed with translational temperature contours. However, because of distinct molecule rotational energy exchange models, contours of rotational temperature demonstrate appreciable deviation throughout the entire domain, as illustrated in Fig. 8 (b). In summary, flow field contours demonstrate that MONACO is incorrect in the far field where 0. Both codes provide reasonable results in regions of significant gradients.
(a) (b)
Figure 8. Comparison of (a) bulk velocity and (b) rotational temperature contours of N2 flow field
12
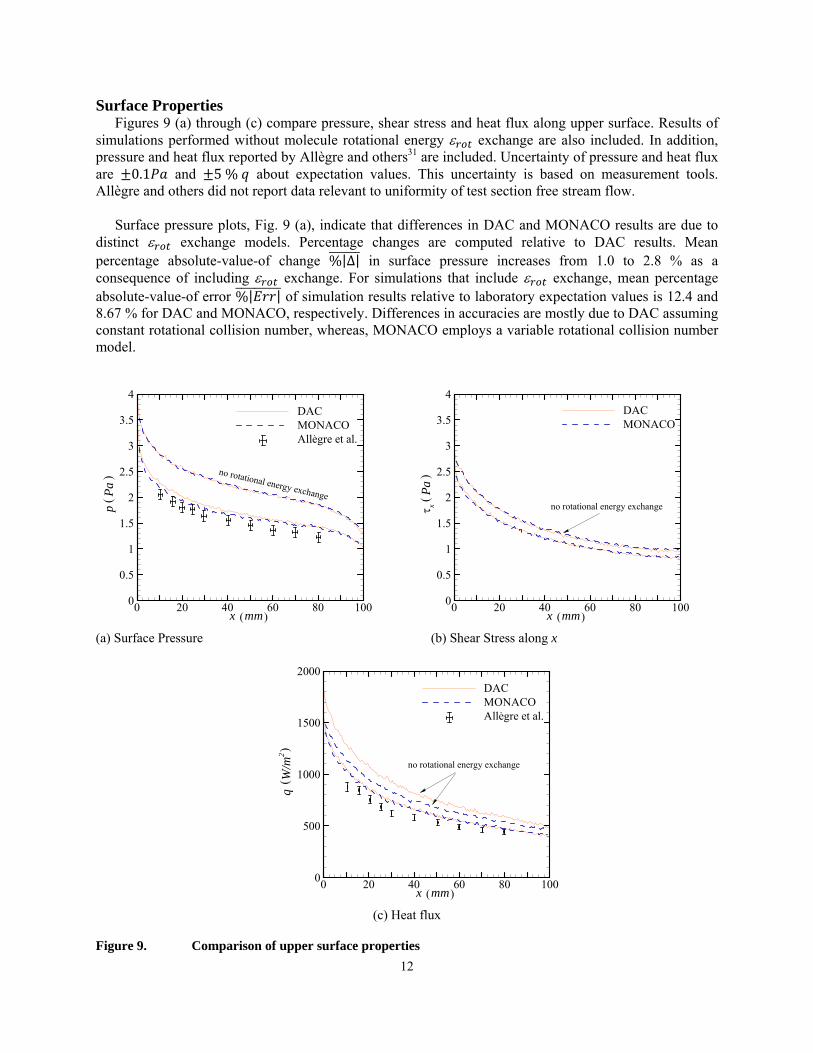
Surface Properties Figures 9 (a) through (c) compare pressure, shear stress and heat flux along upper surface. Results of
simulations performed without molecule rotational energy exchange are also included. In addition, pressure and heat flux reported by Allègre and others31 are included. Uncertainty of pressure and heat flux are 0.1 and 5 % about expectation values. This uncertainty is based on measurement tools. Allègre and others did not report data relevant to uniformity of test section free stream flow.
Surface pressure plots, Fig. 9 (a), indicate that differences in DAC and MONACO results are due to distinct exchange models. Percentage changes are computed relative to DAC results. Mean percentage absolute-value-of change %|Δ| in surface pressure increases from 1.0 to 2.8 % as a consequence of including exchange. For simulations that include exchange, mean percentage absolute-value-of error %| | of simulation results relative to laboratory expectation values is 12.4 and 8.67 % for DAC and MONACO, respectively. Differences in accuracies are mostly due to DAC assuming constant rotational collision number, whereas, MONACO employs a variable rotational collision number model.
(a) Surface Pressure (b) Shear Stress along x
(c) Heat flux
Figure 9. Comparison of upper surface properties
x mm
pP
a
0 20 40 60 80 1000
0.5
1
1.5
2
2.5
3
3.5
4
DACMONACOAllegre et al.
()
( )
`
no rotational energy exchange
x mm
xP
a
0 20 40 60 80 1000
0.5
1
1.5
2
2.5
3
3.5
4DACMONACO
()
( )
`
no rotational energy exchange
x mm
qW
/m2
0 20 40 60 80 1000
500
1000
1500
2000
DACMONACOAllegre et al.
()
( )
`
no rotational energy exchange
13
By contrast, for shear stress and heat flux q, the inclusion of exchange decreases %|Δ| between the codes. Mean percentage change of decreases from 1.96 to 1.62 %, while that of q decreases from 9.3 to 1.91 %. Thus, factors other than exchange model cause differences between code simulation results. As indicated by field contour plots, these appear to be subtle differences in boundary and gaseous collision procedures. The unexpected percentage change in q between the codes for simulations excluding exchange is suspected due to faulty values for inserted by boundary condition or post processing procedures. Hence, q results, of simulations excluding exchange, are not trusted. For simulations that include exchange, %| | of simulation results relative to laboratory expectation values of q is 13.4 and 12.8 % for DAC and MONACO, respectively. As expected, the variable rotational collision number procedure, on average, produces results closer to the laboratory expectation values.
Flat plate drag, including pressure and shear components, are listed in Table 5. Given the 20:1 profile aspect ratio of the flat plate, it is reasonable to find drag due to shear 32 % greater than drag due to pressure. Percentage change in values between codes show that total surface drag is less sensitive than local surface aerothermodynamic properties by an order of magnitude. This substantiates employment of upper surface property distributions for comparing codes with selected simulation case.
Table 5. Drag (N) of simulated flat plate
Dpress Dshear D DAC (DA) 1.91110–4 2.47210–4 4.38310–4 MONACO (MO) 1.91610–4 2.46110–4 4.37710–4 | |/ 0.30 % 0.46 % 0.13 %
5 Conclusion
Two DSMC codes were compared: NASA’s standard production code DAC and an academic research code MONACO. These codes employ distinct grid processing procedures. They were compared by simulating a blunted flat plate wind tunnel test, using an identical flow field computational mesh. This mesh enabled satisfactory results according to a grid refinement study.
Performance of simulations was compared. When performed on a single processor, DAC consumed 57% less memory while MONACO consumed 9.8% less time. Function profiles of single processor simulations determined that DAC is characterized by more expensive standard input and output functions and MONACO is characterized by more expensive grid managing functions. Simulations were repeated with parallel processing with increasing number of processors. When number of processors was equal or greater than 8, DAC demonstrated greater speedup. This threshold is due to distinct prescribed master processor behavior and other less distinct differences in parallel processing code. Thus, speedup comparisons seem to favor strategy of having master processor execute only standard I/O for large number of processors; with threshold value expected to be case dependent. Regarding memory spread, MONACO demonstrated an erratic trend with increase in number of processors; whereas, DAC demonstrated a linear increase. Greater memory spread by MONACO evidences inefficient parallel processing data handling procedures within that code. In summary, parallel speedup and memory spread comparisons indicated that MONACO’s parallel processing procedures are generally less efficient than DAC’s.
14
Accuracy of simulations was also compared. DSMC metrics indicate that both codes yield acceptable quality solutions with same volume mesh and global weights. Flow field contours demonstrated that MONACO is incorrect in the far field where 0. Both codes provided reasonable results in regions of significant gradients. There, good agreement was observed in field contours of bulk velocity magnitude and translational temperature. Rotational temperature contours deviate throughout most of the domain because of distinct rotational energy exchange models. Namely, DAC assumes a constant rotational collision number, whereas, MONACO employs a variable rotational collision number model. For this reason, mean percentage error relative to laboratory expectation values of upper surface pressure and heat flux is slightly less for MONACO than for DAC.
Overall, this study revealed that both codes, excluding grid adaptation, performed similarly. For parallel processing, DAC was generally more efficient. As expected, code accuracy was mainly dependent on the physical models employed.
References
1. G.J. LeBeau, “A Parallel Implimentation of the Direct Simulation Monte Carlo Method,” Computer Methods in Applied Mechanics and Engineering, 174, No. 3-4, 319-337 (1999).
2. R.G. Wilmoth, G.J. LeBeau and A.B. Carlson, “DSMC Grid Methodologies for Computing Low-Density, Hypersonic Flows About Reusable Launch Vehicles,” AIAA Paper 1996-1812, June 1996.
3. G.J. LeBeau and F.E. Lumpkin III, “Application Highlights of the DSMC Analysis Code (DAC) Software for Simulating Rarefied Flows,” Computer Methods in Applied Mechanics and Engineering, 191, No. 6-7, 595-609 (2001).
4. F.E. Lumpkin III, P.C. Stuart and G.J. LeBeau, “Enhanced analysis of plume impingement during Shuttle-Mir docking using a combined CFD and DSMC methodology,” AIAA Paper 1996-1877, June 1996.
5. F.E. Lumpkin III, P.C. Stuart and G.J. LeBeau, “The Airlock Depressurization Plume Anomaly on the STS-82 Hubble Servicing Mission,” AIAA Paper 200-0462, Jan. 2000.
6. D.S. Liechty, “Aeroheating Analysis for the Mars Reconnaissance Orbiter with Comparison to Flight Data,” Journal of Spacecraft and Rockets, 44, No. 6, 1226-1231 (2007).
7. J.N. Moss, G.J. LeBeau, R. C. Blanchard and J. M. Price, “Rarefaction Effects on Galileo Probe Aerodynamics,” NASA TM 1996-111620, August, 1996.
8. C.E. Glass and T.J. Horvath, Comparison of a 3-D CFD-DSMC Solution Methodology with a Wind Tunnel Experiment,” NASA TM 2002-211777, August 2002.
9. S. Dietrich and I.D. Boyd, “A Scalar Optimized Parallel Implementation of the DSMC Method,” AIAA Paper 1994-0355, January 1994.
10. S. Dietrich and I.D. Boyd, “Scalar and Parallel Optimized Implementation of the Direct Simulation Monte Carlo Method,” Journal of Computational Physics, 126, No. 4, 328–342 (1996).
11. I.D. Boyd, D.B. Van Gilder and X. Liu, “Monte Carlo Simulation of Neutral Xenon Flows in Electric Propulsion Devices,” Journal of Propulsion and Power, 14, No. 6, 1009–1015 (1998).
12. Q. Sun, I.D. Boyd and G.V. Candler, “A hybrid continuum/particle approach for modeling subsonic, rarefied gas flows,” Journal of Computational Physics, 194, 256–277 (2004).
13. T.E. Schwartzentruber, L.C. Scalabrin and I.D. Boyd, “A modular particle–continuum numerical method for hypersonic non-equilibrium gas flows,” Journal of Computational Physics, 225, 1159–1174 (2007).
14. A.J. Lofthouse, I.D. Boyd and M.J. Wright, “Effects of continuum breakdown on hypersonic aerothermodynamics,” Physics of Fluids, 19, 027105 (2007).
15. T.E. Schwartzentruber, L.C. Scalabrin and I.D. Boyd, “Multiscale Particle-Continuum Simulations of Hypersonic Flow over a Planetary Probe,” Journal of Spacecraft and Rockets, 45, No. 6, 1196–1206 (2008).
16. J.M. Burt and I.D. Boyd, “A hybrid particle approach for continuum and rarefied flow simulation,” Journal of Computational Physics, 228, 460–475 (2009).
17. A. Danckert and H. Legge, “Experimental and Computational Wake Structure Study for a Wide-Angle Cone,” Journal of Spacecraft and Rockets, 33, No. 4, (1996).
15
18. J.M. Burt and I.D. Boyd, “High Altitude Plume Simulations for a Solid Propellant Rocket,” AIAA Journal, 45, No. 12, 2872-2884 (2007).
19. A.J. Lofthouse, L.C. Scalabrin and I.D. Boyd, “Velocity Slip and Temperature Jump in Hypersonic Aerothermodynamics,” Journal of Thermophysics and Heat Transfer, 22, No. 1, 38–49 (2008).
20. C. Cai, D.D. Liu and K. Xu, “One-Dimensional Multiple-Temperature Gas-Kinetic Bhatnagar–Gross–Krook Scheme for Shock Wave Computation,” AIAA Journal, 46, No. 5, 1054–1062 (2008).
21. M. Keidar, M. Kim and I.D. Boyd, “Electromagnetic Reduction of Plasma Density During Atmospheric Reentry and Hypersonic Flights,” Journal of Spacecraft and Rockets, 45, No. 3, (2008).
22. J.F. Padilla and I.D. Boyd, “Assessment of Gas–Surface Interaction Models for Computation of Rarefied Hypersonic Flow,” Journal of Thermophysics and Heat Transfer, 23, No. 1, 96–105 (2009).
23. D.P. Karipides, I.D. Boyd and G.E. Caledonia, “Development of a Monte Carlo Overlay Method with Application to Spacecraft Glow,” Journal of Thermophysics and Heat Transfer, 12, No. 1, 30–37 (1998).
24. K.C. Kannenberg and I.D. Boyd, “Three-Dimensional Monte Carlo Simulations of Plume Impingement,” Journal of Thermophysics and Heat Transfer, 13, No. 2, 226–235 (1999).
25. Q. Sun, C. Cai and I.D. Boyd, “Computational Analysis of High-Altitude Ionization Gauge Flight Measurements,” Journal of Spacecraft and Rockets, 43, No. 1, 186-193 (2006).
26. G.A. Bird, Molecular Gas Dynamics and the Direct Simulation of Gas Flows, Oxford University Press, Oxford, 1994.
27. G.A. Bird, “Monte Carlo Simulation in an Engineering Context,” Progress in Astronautics and Aeronautics, 74, 239– 255 (1981).
28. C. Borgnakke and P. S. Larsen, “Statistical Collision Model for Monte Carlo Simulations of Gas Mixtures,” Journal of Computational Physics, 18, No. 4, 405-420 (1975).
29. I.D. Boyd, “Analysis of Rotational Nonequilibrium in Standing Shock Waves of Nitrogen,” AIAA Journal, 28, No. 11, 1997-1999 (1990).
30. Gridgen, Software Package, Ver. 15, 2009, Pointwise, Inc., Fort Worth, TX. 31. J. Allègre, M. Raffin, A. Chpoun and L. Gottesdiener, “Rarefied Hypersonic Flow over a Flat Plate with
Tuncated Leading Edge,” Progress in Astronautics and Aeronautics, 160, 285–295 (1992). 32. J. Lengrand, J. Allègre, A. Chpoun and M. Raffin, “Rarefied Hypersonic Flow over a Flat Plate: Numerical
and Experimental Results,” Progress in Astronautics and Aeronautics, 160, 276–284 (1992). 33. A. Chpoun, J.C. Lengrand and K.S. Heffner, “Numerical and Experimental Investigation of Rarefied
Compression Corner Flow,” AIAA Paper 1992-2900, July 1992. 34. Intel Corporation, http://software.intel.com/en-us/intel-compilers. 35. Advanced Micro Devices, Inc., http://www.amd.com. 36. The Portland Group, Inc. http://www.pgroup.com. 37. Open MPI, http://www.open-mpi.org.
REPORT DOCUMENTATION PAGE Form Approved
OMB No. 0704-0188 The public reporting burden for this collection of information is estimated to average 1 hour per response, including the time for reviewing instructions, searching existingdata sources, gathering and maintaining the data needed, and completing and reviewing the collection of information. Send comments regarding this burden estimate or any other aspect of this collection of information, including suggestions for reducing this burden, to Department of Defense, Washington Headquarters Services, Directorate for Information Operations and Reports (0704-0188), 1215 Jefferson Davis Highway, Suite 1204, Arlington, VA 22202-4302. Respondents should be aware that notwithstanding any other provision of law, no person shall be subject to any penalty for failing to comply with a collection of information if it does not display a currently valid OMB control number. PLEASE DO NOT RETURN YOUR FORM TO THE ABOVE ADDRESS.
1. REPORT DATE (DD-MM-YYYY) 2. REPORT TYPE 3. DATES COVERED (From - To)
4. TITLE AND SUBTITLE 5a. CONTRACT NUMBER
5b. GRANT NUMBER
5c. PROGRAM ELEMENT NUMBER
6. AUTHOR(S) 5d. PROJECT NUMBER
5e. TASK NUMBER
5f. WORK UNIT NUMBER
7. PERFORMING ORGANIZATION NAME(S) AND ADDRESS(ES) 8. PERFORMING ORGANIZATION REPORT NUMBER
9. SPONSORING/MONITORING AGENCY NAME(S) AND ADDRESS(ES) 10. SPONSORING/MONITOR'S ACRONYM(S)
11. SPONSORING/MONITORINGREPORT NUMBER
12. DISTRIBUTION/AVAILABILITY STATEMENT
13. SUPPLEMENTARY NOTES
14. ABSTRACT
15. SUBJECT TERMS
16. SECURITY CLASSIFICATION OF: 17. LIMITATION OF
ABSTRACT 18. NUMBER
OF PAGES
19a. NAME OF RESPONSIBLE PERSON
a. REPORT b. ABSTRACT c. THIS PAGE 19b. TELEPHONE NUMBER (Include area code)
Standard Form 298 (Rev. 8-98)Prescribed by ANSI Std. Z39-18
01-08-2010 Technical Memorandum
Comparison of DAC and MONACO DSMC Codes With Flat PlateSimulation
599489.02.07.07.04.13.01
Padilla, Jose F.
NASA Langley Research Center, Hampton, Virginia 23681-2199 L-19909
National Aeronautics and Space Administration, Washington, DC 20546-0001 NASA
NASA/TM-2010-216835
Unclassified-Unlimited Subject Category 34 Availability: NASA CASI (443) 757-5802
Various implementations of the direct simulation Monte Carlo (DSMC) method exist in academia, government and industry. Bycomparing implementations, deficiencies and merits of each can be discovered. This document reports comparisons betweenDSMC Analysis Code (DAC) and “MONACO”. DAC is NASA’s standard DSMC production code and MONACO is a researchDSMC code developed in academia. These codes have various differences; in particular, they employ distinct computational griddefinitions. In this study, DAC and MONACO are compared by having each simulate a blunted flat plate wind tunnel test, using anidentical volume mesh. Simulation expense and DSMC metrics are compared. In addition, flow results are compared with availablelaboratory data. Overall, this study revealed that both codes, excluding grid adaptation, performed similarly. For parallelprocessing, DAC was generally more efficient. As expected, code accuracy was mainly dependent on physical models employed.
Direct simulation Monte Carlo; Rarefied gas dynamics; Wind tunnel simulation; Code comparison
U U U UU 20
STI Help Desk (email: [email protected])
(443) 757-5802